ORIGINAL RESEARCH ARTICLE published: 17 February 2012 doi: 10.3389/fmicb.2012.00049 Characterization of microbial population shifts during sample storage Heath J. Mills 1 *, Brandi Kiel Reese 1,2 and Cruz St. Peter 1 1 Department of Oceanography,Texas A&M University, College Station,TX, USA 2 Department of Biological Science, University of Southern California, Los Angeles, CA, USA Edited by: AndreasTeske, University of North Carolina at Chapel Hill, USA Reviewed by: Rebecca Gast, Woods Hole Oceanographic Institution, USA Kesen Ma, University of Waterloo, Canada *Correspondence: Heath J. Mills, Department of Oceanography,Texas A&M University, 716A Eller O&M Building, College Station, TX 77843-3146, USA. e-mail: [email protected] The objective of this study was to determine shifts in the microbial community structure and potential function based on standard Integrated Ocean Drilling Program (IODP) storage procedures for sediment cores. Standard long-term storage protocols maintain sediment temperature at 4˚C for mineralogy, geochemical, and/or geotechnical analysis whereas standard microbiological sampling immediately preserves sediments at −80˚C. Storage at 4˚C does not take into account populations may remain active over geologic time scales at temperatures similar to storage conditions. Identification of active populations within the stored core would suggest geochemical and geophysical conditions within the core change over time.To test this potential, the metabolically active fraction of the total micro- bial community was characterized from IODP Expedition 325 Great Barrier Reef sediment cores prior to and following a 3-month storage period.Total RNA was extracted from com- plementary 2, 20, and 40 m below sea floor sediment samples, reverse transcribed to complementary DNA and then sequenced using 454 FLX sequencing technology, yield- ing over 14,800 sequences from the six samples. Interestingly, 97.3% of the sequences detected were associated with lineages that changed in detection frequency during the storage period including key biogeochemically relevant lineages associated with nitrogen, iron, and sulfur cycling.These lineages have the potential to permanently alter the physical and chemical characteristics of the sediment promoting misleading conclusions about the in situ biogeochemical environment. In addition, the detection of new lineages after stor- age increases the potential for a wider range of viable lineages within the subsurface that may be underestimated during standard community characterizations. Keywords: sediment microbial ecology, pyrosequencing, geobiology, sediment core storage INTRODUCTION The Integrated Ocean Drilling Program (IODP) and its prede- cessor programs Deep Sea Drilling Program and Ocean Drilling Program have led scientific drilling of the marine subsurface for over 40years. Three main repositories [Gulf Coast Repository, Bremen Core Repository (BCR), and Kochi Core Repository] col- lect and store drill material from around the world, providing a resource to land based scientists in an effort to expand the research potential of the Program. The main focus of subsurface research has been chemical and physical characterizations. However, recent initiatives have emphasized the importance of understanding the subseafloor biosphere (Bickle et al., 2011). With this new direction has come new technology and awareness to determine the biolog- ical effects on subsurface. Previous studies have described some aspects of the physical, chemical, and biological effects of long- term storage on core integrity (König et al., 2000; Lin et al., 2010), however a detailed analysis of changes in the active microbial community during core material storage has not been presented. Advancements in drilling technology and expeditions dedicated to microbiology have provided an increase in the number of sam- ples suitable for enhanced microbial community characterization. Resulting studies have produced a better understanding of in situ community structure and further described natural diagenetic processes deep beneath the seafloor. Multiple biological processes catalyzed by subsurface microbial populations have been shown to alter the physical and chemical structure of subsurface sediment and rock (reviewed in Fry et al., 2008). With minimal geochemical alteration in subsurface environmental conditions over short time scales (Jørgensen, 2011) the community structure would remain stable in composition and expressed metabolic processes. There- fore, disruptions to in situ fluid flow, temperature, or pressure, such as those created during the drilling process and subsequent core storage would be hypothesized to create shifts in both community structure and overall function. This newly structured population would utilize different chemical compounds at different rates com- pared to the undisturbed population and thus would change the physical and chemical composition of the stored material. Key to this assumption is the availability of a dormant fraction of the population, or a minor fraction that becomes more metabolically active following a disruption event. Dormancy is a valuable and common trait to microbial populations (Jones and Lennon, 2010) but has been more frequently associated with environments that experience periodic perturbations or shifts in environmental con- ditions (Fuhrman et al., 2006; Jones and McMahon, 2009). Lin www.frontiersin.org February 2012 |Volume 3 | Article 49 | 1

Welcome message from author
This document is posted to help you gain knowledge. Please leave a comment to let me know what you think about it! Share it to your friends and learn new things together.
Transcript
ORIGINAL RESEARCH ARTICLEpublished: 17 February 2012
doi: 10.3389/fmicb.2012.00049
Characterization of microbial population shifts duringsample storageHeath J. Mills1*, Brandi Kiel Reese1,2 and Cruz St. Peter 1
1 Department of Oceanography, Texas A&M University, College Station, TX, USA2 Department of Biological Science, University of Southern California, Los Angeles, CA, USA
Edited by:
Andreas Teske, University ofNorth Carolina at Chapel Hill, USA
Reviewed by:
Rebecca Gast, Woods HoleOceanographic Institution, USAKesen Ma, University of Waterloo,Canada
*Correspondence:
Heath J. Mills, Department ofOceanography, Texas A&M University,716A Eller O&M Building, CollegeStation, TX 77843-3146, USA.e-mail: [email protected]
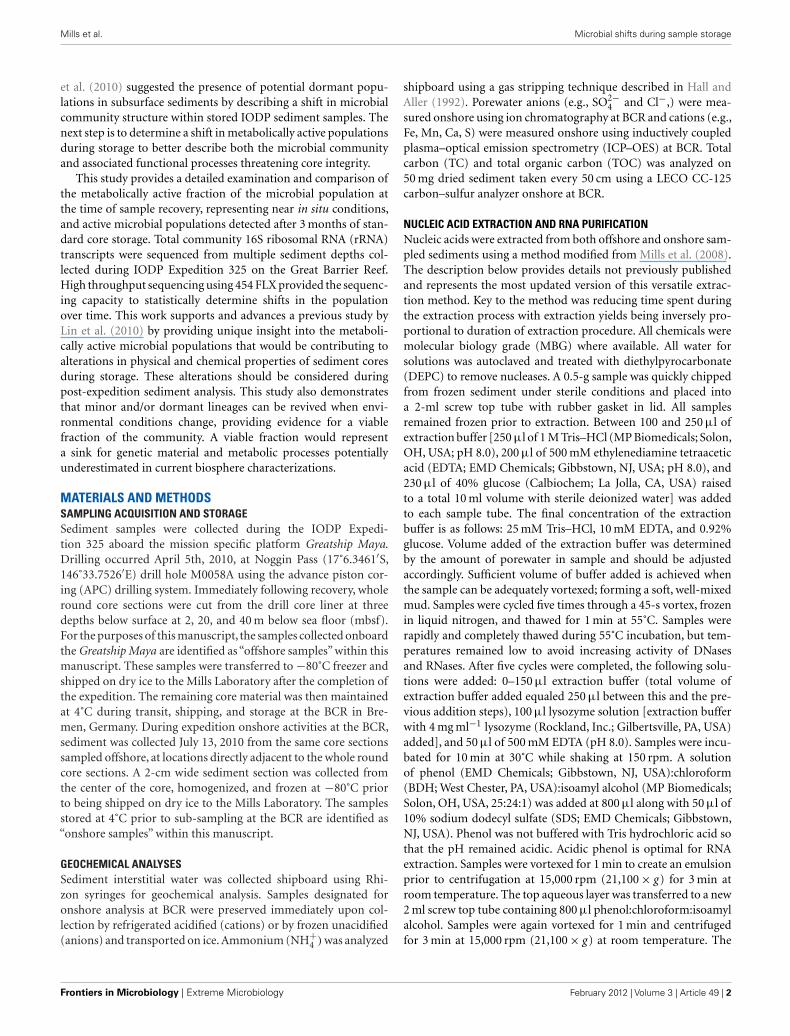
The objective of this study was to determine shifts in the microbial community structureand potential function based on standard Integrated Ocean Drilling Program (IODP) storageprocedures for sediment cores. Standard long-term storage protocols maintain sedimenttemperature at 4˚C for mineralogy, geochemical, and/or geotechnical analysis whereasstandard microbiological sampling immediately preserves sediments at −80˚C. Storage at4˚C does not take into account populations may remain active over geologic time scalesat temperatures similar to storage conditions. Identification of active populations withinthe stored core would suggest geochemical and geophysical conditions within the corechange over time.To test this potential, the metabolically active fraction of the total micro-bial community was characterized from IODP Expedition 325 Great Barrier Reef sedimentcores prior to and following a 3-month storage period.Total RNA was extracted from com-plementary 2, 20, and 40 m below sea floor sediment samples, reverse transcribed tocomplementary DNA and then sequenced using 454 FLX sequencing technology, yield-ing over 14,800 sequences from the six samples. Interestingly, 97.3% of the sequencesdetected were associated with lineages that changed in detection frequency during thestorage period including key biogeochemically relevant lineages associated with nitrogen,iron, and sulfur cycling.These lineages have the potential to permanently alter the physicaland chemical characteristics of the sediment promoting misleading conclusions about thein situ biogeochemical environment. In addition, the detection of new lineages after stor-age increases the potential for a wider range of viable lineages within the subsurface thatmay be underestimated during standard community characterizations.
Keywords: sediment microbial ecology, pyrosequencing, geobiology, sediment core storage
INTRODUCTIONThe Integrated Ocean Drilling Program (IODP) and its prede-cessor programs Deep Sea Drilling Program and Ocean DrillingProgram have led scientific drilling of the marine subsurface forover 40 years. Three main repositories [Gulf Coast Repository,Bremen Core Repository (BCR), and Kochi Core Repository] col-lect and store drill material from around the world, providing aresource to land based scientists in an effort to expand the researchpotential of the Program. The main focus of subsurface researchhas been chemical and physical characterizations. However, recentinitiatives have emphasized the importance of understanding thesubseafloor biosphere (Bickle et al., 2011). With this new directionhas come new technology and awareness to determine the biolog-ical effects on subsurface. Previous studies have described someaspects of the physical, chemical, and biological effects of long-term storage on core integrity (König et al., 2000; Lin et al., 2010),however a detailed analysis of changes in the active microbialcommunity during core material storage has not been presented.
Advancements in drilling technology and expeditions dedicatedto microbiology have provided an increase in the number of sam-ples suitable for enhanced microbial community characterization.Resulting studies have produced a better understanding of in situ
community structure and further described natural diageneticprocesses deep beneath the seafloor. Multiple biological processescatalyzed by subsurface microbial populations have been shown toalter the physical and chemical structure of subsurface sedimentand rock (reviewed in Fry et al., 2008). With minimal geochemicalalteration in subsurface environmental conditions over short timescales (Jørgensen, 2011) the community structure would remainstable in composition and expressed metabolic processes. There-fore,disruptions to in situ fluid flow, temperature, or pressure, suchas those created during the drilling process and subsequent corestorage would be hypothesized to create shifts in both communitystructure and overall function. This newly structured populationwould utilize different chemical compounds at different rates com-pared to the undisturbed population and thus would change thephysical and chemical composition of the stored material. Key tothis assumption is the availability of a dormant fraction of thepopulation, or a minor fraction that becomes more metabolicallyactive following a disruption event. Dormancy is a valuable andcommon trait to microbial populations (Jones and Lennon, 2010)but has been more frequently associated with environments thatexperience periodic perturbations or shifts in environmental con-ditions (Fuhrman et al., 2006; Jones and McMahon, 2009). Lin
www.frontiersin.org February 2012 | Volume 3 | Article 49 | 1
Mills et al. Microbial shifts during sample storage
et al. (2010) suggested the presence of potential dormant popu-lations in subsurface sediments by describing a shift in microbialcommunity structure within stored IODP sediment samples. Thenext step is to determine a shift in metabolically active populationsduring storage to better describe both the microbial communityand associated functional processes threatening core integrity.
This study provides a detailed examination and comparison ofthe metabolically active fraction of the microbial population atthe time of sample recovery, representing near in situ conditions,and active microbial populations detected after 3 months of stan-dard core storage. Total community 16S ribosomal RNA (rRNA)transcripts were sequenced from multiple sediment depths col-lected during IODP Expedition 325 on the Great Barrier Reef.High throughput sequencing using 454 FLX provided the sequenc-ing capacity to statistically determine shifts in the populationover time. This work supports and advances a previous study byLin et al. (2010) by providing unique insight into the metaboli-cally active microbial populations that would be contributing toalterations in physical and chemical properties of sediment coresduring storage. These alterations should be considered duringpost-expedition sediment analysis. This study also demonstratesthat minor and/or dormant lineages can be revived when envi-ronmental conditions change, providing evidence for a viablefraction of the community. A viable fraction would representa sink for genetic material and metabolic processes potentiallyunderestimated in current biosphere characterizations.
MATERIALS AND METHODSSAMPLING ACQUISITION AND STORAGESediment samples were collected during the IODP Expedi-tion 325 aboard the mission specific platform Greatship Maya.Drilling occurred April 5th, 2010, at Noggin Pass (17˚6.3461′S,146˚33.7526′E) drill hole M0058A using the advance piston cor-ing (APC) drilling system. Immediately following recovery, wholeround core sections were cut from the drill core liner at threedepths below surface at 2, 20, and 40 m below sea floor (mbsf).For the purposes of this manuscript, the samples collected onboardthe Greatship Maya are identified as “offshore samples” within thismanuscript. These samples were transferred to −80˚C freezer andshipped on dry ice to the Mills Laboratory after the completion ofthe expedition. The remaining core material was then maintainedat 4˚C during transit, shipping, and storage at the BCR in Bre-men, Germany. During expedition onshore activities at the BCR,sediment was collected July 13, 2010 from the same core sectionssampled offshore, at locations directly adjacent to the whole roundcore sections. A 2-cm wide sediment section was collected fromthe center of the core, homogenized, and frozen at −80˚C priorto being shipped on dry ice to the Mills Laboratory. The samplesstored at 4˚C prior to sub-sampling at the BCR are identified as“onshore samples” within this manuscript.
GEOCHEMICAL ANALYSESSediment interstitial water was collected shipboard using Rhi-zon syringes for geochemical analysis. Samples designated foronshore analysis at BCR were preserved immediately upon col-lection by refrigerated acidified (cations) or by frozen unacidified(anions) and transported on ice. Ammonium (NH+
4 ) was analyzed
shipboard using a gas stripping technique described in Hall andAller (1992). Porewater anions (e.g., SO2−
4 and Cl−,) were mea-sured onshore using ion chromatography at BCR and cations (e.g.,Fe, Mn, Ca, S) were measured onshore using inductively coupledplasma–optical emission spectrometry (ICP–OES) at BCR. Totalcarbon (TC) and total organic carbon (TOC) was analyzed on50 mg dried sediment taken every 50 cm using a LECO CC-125carbon–sulfur analyzer onshore at BCR.
NUCLEIC ACID EXTRACTION AND RNA PURIFICATIONNucleic acids were extracted from both offshore and onshore sam-pled sediments using a method modified from Mills et al. (2008).The description below provides details not previously publishedand represents the most updated version of this versatile extrac-tion method. Key to the method was reducing time spent duringthe extraction process with extraction yields being inversely pro-portional to duration of extraction procedure. All chemicals weremolecular biology grade (MBG) where available. All water forsolutions was autoclaved and treated with diethylpyrocarbonate(DEPC) to remove nucleases. A 0.5-g sample was quickly chippedfrom frozen sediment under sterile conditions and placed intoa 2-ml screw top tube with rubber gasket in lid. All samplesremained frozen prior to extraction. Between 100 and 250 μl ofextraction buffer [250 μl of 1 M Tris–HCl (MP Biomedicals; Solon,OH, USA; pH 8.0), 200 μl of 500 mM ethylenediamine tetraaceticacid (EDTA; EMD Chemicals; Gibbstown, NJ, USA; pH 8.0), and230 μl of 40% glucose (Calbiochem; La Jolla, CA, USA) raisedto a total 10 ml volume with sterile deionized water] was addedto each sample tube. The final concentration of the extractionbuffer is as follows: 25 mM Tris–HCl, 10 mM EDTA, and 0.92%glucose. Volume added of the extraction buffer was determinedby the amount of porewater in sample and should be adjustedaccordingly. Sufficient volume of buffer added is achieved whenthe sample can be adequately vortexed; forming a soft, well-mixedmud. Samples were cycled five times through a 45-s vortex, frozenin liquid nitrogen, and thawed for 1 min at 55˚C. Samples wererapidly and completely thawed during 55˚C incubation, but tem-peratures remained low to avoid increasing activity of DNasesand RNases. After five cycles were completed, the following solu-tions were added: 0–150 μl extraction buffer (total volume ofextraction buffer added equaled 250 μl between this and the pre-vious addition steps), 100 μl lysozyme solution [extraction bufferwith 4 mg ml−1 lysozyme (Rockland, Inc.; Gilbertsville, PA, USA)added], and 50 μl of 500 mM EDTA (pH 8.0). Samples were incu-bated for 10 min at 30˚C while shaking at 150 rpm. A solutionof phenol (EMD Chemicals; Gibbstown, NJ, USA):chloroform(BDH; West Chester, PA, USA):isoamyl alcohol (MP Biomedicals;Solon, OH, USA, 25:24:1) was added at 800 μl along with 50 μl of10% sodium dodecyl sulfate (SDS; EMD Chemicals; Gibbstown,NJ, USA). Phenol was not buffered with Tris hydrochloric acid sothat the pH remained acidic. Acidic phenol is optimal for RNAextraction. Samples were vortexed for 1 min to create an emulsionprior to centrifugation at 15,000 rpm (21,100 × g ) for 3 min atroom temperature. The top aqueous layer was transferred to a new2 ml screw top tube containing 800 μl phenol:chloroform:isoamylalcohol. Samples were again vortexed for 1 min and centrifugedfor 3 min at 15,000 rpm (21,100 × g ) at room temperature. The
Frontiers in Microbiology | Extreme Microbiology February 2012 | Volume 3 | Article 49 | 2
Mills et al. Microbial shifts during sample storage
aqueous layer was transferred to a new 1.5 ml microcentrifugetube avoiding any traces of the phenol solution. A total of 50 μlof 3 M sodium acetate (J. T. Baker; Phillipsburg, NJ, USA; pH 6.4)and 1 ml 200 proof MPG ethanol was added to each sample priorto a 15-min centrifuge step at 15,000 rpm (21,100 × g ) at 4˚C. Thesupernatant was slowly removed and the pellet dried for 10 min.Pellets were resuspended in 50 μl of sodium citrate (pH 6.4) tooptimize for RNA preservation. If DNA is desired, resuspend inautoclaved, deionized water (pH 8.0), and buffer the phenol toraise the pH to 8. For RNA sample preparation, extractions weretreated with Turbo DNA Free (Ambion, Inc.; Austin, TX, USA)according to manufacturer’s instructions to remove residual DNAco-extracted with the RNA.
RNA REVERSE TRANSCRIPTIONSmall subunit (SSU) rRNA was reverse transcribed according toReese et al. (2012). In brief, complementary DNA (cDNA) wasproduced using moloney murine leukemia virus (MMLV) reversetranscriptase (Promega, Madison, WI, USA) and 518R (5′-CGTATT ACC GCG GCT GCT GG-3′; Nogales et al., 1999). Aliquotsof RNA extract were screened for the presence of residual DNAusing the Bacteria domain-specific SSU rRNA gene primers 27F(5′-AGR GTT TGA TCM TGG CTC AG-3′; Giovannoni et al.,1991) and 518R. Thermocycling conditions are described in Reeseet al. (2012). All RNA extracts were determined free of residualDNA (data not shown).
PYROSEQUENCINGPrimers 28F (5′-GAG TTT GAT CNT GGC TCA G-3′) and 519R(5′-GTN TTA CNG CGG CKG CTG-3′) produced amplicons fromcDNA that spanned three hyper-variable regions (V1 through V3;Handl et al., 2011). cDNA amplicons from each of the sedimentsamples were sequenced at the Research and Testing Laboratory(Lubbock, TX, USA). Amplicons from each sample were firstlabeled with a 10 base unique multiplex identifier (MID) sequenceto allow all samples to be sequenced on a single run of a Roche454 FLX (454 Life Sciences; Branford, CT, USA). Downstreamsequence analysis parsed the individual sequences into sample spe-cific libraries. Resulting libraries were screened for reads less than200 bases, reads lacking a Roche-designed four base key sequence,and non-bacterial reads lacking specific 28F primer recognitionsite. Sequences were checked for chimeras using the black boxchimera check software (B2C2; Gontcharova et al., 2010). Allsequences passing quality control were denoized prior to phy-logenetic and statistical analysis. Sequences were then depositedto the National Center for Biotechnology Information databaseusing Sequence Read Archive (SRA) under accession numberSRA049351.
PHYLOGENETIC AND STATISTICAL ANALYSISAll sequences passing quality control were taxonomically classi-fied (percent of total sequence length that aligned with a givendatabase sequence) using the NCBI Basic Local Alignment SearchTool (BLASTn) .NET algorithm (accessed January 2011; Dowdet al., 2005). Sequences with identity scores greater than 97% iden-tity (<3% divergence) to known or well characterized 16S rRNAsequences were resolved at the species level, between 95 and 97% at
the genus level, between 90 and 95% at the family, and between 85and 90% at the order level, 80 and 85% at the class and 77–80% atphyla (Stackebrandt and Goebel, 1994). Only sequences meetingthe genus taxonomic classification were incorporated into statisti-cal analyses. Predictions of functional diversity were derived fromgenus level taxonomic characterization using previous studies forreference. Lineages with multiple metabolic functions identifiedwere assigned to multiple groups to reduce effects of limited geo-chemical data. The percentage of sequences identified to individuallineages was determined for each sample providing relative abun-dance information within and among the samples based uponreads per sample. Sequences were further clustered into oper-ational taxonomic units (OTU) using the Ribosome DatabaseProject (RDP; University of Michigan; Lansing, MI, USA) usinga 95% sequence similarity cutoff (corresponding to a genus levelclassification). The sequences were not trimmed prior to cluster-ing to avoid potential biases for or against indel regions commonto 16S rRNA. The authors recognize potential problems with thisdecision; however, using a lower sequence similarity cutoff (95%compared to a typical 97%) produced a reproducible calculationof OTUs with multiple clustering runs. Chao1, Shannon Wiener,and Evenness were calculated from the OTU clustering using RDP.
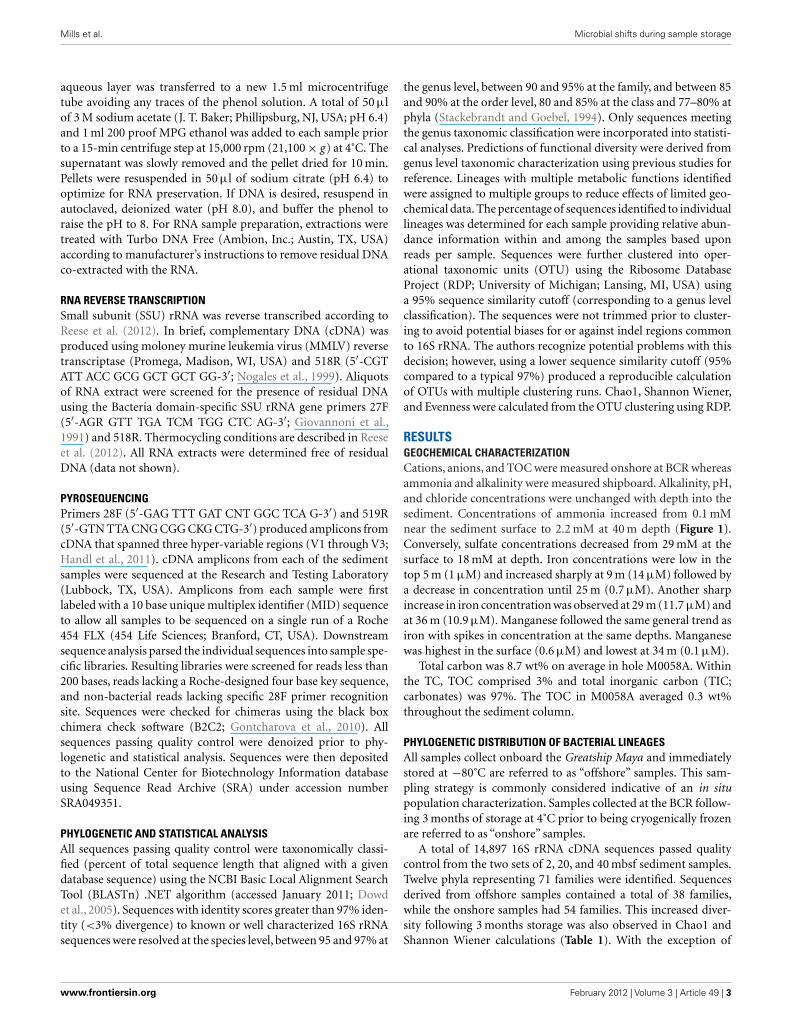
RESULTSGEOCHEMICAL CHARACTERIZATIONCations, anions, and TOC were measured onshore at BCR whereasammonia and alkalinity were measured shipboard. Alkalinity, pH,and chloride concentrations were unchanged with depth into thesediment. Concentrations of ammonia increased from 0.1 mMnear the sediment surface to 2.2 mM at 40 m depth (Figure 1).Conversely, sulfate concentrations decreased from 29 mM at thesurface to 18 mM at depth. Iron concentrations were low in thetop 5 m (1 μM) and increased sharply at 9 m (14 μM) followed bya decrease in concentration until 25 m (0.7 μM). Another sharpincrease in iron concentration was observed at 29 m (11.7 μM) andat 36 m (10.9 μM). Manganese followed the same general trend asiron with spikes in concentration at the same depths. Manganesewas highest in the surface (0.6 μM) and lowest at 34 m (0.1 μM).
Total carbon was 8.7 wt% on average in hole M0058A. Withinthe TC, TOC comprised 3% and total inorganic carbon (TIC;carbonates) was 97%. The TOC in M0058A averaged 0.3 wt%throughout the sediment column.
PHYLOGENETIC DISTRIBUTION OF BACTERIAL LINEAGESAll samples collect onboard the Greatship Maya and immediatelystored at −80˚C are referred to as “offshore” samples. This sam-pling strategy is commonly considered indicative of an in situpopulation characterization. Samples collected at the BCR follow-ing 3 months of storage at 4˚C prior to being cryogenically frozenare referred to as “onshore” samples.
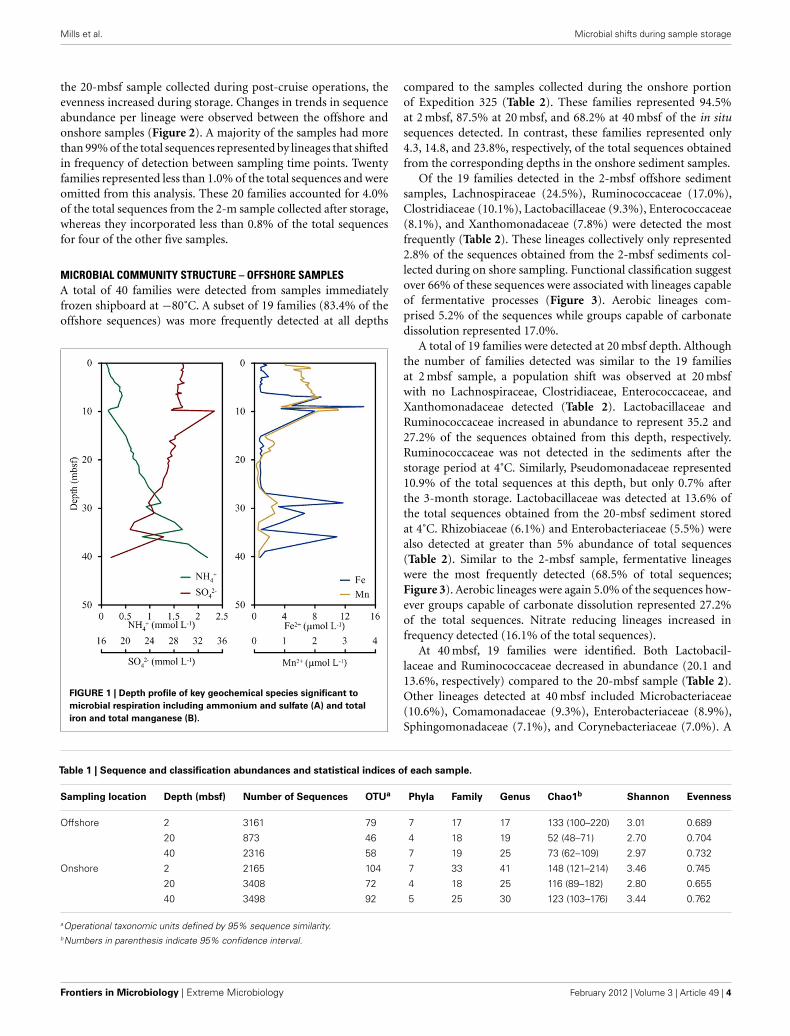
A total of 14,897 16S rRNA cDNA sequences passed qualitycontrol from the two sets of 2, 20, and 40 mbsf sediment samples.Twelve phyla representing 71 families were identified. Sequencesderived from offshore samples contained a total of 38 families,while the onshore samples had 54 families. This increased diver-sity following 3 months storage was also observed in Chao1 andShannon Wiener calculations (Table 1). With the exception of
www.frontiersin.org February 2012 | Volume 3 | Article 49 | 3
Mills et al. Microbial shifts during sample storage
the 20-mbsf sample collected during post-cruise operations, theevenness increased during storage. Changes in trends in sequenceabundance per lineage were observed between the offshore andonshore samples (Figure 2). A majority of the samples had morethan 99% of the total sequences represented by lineages that shiftedin frequency of detection between sampling time points. Twentyfamilies represented less than 1.0% of the total sequences and wereomitted from this analysis. These 20 families accounted for 4.0%of the total sequences from the 2-m sample collected after storage,whereas they incorporated less than 0.8% of the total sequencesfor four of the other five samples.
MICROBIAL COMMUNITY STRUCTURE – OFFSHORE SAMPLESA total of 40 families were detected from samples immediatelyfrozen shipboard at −80˚C. A subset of 19 families (83.4% of theoffshore sequences) was more frequently detected at all depths
FIGURE 1 | Depth profile of key geochemical species significant to
microbial respiration including ammonium and sulfate (A) and total
iron and total manganese (B).
compared to the samples collected during the onshore portionof Expedition 325 (Table 2). These families represented 94.5%at 2 mbsf, 87.5% at 20 mbsf, and 68.2% at 40 mbsf of the in situsequences detected. In contrast, these families represented only4.3, 14.8, and 23.8%, respectively, of the total sequences obtainedfrom the corresponding depths in the onshore sediment samples.
Of the 19 families detected in the 2-mbsf offshore sedimentsamples, Lachnospiraceae (24.5%), Ruminococcaceae (17.0%),Clostridiaceae (10.1%), Lactobacillaceae (9.3%), Enterococcaceae(8.1%), and Xanthomonadaceae (7.8%) were detected the mostfrequently (Table 2). These lineages collectively only represented2.8% of the sequences obtained from the 2-mbsf sediments col-lected during on shore sampling. Functional classification suggestover 66% of these sequences were associated with lineages capableof fermentative processes (Figure 3). Aerobic lineages com-prised 5.2% of the sequences while groups capable of carbonatedissolution represented 17.0%.
A total of 19 families were detected at 20 mbsf depth. Althoughthe number of families detected was similar to the 19 familiesat 2 mbsf sample, a population shift was observed at 20 mbsfwith no Lachnospiraceae, Clostridiaceae, Enterococcaceae, andXanthomonadaceae detected (Table 2). Lactobacillaceae andRuminococcaceae increased in abundance to represent 35.2 and27.2% of the sequences obtained from this depth, respectively.Ruminococcaceae was not detected in the sediments after thestorage period at 4˚C. Similarly, Pseudomonadaceae represented10.9% of the total sequences at this depth, but only 0.7% afterthe 3-month storage. Lactobacillaceae was detected at 13.6% ofthe total sequences obtained from the 20-mbsf sediment storedat 4˚C. Rhizobiaceae (6.1%) and Enterobacteriaceae (5.5%) werealso detected at greater than 5% abundance of total sequences(Table 2). Similar to the 2-mbsf sample, fermentative lineageswere the most frequently detected (68.5% of total sequences;Figure 3). Aerobic lineages were again 5.0% of the sequences how-ever groups capable of carbonate dissolution represented 27.2%of the total sequences. Nitrate reducing lineages increased infrequency detected (16.1% of the total sequences).
At 40 mbsf, 19 families were identified. Both Lactobacil-laceae and Ruminococcaceae decreased in abundance (20.1 and13.6%, respectively) compared to the 20-mbsf sample (Table 2).Other lineages detected at 40 mbsf included Microbacteriaceae(10.6%), Comamonadaceae (9.3%), Enterobacteriaceae (8.9%),Sphingomonadaceae (7.1%), and Corynebacteriaceae (7.0%). A
Table 1 | Sequence and classification abundances and statistical indices of each sample.
Sampling location Depth (mbsf) Number of Sequences OTUa Phyla Family Genus Chao1b Shannon Evenness
Offshore 2 3161 79 7 17 17 133 (100–220) 3.01 0.689
20 873 46 4 18 19 52 (48–71) 2.70 0.704
40 2316 58 7 19 25 73 (62–109) 2.97 0.732
Onshore 2 2165 104 7 33 41 148 (121–214) 3.46 0.745
20 3408 72 4 18 25 116 (89–182) 2.80 0.655
40 3498 92 5 25 30 123 (103–176) 3.44 0.762
aOperational taxonomic units defined by 95% sequence similarity.bNumbers in parenthesis indicate 95% confidence interval.
Frontiers in Microbiology | Extreme Microbiology February 2012 | Volume 3 | Article 49 | 4
Mills et al. Microbial shifts during sample storage
FIGURE 2 | Phyla and class level distribution of bacterial lineages.
Sequences were annotated using RDP Classifier. Identification wasdetermined with a confidence interval of 70%. Sequence data supports ahigh taxonomic level alteration of the community composition during 4˚Cstorage.
general trend of increasing abundance with depth was noted withall of these lineages. In addition, these lineages were detected overthree times more frequently in the offshore samples compared tothe onshore samples. A similar distribution of functional processwas observed compared to the 20-m sample with the exception ofno aerobic lineages detected (Figure 3).
MICROBIAL COMMUNITY STRUCTURE – ONSHORE SAMPLESA total of 57 families were detected in the three samples collectedduring the onshore portion of Expedition 325 following 3 monthsof storage at 4˚C (Table 2). There were 24 families with a highersequence abundance (62.1% of the total sequences) at all threedepths following the 3-month storage at 4˚C (?? in Appendix)compared to the samples collected and preserved at −80˚C onthe ship. These families accounted for 91.4% at 2 mbsf, 23.3% at20 mbsf, and 71.6% mbsf of the total classified sequences from sed-iments collected during the onshore portion of Expedition 325. Incontrast, the same 24 families represented only 0.2, 1.4, and 2.3%of the sequences obtained from 2, 20, and 40 mbsf, respectively,from sediments stored immediately at −80˚C.
At 2 mbsf, a total of 33 families were detected with 20 fam-ilies representing 90.3% of the sequences (Table 2). The mostfrequently detected lineages included Halomonadaceae (24.2%),Clostridia (19.7%), Flavobacteriaceae (12.2%), Geobacteraceae(8.9%), Carnobactericeae (3.4%), Oceanospirillales (3.3%), andDesulfobulbaceae (3.3%). No other family represented more than3.0% of the total sequences. Aerobic lineages were the most
frequently detected with 45.7% of the sequences attributed to thisgroup (Figure 3). While fermentative lineages were also detectedafter the 3-months, the frequency decreased over 50% compared tothe offshore samples. Nitrate, iron, and sulfate-reducing lineagesrepresented 4.1, 10.2, and 6.4%, respectively. In contrast to the off-shore 2 mbsf sample, carbonate reducing lineages accounted foronly 1.1% of the sequences.
A total of 20 families were detected in the 20 mbsf sedimentsamples collected during the onshore portion of the Expedition(Table 2). Within this set, 23.3% of the total sequences were rep-resented by 10 families that were more abundant in the storedsediments at all depths compared to the offshore samples. Anadditional 62.5% of the sequences from this sample were related toComamonadaceae (44.3%), Microbacteriaceae (8.6%), and Enter-obacteriaceae (8.6%; Table 2). Sequences related to Comamon-adaceae increased in abundance by an order of magnitude betweenthe offshore sampling (4.5%) and the post-cruise sampling periodat 20 mbsf (44.3%). However, this lineage was not included in theinitial percent calculations due to the abundance decreasing at40 mbsf from 9.3 to 0.3% after 3 months at 4˚C. A similar trendwas determined for Microbacteriaceae with an increase at 20 mbsffrom 0.2 to 8.6% during the 3-month period at 4˚C, whereas insamples at 40 mbsf the abundance decreased from 10.6 to 0.0%.The 20 mbsf sample was the only depth where Enterobacteriaceaewas more frequently detected in onshore sampled sediment (8.6%)compared to the offshore sampled sediment (4.3%). Collectively,the 10 families plus Comamonadaceae, Microbacteriaceae, andEnterobacteriaceae equal 84.9% of the sequences from the 20-msample collected onshore, compared to 11.6% of the sequencesfrom the corresponding offshore sample. Additional familiesdetected frequently at 20 mbsf included Clostridia (7.3%), Oscil-latoriales (3.7%), and Propionibacteriaceae (3.6%). In contrast tothe 2-mbsf sediments, Halomonadaceae, Clostridia, Flavobacte-riaceae, Geobacteraceae, Carnobactericeae, Oceanospirillales, andDesulfobulbaceae were not detected as this depth. Nitrate reduc-ing lineages incorporated 45.0% of the total sequences whilefermenters remained constant with depth (Figure 3).
At 40 mbsf, sequence annotation identified 29 total familieswithin the sediments. A subset of 14 families represented 71.6%of the total sequences at this depth (Table 2). These familiesincluded Halomonadaceae (27.9%), Altermonadaceae (11.2%),Piscirickettsiaceae (7.7%), Flavobacteriaceae (6.2%), Streptococ-caceae (4.6%), and Solirubrobacteraceae (4.3%). Only Streptococ-caceae was also detected (1.8%) in the offshore samples. AlthoughLactobacillaceae (10.3%) and Enterobacteriaceae (4.6%) weredetected frequently in the onshore samples, they were two timesless that the number of sequences detected in sediments preservedon the ship. Aerobic lineages represented 44.6% of the sequencesdetected while fermenters accounted for 21.4% (Figure 3). Lin-eages associated with methylotrophs incorporated 7.8% of thetotal sequences while carbonate dissolution groups represented3.4% of the sequences, the most at any depth in the onshoresamples.
DISCUSSIONThis study describes a shift in population structure within sed-iment core material obtained from borehole M00058A during
www.frontiersin.org February 2012 | Volume 3 | Article 49 | 5
Mills et al. Microbial shifts during sample storage
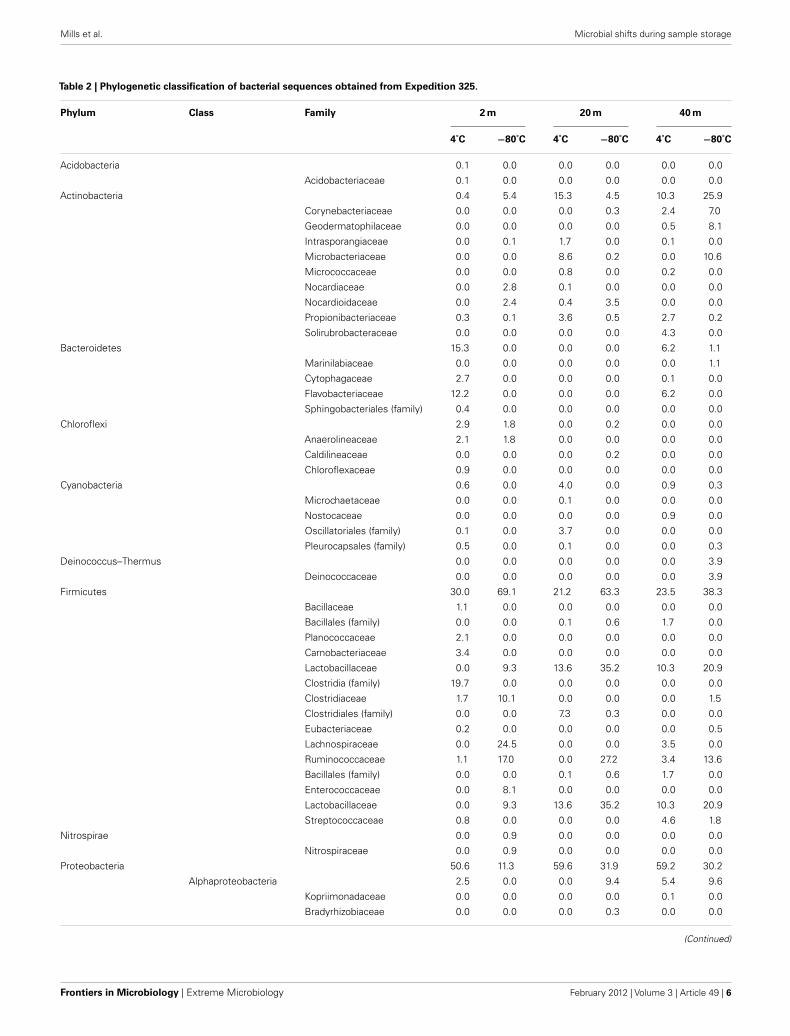
Table 2 | Phylogenetic classification of bacterial sequences obtained from Expedition 325.
Phylum Class Family 2 m 20 m 40 m
4˚C −80˚C 4˚C −80˚C 4˚C −80˚C
Acidobacteria 0.1 0.0 0.0 0.0 0.0 0.0
Acidobacteriaceae 0.1 0.0 0.0 0.0 0.0 0.0
Actinobacteria 0.4 5.4 15.3 4.5 10.3 25.9
Corynebacteriaceae 0.0 0.0 0.0 0.3 2.4 7.0
Geodermatophilaceae 0.0 0.0 0.0 0.0 0.5 8.1
Intrasporangiaceae 0.0 0.1 1.7 0.0 0.1 0.0
Microbacteriaceae 0.0 0.0 8.6 0.2 0.0 10.6
Micrococcaceae 0.0 0.0 0.8 0.0 0.2 0.0
Nocardiaceae 0.0 2.8 0.1 0.0 0.0 0.0
Nocardioidaceae 0.0 2.4 0.4 3.5 0.0 0.0
Propionibacteriaceae 0.3 0.1 3.6 0.5 2.7 0.2
Solirubrobacteraceae 0.0 0.0 0.0 0.0 4.3 0.0
Bacteroidetes 15.3 0.0 0.0 0.0 6.2 1.1
Marinilabiaceae 0.0 0.0 0.0 0.0 0.0 1.1
Cytophagaceae 2.7 0.0 0.0 0.0 0.1 0.0
Flavobacteriaceae 12.2 0.0 0.0 0.0 6.2 0.0
Sphingobacteriales (family) 0.4 0.0 0.0 0.0 0.0 0.0
Chloroflexi 2.9 1.8 0.0 0.2 0.0 0.0
Anaerolineaceae 2.1 1.8 0.0 0.0 0.0 0.0
Caldilineaceae 0.0 0.0 0.0 0.2 0.0 0.0
Chloroflexaceae 0.9 0.0 0.0 0.0 0.0 0.0
Cyanobacteria 0.6 0.0 4.0 0.0 0.9 0.3
Microchaetaceae 0.0 0.0 0.1 0.0 0.0 0.0
Nostocaceae 0.0 0.0 0.0 0.0 0.9 0.0
Oscillatoriales (family) 0.1 0.0 3.7 0.0 0.0 0.0
Pleurocapsales (family) 0.5 0.0 0.1 0.0 0.0 0.3
Deinococcus–Thermus 0.0 0.0 0.0 0.0 0.0 3.9
Deinococcaceae 0.0 0.0 0.0 0.0 0.0 3.9
Firmicutes 30.0 69.1 21.2 63.3 23.5 38.3
Bacillaceae 1.1 0.0 0.0 0.0 0.0 0.0
Bacillales (family) 0.0 0.0 0.1 0.6 1.7 0.0
Planococcaceae 2.1 0.0 0.0 0.0 0.0 0.0
Carnobacteriaceae 3.4 0.0 0.0 0.0 0.0 0.0
Lactobacillaceae 0.0 9.3 13.6 35.2 10.3 20.9
Clostridia (family) 19.7 0.0 0.0 0.0 0.0 0.0
Clostridiaceae 1.7 10.1 0.0 0.0 0.0 1.5
Clostridiales (family) 0.0 0.0 7.3 0.3 0.0 0.0
Eubacteriaceae 0.2 0.0 0.0 0.0 0.0 0.5
Lachnospiraceae 0.0 24.5 0.0 0.0 3.5 0.0
Ruminococcaceae 1.1 17.0 0.0 27.2 3.4 13.6
Bacillales (family) 0.0 0.0 0.1 0.6 1.7 0.0
Enterococcaceae 0.0 8.1 0.0 0.0 0.0 0.0
Lactobacillaceae 0.0 9.3 13.6 35.2 10.3 20.9
Streptococcaceae 0.8 0.0 0.0 0.0 4.6 1.8
Nitrospirae 0.0 0.9 0.0 0.0 0.0 0.0
Nitrospiraceae 0.0 0.9 0.0 0.0 0.0 0.0
Proteobacteria 50.6 11.3 59.6 31.9 59.2 30.2
Alphaproteobacteria 2.5 0.0 0.0 9.4 5.4 9.6
Kopriimonadaceae 0.0 0.0 0.0 0.0 0.1 0.0
Bradyrhizobiaceae 0.0 0.0 0.0 0.3 0.0 0.0
(Continued)
Frontiers in Microbiology | Extreme Microbiology February 2012 | Volume 3 | Article 49 | 6
Mills et al. Microbial shifts during sample storage
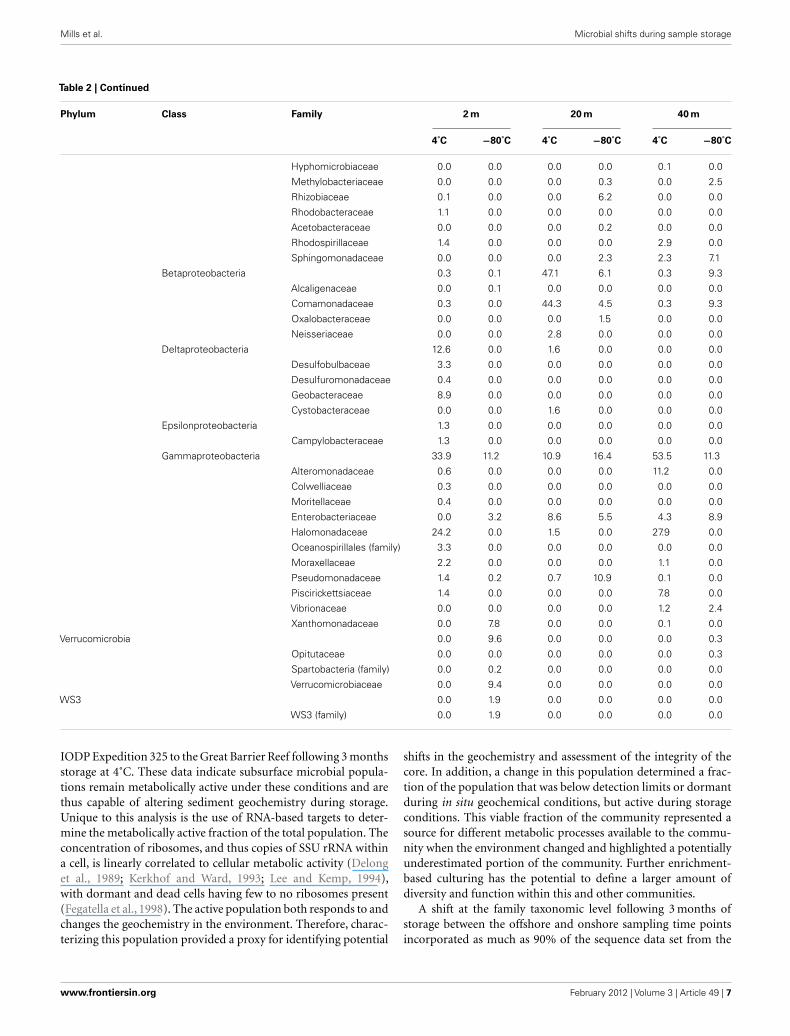
Table 2 | Continued
Phylum Class Family 2 m 20 m 40 m
4˚C −80˚C 4˚C −80˚C 4˚C −80˚C
Hyphomicrobiaceae 0.0 0.0 0.0 0.0 0.1 0.0
Methylobacteriaceae 0.0 0.0 0.0 0.3 0.0 2.5
Rhizobiaceae 0.1 0.0 0.0 6.2 0.0 0.0
Rhodobacteraceae 1.1 0.0 0.0 0.0 0.0 0.0
Acetobacteraceae 0.0 0.0 0.0 0.2 0.0 0.0
Rhodospirillaceae 1.4 0.0 0.0 0.0 2.9 0.0
Sphingomonadaceae 0.0 0.0 0.0 2.3 2.3 7.1
Betaproteobacteria 0.3 0.1 47.1 6.1 0.3 9.3
Alcaligenaceae 0.0 0.1 0.0 0.0 0.0 0.0
Comamonadaceae 0.3 0.0 44.3 4.5 0.3 9.3
Oxalobacteraceae 0.0 0.0 0.0 1.5 0.0 0.0
Neisseriaceae 0.0 0.0 2.8 0.0 0.0 0.0
Deltaproteobacteria 12.6 0.0 1.6 0.0 0.0 0.0
Desulfobulbaceae 3.3 0.0 0.0 0.0 0.0 0.0
Desulfuromonadaceae 0.4 0.0 0.0 0.0 0.0 0.0
Geobacteraceae 8.9 0.0 0.0 0.0 0.0 0.0
Cystobacteraceae 0.0 0.0 1.6 0.0 0.0 0.0
Epsilonproteobacteria 1.3 0.0 0.0 0.0 0.0 0.0
Campylobacteraceae 1.3 0.0 0.0 0.0 0.0 0.0
Gammaproteobacteria 33.9 11.2 10.9 16.4 53.5 11.3
Alteromonadaceae 0.6 0.0 0.0 0.0 11.2 0.0
Colwelliaceae 0.3 0.0 0.0 0.0 0.0 0.0
Moritellaceae 0.4 0.0 0.0 0.0 0.0 0.0
Enterobacteriaceae 0.0 3.2 8.6 5.5 4.3 8.9
Halomonadaceae 24.2 0.0 1.5 0.0 27.9 0.0
Oceanospirillales (family) 3.3 0.0 0.0 0.0 0.0 0.0
Moraxellaceae 2.2 0.0 0.0 0.0 1.1 0.0
Pseudomonadaceae 1.4 0.2 0.7 10.9 0.1 0.0
Piscirickettsiaceae 1.4 0.0 0.0 0.0 7.8 0.0
Vibrionaceae 0.0 0.0 0.0 0.0 1.2 2.4
Xanthomonadaceae 0.0 7.8 0.0 0.0 0.1 0.0
Verrucomicrobia 0.0 9.6 0.0 0.0 0.0 0.3
Opitutaceae 0.0 0.0 0.0 0.0 0.0 0.3
Spartobacteria (family) 0.0 0.2 0.0 0.0 0.0 0.0
Verrucomicrobiaceae 0.0 9.4 0.0 0.0 0.0 0.0
WS3 0.0 1.9 0.0 0.0 0.0 0.0
WS3 (family) 0.0 1.9 0.0 0.0 0.0 0.0
IODP Expedition 325 to the Great Barrier Reef following 3 monthsstorage at 4˚C. These data indicate subsurface microbial popula-tions remain metabolically active under these conditions and arethus capable of altering sediment geochemistry during storage.Unique to this analysis is the use of RNA-based targets to deter-mine the metabolically active fraction of the total population. Theconcentration of ribosomes, and thus copies of SSU rRNA withina cell, is linearly correlated to cellular metabolic activity (Delonget al., 1989; Kerkhof and Ward, 1993; Lee and Kemp, 1994),with dormant and dead cells having few to no ribosomes present(Fegatella et al., 1998). The active population both responds to andchanges the geochemistry in the environment. Therefore, charac-terizing this population provided a proxy for identifying potential
shifts in the geochemistry and assessment of the integrity of thecore. In addition, a change in this population determined a frac-tion of the population that was below detection limits or dormantduring in situ geochemical conditions, but active during storageconditions. This viable fraction of the community represented asource for different metabolic processes available to the commu-nity when the environment changed and highlighted a potentiallyunderestimated portion of the community. Further enrichment-based culturing has the potential to define a larger amount ofdiversity and function within this and other communities.
A shift at the family taxonomic level following 3 months ofstorage between the offshore and onshore sampling time pointsincorporated as much as 90% of the sequence data set from the
www.frontiersin.org February 2012 | Volume 3 | Article 49 | 7
Mills et al. Microbial shifts during sample storage
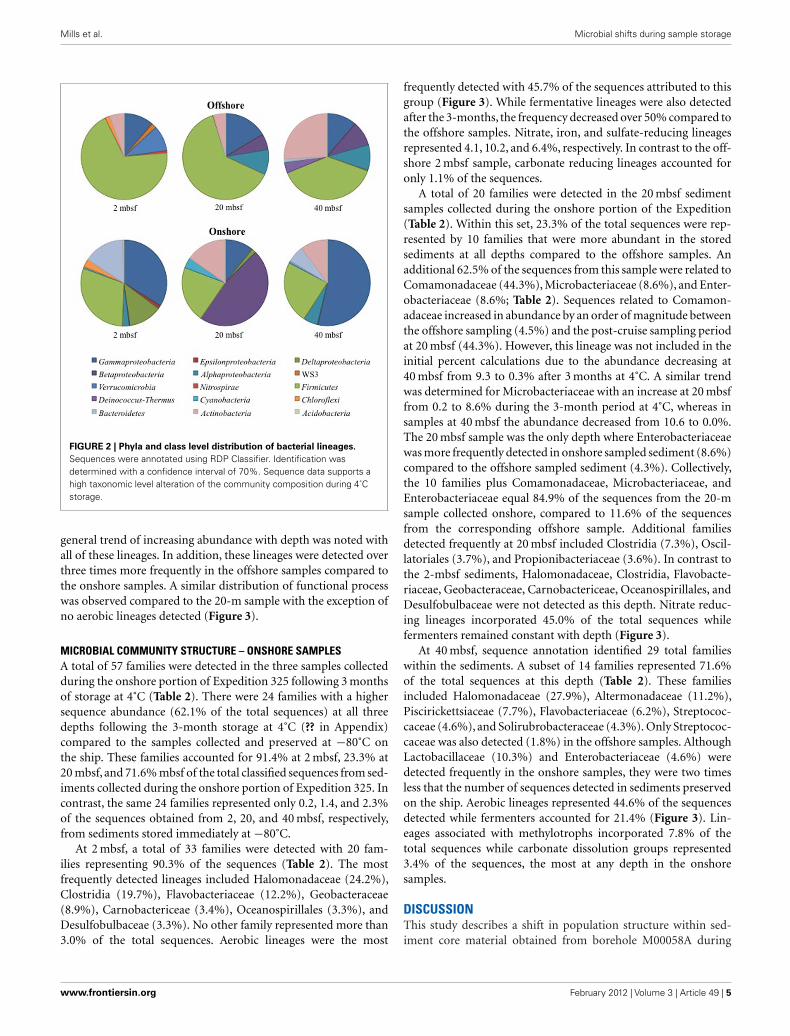
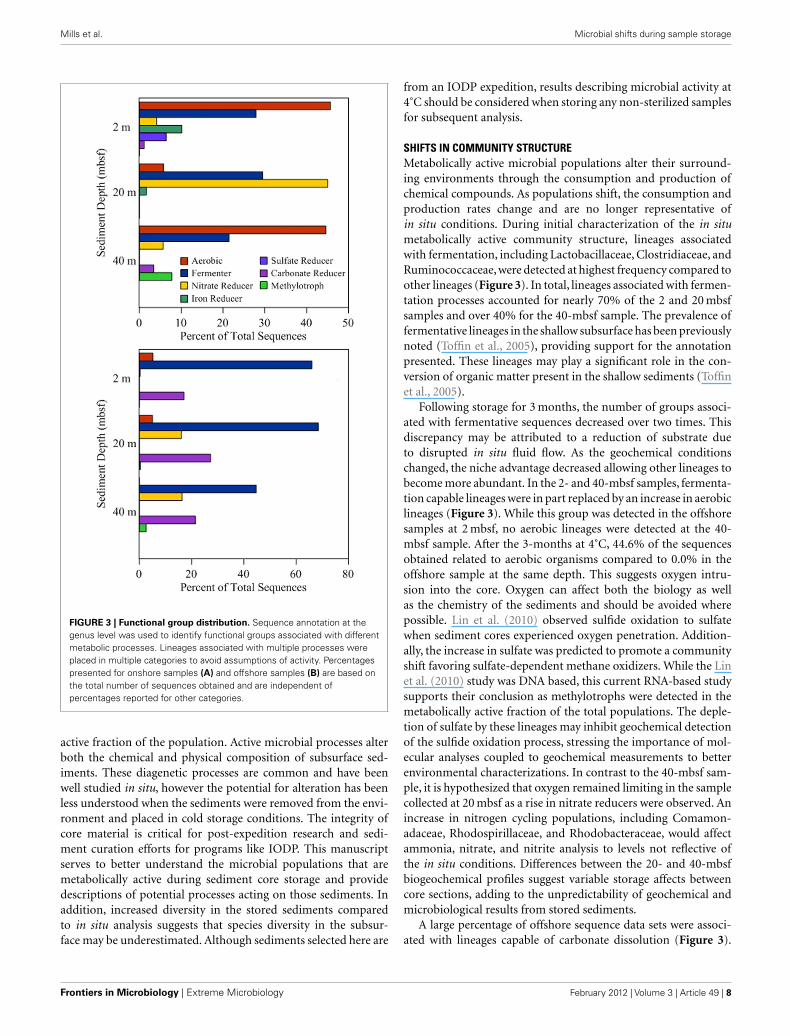
FIGURE 3 | Functional group distribution. Sequence annotation at thegenus level was used to identify functional groups associated with differentmetabolic processes. Lineages associated with multiple processes wereplaced in multiple categories to avoid assumptions of activity. Percentagespresented for onshore samples (A) and offshore samples (B) are based onthe total number of sequences obtained and are independent ofpercentages reported for other categories.
active fraction of the population. Active microbial processes alterboth the chemical and physical composition of subsurface sed-iments. These diagenetic processes are common and have beenwell studied in situ, however the potential for alteration has beenless understood when the sediments were removed from the envi-ronment and placed in cold storage conditions. The integrity ofcore material is critical for post-expedition research and sedi-ment curation efforts for programs like IODP. This manuscriptserves to better understand the microbial populations that aremetabolically active during sediment core storage and providedescriptions of potential processes acting on those sediments. Inaddition, increased diversity in the stored sediments comparedto in situ analysis suggests that species diversity in the subsur-face may be underestimated. Although sediments selected here are
from an IODP expedition, results describing microbial activity at4˚C should be considered when storing any non-sterilized samplesfor subsequent analysis.
SHIFTS IN COMMUNITY STRUCTUREMetabolically active microbial populations alter their surround-ing environments through the consumption and production ofchemical compounds. As populations shift, the consumption andproduction rates change and are no longer representative ofin situ conditions. During initial characterization of the in situmetabolically active community structure, lineages associatedwith fermentation, including Lactobacillaceae, Clostridiaceae, andRuminococcaceae, were detected at highest frequency compared toother lineages (Figure 3). In total, lineages associated with fermen-tation processes accounted for nearly 70% of the 2 and 20 mbsfsamples and over 40% for the 40-mbsf sample. The prevalence offermentative lineages in the shallow subsurface has been previouslynoted (Toffin et al., 2005), providing support for the annotationpresented. These lineages may play a significant role in the con-version of organic matter present in the shallow sediments (Toffinet al., 2005).
Following storage for 3 months, the number of groups associ-ated with fermentative sequences decreased over two times. Thisdiscrepancy may be attributed to a reduction of substrate dueto disrupted in situ fluid flow. As the geochemical conditionschanged, the niche advantage decreased allowing other lineages tobecome more abundant. In the 2- and 40-mbsf samples, fermenta-tion capable lineages were in part replaced by an increase in aerobiclineages (Figure 3). While this group was detected in the offshoresamples at 2 mbsf, no aerobic lineages were detected at the 40-mbsf sample. After the 3-months at 4˚C, 44.6% of the sequencesobtained related to aerobic organisms compared to 0.0% in theoffshore sample at the same depth. This suggests oxygen intru-sion into the core. Oxygen can affect both the biology as wellas the chemistry of the sediments and should be avoided wherepossible. Lin et al. (2010) observed sulfide oxidation to sulfatewhen sediment cores experienced oxygen penetration. Addition-ally, the increase in sulfate was predicted to promote a communityshift favoring sulfate-dependent methane oxidizers. While the Linet al. (2010) study was DNA based, this current RNA-based studysupports their conclusion as methylotrophs were detected in themetabolically active fraction of the total populations. The deple-tion of sulfate by these lineages may inhibit geochemical detectionof the sulfide oxidation process, stressing the importance of mol-ecular analyses coupled to geochemical measurements to betterenvironmental characterizations. In contrast to the 40-mbsf sam-ple, it is hypothesized that oxygen remained limiting in the samplecollected at 20 mbsf as a rise in nitrate reducers were observed. Anincrease in nitrogen cycling populations, including Comamon-adaceae, Rhodospirillaceae, and Rhodobacteraceae, would affectammonia, nitrate, and nitrite analysis to levels not reflective ofthe in situ conditions. Differences between the 20- and 40-mbsfbiogeochemical profiles suggest variable storage affects betweencore sections, adding to the unpredictability of geochemical andmicrobiological results from stored sediments.
A large percentage of offshore sequence data sets were associ-ated with lineages capable of carbonate dissolution (Figure 3).
Frontiers in Microbiology | Extreme Microbiology February 2012 | Volume 3 | Article 49 | 8
Mills et al. Microbial shifts during sample storage
This was expected given the location of the sediments beingin close proximity to the Great Barrier Reef. However, follow-ing incubation, the frequency of detection for these groupsdropped an order of magnitude on average with the 20-mbsfsample populations shifting from 27.2% of the total sequencesto undetectable. This shift suggests a major alteration of thegeochemical environment, requiring specific analysis to deter-mine the cause and implications. Due to shipboard limitations,this analysis could not be preformed and thus was beyond thecapacity of this study. These data represent the first step tobeing able to identify metabolic processes within stored sedi-ments and provide a more clear prediction of sediment alterationcapacity.
A significant rise in the number of sequences related to ironand sulfate-reducing lineages was observed in the sedimentsobtained onshore compared to the offshore samples. Both ironand sulfate-reducing functional groups were only detected aftersediment storage and accounted for over 10 and 6% of thetotal sequences. These populations becoming metabolically activewould affect any post-expedition analysis of sulfur and iron chem-istry. They have the potential to reduce sulfate and Fe(III) con-centrations in marine systems to below detection limits whileforming multiple iron sulfur mineral compounds. Secondaryeffects would change the pH of the sediment and alter organicmatter content and concentration. In addition, the paleomag-netic record within the sediments, or other material would bealtered by both iron reducing and oxidizing populations (Kostkaand Nealson, 1995; Zachara et al., 1998 reviewed in Kopp andKirschvink, 2008). An active microbial population would altermultiple characterization efforts within the sediment profile.Understanding these processes and how to better reducing themis required.
VIABLE FRACTION OF THE POPULATION – METABOLIC SINKA community shift within a closed system implies that a portionof the population was either metabolically active but below detec-tion limits, or dormant in situ. The implications of these shiftsare critical for the core preservation strategies and down streamanalysis reliability, as well as, for understanding the overall viablefraction of the subsurface biosphere. To verify a closed system, sed-iments collected were examined for contamination resulting fromthe drilling process. Results suggest that the contamination poten-tial was very low, but the authors recognize that this possibilitycannot be fully ruled out. A general contamination during drillingor storage would have resulted in a homogenization of the detectedcommunity structure. Variations in the detection frequency ofmultiple lineages suggest a general contamination did not occur.
Aerobic populations were detected in the 40-mbsf onshore sam-ple. These two lineages, Alteromonadaceae and Flavobacteriaceaewere detected in the 2-mbsf sample as well, but not in the 20-mbsfsample. The increase in abundance of related sequences suggestsoxygen intrusion into the sediment may have occurred, howeverthese populations can be facultatively anaerobic as well. These twopopulations were not detected at 20 mbsf, reducing the potentialfor this to be a drilling contamination or air borne contamina-tion during storage. Additional testing beyond the scope of thispaper would be required to determine the true origin of thispopulation.
These results support a fraction of the population remainingviable but dormant within the subsurface. The lower amountof diversity reported in the metabolically active in situ popula-tion (offshore sample) compared to the higher level of diversityobserved on shore supports niche diversification during storageand the revival of dormant populations. The coring process dis-rupted multiple environmental factors, including resource avail-ability, pressure, and temperature. These stressors have con-tributed to shifts in community composition in other environ-ments (Hunter et al., 2006; Lewis, 2007). Within these samples,the environmental changes revived microbial populations in sed-iments dated to over 50 kyr cal before present (Yusuke et al.,2011). The subsurface is considered geochemically stable withslow change over time; a characteristic that has the potential tolimit diversity (Orcutt et al., 2011) and the effectiveness of dor-mancy as a strategy to maintain a viable population (Jones andLennon, 2010). However, the population characterized in thesesamples potentially provided a source of functional diversity forcommunity activity over geologic timescales. This expands thepotential range of such survival strategies beyond environmentswith periodic shifts in geochemical and geotechnical conditions(Cohen, 1970; Fuhrman et al., 2006; Jones and Lennon, 2010), andshould be considered in estimates of community functional capac-ity. Future studies will quantify the depth of the functional sinkavailable to respond to changing environments. In addition, thelength of time these dormant populations remain viable will bedetermined to better understand the effect of temporal isolation.
ACKNOWLEDGMENTSThe authors would like to thank the science party of IODP Expe-dition 325 and the crew aboard the Greatship Maya. Additionally,we thank Scot Dowd, Alicia Shepard, and Laura Zinke with dataprocessing. The Consortium of Ocean Leadership provided fund-ing for this project. This paper is contribution number 126 to theCenter for Dark Energy Biosphere Investigations (CDEBI).
REFERENCESBickle, M., Arculus, R., Barrett, P.,
Decanto, R., Camoin, G., Edwards,K., Fisher, A., Inagaki, F., Ravelo, C.,Saffer, D., and Teagle, D. (2011). Illu-minating Earth’s Past, Present, andFuture: International Ocean Discov-ery Program Science Plan 2013–2023.Washington DC: Integrated OceanDrilling Program ManagementInternational.
Cohen, D. (1970). A theoretical modelfor the optimal timing of diapause.Am. Nat. 104, 389–400.
Delong, E. F., Wickham, G. S.,and Pace, N. R. (1989). Phylo-genetic stains – ribosomal RNA-based probes for the identifica-tion of single cells. Science 243,1360–1363.
Dowd, S. E., Zaragoza, J., Rodriguez,J. R., Oliver, M. J., and Payton, P.
R. (2005). Windows.NET networkdistributed Basic Local AlignmentSearch Toolkit (W.ND-BLAST).BMC Bioinformatics 6, 93.doi:10.1186/1471-2105-6-93
Fegatella, F., Lim, J., Kjelleberg, S.,and Cavicchioli, R. (1998). Implica-tions of rRNA operon copy num-ber and ribosome content in themarine oligotrophic ultramicrobac-terium Sphingomonas sp. strain
RB2256. Appl. Environ. Microbiol.64, 4433–4438.
Fry, J. C., Parkes, R. J., Cragg, B.A., Weightman, A. J., and Webster,G. (2008). Prokaryotic biodiversityand activity in the deep subseafloorbiosphere. FEMS Microbiol. Ecol. 66,181–196.
Fuhrman, J. A., Hewson, I., Schwal-bach, M. S., Steele, J. A., Brown, M.V., and Naeem, S. (2006). Annually
www.frontiersin.org February 2012 | Volume 3 | Article 49 | 9
Mills et al. Microbial shifts during sample storage
reoccurring bacterial communitiesare predictable from ocean condi-tions. Proc. Natl. Acad. Sci. U.S.A.103, 13104–13109.
Giovannoni, J. J., Wing, R. A., Ganal, M.W., and Tanksley, S. D. (1991). Isola-tion of molecular markers from spe-cific chromosomal intervals usingDNA pools from existing mappingpopulations. Nucleic Acids Res. 19,6553–6558.
Gontcharova, V., Youn, E., Wolcott, R.D., Hollister, E. B., Gentry, T. J.,and Dowd, S. E. (2010). Black boxchimera check (B2C2): a windows-based software for batch depletion ofchimeras from bacterial 16S rRNAgene datasets. Open Microbiol. J. 4,47–52.
Hall, P. O., and Aller, R. C. (1992).Rapid, small-volume, flow-injectionanalysis for sigma CO2 and NH4+in marine and fresh waters. Limnol.Oceanogr. 37, 1113–1119.
Handl, S., Dowd, S. E., Garcia-Mazcorro, J. F., Steiner, J. M., andSuchodolski, J. S. (2011). Massiveparallel 16S rRNA gene pyrose-quencing reveals highly diverse fecalbacterial and fungal communities inhealthy dogs and cats. FEMS Micro-biol. Ecol. 76, 1–10.
Hunter, E. M., Mills, H. J., and Kostka,J. E. (2006). Microbial commu-nity diversity associated with carbonand nitrogen cycling in permeablemarine sediments. Appl. Environ.Microbiol. 72, 5689–5701.
Jones, S. E., and Lennon, J. T.(2010). Dormancy contributes to themaintenance of microbial diversity.Proc. Natl. Acad. Sci. U.S.A. 107,5881–5886.
Jones, S. E., and McMahon, K. D.(2009). Species-sorting may explainan apparent minimal effect of
immigration on freshwater bacterialcommunity dynamics. Environ.Microbiol. 11, 905–913.
Jørgensen, B. B. (2011). Deep sub-seafloor microbial cells on physio-logical standby. Proc. Natl. Acad. Sci.U.S.A. 108, 18193–18194.
Kerkhof, L. J., and Ward, B. B.(1993). Comparison of nucleic acidhybridization and fluorometry formeasurement of RNA/DNA rela-tionship with growth rate in amarine bacterium. Appl. Environ.Microbiol. 59, 1303–1307.
König, I., Lougear, A., Bruns, P.,Gru¨tzner, J., Trautwein, A. X., andDullo, W.-C. (2000). “Iron oxidationin sediment cores (site 1062) duringsix months of storage in the OceanDrilling Program archive,” in Pro-ceedings of the Ocean Drilling Pro-gram, Scientific Results, eds L. D.Keigwin, D. Rio, G. D. Acton, andE. Arnold (College Station: OceanDrilling Program).
Kopp, R. E., and Kirschvink, J. L. (2008).The identification and biogeochem-ical interpretation of fossil magne-totactic bacteria. Earth Sci. Rev. 86,42–61.
Kostka, J. E., and Nealson, K. H. (1995).Dissolution and reduction of mag-netite by bacteria. Environ. Sci. Tech-nol. 29, 2535–2540.
Lee, S. H., and Kemp, P. F. (1994).Single cell RNA content of naturalmarine planktonic bacteria mea-sured by hybridization with multiple16S ribosomal RNA targeted fluores-cent probes. Limnol. Oceanogr. 39,869–879.
Lewis, K. (2007). Persister cells, dor-mancy and infectious disease. Nat.Rev. Microbiol. 5, 48–56.
Lin, Y. S., Biddle, J. F., Lipp, J. S.,Orcutt, B. N., Holler, T., Teske, A.,
and Hinrichs, K. U. (2010). Effect ofstorage conditions on archaeal andbacterial communities in subsurfacemarine sediments. Geomicrobiol. J.27, 261–272.
Mills, H. J., Hunter, E., Humphrys,M., Kerkhof, L., Mcguinness, L. M.,Huettel, M., and Kostka, J. E. (2008).Characterization of nitrifying, den-itrifying, and overall bacterial com-munities in permeable marine sed-iments of the northeastern Gulf ofMexico. Appl. Environ. Microbiol. 74,4440–4453.
Nogales, B., Moore, E. R. B., Abra-ham, W. R., and Timmis, K. N.(1999). Identification of the meta-bolically active members of a bac-terial community in a polychlori-nated biphenyl-polluted moorlandsoil. Environ. Microbiol. 1, 199–212.
Orcutt, B. N., Sylvan, J. B., Knab,N. J., and Edwards, K. J. (2011).Microbial ecology of the darkocean above, at, and below theseafloor. Microbiol. Mol. Biol. Rev. 75,361–422.
Reese, B. K., Mills, H. J., Dowd, S., andMorse, J. W. (2012). Benthic biogeo-chemistry of microbial iron and sul-fate reduction in the Gulf of Mexicohypoxic zone. Geomicrobiology (inpress).
Stackebrandt, E., and Goebel, B. M.(1994). A place for DNA-DNAreassociation and 16S ribosomalRNA sequence analysis in thepresent species definition in bac-teriology. Int. J. Syst. Bacteriol. 44,846–849.
Toffin, L., Zink, K., Kato, C., Pignet, P.,Bidault, A., Bienvenu, N., Birrien, J.L., and Prieur, D. (2005). Marini-lactibacillus piezotolerans sp nov., anovel marine lactic acid bacteriumisolated from deep sub-seafloor
sediment of the Nankai Trough.Int. J. Syst. Evol. Microbiol. 55,345–351.
Yusuke, Y., Webster, J. M., Cotterill,C., Braga, J. C., Jovane, J., Mills,H. J., Morgan, S., Suzuki, A., andScientists, T. I. E. (2011). IODPExpedition 325: Great Barrier Reefsreveals past sea-level, climate andenvironmental changes since the lastice age. Sci. Drilling 12, 32–45.
Zachara, J. M., Fredrickson, J. K., Li, S.M., Kennedy, D. W., Smith, S. C.,and Gassman, P. L. (1998). Bacterialreduction of crystalline Fe3+ oxidesin single phase suspensions and sub-surface materials. Am. Mineral. 83,1426–1443.
Conflict of Interest Statement: Theauthors declare that the research wasconducted in the absence of any com-mercial or financial relationships thatcould be construed as a potential con-flict of interest.
Received: 23 November 2011; paperpending published: 16 December 2011;accepted: 30 January 2012; publishedonline: 17 February 2012.Citation: Mills HJ, Reese BK andPeter CS (2012) Characterization ofmicrobial population shifts during sam-ple storage. Front. Microbio. 3:49. doi:10.3389/fmicb.2012.00049This article was submitted to Frontiersin Extreme Microbiology, a specialty ofFrontiers in Microbiology.Copyright © 2012 Mills, Reese and Peter .This is an open-access article distributedunder the terms of the Creative CommonsAttribution Non Commercial License,which permits non-commercial use, dis-tribution, and reproduction in otherforums, provided the original authors andsource are credited.
Frontiers in Microbiology | Extreme Microbiology February 2012 | Volume 3 | Article 49 | 10
Mills et al. Microbial shifts during sample storage
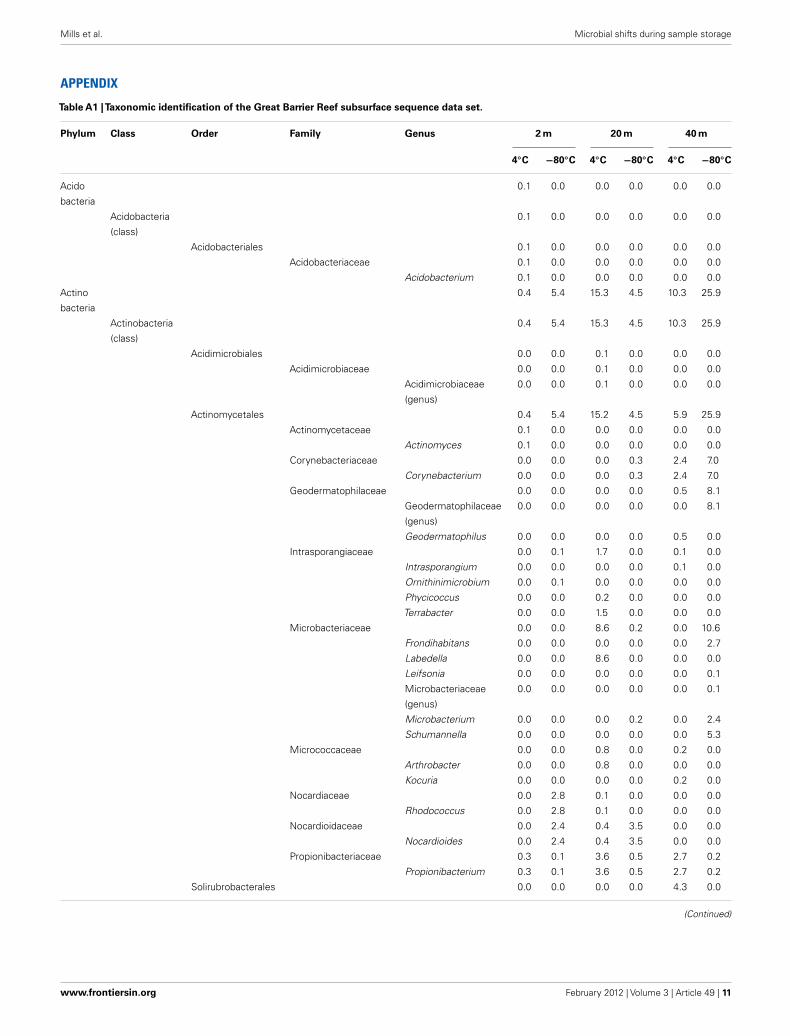
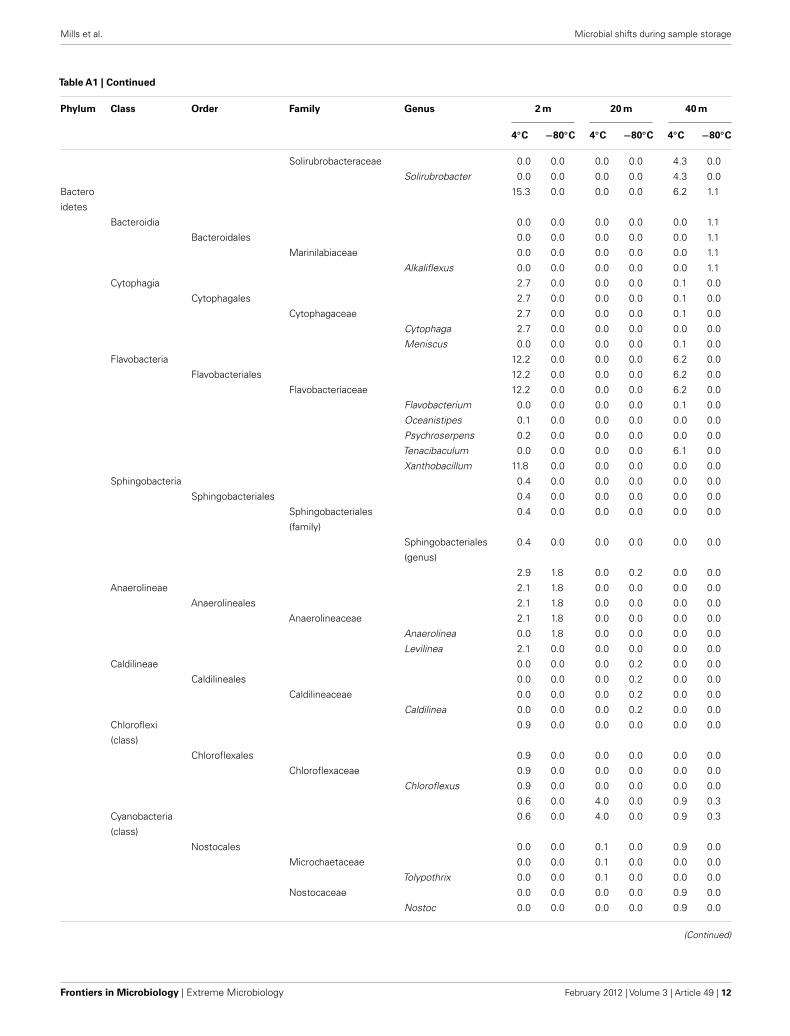
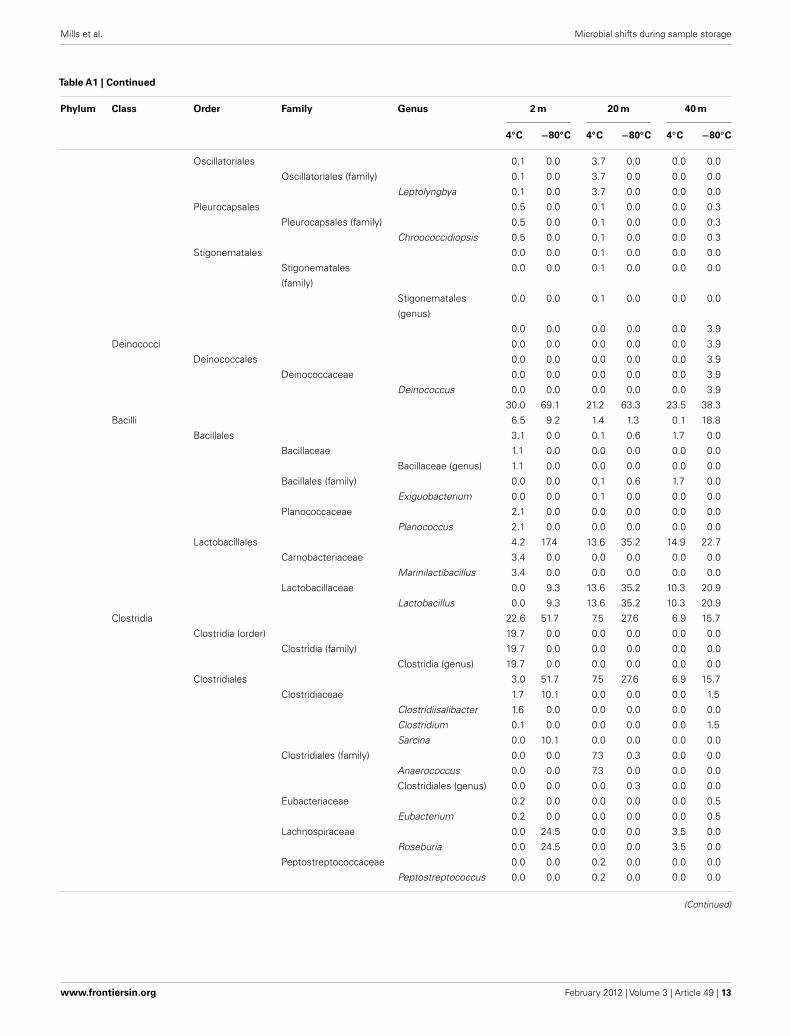
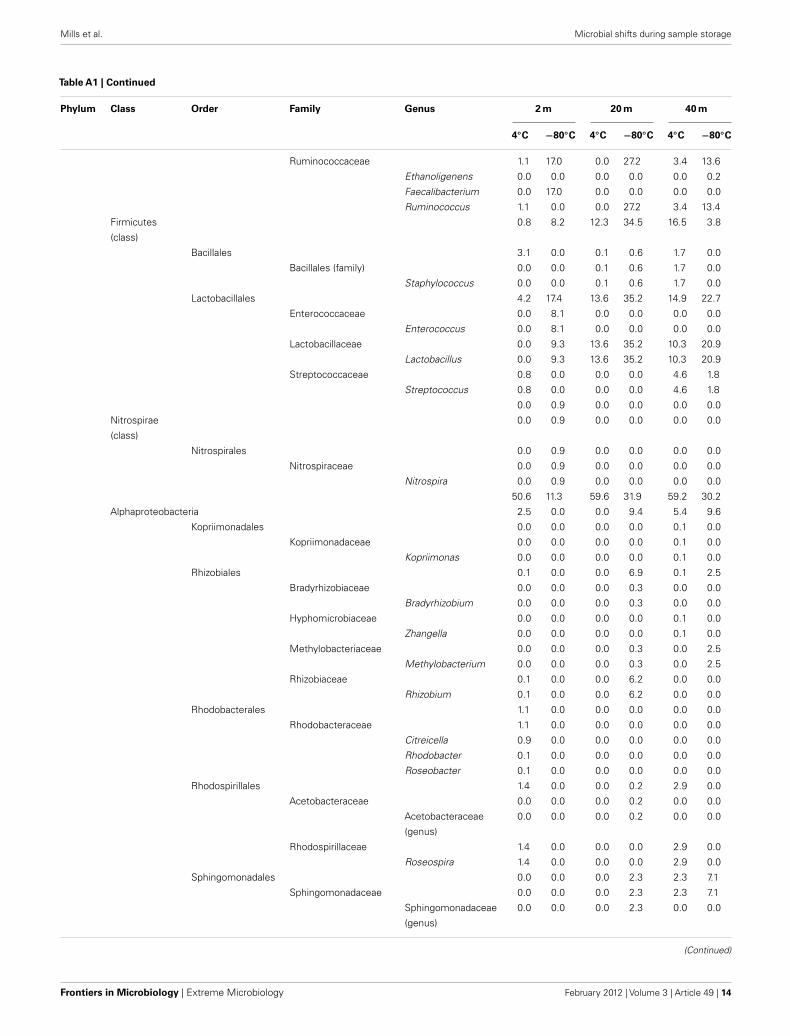
APPENDIX
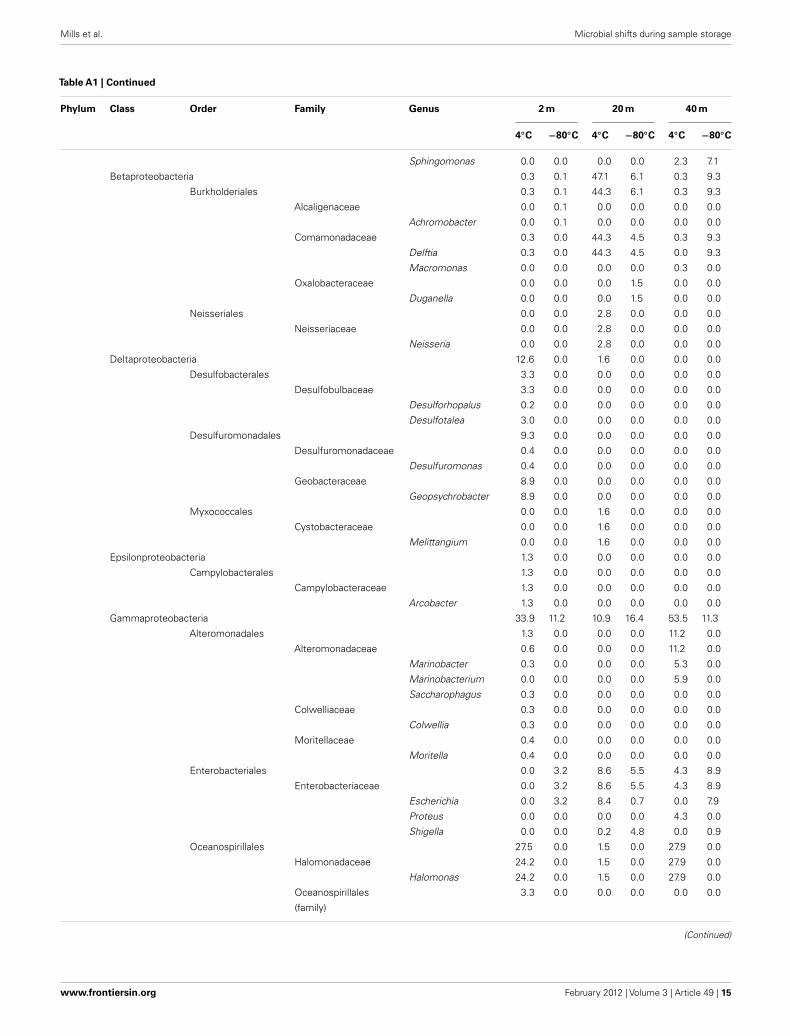
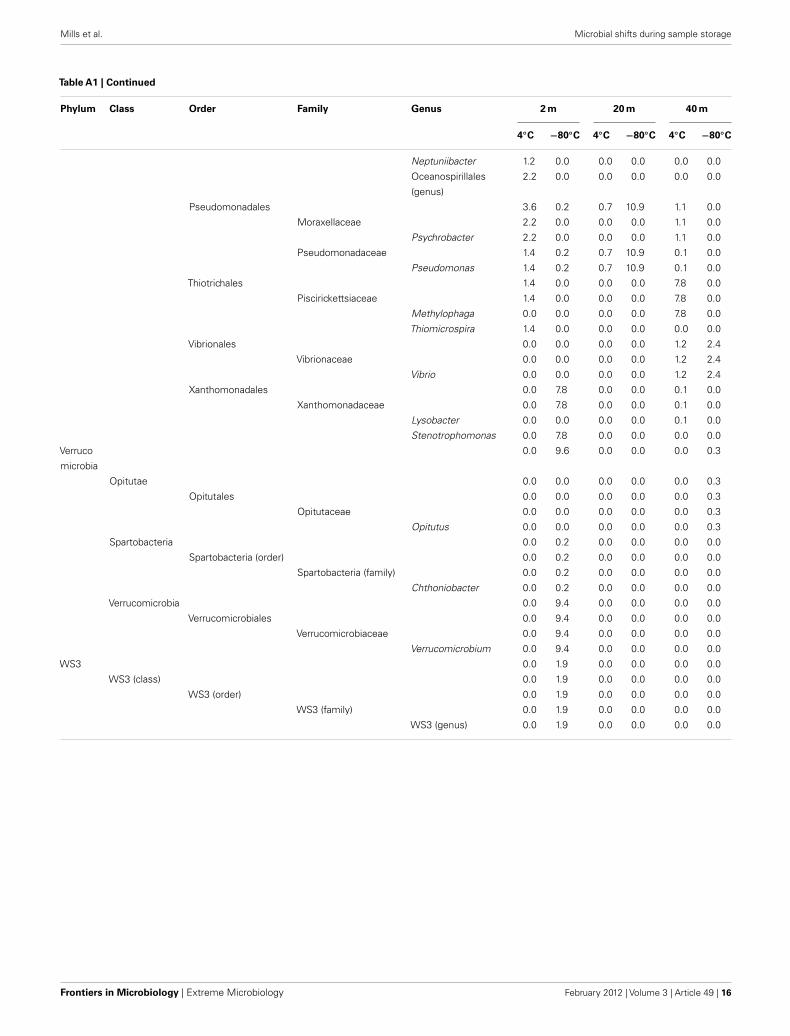
Table A1 |Taxonomic identification of the Great Barrier Reef subsurface sequence data set.
Phylum Class Order Family Genus 2 m 20 m 40 m
4◦C −80◦C 4◦C −80◦C 4◦C −80◦C
Acido
bacteria
0.1 0.0 0.0 0.0 0.0 0.0
Acidobacteria
(class)
0.1 0.0 0.0 0.0 0.0 0.0
Acidobacteriales 0.1 0.0 0.0 0.0 0.0 0.0
Acidobacteriaceae 0.1 0.0 0.0 0.0 0.0 0.0
Acidobacterium 0.1 0.0 0.0 0.0 0.0 0.0
Actino
bacteria
0.4 5.4 15.3 4.5 10.3 25.9
Actinobacteria
(class)
0.4 5.4 15.3 4.5 10.3 25.9
Acidimicrobiales 0.0 0.0 0.1 0.0 0.0 0.0
Acidimicrobiaceae 0.0 0.0 0.1 0.0 0.0 0.0
Acidimicrobiaceae
(genus)
0.0 0.0 0.1 0.0 0.0 0.0
Actinomycetales 0.4 5.4 15.2 4.5 5.9 25.9
Actinomycetaceae 0.1 0.0 0.0 0.0 0.0 0.0
Actinomyces 0.1 0.0 0.0 0.0 0.0 0.0
Corynebacteriaceae 0.0 0.0 0.0 0.3 2.4 7.0
Corynebacterium 0.0 0.0 0.0 0.3 2.4 7.0
Geodermatophilaceae 0.0 0.0 0.0 0.0 0.5 8.1
Geodermatophilaceae
(genus)
0.0 0.0 0.0 0.0 0.0 8.1
Geodermatophilus 0.0 0.0 0.0 0.0 0.5 0.0
Intrasporangiaceae 0.0 0.1 1.7 0.0 0.1 0.0
Intrasporangium 0.0 0.0 0.0 0.0 0.1 0.0
Ornithinimicrobium 0.0 0.1 0.0 0.0 0.0 0.0
Phycicoccus 0.0 0.0 0.2 0.0 0.0 0.0
Terrabacter 0.0 0.0 1.5 0.0 0.0 0.0
Microbacteriaceae 0.0 0.0 8.6 0.2 0.0 10.6
Frondihabitans 0.0 0.0 0.0 0.0 0.0 2.7
Labedella 0.0 0.0 8.6 0.0 0.0 0.0
Leifsonia 0.0 0.0 0.0 0.0 0.0 0.1
Microbacteriaceae
(genus)
0.0 0.0 0.0 0.0 0.0 0.1
Microbacterium 0.0 0.0 0.0 0.2 0.0 2.4
Schumannella 0.0 0.0 0.0 0.0 0.0 5.3
Micrococcaceae 0.0 0.0 0.8 0.0 0.2 0.0
Arthrobacter 0.0 0.0 0.8 0.0 0.0 0.0
Kocuria 0.0 0.0 0.0 0.0 0.2 0.0
Nocardiaceae 0.0 2.8 0.1 0.0 0.0 0.0
Rhodococcus 0.0 2.8 0.1 0.0 0.0 0.0
Nocardioidaceae 0.0 2.4 0.4 3.5 0.0 0.0
Nocardioides 0.0 2.4 0.4 3.5 0.0 0.0
Propionibacteriaceae 0.3 0.1 3.6 0.5 2.7 0.2
Propionibacterium 0.3 0.1 3.6 0.5 2.7 0.2
Solirubrobacterales 0.0 0.0 0.0 0.0 4.3 0.0
(Continued)
www.frontiersin.org February 2012 | Volume 3 | Article 49 | 11
Mills et al. Microbial shifts during sample storage
Table A1 | Continued
Phylum Class Order Family Genus 2 m 20 m 40 m
4◦C −80◦C 4◦C −80◦C 4◦C −80◦C
Solirubrobacteraceae 0.0 0.0 0.0 0.0 4.3 0.0
Solirubrobacter 0.0 0.0 0.0 0.0 4.3 0.0
Bactero
idetes
15.3 0.0 0.0 0.0 6.2 1.1
Bacteroidia 0.0 0.0 0.0 0.0 0.0 1.1
Bacteroidales 0.0 0.0 0.0 0.0 0.0 1.1
Marinilabiaceae 0.0 0.0 0.0 0.0 0.0 1.1
Alkaliflexus 0.0 0.0 0.0 0.0 0.0 1.1
Cytophagia 2.7 0.0 0.0 0.0 0.1 0.0
Cytophagales 2.7 0.0 0.0 0.0 0.1 0.0
Cytophagaceae 2.7 0.0 0.0 0.0 0.1 0.0
Cytophaga 2.7 0.0 0.0 0.0 0.0 0.0
Meniscus 0.0 0.0 0.0 0.0 0.1 0.0
Flavobacteria 12.2 0.0 0.0 0.0 6.2 0.0
Flavobacteriales 12.2 0.0 0.0 0.0 6.2 0.0
Flavobacteriaceae 12.2 0.0 0.0 0.0 6.2 0.0
Flavobacterium 0.0 0.0 0.0 0.0 0.1 0.0
Oceanistipes 0.1 0.0 0.0 0.0 0.0 0.0
Psychroserpens 0.2 0.0 0.0 0.0 0.0 0.0
Tenacibaculum 0.0 0.0 0.0 0.0 6.1 0.0
Xanthobacillum 11.8 0.0 0.0 0.0 0.0 0.0
Sphingobacteria 0.4 0.0 0.0 0.0 0.0 0.0
Sphingobacteriales 0.4 0.0 0.0 0.0 0.0 0.0
Sphingobacteriales
(family)
0.4 0.0 0.0 0.0 0.0 0.0
Sphingobacteriales
(genus)
0.4 0.0 0.0 0.0 0.0 0.0
2.9 1.8 0.0 0.2 0.0 0.0
Anaerolineae 2.1 1.8 0.0 0.0 0.0 0.0
Anaerolineales 2.1 1.8 0.0 0.0 0.0 0.0
Anaerolineaceae 2.1 1.8 0.0 0.0 0.0 0.0
Anaerolinea 0.0 1.8 0.0 0.0 0.0 0.0
Levilinea 2.1 0.0 0.0 0.0 0.0 0.0
Caldilineae 0.0 0.0 0.0 0.2 0.0 0.0
Caldilineales 0.0 0.0 0.0 0.2 0.0 0.0
Caldilineaceae 0.0 0.0 0.0 0.2 0.0 0.0
Caldilinea 0.0 0.0 0.0 0.2 0.0 0.0
Chloroflexi
(class)
0.9 0.0 0.0 0.0 0.0 0.0
Chloroflexales 0.9 0.0 0.0 0.0 0.0 0.0
Chloroflexaceae 0.9 0.0 0.0 0.0 0.0 0.0
Chloroflexus 0.9 0.0 0.0 0.0 0.0 0.0
0.6 0.0 4.0 0.0 0.9 0.3
Cyanobacteria
(class)
0.6 0.0 4.0 0.0 0.9 0.3
Nostocales 0.0 0.0 0.1 0.0 0.9 0.0
Microchaetaceae 0.0 0.0 0.1 0.0 0.0 0.0
Tolypothrix 0.0 0.0 0.1 0.0 0.0 0.0
Nostocaceae 0.0 0.0 0.0 0.0 0.9 0.0
Nostoc 0.0 0.0 0.0 0.0 0.9 0.0
(Continued)
Frontiers in Microbiology | Extreme Microbiology February 2012 | Volume 3 | Article 49 | 12
Mills et al. Microbial shifts during sample storage
Table A1 | Continued
Phylum Class Order Family Genus 2 m 20 m 40 m
4◦C −80◦C 4◦C −80◦C 4◦C −80◦C
Oscillatoriales 0.1 0.0 3.7 0.0 0.0 0.0
Oscillatoriales (family) 0.1 0.0 3.7 0.0 0.0 0.0
Leptolyngbya 0.1 0.0 3.7 0.0 0.0 0.0
Pleurocapsales 0.5 0.0 0.1 0.0 0.0 0.3
Pleurocapsales (family) 0.5 0.0 0.1 0.0 0.0 0.3
Chroococcidiopsis 0.5 0.0 0.1 0.0 0.0 0.3
Stigonematales 0.0 0.0 0.1 0.0 0.0 0.0
Stigonematales
(family)
0.0 0.0 0.1 0.0 0.0 0.0
Stigonematales
(genus)
0.0 0.0 0.1 0.0 0.0 0.0
0.0 0.0 0.0 0.0 0.0 3.9
Deinococci 0.0 0.0 0.0 0.0 0.0 3.9
Deinococcales 0.0 0.0 0.0 0.0 0.0 3.9
Deinococcaceae 0.0 0.0 0.0 0.0 0.0 3.9
Deinococcus 0.0 0.0 0.0 0.0 0.0 3.9
30.0 69.1 21.2 63.3 23.5 38.3
Bacilli 6.5 9.2 1.4 1.3 0.1 18.8
Bacillales 3.1 0.0 0.1 0.6 1.7 0.0
Bacillaceae 1.1 0.0 0.0 0.0 0.0 0.0
Bacillaceae (genus) 1.1 0.0 0.0 0.0 0.0 0.0
Bacillales (family) 0.0 0.0 0.1 0.6 1.7 0.0
Exiguobacterium 0.0 0.0 0.1 0.0 0.0 0.0
Planococcaceae 2.1 0.0 0.0 0.0 0.0 0.0
Planococcus 2.1 0.0 0.0 0.0 0.0 0.0
Lactobacillales 4.2 17.4 13.6 35.2 14.9 22.7
Carnobacteriaceae 3.4 0.0 0.0 0.0 0.0 0.0
Marinilactibacillus 3.4 0.0 0.0 0.0 0.0 0.0
Lactobacillaceae 0.0 9.3 13.6 35.2 10.3 20.9
Lactobacillus 0.0 9.3 13.6 35.2 10.3 20.9
Clostridia 22.6 51.7 7.5 27.6 6.9 15.7
Clostridia (order) 19.7 0.0 0.0 0.0 0.0 0.0
Clostridia (family) 19.7 0.0 0.0 0.0 0.0 0.0
Clostridia (genus) 19.7 0.0 0.0 0.0 0.0 0.0
Clostridiales 3.0 51.7 7.5 27.6 6.9 15.7
Clostridiaceae 1.7 10.1 0.0 0.0 0.0 1.5
Clostridiisalibacter 1.6 0.0 0.0 0.0 0.0 0.0
Clostridium 0.1 0.0 0.0 0.0 0.0 1.5
Sarcina 0.0 10.1 0.0 0.0 0.0 0.0
Clostridiales (family) 0.0 0.0 7.3 0.3 0.0 0.0
Anaerococcus 0.0 0.0 7.3 0.0 0.0 0.0
Clostridiales (genus) 0.0 0.0 0.0 0.3 0.0 0.0
Eubacteriaceae 0.2 0.0 0.0 0.0 0.0 0.5
Eubacterium 0.2 0.0 0.0 0.0 0.0 0.5
Lachnospiraceae 0.0 24.5 0.0 0.0 3.5 0.0
Roseburia 0.0 24.5 0.0 0.0 3.5 0.0
Peptostreptococcaceae 0.0 0.0 0.2 0.0 0.0 0.0
Peptostreptococcus 0.0 0.0 0.2 0.0 0.0 0.0
(Continued)
www.frontiersin.org February 2012 | Volume 3 | Article 49 | 13
Mills et al. Microbial shifts during sample storage
Table A1 | Continued
Phylum Class Order Family Genus 2 m 20 m 40 m
4◦C −80◦C 4◦C −80◦C 4◦C −80◦C
Ruminococcaceae 1.1 17.0 0.0 27.2 3.4 13.6
Ethanoligenens 0.0 0.0 0.0 0.0 0.0 0.2
Faecalibacterium 0.0 17.0 0.0 0.0 0.0 0.0
Ruminococcus 1.1 0.0 0.0 27.2 3.4 13.4
Firmicutes
(class)
0.8 8.2 12.3 34.5 16.5 3.8
Bacillales 3.1 0.0 0.1 0.6 1.7 0.0
Bacillales (family) 0.0 0.0 0.1 0.6 1.7 0.0
Staphylococcus 0.0 0.0 0.1 0.6 1.7 0.0
Lactobacillales 4.2 17.4 13.6 35.2 14.9 22.7
Enterococcaceae 0.0 8.1 0.0 0.0 0.0 0.0
Enterococcus 0.0 8.1 0.0 0.0 0.0 0.0
Lactobacillaceae 0.0 9.3 13.6 35.2 10.3 20.9
Lactobacillus 0.0 9.3 13.6 35.2 10.3 20.9
Streptococcaceae 0.8 0.0 0.0 0.0 4.6 1.8
Streptococcus 0.8 0.0 0.0 0.0 4.6 1.8
0.0 0.9 0.0 0.0 0.0 0.0
Nitrospirae
(class)
0.0 0.9 0.0 0.0 0.0 0.0
Nitrospirales 0.0 0.9 0.0 0.0 0.0 0.0
Nitrospiraceae 0.0 0.9 0.0 0.0 0.0 0.0
Nitrospira 0.0 0.9 0.0 0.0 0.0 0.0
50.6 11.3 59.6 31.9 59.2 30.2
Alphaproteobacteria 2.5 0.0 0.0 9.4 5.4 9.6
Kopriimonadales 0.0 0.0 0.0 0.0 0.1 0.0
Kopriimonadaceae 0.0 0.0 0.0 0.0 0.1 0.0
Kopriimonas 0.0 0.0 0.0 0.0 0.1 0.0
Rhizobiales 0.1 0.0 0.0 6.9 0.1 2.5
Bradyrhizobiaceae 0.0 0.0 0.0 0.3 0.0 0.0
Bradyrhizobium 0.0 0.0 0.0 0.3 0.0 0.0
Hyphomicrobiaceae 0.0 0.0 0.0 0.0 0.1 0.0
Zhangella 0.0 0.0 0.0 0.0 0.1 0.0
Methylobacteriaceae 0.0 0.0 0.0 0.3 0.0 2.5
Methylobacterium 0.0 0.0 0.0 0.3 0.0 2.5
Rhizobiaceae 0.1 0.0 0.0 6.2 0.0 0.0
Rhizobium 0.1 0.0 0.0 6.2 0.0 0.0
Rhodobacterales 1.1 0.0 0.0 0.0 0.0 0.0
Rhodobacteraceae 1.1 0.0 0.0 0.0 0.0 0.0
Citreicella 0.9 0.0 0.0 0.0 0.0 0.0
Rhodobacter 0.1 0.0 0.0 0.0 0.0 0.0
Roseobacter 0.1 0.0 0.0 0.0 0.0 0.0
Rhodospirillales 1.4 0.0 0.0 0.2 2.9 0.0
Acetobacteraceae 0.0 0.0 0.0 0.2 0.0 0.0
Acetobacteraceae
(genus)
0.0 0.0 0.0 0.2 0.0 0.0
Rhodospirillaceae 1.4 0.0 0.0 0.0 2.9 0.0
Roseospira 1.4 0.0 0.0 0.0 2.9 0.0
Sphingomonadales 0.0 0.0 0.0 2.3 2.3 7.1
Sphingomonadaceae 0.0 0.0 0.0 2.3 2.3 7.1
Sphingomonadaceae
(genus)
0.0 0.0 0.0 2.3 0.0 0.0
(Continued)
Frontiers in Microbiology | Extreme Microbiology February 2012 | Volume 3 | Article 49 | 14
Mills et al. Microbial shifts during sample storage
Table A1 | Continued
Phylum Class Order Family Genus 2 m 20 m 40 m
4◦C −80◦C 4◦C −80◦C 4◦C −80◦C
Sphingomonas 0.0 0.0 0.0 0.0 2.3 7.1
Betaproteobacteria 0.3 0.1 47.1 6.1 0.3 9.3
Burkholderiales 0.3 0.1 44.3 6.1 0.3 9.3
Alcaligenaceae 0.0 0.1 0.0 0.0 0.0 0.0
Achromobacter 0.0 0.1 0.0 0.0 0.0 0.0
Comamonadaceae 0.3 0.0 44.3 4.5 0.3 9.3
Delftia 0.3 0.0 44.3 4.5 0.0 9.3
Macromonas 0.0 0.0 0.0 0.0 0.3 0.0
Oxalobacteraceae 0.0 0.0 0.0 1.5 0.0 0.0
Duganella 0.0 0.0 0.0 1.5 0.0 0.0
Neisseriales 0.0 0.0 2.8 0.0 0.0 0.0
Neisseriaceae 0.0 0.0 2.8 0.0 0.0 0.0
Neisseria 0.0 0.0 2.8 0.0 0.0 0.0
Deltaproteobacteria 12.6 0.0 1.6 0.0 0.0 0.0
Desulfobacterales 3.3 0.0 0.0 0.0 0.0 0.0
Desulfobulbaceae 3.3 0.0 0.0 0.0 0.0 0.0
Desulforhopalus 0.2 0.0 0.0 0.0 0.0 0.0
Desulfotalea 3.0 0.0 0.0 0.0 0.0 0.0
Desulfuromonadales 9.3 0.0 0.0 0.0 0.0 0.0
Desulfuromonadaceae 0.4 0.0 0.0 0.0 0.0 0.0
Desulfuromonas 0.4 0.0 0.0 0.0 0.0 0.0
Geobacteraceae 8.9 0.0 0.0 0.0 0.0 0.0
Geopsychrobacter 8.9 0.0 0.0 0.0 0.0 0.0
Myxococcales 0.0 0.0 1.6 0.0 0.0 0.0
Cystobacteraceae 0.0 0.0 1.6 0.0 0.0 0.0
Melittangium 0.0 0.0 1.6 0.0 0.0 0.0
Epsilonproteobacteria 1.3 0.0 0.0 0.0 0.0 0.0
Campylobacterales 1.3 0.0 0.0 0.0 0.0 0.0
Campylobacteraceae 1.3 0.0 0.0 0.0 0.0 0.0
Arcobacter 1.3 0.0 0.0 0.0 0.0 0.0
Gammaproteobacteria 33.9 11.2 10.9 16.4 53.5 11.3
Alteromonadales 1.3 0.0 0.0 0.0 11.2 0.0
Alteromonadaceae 0.6 0.0 0.0 0.0 11.2 0.0
Marinobacter 0.3 0.0 0.0 0.0 5.3 0.0
Marinobacterium 0.0 0.0 0.0 0.0 5.9 0.0
Saccharophagus 0.3 0.0 0.0 0.0 0.0 0.0
Colwelliaceae 0.3 0.0 0.0 0.0 0.0 0.0
Colwellia 0.3 0.0 0.0 0.0 0.0 0.0
Moritellaceae 0.4 0.0 0.0 0.0 0.0 0.0
Moritella 0.4 0.0 0.0 0.0 0.0 0.0
Enterobacteriales 0.0 3.2 8.6 5.5 4.3 8.9
Enterobacteriaceae 0.0 3.2 8.6 5.5 4.3 8.9
Escherichia 0.0 3.2 8.4 0.7 0.0 7.9
Proteus 0.0 0.0 0.0 0.0 4.3 0.0
Shigella 0.0 0.0 0.2 4.8 0.0 0.9
Oceanospirillales 27.5 0.0 1.5 0.0 27.9 0.0
Halomonadaceae 24.2 0.0 1.5 0.0 27.9 0.0
Halomonas 24.2 0.0 1.5 0.0 27.9 0.0
Oceanospirillales
(family)
3.3 0.0 0.0 0.0 0.0 0.0
(Continued)
www.frontiersin.org February 2012 | Volume 3 | Article 49 | 15
Mills et al. Microbial shifts during sample storage
Table A1 | Continued
Phylum Class Order Family Genus 2 m 20 m 40 m
4◦C −80◦C 4◦C −80◦C 4◦C −80◦C
Neptuniibacter 1.2 0.0 0.0 0.0 0.0 0.0
Oceanospirillales
(genus)
2.2 0.0 0.0 0.0 0.0 0.0
Pseudomonadales 3.6 0.2 0.7 10.9 1.1 0.0
Moraxellaceae 2.2 0.0 0.0 0.0 1.1 0.0
Psychrobacter 2.2 0.0 0.0 0.0 1.1 0.0
Pseudomonadaceae 1.4 0.2 0.7 10.9 0.1 0.0
Pseudomonas 1.4 0.2 0.7 10.9 0.1 0.0
Thiotrichales 1.4 0.0 0.0 0.0 7.8 0.0
Piscirickettsiaceae 1.4 0.0 0.0 0.0 7.8 0.0
Methylophaga 0.0 0.0 0.0 0.0 7.8 0.0
Thiomicrospira 1.4 0.0 0.0 0.0 0.0 0.0
Vibrionales 0.0 0.0 0.0 0.0 1.2 2.4
Vibrionaceae 0.0 0.0 0.0 0.0 1.2 2.4
Vibrio 0.0 0.0 0.0 0.0 1.2 2.4
Xanthomonadales 0.0 7.8 0.0 0.0 0.1 0.0
Xanthomonadaceae 0.0 7.8 0.0 0.0 0.1 0.0
Lysobacter 0.0 0.0 0.0 0.0 0.1 0.0
Stenotrophomonas 0.0 7.8 0.0 0.0 0.0 0.0
Verruco
microbia
0.0 9.6 0.0 0.0 0.0 0.3
Opitutae 0.0 0.0 0.0 0.0 0.0 0.3
Opitutales 0.0 0.0 0.0 0.0 0.0 0.3
Opitutaceae 0.0 0.0 0.0 0.0 0.0 0.3
Opitutus 0.0 0.0 0.0 0.0 0.0 0.3
Spartobacteria 0.0 0.2 0.0 0.0 0.0 0.0
Spartobacteria (order) 0.0 0.2 0.0 0.0 0.0 0.0
Spartobacteria (family) 0.0 0.2 0.0 0.0 0.0 0.0
Chthoniobacter 0.0 0.2 0.0 0.0 0.0 0.0
Verrucomicrobia 0.0 9.4 0.0 0.0 0.0 0.0
Verrucomicrobiales 0.0 9.4 0.0 0.0 0.0 0.0
Verrucomicrobiaceae 0.0 9.4 0.0 0.0 0.0 0.0
Verrucomicrobium 0.0 9.4 0.0 0.0 0.0 0.0
WS3 0.0 1.9 0.0 0.0 0.0 0.0
WS3 (class) 0.0 1.9 0.0 0.0 0.0 0.0
WS3 (order) 0.0 1.9 0.0 0.0 0.0 0.0
WS3 (family) 0.0 1.9 0.0 0.0 0.0 0.0
WS3 (genus) 0.0 1.9 0.0 0.0 0.0 0.0
Frontiers in Microbiology | Extreme Microbiology February 2012 | Volume 3 | Article 49 | 16
Related Documents