ORIGINAL ARTICLE Shifts of functional gene representation in wheat rhizosphere microbial communities under elevated ozone Xinyu Li 1,2 , Ye Deng 2 , Qi Li 1 , Caiyan Lu 1 , Jingjing Wang 1 , Huiwen Zhang 1 , Jianguo Zhu 3 , Jizhong Zhou 2,4,5 and Zhili He 2 1 State Key Laboratory of Forest and Soil Ecology, Institute of Applied Ecology, Chinese Academy of Sciences, Shenyang, China; 2 Department of Botany and Microbiology, Institute for Environmental Genomics, The University of Oklahoma, Norman, OK, USA; 3 State Key Laboratory of Soil and Sustainable Agriculture, Institute of Soil Science, The Chinese Academy of Sciences, Nanjing, China; 4 State Key Joint Laboratory of Environment Simulation and Pollution Control, School of Environment, Tsinghua University, Beijing, China and 5 Earth Science Division, Lawrence Berkeley National Laboratory, Berkeley, CA, USA Although the influence of ozone (O 3 ) on plants has been well studied in agroecosystems, little is known about the effect of elevated O 3 (eO 3 ) on soil microbial functional communities. Here, we used a comprehensive functional gene array (GeoChip 3.0) to investigate the functional composition, and structure of rhizosphere microbial communities of Yannong 19 (O 3 -sensitive) and Yangmai 16 (O 3 - relatively sensitive) wheat (Triticum aestivum L.) cultivars under eO 3 . Compared with ambient O 3 (aO 3 ), eO 3 led to an increase in soil pH and total carbon (C) percentages in grain and straw of wheat plants, and reduced grain weight and soil dissolved organic carbon (DOC). Based on GeoChip hybridization signal intensities, although the overall functional structure of rhizosphere microbial communities did not significantly change by eO 3 or cultivars, the results showed that the abundance of specific functional genes involved in C fixation and degradation, nitrogen (N) fixation, and sulfite reduction did significantly (Po0.05) alter in response to eO 3 and/or wheat cultivars. Also, Yannong 19 appeared to harbor microbial functional communities in the rhizosphere more sensitive in response to eO 3 than Yangmai 16. Additionally, canonical correspondence analysis suggested that the functional structure of microbial community involved in C cycling was largely shaped by soil and plant properties including pH, DOC, microbial biomass C, C/N ratio and grain weight. This study provides new insight into our understanding of the influence of eO 3 and wheat cultivars on soil microbial communities. The ISME Journal (2013) 7, 660–671; doi:10.1038/ismej.2012.120; published online 15 November 2012 Subject Category: microbial ecosystem impacts Keywords: elevated ozone; functional gene; rhizosphere microbial community; wheat cultivar Introduction Ozone (O 3 ) is an atmospheric gas that has been rising due to human activity and industrial devel- opment. For agriculture systems, O 3 is considered as the most phytotoxic air pollutant potentially sup- pressing plant growth, productivity and yield (Schoene et al., 2004; Ainsworth, 2008; Booker et al., 2009), and more importantly, it may substan- tially impact below-ground functional processes, such as root growth and carbon (C) allocation (Morgan et al., 2003; Ra ¨mo ¨ et al., 2006; Feng and Kobayashi, 2009; Wittig et al., 2009; Betzelberger et al., 2010). It is expected that such effects will be much more rapid and have significant impacts on plant productivity, soil C and nitrogen (N) dynamics, and ecosystem functioning if anthropo- genic activities leading to ozone formation continue unabated in the future (IPCC, 2007). Wheat is the second largest food crop with an annual production of 4650 million metric tons and harvested area of over 200 million hectares world- wide (Zhu et al., 2011). In the Yangtze River Delta region of China, O 3 pollution resulted in about 10% yield loss of wheat in 1999 as predicted from results of local open-top chamber studies and monitoring data (Feng et al., 2003). Currently, the mean O 3 concentrations (July–October) range from 38 to 46ppb in the Yangtze River Delta of China (Wang et al., 2006), and it is predicted that the average O 3 concentration will increase from 42 to 63 ppb by the Correspondence: Z He, Department of Botany and Microbiology, Institute for Environmental Genomics, University of Oklahoma, 101 David L. Boren Boulevard, Norman, OK 73019, USA. E-mail: [email protected] Received 3 July 2012; revised 21 August 2012; accepted 21 August 2012; published online 15 November 2012 The ISME Journal (2013) 7, 660–671 & 2013 International Society for Microbial Ecology All rights reserved 1751-7362/13 www.nature.com/ismej

Welcome message from author
This document is posted to help you gain knowledge. Please leave a comment to let me know what you think about it! Share it to your friends and learn new things together.
Transcript
ORIGINAL ARTICLE
Shifts of functional gene representation in wheatrhizosphere microbial communities under elevatedozone
Xinyu Li1,2, Ye Deng2, Qi Li1, Caiyan Lu1, Jingjing Wang1, Huiwen Zhang1, Jianguo Zhu3,Jizhong Zhou2,4,5 and Zhili He2
1State Key Laboratory of Forest and Soil Ecology, Institute of Applied Ecology, Chinese Academy of Sciences,Shenyang, China; 2Department of Botany and Microbiology, Institute for Environmental Genomics, TheUniversity of Oklahoma, Norman, OK, USA; 3State Key Laboratory of Soil and Sustainable Agriculture,Institute of Soil Science, The Chinese Academy of Sciences, Nanjing, China; 4State Key Joint Laboratory ofEnvironment Simulation and Pollution Control, School of Environment, Tsinghua University, Beijing, Chinaand 5Earth Science Division, Lawrence Berkeley National Laboratory, Berkeley, CA, USA
Although the influence of ozone (O3) on plants has been well studied in agroecosystems, little isknown about the effect of elevated O3 (eO3) on soil microbial functional communities. Here, we useda comprehensive functional gene array (GeoChip 3.0) to investigate the functional composition, andstructure of rhizosphere microbial communities of Yannong 19 (O3-sensitive) and Yangmai 16 (O3-relatively sensitive) wheat (Triticum aestivum L.) cultivars under eO3. Compared with ambient O3
(aO3), eO3 led to an increase in soil pH and total carbon (C) percentages in grain and straw of wheatplants, and reduced grain weight and soil dissolved organic carbon (DOC). Based on GeoChiphybridization signal intensities, although the overall functional structure of rhizosphere microbialcommunities did not significantly change by eO3 or cultivars, the results showed that the abundanceof specific functional genes involved in C fixation and degradation, nitrogen (N) fixation, and sulfitereduction did significantly (Po0.05) alter in response to eO3 and/or wheat cultivars. Also, Yannong19 appeared to harbor microbial functional communities in the rhizosphere more sensitive inresponse to eO3 than Yangmai 16. Additionally, canonical correspondence analysis suggested thatthe functional structure of microbial community involved in C cycling was largely shaped by soil andplant properties including pH, DOC, microbial biomass C, C/N ratio and grain weight. This studyprovides new insight into our understanding of the influence of eO3 and wheat cultivars on soilmicrobial communities.The ISME Journal (2013) 7, 660–671; doi:10.1038/ismej.2012.120; published online 15 November 2012Subject Category: microbial ecosystem impactsKeywords: elevated ozone; functional gene; rhizosphere microbial community; wheat cultivar
Introduction
Ozone (O3) is an atmospheric gas that has beenrising due to human activity and industrial devel-opment. For agriculture systems, O3 is considered asthe most phytotoxic air pollutant potentially sup-pressing plant growth, productivity and yield(Schoene et al., 2004; Ainsworth, 2008; Bookeret al., 2009), and more importantly, it may substan-tially impact below-ground functional processes,such as root growth and carbon (C) allocation(Morgan et al., 2003; Ramo et al., 2006; Feng and
Kobayashi, 2009; Wittig et al., 2009; Betzelbergeret al., 2010). It is expected that such effects will bemuch more rapid and have significant impacts onplant productivity, soil C and nitrogen (N)dynamics, and ecosystem functioning if anthropo-genic activities leading to ozone formation continueunabated in the future (IPCC, 2007).
Wheat is the second largest food crop with anannual production of 4650 million metric tons andharvested area of over 200 million hectares world-wide (Zhu et al., 2011). In the Yangtze River Deltaregion of China, O3 pollution resulted in about 10%yield loss of wheat in 1999 as predicted from resultsof local open-top chamber studies and monitoringdata (Feng et al., 2003). Currently, the mean O3
concentrations (July–October) range from 38 to46 ppb in the Yangtze River Delta of China (Wanget al., 2006), and it is predicted that the average O3
concentration will increase from 42 to 63 ppb by the
Correspondence: Z He, Department of Botany and Microbiology,Institute for Environmental Genomics, University of Oklahoma,101 David L. Boren Boulevard, Norman, OK 73019, USA.E-mail: [email protected] 3 July 2012; revised 21 August 2012; accepted 21 August2012; published online 15 November 2012
The ISME Journal (2013) 7, 660–671& 2013 International Society for Microbial Ecology All rights reserved 1751-7362/13
www.nature.com/ismej
end of this century, which could drive a further 10%decrease in yield for soybean, wheat and rice, and20% for bean according to meta-analysis conductedby Feng and Kobayashi (2009). One of the strategiesfor reducing such negative O3 effects on wheat yieldis to screen cultivars that are better adapted to eO3
conditions (Barnes et al., 1990; Pleijel et al., 2006).Recently, some O3-relatively sensitive wheat culti-vars have been reported in China, which may avoidyield reduction in a high O3 environment (Cao et al.,2009; Zhu et al., 2011).
As soil systems depend on nutrient inputs fromplants and nutrient cycling of soil microorganisms, achange in nutrient flux due to eO3 could also alterstructural and functional aspects of soil microbialbiodiversity (Andersen, 2003). In recent years, moststudies on the effect of eO3 on rhizosphere microbialcommunities were largely based on open-top cham-bers, and the results mainly focused on the changesof microbial biomass and structure by phospholipidfatty acid analysis, denaturing gradient gel electro-phoresis methods (Kasurinen et al., 2005; Chunget al., 2006; Kanerva et al., 2008), and/or single-strand conformation polymorphism method(Dohrmann and Tebbe, 2005). Those studies indi-cated that eO3 had little or significant effects on soilmicrobial communities with different plants/eco-systems. However, there are only few reports abouteffects of eO3 on soil microbial functional processes(Larson et al., 2002; Phillips et al., 2002; Zak et al.,2007; Chen et al., 2009). It is important to compre-hensively examine the effect of eO3 on the func-tional composition, structure and metabolicpotential of rhizosphere microbial communities.
Functional gene microarray-based technology (forexample, GeoChip) has become a routine moleculartool to analyze the functional composition, structureand dynamics of microbial communities from avariety of ecosystems (He et al., 2012a, c). Forexample, GeoChip 3.0 was used to examine howelevated CO2 affected soil microbial communities,and the results showed that the functional composi-tion, structure and metabolic potential of soilmicrobial communities were shifted, which wassignificantly correlated with soil C and N contentsand plant productivity (He et al., 2010b). Also, itwas applied to examine the effects of globalwarming (temperature) on soil microbial commu-nities (Zhou et al., 2012), and to profile arsenic-contaminated soil microbial communities (Xionget al., 2010) and rhizosphere microbial communitiesof Candidatus Liberibacter asiaticus infected citrustrees (Trivedi et al., 2012). All results demonstratethat GeoChip is a robust and high-throughput tool tospecifically, sensitively and quantitatively profilemicrobial communities and link their structure withenvironmental factors and ecosystem functioning.
In this study, we hypothesized that changes inplant and soil properties resulting from eO3 wouldalter the functional diversity, composition, structureand metabolic potential of rhizosphere microbial
communities, and such effects would vary withwheat cultivars. To test those hypotheses, ourobjectives were (i) to examine the effect of eO3 onrhizosphere microbial functional genes of Yannong19 (O3-sensitive) and Yangmai 16 (O3-relativelysensitive) wheat cultivars; (ii) to distinguishwhether there were differential responses betweenthose two wheat cultivars; and (iii) to understandthe correlation between the functional structure ofrhizosphere microbial communities and the soil andplant properties under eO3. The study was con-ducted on a free-air ozone enrichment (O3-FACE)experimental site located in a suburb of JiangduCity, China. GeoChip 3.0 was used to determine thegene abundance from GeoChip hybridization signalintensities. Although the overall functional struc-ture of rhizosphere microbial communities did notsignificantly change under eO3 or between cultivars,the results showed that eO3 did alter the structure offunctional genes involved in C cycling and changethe abundance of some key functional genes involvedin C, N and sulfur (S) cycling, which appeared to becultivar dependent. This study provides new insightsinto our understanding of the eO3 and wheat cultivarseffect on rhizosphere microbial communities.
Materials and methods
Experimental site and sample collectionsThe experimental site is located in the suburb ofJiangdu City in Jiangsu province of China (321350 N,1191420 E), and the soil type is Shajiang AquicCambosols (Chinese Soil Taxonomy) (Li et al., 2009)with a sandy-loamy texture, with 15 g kg�1 total C,1.59 g kg� 1 total N, pH 6.8, and 25.1% clay(o0.001 mm) and bulk density 1.2 g cm� 3 at0–15 cm depth (Zhu et al., 2011). An experimentalplatform of O3-FACE was established in 2007 over arice-wheat rotation system, with rice transplanted inmid-June and harvested in middle-to-late Octoberand winter wheat sown in early November andharvested in late May or early June of the next year.This study was conducted during the wheat growingseason of 2010 (for example, November 2009 to June2010) after three growth seasons with O3 fumigationat three periods: 14 April to 22 May in 2007, 5 Marchto 26 May in 2008 and 1 March to 24 May in 2009,and their average concentrations of O3 were 42 ppbfor aO3 and 53.4 ppb for eO3 (Zhu et al., 2011).
The O3-FACE system has three O3-FACE rings andthree similar ambient rings. Three O3-FACE repli-cate rings, each 14.5 m in diameter, were setrandomly to continuously provide an eO3 concen-tration of 60 ppb from 0900 h to 1800 h during3 March and 31 May 2010, while three ambient(40 ppb) replicate rings, each with the same size,were set randomly within the same area. All of therings were far enough apart to prevent O3 fromspilling over from one ring to another to avoid theinfluence of O3 from the O3-FACE rings on the
Shifts of functional gene representation under eO3
X Li et al
661
The ISME Journal
ambient plots. In each O3-FACE or ambient ring, twowinter wheat cultivars (Yannong 19 and Yangmai16) were sown in November in each subplot of aring. Previous studies showed different responses ofYannong 19 and Yangmai 16 to eO3, and Yannong 19(Y19) was referred to as O3-sensitive wheat cultivar,and Yangmai 16 (Y16) as O3-relatively sensitivecultivar (Cao et al., 2009; Zhu et al., 2011). A total of12 rhizosphere and 12 corresponding bulk sampleswere taken from 2 cultivars of 6 rings at the ripeningstage on 10 June 2010. For GeoChip analysis,rhizosphere soil was taken by collecting soil thatadhered to plant roots after the plant had beenremoved from soil and shaken, and each sample wasa composite from the roots of five randomly selectedplants and then stored at � 20 1C until DNAextraction. For soil property analysis, soil cores(2.5-cm diameter at the depth of 0–15 cm) weretaken from the corresponding site of plants fromwhich the rhizosphere soil had been collected, andeach soil sample was pooled from five soil cores andstored at � 20 or 4 1C until further analyses.
Analysis of plant and soil propertiesThe total carbon (TC) and nitrogen (TN) of plant orsoil were determined by a TruSpec CN ElementalAnalyzer (Leco Corporation, St. Joseph, MI, USA).Dissolved organic carbon (DOC) was determined bya Multi N/C 3100 analyzer (Analytik Jena AG, Jena,Germany). Soil pH was determined with a glasselectrode in 1:2.5 (soil:water) solution (w/v). Fifteenwinter wheat plants from each subplot were harvested,and partitioned into grain and litter. Litter and grainsamples were dried at 65 1C until a constant weightwas obtained, and then weighed for 1000 kernelweight (grain weight) and individual plant weight(plant weight).
Nucleic acid extraction, purification, amplification andlabelingCommunity DNA of 12 rhizosphere soil sampleswas extracted by the freeze-grinding method (Zhouet al., 1996). Extracted DNA was stored at � 80 1Cuntil it was used. The quality of purified DNA wasassessed by an ND-1000 spectrophotometer (Nano-Drop Technologies Inc., Wilmington, DE, USA) andthe concentration of DNA was measured using aQuant-It PicoGreen kit (Invitrogen, Carlsbad, CA,USA) using a FLUOstar Optima (BMG Labtech, Jena,Germany). An aliquot of 100 ng DNA from each samplewas amplified in triplicate using the TempliPhi kit(Amersham Biosciences, Piscataway, NJ, USA) in amodified buffer containing single strand bindingprotein (200 ng ml� 1) and spermidine (0.04 mM) toincrease the sensitivity of amplification at 30 1C for3 h (Wu et al., 2006). Amplified DNA (B3.0 mg) wasmixed with 20 ml 2.5� random primers (Invitrogen),heated to 99 1C for 5 min, and immediately placedon ice, then fluorescently labeled in a reaction
solution containing 50 mM dATP, dCTP, dGTP, 20 mMdTTP (USB Corporation, Cleveland, OH, USA), 1 mM
Cy5 dUTP (Amersham Pharmacia Biotech, Piscat-away, NJ, USA),and 40 U of Klenow fragment(Invitrogen), incubating at 37 1C for 3 h. The labeledproducts were purified with a QIAquick PCR puri-fication kit (Qiagen, Valencia, CA, USA), and thendried down in a SpeedVac (Thermo Fisher ScientificInc., Milford, MA, USA) for 45 min at 45 1C.
Microarray hybridizations, scanning and array dataprocessingThe fluorescently labeled DNA was suspended in thehybridization mix (50% formamide, 3� SSC, 0.3%SDS, 0.7 mg ml� 1 herring sperm DNA), and 0.86 mMDTT incubated at 95 1C for 5 min, and then main-tained at 60 1C until hybridization. Samples werehybridized with GeoChip 3.0 (He et al., 2010a) ona MAUI Hybridization System (BioMicro Systems,Salt Lake City, UT, USA) at 42 1C for 12 h. Microarrayswere scanned on a Pro ScanArray Microarray Scanner(Perkin-Elmer, Boston, MA, USA), and signal inten-sities of each spot were measured with ImaGene 6.0(Biodiscovery, El Segundo, CA, USA). Empty andpoor spots were removed before the signal inten-sities were normalized by the mean signal acrossthe slide, and spots with signal-to-noise ratio(SNR¼ (signal mean� background mean)/backgroundstandard deviation)42.0 were used as the cutoff forpositive spots for further analyses (He and Zhou,2008). A gene was considered as positive if it wasdetected in at least 2 of 12 samples.
Statistical analysesAll data were analyzed through a general linear modelfor split-plot design to determine the effects of O3
concentration (ambient vs. elevated), different wheatcultivars (Y19 vs. Y16) and their interactions. Diver-sity indices were calculated as previously described(He et al., 2010b). Permutational multivariate analysisof variance (adonis) was based on Euclidean distancematrices to partition differences among different treat-ments using permutations (999 times), and the signifi-cance test was based on pseudo-F ratio (Oksanen et al.,2010). Mantel and partial Mantel analyses were usedto link the functional structure of microbial commu-nities with plant and soil variables (He et al., 2010b).All statistical analyses were performed by the Veganpackage in R (Dixon, 2003). Detrended correspon-dence analysis (DCA) and canonical correspondenceanalysis (CCA) were performed using CANOCO forWindows version 4.5 (Biometris—Plant ResearchInternational, Wageningen, The Netherlands).
Results
Effects of eO3 on soil and plant propertiesTo understand whether eO3 affects soil and wheatproperties, 5 soil variables and 10 plant variables
Shifts of functional gene representation under eO3
X Li et al
662
The ISME Journal
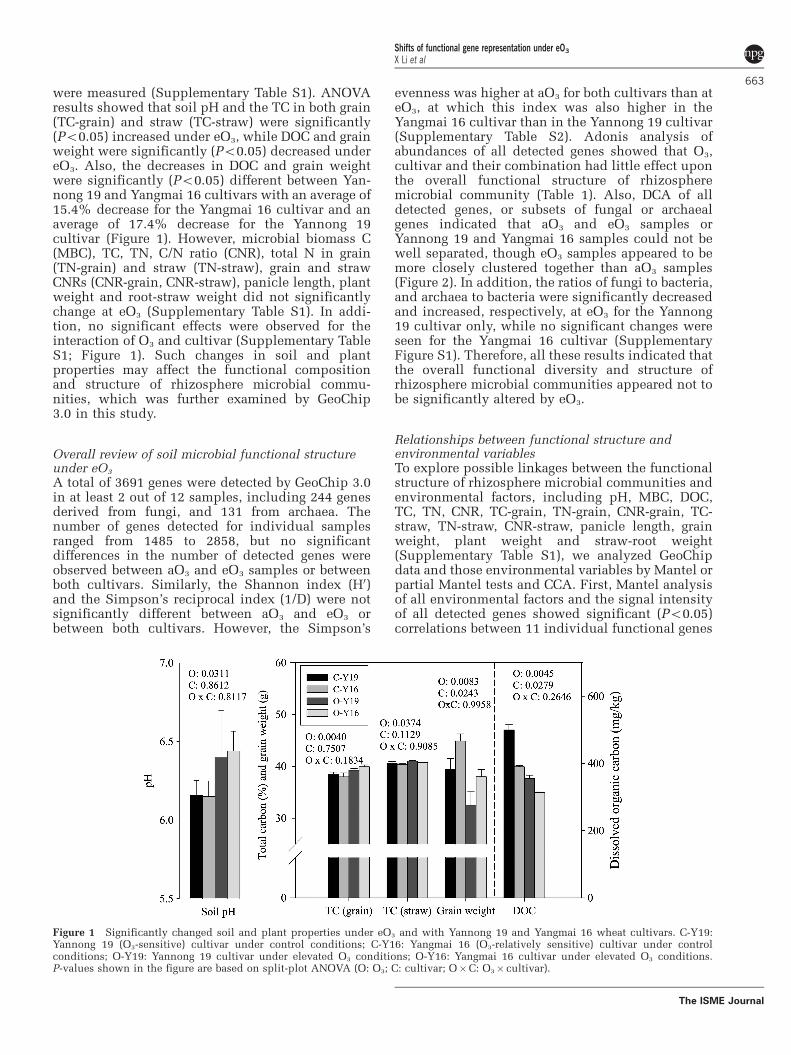
were measured (Supplementary Table S1). ANOVAresults showed that soil pH and the TC in both grain(TC-grain) and straw (TC-straw) were significantly(Po0.05) increased under eO3, while DOC and grainweight were significantly (Po0.05) decreased undereO3. Also, the decreases in DOC and grain weightwere significantly (Po0.05) different between Yan-nong 19 and Yangmai 16 cultivars with an average of15.4% decrease for the Yangmai 16 cultivar and anaverage of 17.4% decrease for the Yannong 19cultivar (Figure 1). However, microbial biomass C(MBC), TC, TN, C/N ratio (CNR), total N in grain(TN-grain) and straw (TN-straw), grain and strawCNRs (CNR-grain, CNR-straw), panicle length, plantweight and root-straw weight did not significantlychange at eO3 (Supplementary Table S1). In addi-tion, no significant effects were observed for theinteraction of O3 and cultivar (Supplementary TableS1; Figure 1). Such changes in soil and plantproperties may affect the functional compositionand structure of rhizosphere microbial commu-nities, which was further examined by GeoChip3.0 in this study.
Overall review of soil microbial functional structureunder eO3
A total of 3691 genes were detected by GeoChip 3.0in at least 2 out of 12 samples, including 244 genesderived from fungi, and 131 from archaea. Thenumber of genes detected for individual samplesranged from 1485 to 2858, but no significantdifferences in the number of detected genes wereobserved between aO3 and eO3 samples or betweenboth cultivars. Similarly, the Shannon index (H0)and the Simpson’s reciprocal index (1/D) were notsignificantly different between aO3 and eO3 orbetween both cultivars. However, the Simpson’s
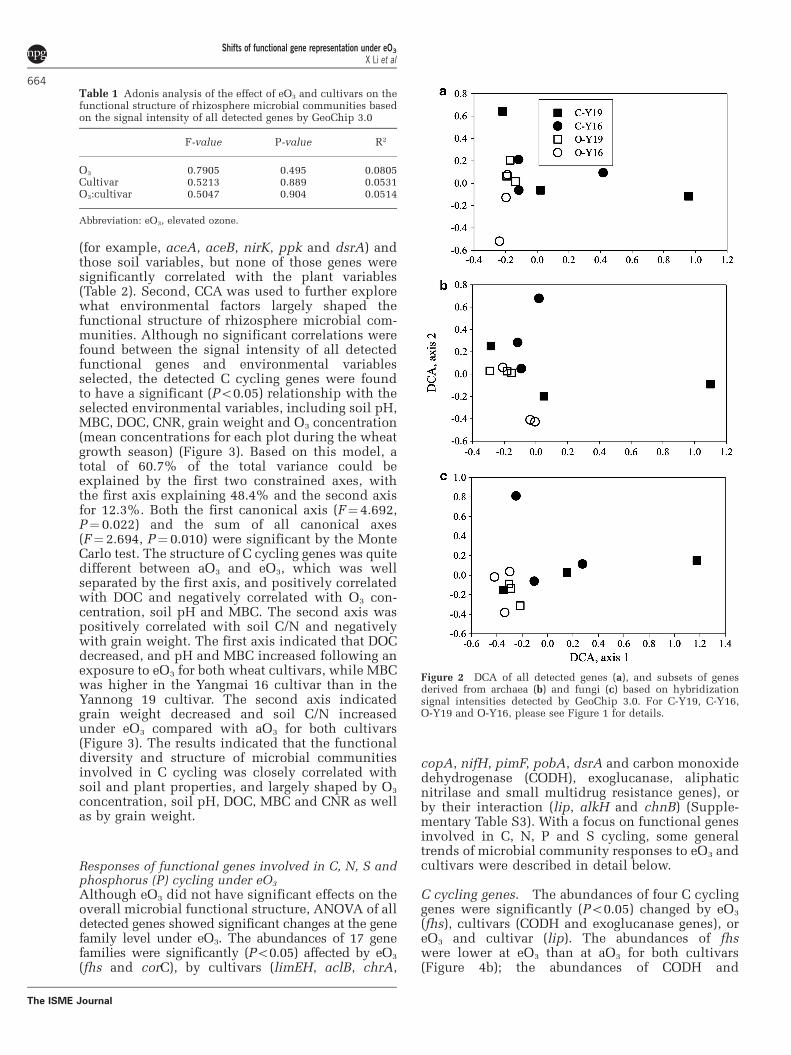
evenness was higher at aO3 for both cultivars than ateO3, at which this index was also higher in theYangmai 16 cultivar than in the Yannong 19 cultivar(Supplementary Table S2). Adonis analysis ofabundances of all detected genes showed that O3,cultivar and their combination had little effect uponthe overall functional structure of rhizospheremicrobial community (Table 1). Also, DCA of alldetected genes, or subsets of fungal or archaealgenes indicated that aO3 and eO3 samples orYannong 19 and Yangmai 16 samples could not bewell separated, though eO3 samples appeared to bemore closely clustered together than aO3 samples(Figure 2). In addition, the ratios of fungi to bacteria,and archaea to bacteria were significantly decreasedand increased, respectively, at eO3 for the Yannong19 cultivar only, while no significant changes wereseen for the Yangmai 16 cultivar (SupplementaryFigure S1). Therefore, all these results indicated thatthe overall functional diversity and structure ofrhizosphere microbial communities appeared not tobe significantly altered by eO3.
Relationships between functional structure andenvironmental variablesTo explore possible linkages between the functionalstructure of rhizosphere microbial communities andenvironmental factors, including pH, MBC, DOC,TC, TN, CNR, TC-grain, TN-grain, CNR-grain, TC-straw, TN-straw, CNR-straw, panicle length, grainweight, plant weight and straw-root weight(Supplementary Table S1), we analyzed GeoChipdata and those environmental variables by Mantel orpartial Mantel tests and CCA. First, Mantel analysisof all environmental factors and the signal intensityof all detected genes showed significant (Po0.05)correlations between 11 individual functional genes
Figure 1 Significantly changed soil and plant properties under eO3 and with Yannong 19 and Yangmai 16 wheat cultivars. C-Y19:Yannong 19 (O3-sensitive) cultivar under control conditions; C-Y16: Yangmai 16 (O3-relatively sensitive) cultivar under controlconditions; O-Y19: Yannong 19 cultivar under elevated O3 conditions; O-Y16: Yangmai 16 cultivar under elevated O3 conditions.P-values shown in the figure are based on split-plot ANOVA (O: O3; C: cultivar; O�C: O3� cultivar).
Shifts of functional gene representation under eO3
X Li et al
663
The ISME Journal
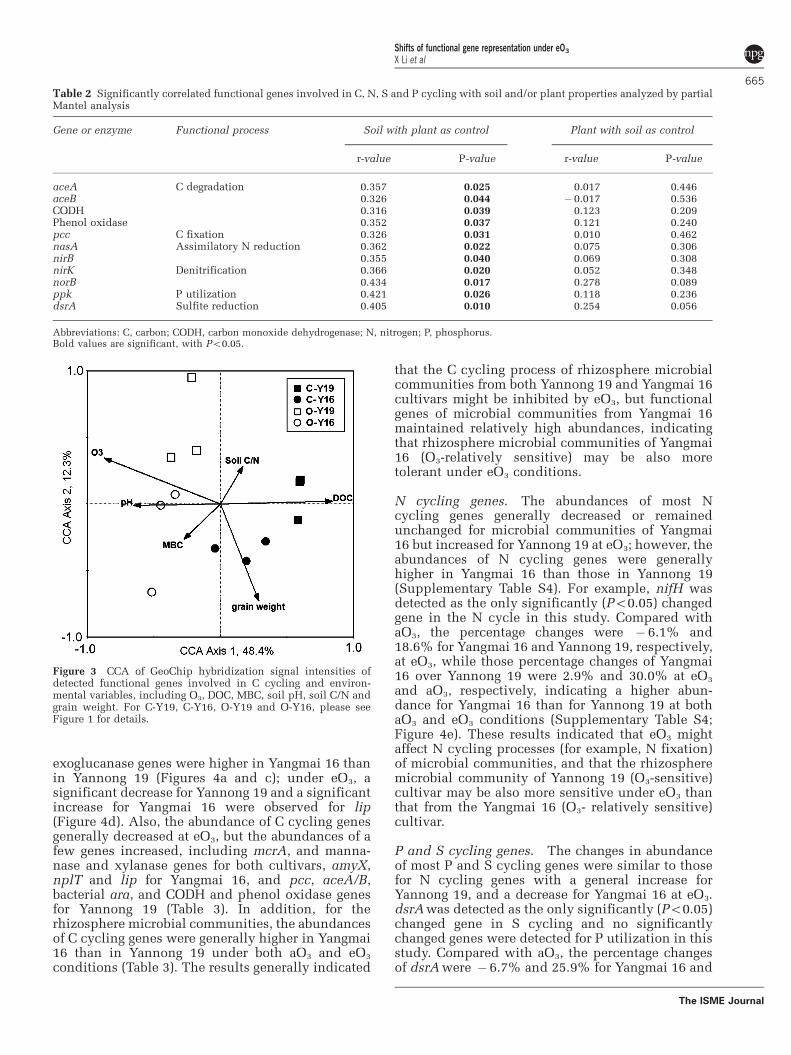
(for example, aceA, aceB, nirK, ppk and dsrA) andthose soil variables, but none of those genes weresignificantly correlated with the plant variables(Table 2). Second, CCA was used to further explorewhat environmental factors largely shaped thefunctional structure of rhizosphere microbial com-munities. Although no significant correlations werefound between the signal intensity of all detectedfunctional genes and environmental variablesselected, the detected C cycling genes were foundto have a significant (Po0.05) relationship with theselected environmental variables, including soil pH,MBC, DOC, CNR, grain weight and O3 concentration(mean concentrations for each plot during the wheatgrowth season) (Figure 3). Based on this model, atotal of 60.7% of the total variance could beexplained by the first two constrained axes, withthe first axis explaining 48.4% and the second axisfor 12.3%. Both the first canonical axis (F¼ 4.692,P¼ 0.022) and the sum of all canonical axes(F¼ 2.694, P¼ 0.010) were significant by the MonteCarlo test. The structure of C cycling genes was quitedifferent between aO3 and eO3, which was wellseparated by the first axis, and positively correlatedwith DOC and negatively correlated with O3 con-centration, soil pH and MBC. The second axis waspositively correlated with soil C/N and negativelywith grain weight. The first axis indicated that DOCdecreased, and pH and MBC increased following anexposure to eO3 for both wheat cultivars, while MBCwas higher in the Yangmai 16 cultivar than in theYannong 19 cultivar. The second axis indicatedgrain weight decreased and soil C/N increasedunder eO3 compared with aO3 for both cultivars(Figure 3). The results indicated that the functionaldiversity and structure of microbial communitiesinvolved in C cycling was closely correlated withsoil and plant properties, and largely shaped by O3
concentration, soil pH, DOC, MBC and CNR as wellas by grain weight.
Responses of functional genes involved in C, N, S andphosphorus (P) cycling under eO3
Although eO3 did not have significant effects on theoverall microbial functional structure, ANOVA of alldetected genes showed significant changes at the genefamily level under eO3. The abundances of 17 genefamilies were significantly (Po0.05) affected by eO3
(fhs and corC), by cultivars (limEH, aclB, chrA,
copA, nifH, pimF, pobA, dsrA and carbon monoxidedehydrogenase (CODH), exoglucanase, aliphaticnitrilase and small multidrug resistance genes), orby their interaction (lip, alkH and chnB) (Supple-mentary Table S3). With a focus on functional genesinvolved in C, N, P and S cycling, some generaltrends of microbial community responses to eO3 andcultivars were described in detail below.
C cycling genes. The abundances of four C cyclinggenes were significantly (Po0.05) changed by eO3
(fhs), cultivars (CODH and exoglucanase genes), oreO3 and cultivar (lip). The abundances of fhswere lower at eO3 than at aO3 for both cultivars(Figure 4b); the abundances of CODH and
Table 1 Adonis analysis of the effect of eO3 and cultivars on thefunctional structure of rhizosphere microbial communities basedon the signal intensity of all detected genes by GeoChip 3.0
F-value P-value R2
O3 0.7905 0.495 0.0805Cultivar 0.5213 0.889 0.0531O3:cultivar 0.5047 0.904 0.0514
Abbreviation: eO3, elevated ozone.
Figure 2 DCA of all detected genes (a), and subsets of genesderived from archaea (b) and fungi (c) based on hybridizationsignal intensities detected by GeoChip 3.0. For C-Y19, C-Y16,O-Y19 and O-Y16, please see Figure 1 for details.
Shifts of functional gene representation under eO3
X Li et al
664
The ISME Journal
exoglucanase genes were higher in Yangmai 16 thanin Yannong 19 (Figures 4a and c); under eO3, asignificant decrease for Yannong 19 and a significantincrease for Yangmai 16 were observed for lip(Figure 4d). Also, the abundance of C cycling genesgenerally decreased at eO3, but the abundances of afew genes increased, including mcrA, and manna-nase and xylanase genes for both cultivars, amyX,nplT and lip for Yangmai 16, and pcc, aceA/B,bacterial ara, and CODH and phenol oxidase genesfor Yannong 19 (Table 3). In addition, for therhizosphere microbial communities, the abundancesof C cycling genes were generally higher in Yangmai16 than in Yannong 19 under both aO3 and eO3
conditions (Table 3). The results generally indicated
that the C cycling process of rhizosphere microbialcommunities from both Yannong 19 and Yangmai 16cultivars might be inhibited by eO3, but functionalgenes of microbial communities from Yangmai 16maintained relatively high abundances, indicatingthat rhizosphere microbial communities of Yangmai16 (O3-relatively sensitive) may be also moretolerant under eO3 conditions.
N cycling genes. The abundances of most Ncycling genes generally decreased or remainedunchanged for microbial communities of Yangmai16 but increased for Yannong 19 at eO3; however, theabundances of N cycling genes were generallyhigher in Yangmai 16 than those in Yannong 19(Supplementary Table S4). For example, nifH wasdetected as the only significantly (Po0.05) changedgene in the N cycle in this study. Compared withaO3, the percentage changes were � 6.1% and18.6% for Yangmai 16 and Yannong 19, respectively,at eO3, while those percentage changes of Yangmai16 over Yannong 19 were 2.9% and 30.0% at eO3
and aO3, respectively, indicating a higher abun-dance for Yangmai 16 than for Yannong 19 at bothaO3 and eO3 conditions (Supplementary Table S4;Figure 4e). These results indicated that eO3 mightaffect N cycling processes (for example, N fixation)of microbial communities, and that the rhizospheremicrobial community of Yannong 19 (O3-sensitive)cultivar may be also more sensitive under eO3 thanthat from the Yangmai 16 (O3- relatively sensitive)cultivar.
P and S cycling genes. The changes in abundanceof most P and S cycling genes were similar to thosefor N cycling genes with a general increase forYannong 19, and a decrease for Yangmai 16 at eO3.dsrA was detected as the only significantly (Po0.05)changed gene in S cycling and no significantlychanged genes were detected for P utilization in thisstudy. Compared with aO3, the percentage changesof dsrA were � 6.7% and 25.9% for Yangmai 16 and
Table 2 Significantly correlated functional genes involved in C, N, S and P cycling with soil and/or plant properties analyzed by partialMantel analysis
Gene or enzyme Functional process Soil with plant as control Plant with soil as control
r-value P-value r-value P-value
aceA C degradation 0.357 0.025 0.017 0.446aceB 0.326 0.044 � 0.017 0.536CODH 0.316 0.039 0.123 0.209Phenol oxidase 0.352 0.037 0.121 0.240pcc C fixation 0.326 0.031 0.010 0.462nasA Assimilatory N reduction 0.362 0.022 0.075 0.306nirB 0.355 0.040 0.069 0.308nirK Denitrification 0.366 0.020 0.052 0.348norB 0.434 0.017 0.278 0.089ppk P utilization 0.421 0.026 0.118 0.236dsrA Sulfite reduction 0.405 0.010 0.254 0.056
Abbreviations: C, carbon; CODH, carbon monoxide dehydrogenase; N, nitrogen; P, phosphorus.Bold values are significant, with Po0.05.
Figure 3 CCA of GeoChip hybridization signal intensities ofdetected functional genes involved in C cycling and environ-mental variables, including O3, DOC, MBC, soil pH, soil C/N andgrain weight. For C-Y19, C-Y16, O-Y19 and O-Y16, please seeFigure 1 for details.
Shifts of functional gene representation under eO3
X Li et al
665
The ISME Journal
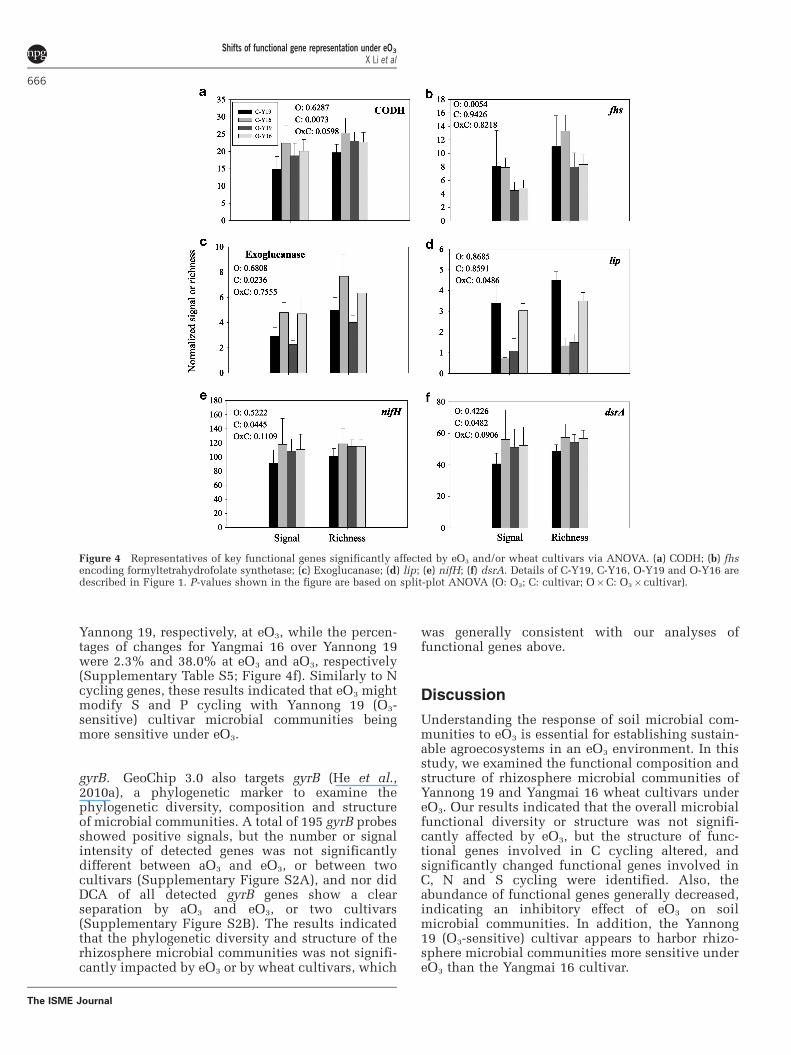
Yannong 19, respectively, at eO3, while the percen-tages of changes for Yangmai 16 over Yannong 19were 2.3% and 38.0% at eO3 and aO3, respectively(Supplementary Table S5; Figure 4f). Similarly to Ncycling genes, these results indicated that eO3 mightmodify S and P cycling with Yannong 19 (O3-sensitive) cultivar microbial communities beingmore sensitive under eO3.
gyrB. GeoChip 3.0 also targets gyrB (He et al.,2010a), a phylogenetic marker to examine thephylogenetic diversity, composition and structureof microbial communities. A total of 195 gyrB probesshowed positive signals, but the number or signalintensity of detected genes was not significantlydifferent between aO3 and eO3, or between twocultivars (Supplementary Figure S2A), and nor didDCA of all detected gyrB genes show a clearseparation by aO3 and eO3, or two cultivars(Supplementary Figure S2B). The results indicatedthat the phylogenetic diversity and structure of therhizosphere microbial communities was not signifi-cantly impacted by eO3 or by wheat cultivars, which
was generally consistent with our analyses offunctional genes above.
Discussion
Understanding the response of soil microbial com-munities to eO3 is essential for establishing sustain-able agroecosystems in an eO3 environment. In thisstudy, we examined the functional composition andstructure of rhizosphere microbial communities ofYannong 19 and Yangmai 16 wheat cultivars undereO3. Our results indicated that the overall microbialfunctional diversity or structure was not signifi-cantly affected by eO3, but the structure of func-tional genes involved in C cycling altered, andsignificantly changed functional genes involved inC, N and S cycling were identified. Also, theabundance of functional genes generally decreased,indicating an inhibitory effect of eO3 on soilmicrobial communities. In addition, the Yannong19 (O3-sensitive) cultivar appears to harbor rhizo-sphere microbial communities more sensitive undereO3 than the Yangmai 16 cultivar.
Figure 4 Representatives of key functional genes significantly affected by eO3 and/or wheat cultivars via ANOVA. (a) CODH; (b) fhsencoding formyltetrahydrofolate synthetase; (c) Exoglucanase; (d) lip; (e) nifH; (f) dsrA. Details of C-Y19, C-Y16, O-Y19 and O-Y16 aredescribed in Figure 1. P-values shown in the figure are based on split-plot ANOVA (O: O3; C: cultivar; O�C: O3� cultivar).
Shifts of functional gene representation under eO3
X Li et al
666
The ISME Journal
One of our hypotheses is that eO3 significantlyaffects the overall functional diversity and structureof rhizosphere microbial communities via thechanges in plant properties and soil microenviron-ments (Biswas et al., 2008; Feng et al., 2008; Fengand Kobayashi, 2009; Zhu et al., 2011). Previousstudies showed that eO3 decreased plant above-ground and root biomass and grain yield, alteredlitter and soil chemistry, and adjusted antioxidantcapacity (Morgan et al., 2003; Liu et al., 2005; Ramoet al., 2006; Betzelberger et al., 2010), especially inwheat (Biswas et al., 2008; Feng et al., 2008; Fengand Kobayashi, 2009; Zhu et al., 2011). However,only few studies have been focused on the effect ofeO3 on microbial community functions. For exam-ple, a significant discrimination of sole-carbonsource utilization patterns was observed for thewheat rhizosphere soil but not for the bulk soil, andthe functional diversity of the rhizosphere microbialcommunities was reduced under eO3 (Chen et al.,2009). Also, a few studies at the Aspen FACE site(Larson et al., 2002; Phillips et al., 2002; Chunget al., 2006; Holmes et al., 2006; Zak et al., 2007) andwith open-top chambers (Kasurinen et al., 2005) ormesocosms (Kanerva et al., 2008) indicated that eO3
altered the functional diversity, structure and/ormetabolic potential of soil microbial communities.In this study, our results did not fully support theabove hypothesis that eO3 would alter the overallfunctional diversity and structure of rhizospheremicrobial communities. There are a few possibili-ties. First, the difference of concentrations betweenaO3 (40 ppb) and eO3 (60 ppb) was not large enoughto cause significant changes in the overall soilmicrobial community diversity and structure. How-ever, it should also be noted that although thisincrease in O3 is relatively small, those differencesidentified in this study are highly relevant to thenear future as well as for current years when O3
concentration is relatively high. Second, the eO3
exposure time may be still too short for soilmicrobial communities to respond to eO3. Third,since DOC is largely composed of low molecularweight compounds (for example, organic acids,amino acids and sugars) with low pH, a decreasein DOC could lead to an increase in pH, but theoverall effect of both factors may result no signifi-cant changes observed. Fourth, plant biomass or rootbiomass was not significantly changed between aO3
and eO3, or Yannong 19 and Yangmai 16 cultivars,
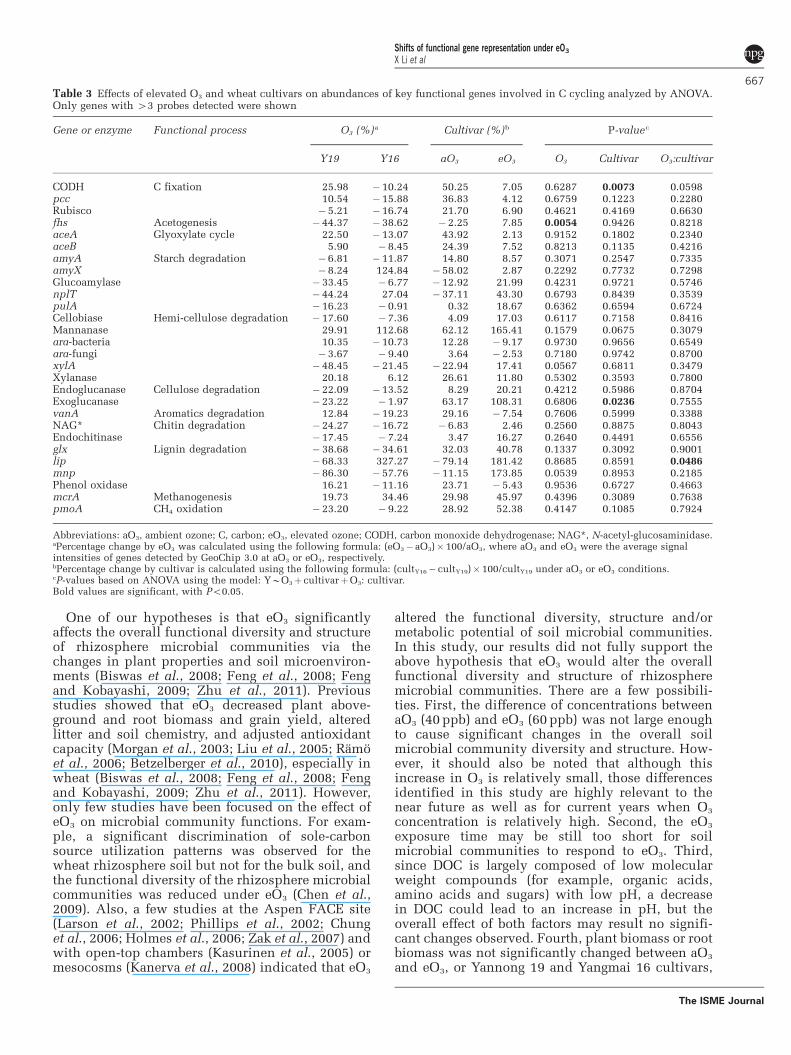
Table 3 Effects of elevated O3 and wheat cultivars on abundances of key functional genes involved in C cycling analyzed by ANOVA.Only genes with 43 probes detected were shown
Gene or enzyme Functional process O3 (%)a Cultivar (%)b P-valuec
Y19 Y16 aO3 eO3 O3 Cultivar O3:cultivar
CODH C fixation 25.98 �10.24 50.25 7.05 0.6287 0.0073 0.0598pcc 10.54 �15.88 36.83 4.12 0.6759 0.1223 0.2280Rubisco �5.21 �16.74 21.70 6.90 0.4621 0.4169 0.6630fhs Acetogenesis � 44.37 �38.62 �2.25 7.85 0.0054 0.9426 0.8218aceA Glyoxylate cycle 22.50 �13.07 43.92 2.13 0.9152 0.1802 0.2340aceB 5.90 � 8.45 24.39 7.52 0.8213 0.1135 0.4216amyA Starch degradation �6.81 �11.87 14.80 8.57 0.3071 0.2547 0.7335amyX �8.24 124.84 �58.02 2.87 0.2292 0.7732 0.7298Glucoamylase � 33.45 � 6.77 �12.92 21.99 0.4231 0.9721 0.5746nplT � 44.24 27.04 �37.11 43.30 0.6793 0.8439 0.3539pulA � 16.23 � 0.91 0.32 18.67 0.6362 0.6594 0.6724Cellobiase Hemi-cellulose degradation � 17.60 � 7.36 4.09 17.03 0.6117 0.7158 0.8416Mannanase 29.91 112.68 62.12 165.41 0.1579 0.0675 0.3079ara-bacteria 10.35 �10.73 12.28 � 9.17 0.9730 0.9656 0.6549ara-fungi �3.67 � 9.40 3.64 � 2.53 0.7180 0.9742 0.8700xylA � 48.45 �21.45 �22.94 17.41 0.0567 0.6811 0.3479Xylanase 20.18 6.12 26.61 11.80 0.5302 0.3593 0.7800Endoglucanase Cellulose degradation � 22.09 �13.52 8.29 20.21 0.4212 0.5986 0.8704Exoglucanase � 23.22 � 1.97 63.17 108.31 0.6806 0.0236 0.7555vanA Aromatics degradation 12.84 �19.23 29.16 � 7.54 0.7606 0.5999 0.3388NAG* Chitin degradation � 24.27 �16.72 �6.83 2.46 0.2560 0.8875 0.8043Endochitinase � 17.45 � 7.24 3.47 16.27 0.2640 0.4491 0.6556glx Lignin degradation � 38.68 �34.61 32.03 40.78 0.1337 0.3092 0.9001lip � 68.33 327.27 �79.14 181.42 0.8685 0.8591 0.0486mnp � 86.30 �57.76 �11.15 173.85 0.0539 0.8953 0.2185Phenol oxidase 16.21 �11.16 23.71 � 5.43 0.9536 0.6727 0.4663mcrA Methanogenesis 19.73 34.46 29.98 45.97 0.4396 0.3089 0.7638pmoA CH4 oxidation � 23.20 � 9.22 28.92 52.38 0.4147 0.1085 0.7924
Abbreviations: aO3, ambient ozone; C, carbon; eO3, elevated ozone; CODH, carbon monoxide dehydrogenase; NAG*, N-acetyl-glucosaminidase.aPercentage change by eO3 was calculated using the following formula: (eO3� aO3)� 100/aO3, where aO3 and eO3 were the average signalintensities of genes detected by GeoChip 3.0 at aO3 or eO3, respectively.bPercentage change by cultivar is calculated using the following formula: (cultY16� cultY19)�100/cultY19 under aO3 or eO3 conditions.cP-values based on ANOVA using the model: YBO3þ cultivarþO3: cultivar.Bold values are significant, with Po0.05.
Shifts of functional gene representation under eO3
X Li et al
667
The ISME Journal
indicating that soil C inputs may remain unchanged.In addition, only three replicates were used in thisstudy so that the statistical power may not beenough to distinguish subtle changes.
Although the overall microbial diversity andstructure did not significantly change in responseto eO3, we did observe eO3-induced and cultivar-specific changes for key functional genes involvedin C, N and S cycling. For example, the abundanceof fhs signficantly decreased at eO3. Formyltetrahy-drofolate synthetase encoded by fhs catalyzes a keystep in the reductive acetogenesis pathway andproduces acetate from C1 precursors (for example,CO2). Acetogenesis is of great important to the globalC cycle, producing B10% of acetate annually inanaerobic habitats (Leaphart and Lovell, 2001).Actate is considered as an important substrate formany micoorganisms in soil, and a decrease of fhsabundance indicates a decrease of acetate produc-tion at eO3, which may result in an increase in pH.Interestingly, the abundance of lip signifcantlydecreased in Yannong 19, and signifcantly increasedin Yangmai 16 at eO3. Lignin peroxidase encoded bylip uses two substrates, 1,2-bis(3,4-dimethoxyphe-nyl)propane-1,3-diol and H2O2, and produces3,4-dimethoxybenzaldehyde, 1-(3,4-dimethoxyphe-nyl)ethane-1,2-diol, and H2O, where H2O2 is mainlyresponsible for plant adjustements in response toeO3 (Heath, 2008). A significant increase of the lipabundance at eO3 may be related to a reduction ofH2O2 concentration in the rhizosphere, and faciliatedetoxication of H2O2 in the rhizosphere and/or inplants. Also, more genes showed cultivar-specificchanges at aO3 or/and eO3. For example, theabundances of genes encoding CODH, exoglucanase,NifH and DsrA were signifcantly higher in Yangmai16 than those in Yannong 19 although they were notsignificantly different between aO3 and eO3. Theseresults are generally consistent with previous stu-dies upon enzyme activities of 1,4-b-glycosidase,1,4-b-N-acetylglucosaminidase and other C degrada-tion enzymes under eO3 (Larson et al., 2002; Chunget al., 2006). Furthermore, the changes of functionalgene abundances showed two clear patterns: (i) mostC cycling genes decreased under eO3 with agenerally higher abundance for Yangmai 16 underboth eO3 and eO3 and (ii) most N, S and P cyclinggenes increased for Yannong 19 and decreased forYangmai 16 under eO3 although a general higherabundance remained for Yangmai 16. Therefore, ourresults indicated that the abundances of some keygenes signifcantly changed at eO3 and/or betweentwo cultivars, which may modify ecosystem func-tional processes, strongly supporting one of ourhypotheses that eO3 would affect the compositionand metablic potential of rhizosphere microialcommuities. In addition, this study identifies someimportant functional genes invovled in the reduc-tive acetogenesis pathway (for example, fhs), lignindegradation (for example, lip) and N fixation (forexample, nifH) in response to eO3; thus, our future
studies may focus on the diversity and quantifica-tion of those key genes by quantitative PCR and/orhigh-throughput sequencing approaches.
The microbial community diversity, structure andfunctional activity are also shaped by environmentalfactors, such as soil and plant properties. Previousstudies indicated that soil pH and C inputssignificantly affected soil microbial communitydiversity and structure (Fierer and Jackson, 2006;Aciego Pietri and Brookes, 2009). In this study, anincrease in soil pH and a decrease in DOC wereobserved. Mantel analyses of all detected genes alsoshowed that the abundances of many genes (forexample, aceA, aceB, pcc, nasA, nirK, ppk anddsrA) involved in C, N, P and S cycling weresignificantly correlated with soil variables. FurtherCCA indicated that the structure of functional genesinvolved in C cycling could be largely shaped by soilpH, DOC, MBC, CNR and grain weight. Therefore,this study indicated that the microbial communitystructure might be shaped by soil environmentalfactors and plant properties.
Root exudates have an important role in plant–microbe interactions and shape the diversity, struc-ture and function of soil, especially rhizospheremicrobial communities (Bais et al., 2006; Denniset al., 2010; Doornbos et al., 2012). A previous studyshowed a degree of specificity in the interaction ofwheat cultivars and fluorescent Pseudomonas spe-cies via analysis of phlD genes (Mazzola et al., 2004).Also, a recent study with Arabidopsis thalianasuggested that root exudation differences couldinfluence rhizosphere bacterial communities(Micallef et al., 2009). Similarly, another study withdifferent plants (wheat, maize, rape and barrelclover) demonstrated that plant species root exu-dates significantly shaped the rhizosphere bacterialcommunity structures (Haichar et al., 2008). Inaddition, artificial root exudate solutions wereadded to soil micrososms, and the results indicatedthat organic acids might have an important role inshaping soil bacterial communities (Shi et al., 2011).However, it is unclear if root exudates shape therhizosphere micorbial communities from Yannong19 and Yangmai 16 cultivars, and further investiga-tions are needed by a comprehesive profiling of rootexudates and linking them with microbial func-tional structure and activity.
The rhizosphere microbial communities of Yan-nong 19 may be more sensitive than those fromYangmai 16 in response to eO3. First, based on thenumber of significantly changed genes and theabundance changes of all detected genes, moreshifts were found by cultivars than by O3, or bytheir interaction. Second, many genes detected hadhigher abundances at eO3 than at aO3 for Yannong 19rhizosphere microbial communities, while theabundances of detected genes in Yangmai 16 rhizo-sphere microbial communities remained largelyunchanged. Third, CCA suggests that the signalintensity of detected genes involved in C cycling
Shifts of functional gene representation under eO3
X Li et al
668
The ISME Journal
had a positive correlation with MBC for Yangmai 16rhizosphere samples, but a negative correlation forYannong 19 rhizosphere samples, indicating thatYangmai 16 may be more favorable for soil micro-bial growth than Yannong 19. Therefore, our resultssuggested that the rhizosphere microbial commu-nities from Yannong 19 may be also more sensitivein response to eO3 than those from Yangmai16. However, further investigations are necessaryto understand the mechanism using differentapproaches, such as quantitative PCR or high-throughput sequencing analysis of 16S rRNA and/or key functional genes (for example, fhs, nifH andlip) identified in this study. It should be noted thattwo crops were grown at the FACE site per yearwith wheat being planted after rice, and rice wasalso exposed to eO3 in the same ring/plot as wheat.Although rice is also sensitive to ozone, it isexpected that rice has little effect on wheat rhizo-sphere microbial communities during the wheatgrowth season. Previous studies also suggest thatthe effect of O3 on soil microbial communitieslargely came from wheat in the current growthseason, especially after anthesis (Slaughter et al.,1989; Pleijel et al., 1998; Soja et al., 2000).
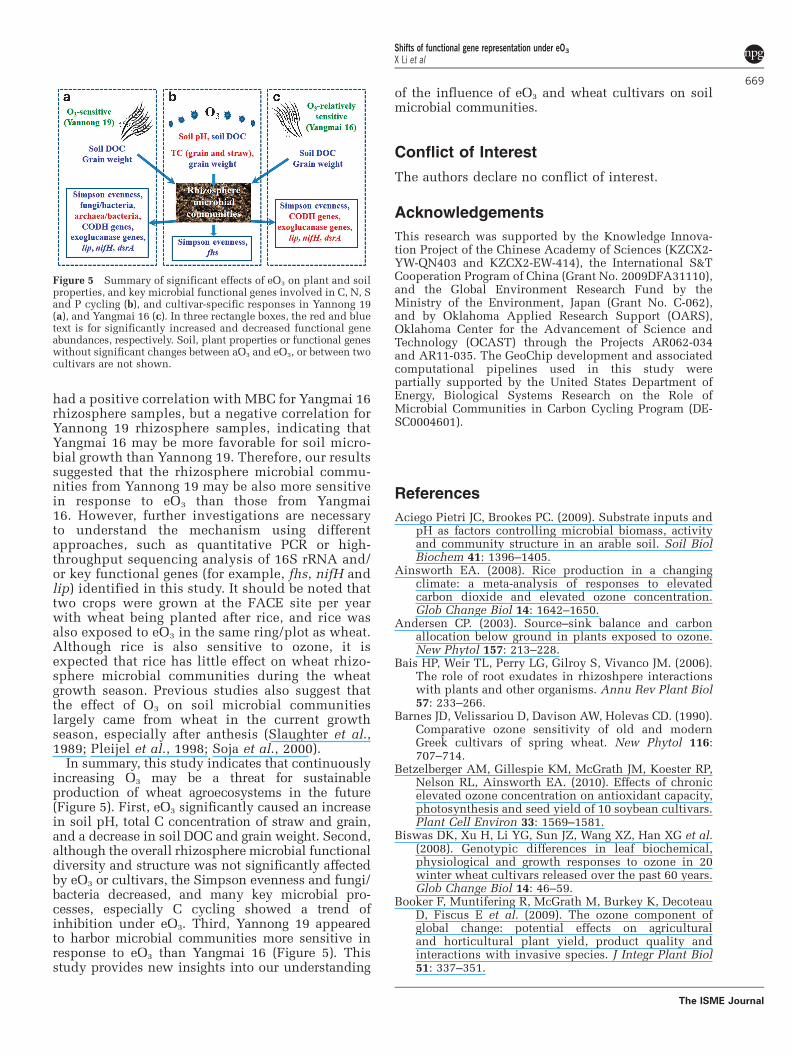
In summary, this study indicates that continuouslyincreasing O3 may be a threat for sustainableproduction of wheat agroecosystems in the future(Figure 5). First, eO3 significantly caused an increasein soil pH, total C concentration of straw and grain,and a decrease in soil DOC and grain weight. Second,although the overall rhizosphere microbial functionaldiversity and structure was not significantly affectedby eO3 or cultivars, the Simpson evenness and fungi/bacteria decreased, and many key microbial pro-cesses, especially C cycling showed a trend ofinhibition under eO3. Third, Yannong 19 appearedto harbor microbial communities more sensitive inresponse to eO3 than Yangmai 16 (Figure 5). Thisstudy provides new insights into our understanding
of the influence of eO3 and wheat cultivars on soilmicrobial communities.
Conflict of Interest
The authors declare no conflict of interest.
Acknowledgements
This research was supported by the Knowledge Innova-tion Project of the Chinese Academy of Sciences (KZCX2-YW-QN403 and KZCX2-EW-414), the International S&TCooperation Program of China (Grant No. 2009DFA31110),and the Global Environment Research Fund by theMinistry of the Environment, Japan (Grant No. C-062),and by Oklahoma Applied Research Support (OARS),Oklahoma Center for the Advancement of Science andTechnology (OCAST) through the Projects AR062-034and AR11-035. The GeoChip development and associatedcomputational pipelines used in this study werepartially supported by the United States Department ofEnergy, Biological Systems Research on the Role ofMicrobial Communities in Carbon Cycling Program (DE-SC0004601).
References
Aciego Pietri JC, Brookes PC. (2009). Substrate inputs andpH as factors controlling microbial biomass, activityand community structure in an arable soil. Soil BiolBiochem 41: 1396–1405.
Ainsworth EA. (2008). Rice production in a changingclimate: a meta-analysis of responses to elevatedcarbon dioxide and elevated ozone concentration.Glob Change Biol 14: 1642–1650.
Andersen CP. (2003). Source–sink balance and carbonallocation below ground in plants exposed to ozone.New Phytol 157: 213–228.
Bais HP, Weir TL, Perry LG, Gilroy S, Vivanco JM. (2006).The role of root exudates in rhizoshpere interactionswith plants and other organisms. Annu Rev Plant Biol57: 233–266.
Barnes JD, Velissariou D, Davison AW, Holevas CD. (1990).Comparative ozone sensitivity of old and modernGreek cultivars of spring wheat. New Phytol 116:707–714.
Betzelberger AM, Gillespie KM, McGrath JM, Koester RP,Nelson RL, Ainsworth EA. (2010). Effects of chronicelevated ozone concentration on antioxidant capacity,photosynthesis and seed yield of 10 soybean cultivars.Plant Cell Environ 33: 1569–1581.
Biswas DK, Xu H, Li YG, Sun JZ, Wang XZ, Han XG et al.(2008). Genotypic differences in leaf biochemical,physiological and growth responses to ozone in 20winter wheat cultivars released over the past 60 years.Glob Change Biol 14: 46–59.
Booker F, Muntifering R, McGrath M, Burkey K, DecoteauD, Fiscus E et al. (2009). The ozone component ofglobal change: potential effects on agriculturaland horticultural plant yield, product quality andinteractions with invasive species. J Integr Plant Biol51: 337–351.
Figure 5 Summary of significant effects of eO3 on plant and soilproperties, and key microbial functional genes involved in C, N, Sand P cycling (b), and cultivar-specific responses in Yannong 19(a), and Yangmai 16 (c). In three rectangle boxes, the red and bluetext is for significantly increased and decreased functional geneabundances, respectively. Soil, plant properties or functional geneswithout significant changes between aO3 and eO3, or between twocultivars are not shown.
Shifts of functional gene representation under eO3
X Li et al
669
The ISME Journal
Cao J-L, Wang L, Zeng Q, Liang J, Tang H-Y, Xie Z-B et al.(2009). Characteristics of photosynthesis in wheatcultivars with different sensitivities to ozone underO3-free air concentration enrichment conditions. ActaAgron Sin 35: 1500–1507.
Chen Z, Wang X, Feng Z, Xiao Q, Duan X. (2009). Impactof elevated O3 on soil microbial community functionunder wheat crop. Water Air Soil Pollut 198: 189–198.
Chung H, Zak D, Lilleskov E. (2006). Fungal CommunityComposition and Metabolism Under Elevated CO2 andO3. Springer Verlag GMBH: Germany, pp 143–154.
Dennis PG, Miller AJ, Hirsch PR. (2010). Are root exudatesmore important than other sources of rhizodeposits instructuring rhizosphere bacterial communities? FEMSMicrobiol Ecol 72: 313–327.
Dixon P. (2003). VEGAN, a package of R functions forcommunity ecology. J Veg Sci 14: 927–930.
Dohrmann AB, Tebbe CC. (2005). Effect of elevatedtropospheric ozone on the structure of bacterialcommunities inhabiting the rhizosphere of herbaceousplants native to Germany. Appl Environ Microbiol 71:7750–7758.
Doornbos RF, van Loon LC, Bakker PAH. (2012). Impact ofroot exudates and plant defense signaling on bacterialcommunities in the rhizosphere. A review. AgronSustain Dev 32: 227–243.
Feng Z, Kobayashi K. (2009). Assessing the impacts ofcurrent and future concentrations of surface ozone oncrop yield with meta-analysis. Atmos Environ 43:1510–1519.
Feng Z, Kobayashi K, Ainsworth EA. (2008). Impact ofelevated ozone concentration on growth, physiology,and yield of wheat (Triticum aestivum L.): a meta-analysis. Glob Change Biol 14: 2696–2708.
Feng Z-W, Jin M-H, Zhang F-Z, Huang Y-Z. (2003). Effectsof ground-level ozone (O3) pollution on the yields ofrice and winter wheat in the Yangtze River delta. JEnviron Sci 15: 360–362.
Fierer N, Jackson RB. (2006). The diversity and biogeo-graphy of soil bacterial communities. Proc Natl AcadSci USA 103: 626–631.
Haichar FZ, Marol C, Berge O, Rangel-Castro JI, Prosser JI,Balesdent J et al. (2008). Plant host habitat and rootexudates shape soil bacterial community structure.ISME J 2: 1221–1230.
He Z, Deng Y, Van Nostrand JD, Tu Q, Xu M, Hemme CLet al. (2010a). GeoChip 3.0 as a high-throughput toolfor analyzing microbial community composition,structure and functional activity. ISME J 4: 1167–1179.
He Z, Deng Y, Zhou J. (2012a). Development of functionalgene microarrays for microbial community analysis.Curr Opin Biotechnol 23: 49–55.
He Z, Piceno Y, Deng Y, Xu M, Lu Z, DeSantis T et al.(2012b). The phylogenetic composition and structureof soil microbial communities shifts in response toelevated carbon dioxide. ISME J 6: 259–272.
He Z, Van Nostrand JD, Zhou J. (2012c). Applications offunctional gene microarrays for profiling microbialcommunities. Curr Opin Biotechnol 23: 460–466.
He Z, Xu M, Deng Y, Kang S, Kellogg L, Wu L et al.(2010b). Metagenomic analysis reveals a markeddivergence in the structure of belowground microbialcommunities at elevated CO2. Ecol Lett 13: 564–575.
He Z, Zhou J. (2008). Empirical evaluation of a newmethod for calculating signal-to-noise ratio formicroarray data analysis. Appl Environ Microbiol 74:2957–2966.
Heath RL. (2008). Modification of the biochemical path-ways of plants induced by ozone: what are the variedroutes to change? Environ Pollut 155: 453–463.
Holmes WE, Zak DR, Pregitzer KS, King JS. (2006).Elevated CO2 and O3 alter soil nitrogen transforma-tions beneath trembling aspen, paper birch, and sugarmaple. Ecosystems 9: 1354–1363.
IPCC (2007). Intergovernmental Panel on Climate Change.Cambridge University Press: Cambridge.
Kanerva T, Palojarvi A, Ramo K, Manninen S. (2008).Changes in soil microbial community structure underelevated tropospheric O3 and CO2. Soil Biol Biochem40: 2502–2510.
Kasurinen A, Keinanen MM, Kaipainen S, Nilsson L-O,Vapaavuori E, Kontro MH et al. (2005). Below-groundresponses of silver birch trees exposed to elevated CO2
and O3 levels during three growing seasons. GlobChange Biol 11: 1167–1179.
Larson J, Zak D, Sinsabaugh R. (2002). Extracellularenzyme activity beneath temperate trees growingunder elevated carbon dioxide and ozone. Soil SciSoc Am J 66: 1848–1856.
Leaphart AB, Lovell CR. (2001). Recovery and analysis offormyltetrahydrofolate synthetase gene sequencesfrom natural populations of acetogenic bacteria. ApplEnviron Microbiol 67: 1392–1395.
Li Q, Xu C, Liang W, Zhong S, Zheng X, Zhu J. (2009).Residue incorporation and N fertilization affectthe response of soil nematodes to the elevatedCO2 in a Chinese wheat field. Soil Biol Biochem 41:1497–1503.
Liu L, King JS, Giardina CP. (2005). Effects of elevatedconcentrations of atmospheric CO2 and troposphericO3 on leaf litter production and chemistry in tremblingaspen and paper birch communities. Tree Physiol 25:1511–1522.
Mazzola M, Funnell DL, Raaijmakers JM. (2004). Wheatcultivar-specific selection of 2,4-diacetylphlorogluci-nol-producing fluorescent Pseudomonas species fromresident soil populations. Microb Ecol 48: 338–348.
Micallef SA, Shiaris MP, Colon-Carmona A. (2009).Influence of Arabidopsis thaliana accessions onrhizobacterial communities and natural variation inroot exudates. J Exp Bot 60: 1729–1742.
Morgan PB, Ainsworth EA, Long SP. (2003). How doeselevated ozone impact soybean? A meta-analysis ofphotosynthesis, growth and yield. Plant Cell Environ26: 1317–1328.
Oksanen J, Blanchet FG, Kindt R, Legendre P, O’Hara RB,Simpson GL et al. (2010). vegan: Community EcologyPackage.
Phillips RL, Zak DR, Holmes WE, White DC. (2002).Microbial community composition and functionbeneath temperate trees exposed to elevated atmo-spheric carbon dioxide and ozone. Oecologia 131:236–244.
Pleijel H, Danielsson H, Gelang J, Sild E, Sellden G. (1998).Growth stage dependence of the grain yield responseto ozone in spring wheat (Triticum aestivum L.). AgricEcosyst Environ 70: 61–68.
Pleijel H, Eriksen AB, Danielsson H, Bondesson N,Sellden G. (2006). Differential ozone sensitivity in anold and a modern Swedish wheat cultivar - grain yieldand quality, leaf chlorophyll and stomatal conduc-tance. Environ Exp Bot 56: 63–71.
Ramo K, Kanerva T, Nikula S, Ojanpera K, Manninen S.(2006). Influences of elevated ozone and carbon
Shifts of functional gene representation under eO3
X Li et al
670
The ISME Journal
dioxide in growth responses of lowland hay meadowmesocosms. Environ Pollut 144: 101–111.
Slaughter LH, Mulchi CL, Lee EH, Tuthill K. (1989).Chronic ozone stress effects on yield and grain qualityof soft red winter wheat. Crop Sci 29: 1251–1255.
Soja G, Barnes JD, Posch M, Vandermeiren K, Pleijel H,Mills G. (2000). Phenological weighting of ozoneexposures in the calculation of critical levels for wheat,bean and plantain. Environ Pollut 109: 517–524.
Schoene K, Franz JT, Masuch G. (2004). The effect ofozone on pollen development in Lolium perenne L.Environ Pollut 131: 347–354.
Shi S, Richardson AE, O’Callaghan M, DeAngelis KM,Jones EE, Stewart A et al. (2011). Effects of selectedroot exudate components on soil bacterial commu-nities. FEMS Microbiol Ecol 77: 600–610.
Trivedi P, He Z, Van Nostrand JD, Albrigo G, Zhou J, WangN. (2012). Huanglongbing alters the structure andfunctional diversity of microbial communities asso-ciated with citrus rhizosphere. ISME J 6: 363–383.
Wang H, Zhou L, Tang X. (2006). Ozone concentrations inrural regions of the Yangtze Delta in China. J AtmosChem 54: 255–265.
Wittig VE, Ainsworth EA, Naidu SL, Karnosky DF, LongSP. (2009). Quantifying the impact of current andfuture tropospheric ozone on tree biomass, growth,
physiology and biochemistry: a quantitative meta-analysis. Glob Change Biol 15: 396–424.
Wu L, Liu X, Schadt CW, Zhou J. (2006). Microarray-basedanalysis of subnanogram quantities of microbialcommunity DNAs by using whole-community genomeamplification. Appl Environ Microbiol 72: 4931–4941.
Xiong J, Wu L, Tu S, Van Nostrand JD, He Z, Zhou J et al.(2010). Microbial communities and functionalgenes associated with soil arsenic contamination andthe rhizosphere of the arsenic-hyperaccumulatingplant Pteris vittata L. Appl Environ Microbiol 76:7277–7284.
Zak DR, Holmes WE, Pregitzer KS. (2007). AtmosphericCO2 and O3 alter the flow of 15N in developing forestecosystems. Ecology 88: 2630–2639.
Zhou J, Bruns MA, Tiedje JM. (1996). DNA recovery fromsoils of diverse composition. Appl Environ Microbiol62: 316–322.
Zhou J, Xue K, Xie J, Deng Y, Wu L, Cheng X et al. (2012).Microbial mediation of carbon-cycle feedbacks toclimate warming. Nature Clim Change 2: 106–110.
Zhu X, Feng Z, Sun T, Liu X, Tang H, Zhu J et al. (2011).Effects of elevated ozone concentration on yield offour Chinese cultivars of winter wheat underfully open-air field conditions. Glob Change Biol 17:2697–2706.
Supplementary Information accompanies the paper on The ISME Journal website (http://www.nature.com/ismej)
Shifts of functional gene representation under eO3
X Li et al
671
The ISME Journal
Related Documents