This article appeared in a journal published by Elsevier. The attached copy is furnished to the author for internal non-commercial research and educational use, including for instruction at the author’s institution and sharing with colleagues. Other uses, including reproduction and distribution, or selling or licensing copies, or posting to personal, institutional or third party websites are prohibited. In most cases authors are permitted to post their version of the article (e.g. in Word or Tex form) to their personal website or institutional repository. Authors requiring further information regarding Elsevier’s archiving and manuscript policies are encouraged to visit: http://www.elsevier.com/copyright

Welcome message from author
This document is posted to help you gain knowledge. Please leave a comment to let me know what you think about it! Share it to your friends and learn new things together.
Transcript

This article appeared in a journal published by Elsevier. The attached copy is furnished to the author for internal non-commercial research and educational
use, including for instruction at the author’s institution and sharing with colleagues.
Other uses, including reproduction and distribution, or selling or licensing copies, or posting to personal, institutional or third party websites are
prohibited.
In most cases authors are permitted to post their version of the article (e.g. in Word or Tex form) to their personal website or institutional repository. Authors
requiring further information regarding Elsevier’s archiving and manuscript policies are encouraged to visit:
http://www.elsevier.com/copyright

at SciVerse ScienceDirect
Radiation Measurements 47 (2012) 111e120
Author's Personal Copy
Contents lists available
Radiation Measurements
journal homepage: www.elsevier .com/locate/radmeas
Characterization of deep energy level defects in a-Al2O3:C using thermallyassisted OSL
Anuj Soni a,*, D.R. Mishra a, B.C. Bhatt c, S.K. Gupta b, N.S. Rawat a, M.S. Kulkarni a, D.N. Sharma a
aRadiation Safety Systems Division, Bhabha Atomic Research Center, Mumbai 400 085, Indiab Technical Physics Division, Bhabha Atomic Research Center, Mumbai 400 085, IndiacDST fellow, c/o Radiation Safety Systems Division, Bhabha Atomic Research Centre, Mumbai 400 085, India
a r t i c l e i n f o
Article history:Received 9 June 2011Received in revised form21 September 2011Accepted 14 November 2011
Keywords:Deep trapsPhototransferPhotoionization cross-sectionThermally assisted OSL (TA-OSL)
* Corresponding author. Tel.: þ91 22 25590599; faxE-mail address: [email protected] (A. Soni)
1350-4487/$ e see front matter � 2011 Elsevier Ltd.doi:10.1016/j.radmeas.2011.11.009
a b s t r a c t
Commercially available a-Al2O3:C powder was studied for deep energy level defects by a newly sug-gested method using thermally assisted optically stimulated luminescence (TA-OSL) phenomenon. Themethod involves simultaneous application of continuous wave optically stimulated luminescence (CW-OSL) as well as thermal stimulation up to 400 �C, using a linear heating rate of 4 K/s. By using thismethod, two well-defined peaks at 121 �C and 232 �C were observed. These TA-OSL peaks have beencorrelated to two different types of deeper defects which can be bleached at 650 �C and 900 �Crespectively on thermal treatment. These deeper defects, having larger thermal trap depth and relativelylower photoionization cross-section at room temperature for stimulation with blue LED (470 nm), arestable up to 500 �C, so they can store absorbed dose information even if the sample is inadvertentlyexposed to light or temperature. As only a fraction of signal is bleached during TA-OSL readout, multiplereadouts could be performed on an exposed sample using this technique. The dose vs TA-OSL responsefrom deep traps of a-Al2O3:C was found to be linear up to 10 kGy, thus extending its application for highdose dosimetry. The value of thermally assisted energy (EA) associated with these traps in a-Al2O3:C hasbeen determined to be 0.268 eV and 0.485 eV respectively and the corresponding values of photoioni-zation cross-section at room temperature (25 �C), for optical stimulation with blue light (470 nm), are5.82 � 10�20 and 3.70 � 10�22 cm2, respectively. The process of thermally assisted OSL has beenformulated analytically as well as theoretically for describing the temperature dependence of opticalcross-section and evaluation of thermally assisted energy associated with deep traps.
� 2011 Elsevier Ltd. All rights reserved.
1. Introduction
Anion deficient a-Al2O3:C has shown increasing popularity foruse as an optically stimulated luminescent (OSL) radiation dosim-eter. The F (two electrons trapped in oxygen vacancy) and Fþ (oneelectron trapped in oxygen vacancy) centers are the main lumi-nescence centers in the phosphor (Evans and Stapelbroek, 1978;Lee and Crawford, 1979). At room temperature, for stimulationwith green or blue light, the OSL comes from the intermediateenergy level defects, also termed as dosimetric traps. These dosi-metric traps however show sub-linear dose response fordoses > 1 Gy and hence put limitations for high dose applicationslike accidental dosimetry and dosimetry for food irradiation. Asmost of the thermoluminescence (TL) and OSL phosphors are foundto be large band gap insulators, there exists the possibilities of deep
: þ91 22 25505151..
All rights reserved.
energy level defects (Bulur et al., 1999), which cannot be accessedeither by visible light or by temperature during stimulation inconventional TL/OSL reader systems. In a-Al2O3:C (TLD-500 K)single crystals, the deeper defects were found to give their presenceat 873 K and 1173 K respectively (Akesrold and Gorelova, 1993).These deep traps have substantial influence on the dosimetricproperties of a-Al2O3:C, in particular, their sensitivity to light andionizing radiation, dose dependence, linearity and other parame-ters that change after exposure to ionizing radiation at higherdoses. Yukihara et al., 2004 have studied the effect of high doseirradiation in a-Al2O3:C on the OSL sensitivity and on the shape ofthe CW-OSL decay curve. The OSL decay curve becomes faster withdose while change in OSL sensitivity during step annealing proce-dure is due to the filling of deep traps. Yukihara et al., 2003 havestudied the influence of deep traps on the changes in TL sensitivityand in peak shape of 177 �C TL peak with dose, type of irradiationand temperature of heating. Their investigation demonstrated thatsensitization/desensitization effects in a-Al2O3:C can be explainedby competition process introduced by presence of deep hole and

Fig. 1. Numerically simulated TA-OSL signal vs time plot. (A) For first peak withb ¼ 4 K/s, EA ¼ 0.268, so(l) ¼ 1.8 � 10�15 cm2 with CW stimulation intensityfo ¼ 48.8 mW/cm2 of 470 nm light. (B) For second peak with b ¼ 4 K/s, EA ¼ 0.4857,so(l) ¼ 3.3 � 10�14 cm2 with CW stimulation intensity fo ¼ 48.8 mW/cm2 of 470 nmlight. (C) Total TA-OSL signal.
A. Soni et al. / Radiation Measurements 47 (2012) 111e120112
Author's Personal Copy
deep electron traps with delocalization temperatures of 873 K and1173 K respectively. Such deep traps having large thermal trapdepth are difficult to access by TL method using commerciallyavailable TL readers. Secondly, at such higher temperatures the lossof signal due to very high thermal quenching (Akselrod et al., 1998)and interference of high infrared background makes such TLmeasurements difficult beyond 750 �C Molnar et al. (2002) havereported TL peaks in Al2O3:C at 310, 460 and 675 �C for heating rateof 2 K/s using UV interference filters. Apart from this, the conven-tional OSL technique using various available visible light sources atroom temperature is also incapable of accessing such deep traps, asthe photoionization cross-section of these traps is expected to bevery low at room temperature (RT). Thus, if a method becomesavailable to exploit and reliably measure the information from thedeep traps using the conventional TL/OSL reader, new vistas in thefield of luminescence dosimetry may emerge to overcome thelimitations of OSL for a-Al2O3:C in high dose dosimetry. The use ofthe isochronous annealing method when investigating opticalabsorption (OA), thermoluminescence (TL) and phototransferredthermoluminescence (PTTL) of a-Al2O3:C single crystals makes itpossible to determine various characteristics of deep traps(Akselrod and Gorelova, 1993). Bulur et al. (1999) also reported thatin a-Al2O3:C, phototransfer (using blue light) of charges from deeptraps (located near 500 �C) result in linear dose vs TL response inthe region from 5 mGy to 5 Gy. Further advancements have beenmade in use of thermally assisted OSL (TA-OSL) (Polymeris et al.,2010), to overcome the limitations of dosimetric traps in the OSLdomain by exploiting deeper traps which are stable attemperatures > 400 �C, the temperature at which most OSLmaterials lose their trapped charge carriers in the metastable traps,which are generally used for conventional dosimetry. Polymeriset al., 2010 have reported TA-OSL from deeper traps in a-Al2O3:Csingle crystals by performing phototransfer OSL measurements atelevated temperature (up to 190 �C) using the blue (470 nm) lightstimulation. In their work the OSL readout was taken at elevatedtemperature for 1000s which may lead to heating of the readerassembly, therefore, may have its own limitation for adoption ofthis technique for routine dose measurements. The present workdescribes a new experimental method to access the signal fromdeep traps without heating the sample to temperatures higher than400 �C and limiting the readout time up to 120 s. The measuredsignal can be used to extend the applicability of a-Al2O3:C powderOSL phosphor for accidental dosimetry in harsh conditions of lightexposure and temperatures such as fire accident as well as for highdose dosimetry. To understand the origin of TA-OSL, it is importantto study the nature of the traps which are responsible for TA-OSLsignal. Umisedo et al., 2010 have recently reported the differencein the OSL characteristics in a-Al2O3:C powder (Landauer Inc.) anda-Al2O3:C single crystals(Urals Polytechnic Institute, Russia).Molnar et al. (2002) have reported that TL peaks at around 190 and675 �C are characterized by blue emission (w420 nm for 190 �Cpeak and w450 nm for 675 �C peak), while TL peaks at w310 and460 �C revealed Fþ center emission around 350 nm. It is also statedthat the 190 �C peak is due to F center emission, but that due to675 �C peak is less clear. It could be F center or impurity (e.g. Ti)emission as well. These results of F and Fþ Center emissions at hightemperatures should be viewed in the light of the important resultsof quenching of F and Fþ emissions around 150e200 �C in Al2O3:C(Akselrod et al., 1998). Also the assignment of F center (due toFþ þ e� to F transformation) for 675 �C TL seems to be contradictingwith the previous optical annealing measurements (Akselrod andGorelova, 1993). In this paper TA-OSL measurements have beenused to identify the nature of these deep energy level defects in a-Al2O3:C powder (Landauer Inc.) and also to evaluate their TA-OSLparameters.
2. Theory of method
Several researchers have investigated the temperature depen-dence of decay constant in CW-OSL measurement (Chru�sci�nska,2010; Spooner, 1994; Kuhns et al., 2000; McKeever et al., 1997).Spooner (1994) described this temperature dependence in terms ofthermal activation from a ground state to an intermediate excitedstate, with activation energy EA fromwhere optical excitation to thedelocalized band takes place (Fig. 1). Passler, 1978 have reportedthat at high temperatures, activation type dependence exp (�EA/kT)play an important part where the activation energies EA depend onthe actual structure of the given traps. The decay constant of CW-OSL curve was observed to follow Arrhenius law, which may beinterpreted as a temperature dependence of the photoionizationcross-section and can be described by the equation:
sðT; lÞ ¼ soðlÞe�EAkT (1)
where s(T,l) is the photoionization cross-section at temperatureT(K) and stimulation wavelength l, k is the Boltzmann’s constantand so(l) is the is the pre-exponential photoionization cross-section which is independent of temperature of measurement.For optical transitions from deep traps to a parabolic delocalizedband (Grimmeiss and Ledebo, 1975), it can be expressed as
soðlÞ ¼ KffiffiffiffiffiEo
p ðhy� E0Þ3=2hyðhy� dE0Þ2
(2)
where K is a constant, hn is the energy of the stimulation light ofwavelength l, Eo is the optical ionization threshold energy for thetrap, and d is a constant (d¼ 0.559 for quartz, Alexander et al., 1997).
The excitation rate (decay constant) f of CW-OSL can beexpressed in terms of product of photoionization cross-section andstimulation flux f(l) as
f ðT ; lÞ ¼ sðT ; lÞfðlÞ (3)
Considering the simplified one trap and one recombinationcenter model and assuming quasi-equilibrium condition, under nore-trapping of optically released carriers, i.e. first-order kinetics, theOSL intensity IOSL can be written as

A. Soni et al. / Radiation Measurements 47 (2012) 111e120 113
Author's Personal Copy
IOSL ¼ �dndt
¼ nf ðT ; lÞ (4)
where n is the concentration of electrons in active OSL traps. Ata given stimulation wavelength (l) and fixed temperature (T),the value of photoionization cross-section, s(T, l) remainsconstant for the given trap level. If we keep the stimulation fluxconstant with respect to time as f(l) ¼ fo(l), then Eq. (3) can berewritten as
f ðT ; lÞ ¼ f ¼ sðT ; lÞfoðlÞ ¼ fosoðlÞe�EAkT ¼ foðlÞe�
EAkT (5)
where fo(l) ¼ so(l)4o is temperature independent decay constant.Incorporating Eq. (5) into Eq. (4), and solving for OSL intensity IOSLwe get CW-OSL equation as
IOSL ¼ nofoe�fot ¼ Ioe�fot (6)
where Io is initial CW-OSL intensity and no is the initial number oftrapped charges at time t ¼ 0. The plot of Eq. (6) is a well-knownexponential decay function with decay constant fo. Now considerthe more dynamic approach to investigate the temperaturedependence nature of this Eq. (6) by incorporating linear increasein temperature by keeping stimulation intensity constantf(l) ¼ fo(l), i.e.,
T ¼ To þ bt (7)
where T is the instantaneous temperature in K, To is startingtemperature in K. b is the heating rate (K/s) and t is time (s). Thislinearly increasing temperature will modulate the excitation ratef(T,l) with respect to temperature.
2.1. Analysis under first-order kinetics
The assumption of first-order kinetics requires that the re-trapping of optically released charges is negligibly small, andhence the Eq. (6) can be written as
ITA�OSL ¼ dmdt
¼ �dndt
¼ nfosoðlÞe�EAkT ¼ nfoðlÞe�
EAkT (8)
where, ITA-OSL is the Thermally Assisted (TA)-OSL intensity. Furthersolving Eq. (8) for n, also incorporating Eq. (7), we get
n ¼ noe
�fob
ZT
To
e�EAkT ’dT ’
(9)
Incorporating Eq. (7) in Eq. (8) and solving for ITA-OSL, we get
ITA�OSL ¼ nofoðlÞe�EAkT e
�fob
ZT
To
e�EAkT ’dT ’
(10a)
or
ITA�OSL ¼ nofosoðlÞe�EAkT e
�fob
ZT
To
e�EAkT ’dT ’
(10b)
Equation (10a) or (10b) gives the TA-OSL intensity under 1storder of kinetics. The plot of numerically simulated TA-OSL intensity(Fig.1) is generated by summingup the two individual TA-OSL peaksfor a given set of experimentally evaluated values EA ¼ 0.268 eV,b¼4K/s andso(l)¼1.8�10�15 cm�2 andEA¼0.487eV,b¼4K/s and
so(l)¼3.3�10�14 cm�2, respectively,withCWstimulation intensityfo ¼ 48.8 mW/cm2 of 470 nm light. The above TA-OSL intensityEquation (10b) seems to be similar to that for TL intensity for 1storder of kinetics for heating rate b, except that attempt to escapefactor (S), also termed as frequency factor, has been replaced by f andthe thermal trap depth (E) by thermal assistance energy EA, as can beseenbycomparisonwith the standard TL intensity equation forfirst-order kinetics given below
ITL ¼ noSe�EkTe
�Sb
ZT
To
e�EkT ’dT ’
(11)
Traditionally OSL is recorded in time domain as luminescenceintensity vs. time, so the above Equation (10a) can be rewritten intime domain as
ITA�OSL ¼ nofoðlÞe�EA
kðToþbtÞe
�fob
Zt
0
e� EA
kðToþbt’Þdt
(12)
The Equation (12) gives rise to peak in TA-OSL intensity vs.temperature (time) plot. The condition for temperature at whichTA-OSL maximum occurs can be derived from the followingcondition
ddT
ðITA�OSLÞT¼TM ¼ 0 (13)
This gives the condition as
EAbkT2M
¼ fosoðlÞe�EAkTM (14)
where TM is the temperature in (K) at which TA-OSL intensity peakoccurs. The Equations (10a) and (14) are very useful equations fordetermination of EA and so. As the initial part of the Equation (10a)can be considered to be dominated by 1st exponential factor andTA-OSL intensity vs. 1/kT plot gives direct slope as EA, and theEquation (14) can be subsequently used for determining so as the 4o
is easily measured using photodiode with appropriate correction toits quantum radiant sensitivity for the selected stimulation lightwavelength.
2.2. Analysis under general-order kinetics (b s 1;b > 0)
In this case we assume probability of re-trapping of optically de-trapped charges and we consider this by defining a re-trappingparameter b. For b ¼ 2, the order of kinetics is 2, i.e. the case ofequal probability of re-trapping and recombination of the opticallyreleased charge carriers, and b ¼ 1 would lead to the case of first-order kinetics. However, a more general approach would be toconsider general-order kinetics i.e.,
bITA�OSL ¼ �dndt
¼ nb
nb�1p (15)
where p¼ s4. The corresponding equation for TA-OSL intensity canbe written as
bITA�OSL ¼ �dndt
¼ nb
nb�1fosoðlÞe�
EAkT ¼ nb
nb�1foðlÞe�
EAkT (16)
where, bITA�OSL is the TA-OSL intensity for given value of fo and b.Solving Eq. (16), after incorporating Eq. (7), we get the TA-OSLintensity in the case of general-order kinetics with respect totemperature as

Fig. 2. Energy level diagram representing the electronic transition involved in thephototransfer process from various traps in a-Al2O3:C powder.
A. Soni et al. / Radiation Measurements 47 (2012) 111e120114
Author's Personal Copy
bITA�OSL ¼ nofosoðlÞe�EAkT
241þðb�1ÞfosoðlÞ
b
ZT
To
e�EAkTdT 0
35b=1�b
(16a)
In time domain it can be rewritten as
bITA�OSL ¼nofosoðlÞe�EA
kðToþbtÞ
2641þðb�1ÞfosoðlÞ
Zt
0
e�EA
kðToþbtÞdT 0
375b=1�b
(16b)
Eq. (16) represents TA-OSL intensity under constant light stim-ulation for the general-order kinetics. Once again the temperatureat which TA-OSL maximum intensity occurs can be derived byapplying the following condition on Eq. (16a), i.e.,
ddT
ðbITA�OSLÞT¼TM ¼ 0 (17)
We get
bEAkT2M
¼ bfosoðlÞe�EAkTm
241þ ðb� 1ÞfosoðlÞ
b
ZTM
To
e�EAkT 0dT 0
35�1
(18)
Eq. (18) gives the condition for maximum in TA-OSL intensity. Asorder of kinetics increases the TA-OSL peak will occur at lowertemperature. The value of Tm also decreases with increase in thevalue of stimulation intensity 4o and so. Recently Mishra et al.(2011) have used this theory to evaluate thermally assistedenergy of dosimetric traps of Al2O3:C phosphor.
3. Materials and method
Commercially available a-Al2O3:C powder (Landauer Inc.) wasused to carry out the TA-OSL studies on its deep traps. The powdersample was annealed at 900 �C to remove any prior existing signal.This annealing removes the hard to bleach OSL components whichmay interfere with TA-OSL measurements (Akselrod et al., 1998),10mg of this annealed samplewas coated on 0.5mm thick stainlesssteel disk and the calibrated 2.2 MeV 90Sr/90Y beta source was usedto irradiate the samples. The TA-OSL measurements were per-formed using a programmable integrated TL/OSL reader systemconsisting of a high intensity blue light emitting diode(lp ¼ 470 nm, Dl ¼ 20 nm) as a stimulating light source (Kulkarniet al., 2007). The luminescence intensity was recorded usinga photon counting module interfaced to the computer. The GG-435and UG-1 optical filters were used across the LED cluster and PMTrespectively to prevent the stimulating light from reaching thePMT. The TL and TA-OSL curves were recorded at a constant heatingrate of 4 K/s and all OSL measurements were performed in theContinuousWave (CW-OSL) mode. The light intensity at the sampleposition was measured approximately to be 48.8 mW/cm2.
Fig. 3. Configuration coordinate diagram representing the thermally assisted opticalstimulation process from deep traps in a-Al2O3:C powder.
4. Results and discussion
4.1. Generation of TA-OSL signal and associated model
The prepared sample was irradiated to an absorbed dose of500 mGy and the TL was recorded up to a temperature of 400 �C, todeplete the signal due to 185 �C main dosimetry TL peak in a-Al2O3:C, which is also associated with the basic OSL traps. Fig. 2shows the energy level diagram representing the electronic
transitions involved in the phototransfer process from various trapsin a-Al2O3:C powder. The model for TA-OSL has been given in Fig. 3which shows the vibrational level of deep energy level defectsparticipating in thermally assisted OSL. The deeper energy leveldefects, having relatively lower photoionization cross-section forblue (470 nm) LED stimulation light source at room temperaturegive slow, exponentially increasing OSL signal on subsequent CW-OSL readout as shown in Fig. 4. (C1), which otherwise shouldhave given exponential decay curve on CW-OSL readout (Bos andWallinga, 2009), if the optical cross-section of these traps wascomparable to that for dosimetric traps. This kind of CW-OSLbehavior can also be explained by a phototransfer mechanism inwhich the electrons from the first deep trap DT1 are transferred toconduction band on stimulation (Fig. 2). The main dosimetric traps(MDT) responsible for 180 �C TL peak are empty at the start of OSLreadout, due to the initial TL readout, offer competition to recom-bination centers for capturing the free electrons from the conduc-tion band. Therefore, the initial OSL signal is low. However, as thetrapping centers are filled, the equilibrium is established betweencharge capture and charge stimulation from these trapping centers.As the system approaches equilibrium and the main OSL trapscompete less for the capture of free electrons, the OSL signal

0 20 40 60 80 100 120
1200
1400
1600
1800
2000
2200
2400
2600 CWOSL-C1 CWOSL-C2 CWOSL-C3 CWOSL-C4
C4
C3
C2
CW
-OSL
Int
ensi
ty(a
.u)
Time(s)
C1
Fig. 4. CW-OSL readout from deep traps. C1 is the CW-OSL readout following the firstTL readout upto 400 �C after a beta dose of 500mGy. C2 is subsequent CW-OSL readoutafter the second TL readout upto 400 �C, and so on, up to C4.
A. Soni et al. / Radiation Measurements 47 (2012) 111e120 115
Author's Personal Copy
increases, approaching a constant equilibrium level. Here we haveconsidered both the deep traps (DT1 & DT2) as electron traps andthe experimental justification for this is given in the results anddiscussion-section D. However, Akselrod and Gorelova had earlierreported two types of traps in a-Al2O3:C single crystals - deep holetraps which are emptied at 600 �C and deep electron traps gettingbleached at 900 �C (Akselrod and Gorelova, 1993).
The phototransfer process described above is further supportedby TLmeasurements carried out immediately after CW-OSL readout(Fig. 5 (T1)). As the first TL readout of irradiated sample was takenup to 400 �C prior to CW-OSL, no TL peak in this region is expectedto appear in the absence of phototransfer. However, due to pho-totransfer from deeper traps, TL peaks appeared at slightly highertemperature (w245 �C) as shown in Fig. 5(T1). Similar results in a-Al2O3:C powder have also been observed by earlier investigators(Umisedo et al., 2010). Now, the second TL readout of the abovesample will deplete the main dosimetric traps and subsequent CW-OSL readout will result in refilling of main dosimetric traps, though
50 100 150 200 250 300 350
0
50
100
150
200
250
300
350
T4
T3
T2
TL-T1 TL-T2TL-T3 TL-T4
TL
Int
ensi
ty(a
.u)
Temperature(oC)
T1
Fig. 5. Subsequent TL readouts after each CW-OSL readout (i.e., C1, C2, C3 and C4 inFig. 4) of Al2O3:C sample.
to a lesser extent, gives same exponentially increasing pattern withslightly lesser intensity (Fig. 4(C2)), as compared to previous CW-OSL readout after the TL readout of the initially exposed sample.Figs. 4 and 5 give results on subsequent sequential CW-OSL and TLreadout on the sample. However no CW-OSL is observed from theirradiated sample annealed at 700 �C as first trap bleached out onannealing at 700 �C. This indicates that the exponential increasingsignal from the sample treated up to 400 �C (i.e. after TL readout)comes from the first deeper trap by stimulationwith blue light. Thephototransfer mechanism is in agreement with previous observa-tions of phototransfer thermoluminescence in Al2O3:C, whichshows that deep traps can be stimulated with light of shorterwavelength, including blue light (Umisedo et al., 2010). In order toexplain the results on thermally assisted OSL in Quartz, Spooner(1994) postulated the existence of an array of available states inthe ground state of the trap. The upper levels of these traps areaccessed at higher temperatures with an activation energyrequiring a smaller optical energy to excite the charges to delo-calized band (Spooner, 1994).
Therefore, in order to record the TA-OSL response of deep traps,after taking first TL readout, the sample was subsequently sub-jected to CW-OSL readout along with simultaneous application oftemperature profile at a linear heating rate at 4 K/s. The TA-OSLsignal increases with increasing the temperature as predicted by1st exponential term in Eq. (10b) and later the depletion of chargesdominate and 2nd exponential term in Eq. (10b) starts showingeffect on the TA-OSL intensity. As a result two well-defined TA-OSLpeaks at 121 �C and at 232 �C occur in time as well as temperaturedomain which are different from the main dosimetric TL peakwhich occurs atw185 �C (Fig. 6A and B). Since both the TA-OSL andTL peak are recorded at the same heating rate (4 K/s), the occur-rence of these TA-OSL peaks at different temperatures confirms theexistence of distinct deeper defects in dosimetry grade a-Al2O3:Cpowder. The intensity of TA-OSL signal thus recorded is however 15times less as compared to the intensity of TL signal recorded for themain TL peak with same heating rate as shown in Fig. 6A and B.
The shift in TA-OSL peak position (experimental and simulated)with heating rate b is shown in Fig. 7. For given stimulationintensity, TA-OSL peak temperature Tm increases with heating rateb as expected from Eq. (14). The numerical fitting of experimentallyevaluated TA-OSL curve is done by using Eq. (16a) as shown inFig. 8. Slight mismatch between the experimental and fitted data
50 100 150 200 250 300 350
0
1000
2000
3000
4000
5000
A
B
185oC
232oC
121oC X 15
Inte
nsit
y (a
.u)
Temperature(oC)
TA-OSL TL
Fig. 6. (A) TL glow curve recorded just after irradiationwith 500 mGy of b dose. (B) TA-OSL curve taken after TL readout recorded at 48 mW/cm2 stimulation light along withlinear temperature ramp at a heating rate of 4 K/s.

Fig. 7. Experimental TA-OSL curve for different heating rates under CW stimulationintensity of 48 mW/cm2. The inset figure shows numerically simulated TA-OSL signalvs temperature plot for various heating rates b with CW stimulation intensityfo ¼ 48.8 mW/cm2, EA ¼ 0.2648, so(l) ¼ 1.8 � 10�15 cm2 of first peak and EA ¼ 0.4865,and so(l) ¼ 3.3 � 10�14 cm2 of second peak for 470 nm light.
Fig. 9. TA-OSL signal vs temperature for 250 mGy of b dose. Inset figure shows theluminescence efficiency measured using elevated temperature CW-OSL vs temperaturerevealing the decrease in luminescence efficiency.
A. Soni et al. / Radiation Measurements 47 (2012) 111e120116
Author's Personal Copy
and also the evaluated parameters may be attributed to thesimplified assumptions in the theoretical TA-OSL equations.
4.2. Measurement of TA-OSL parameters
The slope of integral plot of TA-OSL intensity vs. 1/kT gives thevalue of thermal assistance energy EA associated with the array ofavailable excited states of ground level of deep traps in OSL meta-stable defects for stimulation with blue light. This EA is nothing butthe sum of series of quanta of all possible vibrational energy statesassociated with the ground state of deep OSL traps at elevatedtemperature of TA-OSL measurement. The thermal quenching of Fcenter is reported at higher temperature (>130 �C) in Al2O3:C
50 100 150 200 250 300 350
0
500
1000
1500
2000
TA
-OSL
Int
ensi
ty (
a.u)
Temperature (oC)
Experimental Data TA-OSL
Fitted 2nd
Peak
Fitted 1st Peak
Fitted Total TA-OSL
Fig. 8. Individual peak fitting using TA-OSL equation in experimental TA-OSL. For firstpeak with b ¼ 4 K/s, EA ¼ 0.268, so(l) ¼ 1.1 � 10�15 cm2 and b ¼ 1.1 for second peakwith b ¼ 4 K/s, EA ¼ 0.4857, so(l) ¼ 1.3 � 10�14 cm2 and b ¼ 1with CW stimulationintensity fo ¼ 48.8 mW/cm2 of 470 nm light and no1/no2 ¼ 0.86 for first and secondpeak respectively.
(Akselrod et al., 1998) and can be expressed in terms of lumines-cence efficiency w.r.t. temperature and can be expressed as
h ¼ 1
1þ sonexp��WkT
� (19)
Therefore the effect of thermal quenching of F center in TA-OSLmeasurement has been determined for the sample under study byusing elevated temperature CW-OSL measurement of dosimetrictrap (185 �C TL peak) for same absorbed dose and fixed stimulationintensity of 40 mW/cm2. Appropriate corrections for partial loss ofOSL signal at elevated temperature due to isothermal TL has beenincorporated. The Fig. 9 shows the total TA-OSL and elevatedtemperature normalized CW-OSL intensity for various tempera-tures revealing the presence of strong thermal quenching of Fcenter in the temperature range 130 �Ce220 �C in Al2O3:C.
The inset of Fig. 9 shows the numerical fitting of Eq. (19) to theexperimental data with the measured value of W (1.1 eV) and son
Fig. 10. Natural logarithm TA-OSL intensity of first peak vs 1/kT plot gives slope(Activation Energy (EA)) of first deep trap ¼ 0.2682 � 0.0151 eV.

50 100 150 200 250 300 350 400
0
100
200
300
400
500
600
0.0
0.2
0.4
0.6
0.8
1.0
Lum
insc
ence
Eff
icen
cy (
a.u)
TA
-OSL
Int
ensi
ty (
a.u)
Temperature(oC)
CB
232oC
A
Fig. 11. TA-OSL vs temperature of second peak obtained after thermally filtering outthe first peak, along with measured thermal quenching w.r.t. temperature. Region (A)(25e80 �C) - No thermal quenching, region (B) (80e110 �C) - negligible thermalquenching, region C (110e250 �C) - dominating thermal quenching.
A. Soni et al. / Radiation Measurements 47 (2012) 111e120 117
Author's Personal Copy
(1.8 � 1012) which are in good agreement with the studies carriedout by other researchers. It is found that thermal quenching startsdominating above 130 �C. Therefore the method of initial rise iswell within the applicability limit for determination of activationenergy of first TA-OSL peak which is occurring at 121 �C, withoutthe need to apply any correction for the effect of thermal quench-ing. The evaluation of EA is performed by using the Eq. (10a). Sincethe initial rising part of TA-OSL is governed by 1st exponentiallyincreasing part of Eq. (10a) and under weak stimulation (product ofnofo) and the second exponential term can be assumed to remainconstant. Therefore under these assumptions, the Eq. (10a) can beexpressed as
ITA�OSL ¼ Ae�EAkT (20)
where A is a constant and the plot of ln (ITA-OSL) vs 1/kT gives linearplot with slope as thermal assistance energy (EA) (Fig. 10). For themeasurement of TA-OSL signal from the first deep trap at 121 �C, forstimulation with blue light, the thermal assisted energy associatedwith the trap is found to be EA ¼ 0.268 eV. With this value of EA, thecorresponding so was calculated by using Eq. (14) which comes outto be 1.88 � 10�15 cm2. The corresponding photoionization cross-section at room temperature, i.e., s(300 K, l) was calculated byusing Eq. (1), which comes out to be 5.82 � 10�20 cm2 by using theabove calculated values of EA and so.
As the two TA-OSL peaks are overlapping in nature, to find outthe activation energy of the second peak, the first peak was ther-mally bleached out by annealing the sample at 700 �C and then itsTA-OSL was recorded, which gives only the second TA-OSL peak.Alternatively, the optical bleaching of irradiated sample to100 mW/cm2 for 10 h has also been found to remove first TA-OSLpeak of 121 �C. TA-OSL recorded after removal of first peak shows
Table 1TA-OSL parameters of deep traps of a-Al2O3:C.
Type ofdefect
TA-OSLpeak(�C)
Activationenergy EA(eV)
Pre-exponentiafactor soðlÞ (cmsoðlÞ ¼ EAb
fokT2M
DT1 121 0.2648 1.88 � 10�15
DT2 232 0.4857 5.43 � 10�14
distinct nature of 2nd TA-OSL peak as shown in Fig. 11. The secondmethod (optical bleaching of irradiated sample) gives relativelymore intense TA-OSL peak than the first method (thermal anneal-ing at 700 �C), as at such high temperature annealing, partialannealing of second peak cannot be ruled out. The initial risemethod has been applied to the region B (80e110 �C) of the TA-OSLcurve shown in Fig. 11 where thermal quenching effect is nearlyabsent and start dominating above this temperature region. Henceunder these circumstances the initial rise method will able to giveestimation of activation energy with reasonable accuracy. The TA-OSL parameters for the 232 �C peak are found to be:EA ¼ 0.485 eV (Fig. 12), with corresponding so ¼ 5.43 � 10�14 cm2
and s(300 K, l) ¼ 3.70 � 10�22 cm2, while that of dosimetric trapss(300 K, l) was 1.8 � 10�18 cm2. Hence these deep traps, havinglower photoionization cross-section at room temperature ascompared to that of the dosimetric traps, can retain the absorbeddose information even for storage of the sample in room lightconditions. This is in contrast to significant fading of OSL signalreported from the dosimetric traps in Al2O3:C, due to the leakage oflight through the nearly light tight cassette of Landauer Inlightpersonnel dosimetry badges during its exposure to daylightconditions for 45 days (Benevides et al., 2010). Thus for the deepertrap to have the same photoionization cross-section as that of thedosimetric trap at RT, i.e., to access them by light as OSL signal at RT,the stimulation intensity should be about 1.2 W/cm2 for the firsttrap and about 192 W/cm2 for the second trap, which is not prac-tically achievable in the commercial OSL reader systems. Apartfrom this, at such high optical power, non-linear optical phenom-enon starts playing its role and optical heating of sample will takesplace. Hence these deep traps are stable in room light conditions,having an average light intensity of tens of mW/cm2. Further at121 �C, the photoionization cross-section of first trap becomes7.61 � 10�19 cm2 while for the second trap it becomes7.64 � 10�19 cm2 at 232 �C, which are comparable to that of themain dosimetric trap at room temperature. Therefore, by increasingthe temperature simultaneously along with constant light stimu-lation, the photoionization cross-section (s) of these deeper trapsincreases due to the temperature dependence of OSL (Spooner,1994; McKeever et al., 1997), thus making them accessible forstimulation by blue (470 nm) light at the measurement tempera-tures of 121 and 232 �C respectively. Table 1 shows the TA-OSLparameters of the deep traps in a-Al2O3:C.
4.3. Dosimetric properties of TA-OSL signal
The linearity of the integrated TA-OSL signal has been measuredas a function of absorbed dose and found to be linear in the doserange of 0.1e10 kGy as shown in Fig. 13. The dose threshold wasfound to be 10 mGy using the in-house developed TL/OSL reader(Kulkarni et al., 2007). However, it can be further improved onimproving the sensitivity of the reader system by using UVenhanced PMT. It was found that only 46% of the initial TA-OSLsignal gets bleached out on second readout, while in the thirdreadout the depletion of the signal is by 68% of the initial TA-OSL.Hence by using this method one can have multiple readout of
l2)
eEAkTM
Photo-ionizationcross-section (cm2)at (T ¼ 300 K)sðT ; lÞ ¼ soðlÞe�
EAKT
Photo-ionizationcross-section (cm2) attemperature correspondingto TA-OSL peak
5.82 � 10�20 7.61 � 10�19
3.70 � 10�22 7.64 � 10�19
24.8 25.0 25.2 25.4 25.6 25.8 26.0 26.2 26.4
9.0
9.1
9.2
9.3
9.4
9.5
9.6
9.7
Slope EA
= 0.4857 eV
ln
T
A-O
SL
(a
.u
)
1/kT (eV-1
)
Fig. 12. Natural logarithm TA-OSL intensity of second peak vs 1/kT plot with slope(Activation Energy (EA)) of second deep trap ¼ 0.4857 � 0.0132 eV.
0 20 40 60 80 100
0
500
1000
1500
2000
2500
3000
3500
4000
4500
5000
1 2 3 4 5 6
0.0
0.2
0.4
0.6
0.8
1.0
Nor
mal
ised
TA
-OSL
Int
ensi
ty (
a.u)
Number of Readouts
1st 2nd3rd4th5th6th
TA
-O
SL
In
te
ns
ity
(a
.u
)
Time(sec)
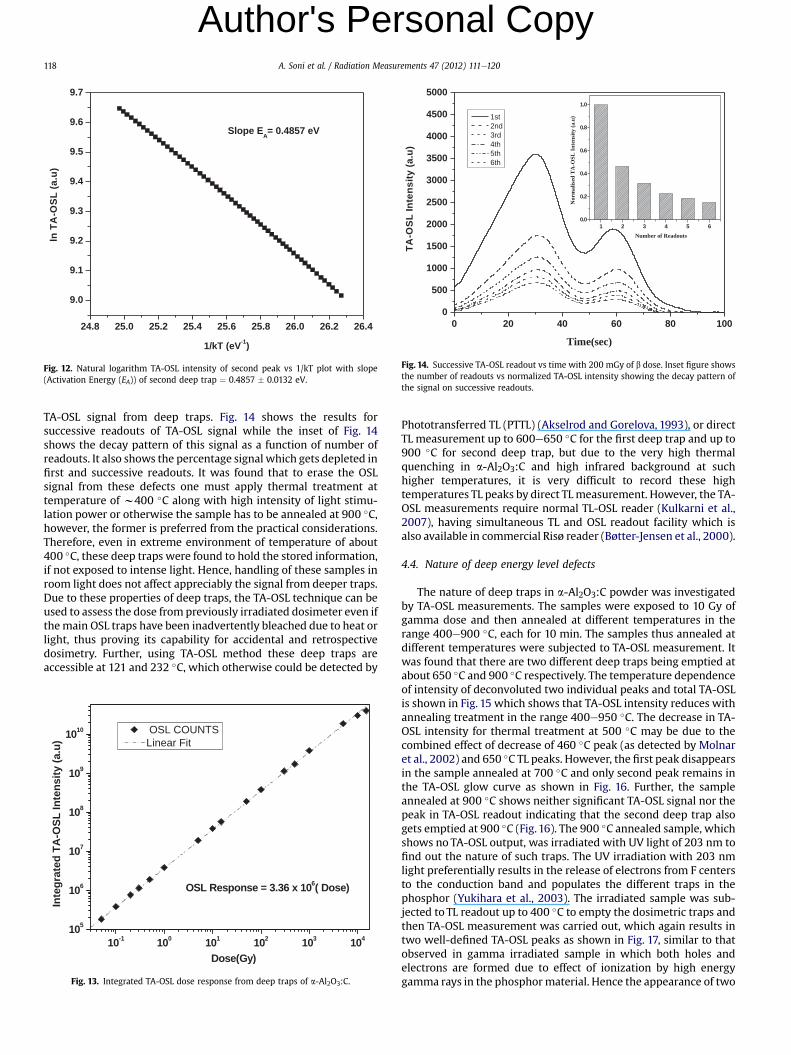
Fig. 14. Successive TA-OSL readout vs time with 200 mGy of b dose. Inset figure showsthe number of readouts vs normalized TA-OSL intensity showing the decay pattern ofthe signal on successive readouts.
A. Soni et al. / Radiation Measurements 47 (2012) 111e120118
Author's Personal Copy
TA-OSL signal from deep traps. Fig. 14 shows the results forsuccessive readouts of TA-OSL signal while the inset of Fig. 14shows the decay pattern of this signal as a function of number ofreadouts. It also shows the percentage signal which gets depleted infirst and successive readouts. It was found that to erase the OSLsignal from these defects one must apply thermal treatment attemperature of w400 �C along with high intensity of light stimu-lation power or otherwise the sample has to be annealed at 900 �C,however, the former is preferred from the practical considerations.Therefore, even in extreme environment of temperature of about400 �C, these deep traps were found to hold the stored information,if not exposed to intense light. Hence, handling of these samples inroom light does not affect appreciably the signal from deeper traps.Due to these properties of deep traps, the TA-OSL technique can beused to assess the dose from previously irradiated dosimeter even ifthemain OSL traps have been inadvertently bleached due to heat orlight, thus proving its capability for accidental and retrospectivedosimetry. Further, using TA-OSL method these deep traps areaccessible at 121 and 232 �C, which otherwise could be detected by
10-1
100
101
102
103
104
105
106
107
108
109
1010
OSL Response = 3.36 x 10⁶
( Dose)
Integ
rated
T
A-O
SL
In
ten
sity (a.u
)
Dose(Gy)
OSL COUNTSLinear Fit
Fig. 13. Integrated TA-OSL dose response from deep traps of a-Al2O3:C.
Phototransferred TL (PTTL) (Akselrod and Gorelova, 1993), or directTL measurement up to 600e650 �C for the first deep trap and up to900 �C for second deep trap, but due to the very high thermalquenching in a-Al2O3:C and high infrared background at suchhigher temperatures, it is very difficult to record these hightemperatures TL peaks by direct TL measurement. However, the TA-OSL measurements require normal TL-OSL reader (Kulkarni et al.,2007), having simultaneous TL and OSL readout facility which isalso available in commercial Risø reader (Bøtter-Jensen et al., 2000).
4.4. Nature of deep energy level defects
The nature of deep traps in a-Al2O3:C powder was investigatedby TA-OSL measurements. The samples were exposed to 10 Gy ofgamma dose and then annealed at different temperatures in therange 400e900 �C, each for 10 min. The samples thus annealed atdifferent temperatures were subjected to TA-OSL measurement. Itwas found that there are two different deep traps being emptied atabout 650 �C and 900 �C respectively. The temperature dependenceof intensity of deconvoluted two individual peaks and total TA-OSLis shown in Fig. 15 which shows that TA-OSL intensity reduces withannealing treatment in the range 400e950 �C. The decrease in TA-OSL intensity for thermal treatment at 500 �C may be due to thecombined effect of decrease of 460 �C peak (as detected by Molnaret al., 2002) and 650 �C TL peaks. However, the first peak disappearsin the sample annealed at 700 �C and only second peak remains inthe TA-OSL glow curve as shown in Fig. 16. Further, the sampleannealed at 900 �C shows neither significant TA-OSL signal nor thepeak in TA-OSL readout indicating that the second deep trap alsogets emptied at 900 �C (Fig.16). The 900 �C annealed sample, whichshows no TA-OSL output, was irradiated with UV light of 203 nm tofind out the nature of such traps. The UV irradiation with 203 nmlight preferentially results in the release of electrons from F centersto the conduction band and populates the different traps in thephosphor (Yukihara et al., 2003). The irradiated sample was sub-jected to TL readout up to 400 �C to empty the dosimetric traps andthen TA-OSL measurement was carried out, which again results intwo well-defined TA-OSL peaks as shown in Fig. 17, similar to thatobserved in gamma irradiated sample in which both holes andelectrons are formed due to effect of ionization by high energygamma rays in the phosphormaterial. Hence the appearance of two

300 400 500 600 700 800 900 1000 1100 1200
10
100
1000
10000
100000 First Peak Second Peak Total TA-OSL
TA
-OSL
Int
ensi
ty (
a.u)
Anneaing Temperature (oC)
background
Fig. 15. TA-OSL intensity variation of individual deconvoluted peaks and total TA-OSLon the annealing temperature after gamma irradiation of 10 Gy.
50 100 150 200 250 300 350
0
10000
20000
30000
40000
50000
60000
UV Irradiation Gamma Irradiation
TA
-OSL
Int
ensi
ty (
a.u)
Temperature( oC)
Fig. 17. Comparison of TA-OSL glow curve of a-Al2O3:C powder irradiated by 10 Gy ofgamma and equivalent exposure of 203 nm of UV light.
A. Soni et al. / Radiation Measurements 47 (2012) 111e120 119
Author's Personal Copy
TA-OSL peaks from deep traps, which get populated due to electronreleased from F center during shining of UV radiation of 203 nm onthe sample and no holes are generated, suggests that the nature ofboth the types of deep traps is electron. Further, as the first trap getsemptied at 650 �C, while the second trap is stable at this temper-ature and get depleted at 900 �C, suggests that both are due todifferent electron traps and accordingly get emptied at differenttemperatures. The sample annealed at 700 �C having only secondpeak was irradiatedwith UV light of 310 nm for 30 s which does notexcite the F and Fþ center electrons. It regenerates the first peakalong with the second peak in TA-OSL readout of this sample as the310 nm light transfers few of the electrons from the second trap tofirst deep trap. It also suggests that both the deep traps in a-Al2O3:Cpowder are electron trap in nature because if the trapw650e700 �C was hole in nature, only one peak would haveappeared on such treatment. However the detailed experimentalresults of Akselrod and Gorelova, (1993) and Yukihara et al. (2003,2004) demonstrated that in a-Al2O3:C crystals the 650 �C might bea hole trap. This contradiction with our results may be because ofthe reason that the effect of UV exposure on TA-OSL is not sufficient
50 100 150 200 250 300 350
0
10000
20000
30000
40000
50000
60000
400oC
500oC
600oC
650oC
700oC
800oC
900oC
950oC
TA
-OSL
Int
ensi
ty
Temperature(oC)
Fig. 16. TA-OSL intensity variation of a-Al2O3:C powder on the annealing temperatureafter gamma irradiation of 10 Gy, showing bleaching of both peaks at differenttemperatures.
to reach a conclusion as both 203 and 310 nm exposure may lead toelectron transition from the valence band to the impurity level andproduce free holes. Thus more detailed studies involving directmeasurement of F and Fþ centers along with TA-OSL in Al2O3:Cwould be required to assign the nature of deep traps.
5. Conclusions
The deep energy level defects of a-Al2O3:C phosphor can beaccessed by stimulating with visible light at elevated temperatures,but at significantly lower temperatures than their respective TLpeaktemperatures, due to increase in their photoionization cross-sectionat such temperatures. TA-OSL signal from these traps can be used toextend the use of a-Al2O3:C phosphor in high dose dosimetryapplications such as retrospective dosimetry, accidental dosimetry,and irradiation of food products. Using TA-OSL method, one canmake multiple readouts from the deep defects in an irradiatedphosphormaterial, thus can be used for confirmation/re-estimationof the measured dose in the certain exposure cases. The dosimetricproperties andnatureof deep trapshavebeen studied. Both thedeeptraps have been found to contribute to TA-OSL peaks at 121 and232 �C, respectively with delocalization temperatures of about 650and 900 �C. By using the method suggested in this paper, furtherstudy onmaterial such as quartz and feldspar will help in extendingthe dose range of these materials for archaeological and geologicaldating applications. The measurement of EA and pre-exponentialfactor is important to understand the change in value of photoion-ization cross-section with LET of incident charge particle such as b,a and HCP (Heavy Charge particles).
Acknowledgment
The authors are grateful to Dr. A KGhosh, Director, Health Safety& Environment Group, BARC for the support and encouragementduring the course of this work.
References
Akselrod, M.S., Agersnap Larsen, N., Whitley, V., McKeever, S.W.S., 1998. Thermalquenching of F-center luminescence in a-Al2O3:C. J. Appl. Phys. 84, 3364e3373.
Akselrod, M.S., Gorelova, E.A., 1993. Deep traps in highly sensitive a-Al2O3: C TLDCrystals. Nucl. Tracks Radiat. Meas. 21, 143e146.

A. Soni et al. / Radiation Measurements 47 (2012) 111e120120
Author's Personal Copy
Alexander, C.S., Morris, M.F., Mackeever, S.W.S., 1997. The time and wavelengthresponse of phototransferred thermoluminescence in natural and syntheticquartz. Radiat. Meas. 27, 153e159.
Benevides, L., Romanyukha, A., Hull, F., Duffy, M., Voss, S., Moscovitch, M., 2010.Light induced fading in the OSL response of Al2O3:C. Radiat. Meas. 45, 523e526.
Bøtter-Jensen, L., Bulur, E., Duller, G.A.T., Murray, A.S., 2000. Advances in lumines-cence instrument systems. Radiat. Meas. 32, 523e528.
Bos, A.J.J., Wallinga, J., 2009. Optically stimulated luminescence signals under variousstimulation modes assuming first-order kinetics. Phys. Rev. B 79, 195118.
Bulur, E., Goksu, H.Y., Wahl, W., 1999. Phototransferred thermoluminescence froma-Al2O3:C using blue light emitting diodes. Radiat. Meas. 30, 203e206.
Chru�sci�nska, A., 2010. On some fundamental features of optically stimulatedluminescence measurements. Radiat. Meas. 45, 991e999.
Evans, B.D., Stapelbroek, M., 1978. Optical properties of the Fþ centre in crystallineAl2O3. Phys. Rev. B 18, 7089e7098.
Grimmeiss, H.G., Ledebo, L.-Å, 1975. Photo-ionization of deep impurity levels in semi-conductors with non-parabolic bands. J. Phys. C: Solid State Phys. 8, 2615e3226.
Kuhns, C.K., Agersnap, Larsen, McKeever, S.W.S., 2000. Characteristics of LM-OSLfrom several different types of quartz. Radiat. Meas. 32, 413e418.
Kulkarni, M.S., Mishra, D.R., Sharma, D.N., 2007. A versatile integrated system forthermo luminescence and optically stimulated luminescence measurements.Nucl. Instrum. Methods Phys. Res. B 262, 348e356.
Lee, K.H., Crawford, J.H., 1979. Luminescence of the F centre in sapphire. Phys. Rev. B19, 3217e3221.
McKeever, S.W.S., Bøtter-Jensen, L., Agersnap Larsen, N., Duller, G.A.T., 1997.Temperature dependence of OSL decay curves experimental and theoreticalaspects. Radiat. Meas. 27, 161e170.
Mishra, D.R., Soni, Anuj, Rawat, N.S., Kulkarni, M.S., Bhatt, B.C., Sharma, D.N., 2011.Method of measuring thermal assistance energy associated with OSL traps in a-Al2O3:C phosphor. Radiat. Meas. 46, 635e642.
Molnar, G., Benabdesselam, M., Borossay, J., Iacconi, P., Lapraz, D., Akselrod, M.,2002. Influence of the irradiation temperature on the dosimetric and hightemperature TL peaks of Al2O3:C. Radiat. Prot. Dosim. 100, 139e142.
Passler, R., 1978. Temperature dependences of the nonradiative multiphonon carriercapture and ejection properties of deep traps in semiconductors. I. Theoreticalresults. Phys. Status Solidi B 85, 203e215.
Polymeris, G.S., Raptis, S., Afouxenidis, D., Tsirliganis, N.C., Kitis, G., 2010. Thermallyassisted OSL from deep traps in a-Al2O3:C. Radiat. Meas. 45, 519e522.
Spooner, N.A.,1994. On the optical dating signal fromquartz. Radiat.Meas. 23, 593e600.Umisedo, Nancy, K., Elisabeth, M., Yoshimura, Patricia, B.R., Gasparian,
Yukihara, E.G., 2010. Comparison between blue and green stimulated lumi-nescence of Al2O3:C. Radiat. Meas. 45, 151e156.
Yukihara, E.G., Whitley, V.H., Polf, J.C., Klein, D.M., McKeever, S.W.S., Akselrod, A.E.,Akselrod, M.S., 2003. The effects of deep trap population on the thermolumi-nescence of Al2O3:C. Radiat. Meas. 37, 627e638.
Yukihara, E.G., Whitley, V.H., McKeever, S.W.S., Akselrod, A.E., Akselrod, M.S., 2004.Effect of high-dose irradiation on the optically stimulated luminescence ofA-l2O3:C. Radiat. Meas. 38, 317e330.
Related Documents