Characterization of Chinese, American and Estonian oil shale semicokes and their sorptive potential Indrek Külaots * , Jillian L. Goldfarb, Eric M. Suuberg Division of Engineering, Brown University, Providence, RI 02912, USA article info Article history: Received 22 January 2010 Received in revised form 11 May 2010 Accepted 18 May 2010 Available online 28 May 2010 Keywords: Oil shale Semicoke Organic char BET surface area Pore-size distribution abstract The primary byproduct of current oil shale oil extraction processes is semicoke. Its landfill deposition pre- sents a potential threat to the environment and represents a waste of a potentially useable byproduct. Here we examine the sorptive characteristics of oil shale semicoke. Oil shale samples from Estonia, China and the United States were pyrolyzed at 500 and 1000 °C and their products analyzed for organic char content, surface area and porosity. Pyrolysis of the oil shales at temperatures of 500–1000 °C yields semi- cokes with organic char contents from 1.7% to 17.5% and BET surface areas of 4.4–57 m 2 g 1 , correspond- ing to 100–550 m 2 g 1 of organic char. For comparison, the BET surface areas of class F coal fly ashes (combustion byproducts of bituminous coals) typically range from 2 to 5 m 2 g 1 , corresponding to 30– 60 m 2 g 1 of carbon while class C fly ash (from low rank coals) have carbon BET surface areas comparable to oil shale semicoke organic char surface areas. Ó 2010 Elsevier Ltd. All rights reserved. 1. Introduction Oil shale, a fine-grained sedimentary rock, often contains a pro- portionally large amount of kerogen, which can be converted into oil by thermal degradation. Worldwide deposits of oil in shale are estimated at 2.8 trillion barrels of recoverable oil, which is a conservative figure given that oil shale resources from some coun- tries are not reported or the deposits are not fully investigated [1]. The world’s largest oil shale deposits are found in Australia, China and the United States, though currently only Israel, Russia, Ger- many, Brazil, Estonia and China utilize their reserves. In some sce- narios, the economics of oil production from oil shale may hinge upon finding suitable and environmentally acceptable uses of the semicoke byproduct of the retorting process. Today, the byproduct of oil shale production, semicoke, finds commercial use as an aggregate in asphalts, in construction bricks, in cements, as a soil amendment, in rock wool insulation, chemi- cals, rubber softeners, sulfur, ammonia and power generation, among others [2,3]. However, the total use of oil shale byproducts in these various products represents only a small fraction of the oil shale semicoke produced each year. In addition there is a potential for a large increase in the production of semicoke byproduct if oil production from shale oil were to increase. Currently, the majority of semicoke is disposed of in landfills, and concern about large vol- umes of byproduct disposal is a major factor used to argue against greater development of this resource. Based on the WEC 2007 report, Estonia was the world’s largest producer of shale oil, producing 345,000 ton of shale oil per year. Approximately 8000 ton of shale oil was utilized for domestic elec- tricity generation; 98,000 ton of oil for heat generation and the remaining 222,000 was exported [1]. In Estonia the solid semicoke byproduct of shale oil production is mostly disposed of in open dumps; currently approximately 300 million ton of solid semicoke waste is present in such dumps. The placement of oil shale semicoke into open dumps presents a potential threat of groundwater pollution by polycyclic aromatic hydrocarbons, heavy metals and phenols via leaching from the semicoke by rain and snow that some suggest are entrained in the semicoke waste [4,5]. Such dumping of oil shale semicoke pre- sents a hazard that evokes images like the recent breach of a coal fly ash containment pond in Harriman, TN, USA, releasing an esti- mated 5.4 million cubic yards of slurry in what some called ‘‘the largest environmental disaster of its kind in the United States” [6]. Previous studies by Manor et al. [7], Stout et al. [8], Trikkel et al. [9] show that the organic char content of oil shale semicoke is rel- atively high, reaching up to 20 wt.%. The organic char in oil shale semicoke does not exist as pure carbon, but rather a carbon system with residual hydrogen and other heteroatoms [7,10]. The Estonian oil shale organic char C/H mass ratio is reported to be as high as 8 [10]. At this point, we clarify that hereafter we use term ‘‘char” to refer to only the organic portion of the oil shale coke, and when we use the term ‘‘semicoke” we refer to the organic plus inorganic por- tions of the oil production byproduct. The relatively high organic matter (char) content in oil shale semicoke leads to a relatively high surface area; the surface area 0016-2361/$ - see front matter Ó 2010 Elsevier Ltd. All rights reserved. doi:10.1016/j.fuel.2010.05.025 * Corresponding author. Tel.: +1 401 863 3977; fax: +1 401 863 9120. E-mail address: [email protected] (I. Külaots). Fuel 89 (2010) 3300–3306 Contents lists available at ScienceDirect Fuel journal homepage: www.elsevier.com/locate/fuel

Welcome message from author
This document is posted to help you gain knowledge. Please leave a comment to let me know what you think about it! Share it to your friends and learn new things together.
Transcript
Fuel 89 (2010) 3300–3306
Contents lists available at ScienceDirect
Fuel
journal homepage: www.elsevier .com/locate / fuel
Characterization of Chinese, American and Estonian oil shale semicokesand their sorptive potential
Indrek Külaots *, Jillian L. Goldfarb, Eric M. SuubergDivision of Engineering, Brown University, Providence, RI 02912, USA
a r t i c l e i n f o a b s t r a c t
Article history:Received 22 January 2010Received in revised form 11 May 2010Accepted 18 May 2010Available online 28 May 2010
Keywords:Oil shaleSemicokeOrganic charBET surface areaPore-size distribution
0016-2361/$ - see front matter � 2010 Elsevier Ltd. Adoi:10.1016/j.fuel.2010.05.025
* Corresponding author. Tel.: +1 401 863 3977; faxE-mail address: [email protected] (I. Kül
The primary byproduct of current oil shale oil extraction processes is semicoke. Its landfill deposition pre-sents a potential threat to the environment and represents a waste of a potentially useable byproduct.Here we examine the sorptive characteristics of oil shale semicoke. Oil shale samples from Estonia, Chinaand the United States were pyrolyzed at 500 and 1000 �C and their products analyzed for organic charcontent, surface area and porosity. Pyrolysis of the oil shales at temperatures of 500–1000 �C yields semi-cokes with organic char contents from 1.7% to 17.5% and BET surface areas of 4.4–57 m2 g�1, correspond-ing to 100–550 m2 g�1 of organic char. For comparison, the BET surface areas of class F coal fly ashes(combustion byproducts of bituminous coals) typically range from 2 to 5 m2 g�1, corresponding to 30–60 m2 g�1 of carbon while class C fly ash (from low rank coals) have carbon BET surface areas comparableto oil shale semicoke organic char surface areas.
� 2010 Elsevier Ltd. All rights reserved.
1. Introduction
Oil shale, a fine-grained sedimentary rock, often contains a pro-portionally large amount of kerogen, which can be converted intooil by thermal degradation. Worldwide deposits of oil in shaleare estimated at 2.8 trillion barrels of recoverable oil, which is aconservative figure given that oil shale resources from some coun-tries are not reported or the deposits are not fully investigated [1].The world’s largest oil shale deposits are found in Australia, Chinaand the United States, though currently only Israel, Russia, Ger-many, Brazil, Estonia and China utilize their reserves. In some sce-narios, the economics of oil production from oil shale may hingeupon finding suitable and environmentally acceptable uses of thesemicoke byproduct of the retorting process.
Today, the byproduct of oil shale production, semicoke, findscommercial use as an aggregate in asphalts, in construction bricks,in cements, as a soil amendment, in rock wool insulation, chemi-cals, rubber softeners, sulfur, ammonia and power generation,among others [2,3]. However, the total use of oil shale byproductsin these various products represents only a small fraction of the oilshale semicoke produced each year. In addition there is a potentialfor a large increase in the production of semicoke byproduct if oilproduction from shale oil were to increase. Currently, the majorityof semicoke is disposed of in landfills, and concern about large vol-umes of byproduct disposal is a major factor used to argue againstgreater development of this resource.
ll rights reserved.
: +1 401 863 9120.aots).
Based on the WEC 2007 report, Estonia was the world’s largestproducer of shale oil, producing 345,000 ton of shale oil per year.Approximately 8000 ton of shale oil was utilized for domestic elec-tricity generation; 98,000 ton of oil for heat generation and theremaining 222,000 was exported [1]. In Estonia the solid semicokebyproduct of shale oil production is mostly disposed of in opendumps; currently approximately 300 million ton of solid semicokewaste is present in such dumps.
The placement of oil shale semicoke into open dumps presents apotential threat of groundwater pollution by polycyclic aromatichydrocarbons, heavy metals and phenols via leaching from thesemicoke by rain and snow that some suggest are entrained inthe semicoke waste [4,5]. Such dumping of oil shale semicoke pre-sents a hazard that evokes images like the recent breach of a coalfly ash containment pond in Harriman, TN, USA, releasing an esti-mated 5.4 million cubic yards of slurry in what some called ‘‘thelargest environmental disaster of its kind in the United States” [6].
Previous studies by Manor et al. [7], Stout et al. [8], Trikkel et al.[9] show that the organic char content of oil shale semicoke is rel-atively high, reaching up to 20 wt.%. The organic char in oil shalesemicoke does not exist as pure carbon, but rather a carbon systemwith residual hydrogen and other heteroatoms [7,10]. The Estonianoil shale organic char C/H mass ratio is reported to be as high as 8[10]. At this point, we clarify that hereafter we use term ‘‘char” torefer to only the organic portion of the oil shale coke, and when weuse the term ‘‘semicoke” we refer to the organic plus inorganic por-tions of the oil production byproduct.
The relatively high organic matter (char) content in oil shalesemicoke leads to a relatively high surface area; the surface area
I. Külaots et al. / Fuel 89 (2010) 3300–3306 3301
of Pakistani oil shale semicoke is reported to be 21 m2 g�1 [11].Moreover, Dogan and Uysal [12] report Turkish spent oil shale sur-face areas in the range from 19 to 117 m2 g�1of spent shale withthe exception of Himmetoglu spent oil shale sample pyrolyzed at700 �C, which is reported to have a surface area as high as183 m2 g�1. As a comparison, the BET surface area of a typical classF fly ash (coal combustion byproduct) with a carbon content ofabout 6 wt.% is as high as 5 m2 g�1 fly ash [13–15].
A scant amount of the oil shale literature focuses on the charac-terization of oil shale semicokes, and even less investigates specif-ically the semicoke organic char. Rather the majority of theliterature focuses on the oil shale retorting process, quantifyingextractable oil, and general characteristics of the oil derived fromshale. Without defining the sorption characteristics of spent oilshales Taulbee et al. [2] suggested that the most likely use for oilshale semicokes could potentially be industrial emissions controlsystems to remove NOx, SO2, NH3, H2S and aqueous pollutants suchas phenols. To our knowledge there has been no systematic studyof the organic char content, surface area and pore-size distributionof oil shale semicokes. Therefore, the motivation behind this workis to investigate these characteristics of various oil shale semicokesamples pyrolyzed at 500 and 1000 �C. The oil shale samples inves-tigated herein were obtained from three continents, in order to seeif there were any geographical trends in the results.
2. Experimental
2.1. Materials
Three oil shale samples were obtained from the Maoming minein the Guangdong province of southwest China, with the local Chi-nese classification (or grade) of A–C. One sample was obtainedfrom the Huadian mine in the Jilin province of northeast China(grade C oil shale). There were three samples from Green River,Colorado (USA), and one sample from the Aidu mine in northeastEstonia. All eight oil shale samples examined in this work wereground and sieved to yield samples with a particle size between45 and 75 lm.
In the pyrolytic sample preparation, approximately 5 g of eachoil shale was placed into a porcelain crucible, which was insertedinto a laboratory tube furnace maintained at two temperatures,500 and 1000 �C, under a helium flow of 300 mL min�1. The massloss in the 500 �C pyrolysis experiments is attributed mostly tothe removal of volatile matter (kerogen), and to the lesser extentthe water removal. The mass loss in the 1000 �C pyrolysis experi-ments is attributed to the removal of volatile matter (kerogen),then to the decomposition of calcite and dolomite in the mineralportion of the shale and to the lesser extent the water removal.
Oil shale mass loss between the temperatures of 120 and 500 �Cwas ascribed to the pyrolytic mass loss from kerogen. Fischer Assayoil yield, in units of gallons of oil per ton of oil shale (GPT), wasestimated from kerogen content of the shales according to Cook[16], but was also given by the sample providers in a few cases.
2.2. Oil shale organic char content
A TA Instruments thermogravimetric analyzer (TGA) model 951enabled determination of organic char contents of the oil shalesemicoke samples prepared in the above pyrolysis process.Approximately 5–10 mg of sample was placed on a platinum panin the TGA. The sample was heated to 120 �C at a rate of30 �C min�1 and held for 20 min to remove physically adsorbedwater, after which the sample was heated at 20 �C min�1 to600 �C and held for 35 min to determine the loss of the organicportion of the semicoke. Each sample was analyzed at least three
times to ensure reproducibility. It is worth mentioning that wedid not see any water in the semicokes, since our samples werestored in air-tight jars to mitigate atmospheric exposure followingtheir pyrolytic preparation. At temperatures above 620 �C theweight loss from oil shale semicokes is likely due to decompositionof carbonate materials such as calcite, dolomite and ankerite, andshould be separately accounted for when the char content of oilshales is measured [11].
2.3. Surface area and porosity characterization
The porous character of the semicokes was examined employ-ing the standard volumetric N2 adsorption technique. Here weuse a fully automatic Quantachrome Corp. Autosorb-1 system.Depending upon the approximate surface area of the sample,100–500 mg of oil shale semicoke powder was placed into a sam-ple vial and out-gassed at 300 �C overnight to clean the surface ofthe sample. The isotherms were obtained by recording the N2
adsorption/desorption data points at relative pressures from 10�6
to 1. These adsorption data points were used to calculate the Bru-nauer, Emmett and Teller (BET) surface areas and the porosities ofeach of the oil shale semicoke samples [17,18]. The BET surfacearea of the semicoke was determined over the partial pressure(P/P0) range where the BET equation had the highest correlationcoefficient. For most samples having little microporosity, the com-monly accepted partial pressure range to determine BET surfacearea is 0.05–0.3. For slightly microporous samples, the isotherms’relative pressure range for BET area determination requires adjust-ment. In this work, with slightly microporous oil shale semicokesamples, the BET areas were determined at significantly lower P/P0 values, in the range of 0.03–0.1, as suggested by Gregg and Sing[18].
The pore sizes discussed in this work are reported according toIUPAC classification, which defines micropores as pores of widthless than 20 Å, pores in the range of 20–500 Å as mesopores andpores above 500 Å as macropores. Micropore volumes of the oilshale semicoke samples were determined by applying the Dubi-nin–Radushkevitch (DR) model to N2 adsorption isotherms [18].The mesoporosity of the oil shale semicoke samples was deter-mined by subtracting the DR microporosity value (in mL per gramof semicoke) from the porosity value (in mL per gram of semicoke),determined at an isotherm relative pressure, P/P0, of 0.95. Themacroporosity of the semicoke sample was determined by sub-tracting the porosity value at a relative pressure P/P0 = 0.95 (inmL per gram of semicoke) from the porosity value at a relativepressure P/P0 = 0.99 (in mL per gram of semicoke). The specificporosities of the oil shale organic chars were calculated by dividingthe semicoke porosities by the organic fraction present in oil shalesemicokes.
The pore-size distributions of oil shale semicokes were deter-mined from the nitrogen adsorption isotherms at 77 K using Den-sity Functional Theory (DFT) [19,20]. The SEM images of oil shalesemicokes were taken to qualitatively further investigate porosityusing a LEO 1530 VP ultra high resolution Field Emission ScanningElectron Microscope (FE-SEM).
3. Results and discussion
3.1. Oil shale oil yields
The oil shales studied have Fischer Assay values ranging from21 to 77 GPT (see Table 1). The Estonian oil shale had the highestvalue of 77 GPT, whereas the three Colorado oil shale sampleshad estimated Fischer Assays of 21, 27 and 51 GPT and those com-pared well to values provided by the oil shale supplier (see Table 1).
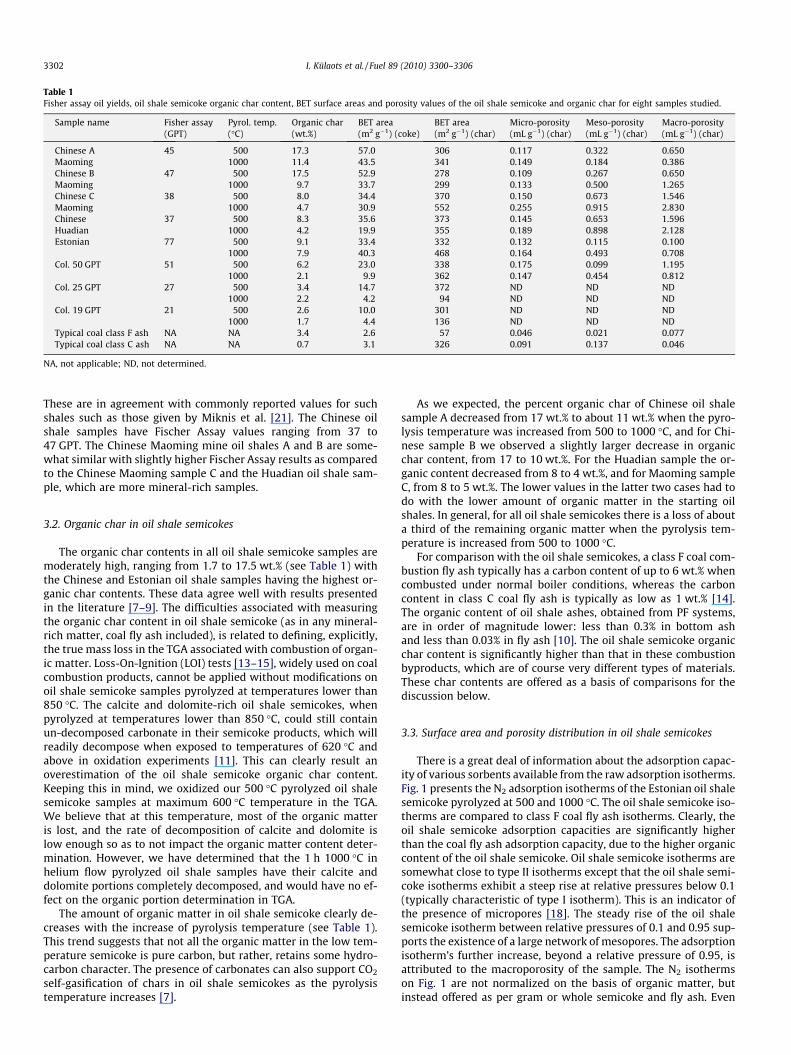
Table 1Fisher assay oil yields, oil shale semicoke organic char content, BET surface areas and porosity values of the oil shale semicoke and organic char for eight samples studied.
Sample name Fisher assay Pyrol. temp. Organic char BET area BET area Micro-porosity Meso-porosity Macro-porosity(GPT) (�C) (wt.%) (m2 g�1) (coke) (m2 g�1) (char) (mL g�1) (char) (mL g�1) (char) (mL g�1) (char)
Chinese A 45 500 17.3 57.0 306 0.117 0.322 0.650Maoming 1000 11.4 43.5 341 0.149 0.184 0.386Chinese B 47 500 17.5 52.9 278 0.109 0.267 0.650Maoming 1000 9.7 33.7 299 0.133 0.500 1.265Chinese C 38 500 8.0 34.4 370 0.150 0.673 1.546Maoming 1000 4.7 30.9 552 0.255 0.915 2.830Chinese 37 500 8.3 35.6 373 0.145 0.653 1.596Huadian 1000 4.2 19.9 355 0.189 0.898 2.128Estonian 77 500 9.1 33.4 332 0.132 0.115 0.100
1000 7.9 40.3 468 0.164 0.493 0.708Col. 50 GPT 51 500 6.2 23.0 338 0.175 0.099 1.195
1000 2.1 9.9 362 0.147 0.454 0.812Col. 25 GPT 27 500 3.4 14.7 372 ND ND ND
1000 2.2 4.2 94 ND ND NDCol. 19 GPT 21 500 2.6 10.0 301 ND ND ND
1000 1.7 4.4 136 ND ND NDTypical coal class F ash NA NA 3.4 2.6 57 0.046 0.021 0.077Typical coal class C ash NA NA 0.7 3.1 326 0.091 0.137 0.046
NA, not applicable; ND, not determined.
3302 I. Külaots et al. / Fuel 89 (2010) 3300–3306
These are in agreement with commonly reported values for suchshales such as those given by Miknis et al. [21]. The Chinese oilshale samples have Fischer Assay values ranging from 37 to47 GPT. The Chinese Maoming mine oil shales A and B are some-what similar with slightly higher Fischer Assay results as comparedto the Chinese Maoming sample C and the Huadian oil shale sam-ple, which are more mineral-rich samples.
3.2. Organic char in oil shale semicokes
The organic char contents in all oil shale semicoke samples aremoderately high, ranging from 1.7 to 17.5 wt.% (see Table 1) withthe Chinese and Estonian oil shale samples having the highest or-ganic char contents. These data agree well with results presentedin the literature [7–9]. The difficulties associated with measuringthe organic char content in oil shale semicoke (as in any mineral-rich matter, coal fly ash included), is related to defining, explicitly,the true mass loss in the TGA associated with combustion of organ-ic matter. Loss-On-Ignition (LOI) tests [13–15], widely used on coalcombustion products, cannot be applied without modifications onoil shale semicoke samples pyrolyzed at temperatures lower than850 �C. The calcite and dolomite-rich oil shale semicokes, whenpyrolyzed at temperatures lower than 850 �C, could still containun-decomposed carbonate in their semicoke products, which willreadily decompose when exposed to temperatures of 620 �C andabove in oxidation experiments [11]. This can clearly result anoverestimation of the oil shale semicoke organic char content.Keeping this in mind, we oxidized our 500 �C pyrolyzed oil shalesemicoke samples at maximum 600 �C temperature in the TGA.We believe that at this temperature, most of the organic matteris lost, and the rate of decomposition of calcite and dolomite islow enough so as to not impact the organic matter content deter-mination. However, we have determined that the 1 h 1000 �C inhelium flow pyrolyzed oil shale samples have their calcite anddolomite portions completely decomposed, and would have no ef-fect on the organic portion determination in TGA.
The amount of organic matter in oil shale semicoke clearly de-creases with the increase of pyrolysis temperature (see Table 1).This trend suggests that not all the organic matter in the low tem-perature semicoke is pure carbon, but rather, retains some hydro-carbon character. The presence of carbonates can also support CO2
self-gasification of chars in oil shale semicokes as the pyrolysistemperature increases [7].
As we expected, the percent organic char of Chinese oil shalesample A decreased from 17 wt.% to about 11 wt.% when the pyro-lysis temperature was increased from 500 to 1000 �C, and for Chi-nese sample B we observed a slightly larger decrease in organicchar content, from 17 to 10 wt.%. For the Huadian sample the or-ganic content decreased from 8 to 4 wt.%, and for Maoming sampleC, from 8 to 5 wt.%. The lower values in the latter two cases had todo with the lower amount of organic matter in the starting oilshales. In general, for all oil shale semicokes there is a loss of abouta third of the remaining organic matter when the pyrolysis tem-perature is increased from 500 to 1000 �C.
For comparison with the oil shale semicokes, a class F coal com-bustion fly ash typically has a carbon content of up to 6 wt.% whencombusted under normal boiler conditions, whereas the carboncontent in class C coal fly ash is typically as low as 1 wt.% [14].The organic content of oil shale ashes, obtained from PF systems,are in order of magnitude lower: less than 0.3% in bottom ashand less than 0.03% in fly ash [10]. The oil shale semicoke organicchar content is significantly higher than that in these combustionbyproducts, which are of course very different types of materials.These char contents are offered as a basis of comparisons for thediscussion below.
3.3. Surface area and porosity distribution in oil shale semicokes
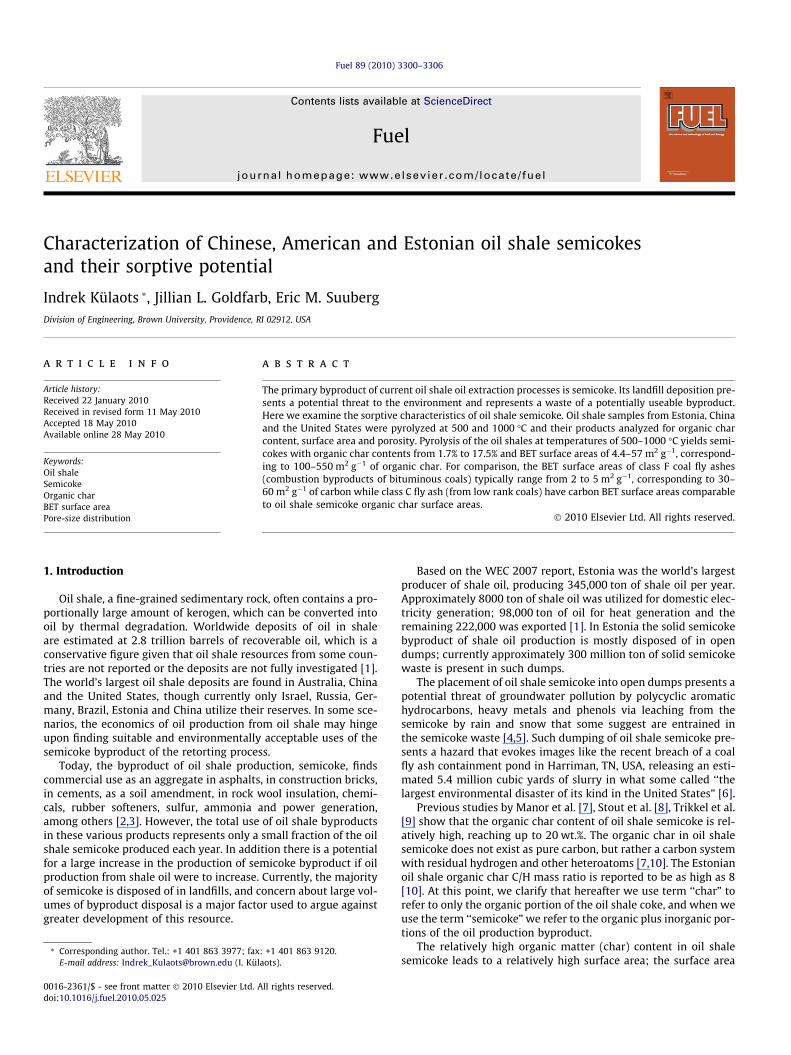
There is a great deal of information about the adsorption capac-ity of various sorbents available from the raw adsorption isotherms.Fig. 1 presents the N2 adsorption isotherms of the Estonian oil shalesemicoke pyrolyzed at 500 and 1000 �C. The oil shale semicoke iso-therms are compared to class F coal fly ash isotherms. Clearly, theoil shale semicoke adsorption capacities are significantly higherthan the coal fly ash adsorption capacity, due to the higher organiccontent of the oil shale semicoke. Oil shale semicoke isotherms aresomewhat close to type II isotherms except that the oil shale semi-coke isotherms exhibit a steep rise at relative pressures below 0.1(typically characteristic of type I isotherm). This is an indicator ofthe presence of micropores [18]. The steady rise of the oil shalesemicoke isotherm between relative pressures of 0.1 and 0.95 sup-ports the existence of a large network of mesopores. The adsorptionisotherm’s further increase, beyond a relative pressure of 0.95, isattributed to the macroporosity of the sample. The N2 isothermson Fig. 1 are not normalized on the basis of organic matter, butinstead offered as per gram or whole semicoke and fly ash. Even
0
10
20
30
40
50
60
0 0.2 0.4 0.6 0.8 1
Ads
orbe
d vo
lum
e, S
TP
[cok
e]
Relative pressure, P/P0
[mL
g-1 ]
Fig. 1. Nitrogen adsorption isotherms of oil Estonian oil shale semicokes pyrolyzedat 500 and 1000 �C, compared to typical coal class F and C fly ash isotherms. j:Estonian oil shale semicoke, 500 �C; .: Estonian oil shale semicoke, 1000 �C; 4:Estonian oil shale semicoke inorganic portion; d: Class F coal fly ash.
0
10
20
30
40
50
60
0 5 10 15 20
BET
sur
face
are
a [m
2[c
oke]
Oil shale semicoke char content [wt.%]
g-1]
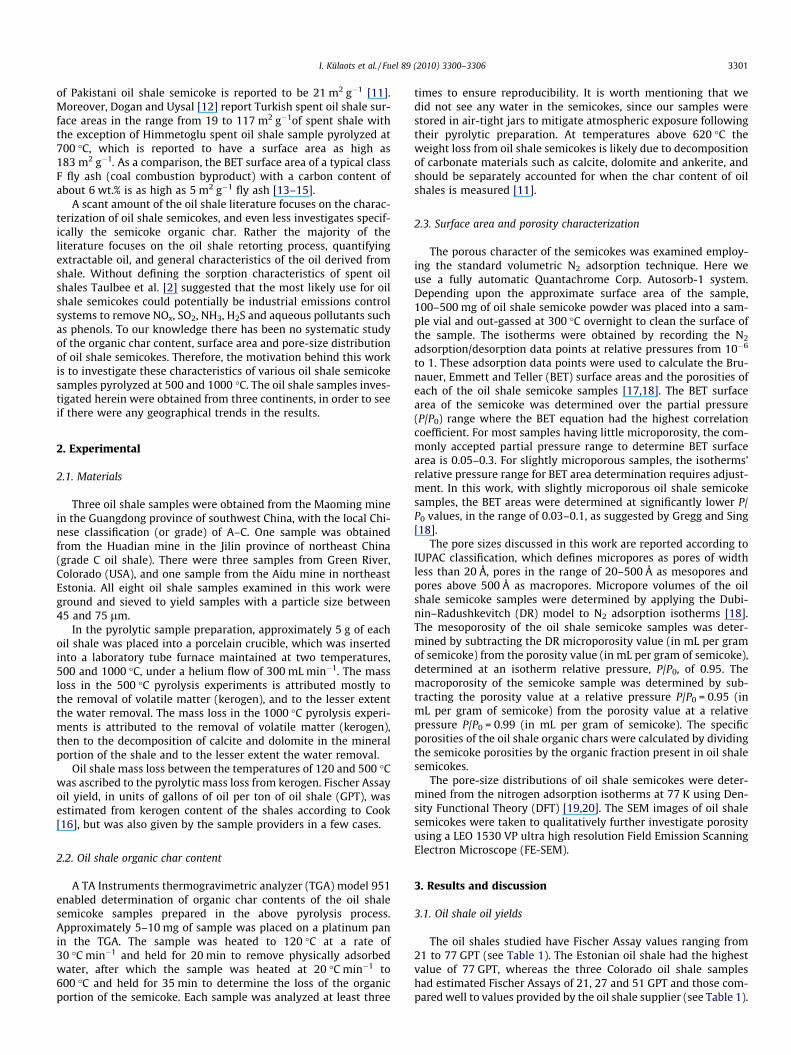
Fig. 2. Oil shale semicoke BET surface areas vs their organic char content forsamples pyrolyzed at 500 �C and 1000 �C. j: Pyrolyzed at 500 �C; .: Pyrolyzed a1000 �C.
Fig. 3. SEM images of Estonian oil shale semicoke mineral matter after oxidation at750 �C for 2 h (A), and class F coal fly ash mineral matter after oxidation at 750 �Cfor 2 h (B).
I. Külaots et al. / Fuel 89 (2010) 3300–3306 3303
without the isotherm normalization, it can be concluded that theadsorption capacity is significantly higher for the Estonian oil shalesemicoke sample pyrolyzed at 1000 �C, compared to the adsorptionuptake of the same oil shale semicoke pyrolyzed at 500 �C. The dif-ference of the slopes of both isotherms (semicoke pyrolyzed at 500and 1000 �C) is most prominent at a relative pressure range of 0.1–0.95, suggesting the presence of the wide range of mesopores in thesemicoke sample pyrolyzed at 1000 �C.
The BET surface areas of all oil shale semicokes ranged from 4.4to 57 m2 g�1 of semicoke, which is agreement with the resultsavailable in literature [11,12], except for the single Dogan and Uy-sal [12] reported 183 m2 g�1 of area value. Unfortunately Doganand Uysal [12] did not report what the organic char content of thisparticular 700 �C spent oil shale sample was, but it must have beenhigh to support such a high surface area per gram of semicoke.
Not surprisingly, there appears to be a clear correlation betweenthe BET surface areas of our oil shale semicokes and their organicchar contents, shown in Fig. 2. This is expected, as most surfacearea resides in the organic char of the oil shale semicoke.
The organic char contents, together with pure mineral BET sur-face area values of the oil shale semicokes, were used to calculatethe specific surface areas of the oil shale semicoke chars as summa-rized in Table 1. The BET surface areas of the pure mineral part ofthe oil shale semicokes were determined to be 2–5 m2 g�1, com-pared to that for a typical coal fly ash mineral surface area of0.8 m2 g�1 [14]. Specifically, the BET surface area of the mineralcontent of the Estonian oil shale was 3.5 m2 g�1, for the three Col-orado shales an average of 2.2 m2 g�1, and for the Chinese shalesthe BET mineral surface area was an average of 5.1 m2 g�1. Thehigher surface area of the oil shale mineral portion is believed tobe due to the particles’ morphologies, which are irregular andnot uniform, as are the minerals in the fly ash samples. The classF coal mineral ash contains mostly uniform glassy particles, whichhave undergone a melt phase in the boiler, since they have seentemperatures well above their fusion temperatures (well above1000 �C). The slightly different morphologies of the retorting semi-coke minerals and the fly ash minerals are clearly visible in theSEM micrographs of Fig. 3A and B.
t
The BET surface areas of the oil shale organic chars ranged from100 to 550 m2 g�1 (see Table 1), which is an order of magnitude
250
300
350
400
450
500
550
600
0.1 0.15 0.2 0.25 0.3
Sp
ecif
ic B
ET
su
rfac
e ar
ea
[ch
ar]
DR microposity [char]
[m2 g-1
]
[mL g-1]
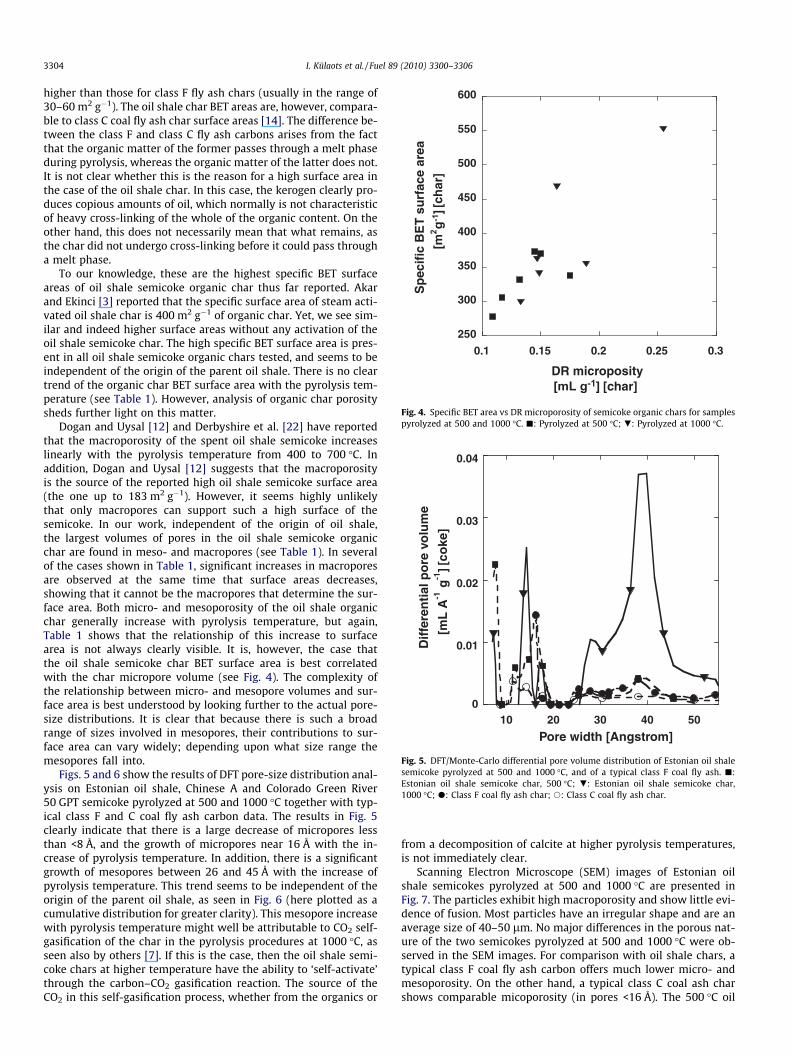
ig. 4. Specific BET area vs DR microporosity of semicoke organic chars for samplesyrolyzed at 500 and 1000 �C. j: Pyrolyzed at 500 �C; .: Pyrolyzed at 1000 �C.
0
0.01
0.02
0.03
0.04
10 20 30 40 50
Dif
fere
nti
al p
ore
vo
lum
e
[mL
A-1
g-1
]
Pore width [Angstrom]
[co
ke]
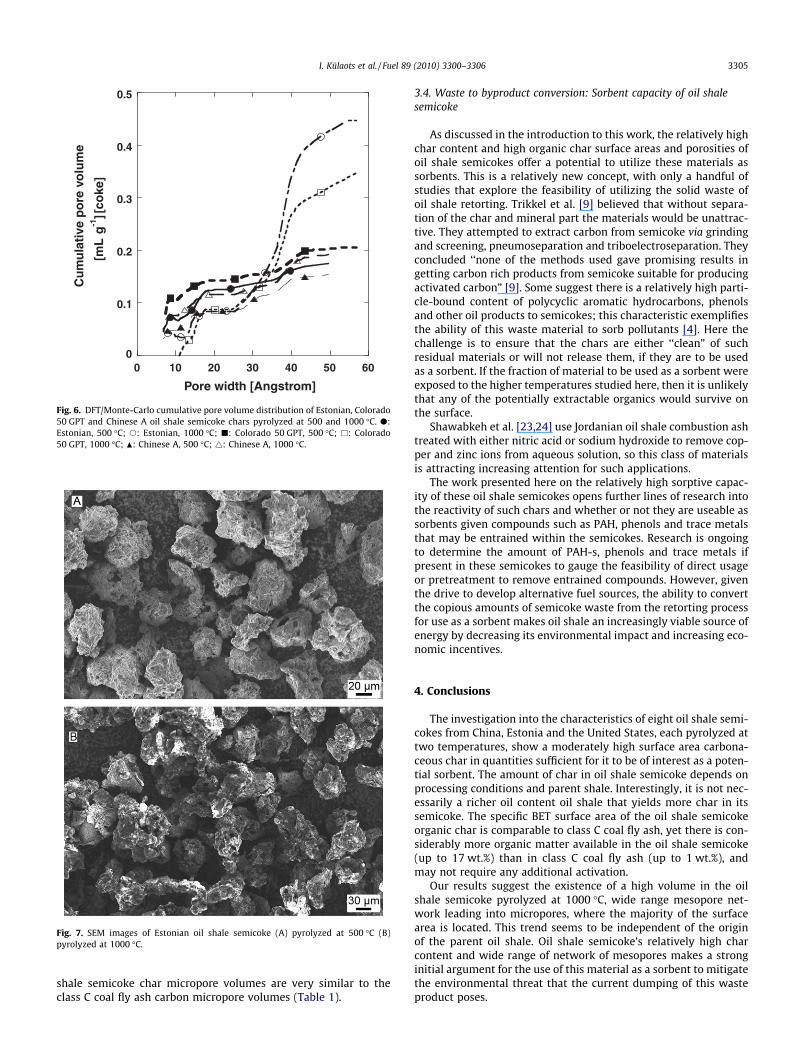
ig. 5. DFT/Monte-Carlo differential pore volume distribution of Estonian oil shalemicoke pyrolyzed at 500 and 1000 �C, and of a typical class F coal fly ash. j:
stonian oil shale semicoke char, 500 �C; .: Estonian oil shale semicoke char,000 �C; d: Class F coal fly ash char; s: Class C coal fly ash char.
3304 I. Külaots et al. / Fuel 89 (2010) 3300–3306
higher than those for class F fly ash chars (usually in the range of30–60 m2 g�1). The oil shale char BET areas are, however, compara-ble to class C coal fly ash char surface areas [14]. The difference be-tween the class F and class C fly ash carbons arises from the factthat the organic matter of the former passes through a melt phaseduring pyrolysis, whereas the organic matter of the latter does not.It is not clear whether this is the reason for a high surface area inthe case of the oil shale char. In this case, the kerogen clearly pro-duces copious amounts of oil, which normally is not characteristicof heavy cross-linking of the whole of the organic content. On theother hand, this does not necessarily mean that what remains, asthe char did not undergo cross-linking before it could pass througha melt phase.
To our knowledge, these are the highest specific BET surfaceareas of oil shale semicoke organic char thus far reported. Akarand Ekinci [3] reported that the specific surface area of steam acti-vated oil shale char is 400 m2 g�1 of organic char. Yet, we see sim-ilar and indeed higher surface areas without any activation of theoil shale semicoke char. The high specific BET surface area is pres-ent in all oil shale semicoke organic chars tested, and seems to beindependent of the origin of the parent oil shale. There is no cleartrend of the organic char BET surface area with the pyrolysis tem-perature (see Table 1). However, analysis of organic char porositysheds further light on this matter.
Dogan and Uysal [12] and Derbyshire et al. [22] have reportedthat the macroporosity of the spent oil shale semicoke increaseslinearly with the pyrolysis temperature from 400 to 700 �C. Inaddition, Dogan and Uysal [12] suggests that the macroporosityis the source of the reported high oil shale semicoke surface area(the one up to 183 m2 g�1). However, it seems highly unlikelythat only macropores can support such a high surface of thesemicoke. In our work, independent of the origin of oil shale,the largest volumes of pores in the oil shale semicoke organicchar are found in meso- and macropores (see Table 1). In severalof the cases shown in Table 1, significant increases in macroporesare observed at the same time that surface areas decreases,showing that it cannot be the macropores that determine the sur-face area. Both micro- and mesoporosity of the oil shale organicchar generally increase with pyrolysis temperature, but again,Table 1 shows that the relationship of this increase to surfacearea is not always clearly visible. It is, however, the case thatthe oil shale semicoke char BET surface area is best correlatedwith the char micropore volume (see Fig. 4). The complexity ofthe relationship between micro- and mesopore volumes and sur-face area is best understood by looking further to the actual pore-size distributions. It is clear that because there is such a broadrange of sizes involved in mesopores, their contributions to sur-face area can vary widely; depending upon what size range themesopores fall into.
Figs. 5 and 6 show the results of DFT pore-size distribution anal-ysis on Estonian oil shale, Chinese A and Colorado Green River50 GPT semicoke pyrolyzed at 500 and 1000 �C together with typ-ical class F and C coal fly ash carbon data. The results in Fig. 5clearly indicate that there is a large decrease of micropores lessthan <8 Å, and the growth of micropores near 16 Å with the in-crease of pyrolysis temperature. In addition, there is a significantgrowth of mesopores between 26 and 45 Å with the increase ofpyrolysis temperature. This trend seems to be independent of theorigin of the parent oil shale, as seen in Fig. 6 (here plotted as acumulative distribution for greater clarity). This mesopore increasewith pyrolysis temperature might well be attributable to CO2 self-gasification of the char in the pyrolysis procedures at 1000 �C, asseen also by others [7]. If this is the case, then the oil shale semi-coke chars at higher temperature have the ability to ‘self-activate’through the carbon–CO2 gasification reaction. The source of theCO2 in this self-gasification process, whether from the organics or
Fp
FseE1
from a decomposition of calcite at higher pyrolysis temperatures,is not immediately clear.
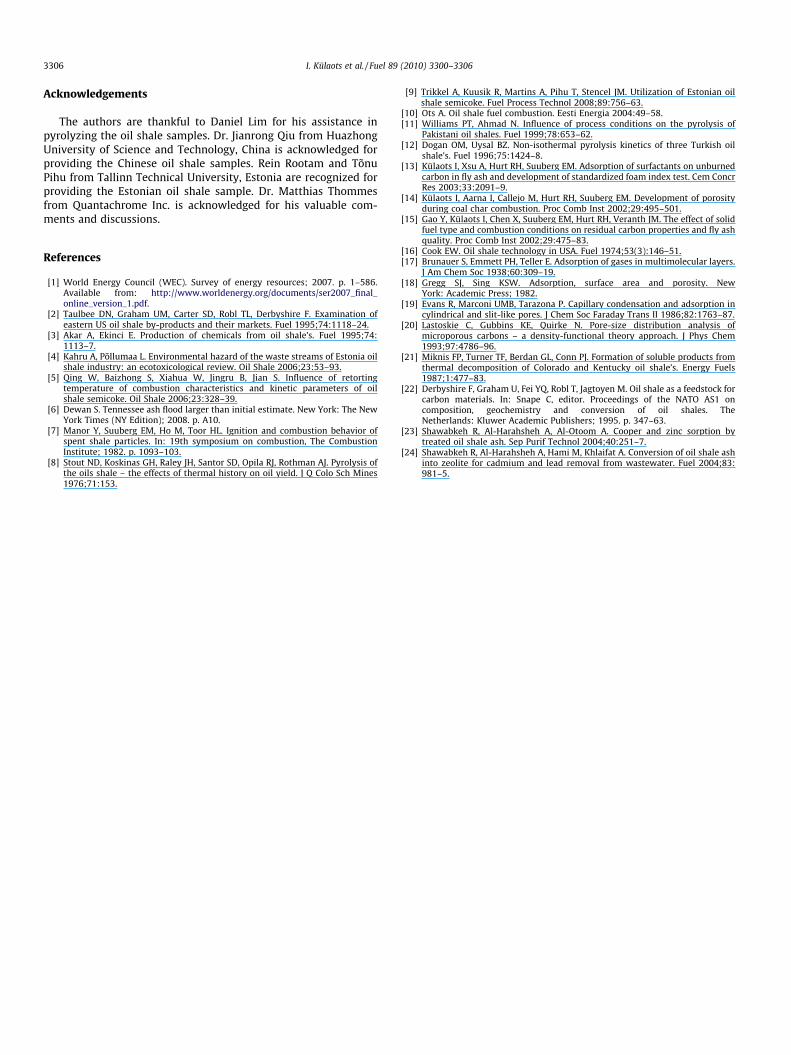
Scanning Electron Microscope (SEM) images of Estonian oilshale semicokes pyrolyzed at 500 and 1000 �C are presented inFig. 7. The particles exhibit high macroporosity and show little evi-dence of fusion. Most particles have an irregular shape and are anaverage size of 40–50 lm. No major differences in the porous nat-ure of the two semicokes pyrolyzed at 500 and 1000 �C were ob-served in the SEM images. For comparison with oil shale chars, atypical class F coal fly ash carbon offers much lower micro- andmesoporosity. On the other hand, a typical class C coal ash charshows comparable micoporosity (in pores <16 Å). The 500 �C oil
0
0.1
0.2
0.3
0.4
0.5
0 10 20 30 40 50 60
Cu
mu
lati
ve p
ore
vo
lum
e
[mL
g-1
]
Pore width [Angstrom]
[co
ke]
Fig. 6. DFT/Monte-Carlo cumulative pore volume distribution of Estonian, Colorado50 GPT and Chinese A oil shale semicoke chars pyrolyzed at 500 and 1000 �C. d:Estonian, 500 �C; s: Estonian, 1000 �C; j: Colorado 50 GPT, 500 �C; h: Colorado50 GPT, 1000 �C; N: Chinese A, 500 �C; 4: Chinese A, 1000 �C.
Fig. 7. SEM images of Estonian oil shale semicoke (A) pyrolyzed at 500 �C (B)pyrolyzed at 1000 �C.
I. Külaots et al. / Fuel 89 (2010) 3300–3306 3305
shale semicoke char micropore volumes are very similar to theclass C coal fly ash carbon micropore volumes (Table 1).
3.4. Waste to byproduct conversion: Sorbent capacity of oil shalesemicoke
As discussed in the introduction to this work, the relatively highchar content and high organic char surface areas and porosities ofoil shale semicokes offer a potential to utilize these materials assorbents. This is a relatively new concept, with only a handful ofstudies that explore the feasibility of utilizing the solid waste ofoil shale retorting. Trikkel et al. [9] believed that without separa-tion of the char and mineral part the materials would be unattrac-tive. They attempted to extract carbon from semicoke via grindingand screening, pneumoseparation and triboelectroseparation. Theyconcluded ‘‘none of the methods used gave promising results ingetting carbon rich products from semicoke suitable for producingactivated carbon” [9]. Some suggest there is a relatively high parti-cle-bound content of polycyclic aromatic hydrocarbons, phenolsand other oil products to semicokes; this characteristic exemplifiesthe ability of this waste material to sorb pollutants [4]. Here thechallenge is to ensure that the chars are either ‘‘clean” of suchresidual materials or will not release them, if they are to be usedas a sorbent. If the fraction of material to be used as a sorbent wereexposed to the higher temperatures studied here, then it is unlikelythat any of the potentially extractable organics would survive onthe surface.
Shawabkeh et al. [23,24] use Jordanian oil shale combustion ashtreated with either nitric acid or sodium hydroxide to remove cop-per and zinc ions from aqueous solution, so this class of materialsis attracting increasing attention for such applications.
The work presented here on the relatively high sorptive capac-ity of these oil shale semicokes opens further lines of research intothe reactivity of such chars and whether or not they are useable assorbents given compounds such as PAH, phenols and trace metalsthat may be entrained within the semicokes. Research is ongoingto determine the amount of PAH-s, phenols and trace metals ifpresent in these semicokes to gauge the feasibility of direct usageor pretreatment to remove entrained compounds. However, giventhe drive to develop alternative fuel sources, the ability to convertthe copious amounts of semicoke waste from the retorting processfor use as a sorbent makes oil shale an increasingly viable source ofenergy by decreasing its environmental impact and increasing eco-nomic incentives.
4. Conclusions
The investigation into the characteristics of eight oil shale semi-cokes from China, Estonia and the United States, each pyrolyzed attwo temperatures, show a moderately high surface area carbona-ceous char in quantities sufficient for it to be of interest as a poten-tial sorbent. The amount of char in oil shale semicoke depends onprocessing conditions and parent shale. Interestingly, it is not nec-essarily a richer oil content oil shale that yields more char in itssemicoke. The specific BET surface area of the oil shale semicokeorganic char is comparable to class C coal fly ash, yet there is con-siderably more organic matter available in the oil shale semicoke(up to 17 wt.%) than in class C coal fly ash (up to 1 wt.%), andmay not require any additional activation.
Our results suggest the existence of a high volume in the oilshale semicoke pyrolyzed at 1000 �C, wide range mesopore net-work leading into micropores, where the majority of the surfacearea is located. This trend seems to be independent of the originof the parent oil shale. Oil shale semicoke’s relatively high charcontent and wide range of network of mesopores makes a stronginitial argument for the use of this material as a sorbent to mitigatethe environmental threat that the current dumping of this wasteproduct poses.
3306 I. Külaots et al. / Fuel 89 (2010) 3300–3306
Acknowledgements
The authors are thankful to Daniel Lim for his assistance inpyrolyzing the oil shale samples. Dr. Jianrong Qiu from HuazhongUniversity of Science and Technology, China is acknowledged forproviding the Chinese oil shale samples. Rein Rootam and TõnuPihu from Tallinn Technical University, Estonia are recognized forproviding the Estonian oil shale sample. Dr. Matthias Thommesfrom Quantachrome Inc. is acknowledged for his valuable com-ments and discussions.
References
[1] World Energy Council (WEC). Survey of energy resources; 2007. p. 1–586.Available from: http://www.worldenergy.org/documents/ser2007_final_online_version_1.pdf.
[2] Taulbee DN, Graham UM, Carter SD, Robl TL, Derbyshire F. Examination ofeastern US oil shale by-products and their markets. Fuel 1995;74:1118–24.
[3] Akar A, Ekinci E. Production of chemicals from oil shale’s. Fuel 1995;74:1113–7.
[4] Kahru A, Põllumaa L. Environmental hazard of the waste streams of Estonia oilshale industry: an ecotoxicological review. Oil Shale 2006;23:53–93.
[5] Qing W, Baizhong S, Xiahua W, Jingru B, Jian S. Influence of retortingtemperature of combustion characteristics and kinetic parameters of oilshale semicoke. Oil Shale 2006;23:328–39.
[6] Dewan S. Tennessee ash flood larger than initial estimate. New York: The NewYork Times (NY Edition); 2008. p. A10.
[7] Manor Y, Suuberg EM, Ho M, Toor HL. Ignition and combustion behavior ofspent shale particles. In: 19th symposium on combustion, The CombustionInstitute; 1982. p. 1093–103.
[8] Stout ND, Koskinas GH, Raley JH, Santor SD, Opila RJ, Rothman AJ. Pyrolysis ofthe oils shale – the effects of thermal history on oil yield. J Q Colo Sch Mines1976;71:153.
[9] Trikkel A, Kuusik R, Martins A, Pihu T, Stencel JM. Utilization of Estonian oilshale semicoke. Fuel Process Technol 2008;89:756–63.
[10] Ots A. Oil shale fuel combustion. Eesti Energia 2004:49–58.[11] Williams PT, Ahmad N. Influence of process conditions on the pyrolysis of
Pakistani oil shales. Fuel 1999;78:653–62.[12] Dogan OM, Uysal BZ. Non-isothermal pyrolysis kinetics of three Turkish oil
shale’s. Fuel 1996;75:1424–8.[13] Külaots I, Xsu A, Hurt RH, Suuberg EM. Adsorption of surfactants on unburned
carbon in fly ash and development of standardized foam index test. Cem ConcrRes 2003;33:2091–9.
[14] Külaots I, Aarna I, Callejo M, Hurt RH, Suuberg EM. Development of porosityduring coal char combustion. Proc Comb Inst 2002;29:495–501.
[15] Gao Y, Külaots I, Chen X, Suuberg EM, Hurt RH, Veranth JM. The effect of solidfuel type and combustion conditions on residual carbon properties and fly ashquality. Proc Comb Inst 2002;29:475–83.
[16] Cook EW. Oil shale technology in USA. Fuel 1974;53(3):146–51.[17] Brunauer S, Emmett PH, Teller E. Adsorption of gases in multimolecular layers.
J Am Chem Soc 1938;60:309–19.[18] Gregg SJ, Sing KSW. Adsorption, surface area and porosity. New
York: Academic Press; 1982.[19] Evans R, Marconi UMB, Tarazona P. Capillary condensation and adsorption in
cylindrical and slit-like pores. J Chem Soc Faraday Trans II 1986;82:1763–87.[20] Lastoskie C, Gubbins KE, Quirke N. Pore-size distribution analysis of
microporous carbons – a density-functional theory approach. J Phys Chem1993;97:4786–96.
[21] Miknis FP, Turner TF, Berdan GL, Conn PJ. Formation of soluble products fromthermal decomposition of Colorado and Kentucky oil shale’s. Energy Fuels1987;1:477–83.
[22] Derbyshire F, Graham U, Fei YQ, Robl T, Jagtoyen M. Oil shale as a feedstock forcarbon materials. In: Snape C, editor. Proceedings of the NATO AS1 oncomposition, geochemistry and conversion of oil shales. TheNetherlands: Kluwer Academic Publishers; 1995. p. 347–63.
[23] Shawabkeh R, Al-Harahsheh A, Al-Otoom A. Cooper and zinc sorption bytreated oil shale ash. Sep Purif Technol 2004;40:251–7.
[24] Shawabkeh R, Al-Harahsheh A, Hami M, Khlaifat A. Conversion of oil shale ashinto zeolite for cadmium and lead removal from wastewater. Fuel 2004;83:981–5.
Related Documents