Characteristics of the 1997/1998 El Nin ˜ o cloud distributions from SAGE II observations Pi-Huan Wang, 1 Patrick Minnis, 2 Bruce A. Wielicki, 2 Takmeng Wong, 2 Robert D. Cess, 3 Minghua Zhang, 3 Lelia B. Vann, 2 and Geoffrey S. Kent 1 Received 5 January 2002; revised 22 July 2002; accepted 4 August 2002; published 8 January 2003. [1] The present study examines the characteristics of cloud distributions with emphasis on cloud longwave radiative forcing (CLRF) during the peak of the 1997/1998 El Nin ˜o in relation to climatological conditions, based on measurements from the Stratospheric Aerosol and Gas Experiment (SAGE) II. The observed distinct cloud occurrence and CLRF during this unusual 1997/1998 El Nin ˜o constitutes a unique data set for validating and improving cloud-radiation-climate interactions in general circulation and climate models. Using the solar occultation technique, the SAGE II satellite instrument is capable of providing measurements with a 1-km vertical resolution facilitating the analysis with sufficient vertical as well as near global scale (70°S–70°N) details. The present study indicates (1) above normal high-altitude opaque cloud occurrence over the eastern tropical Pacific and an opposite situation over the Pacific warm pool, leading to a distribution of the cumulative opaque cloud anomalies above 3 km generally consistent with the pattern of observed tropical sea surface temperature and precipitation anomalies; (2) a similar behavior in the subvisual cloud distributions near the tropical tropopause; (3) a zonally averaged cloud distribution that is characterized by reduced opaque clouds at low latitudes, except in the southern tropics below 10 km, and by enhanced opaque clouds at high latitudes, along with increased subvisual clouds in the southern tropics and decreased subvisual clouds in the northern subtropics in the upper troposphere; and (4) a geographic distribution of model-calculated CLRF anomalies that resembles closely that inferred from the Earth Radiation Budget Experiment and the Clouds and the Earth’s Radiant Energy System. A discussion on the influence of the El Nin ˜o on large-scale mean tropospheric circulations is also provided. INDEX TERMS: 0320 Atmospheric Composition and Structure: Cloud physics and chemistry; 1630 Global Change: Impact phenomena; 3309 Meteorology and Atmospheric Dynamics: Climatology (1620); 3319 Meteorology and Atmospheric Dynamics: General circulation; 3359 Meteorology and Atmospheric Dynamics: Radiative processes; KEYWORDS: El Nin ˜o, clouds, climate, remote sensing Citation: Wang, P.-H., P. Minnis, B. A. Wielicki, T. Wong, R. D. Cess, M. Zhang, L. B. Vann, and G. S. Kent, Characteristics of the 1997/1998 El Nin ˜o cloud distributions from SAGE II observations, J. Geophys. Res., 108(D1), 4009, doi:10.1029/2002JD002501, 2003. 1. Introduction [2] El Nin ˜os are known for leading to severe weather anomalies on a global scale [e.g., Peng and Van den Dool, 1998]. The 1997/1998 El Nin ˜o was perhaps the most intense one on record [Kousky , 1998; Bell et al., 1999]. Its scale and strength caught the scientific community by surprise. Studies based on sea surface temperatures (SST) suggest that the period March –May 1997 can be regarded as the onset phase of the 1997/1998 El Nin ˜o, with a mature phase between June 1997 and April 1998 and a decay phase during May–June 1998 [e.g., Kousky , 1998]. Although forecast models had some success in predicting an El Nin ˜o for 1997/1998, the predicted event was much weaker and later than was actually observed [McPhaden, 1998]. The El Nin ˜o was so intense that it produced a mean tropical clear- sky outgoing longwave radiation (OLR) enhancement of 2 W/m 2 in early 1998 [Wong et al., 2000], and an even larger all-sky increase of 6 to 8 W/m 2 in early 1998 [Wang et al., 2002; Wielicki et al., 2002]. This increase in OLR is accompanied by an increase of about 1°C in the mean tropical tropospheric temperature, the largest mean temper- ature enhancement of three El Nin ˜ os in the 1980s and 1990s [Wang et al., 2002]. [3] A recent study, using upwelling shortwave and long- wave radiation measurements over the Pacific warm pool from the satellite instruments of the Earth Radiation Budget Experiment (ERBE) and the Clouds and the Earth’s Radiant JOURNAL OF GEOPHYSICAL RESEARCH, VOL. 108, NO. D1, 4009, doi:10.1029/2002JD002501, 2003 1 Science and Technology Corporation, Hampton, Virginia, USA. 2 Atmospheric Sciences Competency, NASA Langley Research Center, Hampton, Virginia, USA. 3 Marine Sciences Research Center, State University of New York, Stony Brook, Stony Brook, New York, USA. Copyright 2003 by the American Geophysical Union. 0148-0227/03/2002JD002501$09.00 AAC 5 - 1

Welcome message from author
This document is posted to help you gain knowledge. Please leave a comment to let me know what you think about it! Share it to your friends and learn new things together.
Transcript
Characteristics of the 1997/1998 El Nino cloud distributions
from SAGE II observations
Pi-Huan Wang,1 Patrick Minnis,2 Bruce A. Wielicki,2 Takmeng Wong,2 Robert D. Cess,3
Minghua Zhang,3 Lelia B. Vann,2 and Geoffrey S. Kent1
Received 5 January 2002; revised 22 July 2002; accepted 4 August 2002; published 8 January 2003.
[1] The present study examines the characteristics of cloud distributions with emphasis oncloud longwave radiative forcing (CLRF) during the peak of the 1997/1998 El Nino inrelation to climatological conditions, based on measurements from the StratosphericAerosol and Gas Experiment (SAGE) II. The observed distinct cloud occurrence andCLRF during this unusual 1997/1998 El Nino constitutes a unique data set for validatingand improving cloud-radiation-climate interactions in general circulation and climatemodels. Using the solar occultation technique, the SAGE II satellite instrument is capableof providing measurements with a 1-km vertical resolution facilitating the analysis withsufficient vertical as well as near global scale (70�S–70�N) details. The present studyindicates (1) above normal high-altitude opaque cloud occurrence over the eastern tropicalPacific and an opposite situation over the Pacific warm pool, leading to a distributionof the cumulative opaque cloud anomalies above 3 km generally consistent with thepattern of observed tropical sea surface temperature and precipitation anomalies; (2) asimilar behavior in the subvisual cloud distributions near the tropical tropopause; (3) azonally averaged cloud distribution that is characterized by reduced opaque clouds at lowlatitudes, except in the southern tropics below 10 km, and by enhanced opaque cloudsat high latitudes, along with increased subvisual clouds in the southern tropics anddecreased subvisual clouds in the northern subtropics in the upper troposphere; and (4) ageographic distribution of model-calculated CLRF anomalies that resembles closely thatinferred from the Earth Radiation Budget Experiment and the Clouds and the Earth’sRadiant Energy System. A discussion on the influence of the El Nino on large-scale meantropospheric circulations is also provided. INDEX TERMS: 0320 Atmospheric Composition and
Structure: Cloud physics and chemistry; 1630 Global Change: Impact phenomena; 3309 Meteorology and
Atmospheric Dynamics: Climatology (1620); 3319 Meteorology and Atmospheric Dynamics: General
circulation; 3359 Meteorology and Atmospheric Dynamics: Radiative processes; KEYWORDS: El Nino, clouds,
climate, remote sensing
Citation: Wang, P.-H., P. Minnis, B. A. Wielicki, T. Wong, R. D. Cess, M. Zhang, L. B. Vann, and G. S. Kent, Characteristics of the
1997/1998 El Nino cloud distributions from SAGE II observations, J. Geophys. Res., 108(D1), 4009, doi:10.1029/2002JD002501,
2003.
1. Introduction
[2] El Ninos are known for leading to severe weatheranomalies on a global scale [e.g., Peng and Van den Dool,1998]. The 1997/1998 El Nino was perhaps the mostintense one on record [Kousky, 1998; Bell et al., 1999].Its scale and strength caught the scientific community bysurprise. Studies based on sea surface temperatures (SST)suggest that the period March–May 1997 can be regardedas the onset phase of the 1997/1998 El Nino, with a mature
phase between June 1997 and April 1998 and a decay phaseduring May–June 1998 [e.g., Kousky, 1998]. Althoughforecast models had some success in predicting an El Ninofor 1997/1998, the predicted event was much weaker andlater than was actually observed [McPhaden, 1998]. The ElNino was so intense that it produced a mean tropical clear-sky outgoing longwave radiation (OLR) enhancement of 2W/m2 in early 1998 [Wong et al., 2000], and an even largerall-sky increase of 6 to 8 W/m2 in early 1998 [Wang et al.,2002; Wielicki et al., 2002]. This increase in OLR isaccompanied by an increase of about 1�C in the meantropical tropospheric temperature, the largest mean temper-ature enhancement of three El Ninos in the 1980s and 1990s[Wang et al., 2002].[3] A recent study, using upwelling shortwave and long-
wave radiation measurements over the Pacific warm poolfrom the satellite instruments of the Earth Radiation BudgetExperiment (ERBE) and the Clouds and the Earth’s Radiant
JOURNAL OF GEOPHYSICAL RESEARCH, VOL. 108, NO. D1, 4009, doi:10.1029/2002JD002501, 2003
1Science and Technology Corporation, Hampton, Virginia, USA.2Atmospheric Sciences Competency, NASA Langley Research Center,
Hampton, Virginia, USA.3Marine Sciences Research Center, State University of New York,
Stony Brook, Stony Brook, New York, USA.
Copyright 2003 by the American Geophysical Union.0148-0227/03/2002JD002501$09.00
AAC 5 - 1
Energy System (CERES) suggests a drastically perturbedcloud vertical distribution, with much reduced high-altitudeclouds, during the 1997/98 El Nino [Cess et al., 2001a].Such a perturbed cloud vertical structure was most recentlyconfirmed by cloud distributions derived from the Strato-spheric Aerosol and Gas Experiment (SAGE) II data [Cesset al., 2001b]. In addition, an opposite behavior of the cloudvertical structure over the Eastern Pacific was also revealedby the SAGE II cloud observations, consistent with aseverely altered Walker circulation in the tropics [Bell etal., 1999; Cess et al., 2001b] during the 1997/1998 El Nino.[4] Both SAGE II and ERBE are on board the Earth
Radiation Budget Satellite (ERBS). While the ERBE instru-ment monitors the Earth radiation balance [Barkstrom,1984], the SAGE II sensor measures the properties ofaerosols and gaseous species, including O3, H2O, andNO2, important for understanding and interpreting atmos-pheric radiative properties [McCormick, 1987]. Because ofthe microphysical relationship between aerosols and clouds,the SAGE II tropospheric observations also contain samplesof cloud extinction coefficients at 0.525 and 1.02 mm [Kentet al., 1993; Wang et al., 1994, 1998a]. Furthermore, it isunderstood that the presence of optically thick clouds alongthe tangential viewing path of the SAGE II instrumentterminates the solar occultation profile measurement[McCormick et al., 1979]. Therefore, the SAGE II obser-vations provide information on opaque cloud occurrence inaddition to optically thin clouds [Wang et al., 1995b].[5] While opaque clouds, particularly those associated
with deep convection, strongly influence the Earth radiationbudget [e.g., Cess et al., 2001b] and vertical distributions oftropospheric chemical species, [e.g., Wang et al., 1995a],the persistent presence of optically thin clouds can also havemore subtle effects on atmospheric processes. They couldaffect both ozone concentration through heterogeneouschemical reactions in the tropopause region [Solomon etal., 1997; Bregman et al., 2002] and the water vapor budgetin the lower stratosphere [SPARC, 2000], and can have aminor impact on the Earth radiation budget [Wang et al.,1996]. Furthermore, previous studies indicate that theSAGE II 1.02-mm tropospheric measurement statisticsreveal general geographic variations of cloud occurrencewith distinct features related to tropospheric circulationsincluding the Hadley cell and the Walker circulation [Wang,1994; Wang et al., 1995b]. Based on the intimate relation-ship between opaque cloud occurrence and large-scaleconvective circulation, a method has been developed fordiagnosis of tropospheric mean meridional circulation basedon the zonal mean distribution of the SAGE II troposphericmeasurement frequency [Wang et al., 1998b].[6] The objectives of the present study are (1) to explore
the characteristics of cloud distributions, including bothoptically thin and opaque clouds, and the large-scale meantropospheric circulations for the 1997/1998 El Nino period,using SAGE II observations; and (2) to quantitatively assessthe connection between the cloud and outgoing longwaveradiation anomalies during the 1997/1998 El Nino toimprove the understanding of the cloud-radiation interac-tions. The analyses of the SAGE II cloud observations andthe large-scale circulation for the 1997/98 El Nino arepresented in section 2, followed by an investigation of thecloud-radiation interactions in terms of cloud longwave
radiative forcing (CLRF) for the El Nino in section 3. Theconclusions of the present study and remarks are providedin section 4.
2. Cloud Data and Analysis
[7] The SAGE II 0.525- and 1.02-mm data have beenanalyzed to provide mean vertical profiles of cloud occur-rence at a seasonal time scale [Kent et al., 1993;Wang et al.,2001]. The SAGE II observations contain two generalgroups of clouds, namely, opaque clouds (OC) and subvi-sual clouds (SVC). They are separated at a vertical opticaldepth of about 0.025 at 1.02-mm wavelength. According tothe cirrus cloud classification of Sassen and Cho [1992], theSAGE II opaque clouds generally include all types ofclouds, except optically thin subvisual clouds [Wang etal., 1996]. A two-wavelength method has been developedby Kent et al. [1993] for identifying subvisual cloud datafrom SAGE II measurements. Wang et al. [1995b] devel-oped a method for inferring the vertical distribution ofoptically thick clouds based on SAGE II 1.02-mm observa-tions. This method has been further reviewed in detail byWang et al. [2001].[8] The present analysis for the 1997/98 El Nino uses the
cumulative opaque cloud (COC) occurrence above a givenaltitude, as in the study of Cess et al. [2001b]. In addition,variations in the occurrence of SVCs are also investigated.The COC is a ratio of the difference between the totalnumber of SAGE II overpasses and the number of thesample events that reached a given altitude over a specifiedgeographic area to the total number of overpasses over thesame region [Wang et al., 2001]. The difference between thetotal number of overpasses and the frequency of the sampleevents at a given altitude is essentially the number of SAGEII observations that were terminated by the presence ofopaque clouds above the given altitude. Thus, the sum ofthe cumulative cloud probability and the SAGE II measure-ment probability at a given altitude is unity [Wang et al.,2001]. In the case of SVC, the frequency is determined as aratio of the number of SVCs identified in a given SAGE II1-km layer to the sample size at the layer of interest.[9] In the following cloud anomaly analysis, the 1997/
1998 El Nino measurements are compared with the 1985–1991 climatology as in the study of Cess et al. [2001b]. Toenhance the presentation of the geographic dependence ofthe El Nino impact, the zonally averaged cloud occurrencefrequency at a given latitude for a given altitude is removedfrom the 1997/1998 El Nino and climatological data sets inthe analysis of longitude-latitude and longitude-altitudecloud anomaly distributions. Note, the difference in thedata time frame between the 1997/1998 El Nino and theclimatology is about 10 years. Wang et al. [2002] demon-strated the occurrence of decadal-scale changes in cloudfrequency and OLR in the Tropics between 1985 and 1998[see also Wielicki et al., 2002]. Thus, the decadal changes incloud occurrence would influence the El Nino anomalyanalysis if they are not removed. To separate the decadalcomponent and the El Nino changes completely is notstraightforward. It is noted that the atmospheric responseto El Nino sea surface temperature (SST) changes over theeastern Pacific is expected to be highly longitudinallydependent, while the decadal component of variation is
AAC 5 - 2 WANG ET AL.: EL NINO 1997/1998 CLOUD PROPERTIES
likely to be manifest in larger-scale features. Thus, it ispossible to remove the decadal component of changes fromthe data analysis, to a large extent, by subtracting thecorresponding zonally averaged cloud occurrence frequency(at a given altitude and a given latitude) from the respectiveSAGE II data sets.[10] The SAGE II cloud count is equivalent to a binomial
experiment with the cloud frequency as the binomial param-eter [Wang et al., 2001]. The associated uncertainty of thederived frequency is estimated by using the method ofMendenhall and Scheaffer [1973]. Geographic areas withan anomaly greater than the associated standard error esti-mation according to Johnson and Bhattacharyya [1992] areindicated by using a color graphic scheme in the presentinvestigation.
2.1. Equatorial Cloud Distribution
[11] The study of Cess et al. [2001b] showed that, duringthe 1997/1998 El Nino, significant reductions in high-
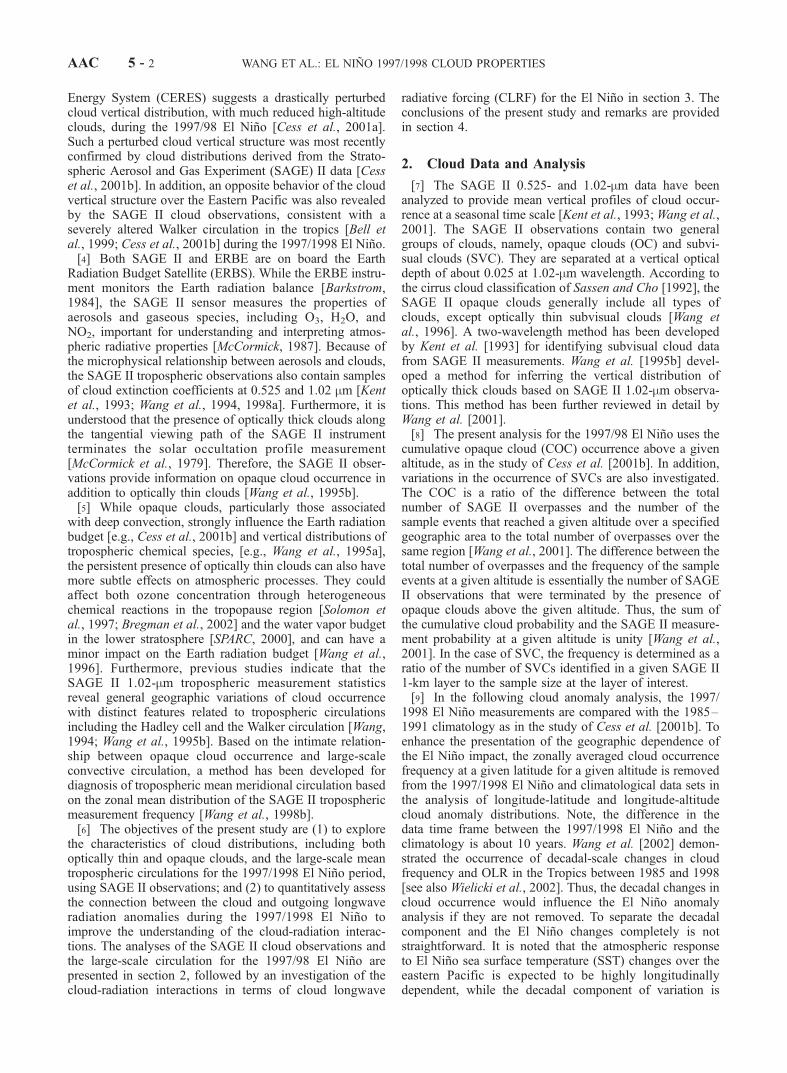
Figure 1. Time series record of the cumulative opaquecloud for the 5 months between December and April(DJFMA) over the Pacific warm pool and the easternPacific.
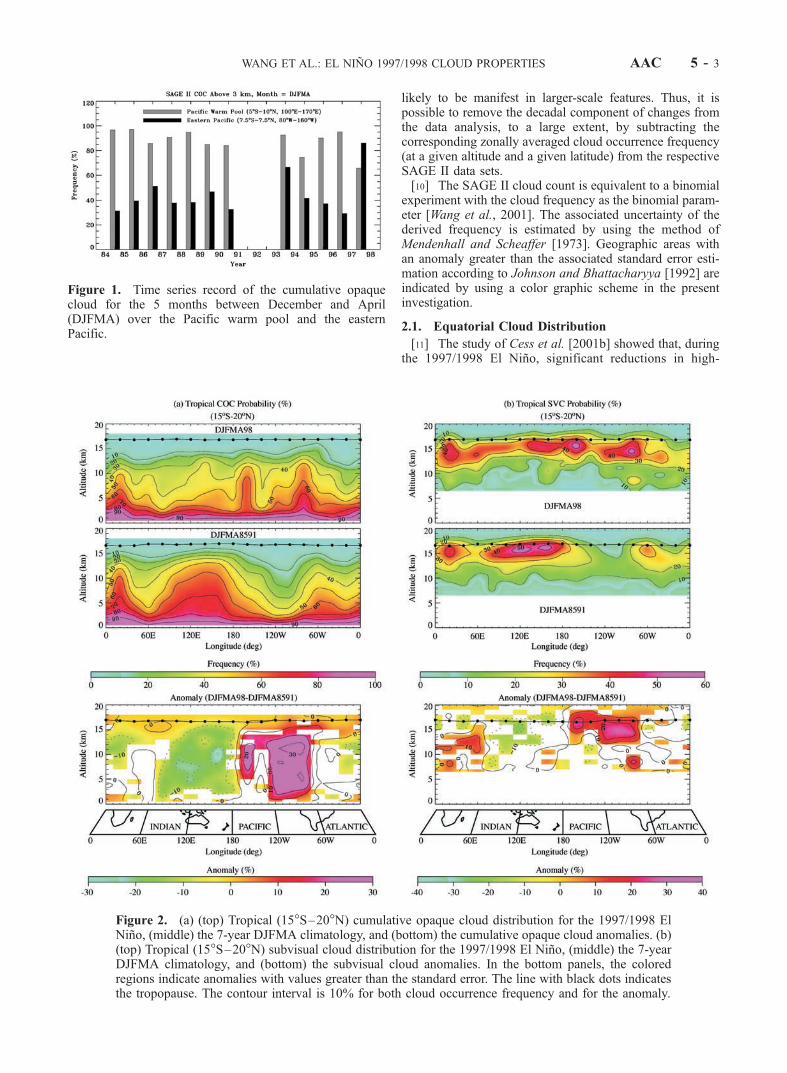
Figure 2. (a) (top) Tropical (15�S–20�N) cumulative opaque cloud distribution for the 1997/1998 ElNino, (middle) the 7-year DJFMA climatology, and (bottom) the cumulative opaque cloud anomalies. (b)(top) Tropical (15�S–20�N) subvisual cloud distribution for the 1997/1998 El Nino, (middle) the 7-yearDJFMA climatology, and (bottom) the subvisual cloud anomalies. In the bottom panels, the coloredregions indicate anomalies with values greater than the standard error. The line with black dots indicatesthe tropopause. The contour interval is 10% for both cloud occurrence frequency and for the anomaly.
WANG ET AL.: EL NINO 1997/1998 CLOUD PROPERTIES AAC 5 - 3
altitude cloud occurrence over the Pacific warm pool (PWP)were coincident with dramatic enhancements of high-alti-tude clouds over the eastern Pacific (EP). To aid in theunderstanding of the impact of the 1997/1998 El Nino onthe tropical cloud behavior, we present the time record ofthe COC above 3 km over the PWP and EP in Figure 1. Thetime series were constructed by computing the frequency ofCOC above 3 km for December through April (DJFMA)between 1985 and 1998. These 5 months correspondroughly to the second half of the mature period of the1997/1998 El Nino. Because of the heavy aerosol loadingfrom the June 1991 Pinatubo (15.1�N, 120.4�E) volcaniceruption, no SAGE II data are available in the tropospherein 1992 and 1993. The time record indicates that the COCover the PWP is more frequent than that over the EPthroughout the data period with only one exception, 1998,indicating that the 1997/1998 event is unique.[12] Figure 2a shows the COC height-longitude distribu-
tion across the entire tropics for the 1997/98 El Nino(DJFMA98) and the 7-year (1985–1991) DJFMA climatol-ogy (DJFMA8591), along with the anomalies. The tropicalcloud distribution analysis is accomplished by using a dataresolution of 20� (latitude) by 1 km (altitude). The El NinoCOC distribution is quite different from the climatology.The normal broad areas of high clouds over the PWP andSouth America are supplanted during the El Nino by twodistinct high-cloud towers. In addition, the COC frequencybetween 0�E and 180�E during the El Nino is much lessthan that of the climatology, particularly over the PWP. Inthe rest of the tropical regions, the results exhibit enhancedcloud over the west coast of South America and near160�W. Particularly noteworthy is that most of the COCchanges occurred at altitudes above 6 km, especially overthe PWP, EP, and Africa. The analyses for SVC are shownin Figure 2b. Generally, the occurrence of SVC near thetropopause changed during the El Nino in a manner con-sistent with the tropical tropopause COC anomalies (Figure2a). This eastward shift of the tropical SVC occurrence isalso revealed in the measurement from the Halogen Occul-tation Experiment [Massie et al., 2000].[13] The pattern of the COC climatology in Figure 2a,
characterized by a broad ridge of the COC centered overIndonesia and by a trough of the COC centered near 110�W,is exactly the type of cloud distribution expected to resultfrom the Walker circulation, which features an upwellingbranch over Indonesia and a subsiding branch over theeastern Pacific [see also Wang et al., 1995b, 1998b]. Notethat the COC climatology also reveals two additional ridges,over western South America and Africa, and two additionaltroughs, over the western Indian Ocean and the westernAtlantic Ocean. Those equatorial ridges are known forregions of frequent deep convective activity. In contrast,during the El Nino, the tropical COC distributions revealthree ridges centered near the central Pacific, easternPacific, and Africa, reflecting a drastically different circu-lation pattern from the normal Walker cell [Bell et al., 1999;Cess et al., 2001b].[14] To allow further understanding of the altered equa-
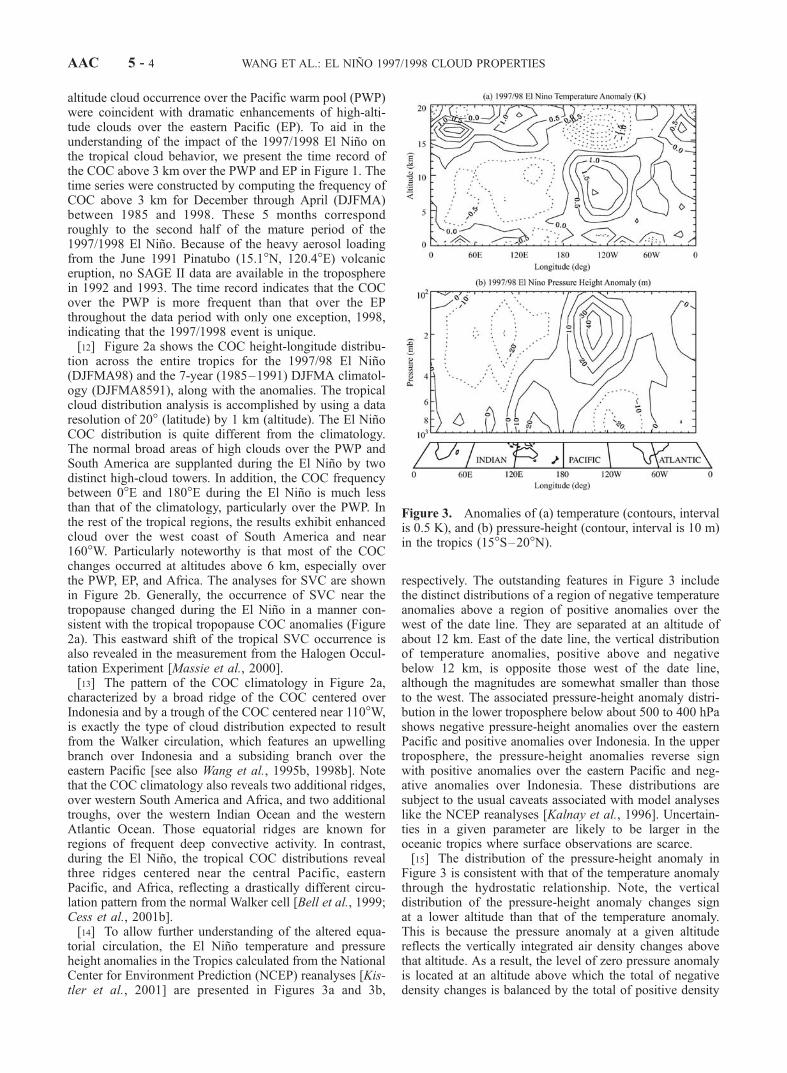
torial circulation, the El Nino temperature and pressureheight anomalies in the Tropics calculated from the NationalCenter for Environment Prediction (NCEP) reanalyses [Kis-tler et al., 2001] are presented in Figures 3a and 3b,
respectively. The outstanding features in Figure 3 includethe distinct distributions of a region of negative temperatureanomalies above a region of positive anomalies over thewest of the date line. They are separated at an altitude ofabout 12 km. East of the date line, the vertical distributionof temperature anomalies, positive above and negativebelow 12 km, is opposite those west of the date line,although the magnitudes are somewhat smaller than thoseto the west. The associated pressure-height anomaly distri-bution in the lower troposphere below about 500 to 400 hPashows negative pressure-height anomalies over the easternPacific and positive anomalies over Indonesia. In the uppertroposphere, the pressure-height anomalies reverse signwith positive anomalies over the eastern Pacific and neg-ative anomalies over Indonesia. These distributions aresubject to the usual caveats associated with model analyseslike the NCEP reanalyses [Kalnay et al., 1996]. Uncertain-ties in a given parameter are likely to be larger in theoceanic tropics where surface observations are scarce.[15] The distribution of the pressure-height anomaly in
Figure 3 is consistent with that of the temperature anomalythrough the hydrostatic relationship. Note, the verticaldistribution of the pressure-height anomaly changes signat a lower altitude than that of the temperature anomaly.This is because the pressure anomaly at a given altitudereflects the vertically integrated air density changes abovethat altitude. As a result, the level of zero pressure anomalyis located at an altitude above which the total of negativedensity changes is balanced by the total of positive density
Figure 3. Anomalies of (a) temperature (contours, intervalis 0.5 K), and (b) pressure-height (contour, interval is 10 m)in the tropics (15�S–20�N).
AAC 5 - 4 WANG ET AL.: EL NINO 1997/1998 CLOUD PROPERTIES
changes. The relationship between temperature, pressure,and density is governed by the ideal gas law, which isnonlinear. Generally, the negative temperature anomalywould induce negative density anomaly, leading to a sit-uation in which the vertical distribution of the pressureanomaly changes sign at a lower altitude than that of thetemperature anomaly. This pattern of pressure-heightanomalies shown in Figure 3 would induce a componentof reversed Walker circulation, leading to the observed cloudoccurrence anomalies (Figure 2a) during the 1997/1998 ElNino. Bell et al. [1999] and Cess et al. [2001b] provideadditional information on the altered Walker circulation.
2.2. Zonal Mean Features
2.2.1. COC and SVC[16] The zonal mean COC for the 1997/98 El Nino and
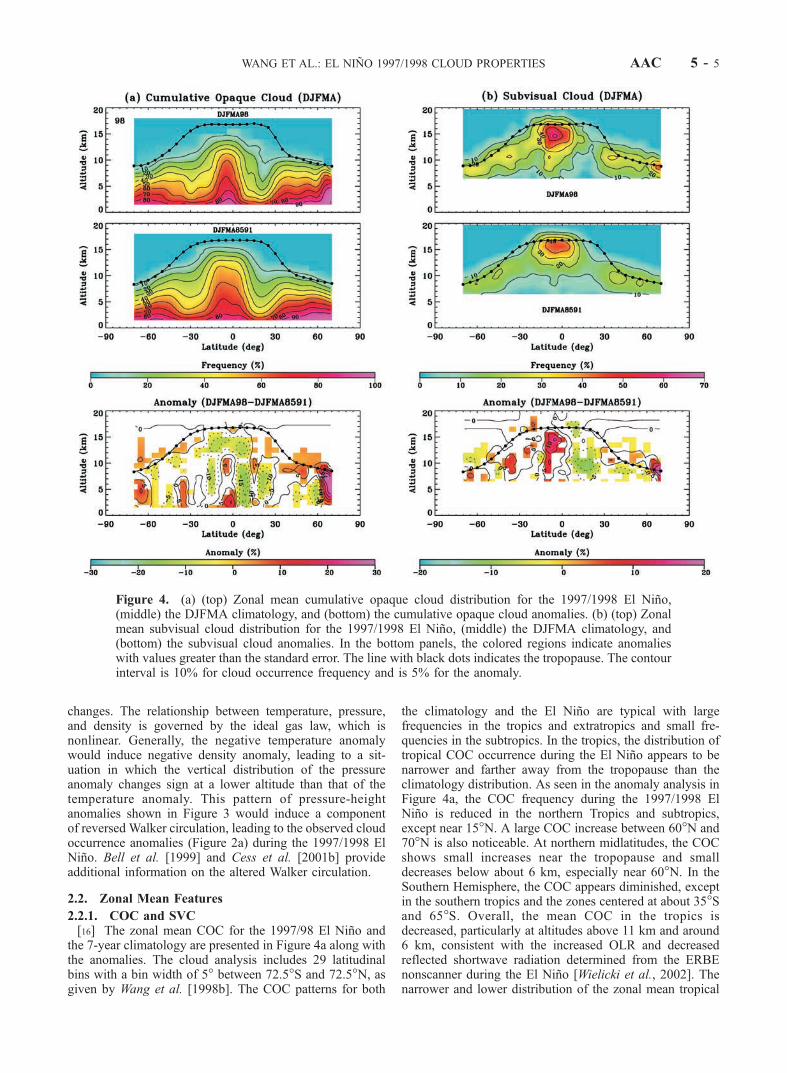
the 7-year climatology are presented in Figure 4a along withthe anomalies. The cloud analysis includes 29 latitudinalbins with a bin width of 5� between 72.5�S and 72.5�N, asgiven by Wang et al. [1998b]. The COC patterns for both
the climatology and the El Nino are typical with largefrequencies in the tropics and extratropics and small fre-quencies in the subtropics. In the tropics, the distribution oftropical COC occurrence during the El Nino appears to benarrower and farther away from the tropopause than theclimatology distribution. As seen in the anomaly analysis inFigure 4a, the COC frequency during the 1997/1998 ElNino is reduced in the northern Tropics and subtropics,except near 15�N. A large COC increase between 60�N and70�N is also noticeable. At northern midlatitudes, the COCshows small increases near the tropopause and smalldecreases below about 6 km, especially near 60�N. In theSouthern Hemisphere, the COC appears diminished, exceptin the southern tropics and the zones centered at about 35�Sand 65�S. Overall, the mean COC in the tropics isdecreased, particularly at altitudes above 11 km and around6 km, consistent with the increased OLR and decreasedreflected shortwave radiation determined from the ERBEnonscanner during the El Nino [Wielicki et al., 2002]. Thenarrower and lower distribution of the zonal mean tropical
Figure 4. (a) (top) Zonal mean cumulative opaque cloud distribution for the 1997/1998 El Nino,(middle) the DJFMA climatology, and (bottom) the cumulative opaque cloud anomalies. (b) (top) Zonalmean subvisual cloud distribution for the 1997/1998 El Nino, (middle) the DJFMA climatology, and(bottom) the subvisual cloud anomalies. In the bottom panels, the colored regions indicate anomalieswith values greater than the standard error. The line with black dots indicates the tropopause. The contourinterval is 10% for cloud occurrence frequency and is 5% for the anomaly.
WANG ET AL.: EL NINO 1997/1998 CLOUD PROPERTIES AAC 5 - 5

COC during the 1997/1998 El Nino relative to that of theclimatology is very interesting. Because the area of sub-sidence associated with tropical deep convections is greaterthan that of ascending motion, the greatly intensified con-vective activities over the EP during the El Nino could bethe reason for the apparent downward shift of the zonallyaveraged COC at high altitudes in tropics [see also Wang etal., 2002].[17] The corresponding zonal mean SVC analysis is
presented in Figure 4b. The SVC increased over the tropics,with the center slightly shifted toward the Southern Hemi-sphere, and diminished over the northern subtropics andincreased near the tropopause at northern high latitudes. Inthe Southern Hemisphere, the SVC exhibits enhancementsequatorward of 45�S in the upper troposphere. Small SVCreductions are also evident just above the tropopause atsouthern high latitudes.
2.2.2. Tropospheric Meridional Circulation[18] As cloud vertical variations can serve as a proxy of
convective activities, Wang et al. [1998b] developed asimple and robust model for diagnosis of the troposphericmean meridional circulation based on zonal mean opaquecloud distributions derived from the SAGE II observations.Briefly, the model assumes that, at a given altitude, the localzonal mean vertical velocity w (z, q) is a linear function ofthe local departure of the COC occurrence frequency, �f (z,q), from the corresponding global mean, i.e.,
wðz; qÞ ¼ k�f ðz; qÞ ð1Þ
where z is the altitude, q indicates the latitude, and k is aproportional constant. As we can see, the proportionalconstant k relates the vertical velocity distribution to thecloud field. In practice, the coefficient k serves as acalibration coefficient in an experimental sense. A value of8.3� 10�5m/s [Wang et al., 1998b] was determined based ona combination of the vertical circulation climatologies ofSchubert et al. [1990], Peixoto and Oort [1992], andTrenberth [1992]. The continuity equation is then used toinfer the meridional velocity field from the vertical circula-tion. The seasonal variations of the derived model circulationhave been shown to be very consistent with the SAGE IItropospheric ozone and aerosol 1.02-mm measurements. Thereaders are referred toWang et al. [1998b] for a more detailedpresentation of the mean meridional circulation model.[19] The derived mean meridional circulation for both the
1997/98 El Nino and the corresponding climatology arepresented in Figure 5. Shown also in Figure 5 is thedistribution of the mean circulation difference (vector windanomaly) between the El Nino and the climatology, keepingin mind that the mean circulation difference involveschanges in flow direction as well as flow speed. Thecirculation pattern during the 1997/1998 El Nino differsfrom that of the climatology in many respects. In the Tropics,the ascending branch of the Hadley cell during the El Nino isnarrower and stronger than that of the climatology. A derivedmean vertical velocity of 32 � 10�4 m/s during the peak ofthe El Nino is located at an altitude of 9 km near 5�S, whichis about a 20% increase over that of the normal year. In theNorthern Hemisphere (NH), the indirect circulation cellduring the El Nino is intensified with a much wider latitu-
dinal extension than that of the climatology. It stretches fromthe subtropical region to high latitudes, and appears to pushthe polar direct thermal cell closer to the pole. In addition,during the 1997/1998 El Nino, the northern Hadley cellappears to expand further to the north near the tropopauseand shows less vertical extension of the tropical ascendingbranch than that of the climatology. Comparatively, theHadley cell in the Southern Hemisphere (SH) during theEl Nino appears to be diminished slightly, except the pole-ward branch of the circulation. A poleward stretch of the SHindirect circulation cell is also noticeable. Overall, the meancirculation difference distribution is consistent with thelatitude-altitude distribution of COC anomalies shown inFigure 4a, as expected.[20] It should be noted that the midlatitude troposphere
experienced a series of pronounced anomalies on a monthlyto seasonal time scale during the 1997/1998 El Nino period[Bell et al., 1999]. Furthermore, the response of the atmos-phere to the 1997/1998 El Nino is hemispherically asym-metric, as discussed by Peng and Van den Dool [1998], whoshowed that the tropical forcing plays a major role ingenerating the midlatitude circulation anomalies mainlyduring winter months. Note, the feature in Figure 5 repre-sents the zonally averaged circulation system. Because theatmospheric response to the El Nino sea surface temperature
Figure 5. Tropospheric mean meridional circulation for(a) the 1997/1998 El Nino, and (b) the DJFMA climatology.(c) Mean circulation difference (DJFMA98 - DJFMA8591).The line with black dots represents the tropopause. Thesolid lines indicate constant potential temperature with acontour interval of 15 K.
AAC 5 - 6 WANG ET AL.: EL NINO 1997/1998 CLOUD PROPERTIES
changes is highly longitudinally dependent, caution mustbe exercised when interpreting the results presented inFigure 5. It should also be stated that, although the simplemodel inferred mean meridional circulation from the zonallyaveraged COC distribution is very interesting and useful, themodel results are unlikely to simulate perfectly the realcirculation.
2.3. Cloud Longitude-Latitude Distributions
[21] The cloud distribution was derived for 10�-latitude by24� -longitude grids as in the 6-year cloud climatology ofWang et al. [1996]. Because of the solar occultation techni-que and the ERBS orbital characteristics, the number ofoverpasses of the SAGE II instrument is lower in the Tropicsthan elsewhere [McCormick, 1987]. This fact, together withthe frequent opaque cloud presence, substantially limits thenumber of observations at tropical lower altitudes. Onaverage, during the 5 months (DJFMA) at the peak of theEl Nino, the total number of overpasses is about 35, whileonly about 13 samples are taken for the 10� � 24� grids at 3
km [Wang et al., 2001]. For the above reasons, we present theCOC distributions above 3 km. Because the climatology is amultiyear (1985–1991) data ensemble, the number of sam-ples is about 7 times larger than during the El Nino.
2.3.1. COC
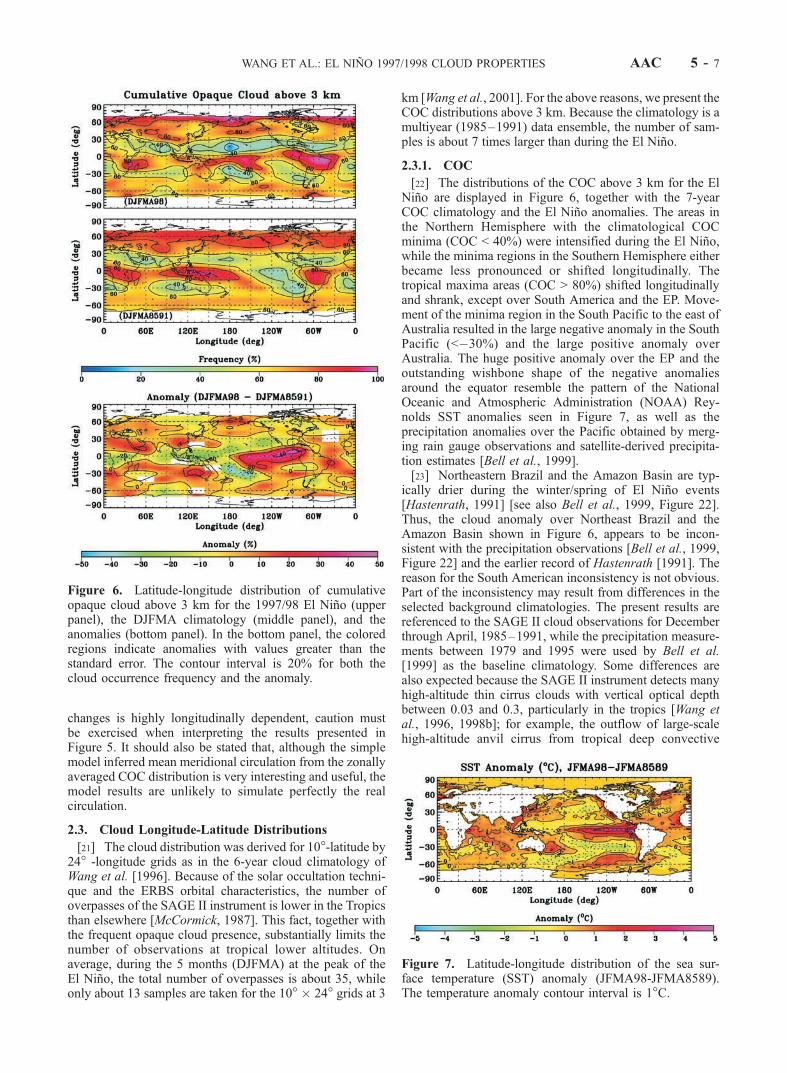
[22] The distributions of the COC above 3 km for the ElNino are displayed in Figure 6, together with the 7-yearCOC climatology and the El Nino anomalies. The areas inthe Northern Hemisphere with the climatological COCminima (COC < 40%) were intensified during the El Nino,while the minima regions in the Southern Hemisphere eitherbecame less pronounced or shifted longitudinally. Thetropical maxima areas (COC > 80%) shifted longitudinallyand shrank, except over South America and the EP. Move-ment of the minima region in the South Pacific to the east ofAustralia resulted in the large negative anomaly in the SouthPacific (<�30%) and the large positive anomaly overAustralia. The huge positive anomaly over the EP and theoutstanding wishbone shape of the negative anomaliesaround the equator resemble the pattern of the NationalOceanic and Atmospheric Administration (NOAA) Rey-nolds SST anomalies seen in Figure 7, as well as theprecipitation anomalies over the Pacific obtained by merg-ing rain gauge observations and satellite-derived precipita-tion estimates [Bell et al., 1999].[23] Northeastern Brazil and the Amazon Basin are typ-
ically drier during the winter/spring of El Nino events[Hastenrath, 1991] [see also Bell et al., 1999, Figure 22].Thus, the cloud anomaly over Northeast Brazil and theAmazon Basin shown in Figure 6, appears to be incon-sistent with the precipitation observations [Bell et al., 1999,Figure 22] and the earlier record of Hastenrath [1991]. Thereason for the South American inconsistency is not obvious.Part of the inconsistency may result from differences in theselected background climatologies. The present results arereferenced to the SAGE II cloud observations for Decemberthrough April, 1985–1991, while the precipitation measure-ments between 1979 and 1995 were used by Bell et al.[1999] as the baseline climatology. Some differences arealso expected because the SAGE II instrument detects manyhigh-altitude thin cirrus clouds with vertical optical depthbetween 0.03 and 0.3, particularly in the tropics [Wang etal., 1996, 1998b]; for example, the outflow of large-scalehigh-altitude anvil cirrus from tropical deep convective
Figure 6. Latitude-longitude distribution of cumulativeopaque cloud above 3 km for the 1997/98 El Nino (upperpanel), the DJFMA climatology (middle panel), and theanomalies (bottom panel). In the bottom panel, the coloredregions indicate anomalies with values greater than thestandard error. The contour interval is 20% for both thecloud occurrence frequency and the anomaly.
Figure 7. Latitude-longitude distribution of the sea sur-face temperature (SST) anomaly (JFMA98-JFMA8589).The temperature anomaly contour interval is 1�C.
WANG ET AL.: EL NINO 1997/1998 CLOUD PROPERTIES AAC 5 - 7
systems. These thin cirrus clouds have a small impact on theOLR and are not necessarily related to precipitation. TheSouth American inconsistency is further explored below.[24] Despite the drastic changes in horizontal and vertical
distributions of cloud occurrence, the estimated mean COCoccurrence above the 3-km level for 70�S to 70�N duringthe El Nino is about 47%, which is only 2% less than thecorresponding climatological mean. This feature appears toimply that the global coverage of upward motion associatedwith the large-scale circulation is roughly the same as that ofthe downward motion.
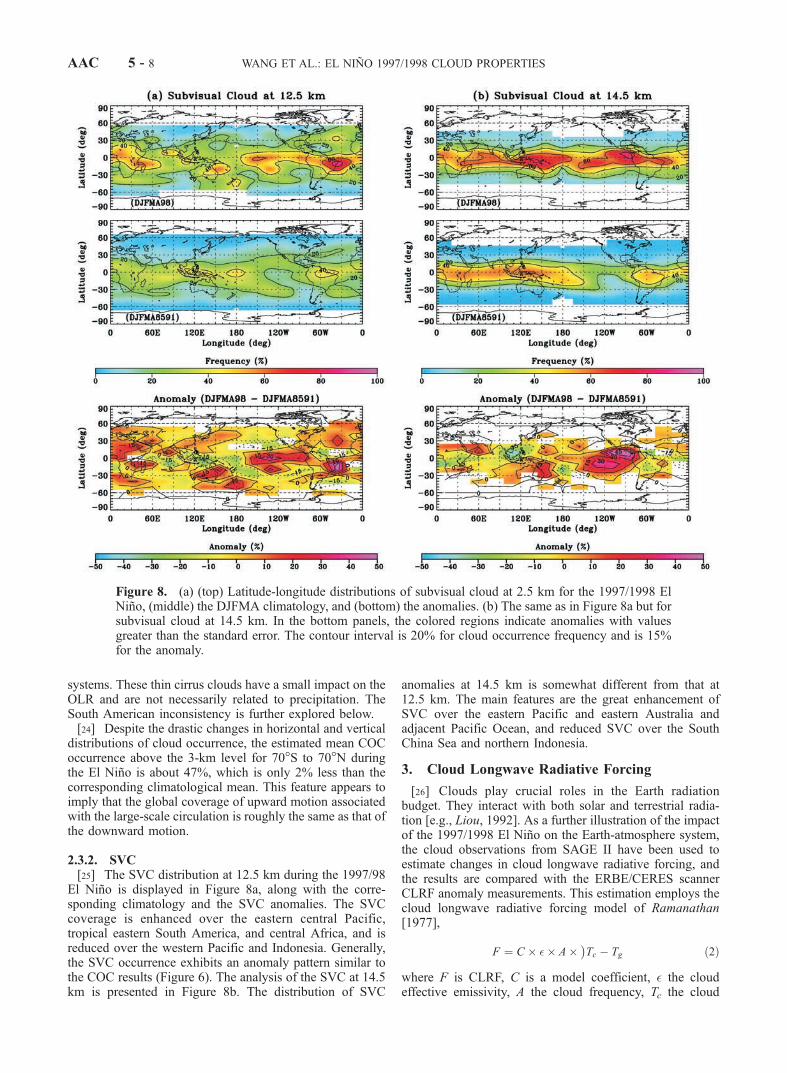
2.3.2. SVC[25] The SVC distribution at 12.5 km during the 1997/98
El Nino is displayed in Figure 8a, along with the corre-sponding climatology and the SVC anomalies. The SVCcoverage is enhanced over the eastern central Pacific,tropical eastern South America, and central Africa, and isreduced over the western Pacific and Indonesia. Generally,the SVC occurrence exhibits an anomaly pattern similar tothe COC results (Figure 6). The analysis of the SVC at 14.5km is presented in Figure 8b. The distribution of SVC
anomalies at 14.5 km is somewhat different from that at12.5 km. The main features are the great enhancement ofSVC over the eastern Pacific and eastern Australia andadjacent Pacific Ocean, and reduced SVC over the SouthChina Sea and northern Indonesia.
3. Cloud Longwave Radiative Forcing
[26] Clouds play crucial roles in the Earth radiationbudget. They interact with both solar and terrestrial radia-tion [e.g., Liou, 1992]. As a further illustration of the impactof the 1997/1998 El Nino on the Earth-atmosphere system,the cloud observations from SAGE II have been used toestimate changes in cloud longwave radiative forcing, andthe results are compared with the ERBE/CERES scannerCLRF anomaly measurements. This estimation employs thecloud longwave radiative forcing model of Ramanathan[1977],
F ¼ C � �� A� Tc � Tg� �
ð2Þ
where F is CLRF, C is a model coefficient, � the cloudeffective emissivity, A the cloud frequency, Tc the cloud
Figure 8. (a) (top) Latitude-longitude distributions of subvisual cloud at 2.5 km for the 1997/1998 ElNino, (middle) the DJFMA climatology, and (bottom) the anomalies. (b) The same as in Figure 8a but forsubvisual cloud at 14.5 km. In the bottom panels, the colored regions indicate anomalies with valuesgreater than the standard error. The contour interval is 20% for cloud occurrence frequency and is 15%for the anomaly.
AAC 5 - 8 WANG ET AL.: EL NINO 1997/1998 CLOUD PROPERTIES
temperature, and Tg the surface temperature. Ramanathan[1977] suggests a value of 1.65W/m2/K forC. A recent studyby Wang et al. [2002], based on cloud radiative transferstudies of Fu and Liou [1992, 1993] and Kiehl [1993], yieldsC = 2.24 W/m2/K, the value used here. Wang et al. [2002]determined a mean of 0.36(±0.003) for � and a linear trend in� of �0.026(±0.008)/decade for the tropics during 1985–1998. Accordingly, the mean effective emissivities of 0.37and 0.34 are used for the 7-year climatology and the 1997/1998 El Nino, respectively, in the present investigation. As inthe study of Wang et al. [2002], we use the occurrencefrequency of the uppermost opaque cloud (UOC) [Wang etal., 2001] for the CLRF study, because the CLRF dependsprimarily on the physical properties (emissivity and tem-perature) of the uppermost cloud systems.[27] According to Wang et al. [1998c], the mean optical
depth for SAGE II SVC is about 3.5 � 10�2 at a 1.02-mmwavelength. Assuming that the SVC particles are icespheres with a mean effective radius of 1 mm and an
effective variance of 1, Mie scattering calculations yieldan extinction efficiency 2.28 at 1.02 mm, and an extinctionefficiency of 0.355 at 10.8 mm [Wang et al., 1996]. Thus, themean visible optical depth of 3.5 � 10�2 converts to anoptical depth of 5 � 10�3 for longwave (10.8 mm). Forcloud with very small optical depth, the emissivity isroughly equal to the value of the optical depth. Thus, theemissivity of the SAGE II SVC is about 5 � 10�3. For theSAGE II UOC, the emissivity is estimated to be 0.36 [Wanget al., 2002]. This value is close to the cirrus cloudemissivity of 0.35 of Paltridge and Platt [1976, Table8.1]. As mentioned in section 2, the SAGE II opaque cloudsgenerally include all types of clouds, except SVCs. There-fore, approximately, the emissivity of SVC is about 2 ordersof magnitude smaller than that of UOC. For this reason,only the UOC frequencies are included in the CLRFanalysis. The meteorological data, including surface temper-ature and tropospheric temperature from the NCEP rean-alyses, are incorporated in the CLRF investigation. Themodel CLRF calculation is performed for each of the SAGEII layers for each geographic bin. Vertical integration of thederived F is then carried out to determine the total CLRF.[28] The model-calculated CLRF results for the 1997/
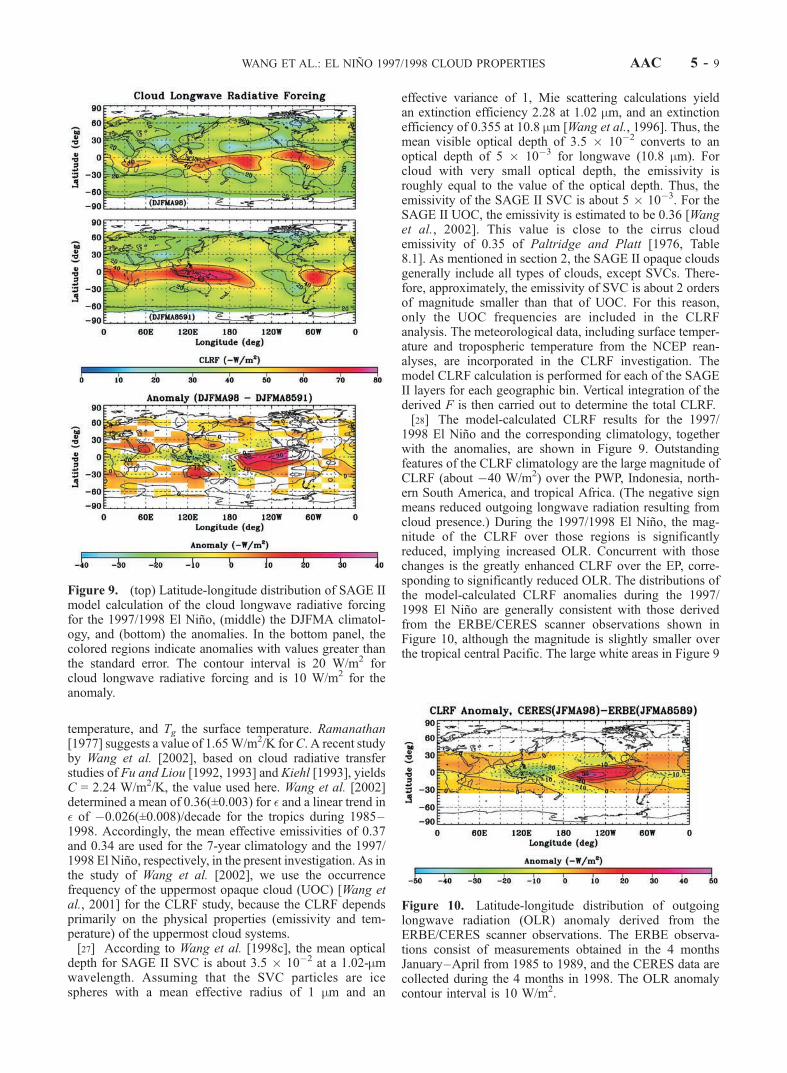
1998 El Nino and the corresponding climatology, togetherwith the anomalies, are shown in Figure 9. Outstandingfeatures of the CLRF climatology are the large magnitude ofCLRF (about �40 W/m2) over the PWP, Indonesia, north-ern South America, and tropical Africa. (The negative signmeans reduced outgoing longwave radiation resulting fromcloud presence.) During the 1997/1998 El Nino, the mag-nitude of the CLRF over those regions is significantlyreduced, implying increased OLR. Concurrent with thosechanges is the greatly enhanced CLRF over the EP, corre-sponding to significantly reduced OLR. The distributions ofthe model-calculated CLRF anomalies during the 1997/1998 El Nino are generally consistent with those derivedfrom the ERBE/CERES scanner observations shown inFigure 10, although the magnitude is slightly smaller overthe tropical central Pacific. The large white areas in Figure 9
Figure 9. (top) Latitude-longitude distribution of SAGE IImodel calculation of the cloud longwave radiative forcingfor the 1997/1998 El Nino, (middle) the DJFMA climatol-ogy, and (bottom) the anomalies. In the bottom panel, thecolored regions indicate anomalies with values greater thanthe standard error. The contour interval is 20 W/m2 forcloud longwave radiative forcing and is 10 W/m2 for theanomaly.
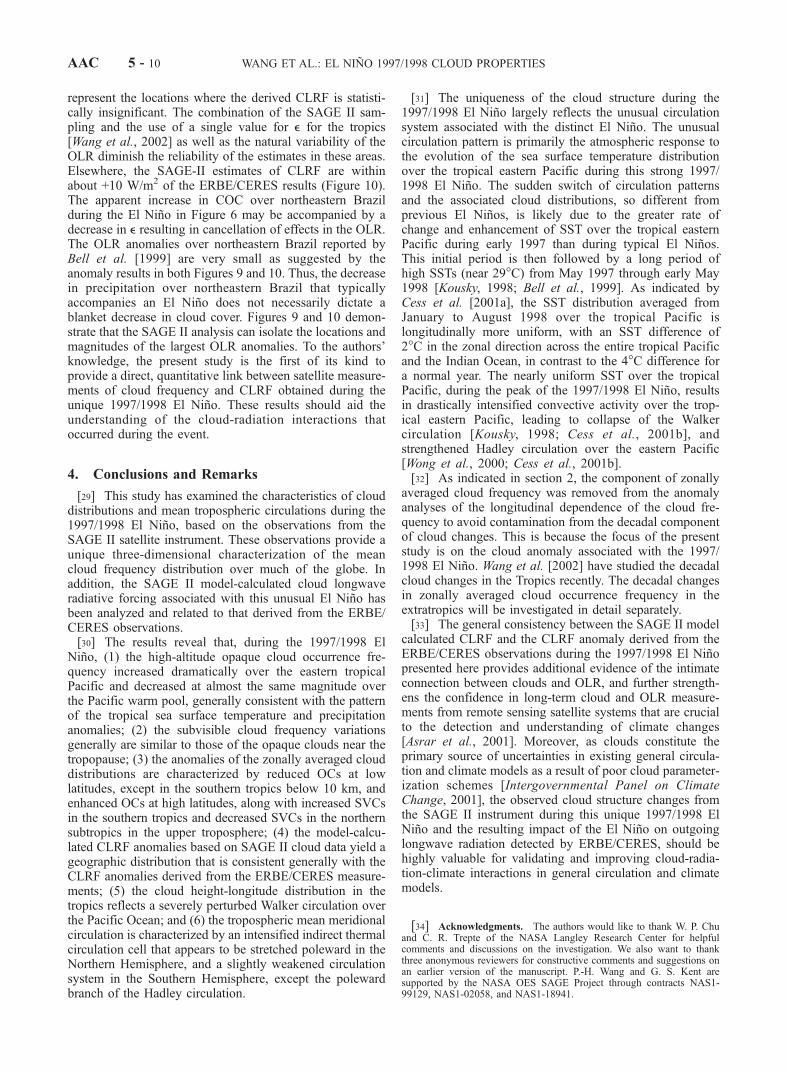
Figure 10. Latitude-longitude distribution of outgoinglongwave radiation (OLR) anomaly derived from theERBE/CERES scanner observations. The ERBE observa-tions consist of measurements obtained in the 4 monthsJanuary–April from 1985 to 1989, and the CERES data arecollected during the 4 months in 1998. The OLR anomalycontour interval is 10 W/m2.
WANG ET AL.: EL NINO 1997/1998 CLOUD PROPERTIES AAC 5 - 9
represent the locations where the derived CLRF is statisti-cally insignificant. The combination of the SAGE II sam-pling and the use of a single value for e for the tropics[Wang et al., 2002] as well as the natural variability of theOLR diminish the reliability of the estimates in these areas.Elsewhere, the SAGE-II estimates of CLRF are withinabout +10 W/m2 of the ERBE/CERES results (Figure 10).The apparent increase in COC over northeastern Brazilduring the El Nino in Figure 6 may be accompanied by adecrease in e resulting in cancellation of effects in the OLR.The OLR anomalies over northeastern Brazil reported byBell et al. [1999] are very small as suggested by theanomaly results in both Figures 9 and 10. Thus, the decreasein precipitation over northeastern Brazil that typicallyaccompanies an El Nino does not necessarily dictate ablanket decrease in cloud cover. Figures 9 and 10 demon-strate that the SAGE II analysis can isolate the locations andmagnitudes of the largest OLR anomalies. To the authors’knowledge, the present study is the first of its kind toprovide a direct, quantitative link between satellite measure-ments of cloud frequency and CLRF obtained during theunique 1997/1998 El Nino. These results should aid theunderstanding of the cloud-radiation interactions thatoccurred during the event.
4. Conclusions and Remarks
[29] This study has examined the characteristics of clouddistributions and mean tropospheric circulations during the1997/1998 El Nino, based on the observations from theSAGE II satellite instrument. These observations provide aunique three-dimensional characterization of the meancloud frequency distribution over much of the globe. Inaddition, the SAGE II model-calculated cloud longwaveradiative forcing associated with this unusual El Nino hasbeen analyzed and related to that derived from the ERBE/CERES observations.[30] The results reveal that, during the 1997/1998 El
Nino, (1) the high-altitude opaque cloud occurrence fre-quency increased dramatically over the eastern tropicalPacific and decreased at almost the same magnitude overthe Pacific warm pool, generally consistent with the patternof the tropical sea surface temperature and precipitationanomalies; (2) the subvisible cloud frequency variationsgenerally are similar to those of the opaque clouds near thetropopause; (3) the anomalies of the zonally averaged clouddistributions are characterized by reduced OCs at lowlatitudes, except in the southern tropics below 10 km, andenhanced OCs at high latitudes, along with increased SVCsin the southern tropics and decreased SVCs in the northernsubtropics in the upper troposphere; (4) the model-calcu-lated CLRF anomalies based on SAGE II cloud data yield ageographic distribution that is consistent generally with theCLRF anomalies derived from the ERBE/CERES measure-ments; (5) the cloud height-longitude distribution in thetropics reflects a severely perturbed Walker circulation overthe Pacific Ocean; and (6) the tropospheric mean meridionalcirculation is characterized by an intensified indirect thermalcirculation cell that appears to be stretched poleward in theNorthern Hemisphere, and a slightly weakened circulationsystem in the Southern Hemisphere, except the polewardbranch of the Hadley circulation.
[31] The uniqueness of the cloud structure during the1997/1998 El Nino largely reflects the unusual circulationsystem associated with the distinct El Nino. The unusualcirculation pattern is primarily the atmospheric response tothe evolution of the sea surface temperature distributionover the tropical eastern Pacific during this strong 1997/1998 El Nino. The sudden switch of circulation patternsand the associated cloud distributions, so different fromprevious El Ninos, is likely due to the greater rate ofchange and enhancement of SST over the tropical easternPacific during early 1997 than during typical El Ninos.This initial period is then followed by a long period ofhigh SSTs (near 29�C) from May 1997 through early May1998 [Kousky, 1998; Bell et al., 1999]. As indicated byCess et al. [2001a], the SST distribution averaged fromJanuary to August 1998 over the tropical Pacific islongitudinally more uniform, with an SST difference of2�C in the zonal direction across the entire tropical Pacificand the Indian Ocean, in contrast to the 4�C difference fora normal year. The nearly uniform SST over the tropicalPacific, during the peak of the 1997/1998 El Nino, resultsin drastically intensified convective activity over the trop-ical eastern Pacific, leading to collapse of the Walkercirculation [Kousky, 1998; Cess et al., 2001b], andstrengthened Hadley circulation over the eastern Pacific[Wong et al., 2000; Cess et al., 2001b].[32] As indicated in section 2, the component of zonally
averaged cloud frequency was removed from the anomalyanalyses of the longitudinal dependence of the cloud fre-quency to avoid contamination from the decadal componentof cloud changes. This is because the focus of the presentstudy is on the cloud anomaly associated with the 1997/1998 El Nino. Wang et al. [2002] have studied the decadalcloud changes in the Tropics recently. The decadal changesin zonally averaged cloud occurrence frequency in theextratropics will be investigated in detail separately.[33] The general consistency between the SAGE II model
calculated CLRF and the CLRF anomaly derived from theERBE/CERES observations during the 1997/1998 El Ninopresented here provides additional evidence of the intimateconnection between clouds and OLR, and further strength-ens the confidence in long-term cloud and OLR measure-ments from remote sensing satellite systems that are crucialto the detection and understanding of climate changes[Asrar et al., 2001]. Moreover, as clouds constitute theprimary source of uncertainties in existing general circula-tion and climate models as a result of poor cloud parameter-ization schemes [Intergovernmental Panel on ClimateChange, 2001], the observed cloud structure changes fromthe SAGE II instrument during this unique 1997/1998 ElNino and the resulting impact of the El Nino on outgoinglongwave radiation detected by ERBE/CERES, should behighly valuable for validating and improving cloud-radia-tion-climate interactions in general circulation and climatemodels.
[34] Acknowledgments. The authors would like to thank W. P. Chuand C. R. Trepte of the NASA Langley Research Center for helpfulcomments and discussions on the investigation. We also want to thankthree anonymous reviewers for constructive comments and suggestions onan earlier version of the manuscript. P.-H. Wang and G. S. Kent aresupported by the NASA OES SAGE Project through contracts NAS1-99129, NAS1-02058, and NAS1-18941.
AAC 5 - 10 WANG ET AL.: EL NINO 1997/1998 CLOUD PROPERTIES
ReferencesAsrar, G., J. A. Kaye, and P. Morel, NASA research strategy for Earthsystem science: Climate component, Bull. Am. Meteorol. Soc., 82,1309–1329, 2001.
Barkstrom, B. R., The Earth Radiation Budget Experiment (ERBE), Bull.Am. Meteorol. Soc., 65, 1170–1185, 1984.
Bell, G. D., M. S. Halpert, C. F. Ropelewski, V. E. Kousky, A. V. Douglas,R. C. Schnell, and M. E. Gelman, Climate assessment for 1998, Bull. Am.Meteorol. Soc., 80, S1–S48, 1999.
Bregman, B., P.-H. Wang, and J. Lelieveld, Chemical ozone loss in the tro-popause region on subvisible ice clouds, calculated with a chemistry-trans-port model, J. Geophys. Res., 107(D3), 4032, 10.1029/2001JD000761,2002.
Cess, R. D., M. Zhang, B. Wielicki, D. F. Young, X.-L. Zhou, andY. Nikitenko, The influence of the 1998 El Nino upon cloud-radiativeforcing over the Pacific warm pool, J. Clim., 14, 2129–2137, 2001a.
Cess, R. D., M. Zhang, P.-H. Wang, and B. Wielicki, Cloud structureanomalies over the tropical Pacific During the 1997/98 El Nino, Geophys.Res. Lett., 28, 4547–4550, 2001b.
Fu, Q., and K.-N. Liou, On the correlated k-distribution method for radia-tive transfer in nonhomogenous atmospheres, J. Atmos. Sci., 49, 2139–2156, 1992.
Fu, Q., and K.-N. Liou, Parameterization of the radiative properties of cirrusclouds, J. Atmos. Sci., 50, 2008–2025, 1993.
Hastenrath, S., Climate Dynamics of the Tropics, 488 pp., Kluwer Acad.,Norwell, Mass., 1991.
Intergovernmental Panel on Climate Change, Climate Change 2001: TheScientific Basis, edited by J. T. Houghton et al., pp. 49–50, CambridgeUniv. Press, New York, 2001.
Johnson, R. A., and G. Bhattacharyya, Statistics: Principles and Methods,682 pp., John Wiley, New York, 1992.
Kalnay, E., et al., The NCEP/NCAR 40-year reanalysis project, Bull. Am.Meteorol. Soc., 77, 437–471, 1996.
Kent, G. S., D. M. Winker, M. T. Osborn, M. P. McCormick, and K. M.Skeens, A model for the separation of cloud and aerosol in SAGE IIoccultation data, J. Geophys. Res., 98, 20,725–20,735, 1993.
Kiehl, J. T., On the observed near cancellation between longwave andshortwave cloud forcing in tropical regions, J. Clim., 7, 559–565, 1993.
Kistler, R., et al., The NCEP-NCAR 50-year reanalysis: Monthly means CD-ROM and documentation, Bull. Am. Meteorol. Soc., 82, 247–267, 2001.
Kousky, V., The 1997–98 Warm (El Nino) Episode: Onset and decaystages, Paper presented at 23rd Annual Climate Diagnostics and Predic-tion Workshop, U.S. Dep. of Commerce, Miami, Fla., 1998.
Liou, K. N., Radiation and Cloud Processes in the Atmosphere, pp. 487,Oxford Univ. Press, New York, 1992.
Massie, S., P. Lowe, X. Tie, M. Hervig, G. Thomas, and J. Russell III,Effect of the 1997 El Nino on the distribution of upper troposphericcirrus, J. Geophys. Res., 105, 22,725–22,741, 1997.
McCormick, M. P., SAGE II: An overview, Adv. Space Res., 7, 319–326,1987.
McCormick, M. P., P. Hamill, T. G. Pepin, W. P. Chu, T. J. Swissler, andL. R. McMaster, Satellite studies of the stratospheric aerosols, Bull. Am.Meteorol. Soc., 60, 1038–1049, 1979.
McPhaden, M. J., The 1997–98 El Nino, paper presented at 23rd AnnualClimate Diagnostics and Prediction Workshop, U.S. Dep. of Commerce,Miami, Fla., 1998.
Mendenhall, W., and R. L. Scheaffer, Mathematical Statistics with Applica-tions, 581 pp., Duxbury, Boston, Mass., 1973.
Paltridge, G. W., and C. M. R. Platt, Radiative Processes in Meteorologyand Climatology, 318 pp., Elsevier Sci., New York, 1976.
Peixoto, J. P., and A. H. Oort, Physics of Climate, 520 pp., Am. Inst. ofPhys., New York, 1992.
Peng, P., and H. Van den Dool, The impact of 1997/98 El Nino on the mid-latitude atmospheric circulation as evaluated by a steady state linearmodel, paper presented at 23rd Annual Climate Diagnostics and Predic-tion Workshop, U.S. Dep. of Commerce, Miami, Fla., 1998.
Ramanathan, V., Interactions between ice-albedo, lapse-rate and cloud topfeedbacks: An analysis of the nonlinear response of a GCM climatemodel, J. Atmos. Sci., 34, 1885–1897, 1977.
Sassen, K., and B. S. Cho, Subvisual-thin cirrus lidar dataset for satelliteverification and climatological research, J. Appl. Meteorol., 31, 1275–1285, 1992.
Schubert, S., C.-K. Park, W. Higgins, S. Moorthi, and M. Suarez, An atlasof ECMWF analyses (1980–1987), I, First moment quantities, NASATech. Memo., 100747, 1990.
Solomon, S., S. Borrmann, R. R. Garcia, R. Portmann, L. Thomason, L. R.Poole, D. Winker, and M. P. McCormick, Heterogeneous chlorine chem-istry in the tropopause region, J. Geophys. Res., 102, 21,411–21,429,1997.
SPARC, Assessment of upper tropospheric and stratospheric water vapour,WMO/TD 1043, SPARC Rep. 2, World Meteorol. Organ., Geneva, De-cember, 2000.
Trenberth, K. E., Global analyses from ECMWF and atlas of 1000 to 10 mbcirculation statistics, NCAR TN-373+STR, Natl. Cent. for Atmos. Res.,Boulder, Colo., 1992.
Wang, C., P. J. Crutzen, V. Pamanathan, and S. F. Williams, The role of adeep convective storm over the tropical Pacific Ocean in the redistribu-tion of atmospheric chemical species, J. Geophys. Res., 100, 11,509–11,516, 1995a.
Wang, P.-H., SAGE II tropospheric measurement frequency and its meteor-ological implication (reprint), paper presented at Seventh Conference onSatellite Meteorology and Oceanography, Am. Meteorol. Soc., Boston,Mass., 1994.
Wang, P.-H., et al., Tropical high cloud characteristics derived from SAGEII extinction measurements, Atmos. Res., 34, 53–83, 1994.
Wang, P.-H., M. P. McCormick, P. Minnis, G. S. Kent, G. K. Yue, and K.M. Skeens, A method for estimating vertical distribution of the SAGE IIopaque cloud frequency, Geophys. Res. Lett., 22, 243–246, 1995b.
Wang, P.-H., P. Minnis, M. P. McCormick, G. S. Kent, and K. M. Skeens, A6-year climatology of cloud occurrence frequency from SAGE II obser-vations (1985–1991), J. Geophys. Res., 101, 29,407–29,429, 1996.
Wang, P.-H., G. S. Kent, G. K. Yue, K. A. Powell, L. R. Poole, and H. M.Steele, Simulation of SAGE II tropical particulate extinctions near thetropopause using a simple microphysical model, OSA Tech. Dig., Cirrus,78–80, 1998a.
Wang, P.-H., D. Rind, C. R. Trepte, G. S. Kent, G. K. Yue, and K. M.Skeens, An empirical model study of the tropospheric meridional circula-tion based on SAGE II observations, J. Geophys. Res., 103, 13,801–13,818, 1998b.
Wang, P.-H., P. Minnis, M. P. McCormick, G. S. Kent, G. K. Yue, D. F.Young, and K. M. Skeens, A study of the vertical structure of tropical(20�S–20�N) optically thin clouds from SAGE II observations, Atmos.Res., 47–48, 599–614, 1998c.
Wang, P.-H., R. E. Veiga, L. B. Vann, P. Minnis, and G. S. Kent, A furtherstudy of the method for estimation of SAGE II opaque cloud occurrence,J. Geophys. Res., 106, 12,603–12,613, 2001.
Wang, P. H., P. Minnis, B. A. Wielicki, T. Wong, and L. B. Vann, Satelliteobservations of long-term changes in tropical cloud and outgoing long-wave radiation from 1985 to 1998, Geophys. Res. Lett., 29, 1397,10.1029/2001GL014264, 2002.
Wielicki, B. A., et al., Evidence for large decadal variability in the tropicalmean radiative energy budget, Science, 295, 841–844, 2002.
Wong, T., D. F. Young, M. Haeffelin, and S. Weckmann, Validation of theCERES/TRMM ERBE-like monthly mean clear-sky longwave datasetand the effects of the 1998 ENSO event, J. Clim., 13, 4256–4267,2000.
�����������������������R. D. Cess and M. Zhang, Marine Sciences Research Center, State
University of New York, Stony Brook, Stony Brook, NY 11794-5000,USA. ([email protected]; [email protected])G. S. Kent and P.-H. Wang, STC/NASA-LaRC, MS 475, Hampton, VA
23681-2199, USA. ([email protected]; [email protected])P. Minnis, B. A. Wielicki, and T. Wong, NASA-LaRC, MS 420,
Hampton, VA 23681-2199, USA. ( [email protected]; [email protected]; [email protected])L. B. Vann, NASA-LaRC, MS 420, Hampton, VA 23681-2199, USA.
WANG ET AL.: EL NINO 1997/1998 CLOUD PROPERTIES AAC 5 - 11
Related Documents