Characteristics of acoustic emissions induced by fluid front displacement in porous media Franziska Moebius, 1 Davide Canone, 2 and Dani Or 1 Received 14 June 2012 ; revised 14 September 2012 ; accepted 26 September 2012 ; published 6 November 2012. [1] The dynamics of fluid displacement in porous media often affect phase entrapment and shape macroscopic transport properties and thus are of considerable interest for a range of natural and engineering applications. The macroscopic motion of a displacement front is composed of numerous abrupt pore-scale invasion events that involve rapid interfacial jumps and reconfigurations with associated mechanical and interfacial energy release detectable as acoustic emissions (AE). We conducted systematic experiments of fluid displacement and measured associated AE during passage of fluid fronts (primarily drainage) within assemblies of glass beads of different sizes. Results indicated distinct acoustic signatures associated with different displacement processes, reflecting dependency on porous media pore size, displacement flow rate, and liquid properties. The rich AE signals associated with front dynamics exhibited power law relationships between the number of AE events and their amplitudes, reminiscent of avalanche-like invasion processes. In addition to AE signals emanating from rapid emptying or filling of pores (Haines jumps), other processes such as redistribution and interfacial reconfigurations behind a drainage front and grain rearrangement may generate AE. Characteristic AE signatures generated by displacement processes in different media and under various boundary conditions offer a promise for remote detection of pore-scale fluid interfacial dynamics in porous media that may shape macroscopic transport properties (e.g., linked with phase entrapment). Citation: Moebius, F., D. Canone, and D. Or (2012), Characteristics of acoustic emissions induced by fluid front displacement in porous media, Water Resour. Res., 48, W11507, doi:10.1029/2012WR012525. 1. Introduction [2] Immiscible fluid displacement in porous media such as drainage, imbibition, and evaporation are of consider- able interest for applications ranging from study of infiltra- tion and evaporation in soils, to quantifying drying of food products and construction materials, or oil reservoir opera- tion or geologic carbon sequestration [e.g., Aker et al., 2000a; Culligan et al., 2006]. Fluid front morphology and dynamics during displacement processes are shaped by pore space geometry, fluid properties, and by boundary conditions [Meheust et al., 2002]. Even minute variations in fluid veloc- ity or pressure gradient may trigger instabilities altering fluid phase displacement pattern thereby affecting macroscopic transport properties such as hydraulic and electrical conduc- tivity and gaseous diffusion [Jury et al., 2003; Chau and Or, 2006; Lovoll et al. , 2011]. Advances in measurement and imaging methods motivated interest in characterizing the role of (the often dismissed) ‘‘Haines jumps’’ and other pore- scale aspects of fluid displacement processes [Måløy et al., 1992; Wildenschild et al., 2002 ; Culligan et al., 2004]. [3] The seemingly continuous and regular motion of imbi- bition and drainage fronts involve numerous pore-scale ab- rupt interfacial reconfigurations and rapid pore invasion events in response to local interfacial instabilities. Such inter- facial invasion processes may resemble an avalanche when a group of pores abruptly empties or fills in response to insta- bility induced by a single meniscus. The resulting rapid advance and pressure fluctuation are referred to as Haines jumps or rheons [Haines, 1930; Melrose and Brandner, 1974; Aker et al., 2000b; DiCarlo et al., 2003; Crandall et al. , 2009]. These and other abrupt interfacial reconfigura- tion processes such as ‘‘snap-off’’ resulting from the sponta- neous filling of angular pores or irregular pore throats [Blunt and Scher, 1995; Tuller et al. , 1999] are often associated with interfacial energy release [Ransohoff et al., 1987] observable with the acoustic emission technique. A relatively understudied aspect of abrupt interfacial snap-off and related jumps is their potential impact on fluid phase entrapment that subsequently shape transport properties through the partially saturated region behind a displacement (drainage) front. [4] Acoustic emission signals (AE) emanate from abrupt and localized release of mechanical and interfacial energy that triggers generation of elastic waves [Scruby, 1987]. 1 Department of Environmental Sciences, ETH Zurich, Zurich, Switzerland. 2 Interuniversity Department of Regional and Urban Studies and Plan- ning, University of Turin, Turin, Italy. Corresponding author: F. Moebius, Department of Environmental Sci- ences, ETH Zurich, Universitaetstr. 16, CH-8092 Zurich, Switzerland. ([email protected]) ©2012. American Geophysical Union. All Rights Reserved. 0043-1397/12/2012WR012525 W11507 1 of 12 WATER RESOURCES RESEARCH, VOL. 48, W11507, doi :10.1029/2012WR012525, 2012

Welcome message from author
This document is posted to help you gain knowledge. Please leave a comment to let me know what you think about it! Share it to your friends and learn new things together.
Transcript
Characteristics of acoustic emissions induced by fluid frontdisplacement in porous media
Franziska Moebius,1 Davide Canone,2 and Dani Or1
Received 14 June 2012; revised 14 September 2012; accepted 26 September 2012; published 6 November 2012.
[1] The dynamics of fluid displacement in porous media often affect phase entrapmentand shape macroscopic transport properties and thus are of considerable interest for a rangeof natural and engineering applications. The macroscopic motion of a displacement front iscomposed of numerous abrupt pore-scale invasion events that involve rapid interfacialjumps and reconfigurations with associated mechanical and interfacial energy releasedetectable as acoustic emissions (AE). We conducted systematic experiments of fluiddisplacement and measured associated AE during passage of fluid fronts (primarilydrainage) within assemblies of glass beads of different sizes. Results indicated distinctacoustic signatures associated with different displacement processes, reflecting dependencyon porous media pore size, displacement flow rate, and liquid properties. The rich AEsignals associated with front dynamics exhibited power law relationships between thenumber of AE events and their amplitudes, reminiscent of avalanche-like invasionprocesses. In addition to AE signals emanating from rapid emptying or filling of pores(Haines jumps), other processes such as redistribution and interfacial reconfigurationsbehind a drainage front and grain rearrangement may generate AE. Characteristic AEsignatures generated by displacement processes in different media and under variousboundary conditions offer a promise for remote detection of pore-scale fluid interfacialdynamics in porous media that may shape macroscopic transport properties (e.g., linkedwith phase entrapment).
Citation: Moebius, F., D. Canone, and D. Or (2012), Characteristics of acoustic emissions induced by fluid front displacement in
porous media, Water Resour. Res., 48, W11507, doi:10.1029/2012WR012525.
1. Introduction[2] Immiscible fluid displacement in porous media such
as drainage, imbibition, and evaporation are of consider-able interest for applications ranging from study of infiltra-tion and evaporation in soils, to quantifying drying of foodproducts and construction materials, or oil reservoir opera-tion or geologic carbon sequestration [e.g., Aker et al.,2000a; Culligan et al., 2006]. Fluid front morphology anddynamics during displacement processes are shaped by porespace geometry, fluid properties, and by boundary conditions[Meheust et al., 2002]. Even minute variations in fluid veloc-ity or pressure gradient may trigger instabilities altering fluidphase displacement pattern thereby affecting macroscopictransport properties such as hydraulic and electrical conduc-tivity and gaseous diffusion [Jury et al., 2003; Chau and Or,2006; Lovoll et al., 2011]. Advances in measurement and
imaging methods motivated interest in characterizing therole of (the often dismissed) ‘‘Haines jumps’’ and other pore-scale aspects of fluid displacement processes [Måløy et al.,1992; Wildenschild et al., 2002; Culligan et al., 2004].
[3] The seemingly continuous and regular motion of imbi-bition and drainage fronts involve numerous pore-scale ab-rupt interfacial reconfigurations and rapid pore invasionevents in response to local interfacial instabilities. Such inter-facial invasion processes may resemble an avalanche when agroup of pores abruptly empties or fills in response to insta-bility induced by a single meniscus. The resulting rapidadvance and pressure fluctuation are referred to as Hainesjumps or rheons [Haines, 1930; Melrose and Brandner,1974; Aker et al., 2000b; DiCarlo et al., 2003; Crandallet al., 2009]. These and other abrupt interfacial reconfigura-tion processes such as ‘‘snap-off’’ resulting from the sponta-neous filling of angular pores or irregular pore throats [Bluntand Scher, 1995; Tuller et al., 1999] are often associatedwith interfacial energy release [Ransohoff et al., 1987]observable with the acoustic emission technique. A relativelyunderstudied aspect of abrupt interfacial snap-off and relatedjumps is their potential impact on fluid phase entrapment thatsubsequently shape transport properties through the partiallysaturated region behind a displacement (drainage) front.
[4] Acoustic emission signals (AE) emanate from abruptand localized release of mechanical and interfacial energythat triggers generation of elastic waves [Scruby, 1987].
1Department of Environmental Sciences, ETH Zurich, Zurich,Switzerland.
2Interuniversity Department of Regional and Urban Studies and Plan-ning, University of Turin, Turin, Italy.
Corresponding author: F. Moebius, Department of Environmental Sci-ences, ETH Zurich, Universitaetstr. 16, CH-8092 Zurich, Switzerland.([email protected])
©2012. American Geophysical Union. All Rights Reserved.0043-1397/12/2012WR012525
W11507 1 of 12
WATER RESOURCES RESEARCH, VOL. 48, W11507, doi:10.1029/2012WR012525, 2012
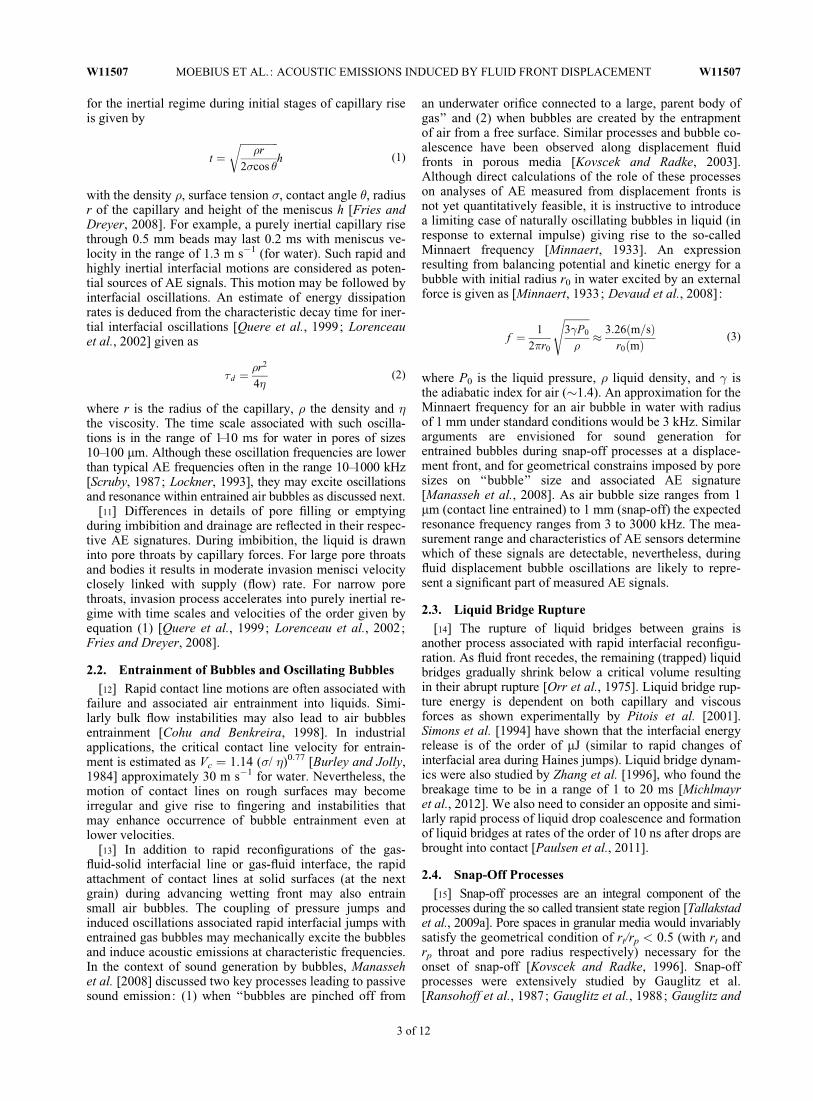
The high-frequency (>kHz) waves propagate as compres-sion or shear waves through solids (or as compressionwaves through fluids) and carry information regarding thesource location and characteristics of the source of energyrelease. AE transducers (typically piezoelectric sensors)detect minute surface vibrations and provide a means fordetermining AE characteristics such as amplitude, rise time,duration or simply counting hits above a threshold (as shownin Figure 1). The AE technique has been used extensivelyin recent decades in diverse applications, e.g., characteriza-tion and nondestructive testing of materials, such as fiber-reinforced plastics [Barre and Benzeggagh, 1994]; fatiguetesting of structural elements or real-time monitoring andlocalization of crack formation in critical structures [Johansenand Sornette, 2000]; process monitoring [Dornfeld, 1992];motion of solid particles in loose porous media; the study ofsoil movement in earth dams [Lord and Koerner, 1975] andfor study of mechanical processes in geologic media[Michlmayr et al., 2012].
[5] Some of the mechanisms responsible for generatingelastic waves are discussed in more detail, with the primaryprocesses of interest in this study are those linked with inter-facial processes induced by evaporation, imbibition, drain-age or bubble coalescence [DiCarlo et al., 2003; Chotardet al., 2006, 2007; Manasseh et al., 2008]. This link betweenindividual displacement events and measurable acousticemissions holds a promise for noninvasive and data-rich ex-ploration of pore-scale displacement processes.
[6] DiCarlo et al. [2003] measured acoustic emissionsduring motion of fluid interfaces in sand which they attrib-uted to ‘‘Haines jumps’’ occurring during fluid front displace-ment. The acoustic events were recorded using microphonesand hydrophones in a frequency range of up to 20 kHz. Evi-dence suggests that different displacement processes (drain-age or imbibition), pore sizes and flow rates may result indifferent AE patterns. Chotard et al. [2007] focused on eventnumbers and AE rate evolution during evaporation processesfrom a porous ceramic and found a correlation between thefrequency of hits and evaporative mass loss rates.
[7] Motivated by results from these recent studies andby advances in AE measurement technology, our primaryobjective was to systematically characterize acoustic emis-sions generated during a range of fluid front displacementregimes in well-defined porous media, focusing on differ-ences in AE generation during imbibition and drainagewithin the same porous medium. In our experimental stud-ies we varied pore spaces, mean front velocity and liquidproperties (surface tension and viscosity) and examinedtheir impacts on measured AE event rates and amplitudes.These results provide the experimental basis for attemptingto link AE characteristics with factors affecting their gener-ation during displacement in porous media toward potentialusing the AE method for noninvasive characterization offluid displacement processes.
2. Sources of Acoustic Emission During FluidFront Displacement
[8] Detailed quantification of the wide scope of AE gen-erating mechanisms is beyond the scope of this experimen-tal study, nevertheless we present a brief overview ofpotential AE generation mechanisms associated with inter-facial displacement in porous media. The primary mecha-nisms considered here include (1) rapid interfacial invasioninto pores (Haines jumps or rheons), (2) air entrainmentand oscillating bubbles, (3) liquid bridge rupture, (4) inter-facial snap-off, and (5) capillary-induced grain rearrange-ment and collisions. Estimates on timescales, energy valuesand wave frequencies of the different processes associatedwith advancing drainage and imbibition fronts, and redis-tribution processes behind a drainage front are presented inthe following.
2.1. Rapid Pore Invasion (Haines Jumps)
[9] Drainage is associated with nonwetting phase (air)invading wetting phase filled pores. The pore-scale interfa-cial motions exhibit pinning-jumping behavior where seg-ments of a drainage front may become pinned until ameniscus at the largest throat (lowest capillary barrier)becomes unstable and abruptly invades the pore body. Theensuing interfacial jump occurs at significantly higher veloc-ity than mean front velocity and is often associated with sig-nificant inertia and subsequent pressure relaxation [Moebiusand Or, 2012]. As drainage rates increase, the pinning-jumping behavior becomes complex and may involve simul-taneous invasion of several pores in an avalanche-like process.Rapid changes in interfacial configurations are associatedwith attainment of unstable states (e.g., passage through apore throat) and involve minimization of interfacial energy.During the moment before rapid breakthrough of the instablemeniscus, the interfacial area along the entire front is‘‘stretched’’ (into the pore throats). Rapid breakthrough andassociated drawback of the neighboring menisci lead to reduc-tion in interfacial area and associated energy release whichare of the order of mJ and are considered as potential sourcesfor elastic energy release detectable as acoustic emission.
[10] For interfacial jumps at time scales shorter than vis-cous dissipation of interfacial motions [Quere, 1997],excess interfacial energy (released during rapid configura-tion) may induce short bursts of elastic waves [Scruby,1987] detected as acoustic emissions. A characteristic time
Figure 1. Characteristics of a typical acoustic emissionsignal.
W11507 MOEBIUS ET AL.: ACOUSTIC EMISSIONS INDUCED BY FLUID FRONT DISPLACEMENT W11507
2 of 12
for the inertial regime during initial stages of capillary riseis given by
t ¼ffiffiffiffiffiffiffiffiffiffiffiffiffiffiffi�r
2�cos �
rh (1)
with the density �, surface tension �, contact angle �, radiusr of the capillary and height of the meniscus h [Fries andDreyer, 2008]. For example, a purely inertial capillary risethrough 0.5 mm beads may last 0.2 ms with meniscus ve-locity in the range of 1.3 m s�1 (for water). Such rapid andhighly inertial interfacial motions are considered as poten-tial sources of AE signals. This motion may be followed byinterfacial oscillations. An estimate of energy dissipationrates is deduced from the characteristic decay time for iner-tial interfacial oscillations [Quere et al., 1999; Lorenceauet al., 2002] given as
�d ¼�r2
4�(2)
where r is the radius of the capillary, � the density and �the viscosity. The time scale associated with such oscilla-tions is in the range of 1–10 ms for water in pores of sizes10–100 mm. Although these oscillation frequencies are lowerthan typical AE frequencies often in the range 10–1000 kHz[Scruby, 1987; Lockner, 1993], they may excite oscillationsand resonance within entrained air bubbles as discussed next.
[11] Differences in details of pore filling or emptyingduring imbibition and drainage are reflected in their respec-tive AE signatures. During imbibition, the liquid is drawninto pore throats by capillary forces. For large pore throatsand bodies it results in moderate invasion menisci velocityclosely linked with supply (flow) rate. For narrow porethroats, invasion process accelerates into purely inertial re-gime with time scales and velocities of the order given byequation (1) [Quere et al., 1999; Lorenceau et al., 2002;Fries and Dreyer, 2008].
2.2. Entrainment of Bubbles and Oscillating Bubbles
[12] Rapid contact line motions are often associated withfailure and associated air entrainment into liquids. Simi-larly bulk flow instabilities may also lead to air bubblesentrainment [Cohu and Benkreira, 1998]. In industrialapplications, the critical contact line velocity for entrain-ment is estimated as Vc ¼ 1.14 (�/ �)0.77 [Burley and Jolly,1984] approximately 30 m s�1 for water. Nevertheless, themotion of contact lines on rough surfaces may becomeirregular and give rise to fingering and instabilities thatmay enhance occurrence of bubble entrainment even atlower velocities.
[13] In addition to rapid reconfigurations of the gas-fluid-solid interfacial line or gas-fluid interface, the rapidattachment of contact lines at solid surfaces (at the nextgrain) during advancing wetting front may also entrainsmall air bubbles. The coupling of pressure jumps andinduced oscillations associated rapid interfacial jumps withentrained gas bubbles may mechanically excite the bubblesand induce acoustic emissions at characteristic frequencies.In the context of sound generation by bubbles, Manassehet al. [2008] discussed two key processes leading to passivesound emission: (1) when ‘‘bubbles are pinched off from
an underwater orifice connected to a large, parent body ofgas’’ and (2) when bubbles are created by the entrapmentof air from a free surface. Similar processes and bubble co-alescence have been observed along displacement fluidfronts in porous media [Kovscek and Radke, 2003].Although direct calculations of the role of these processeson analyses of AE measured from displacement fronts isnot yet quantitatively feasible, it is instructive to introducea limiting case of naturally oscillating bubbles in liquid (inresponse to external impulse) giving rise to the so-calledMinnaert frequency [Minnaert, 1933]. An expressionresulting from balancing potential and kinetic energy for abubble with initial radius r0 in water excited by an externalforce is given as [Minnaert, 1933; Devaud et al., 2008]:
f ¼ 1
2�r0
ffiffiffiffiffiffiffiffiffiffi3�P0
�
s� 3:26ðm=sÞ
r0ðmÞ(3)
where P0 is the liquid pressure, � liquid density, and � isthe adiabatic index for air (�1.4). An approximation for theMinnaert frequency for an air bubble in water with radiusof 1 mm under standard conditions would be 3 kHz. Similararguments are envisioned for sound generation forentrained bubbles during snap-off processes at a displace-ment front, and for geometrical constrains imposed by poresizes on ‘‘bubble’’ size and associated AE signature[Manasseh et al., 2008]. As air bubble size ranges from 1mm (contact line entrained) to 1 mm (snap-off) the expectedresonance frequency ranges from 3 to 3000 kHz. The mea-surement range and characteristics of AE sensors determinewhich of these signals are detectable, nevertheless, duringfluid displacement bubble oscillations are likely to repre-sent a significant part of measured AE signals.
2.3. Liquid Bridge Rupture
[14] The rupture of liquid bridges between grains isanother process associated with rapid interfacial reconfigu-ration. As fluid front recedes, the remaining (trapped) liquidbridges gradually shrink below a critical volume resultingin their abrupt rupture [Orr et al., 1975]. Liquid bridge rup-ture energy is dependent on both capillary and viscousforces as shown experimentally by Pitois et al. [2001].Simons et al. [1994] have shown that the interfacial energyrelease is of the order of mJ (similar to rapid changes ofinterfacial area during Haines jumps). Liquid bridge dynam-ics were also studied by Zhang et al. [1996], who found thebreakage time to be in a range of 1 to 20 ms [Michlmayret al., 2012]. We also need to consider an opposite and simi-larly rapid process of liquid drop coalescence and formationof liquid bridges at rates of the order of 10 ns after drops arebrought into contact [Paulsen et al., 2011].
2.4. Snap-Off Processes
[15] Snap-off processes are an integral component of theprocesses during the so called transient state region [Tallakstadet al., 2009a]. Pore spaces in granular media would invariablysatisfy the geometrical condition of rt/rp < 0.5 (with rt andrp throat and pore radius respectively) necessary for theonset of snap-off [Kovscek and Radke, 1996]. Snap-offprocesses were extensively studied by Gauglitz et al.[Ransohoff et al., 1987; Gauglitz et al., 1988; Gauglitz and
W11507 MOEBIUS ET AL.: ACOUSTIC EMISSIONS INDUCED BY FLUID FRONT DISPLACEMENT W11507
3 of 12
Radke, 1989, 1990]. Results propose inertial breakup at lowOhnesorge numbers (ratio of viscous forces to inertial andsurface forces) (<10�2) and viscous processes above. Forwater as the wetting fluid this leads to the condition that in-ertial breakup occurs for throats larger than 0.14 mm. Thedimensionless breakup time for inertial process is in theorder of 104 or larger which is about �16 ms for 0.5 mm. Itwas further found the dimensionless breakup time beingproportional to the local Capillary number (representing theratio of viscous and capillary forces) to the power of �2[Gauglitz and Radke, 1989].
2.5. Grain Collision
[16] Capillary forces and pressure waves may inducegrain motion and associated solid surface friction and parti-cle collisions during fluid front displacement. A recentreview by Michlmayr et al. [2012] lists a range of AE pro-ducing mechanical processes, for example, the estimatedimpact time for 1 mm glass beads moving at 0.05 m s�1
would be about 13 ms, some 3 orders faster than interfacialreconfigurations described above. Separation of AE signalsby grain friction or collision from those generated by fluidinterfacial reconfigurations at the front remain a challenge.In most consolidated porous media such solid phase me-chanical interactions would make a minor contribution tothe total AE, practically, the displacement experimentsreported herein were conducted within confined grainassemblies to reduce the impact of solid phase AE genera-tion to a minimum.
[17] The phenomena above provide an overview of poten-tial sources for rapid energy release resulting in acousticemissions during front displacement through porous media.The energy release, AE source location and rates of excita-
tion result in AE signals with different characteristic values.The focus here is flow related AE signatures without attempt-ing to resolve individual AE generation mechanisms.
3. Experimental Methods3.1. Experimental Setup
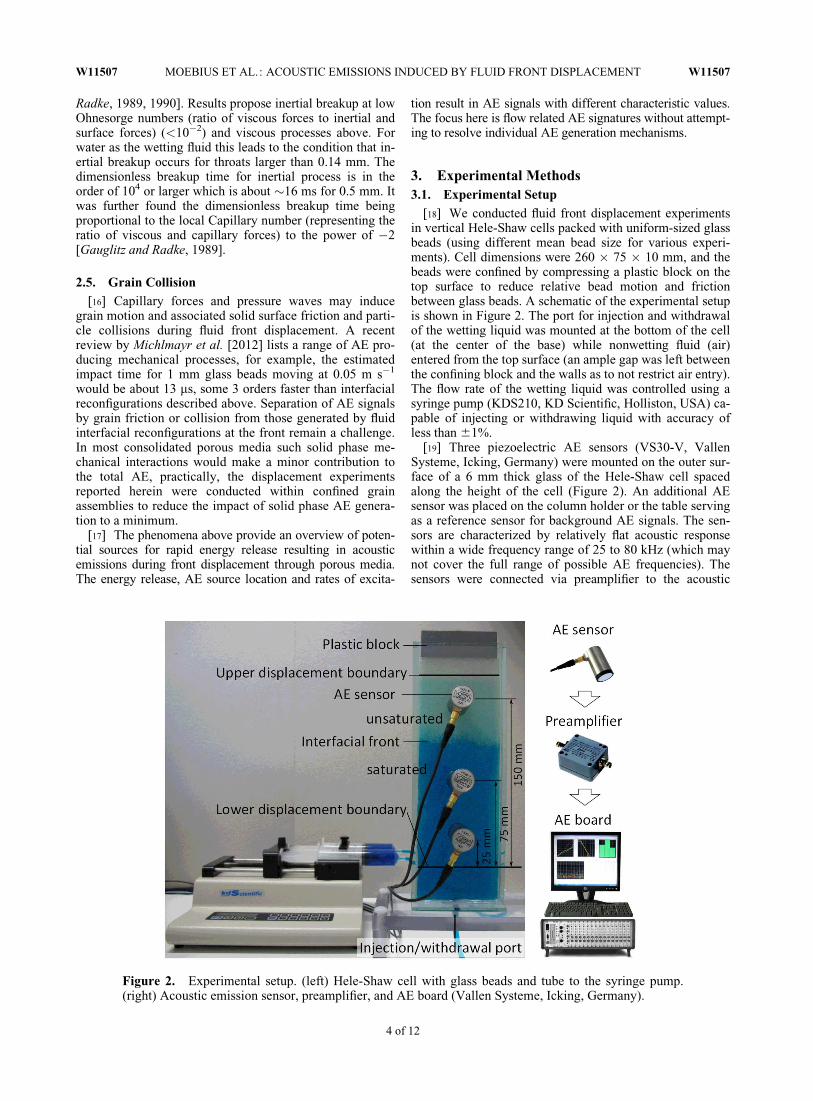
[18] We conducted fluid front displacement experimentsin vertical Hele-Shaw cells packed with uniform-sized glassbeads (using different mean bead size for various experi-ments). Cell dimensions were 260 � 75 � 10 mm, and thebeads were confined by compressing a plastic block on thetop surface to reduce relative bead motion and frictionbetween glass beads. A schematic of the experimental setupis shown in Figure 2. The port for injection and withdrawalof the wetting liquid was mounted at the bottom of the cell(at the center of the base) while nonwetting fluid (air)entered from the top surface (an ample gap was left betweenthe confining block and the walls as to not restrict air entry).The flow rate of the wetting liquid was controlled using asyringe pump (KDS210, KD Scientific, Holliston, USA) ca-pable of injecting or withdrawing liquid with accuracy ofless than 61%.
[19] Three piezoelectric AE sensors (VS30-V, VallenSysteme, Icking, Germany) were mounted on the outer sur-face of a 6 mm thick glass of the Hele-Shaw cell spacedalong the height of the cell (Figure 2). An additional AEsensor was placed on the column holder or the table servingas a reference sensor for background AE signals. The sen-sors are characterized by relatively flat acoustic responsewithin a wide frequency range of 25 to 80 kHz (which maynot cover the full range of possible AE frequencies). Thesensors were connected via preamplifier to the acoustic
Figure 2. Experimental setup. (left) Hele-Shaw cell with glass beads and tube to the syringe pump.(right) Acoustic emission sensor, preamplifier, and AE board (Vallen Systeme, Icking, Germany).
W11507 MOEBIUS ET AL.: ACOUSTIC EMISSIONS INDUCED BY FLUID FRONT DISPLACEMENT W11507
4 of 12
emission measurement system (AMSY-5, Vallen Systeme,Icking, Germany) recording at 10 MHz sampling frequency.The threshold amplitude was set at 30 dB based on back-ground noise.
3.2. Experimental Parameters and BoundaryConditions
[20] The fluid front displacement experiments examineda wide range of parameters considering different pore sizes,flow rates and liquid properties toward assembling a sys-tematic matrix of key factors linking displacement regimesand AE characteristics. Five sizes of glass beads rangingfrom 0.5 to 4.4 mm in diameter (0.5–0.75 mm, 1.00–1.30 mm,2.00–2.40 mm, 2.85–3.45 mm, 3.80–4.40 mm) were usedresulting in estimated average porosities of 0.40 for small and0.43 for larger beads, and span a range of pore sizes. In thefollowing we refer to the lower limit of beads sizes as 0.5,1.00, 2.00, 2.85, and 3.80 mm. As a first approximation ofpore-related AE events, we assumed that the number of poreswas similar to the number of beads in the sample resulting invalues of 6.36 � 105, 1.0 � 105, 1.4 � 104, 4.7 � 103, and2.1 � 103 pores for the five different glass bead sizes (alongthe 180 mm path length in the Hele-Shaw cell marked bysolid lines in Figure 2). We varied the volumetric flow rateq from 5 to 80 mL min�1, resulting in mean displacementfront velocities in the range of 0.25 to 4.6 mm s�1, respec-tively, according to
v ¼ q
A"
where A is the cross section area of the column (750 mm2)and " the porosity. Note that these front velocity estimatesdo not consider effects of phase entrapment emerging athigher front velocities.
[21] The effects of liquid properties on AE behavior wasstudied across a range of liquids with different viscosityand surface tension using distilled water, silicon oil (� ¼10 mPa s at 25�C, Silicon oil DC 200, Sigma-Aldrich),and water with different amounts of surfactant TritonX-100 (Sigma-Aldrich) that modifies water-air surface ten-sion with minimal effects on viscosity and density [Hodgsonand Berg, 1988; Labajos-Broncano et al., 2006]. Concen-trations of 1.9 � 10�6 mol L�1 and 1.5 � 10�4 mol L�1 ofTriton X-100 in distilled water result in surface tension val-ues of 53 mN m�1 and 33 mN m�1 [Labajos-Broncanoet al., 2006]. The visualization of the wetting liquid was
greatly enhanced by adding minute amounts of brilliant blue(<0.5 g L�1) to water (also with Triton X-100) and methylred to silicon oil. The range of Capillary numbers (Ca; ratioof viscous forces to surface tension) induced by flow rates inexperiments with water ranged between 6.2 � 10�4 and 1 �10�2 (indicating dominance of capillary forces), and theBond numbers (Bo; gravitational forces to surface tension)varied in the range from 5.9 � 10�3 to 2.5 � 10�1, suggest-ing significant gravitational forces for experiments withbeads larger than 2.0 mm. A criterion for front displacementregimes proposed by Meheust et al. [2002] using the gener-alized Bond number (Bo� ¼ Bo � Ca) predicts that air dis-placing water in the smallest beads for volumetric flow rateof 80 mL min�1 would yield an unstable displacement frontwith significant viscous fingering. The length scales used tocalculate both Capillary and Bond number were about 1/3of beads diameter.
[22] A series of measurements consisting of several imbi-bition and drainage runs were performed using differentglass beads sizes for each series. We initiated the experi-ments with an imbibition front advancing through initiallydry pack of beads at a volumetric flow rate of 20 mL min�1,followed by drainage and imbibition runs at increasing flowrates for columns with beads larger than 2.0 mm where liq-uid phase entrapment was relatively minor (less than 5%).Due to high values of phase entrapment in the two smallglass bead sizes (diameters of 0.5 and 1.0 mm), to removeambiguities we initiated all imbibition runs into initially drybeads, and all drainage experiments started with fully satu-rated columns. The impact of prewetted glass bead surfacerelative to initially dry beads is discussed in section 4. Thereproducibility of experimental results was evaluated byrepeating all displacement processes with larger glass beadswith water at flow rates of 40 and 80 mL min�1. An over-view over the performed and analyzed experiments isshown in Table 1.
4. Results and Discussion[23] Measured AE signals during the experiments were
characterized by their amplitude, energy content, rise time,duration and hit counts (exceeding a prescribed threshold).We limit the AE data analyses to the number of events (orpores involved per measured AE event), and to measuredAE signal amplitudes. These two attributes are the simplestand most common in AE analyses, and are expected to bearthe signatures of different imbibition and drainage proc-esses, pore sizes, and possibly flow rates. To address the
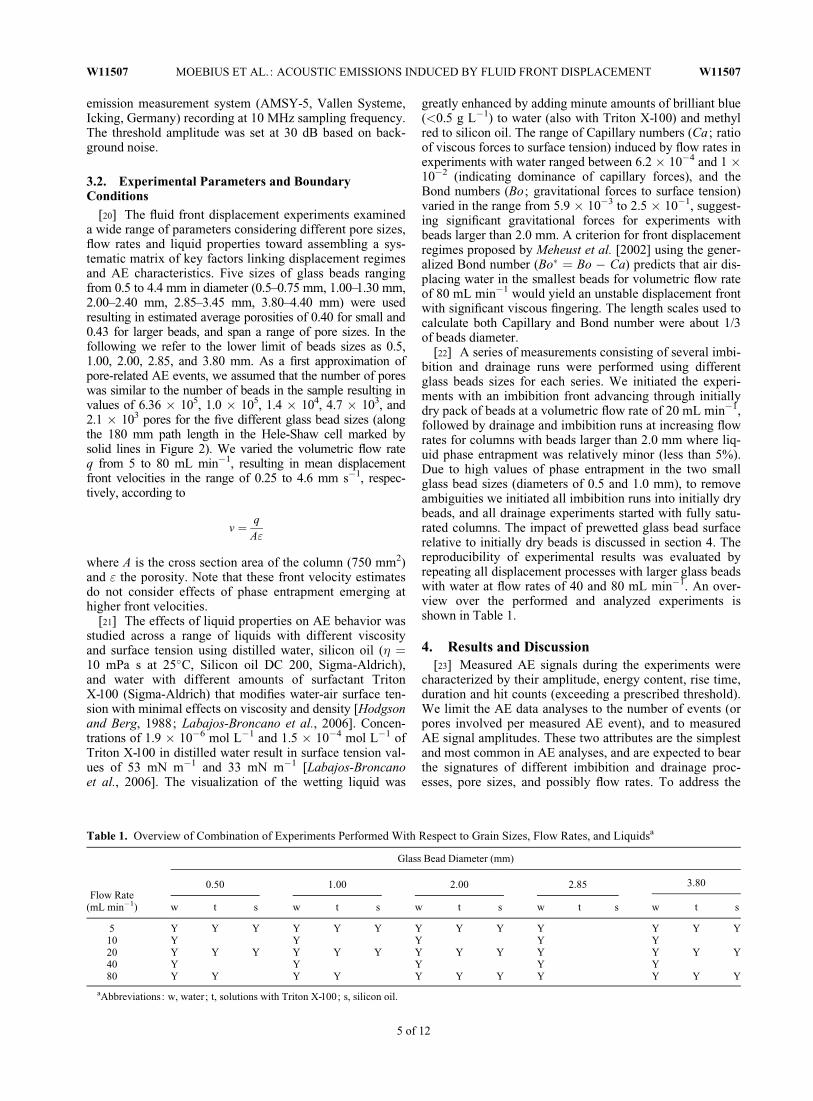
Table 1. Overview of Combination of Experiments Performed With Respect to Grain Sizes, Flow Rates, and Liquidsa
Flow Rate(mL min�1)
Glass Bead Diameter (mm)
0.50 1.00 2.00 2.85 3.80
w t s w t s w t s w t s w t s
5 Y Y Y Y Y Y Y Y Y Y Y Y Y10 Y Y Y Y Y20 Y Y Y Y Y Y Y Y Y Y Y Y Y40 Y Y Y Y Y80 Y Y Y Y Y Y Y Y Y Y Y
aAbbreviations: w, water; t, solutions with Triton X-100; s, silicon oil.
W11507 MOEBIUS ET AL.: ACOUSTIC EMISSIONS INDUCED BY FLUID FRONT DISPLACEMENT W11507
5 of 12
role of signal attenuation and its impact on inferred AEbehavior we studied aspects of attenuation from knowledgeof displacement front position relative to locations of vari-ous AE sensors. The measurement reproducibility wasevaluated by comparing data for runs with same boundaryconditions and experimental parameters (for simplicity,reproducibility was expressed in terms of number of AEevents).
4.1. AE Signals Induced by Displacement of FluidFronts
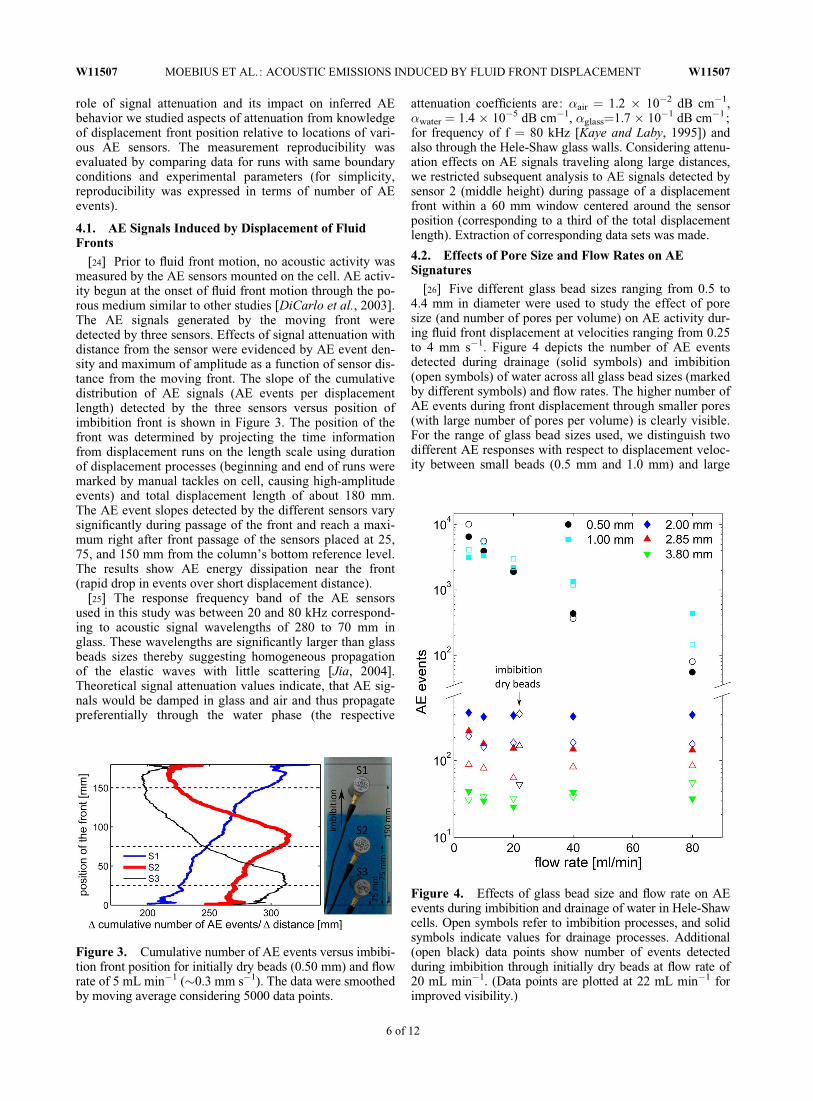
[24] Prior to fluid front motion, no acoustic activity wasmeasured by the AE sensors mounted on the cell. AE activ-ity begun at the onset of fluid front motion through the po-rous medium similar to other studies [DiCarlo et al., 2003].The AE signals generated by the moving front weredetected by three sensors. Effects of signal attenuation withdistance from the sensor were evidenced by AE event den-sity and maximum of amplitude as a function of sensor dis-tance from the moving front. The slope of the cumulativedistribution of AE signals (AE events per displacementlength) detected by the three sensors versus position ofimbibition front is shown in Figure 3. The position of thefront was determined by projecting the time informationfrom displacement runs on the length scale using durationof displacement processes (beginning and end of runs weremarked by manual tackles on cell, causing high-amplitudeevents) and total displacement length of about 180 mm.The AE event slopes detected by the different sensors varysignificantly during passage of the front and reach a maxi-mum right after front passage of the sensors placed at 25,75, and 150 mm from the column’s bottom reference level.The results show AE energy dissipation near the front(rapid drop in events over short displacement distance).
[25] The response frequency band of the AE sensorsused in this study was between 20 and 80 kHz correspond-ing to acoustic signal wavelengths of 280 to 70 mm inglass. These wavelengths are significantly larger than glassbeads sizes thereby suggesting homogeneous propagationof the elastic waves with little scattering [Jia, 2004].Theoretical signal attenuation values indicate, that AE sig-nals would be damped in glass and air and thus propagatepreferentially through the water phase (the respective
attenuation coefficients are: air ¼ 1.2 � 10�2 dB cm�1,water ¼ 1.4 � 10�5 dB cm�1, glass¼1.7 � 10�1 dB cm�1;for frequency of f ¼ 80 kHz [Kaye and Laby, 1995]) andalso through the Hele-Shaw glass walls. Considering attenu-ation effects on AE signals traveling along large distances,we restricted subsequent analysis to AE signals detected bysensor 2 (middle height) during passage of a displacementfront within a 60 mm window centered around the sensorposition (corresponding to a third of the total displacementlength). Extraction of corresponding data sets was made.
4.2. Effects of Pore Size and Flow Rates on AESignatures
[26] Five different glass bead sizes ranging from 0.5 to4.4 mm in diameter were used to study the effect of poresize (and number of pores per volume) on AE activity dur-ing fluid front displacement at velocities ranging from 0.25to 4 mm s�1. Figure 4 depicts the number of AE eventsdetected during drainage (solid symbols) and imbibition(open symbols) of water across all glass bead sizes (markedby different symbols) and flow rates. The higher number ofAE events during front displacement through smaller pores(with large number of pores per volume) is clearly visible.For the range of glass bead sizes used, we distinguish twodifferent AE responses with respect to displacement veloc-ity between small beads (0.5 mm and 1.0 mm) and large
Figure 3. Cumulative number of AE events versus imbibi-tion front position for initially dry beads (0.50 mm) and flowrate of 5 mL min�1 (�0.3 mm s�1). The data were smoothedby moving average considering 5000 data points.
Figure 4. Effects of glass bead size and flow rate on AEevents during imbibition and drainage of water in Hele-Shawcells. Open symbols refer to imbibition processes, and solidsymbols indicate values for drainage processes. Additional(open black) data points show number of events detectedduring imbibition through initially dry beads at flow rate of20 mL min�1. (Data points are plotted at 22 mL min�1 forimproved visibility.)
W11507 MOEBIUS ET AL.: ACOUSTIC EMISSIONS INDUCED BY FLUID FRONT DISPLACEMENT W11507
6 of 12
beads (2.0 mm and larger). In contrast with nearly expo-nential decrease in the number of AE events with increas-ing flow rate in the small beads, the total number of AEevents remained nearly constant across all flow rates in col-umns with large beads.
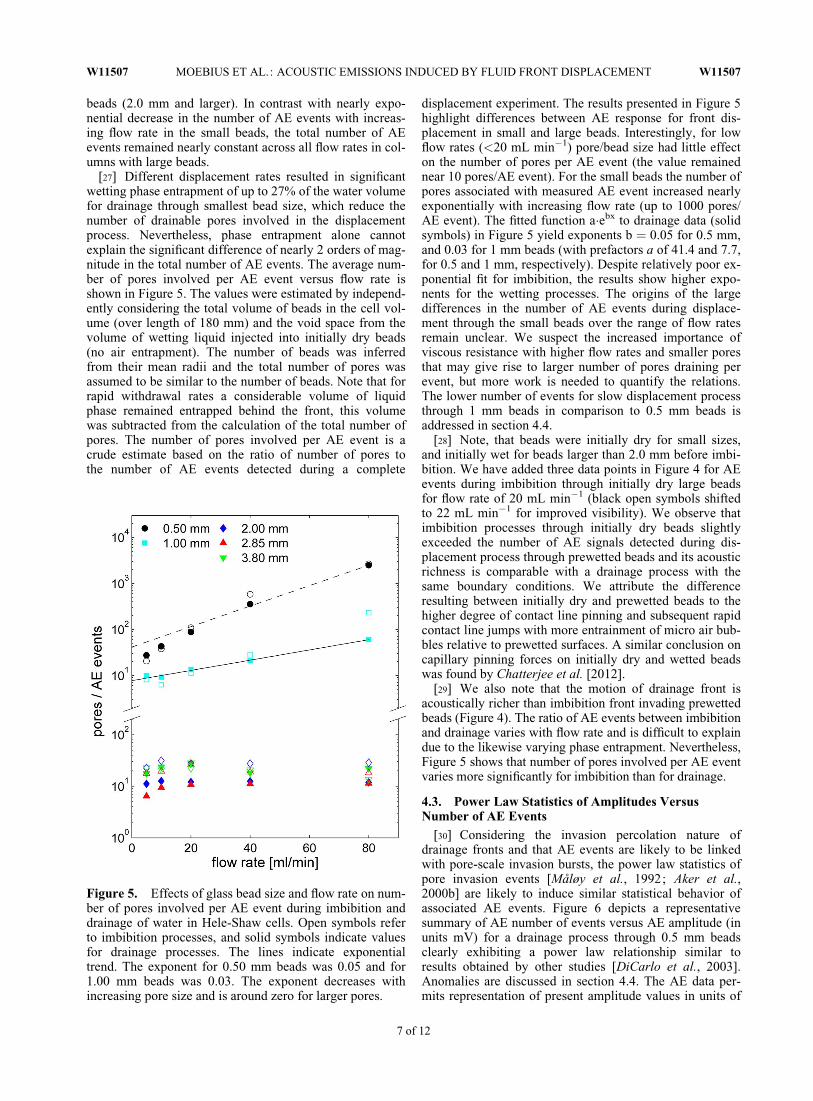
[27] Different displacement rates resulted in significantwetting phase entrapment of up to 27% of the water volumefor drainage through smallest bead size, which reduce thenumber of drainable pores involved in the displacementprocess. Nevertheless, phase entrapment alone cannotexplain the significant difference of nearly 2 orders of mag-nitude in the total number of AE events. The average num-ber of pores involved per AE event versus flow rate isshown in Figure 5. The values were estimated by independ-ently considering the total volume of beads in the cell vol-ume (over length of 180 mm) and the void space from thevolume of wetting liquid injected into initially dry beads(no air entrapment). The number of beads was inferredfrom their mean radii and the total number of pores wasassumed to be similar to the number of beads. Note that forrapid withdrawal rates a considerable volume of liquidphase remained entrapped behind the front, this volumewas subtracted from the calculation of the total number ofpores. The number of pores involved per AE event is acrude estimate based on the ratio of number of pores tothe number of AE events detected during a complete
displacement experiment. The results presented in Figure 5highlight differences between AE response for front dis-placement in small and large beads. Interestingly, for lowflow rates (<20 mL min�1) pore/bead size had little effecton the number of pores per AE event (the value remainednear 10 pores/AE event). For the small beads the number ofpores associated with measured AE event increased nearlyexponentially with increasing flow rate (up to 1000 pores/AE event). The fitted function a�ebx to drainage data (solidsymbols) in Figure 5 yield exponents b ¼ 0.05 for 0.5 mm,and 0.03 for 1 mm beads (with prefactors a of 41.4 and 7.7,for 0.5 and 1 mm, respectively). Despite relatively poor ex-ponential fit for imbibition, the results show higher expo-nents for the wetting processes. The origins of the largedifferences in the number of AE events during displace-ment through the small beads over the range of flow ratesremain unclear. We suspect the increased importance ofviscous resistance with higher flow rates and smaller poresthat may give rise to larger number of pores draining perevent, but more work is needed to quantify the relations.The lower number of events for slow displacement processthrough 1 mm beads in comparison to 0.5 mm beads isaddressed in section 4.4.
[28] Note, that beads were initially dry for small sizes,and initially wet for beads larger than 2.0 mm before imbi-bition. We have added three data points in Figure 4 for AEevents during imbibition through initially dry large beadsfor flow rate of 20 mL min�1 (black open symbols shiftedto 22 mL min�1 for improved visibility). We observe thatimbibition processes through initially dry beads slightlyexceeded the number of AE signals detected during dis-placement process through prewetted beads and its acousticrichness is comparable with a drainage process with thesame boundary conditions. We attribute the differenceresulting between initially dry and prewetted beads to thehigher degree of contact line pinning and subsequent rapidcontact line jumps with more entrainment of micro air bub-bles relative to prewetted surfaces. A similar conclusion oncapillary pinning forces on initially dry and wetted beadswas found by Chatterjee et al. [2012].
[29] We also note that the motion of drainage front isacoustically richer than imbibition front invading prewettedbeads (Figure 4). The ratio of AE events between imbibitionand drainage varies with flow rate and is difficult to explaindue to the likewise varying phase entrapment. Nevertheless,Figure 5 shows that number of pores involved per AE eventvaries more significantly for imbibition than for drainage.
4.3. Power Law Statistics of Amplitudes VersusNumber of AE Events
[30] Considering the invasion percolation nature ofdrainage fronts and that AE events are likely to be linkedwith pore-scale invasion bursts, the power law statistics ofpore invasion events [Måløy et al., 1992; Aker et al.,2000b] are likely to induce similar statistical behavior ofassociated AE events. Figure 6 depicts a representativesummary of AE number of events versus AE amplitude (inunits mV) for a drainage process through 0.5 mm beadsclearly exhibiting a power law relationship similar toresults obtained by other studies [DiCarlo et al., 2003].Anomalies are discussed in section 4.4. The AE data per-mits representation of present amplitude values in units of
Figure 5. Effects of glass bead size and flow rate on num-ber of pores involved per AE event during imbibition anddrainage of water in Hele-Shaw cells. Open symbols referto imbibition processes, and solid symbols indicate valuesfor drainage processes. The lines indicate exponentialtrend. The exponent for 0.50 mm beads was 0.05 and for1.00 mm beads was 0.03. The exponent decreases withincreasing pore size and is around zero for larger pores.
W11507 MOEBIUS ET AL.: ACOUSTIC EMISSIONS INDUCED BY FLUID FRONT DISPLACEMENT W11507
7 of 12
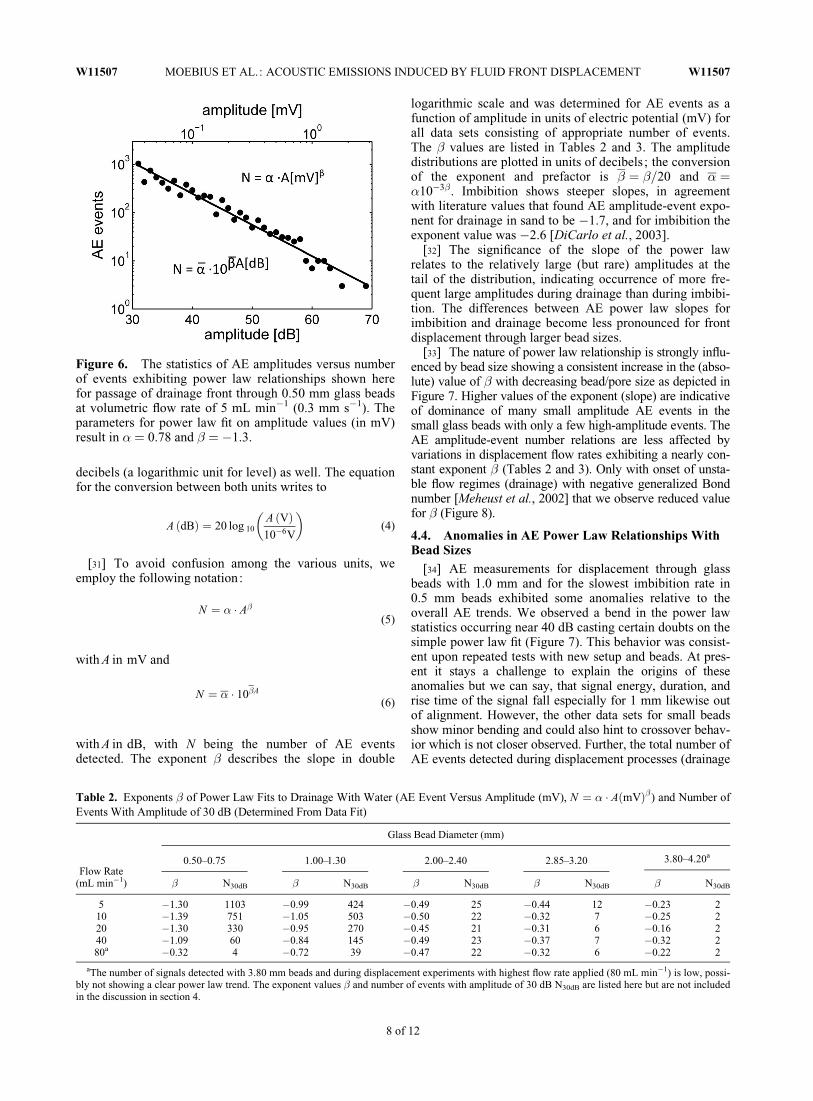
decibels (a logarithmic unit for level) as well. The equationfor the conversion between both units writes to
A ðdBÞ ¼ 20 log 10A ðVÞ10�6V
� �(4)
[31] To avoid confusion among the various units, weemploy the following notation:
N ¼ � A(5)
with A in mV and
N ¼ � 10A
(6)
with A in dB, with N being the number of AE eventsdetected. The exponent describes the slope in double
logarithmic scale and was determined for AE events as afunction of amplitude in units of electric potential (mV) forall data sets consisting of appropriate number of events.The values are listed in Tables 2 and 3. The amplitudedistributions are plotted in units of decibels ; the conversionof the exponent and prefactor is ¼ =20 and ¼10�3. Imbibition shows steeper slopes, in agreementwith literature values that found AE amplitude-event expo-nent for drainage in sand to be �1.7, and for imbibition theexponent value was �2.6 [DiCarlo et al., 2003].
[32] The significance of the slope of the power lawrelates to the relatively large (but rare) amplitudes at thetail of the distribution, indicating occurrence of more fre-quent large amplitudes during drainage than during imbibi-tion. The differences between AE power law slopes forimbibition and drainage become less pronounced for frontdisplacement through larger bead sizes.
[33] The nature of power law relationship is strongly influ-enced by bead size showing a consistent increase in the (abso-lute) value of with decreasing bead/pore size as depicted inFigure 7. Higher values of the exponent (slope) are indicativeof dominance of many small amplitude AE events in thesmall glass beads with only a few high-amplitude events. TheAE amplitude-event number relations are less affected byvariations in displacement flow rates exhibiting a nearly con-stant exponent (Tables 2 and 3). Only with onset of unsta-ble flow regimes (drainage) with negative generalized Bondnumber [Meheust et al., 2002] that we observe reduced valuefor (Figure 8).
4.4. Anomalies in AE Power Law Relationships WithBead Sizes
[34] AE measurements for displacement through glassbeads with 1.0 mm and for the slowest imbibition rate in0.5 mm beads exhibited some anomalies relative to theoverall AE trends. We observed a bend in the power lawstatistics occurring near 40 dB casting certain doubts on thesimple power law fit (Figure 7). This behavior was consist-ent upon repeated tests with new setup and beads. At pres-ent it stays a challenge to explain the origins of theseanomalies but we can say, that signal energy, duration, andrise time of the signal fall especially for 1 mm likewise outof alignment. However, the other data sets for small beadsshow minor bending and could also hint to crossover behav-ior which is not closer observed. Further, the total number ofAE events detected during displacement processes (drainage
Figure 6. The statistics of AE amplitudes versus numberof events exhibiting power law relationships shown herefor passage of drainage front through 0.50 mm glass beadsat volumetric flow rate of 5 mL min�1 (0.3 mm s�1). Theparameters for power law fit on amplitude values (in mV)result in ¼ 0.78 and ¼ �1.3.
Table 2. Exponents of Power Law Fits to Drainage With Water (AE Event Versus Amplitude (mV), N ¼ � AðmVÞ) and Number ofEvents With Amplitude of 30 dB (Determined From Data Fit)
Flow Rate(mL min�1)
Glass Bead Diameter (mm)
0.50–0.75 1.00–1.30 2.00–2.40 2.85–3.20 3.80–4.20a
N30dB N30dB N30dB N30dB N30dB
5 �1.30 1103 �0.99 424 �0.49 25 �0.44 12 �0.23 210 �1.39 751 �1.05 503 �0.50 22 �0.32 7 �0.25 220 �1.30 330 �0.95 270 �0.45 21 �0.31 6 �0.16 240 �1.09 60 �0.84 145 �0.49 23 �0.37 7 �0.32 280a �0.32 4 �0.72 39 �0.47 22 �0.32 6 �0.22 2
aThe number of signals detected with 3.80 mm beads and during displacement experiments with highest flow rate applied (80 mL min�1) is low, possi-bly not showing a clear power law trend. The exponent values and number of events with amplitude of 30 dB N30dB are listed here but are not includedin the discussion in section 4.
W11507 MOEBIUS ET AL.: ACOUSTIC EMISSIONS INDUCED BY FLUID FRONT DISPLACEMENT W11507
8 of 12
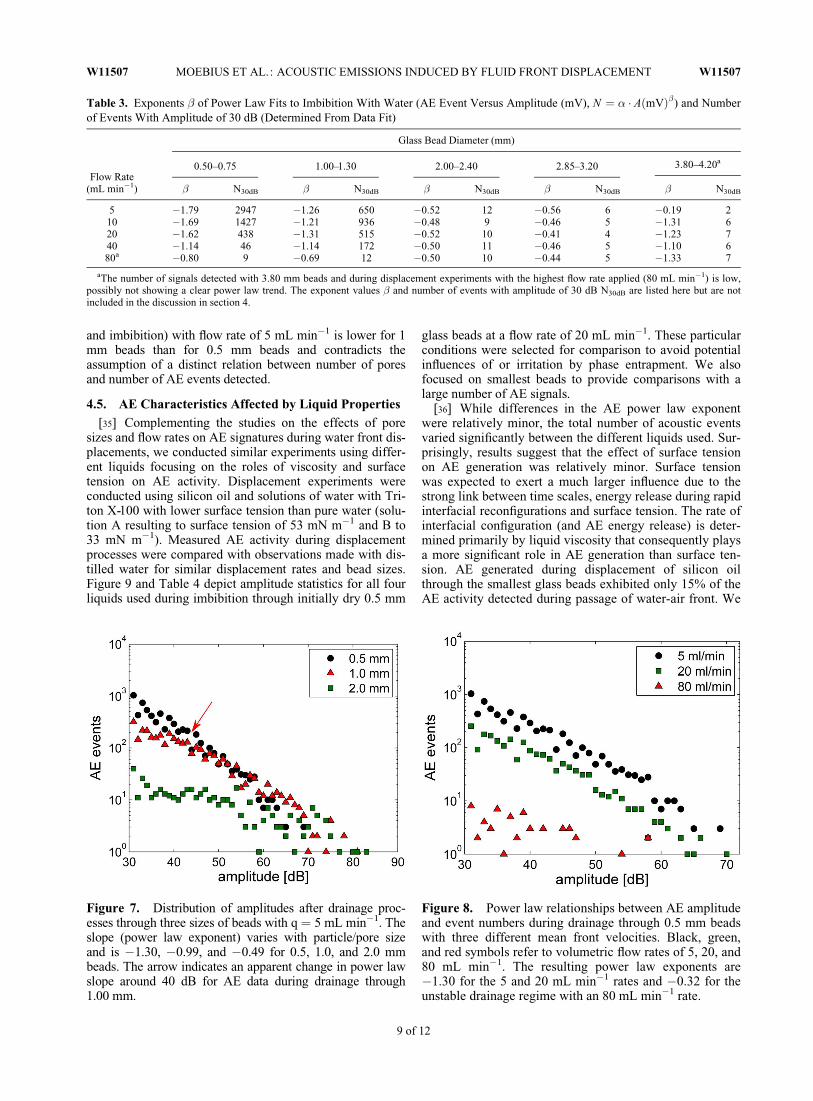
and imbibition) with flow rate of 5 mL min�1 is lower for 1mm beads than for 0.5 mm beads and contradicts theassumption of a distinct relation between number of poresand number of AE events detected.
4.5. AE Characteristics Affected by Liquid Properties
[35] Complementing the studies on the effects of poresizes and flow rates on AE signatures during water front dis-placements, we conducted similar experiments using differ-ent liquids focusing on the roles of viscosity and surfacetension on AE activity. Displacement experiments wereconducted using silicon oil and solutions of water with Tri-ton X-100 with lower surface tension than pure water (solu-tion A resulting to surface tension of 53 mN m�1 and B to33 mN m�1). Measured AE activity during displacementprocesses were compared with observations made with dis-tilled water for similar displacement rates and bead sizes.Figure 9 and Table 4 depict amplitude statistics for all fourliquids used during imbibition through initially dry 0.5 mm
glass beads at a flow rate of 20 mL min�1. These particularconditions were selected for comparison to avoid potentialinfluences of or irritation by phase entrapment. We alsofocused on smallest beads to provide comparisons with alarge number of AE signals.
[36] While differences in the AE power law exponentwere relatively minor, the total number of acoustic eventsvaried significantly between the different liquids used. Sur-prisingly, results suggest that the effect of surface tensionon AE generation was relatively minor. Surface tensionwas expected to exert a much larger influence due to thestrong link between time scales, energy release during rapidinterfacial reconfigurations and surface tension. The rate ofinterfacial configuration (and AE energy release) is deter-mined primarily by liquid viscosity that consequently playsa more significant role in AE generation than surface ten-sion. AE generated during displacement of silicon oilthrough the smallest glass beads exhibited only 15% of theAE activity detected during passage of water-air front. We
Table 3. Exponents of Power Law Fits to Imbibition With Water (AE Event Versus Amplitude (mV), N ¼ � AðmVÞ) and Numberof Events With Amplitude of 30 dB (Determined From Data Fit)
Flow Rate(mL min�1)
Glass Bead Diameter (mm)
0.50–0.75 1.00–1.30 2.00–2.40 2.85–3.20 3.80–4.20a
N30dB N30dB N30dB N30dB N30dB
5 �1.79 2947 �1.26 650 �0.52 12 �0.56 6 �0.19 210 �1.69 1427 �1.21 936 �0.48 9 �0.46 5 �1.31 620 �1.62 438 �1.31 515 �0.52 10 �0.41 4 �1.23 740 �1.14 46 �1.14 172 �0.50 11 �0.46 5 �1.10 680a �0.80 9 �0.69 12 �0.50 10 �0.44 5 �1.33 7
aThe number of signals detected with 3.80 mm beads and during displacement experiments with the highest flow rate applied (80 mL min�1) is low,possibly not showing a clear power law trend. The exponent values and number of events with amplitude of 30 dB N30dB are listed here but are notincluded in the discussion in section 4.
Figure 7. Distribution of amplitudes after drainage proc-esses through three sizes of beads with q ¼ 5 mL min�1. Theslope (power law exponent) varies with particle/pore sizeand is �1.30, �0.99, and �0.49 for 0.5, 1.0, and 2.0 mmbeads. The arrow indicates an apparent change in power lawslope around 40 dB for AE data during drainage through1.00 mm.
Figure 8. Power law relationships between AE amplitudeand event numbers during drainage through 0.5 mm beadswith three different mean front velocities. Black, green,and red symbols refer to volumetric flow rates of 5, 20, and80 mL min�1. The resulting power law exponents are�1.30 for the 5 and 20 mL min�1 rates and �0.32 for theunstable drainage regime with an 80 mL min�1 rate.
W11507 MOEBIUS ET AL.: ACOUSTIC EMISSIONS INDUCED BY FLUID FRONT DISPLACEMENT W11507
9 of 12
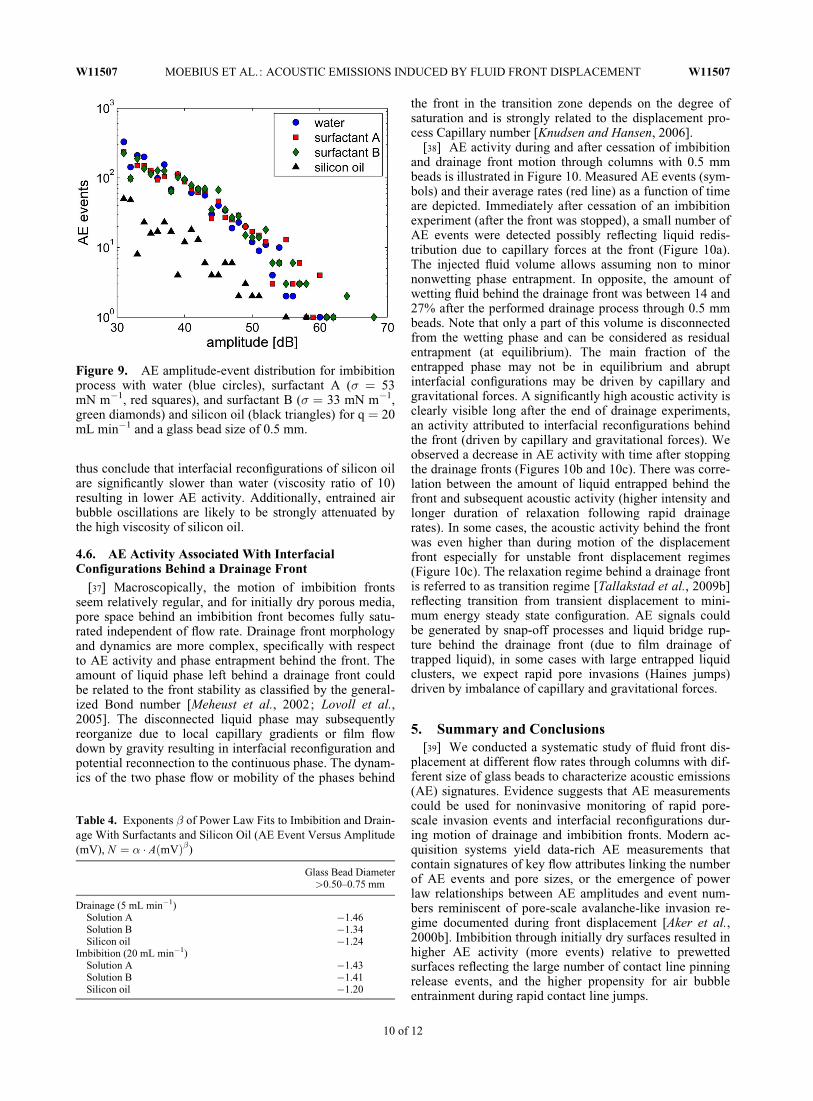
thus conclude that interfacial reconfigurations of silicon oilare significantly slower than water (viscosity ratio of 10)resulting in lower AE activity. Additionally, entrained airbubble oscillations are likely to be strongly attenuated bythe high viscosity of silicon oil.
4.6. AE Activity Associated With InterfacialConfigurations Behind a Drainage Front
[37] Macroscopically, the motion of imbibition frontsseem relatively regular, and for initially dry porous media,pore space behind an imbibition front becomes fully satu-rated independent of flow rate. Drainage front morphologyand dynamics are more complex, specifically with respectto AE activity and phase entrapment behind the front. Theamount of liquid phase left behind a drainage front couldbe related to the front stability as classified by the general-ized Bond number [Meheust et al., 2002; Lovoll et al.,2005]. The disconnected liquid phase may subsequentlyreorganize due to local capillary gradients or film flowdown by gravity resulting in interfacial reconfiguration andpotential reconnection to the continuous phase. The dynam-ics of the two phase flow or mobility of the phases behind
the front in the transition zone depends on the degree ofsaturation and is strongly related to the displacement pro-cess Capillary number [Knudsen and Hansen, 2006].
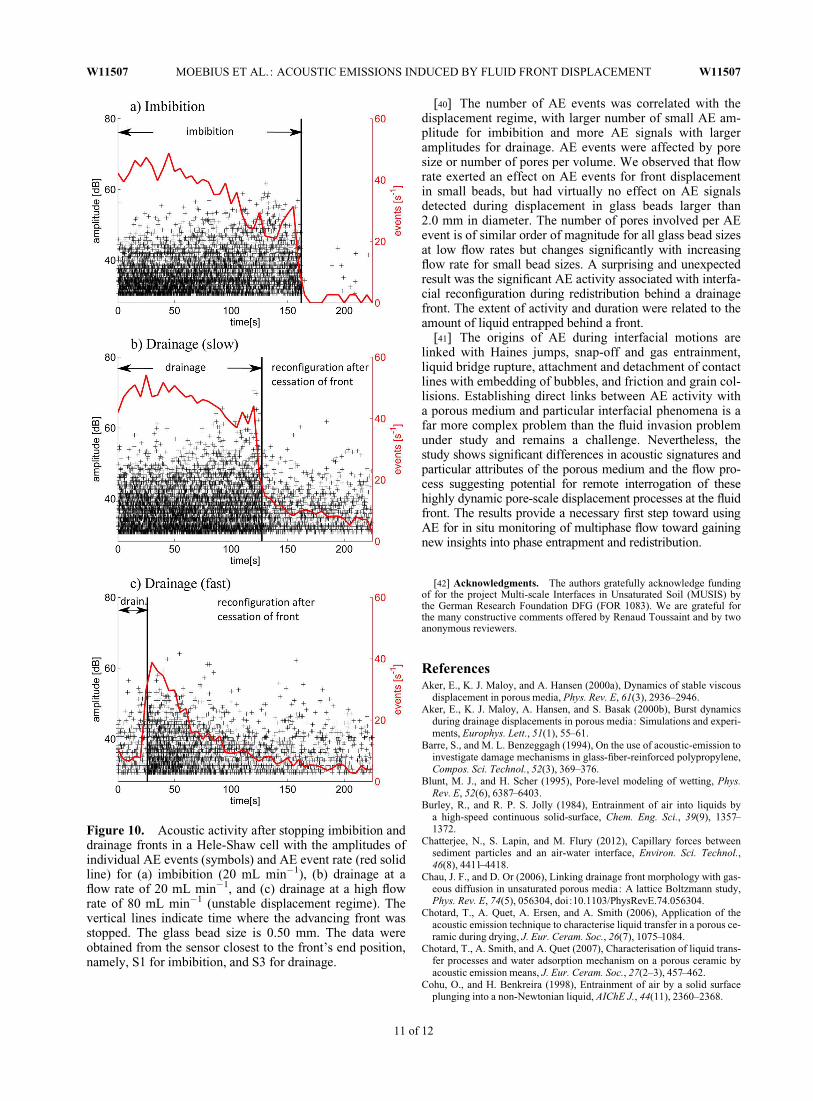
[38] AE activity during and after cessation of imbibitionand drainage front motion through columns with 0.5 mmbeads is illustrated in Figure 10. Measured AE events (sym-bols) and their average rates (red line) as a function of timeare depicted. Immediately after cessation of an imbibitionexperiment (after the front was stopped), a small number ofAE events were detected possibly reflecting liquid redis-tribution due to capillary forces at the front (Figure 10a).The injected fluid volume allows assuming non to minornonwetting phase entrapment. In opposite, the amount ofwetting fluid behind the drainage front was between 14 and27% after the performed drainage process through 0.5 mmbeads. Note that only a part of this volume is disconnectedfrom the wetting phase and can be considered as residualentrapment (at equilibrium). The main fraction of theentrapped phase may not be in equilibrium and abruptinterfacial configurations may be driven by capillary andgravitational forces. A significantly high acoustic activity isclearly visible long after the end of drainage experiments,an activity attributed to interfacial reconfigurations behindthe front (driven by capillary and gravitational forces). Weobserved a decrease in AE activity with time after stoppingthe drainage fronts (Figures 10b and 10c). There was corre-lation between the amount of liquid entrapped behind thefront and subsequent acoustic activity (higher intensity andlonger duration of relaxation following rapid drainagerates). In some cases, the acoustic activity behind the frontwas even higher than during motion of the displacementfront especially for unstable front displacement regimes(Figure 10c). The relaxation regime behind a drainage frontis referred to as transition regime [Tallakstad et al., 2009b]reflecting transition from transient displacement to mini-mum energy steady state configuration. AE signals couldbe generated by snap-off processes and liquid bridge rup-ture behind the drainage front (due to film drainage oftrapped liquid), in some cases with large entrapped liquidclusters, we expect rapid pore invasions (Haines jumps)driven by imbalance of capillary and gravitational forces.
5. Summary and Conclusions[39] We conducted a systematic study of fluid front dis-
placement at different flow rates through columns with dif-ferent size of glass beads to characterize acoustic emissions(AE) signatures. Evidence suggests that AE measurementscould be used for noninvasive monitoring of rapid pore-scale invasion events and interfacial reconfigurations dur-ing motion of drainage and imbibition fronts. Modern ac-quisition systems yield data-rich AE measurements thatcontain signatures of key flow attributes linking the numberof AE events and pore sizes, or the emergence of powerlaw relationships between AE amplitudes and event num-bers reminiscent of pore-scale avalanche-like invasion re-gime documented during front displacement [Aker et al.,2000b]. Imbibition through initially dry surfaces resulted inhigher AE activity (more events) relative to prewettedsurfaces reflecting the large number of contact line pinningrelease events, and the higher propensity for air bubbleentrainment during rapid contact line jumps.
Figure 9. AE amplitude-event distribution for imbibitionprocess with water (blue circles), surfactant A (� ¼ 53mN m�1, red squares), and surfactant B (� ¼ 33 mN m�1,green diamonds) and silicon oil (black triangles) for q ¼ 20mL min�1 and a glass bead size of 0.5 mm.
Table 4. Exponents of Power Law Fits to Imbibition and Drain-age With Surfactants and Silicon Oil (AE Event Versus Amplitude(mV), N ¼ � AðmVÞ)
Glass Bead Diameter>0.50–0.75 mm
Drainage (5 mL min�1)Solution A �1.46Solution B �1.34Silicon oil �1.24
Imbibition (20 mL min�1)Solution A �1.43Solution B �1.41Silicon oil �1.20
W11507 MOEBIUS ET AL.: ACOUSTIC EMISSIONS INDUCED BY FLUID FRONT DISPLACEMENT W11507
10 of 12
[40] The number of AE events was correlated with thedisplacement regime, with larger number of small AE am-plitude for imbibition and more AE signals with largeramplitudes for drainage. AE events were affected by poresize or number of pores per volume. We observed that flowrate exerted an effect on AE events for front displacementin small beads, but had virtually no effect on AE signalsdetected during displacement in glass beads larger than2.0 mm in diameter. The number of pores involved per AEevent is of similar order of magnitude for all glass bead sizesat low flow rates but changes significantly with increasingflow rate for small bead sizes. A surprising and unexpectedresult was the significant AE activity associated with interfa-cial reconfiguration during redistribution behind a drainagefront. The extent of activity and duration were related to theamount of liquid entrapped behind a front.
[41] The origins of AE during interfacial motions arelinked with Haines jumps, snap-off and gas entrainment,liquid bridge rupture, attachment and detachment of contactlines with embedding of bubbles, and friction and grain col-lisions. Establishing direct links between AE activity witha porous medium and particular interfacial phenomena is afar more complex problem than the fluid invasion problemunder study and remains a challenge. Nevertheless, thestudy shows significant differences in acoustic signatures andparticular attributes of the porous medium and the flow pro-cess suggesting potential for remote interrogation of thesehighly dynamic pore-scale displacement processes at the fluidfront. The results provide a necessary first step toward usingAE for in situ monitoring of multiphase flow toward gainingnew insights into phase entrapment and redistribution.
[42] Acknowledgments. The authors gratefully acknowledge fundingof for the project Multi-scale Interfaces in Unsaturated Soil (MUSIS) bythe German Research Foundation DFG (FOR 1083). We are grateful forthe many constructive comments offered by Renaud Toussaint and by twoanonymous reviewers.
ReferencesAker, E., K. J. Maloy, and A. Hansen (2000a), Dynamics of stable viscous
displacement in porous media, Phys. Rev. E, 61(3), 2936–2946.Aker, E., K. J. Maloy, A. Hansen, and S. Basak (2000b), Burst dynamics
during drainage displacements in porous media: Simulations and experi-ments, Europhys. Lett., 51(1), 55–61.
Barre, S., and M. L. Benzeggagh (1994), On the use of acoustic-emission toinvestigate damage mechanisms in glass-fiber-reinforced polypropylene,Compos. Sci. Technol., 52(3), 369–376.
Blunt, M. J., and H. Scher (1995), Pore-level modeling of wetting, Phys.Rev. E, 52(6), 6387–6403.
Burley, R., and R. P. S. Jolly (1984), Entrainment of air into liquids bya high-speed continuous solid-surface, Chem. Eng. Sci., 39(9), 1357–1372.
Chatterjee, N., S. Lapin, and M. Flury (2012), Capillary forces betweensediment particles and an air-water interface, Environ. Sci. Technol.,46(8), 4411–4418.
Chau, J. F., and D. Or (2006), Linking drainage front morphology with gas-eous diffusion in unsaturated porous media: A lattice Boltzmann study,Phys. Rev. E, 74(5), 056304, doi:10.1103/PhysRevE.74.056304.
Chotard, T., A. Quet, A. Ersen, and A. Smith (2006), Application of theacoustic emission technique to characterise liquid transfer in a porous ce-ramic during drying, J. Eur. Ceram. Soc., 26(7), 1075–1084.
Chotard, T., A. Smith, and A. Quet (2007), Characterisation of liquid trans-fer processes and water adsorption mechanism on a porous ceramic byacoustic emission means, J. Eur. Ceram. Soc., 27(2–3), 457–462.
Cohu, O., and H. Benkreira (1998), Entrainment of air by a solid surfaceplunging into a non-Newtonian liquid, AIChE J., 44(11), 2360–2368.
Figure 10. Acoustic activity after stopping imbibition anddrainage fronts in a Hele-Shaw cell with the amplitudes ofindividual AE events (symbols) and AE event rate (red solidline) for (a) imbibition (20 mL min�1), (b) drainage at aflow rate of 20 mL min�1, and (c) drainage at a high flowrate of 80 mL min�1 (unstable displacement regime). Thevertical lines indicate time where the advancing front wasstopped. The glass bead size is 0.50 mm. The data wereobtained from the sensor closest to the front’s end position,namely, S1 for imbibition, and S3 for drainage.
W11507 MOEBIUS ET AL.: ACOUSTIC EMISSIONS INDUCED BY FLUID FRONT DISPLACEMENT W11507
11 of 12
Crandall, D., G. Ahmadi, M. Ferer, and D. H. Smith (2009), Distributionand occurrence of localized-bursts in two-phase flow through porousmedia, Physica A, 388(5), 574–584.
Culligan, K. A., D. Wildenschild, B. S. B. Christensen, W. G. Gray, M. L.Rivers, and A. F. B. Tompson (2004), Interfacial area measurements forunsaturated flow through a porous medium, Water Resour. Res., 40,W12413, doi:10.1029/2004WR003278.
Culligan, K. A., D. Wildenschild, B. S. B. Christensen, W. G. Gray, andM. L. Rivers (2006), Pore-scale characteristics of multiphase flow in po-rous media: A comparison of air-water and oil-water experiments, Adv.Water Resour., 29(2), 227–238.
Devaud, M., T. Hocquet, J. C. Bacri, and V. Leroy (2008), The Minnaertbubble: An acoustic approach, Eur. J. Phys., 29(6), 1263–1285.
DiCarlo, D. A., J. I. G. Cidoncha, and C. Hickey (2003), Acoustic measure-ments of pore-scale displacements, Geophys. Res. Lett., 30(17), 1901,doi:10.1029/2003GL017811.
Dornfeld, D. (1992), Application of acoustic-emission techniques in manu-facturing, NDT&E Int., 25(6), 259–269.
Fries, N., and M. Dreyer (2008), The transition from inertial to viscous flowin capillary rise, J. Colloid Interface Sci., 327(1), 125–128.
Gauglitz, P. A., and C. J. Radke (1989), Dynamics of Haines jumps forcompressible bubbles in constricted capillaries, AIChE J., 35(2), 230–240.
Gauglitz, P. A., and C. J. Radke (1990), The dynamics of liquid-filmbreakup in constricted cylindrical capillaries, J. Colloid Interface Sci.,134(1), 14–40.
Gauglitz, P. A., C. M. Stlaurent, and C. J. Radke (1988), Experimental-determination of gas-bubble breakup in a constricted cylindrical capil-lary, Ind. Eng. Chem. Res., 27(7), 1282–1291.
Haines, W. B. (1930), Studies in the physical properties of soil. V. The hys-teresis effect in capillary properties, and the modes of moisture distribu-tion associated therewith, J. Agric. Sci., 20, 97–116.
Hodgson, K. T., and J. C. Berg (1988), The effect of surfactants on wickingflow in fiber networks, J. Colloid Interface Sci., 121(1), 22–31.
Jia, X. (2004), Codalike multiple scattering of elastic waves in dense granu-lar media, Phys. Rev. Lett., 93(15), 154303, doi:10.1103/PhysRevLett.93.154303.
Johansen, A., and D. Sornette (2000), Critical ruptures, Eur. Phys. J. B,18(1), 163–181.
Jury, W. A., Z. Wang, and A. Tuli (2003), A conceptual model of unstableflow in unsaturated soil during redistribution, Vadose Zone J., 2(1), 61–67.
Kaye, G. W. C., and T. H. Laby (1995), 2.4.1. The speed and attenuation ofsound, in Tables of Physical and Chemical Constants, 16th ed., online ver-sion 1.0, Kaye and Laby Online, Natl. Phys. Lab., Teddington, U. K. [Avail-able at http://www.kayelaby.npl.co.uk/general_physics/2_4/2_4_1.html.]
Knudsen, H. A., and A. Hansen (2006), Two-phase flow in porous media:Dynamical phase transition, Eur. Phys. J B, 49(1), 109–118.
Kovscek, A. R., and C. J. Radke (1996), Gas bubble snap-off under pres-sure-driven flow in constricted noncircular capillaries, Colloids Surf. A,117(1–2), 55–76.
Kovscek, A. R., and C. J. Radke (2003), Pressure-driven capillary snap-offof gas bubbles at low wetting-liquid content, Colloids Surf. A, 212(2–3),99–108.
Labajos-Broncano, L., J. A. Antequera-Barroso, M. L. Gonzalez-Martin,and J. M. Bruque (2006), An experimental study about the imbibition ofaqueous solutions of low concentration of a non-adsorbable surfactant ina hydrophilic porous medium, J. Colloid Interface Sci., 301(1), 323–328.
Lockner, D. (1993), The role of acoustic-emission in the study of rock frac-ture, Int. J. Rock Mech. Min., 30(7), 883–899.
Lord, A. E., and R. M. Koerner (1975), Acoustic emissions in soils and theiruse in assessing earth dam stability, J. Acoust. Soc. Am., 57(2), 516–519.
Lorenceau, E., D. Quere, J. Y. Ollitrault, and C. Clanet (2002), Gravita-tional oscillations of a liquid column in a pipe, Phys. Fluids, 14(6),1985–1992.
Lovoll, G., Y. Meheust, K. J. Maloy, E. Aker, and J. Schmittbuhl (2005),Competition of gravity, capillary and viscous forces during drainage in atwo-dimensional porous medium, a pore scale study, Energy, 30(6), 861–872.
Lovoll, G., M. Jankov, K. J. Maloy, R. Toussaint, J. Schmittbuhl, G. Schafer,and Y. Meheust (2011), Influence of viscous fingering on dynamic satura-tion-pressure curves in porous media, Transp. Porous Media, 86(1), 335–354.
Måløy, K. J., L. Furuberg, J. Feder, and T. Jossang (1992), Dynamics ofslow drainage in porous-media, Phys. Rev. Lett., 68(14), 2161–2164.
Manasseh, R., G. Riboux, and F. Risso (2008), Sound generation on bubblecoalescence following detachment, Int. J. Multiphase Flow, 34(10), 938–949.
Meheust, Y., G. Lovoll, K. J. Maloy, and J. Schmittbuhl (2002), Interfacescaling in a two-dimensional porous medium under combined viscous,gravity, and capillary effects, Phys. Rev. E, 66(5), 051603, doi:10.1103/PhysRevE.66.051603.
Melrose, J. C., and C. F. Brandner (1974), Role of capillary forces in deter-mining microscopic displacement efficiency for oil-recovery by water-flooding, J. Can. Petrol. Technol., 13(1), 13–13.
Michlmayr, G., D. Cohen, and D. Or (2012), Sources and characteristics ofacoustic emissions from mechanically stressed geologic granularmedia—A review, Earth Sci. Rev., 112(3–4), 97–114.
Minnaert, M. (1933), On musical air bubbles and the sounds of runningwater, Philos. Mag., 16(104), 235–248.
Moebius, F., and D. Or (2012), Interfacial jumps and pressure bursts duringfluid displacement in interacting irregular capillaries, J. Colloid InterfaceSci., 377(1), 406–415.
Orr, F. M., L. E. Scriven, and A. P. Rivas (1975), Pendular rings betweensolids—Meniscus properties and capillary force, J. Fluid Mech., 67,723–742.
Paulsen, J. D., J. C. Burton, and S. R. Nagel (2011), Viscous to inertialcrossover in liquid drop coalescence, Phys. Rev. Lett., 106(11), 114501,doi:10.1103/PhysRevLett.106.114501.
Pitois, O., P. Moucheront, and X. Chateau (2001), Rupture energy of a pen-dular liquid bridge, Eur. Phys. J. B, 23(1), 79–86.
Quere, D. (1997), Inertial capillarity, Europhys. Lett., 39(5), 533–538.Quere, D., E. Raphael, and J. Y. Ollitrault (1999), Rebounds in a capillary
tube, Langmuir, 15(10), 3679–3682.Ransohoff, T. C., P. A. Gauglitz, and C. J. Radke (1987), Snap-off of gas-
bubbles in smoothly constricted noncircular capillaries, AIChE J., 33(5),753–765.
Scruby, C. B. (1987), An introduction to acoustic-emission, J. Phys. E, 20(8),947–953.
Simons, S. J. R., J. P. K. Seville, and M. J. Adams (1994), An analysis ofthe rupture energy of pendular liquid bridges, Chem. Eng. Sci., 49(14),2331–2339.
Tallakstad, K. T., G. Lovoll, H. A. Knudsen, T. Ramstad, E. G. Flekkoy,and K. J. Maloy (2009a), Steady-state, simultaneous two-phase flow inporous media: An experimental study, Phys. Rev. E, 80(3), 036308,doi:10.1103/PhysRevE.80.036308.
Tallakstad, K. T., H. A. Knudsen, T. Ramstad, G. Lovoll, K. J. Maloy,R. Toussaint, and E. G. Flekkoy (2009b), Steady-state two-phase flow inporous media: Statistics and transport properties, Phys. Rev. Lett., 102(7),074502, doi:10.1103/PhysRevLett.102.074502.
Tuller, M., D. Or, and L. M. Dudley (1999), Adsorption and capillary con-densation in porous media: Liquid retention and interfacial configura-tions in angular pores, Water Resour. Res., 35(7), 1949–1964.
Wildenschild, D., J. W. Hopmans, C. M. P. Vaz, M. L. Rivers, D. Rikard,and B. S. B. Christensen (2002), Using X-ray computed tomography inhydrology: Systems, resolutions, and limitations, J. Hydrol., 267(3–4),285–297.
Zhang, X., R. S. Padgett, and O. A. Basaran (1996), Nonlinear deformationand breakup of stretching liquid bridges, J. Fluid Mech., 329, 207–245.
W11507 MOEBIUS ET AL.: ACOUSTIC EMISSIONS INDUCED BY FLUID FRONT DISPLACEMENT W11507
12 of 12
Related Documents