Chapter 5 DERIVATIVES OF EXPONENTIAL AND TRIGONOMETRIC FUNCTIONS The world’s population experiences exponential growth—the rate of growth becomes more rapid as the size of the population increases. Can this be explained in the language of calculus? Well, the rate of growth of the population is described by an exponential function, and the derivative of the population with respect to time is a constant multiple of the population at any time t. There are also many situations that can be modelled by trigonometric functions, whose derivative also provides a model for instantaneous rate of change at any time t. By combining the techniques in this chapter with the derivative rules seen earlier, we can find the derivative of an exponential or trigonometric function that is combined with other functions. Logarithmic functions and exponential functions are inverses of each other, and, in this chapter, you will also see how their graphs and properties are related to each other. CHAPTER EXPECTATIONS In this chapter, you will • define e and the derivative of Section 5.1 • determine the derivative of the general exponential function Section 5.2 • compare the graph of an exponential function with the graph of its derivative, Sections 5.1, 5.2 • solve optimization problems using exponential functions, Section 5.3 • investigate and determine the derivatives of sinusoidal functions, Section 5.4 • determine the derivative of the tangent function, Section 5.5 • solve rate of change problems involving exponential and trigonometric function models using their derivatives, Sections 5.1 to 5.5 y b x , y e x , NEL

Welcome message from author
This document is posted to help you gain knowledge. Please leave a comment to let me know what you think about it! Share it to your friends and learn new things together.
Transcript
Chapter 5
DERIVATIVES OF EXPONENTIAL AND TRIGONOMETRIC FUNCTIONS
The world’s population experiences exponential growth—the rate of growthbecomes more rapid as the size of the population increases. Can this be explainedin the language of calculus? Well, the rate of growth of the population is describedby an exponential function, and the derivative of the population with respect totime is a constant multiple of the population at any time t. There are also manysituations that can be modelled by trigonometric functions, whose derivative alsoprovides a model for instantaneous rate of change at any time t. By combining thetechniques in this chapter with the derivative rules seen earlier, we can find thederivative of an exponential or trigonometric function that is combined with otherfunctions. Logarithmic functions and exponential functions are inverses of eachother, and, in this chapter, you will also see how their graphs and properties arerelated to each other.
CHAPTER EXPECTATIONSIn this chapter, you will
• define e and the derivative of Section 5.1
• determine the derivative of the general exponential function Section 5.2
• compare the graph of an exponential function with the graph of its derivative,Sections 5.1, 5.2
• solve optimization problems using exponential functions, Section 5.3
• investigate and determine the derivatives of sinusoidal functions, Section 5.4
• determine the derivative of the tangent function, Section 5.5
• solve rate of change problems involving exponential and trigonometric functionmodels using their derivatives, Sections 5.1 to 5.5
y � bx,
y � ex,
NEL

Review of Prerequisite Skills
In Chapter 5, you will be studying the derivatives of two classes of functions thatoccur frequently in calculus problems: exponential functions and trigonometricfunctions. To begin, we will review some of the properties of exponential andtrigonometric functions.
Properties of Exponents•
•
•
•
•
Properties of the Exponential Function,• The base b is positive and • The y-intercept is 1.• The x-axis is a horizontal asymptote.• The domain is the set of real numbers, R.• The range is the set of positive real numbers.• The exponential function is always increasing if • The exponential function is always decreasing if • The inverse of is • The inverse is called the logarithmic function and is written as
Graphs of and y � bxy � logbx
logbx � y.x � by.y � bx
0 6 b 6 1.b 7 1.
b � 1.y � bx
logb bm � m
blogbm � m
1bm 2n � bmn
bm
bn � bm�n, bn � 0
bmbn � bm�n
R E V I E W O F P R E R E Q U I S I T E S K I L L S222
for b 7 1 for 0 6 b 6 1
y
x2
4
–24
–4
0 2–4 –2
y = bx
y = xy = logbx
y
x2
4
–24
–4
0 2–4 –2
y = bx
y = logbxy = x
• If for then logbn � m.b 7 0,bm � n
NEL
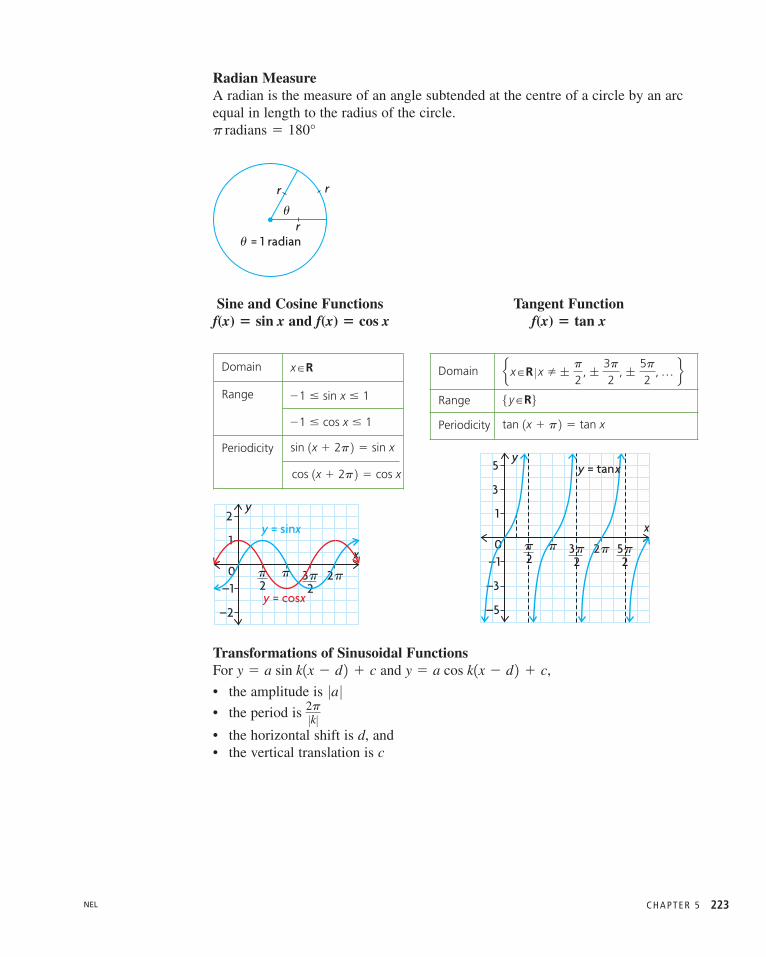
Sine and Cosine Functions Tangent Function f(x) sin x and f(x) cos x f(x) tan x���
C H A P T E R 5 223
u = 1 radian
u
r
r
r
Domain x�R
Range �1 � sin x � 1
�1 � cos x � 1
Periodicity sin 1x � 2p 2 � sin x
cos 1x � 2p 2 � cos x
y
x1
2
–1
–2
0
y = sinx
y = cosx2p p 2p
23p
Transformations of Sinusoidal FunctionsFor and ,
• the amplitude is
• the period is
• the horizontal shift is d, and• the vertical translation is c
2p�k�
0a 0 y � a cos k1x � d 2 � cy � a sin k1x � d 2 � c
Radian MeasureA radian is the measure of an angle subtended at the centre of a circle by an arcequal in length to the radius of the circle.p radians � 180°
Domain e x�R � x � ; p
2, ;
3p2
, ; 5p2
, p fRange 5 y�R6Periodicity tan 1x � p 2 � tan x
y
x1
3
–1
5
–3
–5
02p p 2p
23p
25p
y = tanx
NEL
R E V I E W O F P R E R E Q U I S I T E S K I L L S224
Exercise
1. Evaluate each of the following:
a. b. c. d.
2. Express each of the following in the equivalent logarithmic form:
a. c. e.
b. d. f.
3. Sketch the graph of each function, and state its x-intercept.
a. b.
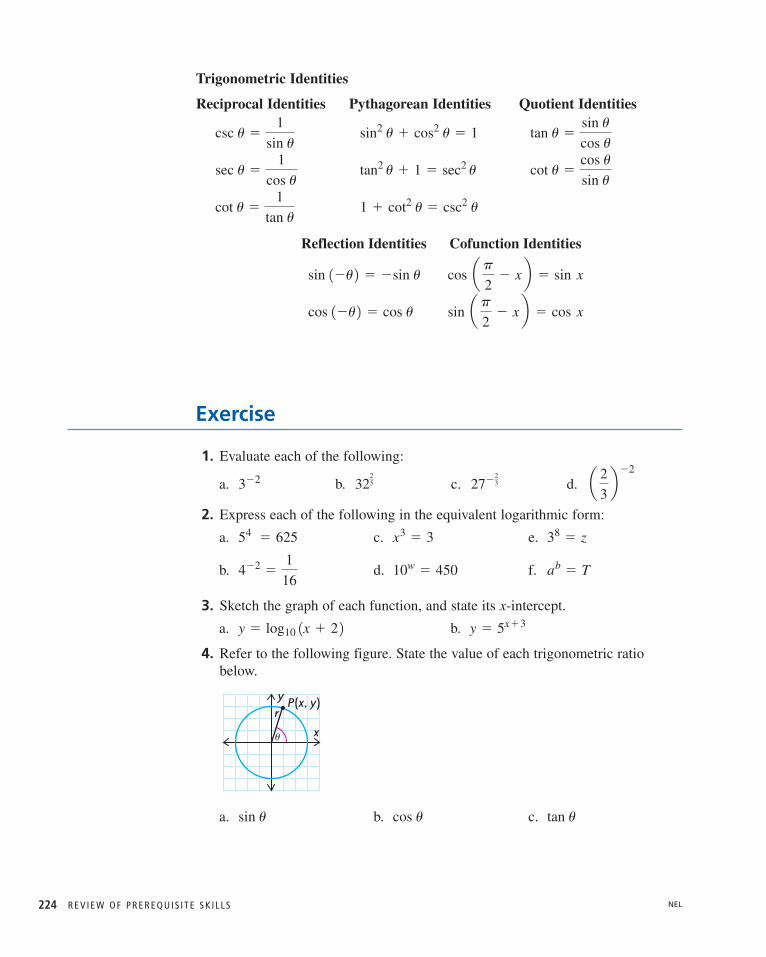
4. Refer to the following figure. State the value of each trigonometric ratiobelow.
a. b. c. tan ucos usin u
y
x
P(x, y)r
u
y � 5x�3y � log10 1x � 2 2ab � T10w � 4504�2 �
1
16
38 � zx3 � 354 � 625
a 2
3b�2
27�2332
253�2
Trigonometric Identities
Reflection Identities Cofunction Identities
sin ap2
� x b � cos xcos 1�u 2 � cos u
cos ap2
� x b � sin xsin 1�u 2 � �sin u
Reciprocal Identities Pythagorean Identities Quotient Identities
1 � cot2 u � csc2 ucot u �1
tan u
cot u �cos u
sin utan2 u � 1 � sec2 usec u �
1
cos u
tan u �sin u
cos usin2 u � cos2 u � 1csc u �
1
sin u
NEL

5. Convert the following angles to radian measure:
a. c. e. g.
b. d. f. h.
6. Refer to the following figure. State the value of each trigonometric ratiobelow.
a. c. e.
b. d. f.
7. The value of or is given. Determine the values of the othertwo functions if lies in the given interval.
a. c.
b. d.
8. State the period and amplitude of each of the following:
a. d.
b. e.
c. f.
9. Sketch the graph of each function over two complete periods.
a. b.
10. Prove the following identities:
a. b.
11. Solve the following equations, where .
a. b. cos x � 1 � �cos x3 sin x � sin x � 1
x� 30, 2p 4sin x
1 � sin2 x� tan x sec xtan x � cot x � sec x csc x
y � 3 cos a x �p
2by � sin 2x � 1
y � 03 sin x 0y � �3 sin 1px 2 � 1
y � 5 sin a u � p
6by � 2 sin
x
2
y �2
7 cos 112x 2y � cos 2x
0 � u � psin u � 1,p � u �3p
2cos u � �
2
3,
3p
2� u � 2ptan u � �2,
p
2� u � psin u �
5
13,
u
tan ucos u,sin u,
sin 1�u 2sin ap2
� u btan u
cos ap2
� u bcos usin u
y
x
(b, a)(a, b)
(1, 0)
(0, 1)
u
u
330°�120°30°45°
225°270°�90°360°
C H A P T E R 5 225NEL
C A R E E R L I N K226
InvestigateCAREER LINK
CHAPTER 5: RATE-OF-CHANGE MODELS IN MICROBIOLOGY
While many real-life situations can be modelled fairly well by polynomialfunctions, there are some situations that are best modelled by other types offunctions, including exponential, logarithmic, and trigonometric functions.Because determining the derivative of a polynomial function is simple, findingthe rate of change for models described by polynomial functions is also simple.Often the rate of change at various times is more important to the personstudying the scenario than the value of the function is. In this chapter, you willlearn how to differentiate exponential and trigonometric functions, increasingthe number of function types you can use to model real-life situations and, inturn, analyze using rates of change.
Case Study—Microbiologist
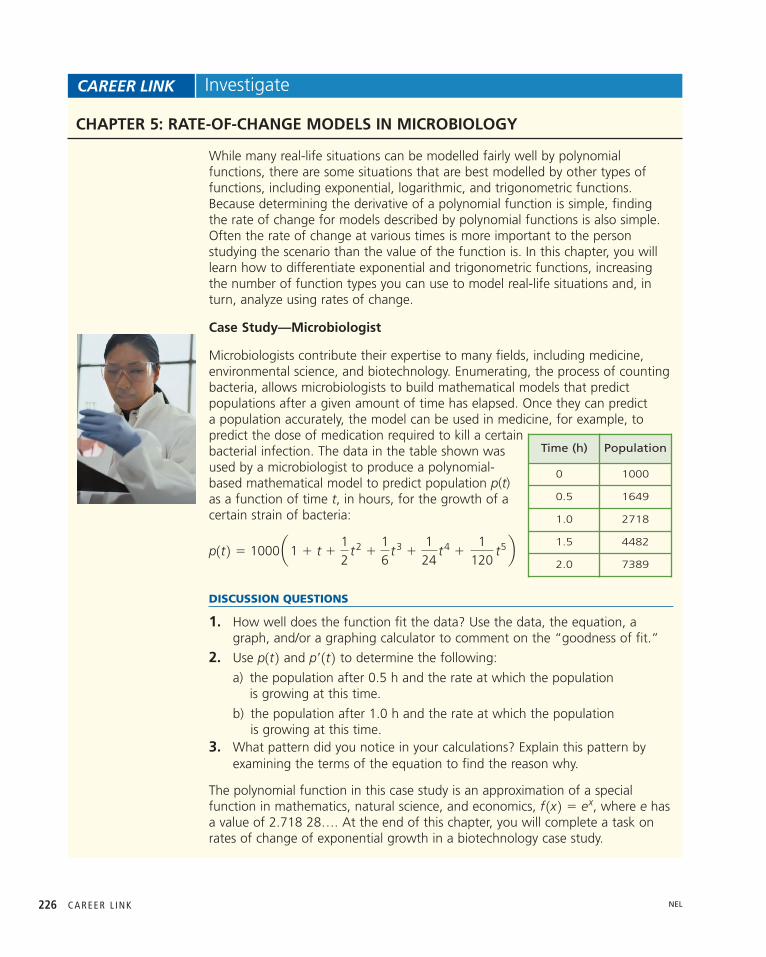
Microbiologists contribute their expertise to many fields, including medicine,environmental science, and biotechnology. Enumerating, the process of countingbacteria, allows microbiologists to build mathematical models that predictpopulations after a given amount of time has elapsed. Once they can predict a population accurately, the model can be used in medicine, for example, topredict the dose of medication required to kill a certainbacterial infection. The data in the table shown wasused by a microbiologist to produce a polynomial-based mathematical model to predict population p(t)as a function of time t, in hours, for the growth of acertain strain of bacteria:
p1t 2 � 1000 a1 � t �12
t2 �16
t3 �124
t4 �1
120t5 b
Time (h) Population
0 1000
0.5 1649
1.0 2718
1.5 4482
2.0 7389
DISCUSSION QUESTIONS
1. How well does the function fit the data? Use the data, the equation, agraph, and/or a graphing calculator to comment on the “goodness of fit.”
2. Use and to determine the following:
a) the population after 0.5 h and the rate at which the population is growing at this time.
b) the population after 1.0 h and the rate at which the population is growing at this time.
3. What pattern did you notice in your calculations? Explain this pattern byexamining the terms of the equation to find the reason why.
The polynomial function in this case study is an approximation of a specialfunction in mathematics, natural science, and economics, , where e hasa value of 2.718 28…. At the end of this chapter, you will complete a task onrates of change of exponential growth in a biotechnology case study.
f 1x 2 � ex
p¿ 1t 2p1t 2
NEL

C H A P T E R 5 227
Section 5.1—Derivatives of ExponentialFunctions,
Many mathematical relations in the world are nonlinear. We have already studiedvarious polynomial and rational functions and their rates of change. Another type ofnonlinear model is the exponential function. Exponential functions are often used tomodel rapid change. Compound interest, population growth, the intensity of anearthquake, and radioactive decay are just a few examples of exponential change.
In this section, we will study the exponential function and its derivative.The number e is a special irrational number, like the number . It is called thenatural number, or Euler’s number in honour of the Swiss mathematicianLeonhard Euler (pronounced “oiler”), who lived from 1707 to 1783. We use arational approximation for e of about 2.718. The rules developed thus far havebeen applied to polynomial functions and rational functions. We are now going toshow how the derivative of an exponential function can be found.
INVESTIGATION In this investigation, you will• graph the exponential function and its derivative• determine the relationship between the exponential function and its derivative
A.Consider the function Create a table similar to the one shown below.Complete the column by using a graphing calculator to calculate the valuesof for the values of x provided. Round all values to three decimal places.ex
f 1x 2 f 1x 2 � ex.
f 1x 2 � ex
p
y � ex
y � ex
x f (x) f’(x)
�2 0.135
�1
0
1
2
3
B. Graph the function C. Use a graphing calculator to calculate the value of the derivative at each
of the given points.To calculate , press and scroll down to 8:nDeriv( under the
MATH menu. Press and the display on the screen will be nDeriv(.
To find the derivative, key in the expression the variable x, and the x-value ex,
ENTER
MATHf ¿ 1x 2 f ¿ 1x 2f 1x 2 � ex.
To evaluatepowers of e, suchas , press
.ENTER2
2LN2ND
e�2
Tech Support
NEL
at which you want the derivative, for example, to determine
the display will be nDeriv( X, ). Press , and the approximatevalue of will be returned.
D.What do you notice about the values of and ?E. Draw the graph of the derivative function on the same set of axes as
How do the two graphs compare?F. Try a few other values of x to see if the pattern continues.G.What conclusion can you make about the function and its derivative?
Properties of y ex
Since is an exponential function, it has the same properties as other exponential functions you have studied.
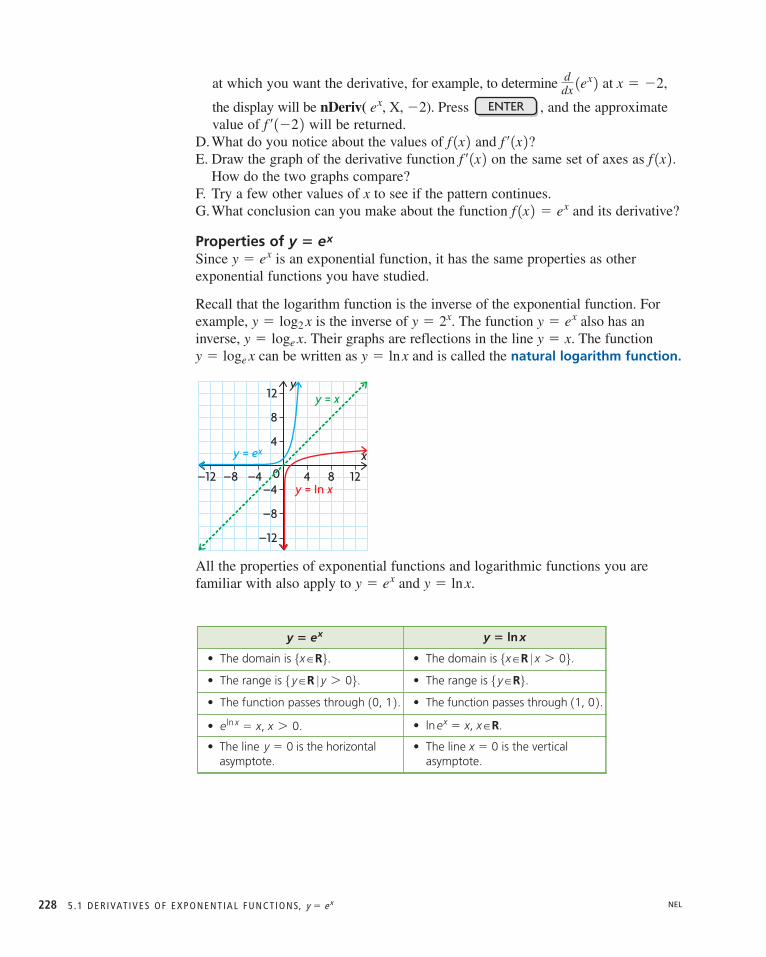
Recall that the logarithm function is the inverse of the exponential function. Forexample, is the inverse of The function also has aninverse, Their graphs are reflections in the line The function
can be written as and is called the natural logarithm function.
All the properties of exponential functions and logarithmic functions you arefamiliar with also apply to and y � ln x.y � ex
y
x0
12
4 8 12
4
8
–4
–12
–8
–4–8–12
y = ex
y = x
y = In x
y � ln xy � loge xy � x.y � loge x.y � exy � 2x.y � log2 x
y � ex�
f 1x 2 � ex
f 1x 2 .f ¿ 1x 2 f ¿ 1x 2f 1x 2f ¿ 1�2 2 ENTER�2ex,
ddx 1ex 2 at x � �2,
5 . 1 D E R I VAT I V E S O F E X P O N E N T I A L F U N C T I O N S, y � e x228
y � ex y � ln x
• The domain is .5x�R6 • The domain is .5x�R 0 x 7 06• The range is .5 y�R 0 y 7 06 • The range is .5 y�R6• The function passes through .10, 1 2 • The function passes through .11, 0 2• .e ln x � x, x 7 0 • .ln ex � x, x�R
• The line is the horizontalasymptote.
y � 0 • The line is the verticalasymptote.
x � 0
NEL

C H A P T E R 5 229
Derivative of f(x)For the function f ¿ 1x 2 � ex.f 1x 2 � ex,
� ex
From the investigation, you should have noticed that all the values of the derivative were exactly the same as those of the original function This is a very significant result, since this function is its own derivative—that is,
Since the derivative also represents the slope of the tangent at anygiven point, the function has the special property that the slope of thetangent at a point is the value of the function at this point.
y
x0
12
4 8 12
4
8
–4
–12
–8
–4–8–12
f (x) = ex
(1, e1)
(2, e2)The slope of thetangent at (2, e2) ise2, and so on.
The slope of thetangent at (1, e1)is e1.
f 1x 2 � exf 1x 2 � f ¿ 1x 2 . f 1x 2 � ex.f ¿ 1x 2
EXAMPLE 1 Selecting a strategy to differentiate a composite function involving ex
Determine the derivative of
SolutionTo find the derivative, use the chain rule.
� 3e3x
� e3x � 3
df 1x 2dx
�d1e3x 2d 13x 2 d 13x 2
dx
f 1x 2 � e3x.
Derivative of a Composite Function Involving ex
In general, if f (x) (x), then (x) (x) (x) by the chain rule. g¿� egf ¿� eg
NEL
EXAMPLE 2 Derivatives of exponential functions involving ex
Determine the derivative of each function.a.
b.
Solutiona. To find the derivative of we use the chain rule.
(Chain rule)
b. Using the product rule,
(Product rule)
(Factor)
EXAMPLE 3 Selecting a strategy to determine the value of the derivative
Given determine
SolutionFirst, find an expression for the derivative of
(Chain rule)
Then
Answers are usually left as exact values in this form. If desired, numeric approximations can be obtained from a calculator. Here, using the value of eprovided by the calculator, we obtain the answer rounded to four decimal places.
�16.3097,
f ¿ 1�1 2 � �6e.
� 6xex2
� 3ex212x 2d13ex2 2d1x2 2
dx2
dxf ¿1x 2 �
f ¿1x 2 .f ¿1�1 2 .f 1x 2 � 3ex2
,
� ex12x � x2 2� 2xex � x2ex
f ¿ 1x 2 �d1x2 2
dx� ex � x2 �
dex
dx
� ex2�x12x � 1 2�d1ex2�x 2
d1x2 � x 2 �d1x2 � x 2
dx
dg1x 2dx
�d1ex2�x 2
dx
g 1x 2 � ex2�x,
f 1x 2 � x2ex
g 1x 2 � ex2�x
5 . 1 D E R I VAT I V E S O F E X P O N E N T I A L F U N C T I O N S, y � e x230 NEL
EXAMPLE 4 Connecting the derivative of an exponential function to the slope of a tangent
Determine the equation of the line tangent to where
SolutionUse the derivative to determine the slope of the required tangent.
(Rewrite as a product)
(Product rule)
(Determine a common denominator)
(Simplify)
(Factor)
When When and the tangent is horizontal.
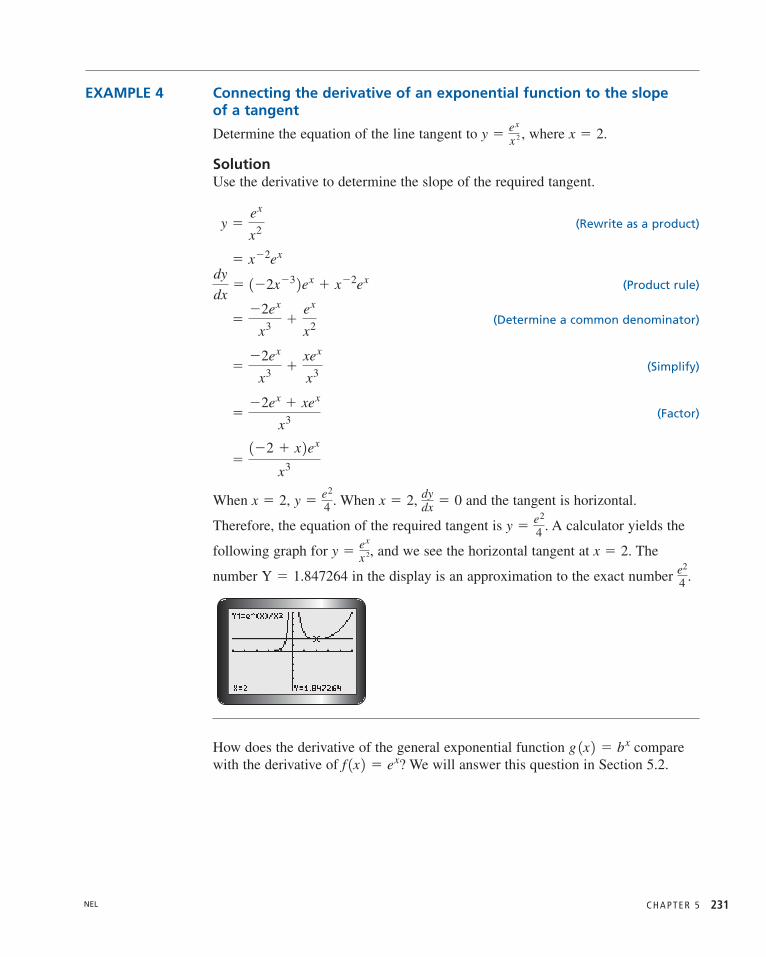
Therefore, the equation of the required tangent is A calculator yields the
following graph for and we see the horizontal tangent at The
number in the display is an approximation to the exact number .
How does the derivative of the general exponential function comparewith the derivative of We will answer this question in Section 5.2.f 1x 2 � ex?
g 1x 2 � bx
e2
4Y � 1.847264
x � 2.y �ex
x 2,
y �e2
4 .
dydx � 0x � 2,y �
e2
4 .x � 2,
�1�2 � x 2ex
x3
��2ex � xex
x3
��2ex
x3 �xex
x3
��2ex
x3 �ex
x2
dy
dx� 1�2x�3 2ex � x�2ex
� x�2ex
y �ex
x2
x � 2.y �ex
x 2 ,
C H A P T E R 5 231NEL
Exercise 5.1
PART A1. Why can you not use the power rule for derivatives to differentiate
2. Differentiate each of the following:
a. c. e.
b. d. f.
3. Determine the derivative of each of the following:
a. c. e.
b. d. f.
4. a. If calculate
b. If calculate
c. If calculate
5. a. Determine the equation of the tangent to the curve defined by at the point
b. Use graphing technology to graph the function in part a., and draw the tangent at
c. Compare the equation in part a. with the equation generated by graphingtechnology. Do they agree?
10, 1 2 .10, 1 2 . y �2ex
1 � ex
h¿ 1�1 2 .h1z 2 � z211 � e�z 2 , f ¿ 10 2 .f 1x 2 � e� 1 1x�12, f ¿ 11 2 .f 1x 2 �
13 1e3x � e�3x 2 , g 1t 2 �
e2t
1 � e2tf 1x 2 � Vxexy � xe3x
h 1t 2 � et2 � 3e�tf 1x 2 �e�x3
xy � 2ex3
y � eVxy � e�3xs � e3t�5
y � e5�6x�x2y � 2e10ty � e3x
y � ex?
5 . 1 D E R I VAT I V E S O F E X P O N E N T I A L F U N C T I O N S, y � e x232
K
NEL
IN SUMMARY
Key Ideas
• For
In Leibniz notation,
• For
In Leibniz notation, .
• The slope of the tangent at a point on the graph of equals the value of the function at this point.
Need to Know
• The rules for differentiating functions, such as the product, quotient, andchain rules, also apply to combinations involving exponential functions of theform
• e is called Euler's number or the natural number, where e 2.718.�
f1x 2 � eg1x2.
y � ex
d1g1x 22dx
d1 eg1x22dx
� d1eg1x22d1g1x 22
f ¿ 1x 2 � eg1x2 � g¿ 1x 2 .f1x 2 � eg1x2,ddx 1ex 2 � ex.
f ¿ 1x 2 � ex.f1x 2 � ex,
PART B6. Determine the equation of the tangent to the curve at the point where
Graph the original curve and the tangent.
7. Determine the equation of the tangent to the curve defined by at thepoint
8. Determine the coordinates of all points at which the tangent to the curvedefined by is horizontal.
9. If prove that
10. a. For the function determine , and .
b. From the pattern in part a., state the value of
11. Determine the first and second derivatives of each function.
a. b. c.
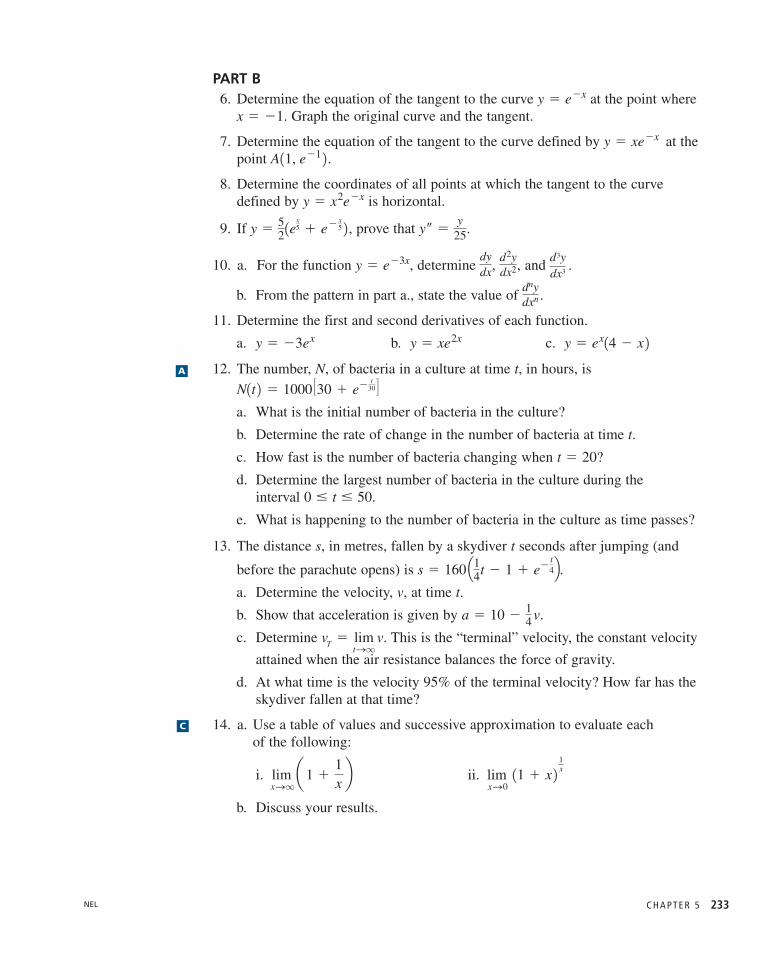
12. The number, N, of bacteria in a culture at time t, in hours, is
a. What is the initial number of bacteria in the culture?
b. Determine the rate of change in the number of bacteria at time t.
c. How fast is the number of bacteria changing when ?
d. Determine the largest number of bacteria in the culture during the interval
e. What is happening to the number of bacteria in the culture as time passes?
13. The distance s, in metres, fallen by a skydiver t seconds after jumping (and
before the parachute opens) is
a. Determine the velocity, v, at time t.
b. Show that acceleration is given by
c. Determine This is the “terminal” velocity, the constant velocity
attained when the air resistance balances the force of gravity.
d. At what time is the velocity 95% of the terminal velocity? How far has theskydiver fallen at that time?
14. a. Use a table of values and successive approximation to evaluate each of the following:
i. ii.
b. Discuss your results.
lim xS0
11 � x 2 1xlim xSqa1 �
1xb
vT � limtSq
v.
a � 10 �14v.
s � 160 Q14t � 1 � e�t4R.
0 � t � 50.
t � 20
N1t 2 � 1000 �30 � e� t30�
y � ex14 � x 2y � xe2xy � �3ex
dnydxn
.
d3ydx3
d2ydx2
dydx,y � e�3x,
y– �y
25.y �52 1ex
5 � e� x5 2 ,y � x2e�x
A11, e�1 2 . y � xe�x
x � �1.y � e�x
C H A P T E R 5 233
A
C
NEL
PART C15. Use the definition of the derivative to evaluate each limit.
a. b.
16. For what values of m does the function satisfy the following equation?
17. The hyperbolic functions are defined as and
a. Prove
b. Prove
c. Prove if
Extension: Graphing the Hyperbolic Function1. Use graphing technology to graph by using the definition
CATALOG
2. Press for the list of CATALOG items, and select cosh( toinvestigate if cosh is a built-in function.
3. In the same window as problem 1, graph and
Investigate changes in the coefficient a in the equation to see ifyou can create a parabola that will approximate the hyperbolic cosine function.
18. a. Another expression for e is
Evaluate this expression using four, five, six, and seven consecutive termsof this expression. (Note: 2! is read “two factorial”; and
b. Explain why the expression for e in part a. is a special case of
What is the value of x?ex � 1 �x1
1! �x2
2! �x3
3! �x4
4! � p .
5! � 5 � 4 � 3 � 2 � 1. 2 2! � 2 � 1
e � 1 �11! �
12! �
13! �
14! �
15! � p .
y � ax2 � 1
y � 1.05x2 � 1.y � 1.25x2 � 1
02ND
cosh x �12 1ex � e�x 2 . y � cosh x
tanh x �sinh x
cosh x.
d1tanh x 2dx
�11cosh x 22
d1cosh x 2dx
� sinh x.
d1sinh x 2dx
� cosh x.
cosh x �12 1ex � e�x 2 . sinh x �
12 1ex � e�x 2
d2y
dx2 �dy
dx� 6y � 0
y � Aemt
lim hS0
e2�h � e2
hlim hS0
eh � 1
h
5 . 1 D E R I VAT I V E S O F E X P O N E N T I A L F U N C T I O N S, y � e x234
T
NEL
C H A P T E R 5 235
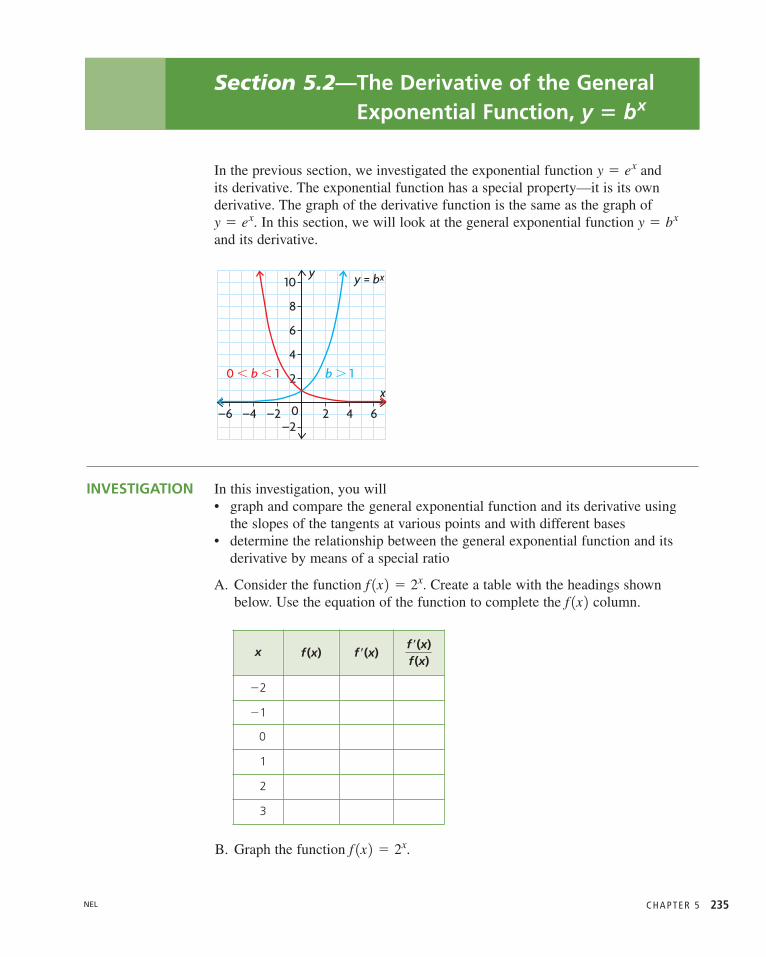
Section 5.2—The Derivative of the GeneralExponential Function,
In the previous section, we investigated the exponential function and its derivative. The exponential function has a special property—it is its own derivative. The graph of the derivative function is the same as the graph of
In this section, we will look at the general exponential function and its derivative.
INVESTIGATION In this investigation, you will• graph and compare the general exponential function and its derivative using
the slopes of the tangents at various points and with different bases• determine the relationship between the general exponential function and its
derivative by means of a special ratio
A. Consider the function Create a table with the headings shownbelow. Use the equation of the function to complete the column.
B. Graph the function f 1x 2 � 2x.
f 1x 2f 1x 2 � 2x.
y
x0
10
2 4 6
6
4
8
2
–2–2–4–6
y = bx
0 , b , 1 b . 1
y � bxy � ex.
y � ex
y � bx
x f (x) f �(x)f �(x)f (x)
�2
�1
0
1
2
3
NEL
C. Calculate the value of the derivative at each of the given points to threedecimal places. To calculate , use the nDeriv( function. (See the investigation in Section 5.1 for detailed instructions.)
D. Draw the graph of the derivative function on the same set of axes as usingthe given x values and the corresponding values of
E. Compare the graph of the derivative with the graph of
F. i. Calculate the ratio , and record these values in the last column of your table.
ii. What do you notice about this ratio for the different values of x?
iii. Is the ratio greater or less than 1?
G. Repeat parts A to F for the function
H. Compare the ratio for the functions and
I. Repeat parts A to F for the function using different values of b.Does the pattern you found for and continue?
J. What conclusions can you make about the general exponential function and itsderivative?
Properties of y bx
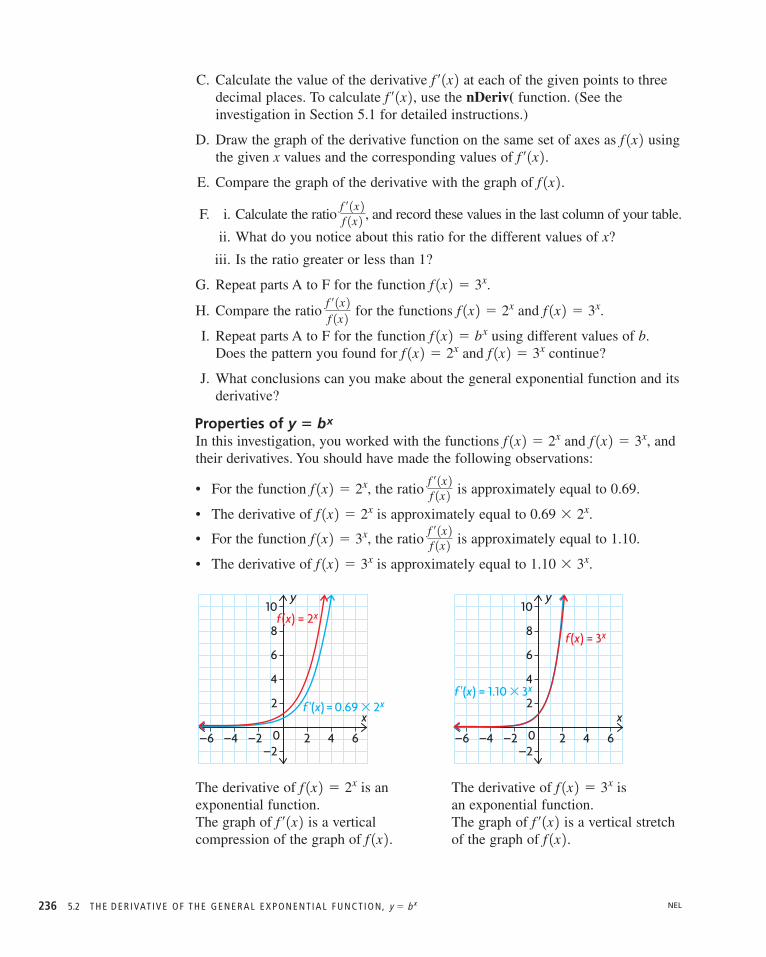
In this investigation, you worked with the functions and andtheir derivatives. You should have made the following observations:
• For the function the ratio is approximately equal to 0.69.
• The derivative of is approximately equal to
• For the function the ratio is approximately equal to 1.10.
• The derivative of is approximately equal to
The derivative of is an The derivative of is exponential function. an exponential function.The graph of is a vertical The graph of is a vertical stretchcompression of the graph of of the graph of f 1x 2 .f 1x 2 . f ¿ 1x 2f ¿ 1x 2 f 1x 2 � 3xf 1x 2 � 2x
y
x0
10
2 4 6
6
4
8
2
–2–2–4–6
f(x) = 3x
f '(x) = 1.10 3 3x
y
x0
10
2 4 6
6
4
8
2
–2–2–4–6
f(x) = 2x
f '(x) = 0.69 3 2x
1.10 � 3x.f 1x 2 � 3x
f ¿ 1x 2f 1x 2f 1x 2 � 3x,
0.69 � 2x.f 1x 2 � 2x
f ¿ 1x 2f 1x 2f 1x 2 � 2x,
f 1x 2 � 3x,f 1x 2 � 2x�
f 1x 2 � 3xf 1x 2 � 2xf 1x 2 � bx
f 1x 2 � 3x.f 1x 2 � 2xf ¿ 1x 2f 1x 2
f 1x 2 � 3x.
f ¿ 1x 2f 1x 2
f 1x 2 .f ¿ 1x 2 . f 1x 2f ¿ 1x 2 f ¿ 1x 2
NEL5.2 T H E D E R I VAT I V E O F T H E G E N E R A L E X P O N E N T I A L F U N C T I O N, y � b x236
C H A P T E R 5 237
In general, for the exponential function , we can conclude that• and are both exponential functions• the slope of the tangent at a point on the curve is proportional to the value of
the function at this point• is a vertical stretch or compression of , dependent on the value of b
• the ratio is a constant and is equivalent to the stretch/compression factor
We can use the definition of the derivative to determine the derivative of theexponential function
(Substitution)
(Properties of the exponential function)
(Common factor)
The factor is constant as and does not depend on h. Therefore,
Consider the functions from our investigation:
• For we determined that and so
• For we determined that and so
In the previous section, for , we determined that and
so
Can we find a way to determine this constant of proportionality without using a table of values?
The derivative of might give us a hint at the answer to this question.From the previous section, we know that
We also know that or Now consider and ln 3.ln 2
ln e � 1.loge e � 1,
f ¿ 1x 2 � 1 � ex.f 1x 2 � ex
limhS0
eh � 1
h � 1.
f ¿ 1x 2 � exf 1x 2 � ex
limhS0
3h � 1
h � 1.10.
f ¿ 1x 2 � 1.10 � 3xf 1x 2 � 3x,
limhS0
2h � 1
h � 0.69.
f ¿ 1x 2 � 0.69 � 2xf 1x 2 � 2x,
f ¿ 1x 2 � bx limhS0
bh � 1
h .
hS 0bx
� limhS0
bx1bh � 1 2
h
� limhS0
bx � bh � bx
h
� limhS0
bx�h � bx
h
f ¿ 1x 2 � limhS0
f 1x � h 2 � f 1x 2
h
f 1x 2 � bx.
f ¿ 1x 2f 1x 2 f 1x 2f ¿ 1x 2f ¿ 1x 2f 1x 2 f 1x 2 � bx
NEL
5.2 T H E D E R I VAT I V E O F T H E G E N E R A L E X P O N E N T I A L F U N C T I O N, y � b x238
and
These match the constants that we determined in our investigation.
This leads to the following conclusion:
f ¿ 1x 2f 1x 2ln 3 � 1.098 612ln 2 � 0.693 147
Derivative of f(x) bg(x)
For f ¿ 1x 2 � bg1x2 1ln b2 1g¿ 1x 22f 1x 2 � bg1x2, �
Derivative of f(x) bx
and if then f ¿ 1x 2 � 1ln b 2 � bxf 1x 2 � bx,lim hS0
bh � 1
h� ln b
�
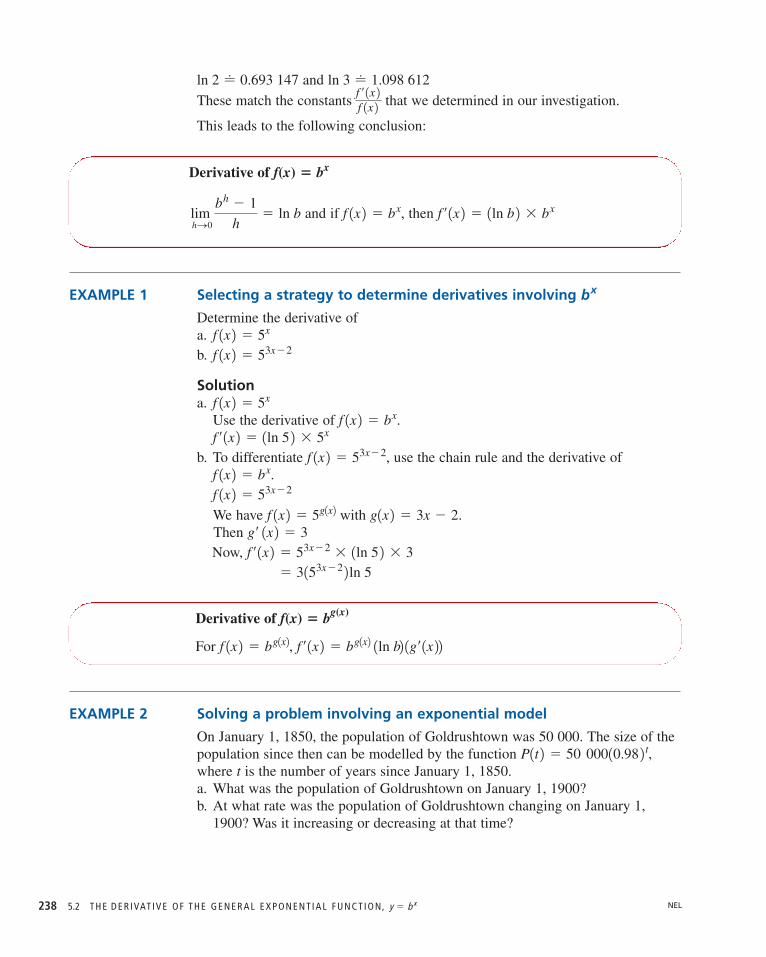
EXAMPLE 1 Selecting a strategy to determine derivatives involving bx
Determine the derivative ofa.b.
Solutiona.
Use the derivative of
b. To differentiate use the chain rule and the derivative of
We have with Then Now,
� 3153x�2 2 ln 5 f ¿ 1x 2 � 53x�2 � 1ln 5 2 � 3g¿ 1x 2 � 3
g1x 2 � 3x � 2.f 1x 2 � 5g1x2f 1x 2 � 53x�2f 1x 2 � bx.
f 1x 2 � 53x�2,f ¿ 1x 2 � 1ln 5 2 � 5x
f 1x 2 � bx.f 1x 2 � 5x
f 1x 2 � 53x�2f 1x 2 � 5x
EXAMPLE 2 Solving a problem involving an exponential model
On January 1, 1850, the population of Goldrushtown was 50 000. The size of thepopulation since then can be modelled by the function where t is the number of years since January 1, 1850.a. What was the population of Goldrushtown on January 1, 1900?b. At what rate was the population of Goldrushtown changing on January 1,
1900? Was it increasing or decreasing at that time?
P1t 2 � 50 00010.98 2 t,
NEL
C H A P T E R 5 239
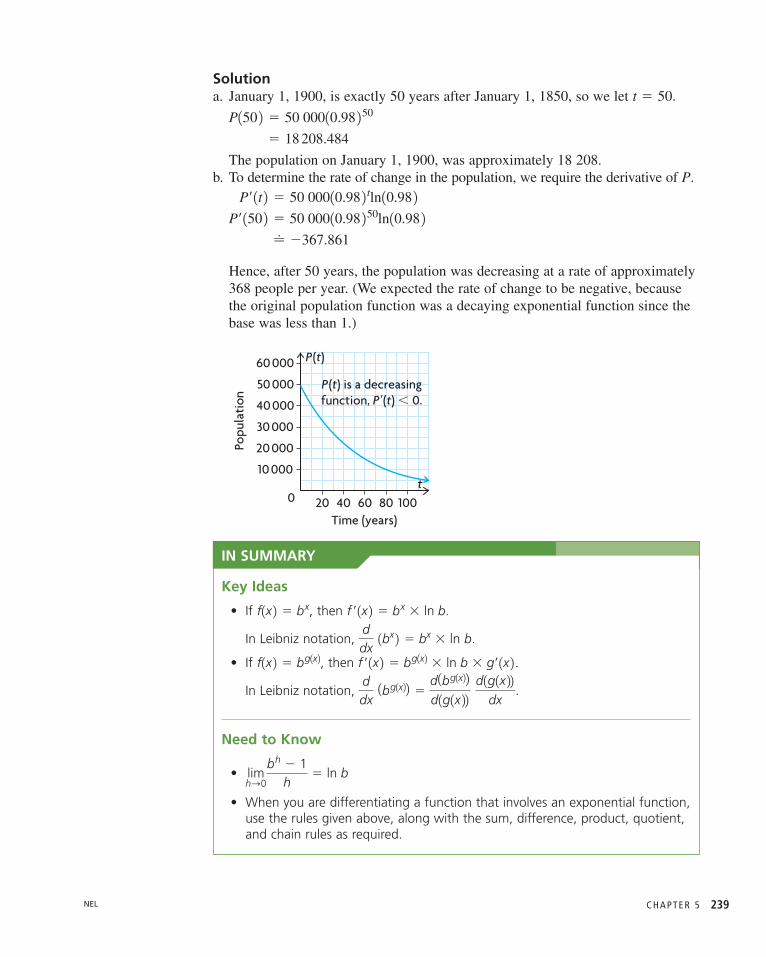
Solutiona. January 1, 1900, is exactly 50 years after January 1, 1850, so we let
The population on January 1, 1900, was approximately 18 208.b. To determine the rate of change in the population, we require the derivative of P.
Hence, after 50 years, the population was decreasing at a rate of approximately368 people per year. (We expected the rate of change to be negative, becausethe original population function was a decaying exponential function since thebase was less than 1.)
30 000
40 000
50 000
P(t)
Time (years)
P(t) is a decreasingfunction, P'(t) , 0.
Popu
lati
on
0t
20 40 60 80
20 000
10 000
100
60 000
� �367.861
P¿ 150 2 � 50 00010.98 250ln10.98 2 P¿ 1t 2 � 50 00010.98 2 tln10.98 2 � 18 208.484
P150 2 � 50 00010.98 250
t � 50.
IN SUMMARY
Key Ideas
• If then
In Leibniz notation, ln b.
• If then
In Leibniz notation, .
Need to Know
•
• When you are differentiating a function that involves an exponential function,use the rules given above, along with the sum, difference, product, quotient,and chain rules as required.
limhS0
bh � 1h
� ln b
ddx
1bg1x22 �d1bg1x22d1g1x 22 d1g1x 22dx
f ¿ 1x 2 � bg1x2 � ln b � g¿ 1x 2 .f1x 2 � bg1x2,ddx
1bx 2 � bx �
f ¿ 1x 2 � bx � ln b.f1x 2 � bx,
NEL

5.2 T H E D E R I VAT I V E O F T H E G E N E R A L E X P O N E N T I A L F U N C T I O N, y � b x240
Exercise 5.2
PART A1. Differentiate each of the following functions:
a. d.
b. e.
c. f.
2. Determine the derivative of each function.
a. c.
b. d.
3. If determine the values of t so that
PART B4. Determine the equation of the tangent to at .
5. Determine the equation of the tangent to at
6. A certain radioactive material decays exponentially. The percent, P, of thematerial left after t years is given by
a. Determine the half-life of the substance.
b. How fast is the substance decaying at the point where the half-life is reached?
7. Historical data show that the amount of money sent out of Canada for interest and dividend payments during the period from 1967 to 1979 can beapproximated by the model where t is measured inyears in 1967 and P is the total payment in Canadian dollars.
a. Determine and compare the rates of increase for the years 1968 and 1978.
b. Assuming this trend continues, compare the rate of increase for 1988 withthe rate of increase for 1998.
c. Check the Statistics Canada website to see if the rates of increase predicted by this model were accurate for 1988 and 1998.
8. Determine the equation of the tangent to the curve at the point onthe curve where Graph the curve and the tangent at this point.
PART C9. The velocity of a car is given by Graph the function.
Describe the acceleration of the car.v1t 2 � 12011 � 0.85t 2 .
x � 0.y � 2�x2
21t � 0P � 15 � 108 2e0.200 15 t,
P1t 2 � 10011.2 2�t.
11, 10 2 .y � 10x
x � 3y � 312x 2f ¿ 1t 2 � 0.f 1t 2 � 103t�5 � e2t2
,
f 1x 2 �V3x
x2y � x13 2 x2
v �2t
ty � x5 � 15 2 x
y � 40012 2 x�3s � 103t�5
y � 3x2�2y � 3.1x � x3
w � 1015�6n�n22y � 23x
A
K
T
C
NEL
Section 5.3—Optimization Problems InvolvingExponential Functions
In earlier chapters, you considered numerous situations in which you were askedto optimize a given situation. As you learned, to optimize means to determinevalues of variables so that a function representing quantities such as cost, area,number of objects, or distance can be minimized or maximized.
Here we will consider further optimization problems, using exponential functionmodels.
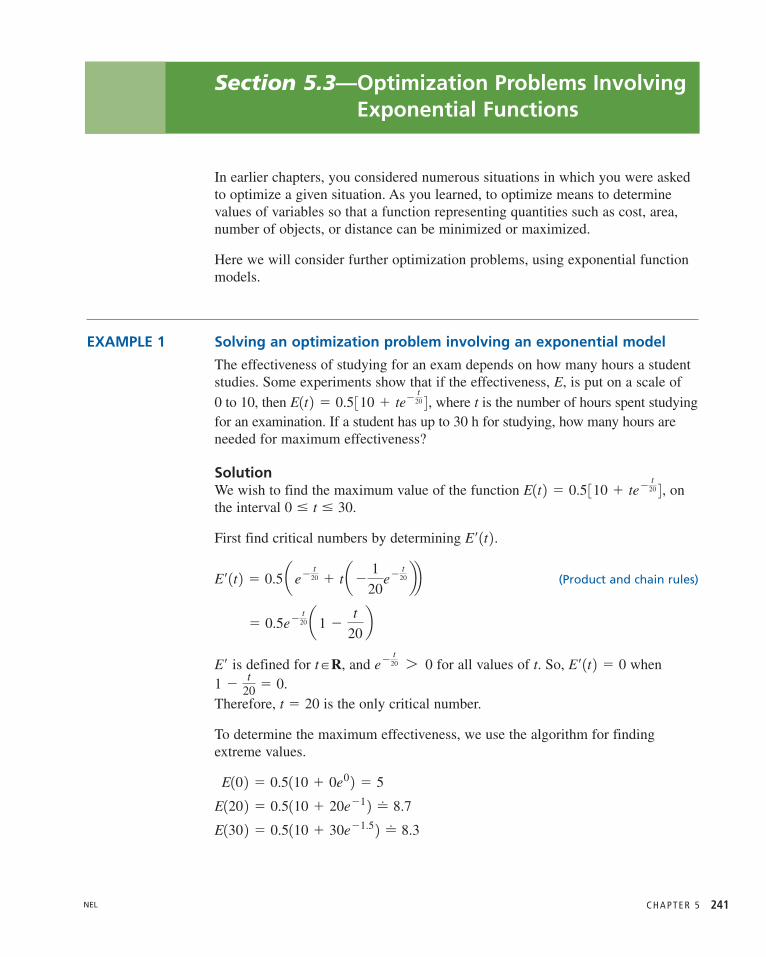
EXAMPLE 1 Solving an optimization problem involving an exponential model
The effectiveness of studying for an exam depends on how many hours a studentstudies. Some experiments show that if the effectiveness, E, is put on a scale of 0 to 10, then where t is the number of hours spent studyingfor an examination. If a student has up to 30 h for studying, how many hours are needed for maximum effectiveness?
SolutionWe wish to find the maximum value of the function onthe interval
First find critical numbers by determining
(Product and chain rules)
is defined for and for all values of t. So, when
Therefore, is the only critical number.
To determine the maximum effectiveness, we use the algorithm for findingextreme values.
E130 2 � 0.5110 � 30e�1.5 2 � 8.3
E120 2 � 0.5110 � 20e�1 2 � 8.7
E10 2 � 0.5110 � 0e0 2 � 5
t � 201 �
t20 � 0.
E¿ 1t 2 � 0e�t
20 7 0t�R,E¿
� 0.5e�t
20 a1 �t
20b
E¿ 1t 2 � 0.5 a e�t
20 � t a�1
20e�
t20 bb
E¿ 1t 2 .0 � t � 30.E1t 2 � 0.5 310 � te�
t20 4 ,
E1t 2 � 0.5 310 � te�t
20 4 ,
C H A P T E R 5 241NEL

5.3 O P T I M I Z AT I O N P R O B L E M S I N VO LV I N G E X P O N E N T I A L F U N C T I O N S242
Therefore, the maximum effectiveness measure of 8.7 is achieved when a studentstudies 20 h for the exam.Examining the graph of the function confirms our result.
EXAMPLE 2 Using calculus techniques to analyze an exponential business model
A mathematical consultant determines that the proportion of people who will haveresponded to the advertisement of a new product after it has been marketed fort days is given by The area covered by the advertisementcontains 10 million potential customers, and each response to the advertisementresults in revenue to the company of $0.70 (on average), excluding the cost ofadvertising. The advertising costs $30 000 to produce and a further $5000 per dayto run.a. Determine , and interpret the result.
b. What percent of potential customers have responded after seven days ofadvertising?
c. Write the function P(t) that represents the average profit after t days of advertising. What is the average profit after seven days?
d. For how many full days should the advertising campaign be run in order tomaximize the average profit? Assume an advertising budget of $200 000.
Solutiona. As , so This result
means that if the advertising is left in place indefinitely (forever), 70% of thepopulation will respond.
b.After seven days of advertising, about 53% of the population has responded.
c. The average profit is the difference between the average revenue received from allcustomers responding to the ad and the advertising costs. Since the area coveredby the ad contains 10 million potential customers, the number of customersresponding to the ad after t days is 107 30.711 � e�0.2t 2 4 � 7 � 10611 � e�0.2t 2 .f 17 2 � 0.711 � e�0.2172 2 � 0.53
limtSq
f 1t 2 � limtSq
0.711 � e�0.2t 2 � 0.7.e�0.2tS 0t S q,
limtSq
f 1t 2f 1t 2 � 0.711 � e�0.2t 2 .
t0
E (t)10
10 15 25
6
8
2
4
5
Maximum point (20, 8.7)
20 30
Time (h)
Effe
ctiv
enes
s
E1t 2 � 0.5 310 � te�t
20 4
NEL
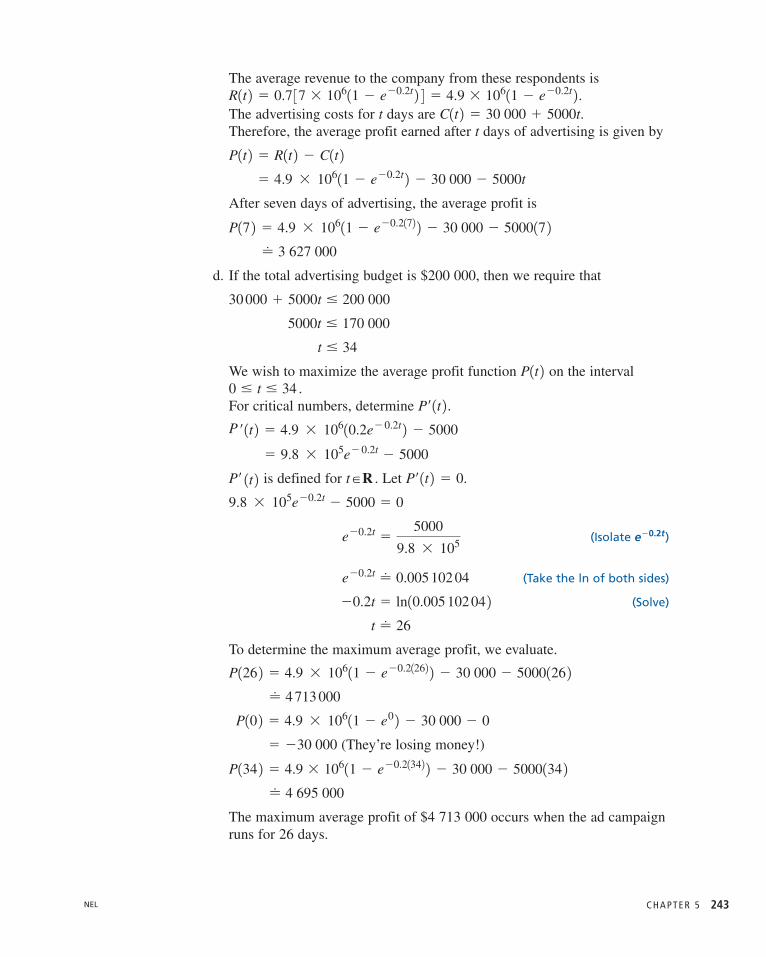
C H A P T E R 5 243
The average revenue to the company from these respondents is
The advertising costs for t days are .Therefore, the average profit earned after t days of advertising is given by
After seven days of advertising, the average profit is
d. If the total advertising budget is $200 000, then we require that
We wish to maximize the average profit function on the interval
For critical numbers, determine
is defined for Let
(Isolate )
(Take the ln of both sides)
(Solve)
To determine the maximum average profit, we evaluate.
(They’re losing money!)
The maximum average profit of $4 713 000 occurs when the ad campaignruns for 26 days.
� 4 695 000
P134 2 � 4.9 � 10611 � e�0.21342 2 � 30 000 � 5000134 2� �30 000
P10 2 � 4.9 � 10611 � e0 2 � 30 000 � 0
� 4 713 000
P126 2 � 4.9 � 10611 � e�0.21262 2 � 30 000 � 5000126 2 t � 26
�0.2t � ln10.005 102 04 2 e�0.2t � 0.005 102 04
e�0.2t e�0.2t �5000
9.8 � 105
9.8 � 105e�0.2t � 5000 � 0
P¿ 1t 2 � 0.t�R .P¿ 1t 2 � 9.8 � 105e� 0.2t � 5000
P ¿ 1t 2 � 4.9 � 10610.2e� 0.2t 2 � 5000
P¿ 1t 2 .0 � t � 34 .P1t 2t � 34
5000t � 170 000
30 000 � 5000t � 200 000
� 3 627 000
P17 2 � 4.9 � 10611 � e�0.2172 2 � 30 000 � 500017 2� 4.9 � 10611 � e�0.2t 2 � 30 000 � 5000t
P1t 2 � R1t 2 � C1t 2C1t 2 � 30 000 � 5000t
R1t 2 � 0.7 37 � 10611 � e�0.2t 2 4 � 4.9 � 10611 � e�0.2t 2 .
NEL

5.3 O P T I M I Z AT I O N P R O B L E M S I N VO LV I N G E X P O N E N T I A L F U N C T I O N S244
Examining the graph of the function confirms our result.
P(t)
t0
1 000 000
2 000 000
3 000 000
4 000 000
5 000 000
20–20 30–10 10
maximum point(26, 4 713 000)
40
Time (days)
Prof
it ($
)
P 1t 2
IN SUMMARY
Key Ideas
• Optimizing means determining the values of the independent variable so that the values of a function that models a situation can be minimized or maximized.
• The techniques used to optimize an exponential function model are the same as those used to optimize polynomial and rational functions.
Need to Know
• Apply the algorithm introduced in Chapter 3 to solve an optimization problem:
1. Understand the problem, and identify quantities that can vary. Determine afunction in one variable that represents the quantity to be optimized.
2. Determine the domain of the function to be optimized, using theinformation given in the problem.
3. Use the algorithm for finding extreme values (from Chapter 3) to find theabsolute maximum or minimum value of the function on the domain.
4. Use your result from step 3 to answer the original problem.
5. Graph the original function using technology to confirm your results.
NEL

C H A P T E R 5 245
Exercise 5.3
PART A1. Use graphing technology to graph each of the following functions. From the
graph, find the absolute maximum and absolute minimum values of the givenfunctions on the indicated intervals.
a. on
b. on
2. a. Use the algorithm for finding extreme values to determine the absolutemaximum and minimum values of the functions in question 1.
b. Explain which approach is easier to use for the functions in question 1.
3. The squirrel population in a small self-contained forest was studied by abiologist. The biologist found that the squirrel population, P, measured in hundreds, is a function of time, t, where t is measured in weeks. The functionis
a. Determine the population at the start of the study, when
b. The largest population the forest can sustain is represented mathematicallyby the limit as Determine this limit.
c. Determine the point of inflection.
d. Graph the function.
e. Explain the meaning of the point of inflection in terms of squirrelpopulation growth.
PART B4. The net monthly profit, in dollars, from the sale of a certain item is given by the
formula where x is the number of items sold.
a. Determine the number of items that yield the maximum profit. At fullcapacity, the factory can produce 2000 items per month.
b. Repeat part a., assuming that, at most, 500 items can be produced permonth.
5. Suppose that the monthly revenue in thousands of dollars, for the sale of x hundredunits of an electronic item is given by the function where the maximum capacity of the plant is 800 units. Determine the number ofunits to produce in order to maximize revenue.
6. A rumour spreads through a population in such a way that t hours after therumour starts, the percent of people involved in passing it on is given by
What is the highest percent of people involved in
spreading the rumour within the first 3 h? When does this occur?
P1t 2 � 100Qe�t � e�4tR.
R1x 2 � 40x2e�0.4x � 30,
P1x 2 � 106 31 � 1x � 1 2e�0.001x 4 ,
t S q.
t � 0.
P1t 2 �20
1 � 3e�0.02t .
x� 3�4, 4 4m1x 2 � 1x � 2 2e�2x
0 � x � 10f 1x 2 � e�x � e�3x
K
NEL
5.3 O P T I M I Z AT I O N P R O B L E M S I N VO LV I N G E X P O N E N T I A L F U N C T I O N S246
7. Small countries trying to develop an industrial economy rapidly often try toachieve their objectives by importing foreign capital and technology. StatisticsCanada data show that when Canada attempted this strategy from 1867 to1967, the amount of U.S. investment in Canada increased from about
to This increase in foreign investment can berepresented by the simple mathematical model where t represents the number of years (starting with 1867 as zero) and Crepresents the total capital investment from U.S. sources in dollars.
a. Graph the curve for the 100-year period.
b. Compare the growth rate of U.S. investment in 1947 with the rate in 1967.
c. Determine the growth rate of investment in 1967 as a percent of theamount invested.
d. If this model is used up to 1977, calculate the total U.S. investment and thegrowth rate in this year.
e. Use the Internet to determine the actual total U.S. investment in 1977, andcalculate the error in the model.
f. If the model is used up to 2007, calculate the expected U.S. investmentand the expected growth rate.
8. A colony of bacteria in a culture grows at a rate given by where N isthe number of bacteria t minutes from the beginning. The colony is allowed togrow for 60 min, at which time a drug is introduced to kill the bacteria. Thenumber of bacteria killed is given by where K bacteria are killed attime t minutes.
a. Determine the maximum number of bacteria present and the time at whichthis occurs.
b. Determine the time at which the bacteria colony is obliterated.
9. Lorianne is studying for two different exams. Because of the nature ofthe courses, the measure of study effectiveness on a scale from 0 to 10 for thefirst course is while the measure for the second course
is Lorianne is prepared to spend up to 30 h, in total,studying for the exams. The total effectiveness is given by How should this time be allocated to maximize total effectiveness?
10. Explain the steps you would use to determine the absolute extrema ofon the interval .
11. a. For determine the intervals of increase and decrease.
b. Determine the absolute minimum value of f 1x 2 .f 1x 2 � x2ex,
x� 3�2, 2 4f 1x 2 � x � e2x
f 1t 2 � E1 � E2.E2 � 0.5110 � te�
t10 2 .E1 � 0.619 � te�
t20 2 ,
K1t 2 � et3,
N1t 2 � 2t5,
C1t 2 � 0.015 � 109e0.075 33t,$280 305 � 106.$15 � 106
A
C
T
NEL
C H A P T E R 5 247
12. Find the maximum and minimum values of each function. Graph each function.
a. c.
b. d.
13. The profit function of a commodity is Find the maximum value of the function if x is measured in hundreds of units and P ismeasured in thousands of dollars.
14. You have just walked out the front door of your home. You notice that it closesquickly at first and then closes more slowly. In fact, a model of the movementof the door is given by , where d is the number of degreesbetween the door frame and the door at t seconds.
a. Graph this relation.
b. Determine when the speed of the moving door is increasing and decreasing.
c. Determine the maximum speed of the moving door.
d. At what point would you consider the door closed?
PART C15. Suppose that, in question 9, Lorianne has only 25 h to study for the two exams.
Is it possible to determine the time to be allocated to each exam? If so, how?
16. Although it is true that many animal populations grow exponentially for aperiod of time, it must be remembered that the food available to sustain thepopulation is limited and the population will level off because of this. Over aperiod of time, the population will level out to the maximum attainable value,L. One mathematical model to describe a population that grows exponentiallyat the beginning and then levels off to a limiting value, L, is the logistic model. The equation for this model is where the
independent variable t represents the time and P represents the size of thepopulation. The constant a is the size of the population at L is the limiting value of the population, and k is a mathematical constant.
a. Suppose that a biologist starts a cell colony with 100 cells and finds thatthe limiting size of the colony is 10 000 cells. If the constant draw a graph to illustrate this population, where t is in days.
b. At what point in time does the cell colony stop growing exponentially?How large is the colony at this point?
c. Compare the growth rate of the colony at the end of day 3 with the growthrate at the end of day 8. Explain what is happening.
k � 0.0001,
t � 0,
P �aL
a � 1L � a 2e�kLt ,
d1t 2 � 200 t12 2�t
P1x 2 � xe�0.5x2, where x 7 0.
y � 3xe�x � xy � xex � 3
y � 2xe2xy � ex � 2
NEL
M I D - C H A P T E R R E V I E W248
Mid-Chapter Review
1. Determine the derivative of each function.
a. c. e.
b. d. f.
2. A certain radioactive substance decays exponentially over time. The amountof a sample of the substance that remains, P, after t years is given by
where P is expressed as a percent.
a. Determine the rate of change of the function,
b. What is the rate of decay when 50% of the original sample has decayed?
3. Determine the equation of the tangent to the curve at the pointwhere
4. Determine the first and second derivatives of each function.
a. b. c.
5. Determine the derivative of each function.
a. c. e.
b. d. f.
6. The number of rabbits in a forest at time t, in months, is
a. What is the initial number of rabbits in the forest?
b. Determine the rate of change of the number of rabbits at time t.
c. How fast is the number of rabbits changing after one year?
d. Determine the largest number of rabbits in the forest during the first threeyears.
e. Use graphing technology to graph versus . Give physical reasons whythe population of rabbits might behave this way.
7. A drug is injected into the body in such a way that the concentration, C, inthe blood at time t hours is given by the function Atwhat time does the highest concentration occur within the first 5 h?
8. Given for what values of does the function represent growth?For what values of does the function represent decay?k
ky � c1ekx 2 ,C1t 2 � 101e�2t � e�3t 2 .
tR
R1t 2 � 500 310 � e� t10 4 .
f 1x 2 � 1x � 2 22 � 4xH1x 2 � 30015 23x�1y � 3.2110 20.2x
q1x 2 � 1.9x � x1.9f 1x 2 � x22xy � 82x�5
y � ex14 � x 2y � xe2xy � �3ex
x � 0.y � 2 � xex
dPdt .
P1t 2 � 100e�5t,
y �ex � e�x
ex � e�xy � 1x � 1 22exy � 7e17x
y � 1x � e�x 22y � x3e�2xy � 5e�3x
NEL
9. The rapid growth in the number of a species of insect is given bywhere t is the number of days.
a. What is the initial population ?
b. How many insects will there be after a week?
c. How many insects will there be after a month (30 days)?
10. If you have ever travelled in an airplane, you probably noticed that the airpressure in the airplane varied. The atmospheric pressure, y, varies with thealtitude, x kilometres, above Earth. For altitudes up to 10 km, the pressure inmillimetres of mercury (mm Hg) is given by . What is theatmospheric pressure at each distance above Earth?
a. 5 km b. 7 km c. 9 km
11. A radioactive substance decays in such a way that the amount left after t yearsis given by . The amount, A, is expressed as a percent. Find thefunction, , that describes the rate of decay. What is the rate of decay when50% of the substance is gone?
12. Given find all the x values for which What is the significance of this?
13. Find the equation of the tangent to the curve at the point on thecurve where Graph the curve and the tangent at this point.
14. a. Determine an equation for A(t), the amount of money in the account at any time t.
b. Find the derivative of the function.
c. At what rate is the amount growing at the end of two years? At what rateis it growing at the end of five years and at the end of 10 years?
d. Is the rate constant?
e. Determine the ratio of for each value that you determined for .
f. What do you notice?
15. The function is its own derivative. It is not the only function, however,that has this property. Show that for every value of has the sameproperty.
c, y � c 1ex 2y � ex
A¿ 1t 2A¿ 1t 2A1t 2
A¿ 1t 2x � 1.
y � 5�x2
f ¿ 1x 2 7 0.f 1x 2 � xex,
A¿A � 100e�0.3t
y � 760e�0.125x
1t � 0 2P1t 2 � 5000e0.02t,
C H A P T E R 5 249NEL
5 . 4 T H E D E R I VAT I V E S O F A N D y � cos xy � sin x250
Section 5.4—The Derivatives of and
In this section, we will investigate to determine the derivatives of and
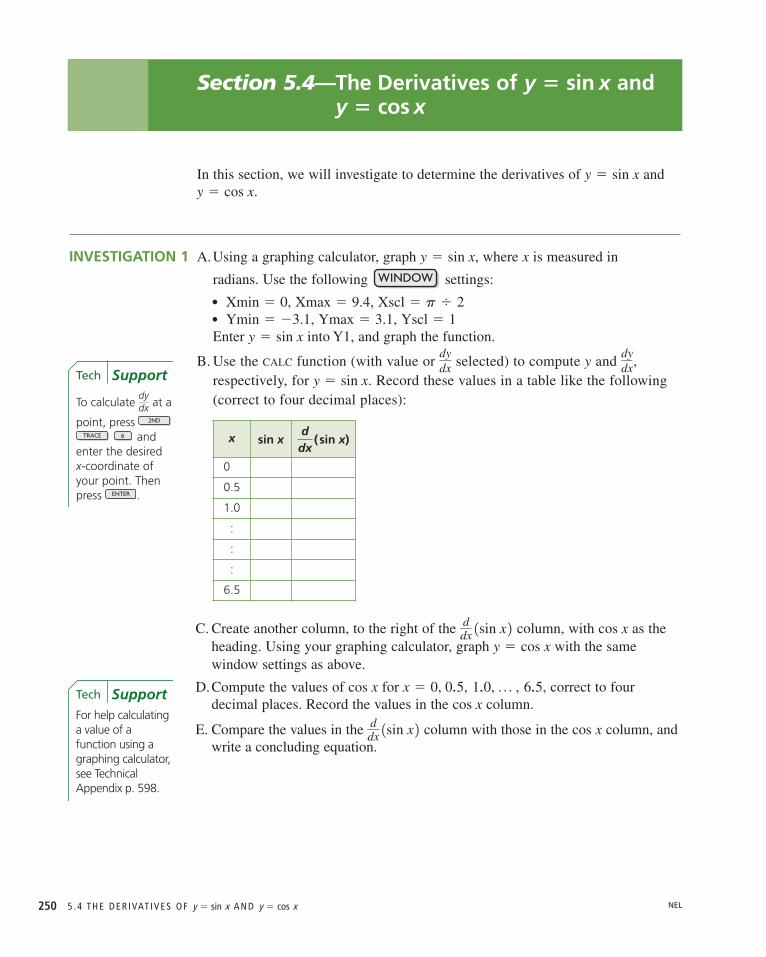
INVESTIGATION 1 A.Using a graphing calculator, graph , where x is measured in
radians. Use the following settings:
••Enter into Y1, and graph the function.
B. Use the CALC function (with value or selected) to compute y and respectively, for . Record these values in a table like the following(correct to four decimal places):
y � sin x
dydx,
dydx
y � sin xYscl � 1Ymax � 3.1,Ymin � �3.1,
Xscl � p � 2Xmax � 9.4,Xmin � 0,
WINDOW
y � sin x
y � cos x.y � sin x
y � cos xy � sin x
C. Create another column, to the right of the column, with as the heading. Using your graphing calculator, graph with the same window settings as above.
D.Compute the values of for correct to four decimal places. Record the values in the column.
E. Compare the values in the column with those in the cos x column, andwrite a concluding equation.
ddx 1sin x 2 cos x
x � 0, 0.5, 1.0, p , 6.5,cos x
y � cos xcos xd
dx 1sin x 2
x sin xddx
(sin x)
0
0.5
1.0
:
:
:
6.5
To calculate at a
point, press and
enter the desiredx-coordinate ofyour point. Thenpress .ENTER
6TRACE
2ND
dydx
Tech Support
For help calculatinga value of afunction using agraphing calculator,see TechnicalAppendix p. 598.
Tech Support
NEL
C H A P T E R 5 251
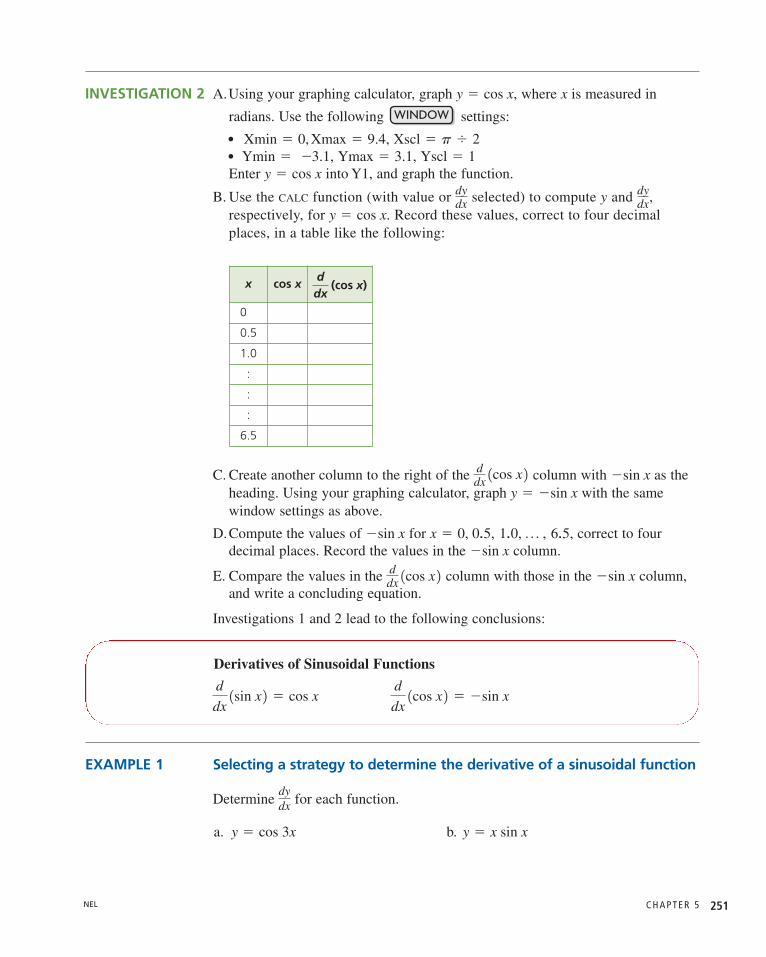
INVESTIGATION 2 A.Using your graphing calculator, graph where x is measured in
radians. Use the following settings:
••Enter into Y1, and graph the function.
B. Use the CALC function (with value or selected) to compute y and respectively, for Record these values, correct to four decimalplaces, in a table like the following:
y � cos x.
dydx,dy
dx
y � cos xYscl � 1Ymax � 3.1,Ymin � �3.1,
Xscl � p � 2Xmax � 9.4,Xmin � 0,
WINDOW
y � cos x,
x cos x ddx
(cos x)
0
0.5
1.0
:
:
:
6.5
C. Create another column to the right of the column with as theheading. Using your graphing calculator, graph with the same window settings as above.
D.Compute the values of for correct to fourdecimal places. Record the values in the column.
E. Compare the values in the column with those in the column,and write a concluding equation.
Investigations 1 and 2 lead to the following conclusions:
�sin xddx 1cos x 2 �sin x
x � 0, 0.5, 1.0, p , 6.5,�sin x
y � �sin x�sin xd
dx 1cos x 2
d
dx1cos x 2 � �sin x
d
dx1sin x 2 � cos x
EXAMPLE 1 Selecting a strategy to determine the derivative of a sinusoidal function
Determine for each function.
a. b. y � x sin xy � cos 3x
dydx
Derivatives of Sinusoidal Functions
NEL
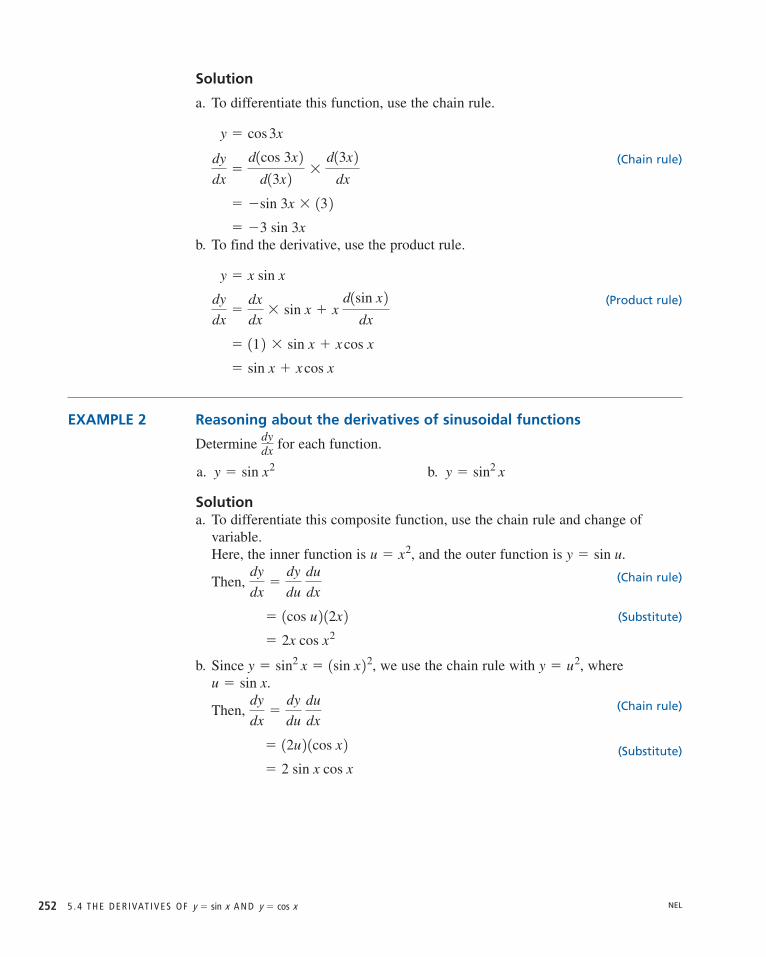
Solution
a. To differentiate this function, use the chain rule.
b. To find the derivative, use the product rule.
EXAMPLE 2 Reasoning about the derivatives of sinusoidal functions
Determine for each function.
a. b.
Solutiona. To differentiate this composite function, use the chain rule and change of
variable.Here, the inner function is and the outer function is
Then,
b. Since we use the chain rule with where
Then,
� 2 sin x cos x
� 12u 2 1cos x 2 dy
dx�
dy
du du
dx
u � sin x.y � u2,y � sin2 x � 1sin x 22,
� 2x cos x2
� 1cos u 2 12x 2 dy
dx�
dy
du du
dx
y � sin u.u � x2,
y � sin2 xy � sin x2
dydx
� sin x � x cos x
� 11 2 � sin x � x cos x
dy
dx�
dx
dx� sin x � x
d1sin x 2dx
y � x sin x
� �3 sin 3x
� �sin 3x � 13 2 dy
dx�
d1cos 3x 2d13x 2 �
d13x 2dx
y � cos 3x
(Chain rule)
(Product rule)
(Chain rule)
(Substitute)
(Substitute)
(Chain rule)
NEL5 . 4 T H E D E R I VAT I V E S O F A N D y � cos xy � sin x252

C H A P T E R 5 253
EXAMPLE 3 Differentiating a composite cosine function
Determine for
Solution
EXAMPLE 4 Differentiating a combination of functions
Determine for
Solution
� esin x�cos x1cos x � sin x 2y¿ �d1esin x�cos x 2
d1sin x � cos x 2 �d1sin x � cos x 2
dx
y � esin x�cos x
y � esin x�cos x.y¿
� �3x2 sin 11 � x3 2 � �sin 11 � x3 2 13x2 2 dy
dx�
d 3cos 11 � x3 2 4d11 � x3 2 �
d11 � x3 2dx
y � cos 11 � x3 2y � cos 11 � x3 2 .dy
dx
Derivatives of Composite Sinusoidal Functions
If then
In Leibniz notation,
If then
In Leibniz notation,d
dx 1cos f 1x 22 � d1cos f 1x 22
d 1 f 1x 22 �d 1 f 1x 22
dx� �sin f 1x 2 � d 1 f 1x 22
dx.
dydx � �sin f 1x 2 � f ¿ 1x 2 .y � cos f 1x 2 ,d
dx 1sin f 1x 22 �
d1sin f 1x 22d 1 f 1x 22 �
d 1 f 1x 22dx
� cos f 1x 2 �d 1 f 1x 22
dx.
dydx � cos f 1x 2 � f ¿1x 2 .y � sin f 1x 2 ,
(Chain rule)
(Chain rule)
With practice, you will learn how to apply the chain rule without the intermediatestep of introducing the variable u. For for example, you can skip this
step and immediately write dy
dx � 1cos x2 2 12x 2 .y � sin x2,
NEL
EXAMPLE 5 Connecting the derivative of a sinusoidal function to the slope of a tangent
Determine the equation of the tangent to the graph of at
Solution
When
The point of tangency is
The slope of the tangent at any point on the graph is given by
(Product and chain rules)
(Simplify)
At (Evaluate)
The equation of the tangent is
or
EXAMPLE 6 Connecting the derivative of a sinusoidal function to its extreme values
Determine the maximum and minimum values of the function onthe interval .
SolutionBy the algorithm for finding extreme values, the maximum and minimum valuesoccur at points on the graph where or at endpoints of the interval. The derivative of is
(Chain rule)
(Using the double angle identity)
Solving ,
or
so or 2px � 0, p
2, p,
3p
2,
4p 2x � 0, p, 2p, 3p,
sin 2x � 0
�sin 2x � 0
f ¿1x 2 � 0
� �sin 2x
� �2 sin x cos x
f ¿1x 2 � 2 1cos x 2 1�sin x 2f 1x 2 f ¿ 1x 2 � 0
x� 30, 2p 4 f 1x 2 � cos2 x
y � �x.y �p
2� � a x �
p
2b
� �1
dy
dx� cos p � p1sin p 2x �
p
2,
� cos 2x � 2x sin 2x
� 11 2 1cos 2x 2 � x1�sin 2x 2 12 2 dy
dx�
dx
dx� cos 2x � x �
d1cos 2x 2dx
Qp2 , �p2R.y �
p2 cos p � �
p2 .x �
p2 ,
x �p2 .y � x cos 2x
NEL5 . 4 T H E D E R I VAT I V E S O F A N D y � cos xy � sin x254

C H A P T E R 5 255
We evaluate at the critical numbers. (In this example, the endpoints of theinterval are included.)
f 1x 2
IN SUMMARY
Key Idea
• The derivatives of sinusoidal functions are found as follows:
• and
• If then
• If then
Need to Know
• When you are differentiating a function that involves sinusoidal functions, usethe rules given above, along with the sum, difference, product, quotient, andchain rules as required.
dydx
� �sin f 1x 2 � f ¿ 1x 2 .y � cos f 1x 2 ,dydx
� cos f 1x 2 � f ¿ 1x 2 .y � sin f 1x 2 ,d 1cos x 2
dx� �sin x
d 1sin x 2dx
� cos x
x 0p
2p
3p2
2p
xf 1x 2 � cos2 1 0 1 0 1
The maximum value is 1 when . The minimum value is 0 when
or
The above solution is verified by our knowledge of the cosine function. For thefunction ,• the domain is • the range is For the given function ,• the domain is • the range is Therefore, the maximum value is 1 and the minimum value is 0.
yy = cos2 x
x1
2
–10
2p p 2p
23p
0 � cos2 x � 1x�R
y � cos2 x�1 � cos x � 1
x�Ry � cos x
3p2 .x �
p2
x � 0, p, or 2p
NEL
Exercise 5.4
PART A1. Determine for each of the following:
a. f.
b. g.
c. h.
d. i.
e. j.
2. Differentiate the following functions:
a. d.
b. e.
c. f.
PART B3. Determine an equation for the tangent at the point with the given x-coordinate
for each of the following functions:
a. d.
b. e.
c. f.
4. a. If and explain why
b. If and how are and related?
5. Differentiate each function.
a. c.
b. d. m1x 2 � 1x2 � cos2 x 23v1t 2 � �1 � cos t � sin2 t
h1x 2 � sin x sin 2x sin 3xv1t 2 � sin2 1�t 2g¿1x 2f ¿1x 2g 1x 2 � 1 � cos2 x,f 1x 2 � sin2 x
f ¿1x 2 � g¿1x 2 .g 1x 2 � 1 � cos2 x,f 1x 2 � sin2 x
f 1x 2 � 2 sin x cos x, x �p
2f 1x 2 � cos 14x 2 , x �
p
4
x �p
4f 1x 2 � cos a2x �
p
3b ,x � 0f 1x 2 � x � sin x,
x �p
2f 1x 2 � sin 2x � cos x,x �
p
3f 1x 2 � sin x,
y � 2x3 sin x � 3x cos xy � cos 1sin 2x 2 y � ex1cos x � sin x 2y �cos 2x
x
y �sin x
1 � cos xy � 2 sin x cos x
y � sin 1x
y � sin 3x � cos 4x
y � x2 � cos x � sin p
4y � 2 cos 1�4x 2 y � 3 sin 13x � 2p 2y � sin 1x3 � 2x � 4 2 y � sin 1ex 2y � 2 cos 3x
y � 2x � 2 sin x � 2 cos xy � sin 2x
dydx
K
C
NEL5 . 4 T H E D E R I VAT I V E S O F A N D y � cos xy � sin x256
C H A P T E R 5 257
6. Determine the absolute extreme values of each function on the given interval.(Verify your results with graphing technology.)
a.
b.
c.
d.
7. A particle moves along a line so that, at time t, its position is
a. For what values of t does the particle change direction?
b. What is the particle’s maximum velocity?
8. a. Graph the function
b. Determine the coordinates of the point where the tangent to the curve ofis horizontal, on the interval
9. Determine expressions for the derivatives of and .
10. Determine the slope of the tangent to the curve at point
11. A particle moves along a line so that at time t, its position is
a. When does the particle change direction?
b. What is the particle’s maximum velocity?
c. What is the particle’s minimum distance from the origin? What is its maximum distance from the origin?
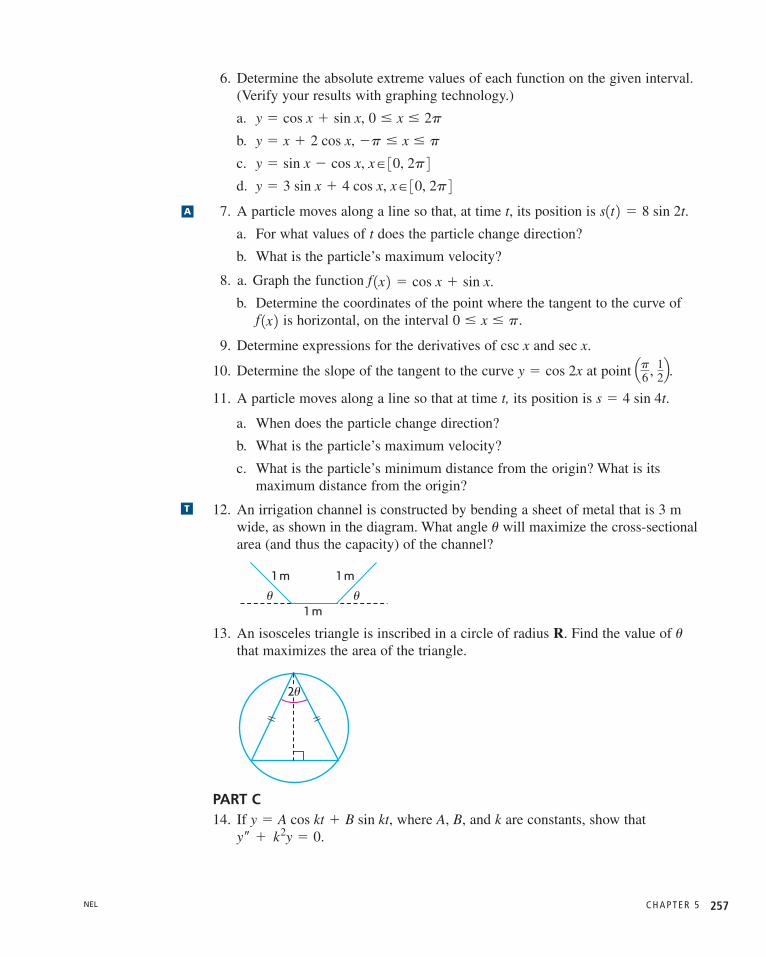
12. An irrigation channel is constructed by bending a sheet of metal that is 3 mwide, as shown in the diagram. What angle will maximize the cross-sectionalarea (and thus the capacity) of the channel?
13. An isosceles triangle is inscribed in a circle of radius R. Find the value of that maximizes the area of the triangle.
PART C14. If where A, B, and k are constants, show that
y– � k2y � 0.y � A cos kt � B sin kt,
2u
u
u
1 m
1 m
1 m
u
u
s � 4 sin 4t.
Qp6 , 12R.y � cos 2x
sec xcsc x
0 � x � p.f 1x 2f 1x 2 � cos x � sin x.
s1t 2 � 8 sin 2t.
y � 3 sin x � 4 cos x, x� 30, 2p 4y � sin x � cos x, x� 30, 2p 4�p � x � py � x � 2 cos x,
0 � x � 2py � cos x � sin x,
A
T
NEL

5 . 5 T H E D E R I VAT I V E O F y � tan x258
Section 5.5—The Derivative of
In this section, we will study the derivative of the remaining primary trigonometricfunction—tangent.
Since this function can be expressed in terms of sine and cosine, we can find itsderivative using the product rule.
EXAMPLE 1 Reasoning about the derivative of the tangent function
Determine for
Solution
(Product rule)
(Chain rule)
(Using the Pythagorean identity)
Therefore,
EXAMPLE 2 Selecting a strategy to determine the derivative of a composite tangent function
Determine for
Solution
(Chain rule)
� 12x � 3 2sec2 1x2 � 3x 2 � sec2 1x2 � 3x 2 � 12x � 3 2 dy
dx�
d tan 1x2 � 3x 2d1x2 � 3x 2 �
d1x2 � 3x 2dx
y � tan 1x2 � 3x 2y � tan 1x2 � 3x 2 .dy
dx
d1tan x 2dx
� sec2 x
� sec2 x
� 1 � tan2 x
� 1 �sin2 x
cos2 x
� 1cos x 2 1cos x 2�1 � sin x 1�1 2 1cos x 2�21�sin x 2 dy
dx�
d 1sin x 2dx
� 1cos x 2�1 � sin x �d1cos x 2�1
dx
� 1sin x 2 1cos x 2�1
�sin xcos x
y � tan x
y � tan x.dydx
y � tan x
NEL

C H A P T E R 5 259
EXAMPLE 3 Determining the derivative of a combination of functions
Determine for .
Solution
(Chain rule)
EXAMPLE 4 Determining the derivative of a product involving the tangent function
Determine for
Solution
(Product and chain rules)
� tan 12x � 1 2 � 2x sec2 12x � 1 2 dy
dx� 11 2 tan 12x � 1 2 � 1x 2sec2 12x � 1 2 d12x � 1 2
dx
y � x tan 12x � 1 2y � x tan 12x � 1 2 .dy
dx
dy
dx� 41sin x � tan x 231cos x � sec2 x 2 y � 1sin x � tan x 24
y � 1sin x � tan x 24dydx
Derivatives of Composite Functions Involving
If then
In Leibniz notation,d
dx 1tan f 1x 22 � d1tan f 1x 22
d1 f 1x 22 �df1x 22
dx� sec2 1 f 1x 22 �
d1 f 1x 22dx
.
dydx � sec2 f 1x 2 � f ¿ 1x 2 .y � tan f 1x 2 , y � tan x
IN SUMMARY
Key Idea
• The derivatives of functions involving the tangent function are found as follows:
•
•
Need to Know
• Trigonometric identities can be used to write one expression as an equivalentexpression and then differentiate. In some cases, the new function will beeasier to work with.
ddx1tan f 1x 22 � sec2 f 1x 2 � f ¿ 1x 2
d1tan x 2dx
� sec2 x
NEL
Exercise 5.5
PART A1. Determine for each of the following:
a. d. y �x2
tan pxy � tan 3x
dydx
K
A
b. e.
c. f.
2. Determine an equation for the tangent to each function at the point with thegiven x-coordinate.
a. b.
PART B3. Determine for each of the following:
a. d.
b. e.
c. f.
4. Determine for each of the following:
a. b.
5. Determine all the values of x, for which the slope of the tangentto is zero.
6. Determine the local maximum point on the curve , where
7. Prove that is always increasing on the interval
8. Determine the equation of the line that is tangent to where
9. If you forget the expression that results when differentiating the tangent function, explain how you can derive this derivative using an identity.
PART C
10. Determine the derivative of
11. Determine , where .f 1x 2 � cot 4xf – 1x 2 cot x.
x �p4 .y � 2 tan x,
�p2 6 x 6 p2 .y � sec x � tan x
�p2 6 x 6 p2 .
y � 2x � tan x
f 1x 2 � sin x tan x0 � x � 2p,
y � tan2 xy � sin x tan x
d2ydx2
y � etan�xy � tan2 1cos x 2 y � sin3 x tan xy � 3 tan 1x2 � 1 2 4�2
y � 1tan x � cos x 22y � tan 1sin x 2y¿
x � 0f 1x 2 � 6 tan x � tan 2x,x �p
4f 1x 2 � tan x,
y � 3 sin 5x tan 5xy � tan2 1x3 2 y � tan 1x2 2� tan2 xy � 2 tan x � tan 2x
T
C
NEL5 . 5 T H E D E R I VAT I V E O F y � tan x260
C H A P T E R 5 261
CHAPTER 5: RATE-OF-CHANGE MODELS IN MICROBIOLOGY
Investigate and ApplyCAREER LINK WRAP-UP
A simplified model for bacterial growth is where P(t) is the populationof the bacteria colony after t hours, is the initial population of the colony (thepopulation at ), and r determines the growth rate of the colony. The model issimple because it does not account for limited resources, such as space andnutrients. As time increases, so does the population, but there is no bound on thepopulation. While a model like this can describe a population for a short period oftime or can be made to describe a population for a longer period of time byadjusting conditions in a laboratory experiment, in general, populations are betterdescribed by more complex models.
To determine how the population of a particular type of bacteria will grow overtime under controlled conditions, a microbiologist observes the initial populationand the population every half hour for 8 h. (The microbiologist also controls theenvironment in which the colony is growing to make sure that temperature andlight conditions remain constant and ensures that the amount of nutrientsavailable to the colony as it grows is sufficient for the increasing population.)
After analyzing the population data, the microbiologist determines that thepopulation of the bacteria colony can be modelled by the equation
a. What is the initial population of the bacteria colony?
b. What function describes the instantaneous rate of change in the bacteriapopulation after t hours?
c. What is the instantaneous rate of change in the population after 1 h? What isthe instantaneous rate of change after 8 h?
d. How do your answers for part c. help you make a prediction about how longthe bacteria colony will take to double in size? Make a prediction for thenumber of hours the population will take to double, using your answers for part c. and/or other information.
e. Determine the actual doubling time—the time that the colony takes to grow totwice its initial population. (Hint: Solve for t when .)
f. Compare your prediction for the doubling time with the calculated value. If yourprediction was not close to the actual value, what factors do you think mightaccount for the difference?
g. When is the instantaneous rate of change equal to 500 bacteria per hour?
P1t 2 � 1000
P1t 2 � 500 e0.1t.
t � 0P0
P1t 2 � P0ert,
NEL

K E Y C O N C E P T S R E V I E W262
Key Concepts Review
In this chapter, we introduced a new base for exponential functions, namely thenumber e, where We examined the derivatives of the exponentialfunctions along with the primary trigonometric functions. You should now be ableto apply all the rules of differentiation that you learned in Chapter 2 to expressionsthat involve the exponential, sine, cosine, and tangent functions combined withpolynomial and rational functions.
We also examined some applications of exponential and trigonometric functions.The calculus techniques that are used to determine instantaneous rates ofchange, equations of tangent lines, and absolute extrema for polynomial andrational functions, can also be used for exponential and trigonometric functions.
Derivative Rules for Exponential Functions
• and
• and d
dx 1bg1x2 2 � bg1x2 1ln b 2g¿ 1x 2d
dx 1bx 2 � bx ln b
d
dx 1eg1x2 2 � eg1x2 � g¿ 1x 2d
dx 1ex 2 � ex
e � 2.718 281.
Derivative Rules for Primary Trigonometric Functions
• and
• and
• and d
dx 1tan f 1x 22 � sec2 f 1x 2 � f ¿ 1x 2d
dx 1tan x 2 � sec2 x
d
dx 1cos f 1x 22 � �sin f 1x 2 � f ¿ 1x 2d
dx 1cos x 2 � �sin x
d
dx 1sin f 1x 22 � cos f 1x 2 � f ¿ 1x 2d
dx 1sin x 2 � cos x
NEL
C H A P T E R 5 263
Review Exercise
1. Differentiate each of the following:
a. d.
b. e.
c. f.
2. Determine for each of the following:
a. c. e.
b. d. f.
3. Differentiate each of the following:
a. d.
b. e.
c. f.
4. a. Given the function solve the equation
b. Discuss the significance of the solution you found in part a.
5. a. If find
b. Explain what this number represents.
6. Determine the second derivative of each of the following:
a. b.
7. If prove that
8. Determine the equation of the tangent to the curve defined by that is parallel to the line represented by
9. Determine the equation of the tangent to the curve at the pointwhere
10. An object moves along a line so that, at time t, its position is
where s is the displacement in metres. Calculate the object’s velocity at t �p4 .
s �sin t
3 � cos 2 t ,
x �p2 .
y � x sin x
3x � y � 9 � 0.y � x � e�x
dydx � 1 � y2.y �
e2x � 1e2x � 1,
y � xe10xy � xex � ex
f ¿Q12R.f 1x 2 � xe�2x,
f ¿ 1x 2 � 0.f 1x 2 �ex
x ,
y � cos2 2xy �1
2 � cos x
y � 1sin 2x 2e3xy � tan 3x
y � x tan 2xy � 3 sin 2x � 4 cos 2x
y �5Vx
xy � 1x4 2 2xy � 43x2
y �4x
4xy � 15x 2 15x 2y � 10x
dydx
s �et � 1
et � 1y � e2x�3
y � xexy � 2x � 3ex
y � e�3x2�5xy � 6 � ex
NEL

R E V I E W E X E R C I S E264
11. The number of bacteria in a culture, N, at time t is given by
a. When is the rate of change of the number of bacteria equal to zero?
b. If the bacterial culture is placed in a colony of mice, the number of micethat become infected, M, is related to the number of bacteria present by the
equation After 10 days, how many mice are infectedper day?
12. The concentrations of two medicines in the bloodstream t hours after injection are and
a. Which medicine has the larger maximum concentration?
b. Within the first half hour, which medicine has the larger maximum concentration?
13. Differentiate.
a. c.
b. d.
14. Differentiate.
a. d.
b. e.
c. f.
15. Determine .
a. d.
b. e.
c. f.
16. Determine the equation of the tangent to the curve at
17. An object is suspended from the end of a spring. Its displacement from theequilibrium position is at time t. Calculate the velocity and
acceleration of the object at any time t, and show that d2s
dt2 � 100p2s � 0.
s � 8 sin 110pt 2Qp2 , 0R.y � cos x
y � cos x sin2 xy � sin ap2
� x b y � cos2 xy � x2 sin x
y � cos x sin xy � sin 2x
y¿
y � �2110 23xy � 152 22x
y � 41e 2 xy � 10.47 2 x y � 512 2 xy � 5x
y � 11 � e5x 25y � xe
y � eexy � 12 � 3e�x 23
c21t 2 � t2e�t.c11t 2 � te�t
M1t 2 � �3 N � 1000 .
2000�30 � te� t20�.N1t 2 �
NEL
C H A P T E R 5 265
18. The position of a particle is given by at time t. What are the
maximum values of the displacement, the velocity, and the acceleration?
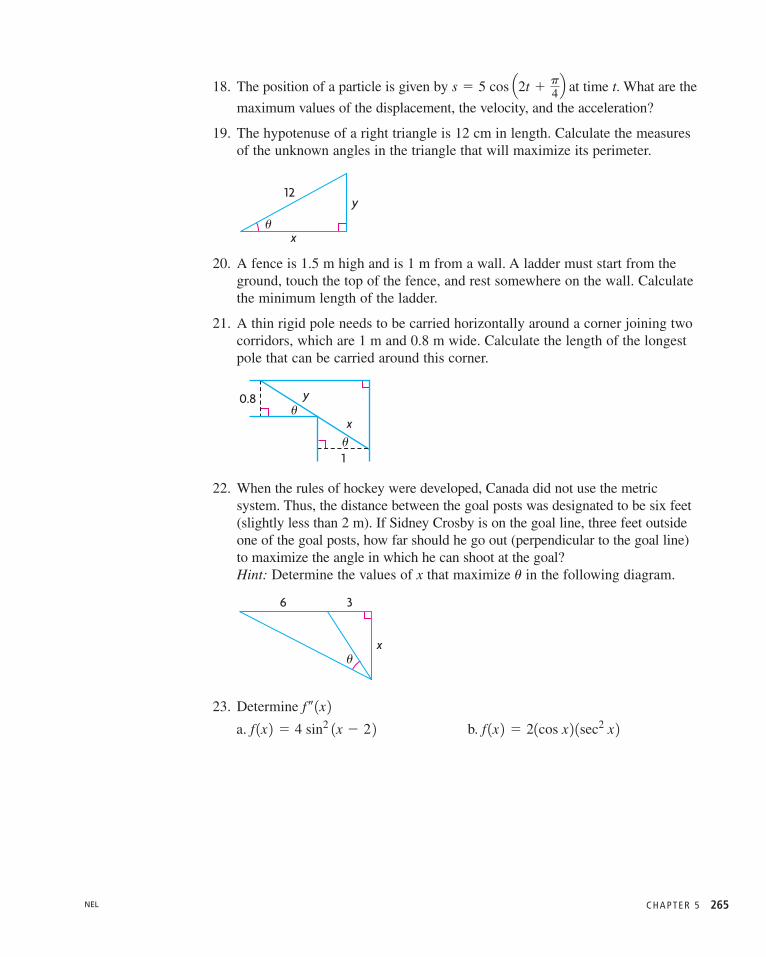
19. The hypotenuse of a right triangle is 12 cm in length. Calculate the measuresof the unknown angles in the triangle that will maximize its perimeter.
20. A fence is 1.5 m high and is 1 m from a wall. A ladder must start from theground, touch the top of the fence, and rest somewhere on the wall. Calculatethe minimum length of the ladder.
21. A thin rigid pole needs to be carried horizontally around a corner joining two corridors, which are 1 m and 0.8 m wide. Calculate the length of the longestpole that can be carried around this corner.
22. When the rules of hockey were developed, Canada did not use the metric system. Thus, the distance between the goal posts was designated to be six feet(slightly less than 2 m). If Sidney Crosby is on the goal line, three feet outsideone of the goal posts, how far should he go out (perpendicular to the goal line)to maximize the angle in which he can shoot at the goal?Hint: Determine the values of x that maximize in the following diagram.
23. Determine
a. b. f 1x 2 � 21cos x 2 1sec2 x 2f 1x 2 � 4 sin2 1x � 2 2f ¿¿ 1x 2
36
ux
u
1
0.8
u
uy
x
12y
xu
s � 5 cos Q2t �p4R
NEL
Chapter 5 Test
1. Determine the derivative for each of the following:
a. d.
b. e.
c. f.
2. Determine the equation of the tangent to the curve defined by that is parallel to the line defined by
3. Determine the equation of the tangent to at .
4. The velocity of a certain particle that moves in a straight line under theinfluence of forces is given by where k is a positive constantand is in centimetres per second.
a. Show that the acceleration of the particle is proportional to a constantmultiple of its velocity. Explain what is happening to the particle.
b. What is the initial velocity of the particle?
c. At what time is the velocity equal to half the initial velocity? What is theacceleration at this time?
5. Determine
a. b.
6. Determine the absolute extreme values of , where .
7. Calculate the slope of the tangent line that passes through , whereExpress your answer to two decimal places.
8. Determine all the maximum and minimum values of
9.
a. Determine all critical number for f(x) on the given interval.
b. Determine the intervals where f(x) is increasing and where it is decreasing.
c. Determine all local maximum and minimum values of f(x) on the given interval.
d. Use the information you found above to sketch the curve.
f 1x 2 � 2 cos x �sin 2x where x� 3�p, p 4 y � xex � 3ex.
x � 2.y � 5x
x� 30, p 4f 1x 2 � sin2 x
f 1x 2 � cos x cot xf 1x 2 � cos2 x
f –1x 2 .
v1t 2 v1t 2 � 10e�kt,
10, 1 2y � ex � sin x
�6x � y � 2.y � 2e3x
y � tan�1 � xy �e3x � e�3x
2
y � sin3 1x2 2y � 3x2�3x
y � 2 sin x � 3 cos 5xy � e�2x2
dydx
C H A P T E R 5 T E S T266 NEL
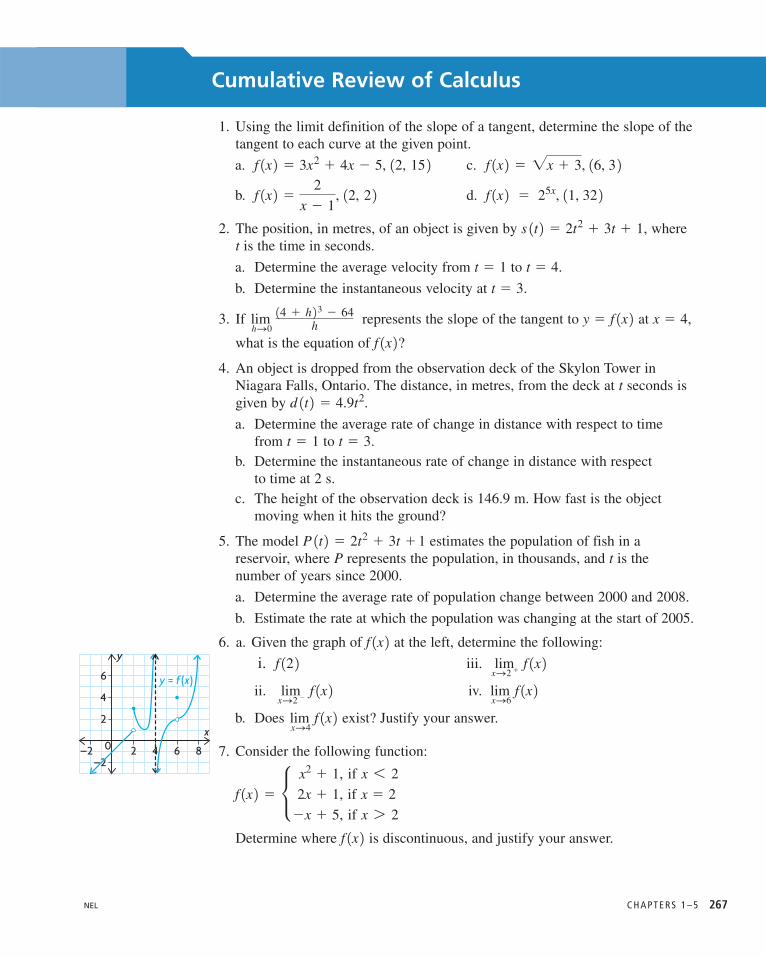
C H A P T E R S 1 – 5
Cumulative Review of Calculus
1. Using the limit definition of the slope of a tangent, determine the slope of thetangent to each curve at the given point.
a. c.
b. d.
2. The position, in metres, of an object is given by where t is the time in seconds.
a. Determine the average velocity from to
b. Determine the instantaneous velocity at
3. If represents the slope of the tangent to at
what is the equation of
4. An object is dropped from the observation deck of the Skylon Tower inNiagara Falls, Ontario. The distance, in metres, from the deck at t seconds isgiven by
a. Determine the average rate of change in distance with respect to time from to
b. Determine the instantaneous rate of change in distance with respect to time at 2 s.
c. The height of the observation deck is 146.9 m. How fast is the object moving when it hits the ground?
5. The model estimates the population of fish in a reservoir, where P represents the population, in thousands, and t is the number of years since 2000.
a. Determine the average rate of population change between 2000 and 2008.
b. Estimate the rate at which the population was changing at the start of 2005.
6. a. Given the graph of at the left, determine the following:
i. iii.
ii. iv.
b. Does exist? Justify your answer.
7. Consider the following function:
Determine where is discontinuous, and justify your answer.f 1x 2f 1x 2 � • x2 � 1, if x 6 2
2x � 1, if x � 2
�x � 5, if x 7 2
lim xS4
f 1x 2 lim xS6
f 1x 2lim xS2 �
f 1x 2 lim xS2 �
f 1x 2f 12 2 f 1x 2
P 1t 2 � 2t2 � 3t �1
t � 3.t � 1
d 1t 2 � 4.9t2.
f 1x 2? x � 4,y � f 1x 2lim hS0
14 � h 2 3 � 64
h
t � 3.
t � 4.t � 1
s 1t 2 � 2t2 � 3t � 1,
f 1x 2 � 25x, 11, 32 212, 2 2f 1x 2 �2
x � 1,
f 1x 2 � �x � 3, 16, 3 212, 15 2f 1x 2 � 3x2 � 4x � 5,
NEL
y
6
0
2
–2
4
2 4 6 8–2
x
y = f (x)
267

8. Use algebraic methods to evaluate each limit (if it exists).
a. d.
b. e.
c. f.
9. Determine the derivative of each function from first principles.
a. b.
10. Determine the derivative of each function.
a. d.
b. e.
c. f.
11. Determine the equation of the tangent to at the point
12. Determine the slope of the tangent to at the point where thecurve intersects the line
13. In 1980, the population of Littletown, Ontario, was 1100. After a time t, inyears, the population was given by
a. Determine the function that describes the rate of change of the population at time t.
b. Determine the rate of change of the population at the start of 1990.
c. At the beginning of what year was the rate of change of the population 110 people per year?
14. Determine and for each function.
a. c.
b. d.
15. Determine the extreme values of each function on the given interval.
a. c.
b. d. f 1x 2 � 2 sin 4x � 3, x� 30, p 41 � x � 9f 1x 2 � x �1
�x,
x� 30, 4 4f 1x 2 �ex
1 � ex ,�2 � x � 6f 1x 2 � 1 � 1x � 3 22,
f 1x 2 � x4 �1
x4f 1x 2 ��2
x2
f 1x 2 �4
Vxf 1x 2 � x5 � 5x3 � x � 12
f –f ¿
p¿ 1t 2 , p 1t 2 � 2t2 � 6t � 1100.
y � 3x.y � x2 � 9x � 9
11 , 2 2 .y �181x � 2 2 2
y � 3x2 � 12x � 1 23 45y �2x
x � 3
y �14x2 � 1 2513x � 2 23y � �2x 3 � 1
y � 1x2 � 3 2214x5 � 5x � 1 2y � x3 � 4x2 � 5x � 2
f 1x 2 �1x
f 1x 2 � 3x2 � x � 1
lim xS0
Vx � 4 � V4 � xx
lim xS�3
1x �
13
x � 3
lim xS2
x � 2
x3 � 8lim xS3
x � 3
Vx � 6 � 3
lim xS2
x2 � 4
x2 � x � 2lim xS0
2x2 � 1
x � 5
C U M U L AT I V E R E V I E W O F C A L C U L U S NEL268
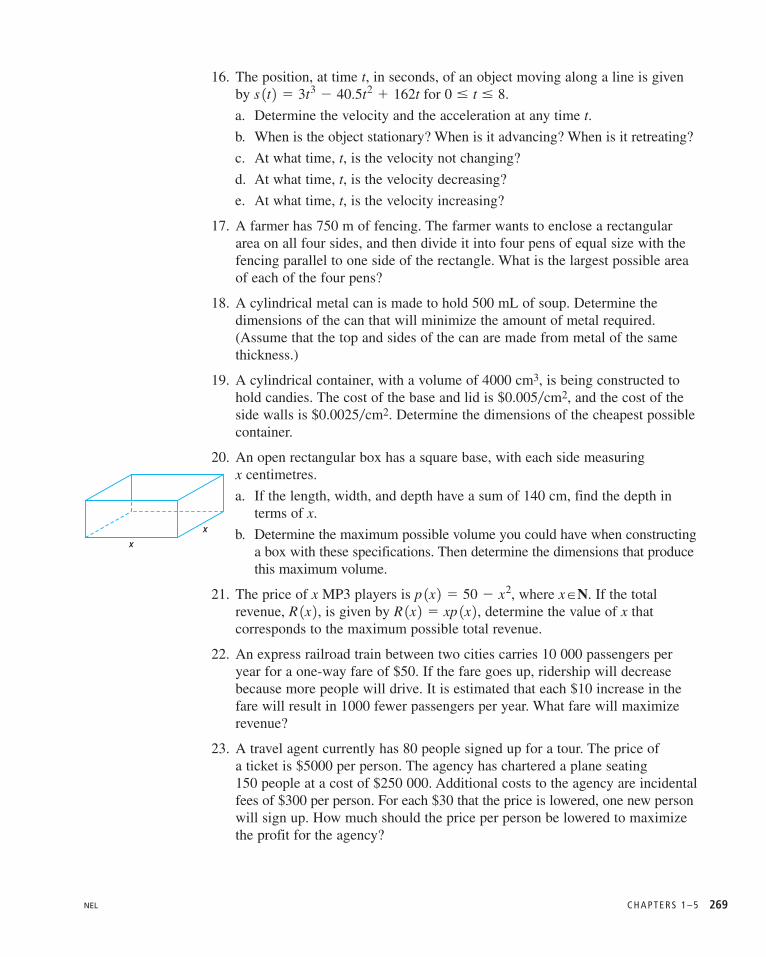
16. The position, at time t, in seconds, of an object moving along a line is givenby for
a. Determine the velocity and the acceleration at any time t.
b. When is the object stationary? When is it advancing? When is it retreating?
c. At what time, t, is the velocity not changing?
d. At what time, t, is the velocity decreasing?
e. At what time, t, is the velocity increasing?
17. A farmer has 750 m of fencing. The farmer wants to enclose a rectangulararea on all four sides, and then divide it into four pens of equal size with thefencing parallel to one side of the rectangle. What is the largest possible areaof each of the four pens?
18. A cylindrical metal can is made to hold 500 mL of soup. Determine thedimensions of the can that will minimize the amount of metal required.(Assume that the top and sides of the can are made from metal of the samethickness.)
19. A cylindrical container, with a volume of 4000 cm3, is being constructed tohold candies. The cost of the base and lid is $0.005 cm2, and the cost of theside walls is $0.0025 cm2. Determine the dimensions of the cheapest possiblecontainer.
20. An open rectangular box has a square base, with each side measuring x centimetres.
a. If the length, width, and depth have a sum of 140 cm, find the depth interms of x.
b. Determine the maximum possible volume you could have when constructinga box with these specifications. Then determine the dimensions that producethis maximum volume.
21. The price of x MP3 players is where If the totalrevenue, is given by determine the value of x thatcorresponds to the maximum possible total revenue.
22. An express railroad train between two cities carries 10 000 passengers peryear for a one-way fare of $50. If the fare goes up, ridership will decreasebecause more people will drive. It is estimated that each $10 increase in thefare will result in 1000 fewer passengers per year. What fare will maximizerevenue?
23. A travel agent currently has 80 people signed up for a tour. The price of a ticket is $5000 per person. The agency has chartered a plane seating 150 people at a cost of $250 000. Additional costs to the agency are incidentalfees of $300 per person. For each $30 that the price is lowered, one new personwill sign up. How much should the price per person be lowered to maximizethe profit for the agency?
R 1x 2 � xp 1x 2 ,R 1x 2 , x�N.p 1x 2 � 50 � x2,
0 � t � 8.s 1t 2 � 3t3 � 40.5t2 � 162t
C H A P T E R S 1 – 5NEL
xx
269

24. For each function, determine the derivative, all the critical numbers, and theintervals of increase and decrease.
a. c.
b. d.
25. For each of the following, determine the equations of any horizontal, vertical,or oblique asymptotes and all local extrema:
a. b.
26. Use the algorithm for curve sketching to sketch the graph of each function.
a. b.
27. Determine the derivative of each function.
a. c.
b. d.
28. Determine the equation of the tangent to the curve at
29. In a research laboratory, a dish of bacteria is infected with a particular
disease. The equation models the number of bacteria, N,
that will be infected after d days.
a. How many days will pass before the maximum number of bacteria will be infected?
b. Determine the maximum number of bacteria that will be infected.
30. Determine the derivative of each function.
a. d.
b. e.
c. f.
31. A tool shed, 250 cm high and 100 cm deep, is built against a wall. Calculatethe shortest ladder that can reach from the ground, over the shed, to the wallbehind.
32. A corridor that is 3 m wide makes a right-angle turn, as shown on the left.Find the longest rod that can be carried horizontally around this corner.Round your answer to the nearest tenth of a metre.
y � sin 1cos x2 2y � �x2 � sin 3x
y � tan x2 � tan2 xy � 1sin 2x � 1 24 y �sin x
cos x � 2y � 2 sin x � 3 cos 5x
N 1d 2 � 115d 2e�d5
x � 1.y � e2x�1
y � esin xf 1x 2 � xe3x
y � 63x�8f 1x 2 � 1�4 2e5x�1
y �3x
x2 � 4f 1x 2 � 4x3 � 6x2 � 24x � 2
y �4x3
x2 � 1y �
8
x2 � 9
y �x
x � 2y � 6x2 � 16x � 40
y � 2x3 � 24xy � �5x2 � 20x � 2
C U M U L AT I V E R E V I E W O F C A L C U L U S NEL
3 m
3 m
270

4. hole at large and negative toleft of asymptote, large and positive toright of asymptote;
;Domain:
5.
6. There are discontinuities at and
is a vertical asymptote.
is a vertical asymptote.
The y-intercept is and x-interceptis .
is a local minimum and
is a local maximum.
is a horizontal asymptote.
7.
Chapter 5
Review of Prerequisite Skills,pp. 224–225
1. a. c.
b. 4 d.
2. a.
b.
c.
d.
e.
f.
3. a.
x-intercept:
b.
no x-intercept
4. a. b. c.
5. a. e.
b. f.
c. g.
d. h.
6. a. c. e.
b. d. f.
7. a. ,
b. ,
c. ,
d. ,
is undefined
8. a. period: ,amplitude: 1
b. period: ,amplitude: 2
c. period: 2,amplitude: 3
d. period: ,
amplitude:
e. period:amplitude: 5
f. period:
amplitude:
9. a.
b.
10. a.LS
RS
Therefore,sec x csc x.
tan x � cot x �
�1
cos x sin x
�1
cos x �1
sin x
� sec x csc x �
1
cos x � sin x
�sin2 x � cos2 x
cos x � sin x
�sin xcos x �
cos xsin x
� tan x � cot xtan x � cot x � sec x csc x
3p2
5p2
7p2
3
2
1
0– 1
–2
–3
2p 3ppp2
x
y
3p2
3
4
2
1
0 2ppp2
x
y
32
2p,
2p,
27
p6
4p
p
tan p
2
cos p
2� 0
cos u �1
�5
sin u � �2
�5
tan u ��5
2
sin u � ��5
3
tan u � �5
12
cos u � �12
13
�bab
a
bab
11p
6
p
6
5p
4�p
2
�2p
3
p
4
3p
22p
y
x
x
r
y
r
80–2
y
x
42 6–4 –2–8 –6
4
2
6
8
10
1�1, 0 22 30
3
2
1
–1
–2
–3
1–2–3 –1
x
y
loga T � b
log3 z � 8
log10 450 � w
logx 3 � 3
log4 1
16� �2
log5 625 � 4
9
4
1
9
1
9
y
x
4
6
8
2
0–2
–4
–6
–8
–2 –1–3–4 2 3 41
(0, 2)
(–2, 6)
c � 2b � 3,
y
x
4
6
8
2
0–2
–4
–6
–8
–4 –2–6–8–10 4 6 8 102
y � 0
1�1, �1 2Q�9, �19R�5
�109
limxS3�
f 1x 2 � �q
limxS3�
f 1x 2 � q¶ x � 3
limxS3�
f 1x 2 � q
limxS3�
f 1x 2 � �q¶ x � �3
x � 3.x � �3
y
x20
–40
–60
–80
–100
–120
–140
–20–4 –2–6 4 6 8 1020
5x�R 0 x � �2, x � 36y � 1
x � �2;
A n s w e r s 653NEL
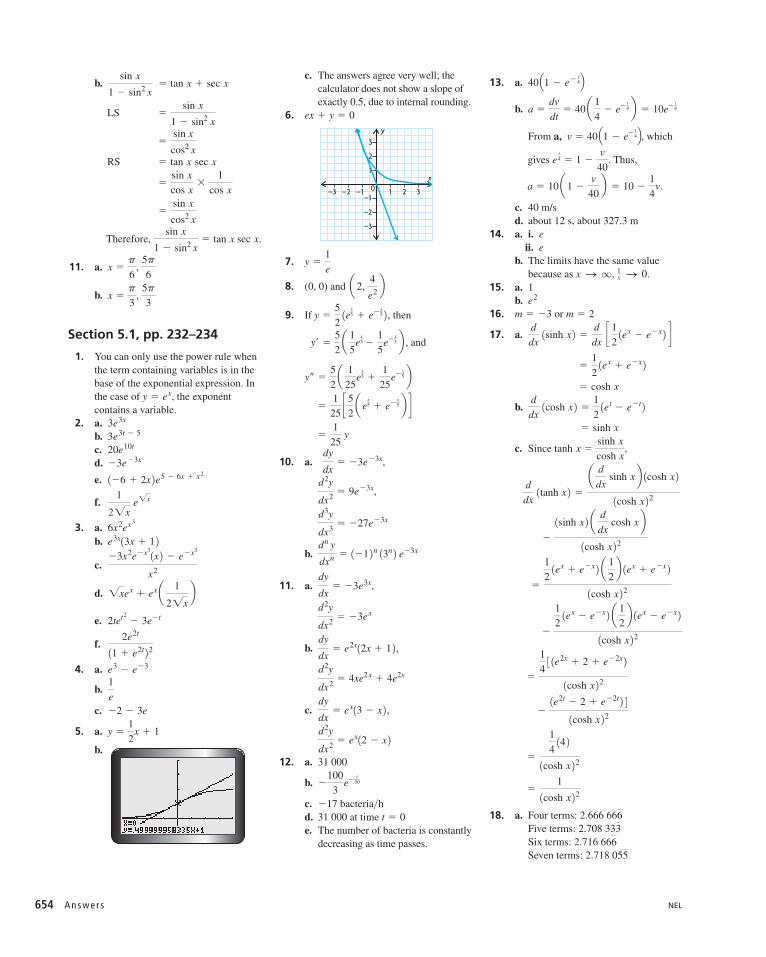
b.
LS
RS
Therefore,
11. a.
b.
Section 5.1, pp. 232–234
1. You can only use the power rule whenthe term containing variables is in thebase of the exponential expression. Inthe case of the exponentcontains a variable.
2. a.b.c.d.
e.
f.
3. a.b.
c.
d.
e.
f.
4. a.
b.
c.
5. a.
b.
c. The answers agree very well; thecalculator does not show a slope ofexactly 0.5, due to internal rounding.
6.
7.
8. (0, 0) and
9. If then
and
10. a. ,
,
b.
11. a. ,
b. ,
c. ,
12. a. 31 000
b.
c. bacteria hd. 31 000 at time e. The number of bacteria is constantly
decreasing as time passes.
13. a.
b.
From a, which
gives Thus,
c. 40 m/sd.
14. a. i. eii. e
b. The limits have the same valuebecause as x , 0.
15. a.b.
16. or
17. a.
b.
c. Since
18. a. Four terms:Five terms:Six terms:Seven terms: 2.718 055
2.716 6662.708 3332.666 666
�11cosh x 22
�
1
4 14 21cosh x 22
�1e2t � 2 � e�2t 2 41cosh x 22
�
1
43 1e2x � 2 � e�2x 21cosh x 22
�
1
2 1ex � e�x 2 a 1
2b 1ex � e�x 21cosh x 22
�
1
2 1ex � e�x 2 a 1
2b 1ex � e�x 21cosh x 22
�
1sinh x 2 a d
dx cosh x b1cosh x 22
d
dx 1tanh x 2 �
a d
dx sinh x b 1cosh x 21cosh x 22
tanh x �sinh xcosh x,
� sinh x
d
dx 1cosh x 2 �
1
21et � e�t 2� cosh x
�1
21ex � e�x 2
d
dx 1sinh x 2 �
d
dx c 1
21ex � e�x 2 dm � 2m � �3
e21
S1xqS
about 12 s, about 327.3 m
a � 10 a1 �v
40b � 10 �
1
4v.
et4 � 1 �
v
40.
v � 40 Q1 � e� t4R,a �
dv
dt� 40 a 1
4� e� t
4 b � 10e� t4
40 Q1 � e� t4R
t � 0>�17
�100
3e� t
30
d2y
dx2� ex12 � x 2
dy
dx� ex13 � x 2
d2y
dx2� 4xe2x � 4e2x
dy
dx� e2x12x � 1 2
d2y
dx2� �3ex
dy
dx� �3e3x
dn y
dxn � 1�1 2n 13n 2 e�3x
d3y
dx3� �27e�3x
d2y
dx2� 9e�3x
dy
dx� �3e�3x
�1
25 y
�1
25c 52a e
x5 � e�x
5 b dy– �
5
2a 1
25e
x5 �
1
25e�x
5 by¿ �
5
2a 1
5e
x5 �
1
5e�x
5 b ,
y �5
2 1ex
5 � e�x5 2 ,
a2, 4
e2by �
1
e
2 30
3
2
1
–1
–2
–3
1–2–3 –1
x
y
ex � y � 0
y �1
2x � 1
�2 � 3e
1
e
e3 � e�3
2e2t11 � e2t 222tet2
� 3e�t
�xex � ex a 1
2�xb
�3x2e�x31x 2 � e�x3
x2
e3x13x � 1 26x2ex3
1
2�x e�x
1�6 � 2x 2e5 � 6x � x2
�3e�3x20e10t3e3t � 53e3x
y � ex,
5p
3x �p
3,
5p
6x �p
6,
sin x1 � sin2 x
� tan x sec x.
�sin xcos2 x
�sin xcos x �
1
cos x
� tan x sec x �
sin x
cos2 x
�sin x
1 � sin2 x
sin x1 � sin2 x
� tan x � sec x
A n s w e r s654 NEL
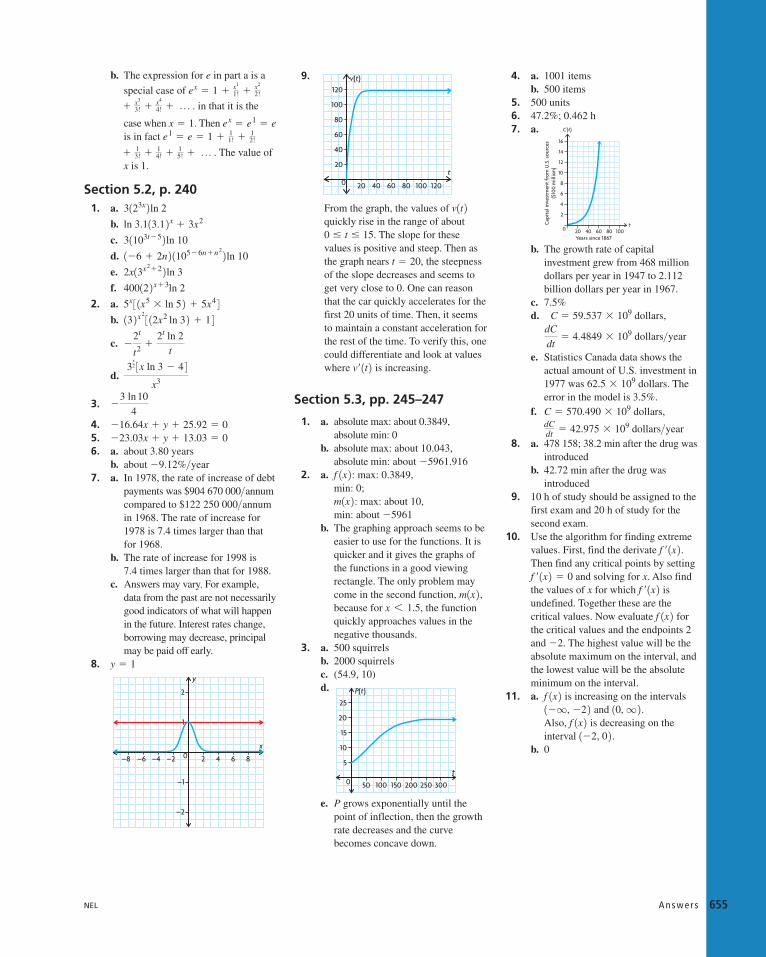
b. The expression for e in part a is a
special case of
in that it is the
case when Then is in fact
The value ofx is 1.
Section 5.2, p. 2401. a.
b.
c.
d.
e.
f.
2. a.
b.
c.
d.
3.
4.5.6. a. about years
b. about % year7. a. In 1978, the rate of increase of debt
payments was $904 670 000 annumcompared to $122 250 000 annumin 1968. The rate of increase for1978 is 7.4 times larger than thatfor 1968.
b. The rate of increase for 1998 is 7.4 times larger than that for 1988.
c. Answers may vary. For example,data from the past are not necessarilygood indicators of what will happenin the future. Interest rates change,borrowing may decrease, principalmay be paid off early.
8.
9.
From the graph, the values of quickly rise in the range of about
The slope for thesevalues is positive and steep. Then asthe graph nears , the steepnessof the slope decreases and seems toget very close to 0. One can reasonthat the car quickly accelerates for thefirst 20 units of time. Then, it seemsto maintain a constant acceleration forthe rest of the time. To verify this, onecould differentiate and look at valueswhere is increasing.
Section 5.3, pp. 245–247
1. a. absolute max: about 0.3849,absolute min: 0
b. absolute max: about 10.043,absolute min: about
2. a. max: 0.3849,min: 0;
max: about 10,min: about
b. The graphing approach seems to beeasier to use for the functions. It isquicker and it gives the graphs ofthe functions in a good viewingrectangle. The only problem maycome in the second function,because for , the functionquickly approaches values in thenegative thousands.
3. a. 500 squirrelsb. 2000 squirrelsc. (54.9, 10)d.
e. P grows exponentially until thepoint of inflection, then the growthrate decreases and the curvebecomes concave down.
4. a. 1001 itemsb. 500 items
5. 500 units6. 47.2%; 0.462 h7. a.
b. The growth rate of capitalinvestment grew from 468 milliondollars per year in 1947 to 2.112billion dollars per year in 1967.
c. 7.5%d. dollars,
dollars year
e. Statistics Canada data shows theactual amount of U.S. investment in1977 was dollars. Theerror in the model is 3.5%.
f. dollars,
dollars year8. a. 478 158; 38.2 min after the drug was
introducedb. 42.72 min after the drug was
introduced9. 10 h of study should be assigned to the
first exam and 20 h of study for thesecond exam.
10. Use the algorithm for finding extremevalues. First, find the derivate .Then find any critical points by setting
and solving for x. Also findthe values of x for which isundefined. Together these are thecritical values. Now evaluate forthe critical values and the endpoints 2and The highest value will be theabsolute maximum on the interval, andthe lowest value will be the absoluteminimum on the interval.
11. a. is increasing on the intervals and
Also, is decreasing on theinterval
b. 01�2, 0 2 .f 1x 2 10, q 2 .1�q, �2 2f 1x 2
�2.
f 1x 2f ¿ 1x 2f ¿ 1x 2 � 0
f ¿ 1x 2
>dCdt � 42.975 � 109
C � 570.490 � 109
62.5 � 109
>dC
dt� 4.4849 � 109
C � 59.537 � 109
16
14
12
10
8
6
4
2
0 20 40 60 80 100Years since 1867
Cap
ital
inve
stm
ent
from
U.S
. sou
rces
($10
0 m
illio
n)
t
C(t)
25
20
15
10
5
0 50 100 150 200 250 300
P(t)
t
x 6 1.5m1x 2 ,
�5961m1x 2 :f 1x 2 : �5961.916
v¿ 1t 2
t � 20
0 � t � 15.
v1t 2
120
100
80
60
40
20
0 20 40 60 80 100 120
t
v(t)
y
x
1
2
0
–1
–2
–4 –2–6–8 4 6 82
y � 1
>>>�9.12
3.80�23.03x � y � 13.03 � 0�16.64x � y � 25.92 � 0
�3 ln 10
4
3x2 3x ln 3 � 4 4
x3
�2t
t2�
2t ln 2
t
13 2x2 3 12x2 ln 3 2 � 1 45x 3 1x5 � ln 5 2 � 5x4 440012 2 x�3ln 2
2x13x2�2 2 ln 3
1105�6n�n2 2 ln 101�6 � 2n 231103t�5 2 ln 10
ln 3.113.1 2x � 3x2
3123x 2 ln 2
15! � p .� 1
4! �� 13!
� 12!e1 � e � 1 � 1
1!
ex � e1 � ex � 1.
� x3
3! � x4
4! � p .
ex � 1 � x1
1! � x2
2!
A n s w e r s 655NEL
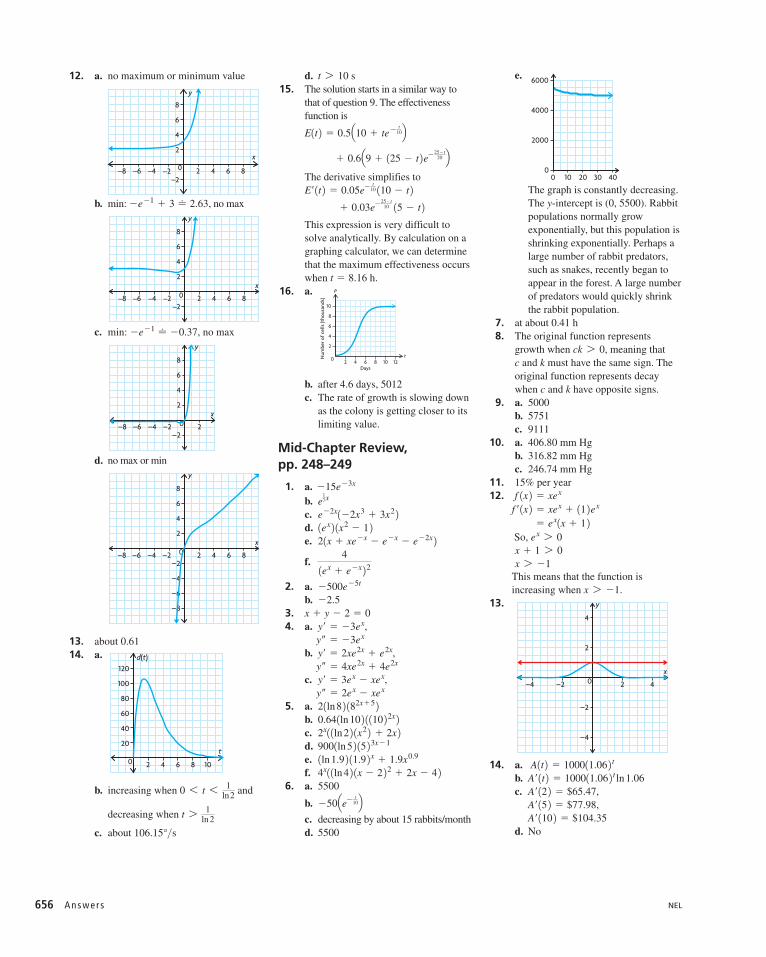
12. a. no maximum or minimum value
b. min: no max
c. min: no max
d. no max or min
13. about 0.6114. a.
b. increasing when and
decreasing when
c. about s
d.15. The solution starts in a similar way to
that of question 9. The effectivenessfunction is
The derivative simplifies to
This expression is very difficult tosolve analytically. By calculation on agraphing calculator, we can determinethat the maximum effectiveness occurswhen h.
16. a.
b. after 4.6 days, 5012c. The rate of growth is slowing down
as the colony is getting closer to itslimiting value.
Mid-Chapter Review, pp. 248–249
1. a.b.c.d.e.
f.
2. a.b.
3.4. a. ,
b. ,
c. ,
5. a.b.c.d.e.f.
6. a. 5500
b.
c. decreasing by about 15 rabbits/monthd. 5500
e.
The graph is constantly decreasing.The y-intercept is (0, 5500). Rabbitpopulations normally growexponentially, but this population isshrinking exponentially. Perhaps alarge number of rabbit predators,such as snakes, recently began toappear in the forest. A large numberof predators would quickly shrinkthe rabbit population.
7. at about 0.41 h8. The original function represents
growth when meaning that c and k must have the same sign. Theoriginal function represents decaywhen c and k have opposite signs.
9. a. 5000b. 5751c. 9111
10. a. 406.80 mm Hgb. 316.82 mm Hgc. 246.74 mm Hg
11. 15% per year12.
So,
This means that the function is increasing when
13.
14. a.b.c. ,
,
d. NoA¿ 110 2 � $104.35A¿ 15 2 � $77.98A¿ 12 2 � $65.47A¿ 1t 2 � 100011.06 2 t ln 1.06 A1t 2 � 100011.06 2 t
x
2
4
0
–2
–4
–2–4 2 4
y
x 7 �1.
x 7 �1x � 1 7 0
ex 7 0 � ex1x � 1 2 f ¿ 1x 2 � xex � 11 2ex
f 1x 2 � xex
ck 7 0,
6000
4000
2000
0100 20 30 40
�50Qe� t10R
4x1 1ln 4 2 1x � 2 22 � 2x � 4 21ln 1.9 2 11.9 2 x � 1.9x0.99001ln 5 2 15 23x�12x1 1ln 2 2 1x2 2 � 2x 20.641ln 10 2 1 110 22x 221ln 8 2 182x�5 2y– � 2ex � xexy¿ � 3ex � xexy– � 4xe2x � 4e2xy¿ � 2xe2x � e2xy– � �3exy¿ � �3ex
x � y � 2 � 0�2.5�500e�5t
41ex � e�x 2221x � xe�x � e�x � e�2x 21ex 2 1x2 � 1 2e�2x1�2x3 � 3x2 2e
17x
�15e�3x
10
8
6
4
2
0 2 4 6 8 10 12Days
Num
ber o
f cel
ls (t
hous
ands
)
t
P
t � 8.16
� 0.03e�25�t10 15 � t 2E¿ 1t 2 � 0.05e� t
10 110 � t 2� 0.6Q9 � 125 � t 2e�25�t
20 RE1t 2 � 0.5Q10 � te� t10R
t 7 10 s
>106.15°
t 7 1ln 2
0 6 t 6 1ln 2
120
100
80
60
40
20
0 2 4 6 8 10
t
d(t)
4
6
8
2
–4
–2
–6
–8
–4 –2–6–8 4 6 820
y
x
4
6
8
2
–2–4 –2–6–8 20
y
x
�e�1 � �0.37,
4
6
8
2
–2–4 –2–6–8 4 6 820
y
x
�e�1 � 3 � 2.63,
–6–8 6 80
4
2
–2
6
8
y
x
2 4–4 –2
A n s w e r s656 NEL
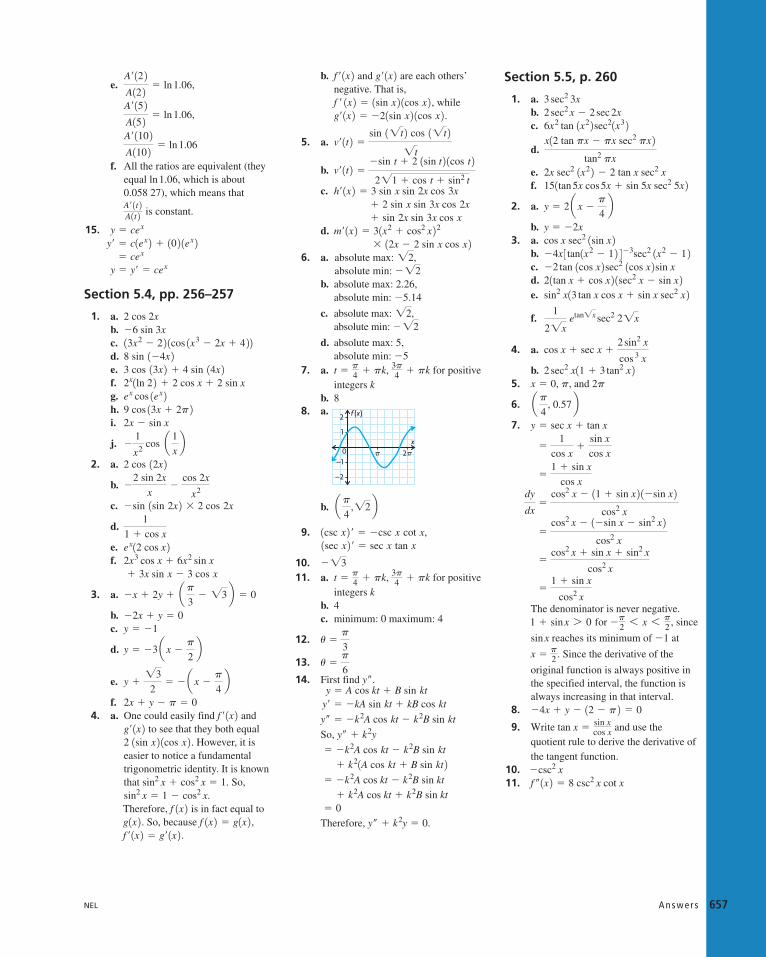
e.
f. All the ratios are equivalent (theyequal which is about 0.058 27), which means that
is constant.
15.
Section 5.4, pp. 256–257
1. a.b.c.d.e.f.g.h.i.
j.
2. a.
b.
c.
d.
e.f.
3. a.
b.c.
d.
e.
f.4. a. One could easily find and
to see that they both equalHowever, it is
easier to notice a fundamentaltrigonometric identity. It is knownthat So,
Therefore, is in fact equal toSo, because
b. and are each others’negative. That is,
, while
5. a.
b.
c.
d.
6. a. absolute max: ,absolute min:
b. absolute max: 2.26,absolute min:
c. absolute max: ,absolute min:
d. absolute max: 5,absolute min:
7. a. for positiveintegers k
b. 88. a.
b.
9. ,
10.11. a. for positive
integers kb. 4c. minimum: 0 maximum: 4
12.
13.
14. First find
So,
Therefore,
Section 5.5, p. 260
1. a.b.c.
d.
e.f.
2. a.
b.3. a.
b.c.d.e.
f.
4. a.
b.5. and
6.
7.
The denominator is never negative.for since
reaches its minimum of at
Since the derivative of the
original function is always positive inthe specified interval, the function isalways increasing in that interval.
8.
9. Write tan and use the quotient rule to derive the derivative of the tangent function.
10.11. f – 1x 2 � 8 csc2 x cot x
�csc2 x
x �sin xcos x
�4x � y � 12 � p 2 � 0
x �p2 .
�1sin x
�p2 6 x 6 p2 ,1 � sin x 7 0
�1 � sin x
cos2 x
�cos2 x � sin x � sin2 x
cos2 x
�cos2 x � 1�sin x � sin2 x 2
cos2 x
dy
dx�
cos2 x � 11 � sin x 2 1�sin x 2cos2 x
�1 � sin x
cos x
�1
cos x�
sin x
cos x
y � sec x � tan x
ap4
, 0.57 b 2pp,x � 0,2 sec2 x11 � 3 tan2 x 2cos x � sec x �
2 sin2 x
cos 3 x
1
2�x etan�x sec2 2�x
sin2 x13 tan x cos x � sin x sec2 x 221tan x � cos x 2 1sec2 x � sin x 2�2 tan 1cos x 2sec2 1cos x 2sin x�4x 3 tan1x2 � 1 2 4�3sec2 1x2 � 1 2cos x sec2 1sin x 2y � �2x
y � 2 a x �p
4b151tan 5x cos 5x � sin 5x sec2 5x 22x sec2 1x2 2 � 2 tan x sec2 x
x12 tan px � px sec2 px 2tan2 px
6x2 tan 1x2 2sec21x3 22 sec2 x � 2 sec 2x
3 sec2 3x
y– � k2y � 0.
� 0� k2A cos kt � k2B sin kt
� �k2A cos kt � k2B sin kt
� k21A cos kt � B sin kt 2� �k2A cos kt � k2B sin kt
y– � k2y
y– � �k2A cos kt � k2B sin kt
y¿ � �kA sin kt � kB cos kt y � A cos kt � B sin kt
y–.u �p
6
u �p
3
3p4 � pkt �
p4 � pk,
��3
1sec x 2 ¿ � sec x tan x1csc x 2 ¿ � �csc x cot xap
4,�2 b
p 2p
2
1
0–1
–2
x
f (x)
3p4 � pkt �
p4 � pk,
�5
��2�2
�5.14
��2�2
� 12x � 2 sin x cos x 2m¿ 1x 2 � 31x2 � cos2 x 22� sin 2x sin 3x cos x� 2 sin x sin 3x cos 2x
� 3 sin x sin 2x cos 3xh¿ 1x 2v¿ 1t 2 ��sin t � 2 1sin t 2 1cos t 2
2�1 � cos t � sin2 t
v¿ 1t 2 �sin 1�t 2 cos 1�t 2
�t
g¿ 1x 2 � �21sin x 2 1cos x 2 .f ¿ 1x 2 � 1sin x 2 1cos x 2g¿ 1x 2f ¿ 1x 2
f ¿ 1x 2 � g¿ 1x 2 . f 1x 2 � g1x 2 ,g1x 2 . f 1x 2sin2 x � 1 � cos2 x.sin2 x � cos2 x � 1.
2 1sin x 2 1cos x 2 .g¿ 1x 2 f ¿ 1x 22x � y � p � 0
y ��3
2� � a x �
p
4b
y � �3 a x �p
2by � �1
�2x � y � 0
�x � 2y � ap3
� �3 b � 0
� 3x sin x � 3 cos x2x3 cos x � 6x2 sin xex12 cos x 2
1
1 � cos x
�sin 1sin 2x 2 � 2 cos 2x
�2 sin 2x
x�
cos 2x
x2
2 cos 12x 2�1
x2 cos a 1
xb2x � sin x
9 cos 13x � 2p 2ex cos 1ex 22x1ln 2 2 � 2 cos x � 2 sin x3 cos 13x 2 � 4 sin 14x 28 sin 1�4x 213x2 � 2 2 1cos 1x3 � 2x � 4 2 2�6 sin 3x2 cos 2x
y � y¿ � cex � cex
y¿ � c1ex 2 � 10 2 1ex 2y � cex
A¿ 1t 2A1t 2
ln 1.06,
A¿ 110 2A110 2 � ln 1.06
A¿ 15 2A15 2 � ln 1.06,
A¿ 12 2A12 2 � ln 1.06,
A n s w e r s 657NEL

Review Exercise, pp. 263–265
1. a.b.c.
d.e.
f.
2. a.b.c.d.
e.
f.
3. a.b.
c.
d.e.f.
4. a.b. The function has a horizontal
tangent at (1, e). So this point couldbe possible local max or min.
5. a.b. The slope of the tangent to at
the point with x-coordinate is 0.
6. a.b.
7.
Now,
8.9.
10. about m per unit of time
11. a.b. After 10 days, about 0.1156 mice
are infected per day. Essentially,almost 0 mice are infected per daywhen
12. a.b.
13. a.b.c.d.
14. a.b.
c.
d.e.f.
15. a.b.
c.
d.e.f.
16.
17.Thus,
The acceleration at any time t is
Hence,Now,
18. displacement: 5,velocity: 10,acceleration: 20
19. each angle rad, or 20. 4.5 m21. 2.5 m22. 5.19 ft23. a.
b.
Chapter 5 Test, p. 266
1. a.b.
c.
d.
e.
f.
2. ,The tangent line is the given line.
3.4. a.
Thus, the acceleration is a constantmultiple of the velocity. As thevelocity of the particle decreases,the acceleration increases by afactor of k.
b. 10 cm s
c.
5. a.b.
6. absolute max: 1,absolute min: 0
7. 40.24
8. minimum: , no maximum
9. a.
b. increasing:
decreasing: and
c. local maximum at local
minimum at
d.
Cumulative Review of Calculus,pp. 267–270
1. a. 16 c.
b. d.2. a. m s
b. m s3.4. a. m s
b. m sc. m s>53.655
>19.6>19.6
f 1x 2 � x3>15>13
160 ln 2�2
1
6
–p p3p4
0
2
1
–2
–1
–3
–4
3
4
y
x– 3p4
p2– p
2p4– p
4
x � �5p6
x � �p6 ;
�p6 6 x 6 p
�p � x 6 �5p6
�5p6 6 x 6 �
p6 ;
x � �p
6, �
5p
6, p
2
Q�4, � 1e4R
� csc3 x � sin xf – 1x 2 � csc x cot2 xf – 1x 2 � 21sin2 x � cos2 x 2ln 2
k; �5k
>
� �kv1t 2� �k110e�kt 2a1t 2 � v¿ 1t 2 � �10ke�kt�2x � y � 1
�6x � y � 2
�sec2
�1 � x
2�1 � x
6x sin2 1x2 2cos 1x2 2
2 cos x � 15 sin 5x
3
23e3x � e�3x 43ex2�3x � ln 3 � 12x � 3 2�4xe�2x2
� 2 sin x1sec x 22 f – 1x 2 � 14 cos x 2 1sec2 x tan x 2� 8 cos2 1x � 2 2f – 1x 2 � �8 sin2 1x � 2 2
45°p4
� 100p218 sin 110pt 22 � 0.
d2sdt2 � 100p2s � �800p2 sin 110pt 2� �800p2sin 110pt 2 .a � 80p1�sin 110pt 22 110p 2a �
dvdt �
d2sdt2.
� 80p cos 110pt 2v � 81cos 110pt 22 110p 2v �dsdt;
x � y �p
2� 0
2 sin x cos2 x � sin3 x�2 cos x sin xcos2 x � sin2 x
�cos ap2
� x bx2 cos x � 2x sin x2x ln 2 cos 2x
�6110 23x ln 104ex512 2x ln 2
2152 22x ln 52
10.47 2x ln 10.47 25x ln 5
�25e5x11 � e5x 24ex�exexe�1�9e�x12 � 3e�x 22c1
c2
t � 10.
t � 20
0.3928
�x � y � 03x � y � 2 ln 2 � 2 � 0
�4e2x132x � 1 22 �
dy
dx
�e4x � 2e2x � 1 � e4x � 2e2x � 11e2x � 1 22
1 � y2 � 1 �e4x � 2e2x � 11e2x � 1 22
�4e2x1e2x � 1 22
�2e4x � 2e2x � 2e4x � 2e2x1e2x � 1 22
dy
dx�
2e2x1e2x � 1 2 � 1e2x � 1 2 12e2x 21e2x � 1 22y �
e2x � 1
e2x � 1
20e10x15x � 1 2ex1x � 1 2 12
f 1x 20
x � 1�4 cos 12x 2sin 12x 2e3x13 sin 2x � 2 cos 2x 22x sec2 12x 2 � tan 2x
�sin x12 � cos x 22
3 sec2 13x 26 cos 12x 2 � 8 sin 12x 25�x a�1
x2�
ln 5
2x�xb
4 � 4x ln 4
4x
x3 � 2x1x ln 2 � 4 25 � 5x1x ln 5 � 1 26x143x2 2 ln 410x ln 10
2et1et � 1 22ex1x � 1 21�6x � 5 2e�3x2�5x
2e2x�32 � 3ex�ex
A n s w e r s658 NEL
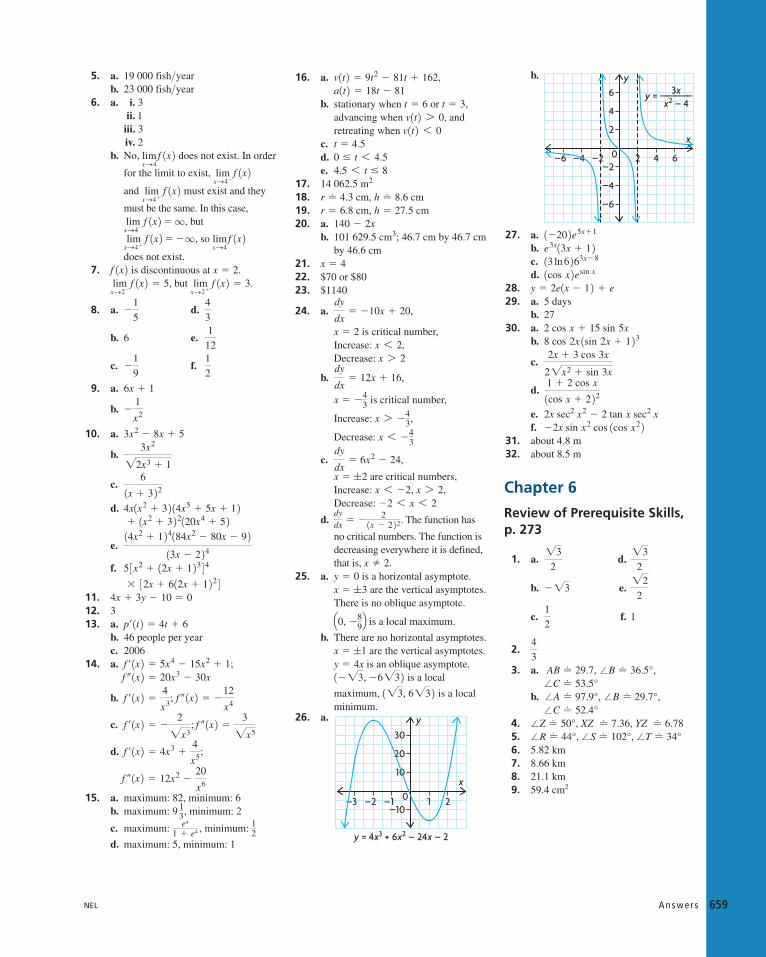
5. a. 19 000 fish yearb. 23 000 fish year
6. a. i. 3ii. 1
iii. 3iv. 2
b. No, does not exist. In order
for the limit to exist,
and must exist and they
must be the same. In this case,but
so
does not exist.7. is discontinuous at
but
8. a. d.
b. 6 e.
c. f.
9. a.
b.
10. a.
b.
c.
d.
e.
f.
11.12. 313. a.
b. 46 people per yearc. 2006
14. a.
b.
c.
d.
15. a. maximum: 82, minimum: 6b. maximum: minimum: 2
c. maximum: minimum:
d. maximum: 5, minimum: 1
16. a.
b. stationary when or advancing when andretreating when
c.d.e.
17.18. cm, cm19. cm, cm20. a.
b. 46.7 cm by 46.7 cmby 46.6 cm
21.22. $70 or $8023. $1140
24. a.
is critical number,Increase:Decrease:
b.
is critical number,
Increase:
Decrease:
c.
are critical numbers,Increase:Decrease:
d. The function has
no critical numbers. The function is decreasing everywhere it is defined,that is,
25. a. is a horizontal asymptote.are the vertical asymptotes.
There is no oblique asymptote.
is a local maximum.
b. There are no horizontal asymptotes.are the vertical asymptotes.
is an oblique asymptote.is a local
maximum, is a localminimum.
26. a.
b.
27. a.b.c.d.
28.29. a. 5 days
b. 2730. a.
b.
c.
d.
e.f.
31. about 4.8 m32. about 8.5 m
Chapter 6
Review of Prerequisite Skills,p. 273
1. a. d.
b. e.
c. f. 1
2.
3. a. , ,
b. , ,
4. , ,5. , ,6. 5.82 km7. 8.66 km8. 21.1 km9. 59.4 cm2
�T � 34°�S � 102°�R � 44°YZ � 6.78XZ � 7.36�Z � 50°
�C � 52.4° �B � 29.7° �A � 97.9°
�C � 53.5° �B � 36.5° AB � 29.7
4
3
1
2
�2
2��3
�3
2
�3
2
�2x sin x2 cos 1cos x2 22x sec2 x2 � 2 tan x sec2 x
1 � 2 cos x1cos x � 2 222x � 3 cos 3x
2�x2 � sin 3x
8 cos 2x 1sin 2x � 1 232 cos x � 15 sin 5x
y � 2e1x � 1 2 � e1cos x 2esin x13 ln 6 263x�8e3x13x � 1 21�20 2e5x�1
4 6
3x——–—–x2 – 4
y =
0
4
6
2
–4
–6
–2
y
x
2–2–4–6
2
y = 4x3 + 6x2 – 24x – 2
0
20
30
10
–10
y
x
1–1–2–3
1�3, 6�3 21��3, �6�3 2y � 4xx � ;1
Q0, �89R
x � ;3y � 0
x � 2.
dydx � �
21x � 2 2 2.�2 6 x 6 2x 7 2,x 6 �2,
x � ;2
dy
dx� 6x2 � 24,
x 6 �43
x 7 �43,
x � �43
dy
dx� 12x � 16,
x 7 2x 6 2,
x � 2
dy
dx� �10x � 20,
x � 4
101 629.5 cm3;140 � 2x
h � 27.5r � 6.8h � 8.6r � 4.3
14 062.5 m24.5 6 t � 80 � t 6 4.5t � 4.5
v1t 2 6 0v1t 2 7 0,
t � 3,t � 6a1t 2 � 18t � 81v1t 2 � 9t2 � 81t � 162,
12
e4
1 � e4 ,
9 13,
f – 1x 2 � 12x2 �20
x6
f ¿ 1x 2 � 4x3 �4
x5;
f – 1x 2 �3
�x5f ¿ 1x 2 � �
2
�x3;
f – 1x 2 � �12
x4f ¿ 1x 2 �
4
x3;
f – 1x 2 � 20x3 � 30xf ¿ 1x 2 � 5x4 � 15x2 � 1;
p¿ 1t 2 � 4t � 6
4x � 3y � 10 � 0� 32x � 612x � 1 22 45 3x2 � 12x � 1 23 4414x2 � 1 24184x2 � 80x � 9 213x � 2 24� 1x2 � 3 22120x4 � 5 24x1x2 � 3 2 14x5 � 5x � 1 2
61x � 3 223x2
�2x3 � 1
3x2 � 8x � 5
�1
x2
6x � 1
1
2�
1
9
1
12
4
3�
1
5
limxS2�
f 1x 2 � 3.limxS2�
f 1x 2 � 5,x � 2.f 1x 2limxS4
f 1x 2limxS4�
f 1x 2 � �q,
limxS4�
f 1x 2 �q,
limxS4�
f 1x 2 limxS4�
f 1x 2limxS4
f 1x 2>>
A n s w e r s 659NEL
Related Documents