NEL 312

Welcome message from author
This document is posted to help you gain knowledge. Please leave a comment to let me know what you think about it! Share it to your friends and learn new things together.
Transcript

NEL312

6Chapter
?
TrigonometricFunctions
FM radio stations and many otherwireless technologies (such as thesound portion of a television signal,cordless phones, and cell phones)transmit information using sinewaves. The equations that are usedto model these sine waves, however,do not use angles that are measuredin degrees. What is an alternativeway to measure angles, and howdoes this affect the graphs oftrigonometric functions?
GOALS
You will be able to
• Understand radian measure and itsrelationship to degree measure
• Use radian measure with trigonometricfunctions
• Make connections between trigonometricratios and the graphs of the primary andreciprocal trigonometric functions
• Pose, model, and solve problems thatinvolve trigonometric functions
• Solve problems that involve rates ofchange in trigonometric functions
NEL 313

NEL314 Getting Started
6 Getting Started
SKILLS AND CONCEPTS You Need• For help, see the Review of
Essential Skills found at theNelson Advanced Functionswebsite.
Study Aid
Question Appendix
1, 2, 3, 4 R-10
5 R-11
6, 7 R-12
45˚
45˚
60˚
30˚
1
1 2
1
2 3
1. For angle determinea) the size of the related acute angleb) the size of the principal angle
2. Point lies on the terminal arm of an angle in standardposition.a) Sketch the angle, and determine the values of the primary and
reciprocal ratios.b) Determine the measure of the principal angle, to the nearest
degree.
3. Draw each angle in standard position. Then, using the specialtriangles as required, determine the exact value of the trigonometricratio.a) c) e)b) d) f )
4. Determine the value(s) of if
a) c) e)
b) d) f )
5. For each of the following, state the period, amplitude, equation ofthe axis, and range of the function. Then sketch its graph.a) where b) where
6. State the period, equation of the axis, horizontal shift, and amplitudeof each function. Then sketch one cycle.
a) b)
7. Identify the transformation that is associated with each of theparameters ( and c) in the graphs defined by
and Discuss which graphical feature (period, amplitude, equation of theaxis, or horizontal shift) is associated with each parameter.
y 5 a cos (k(x 2 d )) 1 c.y 5 a sin (k(x 2 d )) 1 ca, k, d,
y 5 2sin a12
(x 2 60°)b 2 1y 5 2 sin (3(x 1 45°))
2360° # u # 360°.y 5 cos u,2360° # u # 360°.y 5 sin u,
sin u 5 1cos u 5 21tan u 51
"3
cot u 5 21tan u 5 1cos u 512
0°# u # 360°.u,
csc 270°cos 300°tan 180°
sec 135°sin 120°sin 60°
P(3, 24)
u, y
x
28�
�

APPLYING What You Know
Using a Sinusoidal Model
A Ferris wheel has a diameter of 20 m, and its axle is located 15 m abovethe ground. Once the riders are loaded, the Ferris wheel accelerates to asteady speed and rotates 10 times in 4 min. The height, h metres, of a riderabove the ground during a ride on this Ferris wheel can be modelled by asinusoidal function of the form where t isthe time in seconds.
The height of a rider begins to be tracked when the rider is level with theaxis of the Ferris wheel on the first rotation.
What does the graph of the rider‘s height versus time, for threecomplete revolutions, look like? What equation can be used todescribe this graph?
A. Determine the maximum and minimum heights of a rider above theground during the ride.
B. How many seconds does one complete revolution take? What part ofthe graph represents this?
C. On graph paper, sketch a graph of the rider’s height above the groundversus time for three revolutions of the Ferris wheel.
D. What type of curve does your graph resemble?
E. Is this function a periodic function? Explain.
F. What is the amplitude of this function?
G. What is the period of this function?
H. What is the equation of the axis of this function?
I. Assign appropriate values to each parameter in for this situation.
J. Write the equation of a sine function that describes the graph yousketched in part C.
h(t)
?
h(t) 5 a sin (k(t 2 d )) 1 c,
YOU WILL NEED
• graph paper
20 m
15 m
NEL 315Chapter 6
Getting Started

LEARN ABOUT the MathAngles are commonly measured in degrees. In mathematics and physics,however, there are many applications in which expressing the size of anangle as a pure number, without units, is more convenient than usingdegrees. In these applications, the size of an angle is expressed in terms ofthe length of an arc, a, that subtends the angle, , at the centre of a circlewith radius r. In this situation, a is proportional to r and also to , where
The unit of measure is the radian.
How are radians and degrees related to each other??
u 5ar.
uu
NEL316 6.1 Radian Measure
Radian Measure
ar
u
radian
the size of an angle that issubtended at the centre of acircle by an arc with a lengthequal to the radius of the circle;both the arc length and theradius are measured in units oflength (such as centimetres)and, as a result, the angle is areal number without any units
u 5ar
5rr
5 1
EXAMPLE 1 Connecting radians and degrees
How many degrees is 1 radian?
Solution
u 52pr
1
r1
5 2p radians
3608a = 2pr
r
a = r
r
u = 1
radi
an 1 radian is defined as the anglesubtended by an arc length, a, equal to the radius, r. It appears asthough 1 radian should be a littleless than since the sectorformed resembles an equilateraltriangle, with one side that is curved slightly.
60°,
Consider the arc length created byan angle of This arc length is
the circumference of the circle. 2pr,360°.
Using the relationship the size of the angle can be expressed in radians.
u 5ar ,
6.1
Use radian measurement to represent the size of an angle.
GOAL

NEL 317Chapter 6
The relationship can be used to convert betweendegrees and radians.
p radians 5 180°
a 1 a2
r1
r2
u
1 radian 5180°
p8 57.3°
p radiansp
5180°
p
p radians 5 180°
2p radians 5 360°
u 5 360°
6.1
is also , the size of the central anglewith an arc length of 2pr.
360°u
Equating the measures of gives anexpression relating degrees and radians.
Dividing both sides by 2 gives a simplerrelationship between degrees and radians.
u
Dividing both sides by gives the value of1 radian in degree measure.
p
It is important to note that the size of anangle in radians is not affected by the size ofthe circle. The diagram shows that and
subtend the same angle so u 5a
1r1
5a
2r2
.u,
a2a1
EXAMPLE 2 Reasoning how to convert degrees to radians
Convert each of the following angles to radians.a) b)
Solution
a)
8 0.35
5p
9
20° 5 (20°1
) ap
180°9
b
p
180°5 1
p radians 5 180°
225°20°
Divide both sides by to get anequivalent expression that is equal to 1.
180°
Multiplying by 1 creates an equivalent
expression, so multiply by to convert
degrees to radians.
p180°
Express the answer as an exact value in terms of or as an approximate decimalvalue, as required.
p
Simplify by dividing by the common factorof 20. Notice that the units cancel out.
Whenever an angle isexpressed without a unit (thatis, as a real number), it isunderstood to be in radians.We often write “radians” afterthe number, as a reminder thatwe are discussing an angle.
Communication Tip

NEL318
b)
55p
4
5225°p
180°4
45
45
225° 5 (225°) ap
180°b Multiply by to convert degrees to radians.p
180°
EXAMPLE 3 Reasoning how to convert radians to degrees
Convert each radian measure to degrees.
a) b) 1.75 radians
Solution
a)
b)
8 100.3°
180°
p radians1
1.75 radians 5 1.75 radians1
3
1 5180°
p radians
p radians 5 180°
5 150°
5 5(30°)
5p
65
5(180°)
6
p radians 5 180°
5p
6
Substitute for p.180°
Evaluate.
Divide both sides by radians to get an equivalent expression that is equal to 1.
p
Multiplying by 1 creates an equivalent
expression, so multiply by to
convert radians to degrees.
180°
p radians
Reflecting
A. Consider the formula Explain why angles can be described ashaving no unit when they are measured in radians.
B. Explain how to convert any angle measure that is given in degrees toradians.
C. Explain how to convert any angle measure that is given in radians todegrees.
u 5ar.
Simplify by dividing by the common factor of45. (Note that the degree symbols cancel.)
6.1 Radian Measure
NEL 319
6.1
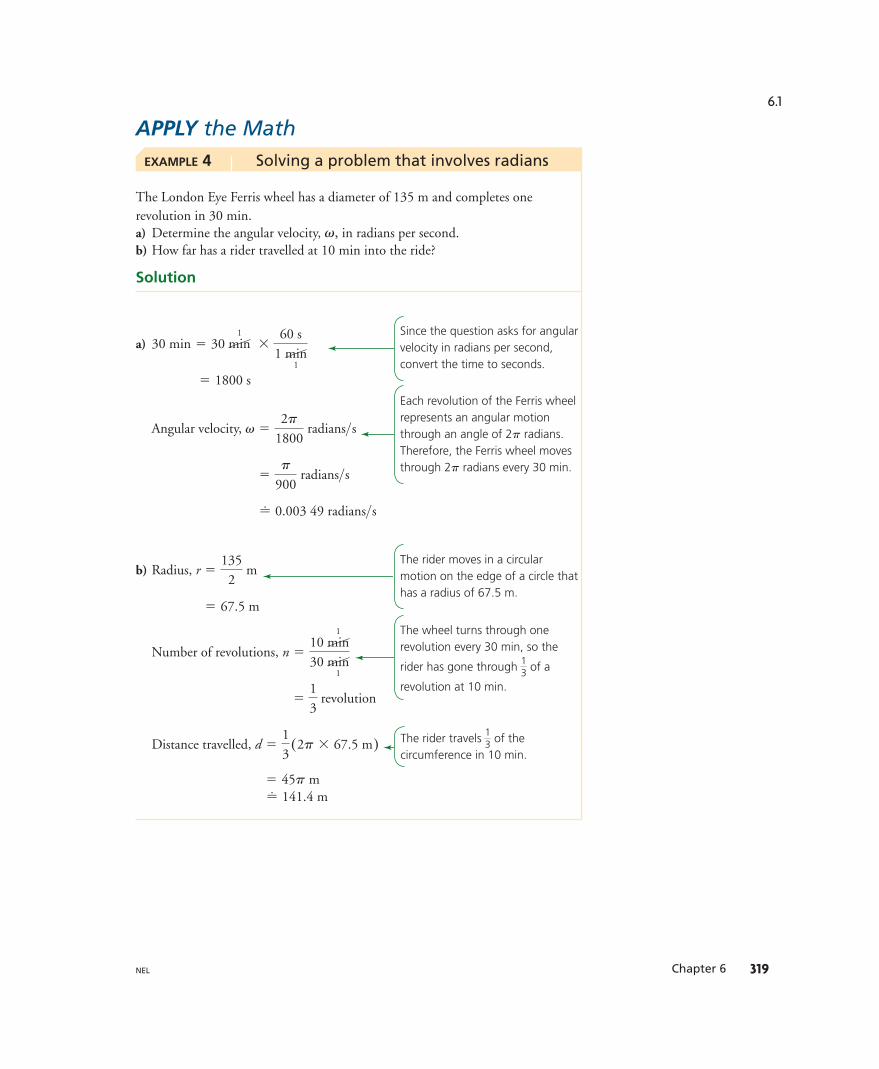
APPLY the MathEXAMPLE 4 Solving a problem that involves radians
The London Eye Ferris wheel has a diameter of 135 m and completes onerevolution in 30 min.a) Determine the angular velocity, in radians per second.b) How far has a rider travelled at 10 min into the ride?
Solution
a)
Angular velocity,
49 radians s
b) Radius,
Number of revolutions,
revolution
Distance travelled,
8 141.4 m5 45p m
d 513
(2p 3 67.5 m)
51
3
n 510 min
1
30 min1
5 67.5 m
r 5135
2 m
>8 0.003
5p
900 radians>s
v 52p
1800 radians>s
5 1800 s
30 min 5 30 min1
360 s
1 min1
v,
Each revolution of the Ferris wheelrepresents an angular motionthrough an angle of radians.Therefore, the Ferris wheel movesthrough radians every 30 min.2p
2p
Since the question asks for angularvelocity in radians per second,convert the time to seconds.
The rider moves in a circularmotion on the edge of a circle thathas a radius of 67.5 m.
The wheel turns through onerevolution every 30 min, so the
rider has gone through of a
revolution at 10 min.
13
The rider travels of thecircumference in 10 min.
13
Chapter 6

CHECK Your Understanding1. A point is rotated about a circle of radius 1. Its start and finish are
shown. State the rotation in radian measure and in degree measure.
NEL320
In Summary
Key Ideas• The radian is an alternative way to
represent the size of an angle. The arc length, a, of a circle is proportional to its radius, r, and the central angle that it subtends, by the
formula
• One radian is defined as the angle subtended by an arc that is the same
length as the radius. .
1 radian is about
Need to Know• Using radians enables you to express the size of an angle as a real number
without any units, often in terms of It is related to degree measure by thefollowing conversion factor:
• To convert from degree measure to radians, multiply by .
• To convert from radians to degrees, multiply by .180°
p
p180°
p radians 5 180°.p.
57.3°.
u 5ar
5rr
5 1
u 5ar.
u,
a)
b)
c)
d)
e)
f )
g)
h)
ar
u
a = r
r
u = 1
radi
an
Recall that counterclockwiserotation is represented usingpositive angles, whileclockwise rotation isrepresented using negativeangles.
Communication Tip
6.1 Radian Measure

NEL 321
2. Sketch each rotation about a circle of radius 1.
a) c) e) g)
b) d) f ) h)
3. Convert each angle from degrees to radians, in exact form.a) b) c) d)
4. Convert each angle from radians to degrees. Express the measurecorrect to two decimal places, if necessary.
a) b) c) 3 d)
PRACTISING5. a) Determine the measure of the central angle that is formed by an
arc length of 5 cm in a circle with a radius of 2.5 cm. Express themeasure in both radians and degrees, correct to one decimal place.
b) Determine the arc length of the circle in part a) if the central angleis
6. Determine the arc length of a circle with a radius of 8 cm ifa) the central angle is 3.5b) the central angle is
7. Convert to radian measure.a) c) e) g)b) d) f ) h)
8. Convert to degree measure.
a) c) e) g)
b) d) f ) h)
9. If a circle has a radius of 65 m, determine the arc length for each ofthe following central angles.
a) b) 1.25 c)
10. Given radians and , determine the size of and x .u
CE 5 4.5 cm/DCE 5p12
150°19p
20
29p
22
3p
22
3p
42
5p
3
11p
67p
6p
42p
3
2120°60°45°270°
240°2135°2180°90°
300°
200°.
11p
40.3p
5p
3
320°400°200°75°
2p
42p
4p
3p
3
2p
2
5p
3
2p
3p
6.1
A
K
Fx4 cm
8 cm4.5 cm
DE
CA
B
u
Chapter 6

NEL322
11. A wind turbine has three blades, each measuring 3 m from centre totip. At a particular time, the turbine is rotating four times a minute.a) Determine the angular velocity of the turbine in radians second.b) How far has the tip of a blade travelled after 5 min?
12. A wheel is rotating at an angular velocity of radians s, while apoint on the circumference of the wheel travels m in 10 s.a) How many revolutions does the wheel make in 1 min?b) What is the radius of the wheel?
13. Two pieces of mud are stuck to the spoke of a bicycle wheel. Piece A iscloser to the circumference of the tire, while piece B is closer to thecentre of the wheel.a) Is the angular velocity at which piece A is travelling greater than,
less than, or equal to the angular velocity at which piece B istravelling?
b) Is the velocity at which piece A is travelling greater than, less than,or equal to the velocity at which piece B is travelling?
c) If the angular velocity of the bicycle wheel increased, would thevelocity at which piece A is travelling as a percent of the velocity atwhich piece B is travelling increase, decrease, or stay the same?
14. In your notebook, sketch the diagram shown and label each angle, indegrees, for one revolution. Then express each of these angles in exactradian measure.
Extending
15. Circle A has a radius of 15 cm and a central angle of radians, circle
B has a radius of 17 cm and a central angle of radians, and circle C
has a radius of 14 cm and a central angle of radians. Put the circles
in order, from smallest to largest, based on the lengths of the arcs subtending the central angles.
16. The members of a high-school basketball team are driving fromCalgary to Vancouver, which is a distance of 675 km. Each tire ontheir van has a radius of 32 cm. If the team members drive at aconstant speed and cover the distance from Calgary to Vancouver in 6 h 45 min, what is the angular velocity, in radians second, of eachtire during the drive?
>
p5
p7
p6
9.6p>1.2p
>
T
90˚60˚
45˚
0˚, 360˚
30˚
C
6.1 Radian Measure

NELNEL 323
EXAMPLE 1 Connecting radians and the special triangles
6.2
LEARN ABOUT the MathRecall that the special triangles shown can be used to determine the exactvalues of the primary and reciprocal trigonometric ratios for some anglesmeasured in degrees.
Radian Measure and Angleson the Cartesian Plane
GOAL
C
45˚
45˚
60˚
30˚A
1
1
B
2
1Q P
R
2 3
How can these special triangles be used to determine the exactvalues of the trigonometric ratios for angles expressed inradians?
?
Use the Cartesian plane to evaluate the trigonometric ratios forangles between 0 and 2p.
Determine the radian measures of the angles in the special triangles, and calculate their primary trigonometric ratios.
Solution
5p
2 5
p
4
90 ° 5 90 °1 a p
180°2
b 45 ° 5 45 °1 a p
180 °4
b/P 5 /A 5 90 ° /B 5 /C 5 45 °
5p
6 5
p
3
30 ° 5 30 °1 a p
180 °6
b 60 ° 5 60 °1 a p
180 °3
b /R 5 30 ° /Q 5 60 °
is the special triangle. Multiplyeach angle by toconvert from degrees toradians.
p180°
30°, 60°, 90°^PQR
is the special triangle.
Multiply each angle byto convert from
degrees to radians.
p180°
90°
45°,45°,^ABC
A B
C
1
1
4p
4p
2
2
1Q P
R
3p
6p
3
Chapter 6

NEL324 NEL324 6.2 Radian Measure and Angles on the Cartesian Plane
tan p
65
1
"3 cot
p
65 "3
cos p
65
"32
sec p
65
2
"3
sin p
65
1
2 csc
p
65 2
tan p
45 1 cot
p
45 1
cos p
45
1
"2 sec
p
45 "2
sin p
45
1
"2 csc
p
45 "2
1.00
1.0
x
r =
4p
4p y = 1
x = 1
2P (1, 1)
tan p
35 "3 cot
p
35
1
"3
cos p
35
1
2 sec
p
35 2
sin p
35
"3
2 csc
p
35
2
"3
Draw each special angleon the Cartesian plane in standard position.Use the trigonometricdefinitions of angles onthe Cartesian plane todetermine the exact valueof each angle. Recall that
where andr . 0.
x2 1 y2 5 r2
tan u 5yx cot u 5
xy
cos u 5xr sec u 5
rx
sin u 5yr csc u 5
ry
y
x0
1.0
2.0 P(1 , )3
1.0
r = 2
x = 1
3p
6p
y = 3
y
x0
1.0
1.0 2.0
r = 2y = 13
p
6p
x = 3
P( , 1 )3
Reflecting
A. Compare the exact values of the trigonometric ratios in each specialtriangle when the angles are given in radians and when the angles aregiven in degrees.
B. Explain why the strategy that is used to determine the value of atrigonometric ratio for a given angle on the Cartesian plane is thesame when the angle is expressed in radians and when the angle isexpressed in degrees.

NEL 325
6.2
Chapter 6
Determine the exact value of each trigonometric ratio.
a) b) cot a3p
2bsin a
p
2b
Solution
a)
y
x0
1
1–1
–2
2
2–1–22p
P(0, 1 )
b)
511
5 1
sin ap
2b 5
yr
50
215 0
cot a3p
2b 5
xy
is one-quarter of a fullrevolution, and the point
lies on the unitcircle, as shown. Drawthe angle in standardposition with its terminalarm on the positive y-axis. From the drawing,
and r 5 1.x 5 0, y 5 1,
P(0, 1)
p2
is three-quarters of afull revolution, and thepoint lies onthe unit circle, as shown.Draw the angle instandard position with itsterminal arm on thenegative y-axis. From thedrawing, and r 5 1.
x 5 0, y 5 21
P(0, 21)
3p2
The relationships between the principal angle, its related acute angle, andthe trigonometric ratios for angles in standard position are the same whenthe angles are measured in radians and degrees.
y
x0
1
1–1
–2
2
2–1–2
3p2
P(0,–1 )
APPLY the Math
NEL 325
EXAMPLE 2 Selecting a strategy to determine the exactvalue of a trigonometric ratio

NEL326 NEL326
EXAMPLE 3 Selecting a strategy to determine the exactvalue of a trigonometric ratio
Determine the exact value of each trigonometric ratio.
a) b)
Solution A: Using the special angles
a)
csc a11p6 bcos a5p
4 b
Sketch the angle instandard position. is a
half of a revolution. is
halfway between and
and lies in the thirdquadrant with a related
angle of , or p4.5p4 2 p
3p2 ,
p
5p4
py
x5p4
b)
is in the
special triangle. Positionthis triangle so the rightangle lies on the negativex-axis.
Since lies onthe terminal arm,
and Therefore, the cosineratio has a negativevalue.
r 5 "2. y 5 21,x 5 21,
(21, 21)
1, 1, "2p4
cos a5p
4b 5
xr 5
21
"2
y
x5p4
p4
x = –1
y = –1
r = 2P(–1 , –1 )
y
x11p6
Sketch the angle instandard position. is
between and andlies in the fourth quadrantwith a related angle of
, or p6.2p 211p
6
2p,3p2
11p6
6.2 Radian Measure and Angles on the Cartesian Plane

NEL 327
6.2
NEL 327
y
xp6
11p6
y = –1r = 2
x = 3
P( , –1 )3
Solution B: Using a calculator
a)
is in the special triangle. Position itso that the right anglelies on the positive x-axis.Since the point lies on the terminal arm,
andTherefore, the csc
ratio has a negative value.r 5 2.
y 5 21,x 5 "3,
("3, 21)
1, "3, 2p6
b)
Set the calculator toradian mode. Enter theexpression.
The result is a decimal.
Entering confirms
that the answer isequivalent to this decimal.
21!2
cos a5p
4b 5
21
"2
csc a11p
6b 5 22
To put a graphing calculator in
radian mode, press the
key, scroll to Radian,
and press .ENTER
MODE
Tech Support
There is no csc key on thecalculator. Use the factthat cosecant is thereciprocal of sine.
52
215 22
csc a11p
6b 5
ry
Chapter 6

NEL328 NEL328
In the second quadrant, is about 2.86.u
p 2 0.28 8 2.86
If where evaluate to the nearest hundredth.
Solution
tan u 5 27
245
yx
u0 # u # 2p,tan u 5 27
24,
EXAMPLE 4 Solving a trigonometric equation thatinvolves radians
There are two possibilitiesto consider:
andx 5 224, y 5 7.x 5 24, y 5 27
x
y
u
P(24, –7)
For the ordered pairthe terminal
arm of the angle lies inthe fourth quadrant.3p2 , u , 2p
u
(24, 27),
In the fourth quadrant, is about 6.00.u
2p 2 0.28 8 6.00
Use a calculator todetermine the relatedacute angle by calculating
the inverse tan of .
The related angle is 0.28,rounded to two decimalplaces. Subtract 0.28from to determineone measure of u.
2p
724
x
y
P(–24, 7)
0
uFor the ordered pair
the terminalarm of lies in the second quadrant, andalso has a related angle of0.28. Subtract 0.28 from to determine the othermeasure of u.
p
p2 , u , p,
u
(224, 7),
6.2 Radian Measure and Angles on the Cartesian Plane

NEL 329
6.2
NEL 329
In Summary
Key Ideas• The angles in the special triangles can be expressed in radians, as well as in degrees. The radian measures can be used
to determine the exact values of the trigonometric ratios for multiples of these angles between 0 and • The strategies that are used to determine the values of the trigonometric ratios when an angle is expressed in degrees
on the Cartesian plane can also be used when the angle is expressed in radians.
2p.
Need to Know• The trigonometric ratios for any principal angle, in standard position can be determined by finding the related
acute angle, using coordinates of any point that lies on the terminal arm of the angle.
y
x
0
P(x, y)
b
ux
y r
b,u,
From the Pythagorean theorem, if
cot u 5xy
sec u 5rx
csc u 5ry
tan u 5yx
cos u 5xr
sin u 5yr
r . 0.r2 5 x2 1 y2,
The Special TrianglesThe Special Triangles on the Cartesian Plane
Using a Circle of Radius 1
3p
6p
2
1
3
1
1
p4
p4
2
y1
0
–1
1–1x
1 1
4p 4
p
2
12
y1
0
–1
1–1x
1
3p
6p
12
32
12
32
P ,
• The CAST rule is an easy way to remember which primary trigonometric ratios arepositive in which quadrant. Since r is always positive, the sign of each primaryratio depends on the signs of the coordinates of the point.• In quadrant 1, All (A) ratios are positive because both x and y are positive.• In quadrant 2, only Sine (S) is positive, since x is negative and y is positive.• In quadrant 3, only Tangent (T) is positive because both x and y are negative.• In quadrant 4, only Cosine (C) is positive, since x is positive and y is negative.
x0
y
A12
3 4
S
T C
Chapter 6

NEL330 NEL330
CHECK Your Understanding1. For each trigonometric ratio, use a sketch to determine in which
quadrant the terminal arm of the principal angle lies, the value ofthe related acute angle, and the sign of the ratio.
a) d)
b) e)
c) f )
2. Each of the following points lies on the terminal arm of an angle instandard position.
i) Sketch each angle.ii) Determine the value of r.
iii) Determine the primary trigonometric ratios for the angle.iv) Calculate the radian value of to the nearest hundredth, where
a) c)b) d)
3. Determine the primary trigonometric ratios for each angle.
a) c)
b) d)
4. State an equivalent expression in terms of the related acute angle.
a) c)
b) d)
PRACTISING5. Determine the exact value of each trigonometric ratio.
a) c) e)
b) d) f ) sec 5p
3sin
7p
4cos
5p
4
csc 5p
6tan
11p
6sin
2p
3
sec 7p
6cos
5p
3
cot a2p
4bsin
5p
6
2p
62p
7p
42
p
2
(0, 5)(212, 25)
(4, 23)(6, 8)
0 # u # 2p.u,
cot 7p
4tan
4p
3
cos 2p
3cos
5p
3
sec 5p
6sin
3p
4
K
6.2 Radian Measure and Angles on the Cartesian Plane

NEL 331NEL 331
6.2
6. For each of the following values of cos determine the radian valueof if
a) c) e) 0
b) d) f )
7. The terminal arm of an angle in standard position passes through eachof the following points. Find the radian value of the angle in theinterval , to the nearest hundredth.a) c) e)b) d) f )
8. State an equivalent expression in terms of the related acute angle.
a) c) e)
b) d) f )
9. A leaning flagpole, 5 m long, makes an obtuse angle with the ground.If the distance from the tip of the flagpole to the ground is 3.4 m,determine the radian measure of the obtuse angle, to the nearesthundredth.
10. The needle of a compass makes an angle of 4 radians with the linepointing east from the centre of the compass. The tip of the needle is4.2 cm below the line pointing west from the centre of the compass.How long is the needle, to the nearest hundredth of a centimetre?
11. A clock is showing the time as exactly 3:00 p.m. and 25 s. Because afull minute has not passed since 3:00, the hour hand is pointingdirectly at the 3 and the minute hand is pointing directly at the 12. Ifthe tip of the second hand is directly below the tip of the hour hand,and if the length of the second hand is 9 cm, what is the length of thehour hand?
12. If you are given an angle, that lies in the interval ,
how would you determine the values of the primary trigonometricratios for this angle?
13. You are given where a) In which quadrant(s) could the terminal arm of lie?b) Determine all the possible trigonometric ratios for c) State all the possible radian values of to the nearest hundredth.u,
u.u
0 # u # 2p.cos u 5 2513,
uP c p2 , 2p du,
sec 7p
4cot
2p
3tan
11p
6
sin 2p
6csc a2
p
3bcos
3p
4
(6, 21)(24, 22)(12, 2)
(9, 10)(3, 11)(27, 8)
30, 2p4
212"3
2
"3
2
2"2
22
1
2
p # u # 2p.uu,
A
T
C
Chapter 6

NEL332 NEL332
14. Use special triangles to show that the equation
is true.
15. Show that for
16. Determine the length of AB. Find the sine, cosine, and tangent ratiosof given
17. Given that x is an acute angle, draw a diagram of both angles (instandard position) in each of the following equalities. For each angle,indicate the related acute angle as well as the principal angle. Then,referring to your drawings, explain why each equality is true.a) c)b) d)
Extending
18. Find the sine of the angle formed by two rays that start at the origin ofthe Cartesian plane if one ray passes through the point and the other ray passes through the point Round youranswer to the nearest hundredth, if necessary.
19. Find the cosine of the angle formed by two rays that start at the originof the Cartesian plane if one ray passes through the point and the other ray passes through the point Round your answer to the nearest hundredth, if necessary.
20. Julie noticed that the ranges of the sine and cosine functions go fromto 1, inclusive. She then began to wonder about the reciprocals of
these functions—that is, the cosecant and secant functions. What doyou think the ranges of these functions are? Why?
21. The terminal arm of is in the fourth quadrant. If then calculate sin u cot u 2 cos2 u.
cot u 5 2!3,u
21
(27!3, 7).(6!2, 6!2)
(24, 4!3).(3!3, 3)
tan x 5 tan (p 1 x)sin x 5 2sin (2p 2 x)
cos x 5 2cos (p 2 x)sin x 5 sin (p 2 x)
AC 5 CD 5 8 cm./D,
11p6 .2 sin2 u 2 1 5 sin2 u 2 cos2 u
cos Q5p6 R 5 cos (2150°)
8 cm
8 cm
A
CB D
p6
6.2 Radian Measure and Angles on the Cartesian Plane

NEL 333
Use radians to graph the primary trigonometric functions.
NEL 333
Exploring Graphs of the PrimaryTrigonometric Functions
GOAL
EXPLORE the MathThe unit circle is a circle that is centred at the origin and has a radius of 1 unit. On the unit circle, the sine and cosine functions take a particularly simple form: and The value of is the y-coordinate of each point on the circle, and the value of is the x-coordinate. As a result, each point on the circle can be represented by theordered pair where is the angle formed betweenthe positive x-axis and the terminal arm of the angle that passes through
each point. For example, the point lies on the terminal arm
of the angle Evaluating each trigonometric expression using the special
triangles results in the ordered pair Repeating this process for other
angles between 0 and results in the following diagram:2p
Q!32 , 12R.
p6 .
Qcos p6 , sin p6 R
u(x, y) 5 (cos u, sin u),
cos usin ucos u 5
x1 5 x.sin u 5
y1 5 y
YOU WILL NEED
• graph paper• graphing calculator
u
1y
x
(x,y)
y
270˚
= 3p 2
90˚ =
p 2
60˚ =
p 3
30˚ = p6
45˚ = p 4
240˚
= 4p 322
5˚ = 5p
4210˚ = 7p
6
150˚ = 5p6
180˚ = p 0˚ = 0p = 2p
330˚ = 11p6
315˚ = 7p4
300˚ = 5p3
135˚ = 3p4
120˚ = 2p3
(–1, 0)
(0, 1)
(0, –1)
x
(x, y) = (cos u, sin u)
2 22U2U– ,
2 213U– ,
22U
22U,
12 2
3U,
2 23U 1,
12 2
3U,–
,2 2
13U– –
22U 2U–
2–,
21–
23U–, ,
21
23U–
3U2 2
1, –
(1, 0)
,2 2
2U2U –
What do the graphs of the primary trigonometric functions looklike when is expressed in radians?u
?
6.3
Chapter 6

NEL334 NEL334 6.3 Exploring Graphs of the Primary Trigonometric Functions
A. Copy the following table. Complete the table using a calculator andthe unit circle shown to approximate each value to two decimal places.
B. Plot the ordered pairs and sketch the graph of the functionOn the same pair of axes, plot the ordered pairs
and sketch the graph of the function
C. State the domain, range, amplitude, equation of the axis, and periodof each function.
D. Recall that Use the values from your table for part A to
calculate the value of tan Use a calculator to confirm your results, totwo decimal places.
E. What do you notice about the value of the tangent ratio whenWhat do you notice about its value when
F. Based on your observations in part E, what characteristics does thisimply for the graph of
G. What do you notice about the value of the tangent ratio when
and Why does this occur?67p4 ?u 5 6
p4 , 63p
4 , 65p4 ,
y 5 tan u?
sin u 5 0?cos u 5 0?
u.
tan u 5sin ucos u.
y 5 cos u.(u, cos u)y 5 sin u.
(u, sin u),
u7p6
5p4
4p3
3p2
5p3
7p4
11p6 2p
sin ucos u
u7p6
5p4
4p3
3p2
5p3
7p4
11p6 2p
sin u
cos u
u 0 p6
p4
p3
p2
2p3
3p4
5p6
p
sin u
cos u
u 0 p6
p4
p3
p2
2p3
3p4
5p6
p
sin ucos u

NEL 335
H. On a new pair of axes, plot the ordered pairs and sketch thegraph of the function where
I. Determine the domain, range, amplitude, equation of the axis, andperiod of this function, if possible.
Reflecting
J. The tangent function is directly related to the slope of the line segmentthat joins the origin to each point on the unit circle. Explain why.
K. Where are the vertical asymptotes for the tangent graph located whenand what are their equations? Explain why they are
found at these locations.
L. How does the period of the tangent function compare with the periodof the sine and cosine functions?
0 # u # 2p,
0 # u # 2p.y 5 tan u,(u, tan u)
In Summary
Key Idea
• The graphs of the primary trigonometric functions can be summarized as follows:
–5p2 –3p
2 – p2p2
3p2
5p2–3p
–2p 2p u
y = sin u y
1
–10
2p
3p–p p
Axis:
Maximum Minimum
R 5 5 yPR 021 # y # 16D 5 5uPR6
value 5 21 value 5 1
Amplitude 5 1y 5 0
Period 5 2p
Key points when 0 # u # 2p
u y 5 sin (u)
0 0p2 1
p 03p2 21
2p 0
(continued)
–5p2 –3p
2 – p2p2
3p2
5p2–3p
–2p 2p u
y = cos u y
1
–10
2p
3p–p p
Axis:
Maximum Minimum
R 5 5 yPR 021 # y # 16D 5 5uPR6
value 5 21 value 5 1
Amplitude 5 1y 5 0
Period 5 2p
Key points when 0 # u # 2p
u y 5 cos (u)
0 1p2 0
p 213p2
0
2p 1
NEL 335
6.3
Chapter 6

NEL336 NEL336
Axis: Amplitude: undefinedNo maximum or minimum valuesVertical asymptotes:
R 5 5 yPR6
63p
2, 6
5p
2, c f
D 5 e uPR ` u 2 6p
2,
u 5 6p
2, 6
3p
2, 6
5p
2, c
y 5 0Period 5 p
Key points:• y-• -
62p, cintercepts 5 0, 6 p,u
intercept 5 0
y
u
0
3
1
2
–2
–3
–1
y = tan u
0 p2
p 2p 5p2
3p2–p2
–p–2p–3p2–5p
2
p
FURTHER Your Understanding1. a) Examine the graphs of and . Create a table to
compare their similarities and differences.b) Repeat part a) using the graphs of and .
2. a) Use a graphing calculator, in radian mode, to create the graphs ofthe trigonometric functions and on theinterval To do this, enter the functions
and in the equation editor, and use thewindow settings shown.
b) Determine the values of where the functions intersect.c) The equation can be used to represent the
general term of any arithmetic sequence, where a is the first termand d is the common difference. Use this equation to find anexpression that describes the location of each of the followingvalues for where and is in radians.
i) -interceptsii) maximum values
iii) minimum values
3. Find an expression that describes the location of each of the followingvalues for where and is in radians.a) -intercepts b) maximum values c) minimum values
4. Graph using a graphing calculator in radian mode. Compareyour graph with the graph of
5. Find an expression that describes the location of each of the followingvalues for where and is in radians.a) -intercepts b) vertical asymptotesu
unPIy 5 tan u,
y 5 tan u.y 5
sin ucos u
uunPIy 5 cos u,
uunPIy 5 sin u,
tn 5 a 1 (n 2 1)du
Y 2 5 cos uY 1 5 sin u22p # u # 2p.
y 5 cos uy 5 sin u
y 5 tan uy 5 sin u
y 5 cos uy 5 sin u
6.3 Exploring Graphs of the Primary Trigonometric Functions

NEL 337NEL 337
LEARN ABOUT the MathThe following transformations are applied to the graph of where
• a vertical stretch by a factor of 3• a horizontal compression by a factor of • a horizontal translation to the left• a vertical translation 1 down
What is the equation of the transformed function, and whatdoes its graph look like?
?
p6
12
0 # x # 2p:y 5 sin x,
6.4YOU WILL NEED
• graph paper• graphing calculator
GOAL
Use transformations to sketch the graphs of the primarytrigonometric functions in radians.
Transformations ofTrigonometric Functions
EXAMPLE 1 Selecting a strategy to apply transformations and graph a sine function
Use the transformations above to sketch the graph of the transformed function inthe interval
Solution A: Applying the transformation to the key points ofthe parent function
is the parent function.y 5 sin x
0 # x # 2p.
x y 5 sin (x)
0 0
p
21
p 0
3p
221
2p 0
is the
equation of the transformed function.
y 5 3 sin Q2Qx 1p6 RR 2 1
One cycle of the parent function canbe described with five key points. Byapplying the relevant transformationsto these points, a complete cycle ofthe transformed function can begraphed.
Recall that, in the general functioneach
parameter is associated with a specific transformation. In this case,
(vertical stretch)
(horizontal compression)
(translation left)(translation down)c 5 21
d 5 2p6
k 5112
5 2
a 5 3
y 5 af(k(x 2 d)) 1 c,
Chapter 6

NEL338 NEL338 6.4 Transformations of Trigonometric Functions
Stretched/Compressed
Function,y 5 3 sin (2x)
Final Transformed Function,
a2ax 1p
6bb 2 1y 5 3 sin
(0, 0) a0 2p
6, 0 2 1b 5 a2
p
6, 21b
ap
4, 3b a
p
42
p
6, 3 2 1b 5 a
p
12, 2b
ap
2, 0b 2
p
6, 0 2 1b 5 a
p
3, 21ba
p
2
a3p
4, 23b 2
p
6, 23 2 1b 5 a
7p
12, 24ba
3p
4
(p, 0) ap 2p
6, 0 2 1b 5 a
5p
6, 21b
Each x-coordinate of the key points on theprevious function nowhas subtracted fromit, and each y-coordinatehas 1 subtracted from it.
These five pointsrepresent one completecycle of the graph. To extend the graph to
copy this cycle byadding the period of to each x-coordinate inthe table of thetransformed key points.
p
2p,
p6
(x, y) S a12x, 3yb
Parent Function, y 5 sin x
Stretched/Compressed Function, y 5 3 sin (2x)
(0, 0) (0), 3(0)b 5 (0, 0)a12
ap
2, 1b a
p
2b, 3(1)b 5 a
p
4, 3ba
12
(p, 0) a12
(p), 3(0)b 5 ap
2, 0b
a3p
2, 21b a
3p
2b, 3(21)b 5 a
3p
4, 23ba
12
(2p, 0) a12
(2p), 3(0)b 5 (p, 0)
a12
x, 3yb S a12
x 2p
6, 3y 2 1b
y
0
2
–2
–4
4
x
2pp 3p2
p2
y = sin (x)
y = 3 sin (2x)
The parameters k and daffect the x-coordinates ofeach point on the parentfunction, and theparameters a and c affectthe y-coordinates. All stretches/compressionsand reflections must beapplied before anytranslations. In this example,each x-coordinate of the fivekey points is multiplied by and each y-coordinate ismultiplied by 3.
12,
Plot the key points ofthe parent function andthe key points of thetransformed function,and draw smooth curves through them.Extend the red curve for one more cycle.

NEL 339
y
0
2
–2
–4
4
x
p 2p
y = 3 sin (2x)
y = sin (x)
y = 3 sin 2(x + ) – 16p ]
]
Note that the vertical stretch and translation cause corresponding changes in therange of the parent function. The range of the parent function is and the range of the transformed function is 24 # y # 2.
21 # y # 1,
Solution B: Using the features of the transformed function
is the
equation of the transformed function.It has the following characteristics:
Equation of the axis: y 5 21
Period 52p2 5 p
Amplitude 5 3
y 5 3 sin a2ax 1p
6bb 2 1 Recall that each parameter in the
general functionis
associated with a specifictransformation. For thetransformations applied to
(vertical stretch)
(horizontalcompression)
(translation left)
(translation down)c 5 21
d 5 2p
6
k 5112
5 2
a 5 3f(x) 5 sin x,
y 5 af(k(x 2 d)) 1 c
Plot the key points of the finaltransformed function, and drawa smooth curve through them.
Sketch the graph of by plotting its axis, points on its axis, and maximum and minimum values.
y
0
2
– 2
– 4
4 y = 3 sin (2x) –1
y = –1 p
x2p
y 5 3 sin (2x) 2 1 Since the axis is and theamplitude is 3, the graph has amaximum at 2 and a minimumat Since this is a sinefunction with a period of themaximum occurs at and
the minimum occurs at The graph has points on the axiswhen and
Since the given domain isadd the period
to each point that was plottedfor the first cycle and draw asmooth curve.
p0 # u # 2p,
x 5 p.x 5 0, x 5p2,
x 53p4 .
x 5p4 ,p,
24.
y 5 21
NEL 339Chapter 6
6.4

NEL340
is the function
translated to the left.
Reflecting
A. What transformations affect each of the following characteristics of asinusoidal function?i) period ii) amplitude iii) equation of the axis
B. In both solutions, it was necessary to extend the graphs after the finaltransformed points were plotted. Explain how this was done.
C. Which strategy for graphing sinusoidal functions do you prefer?Explain why.
y = 3 sin (2x+ ) – 1 6py
0
2
– 2
– 4
4
p
x2p
p6y 5 3 sin (2x) 2 1
y 5 3 sin a2ax 1p6 bb 2 1
NEL340
A mass on a spring is pulled toward the floor and released, causing it to move upand down. Its height, in centimetres, above the floor after t seconds is given by the function Sketch a graph ofheight versus time. Then use your graph to predict when the mass will be 18 cm above the floor as it travels in an upward direction.
Solution
For this function, the amplitude is 10 and the period is 1. The equation of the axis is The function undergoes a horizontal translation 0.75 to the left.
h 5 15.
h(t) 5 10 sin (2p(t 1 0.75)) 1 15
h(t) 5 10 sin (2pt 1 1.5p) 1 15
h(t) 5 10 sin (2pt 1 1.5p) 1 15, 0 # t # 3.
APPLY the Math
EXAMPLE 2 Using the graph of a sinusoidal function tosolve a problem
Apply the horizontal translationto the previous graph by shiftingthe maximum and minimumpoints and the points on the axis
to the left.p6
argument
the expression on which afunction operates; in Example 2,sin is the function and itoperates on the expression
so isthe argument
2pt 1 1.5p2pt 1 1.5p;
6.4 Transformations of Trigonometric Functions
Determine the characteristicsthat define the graph of thisfunction. To do so, divide outthe common factor from theargument. Then determine thevalues of the parameters and c.
so the period is
c 5 15d 5 20.75
2p2p
5 1k 5 2p,a 5 10
a, k, d,

NEL 341
Sketch the graph of over one cycle using the axis, amplitude, and period.
The spring is on its way up on the parts of the graph where the height is increasing.
On its way up, the spring is at a height of 18 cm at about 0.3 s, 1.3 s, and 2.3 s.
If you are given a graph of a sinusoidal function, then characteristics of itsgraph can be used to determine the equation of the function.
Time (s)
Hei
ght
(cm
)
0
5
10
15
20
25
t
h(t)h(t) = 10 sin (2p(t + 0.75)) + 15
h(t) = 18
1.0 1.5 2.0 2.5 3.00.5
Time (s)
Hei
ght
(cm
)
0
5
10
15
20
25
h(t) = 10 sin (2p(t + 0.75)) + 15
1.0 1.5 2.0 2.50.5
h(t)
t
Time (s)
Hei
ght
(cm
)
0
5
10
15
20
25 h(t) = 10 sin (2pt) + 15 h(t)
t
1.0 1.5 2.0 2.50.5
h(t) 5 10 sin (2pt) 1 15Since the axis is andthe amplitude is 10, the graphwill have a maximum at 25 anda minimum at 5. Since this is asine function with a period of 1,these points will occur at
and The graph has points
on the axis when
and
Since the given domain isadd the period 1 to
each point that was plotted forthe first cycle. Repeat using thepoints on the second cycle to get three complete cycles. Thendraw a smooth curve.
0 # t # 3,
t 5 1.
t 5 0, t 512,
t 534.
t 514
h(t) 5 15
Apply the horizontal translationto the previous graph by shifting the maximum andminimum points and the pointson the axis 0.75 to the left.
Use the graph to estimate whenthe spring will be 18 cm abovethe floor on the intervals
and32.0, 2.54.
30, 0.54, 31.0, 1.54,tP
Chapter 6NEL 341
6.4

NEL342
The following graph shows the temperature in Nellie’s dorm room over a 24 h period.
Determine the equation of this sinusoidal function.
Solution
Use the graph to determine the values of the parameters a, k, d, and c, and write the equation.
The axis is
so
The equation is T(t) 5 6 cos a p
12(t 2 17)b 1 19.
d 5 17
k 5p
12
24k 5 2p
24 52p
kPeriod 5
2p
k,
a 525 2 13
25 6
c 513 1 25
25 19.
Time (h)
t
T
Tem
pera
ture
(°C
)
0
5
10
15
20
25
10 15 20 255
NEL342
EXAMPLE 3 Connecting the features of the graph of a sinusoidal function to its equation
The graph resembles the cosine function, so itsequation is of the form y 5 a cos (k(x 2 d)) 1 c.
The value of c indicates the horizontal axis of thefunction. The horizontal axis is the mean of themaximum and minimum values.
The value of a indicates the amplitude of thefunction. The amplitude is half the differencebetween the maximum and minimum values.
The value of k is related to the period of thefunction.
If you assume that this cycle repeats itself overseveral days, then the period is 1 day, or 24 h.
Let us use a cosine function. The parent functionhas a maximum value at
This graph has a maximum value at Therefore, we translate the function 17 units to the right.
t 5 17.
t 5 0.
6.4 Transformations of Trigonometric Functions

NEL 343
In Summary
Key Idea• The graphs of functions of the form and are transformations
of the parent functions and respectively.
To sketch these functions, you can use a variety of strategies. Two of these strategies are given below:1. Begin with the key points in one cycle of the parent function and apply any stretches compressions and reflections to
these points: Take each of the new points, and apply any translations:
To graph more cycles, as required by the given domain, add multiples of the period to the x-coordinates of thesetransformed points and draw a smooth curve.
2. Using the given equation, determine the equation of the axis, amplitude, and period of the function. Use thisinformation to determine the location of the maximum and minimum points and the points that lie on the axis for one cycle. Plot these points, and then apply the horizontal translation to these points. To graph more cycles, as required by the domain, add multiples of the period to the x-coordinates of these points and draw a smooth curve.
Need to Know• The parameters in the equations and give useful information
about transformations and characteristics of the function.
• If the independent variable has a coefficient other than , the argument must be factored to separate the values of k and c. For example,
should be changed to .y 5 3 cos a2ax 1p
2bby 5 3 cos (2x 1 p)
11
f(x) 5 a cos (k(x 2 d)) 1 cf(x) 5 a sin (k(x 2 d)) 1 c
axk, ayb S a
xk 1 d, ay 1 cb.(x, y) S axk , ayb.
>
y 5 cos (x),y 5 sin (x)
f(x) 5 a cos (k(x 2 d)) 1 cf(x) 5 a sin (k(x 2 d)) 1 c
Transformations of the Parent Function Characteristics of the Transformed Function
gives the vertical stretch compression factor. If there is also a reflection in the x-axis.
a , 0,>0 a 0 gives the amplitude.0 a 0
gives the horizontal stretch/compression factor.
If there is also a reflection in the y-axis.k , 0,
`1k ` gives the period.2p
0 k 0
d gives the horizontal translation. d gives the horizontal translation.
c gives the vertical translation. gives the equation of the axis.y 5 c
CHECK Your Understanding1. State the period, amplitude, horizontal translation, and equation of
the axis for each of the following trigonometric functions.
a) c)
b) d) y 5 5 cos a22x 1p
3b 2 2y 5 sin ax 2
p
4b 1 3
y 5 2 sin (3x) 2 1y 5 0.5 cos (4x)
Chapter 6NEL 343
6.4

NEL344
x 0p2 p 3p
2 2p
y 0 18 0 218 0
x 0 2p 4p 6p 8p
y 23 1 23 1 23
x 0 3p 6p 9p 12p
y 4 9 4 9 4
x 0 p 2p 3p 4p
y 22 4 22 28 22
NEL344
K
2. Suppose the trigonometric functions in question 1 are graphed using agraphing calculator in radian mode and the window settings shown.Which functions produce a graph that is not cut off on the top orbottom and that displays at least one cycle?
3. Identify the key characteristics of andsketch its graph. Check your graph with a graphing calculator.
PRACTISING4. The following trigonometric functions have the parent function
They have undergone no horizontal translations and noreflections in either axis. Determine the equation of each function.a) The graph of this trigonometric function has a period of and
an amplitude of 25. The equation of the axis is b) The graph of this trigonometric function has a period of 10 and
an amplitude of The equation of the axis is
c) The graph of this trigonometric function has a period of and
an amplitude of 80. The equation of the axis is
d) The graph of this trigonometric function has a period of and an amplitude of 11. The equation of the axis is
5. State the period, amplitude, and equation of the axis of thetrigonometric function that produces each of the following tables of values. Then use this information to write the equation of thefunction.
a)
b)
c)
d)
y 5 0.
12
y 5 29
10.
6p
y 51
15.25.
y 5 24.p
f (x) 5 sin x.
y 5 22 cos (4x 1 p) 1 4,
6.4 Transformations of Trigonometric Functions

NEL 345
6. State the transformations that were applied to the parent functionto obtain each of the following transformed functions.
Then graph the transformed functions.a) c)
b) d)
7. The trigonometric function has undergone the followingsets of transformations. For each set of transformations, determine theequation of the resulting function and sketch its graph.a) vertical compression by a factor of vertical translation 3 units upb) horizontal stretch by a factor of 2, reflection in the y-axisc) vertical stretch by a factor of 3, horizontal translation to the
rightd) horizontal compression by a factor of horizontal translation to
the left
8. Sketch each graph for Verify your sketch using graphingtechnology.
a) d)
b) e)
c) f )
9. Each person’s blood pressure is different, but there is a range of bloodpressure values that is considered healthy. The function
models the blood pressure, p, in
millimetres of mercury, at time t, in seconds, of a person at rest.a) What is the period of the function? What does the period
represent for an individual?b) How many times does this person’s heart beat each minute?c) Sketch the graph of d) What is the range of the function? Explain the meaning of the
range in terms of a person’s blood pressure.
10. A pendulum swings back and forth 10 times in 8 s. It swings througha total horizontal distance of 40 cm. a) Sketch a graph of this motion for two cycles, beginning with the
pendulum at the end of its swing.b) Describe the transformations necessary to transform into
the function you graphed in part a).c) Write the equation that models this situation.
y 5 sin x
y 5 P(t) for 0 # t # 6.
P(t) 5 220 cos 5p3 t 1 100
y 51
2 cos a
x2
2p
12b 2 3y 5 22 sin a2ax 1
p
4bb 1 2
y 5 0.5 sin ax4
2p
16b 2 5y 5 5 cos ax 1
p
4b 2 2
y 5 2cos a0.5x 2p
6b 1 3y 5 3 sin a2ax 2
p
6bb 1 1
0 # x # 2p.
p2
12,
p2
12,
f (x) 5 cos x
f (x) 5 sin a4x 12p
3bf (x) 5 2sin a1
4xb
f (x) 5 sin (x 2 p) 2 1f (x) 5 4 sin x 1 3
f (x) 5 sin x
A
Chapter 6NEL 345
6.4

NEL346 NEL346
11. A rung on a hamster wheel, with a radius of 25 cm, is travelling at aconstant speed. It makes one complete revolution in 3 s. The axle ofthe hamster wheel is 27 cm above the ground.a) Sketch a graph of the height of the rung above the ground during
two complete revolutions, beginning when the rung is closest tothe ground.
b) Describe the transformations necessary to transform into the function you graphed in part a).
c) Write the equation that models this situation.
12. The graph of a sinusoidal function has been horizontally compressedand horizontally translated to the left. It has maximums at the points
and and it has a minimum at
If the x-axis is in radians, what is the period of the function?
13. The graph of a sinusoidal function has been vertically stretched, verticallytranslated up, and horizontally translated to the right. The graph has a
maximum at and the equation of the axis is If
the x-axis is in radians, list one point where the graph has a minimum.
14. Determine a sinusodial equation for each of the following graphs.
y 5 9.Qp13, 13R,
Q24p
7 , 21R.Q23p
7 , 1R,Q25p
7 , 1R
y 5 cos x
T
a) b) c)
20 40 60
2
4
–2
–4
80
x0
yy
0
2
–2
–4
4
x
82 4 6
y
0
0.5
–0.5
–1.0
1.0
x
0.25 0.500.75
15. Create a flow chart that summarises how you would use transformations
to sketch the graph of
Extending
16. The graph shows the distance from a light pole to a car racing around acircular track. The track is located north of the light pole.a) Determine the distance from the light pole to the edge of the track.b) Determine the distance from the light pole to the centre of the track.c) Determine the radius of the track.d) Detemine the time that the car takes to complete one lap of the track.e) Determine the speed of the car in metres per second.
f (x) 5 22 sin Q0.5Qx 2p4RR 1 3.
C
Time (s)
Dis
tanc
e (c
ar t
o po
le)
0
100
200
300
400
500
600
700
40 60 80 10020
6.4 Transformations of Trigonometric Functions

NEL 347
3 Chapter Review
NEL
3 Chapter Review
NEL 347
• See Lesson 6.1, Examples 1,2, and 3.
• Try Mid-Chapter ReviewQuestions 1, 2, and 3.
Study Aid
• See Lesson 6.2, Example 3.• Try Mid-Chapter Review
Questions 4 and 6.
Study Aid
FREQUENTLY ASKED QuestionsQ: How are radians and degrees related?
A: Radians are determined by the relationship where isthe angle subtended by arc length a in a circle with radius r. One revolution creates an angle of , or radians. Since
radians, it follows that radians. Thisrelationship can be used to convert between the two measures.
• To convert from degrees to radians, multiply by .
• To convert from radians to degrees, either substitute for or
multiply by .
Here are three examples:
Q: How do you determine exact values of trigonometricratios for multiples of special angles expressed inradians?
A: An angle on the Cartesian plane is determined by rotating theterminal arm in either a clockwise or counterclockwise direction. Thespecial triangles can be used to determine the coordinates of a pointthat lies on the terminal arm of the angle. Then, using the trigonometric definitions and the related angle, the exact values of the trigonometric ratios can be evaluated for multiples of angles
and
For example, to determine the exact value of sec , sketch the angle
in standard position. Determine the related angle. Since the terminal
arm of lies in the third quadrant, the related angle is . 5p4 2 p 5
p4
5p4
5p4
p6 .
p3 , p4 ,
x, y, r
8 171.887°5 225°55p
12
3 radians 53(180°)
p
5p
45
5(180°)
475° 5 75° 3
p
180°
180°
p
p180°
p180°
180° 5 p360° 5 2p2p360°
uu 5ar,
y
x5p4
6 Mid-Chapter Review
Chapter 6

NEL348 NELNEL348 Mid-Chapter Review
Sketch the special triangle by drawing a vertical line fromthe point on the terminal arm to the negative - axis. Use the values of , , and and the appropriate ratio to determine the value.
sec
Q: How can transformations be used to graph sinusoidalfunctions?
A: The graphs of functions of the form and are transformations of the parentfunctions and respectively.
In sinusoidal functions, the parameters a, k, d, and c give thetransformations to be applied, as well as the key characteristics of the graph.
• gives the vertical stretch/compression factor and the amplitudeof the function.
• determines the horizontal stretch/compression factor, and
gives the period of the function.
• When a is negative, the function is reflected in the x-axis. When k is negative, the function is reflected in the y-axis.
• d gives the horizontal translation.
• c gives the vertical translation, and gives the equation of the horizontal axis of the function.
To sketch these functions, begin with the key points of the parentfunction. Apply any stretches/compressions and reflections first, andthen follow them with any translations.
Alternatively, use the equation of the axis, amplitude, and period to sketch a graph of the form or
Then apply the horizontal translation to the points of this graph, if necessary.f (x) 5 a cos (x) 1 c.
f (x) 5 a sin (x) 1 c
y 5 c
`2p
k ``1k `
0 a 0
y 5 cos (x),y 5 sin (x)
f (x) 5 a cos (k(x 2 d )) 1 cf (x) 5 a sin (k(x 2 d )) 1 c
5 2"2
5"221
5p
45
rx
ryxx(21, 21)
1, 1, "2y
x5p4
p4
x = –1
y = –1
r = 2P(–1 , –1 )
• See Lesson 6.4, Example 3.• Try Mid-Chapter Review
Questions 8 and 9.
Study Aid
NEL 349NEL
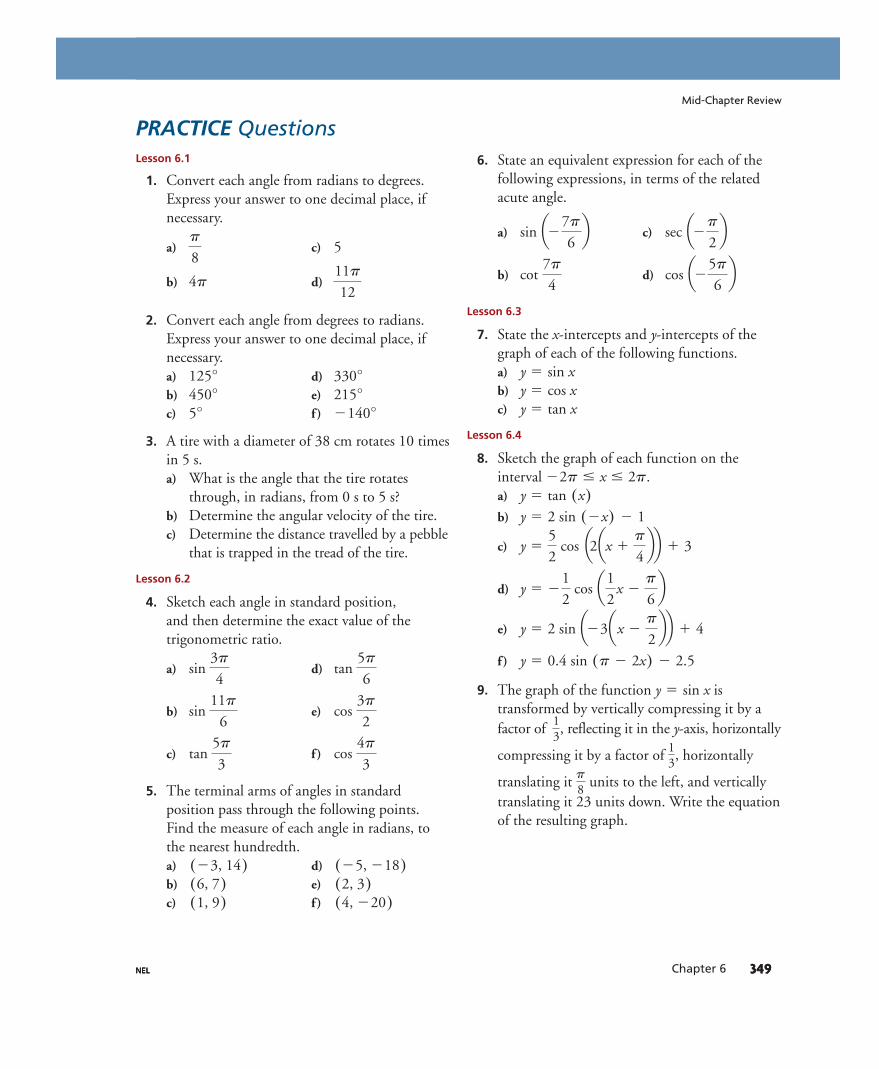
Lesson 6.1
1. Convert each angle from radians to degrees.Express your answer to one decimal place, ifnecessary.
a) c) 5
b) d)
2. Convert each angle from degrees to radians.Express your answer to one decimal place, ifnecessary.a) d)b) e)c) f )
3. A tire with a diameter of 38 cm rotates 10 timesin 5 s.a) What is the angle that the tire rotates
through, in radians, from 0 s to 5 s?b) Determine the angular velocity of the tire.c) Determine the distance travelled by a pebble
that is trapped in the tread of the tire.
Lesson 6.2
4. Sketch each angle in standard position, and then determine the exact value of thetrigonometric ratio.
a) d)
b) e)
c) f )
5. The terminal arms of angles in standardposition pass through the following points. Find the measure of each angle in radians, tothe nearest hundredth.a) d)b) e)c) f )
6. State an equivalent expression for each of thefollowing expressions, in terms of the relatedacute angle.
a) c)
b) d)
Lesson 6.3
7. State the x-intercepts and y-intercepts of thegraph of each of the following functions.a)b)c)
Lesson 6.4
8. Sketch the graph of each function on theinterval a)
b)
c)
d)
e)
f )
9. The graph of the function istransformed by vertically compressing it by afactor of reflecting it in the y-axis, horizontally
compressing it by a factor of horizontally
translating it units to the left, and verticallytranslating it 23 units down. Write the equationof the resulting graph.
p8
13,
13,
y 5 sin x
y 5 0.4 sin (p 2 2x) 2 2.5
y 5 2 sin a23ax 2p
2bb 1 4
y 5 21
2 cos a1
2x 2
p
6b
y 552
cos a2ax 1p
4bb 1 3
y 5 2 sin (2x) 2 1y 5 tan (x)
22p # x # 2p.
y 5 tan xy 5 cos xy 5 sin x
cos a25p
6bcot
7p
4
sec a2p
2bsin a27p
6b
(4, 220)(1, 9)
(2, 3)(6, 7)
(25, 218)(23, 14)
cos 4p
3tan
5p
3
cos 3p
2sin
11p
6
tan 5p
6sin
3p
4
2140°5°
215°450°
330°125°
11p
124p
p
8
NEL 349Chapter 6
Mid-Chapter Review
PRACTICE Questions

NEL350
Graph the reciprocal trigonometric functions and determine theirkey characteristics.
NEL350 6.5 Exploring Graphs of the Reciprocal Trigonometric Functions
6.5 Exploring Graphs of theReciprocal TrigonometricFunctions
GOAL
EXPLORE the MathRecall that the characteristics of the graph of a reciprocal function of alinear or quadratic function are directly related to the characteristics of theoriginal function. Therefore, the key characteristics of the graph of a linearor quadratic function can be used to graph the related reciprocal function.The same strategies can be used to graph the reciprocal of a trigonometricfunction.
What do the graphs of the reciprocal trigonometric functionsand look like, and what are their
key characteristics?
A. Here is the graph of
Use this graph to predict where each of the following characteristics of
the graph of will occur.
a) vertical asymptotesb) maximum and minimum values c) positive and negative intervalsd) intervals of increase and decreasee) points of intersection for and
B. Use your predictions in part A to sketch the graph of (that
is, ). Verify your sketch by entering into Y1 and
into Y2 of a graphing calculator, using the window settings
shown. Compare the period and amplitude of each function.
y 51
sin x
y 5 sin xy 5 csc x
y 51
sin x
y 51
sin xy 5 sin x
y 51
sin x
–2p–
3p2
3p2– p2
p2
x
y = sin x y
1
–10
2p
2pp–p
y 5 sin x.
y 5 cot xy 5 csc x, y 5 sec x,?
YOU WILL NEED
• graph paper• graphing calculator

NEL 351NEL 351Chapter 6
C. Predict what will happen if the period of changes from
to Change Y1 to and Y2 to and discussthe results.
D. Here is the graph of
Repeat parts A to C using the cosine function and its reciprocal
(that is,
E. Here is the graph of Recall that
Repeat parts A to C using this form of the tangent function and its
reciprocal (that is, ).
Reflecting
F. Do the primary trigonometric functions and their reciprocal functionshave the same kind of relationship that linear and quadratic functionsand their reciprocal functions have? Explain.
G. Which x-values of the reciprocal function, in the intervalresult in vertical asymptotes? Why does this
happen?
H. What is the relationship between the positive and negative intervals of the primary trigonometric functions and the positive and negativeintervals of their reciprocal functions?
I. Where do the points of intersection occur for the primary trigonometricfunctions and their reciprocal functions?
22p # x # 2p,
y 5 cot xy 5cos xsin x
y
x0
3
1
2
–2
–3
–1
y = tan x
0 p2
p 2p3p2–p2
–p–2p–3p2
p
tan x 5sin xcos x.y 5 tan x.
y 5 sec x).y 51
cos x
–3p2 – p2
p2
3p2
–2p 2p
x
y = cos x y
1
–10
2p
–p p
y 5 cos x.
y 51
sin (2x)y 5 sin (2x)p.
2py 5 sin x
6.5

NEL352 NEL352
In Summary
Key Idea• Each of the primary trigonometric graphs has a corresponding reciprocal function.
Cosecant Secant Cotangent
Need to Know• The graph of a reciprocal trigonometric function is related to the graph of its corresponding primary trigonometric
function in the following ways:• The graph of the reciprocal function has a vertical asymptote at each zero of the corresponding primary
trigonometric function.• The reciprocal function has the same positive/negative intervals as the corresponding primary trigonometric function.• Intervals of increase on the primary trigonometric function are intervals of decrease on the corresponding reciprocal
function. Intervals of decrease on the primary trigonometric function are intervals of increase on the correspondingreciprocal function.
• The ranges of the primary trigonometric functions include 1 and so a reciprocal function intersects itscorresponding primary function at points where the y-coordinate is 1 or
• If the primary trigonometric function has a local minimum point, the corresponding reciprocal function has a localmaximum point at the same value. If the primary trigonometric function has a local maximum point, thecorresponding reciprocal function has a local minimum point at the same value.u
u
21.21,
y 51
tan u5
cos usin u
y 51
cos uy 5
1sin u
y 5 cot uy 5 sec uy 5 csc u
y
u
0
3
1
2
–1
–3
–2
p 2p–p–2p
y = csc (u)
y = sin (x)y = sin (u)
Cosecant Secant Cotangent
• has vertical asymptotes at the points where
• has the same period as
• has the domain
• has the range 5 yPR 0 0 y 0 $ 16
5xPR 0 u 2 np, nPI6
y 5 sin u(2p)
sin u 5 0• has vertical asymptotes at
the points where • has the same period
as • has the domain
• has the range 5 yPR 0 0 y 0 $ 165xPR 0u 2 (2n 2 1)
p2, nPI6
y 5 cos u(2p)
cos u 5 0• has vertical asymptotes at the points
where • has zeros at the points where
has asymptotes• has the same period as • has the domain • has the range 5 yPR6
5xPR 0 u 2 np, nPI6y 5 tan u(p)
y 5 tan utan u 5 0
y
u
0
3
1
2
–1
–3
–2
p 2p–p–2p
y = sec (u)
y = cos (u)
y
u
0
3
1
2
–2
–3
–1
y = tan (u)
0 p 2p–p–2p
y = cot (u)
6.5 Exploring Graphs of the Reciprocal Trigonometric Functions

NEL 353
FURTHER Your Understanding1. The equation can be used to represent the
general term of any arithmetic sequence, where a is the first term andd is the common difference. Use this equation to find an expressionthat describes the location of each of the following values for
where and x is in radians.a) vertical asymptotesb) maximum valuesc) minimum values
2. Find an expression that describes the location of each of the followingvalues for where and x is in radians.a) vertical asymptotesb) maximum valuesc) minimum values
3. Find an expression that describes the location of each of the followingvalues for where and x is in radians.a) vertical asymptotesb) x-intercepts
4. Use graphing technology to graph and For whichvalues of the independent variable do the graphs intersect? Comparethese values with the intersections of and Explain.
5. The graphs of the functions and are congruent,
related by a translation of where Does this
relationship hold for and Verify your conjectureusing graphing technology.
6. Two successive transformations can be applied to the graph ofto obtain the graph of There is more than one
way to apply these transformations, however. Describe one of thesecompound transformations.
7. Use transformations to sketch the graph of each function. Then statethe period of the function.
a)
b)
c)d) y 5 csc (0.5x 1 p)
y 5 sec x 2 1
y 5 csc a2ax 1p
2bb
y 5 cot a x2b
y 5 cot x.y 5 tan x
y 5 sec x ?y 5 csc x
sin Qx 1p2R 5 cos x.p
2
y 5 cos xy 5 sin x
y 5 cos x.y 5 sin x
y 5 sec x.y 5 csc x
nPIy 5 cot x,
nPIy 5 sec x,
nPIy 5 csc x,
tn 5 a 1 (n 2 1) d
Chapter 6NEL 353
6.5

NEL354
EXAMPLE 1 Modelling the problem using a sinusoidal equation
LEARN ABOUT the MathThe tides at Cape Capstan, New Brunswick, change the depth of the waterin the harbour. On one day in October, the tides have a high point ofapproximately 10 m at 2 p.m. and a low point of approximately 1.2 m at8:15 p.m. A particular sailboat has a draft of 2 m. This means it can onlymove in water that is at least 2 m deep. The captain of the sailboat plans toexit the harbour at 6:30 p.m.
Can the captain exit the harbour safely in the sailboat at 6 p.m.??
NEL354 6.6 Modelling with Trigonometric Functions
6.6 Modelling with TrigonometricFunctions
YOU WILL NEED
• graphing calculator orgraphing software
GOAL
Model and solve problems that involve trigonometric functionsand radian measurement.
Create a sinusoidal function to model the problem, and use it to determine whether the sailboat can exit the harboursafely at 6 p.m.
Solution
a 5 4.4
a 510 2 1.2
2
H(t) 5 a cos (k(t 2 d)) 1 c
0
2468
10h(t)
t
2 pm 4 pm 6 pm 8 pm14:00 16:00 18:00 20:00
2m
3 pm 9 pm7 pm5 pm15:00 17:00 19:00 21:00
A sinusoidal function can be used to modelthe height of the water versus time. Draw asketch to get an idea of when the captainneeds to leave. It appears that the captain willhave enough depth at 6:30 p.m., but youcannot be sure from a rough sketch.
Choose the cosine function to model theproblem, since the graph starts at a maximumvalue. The amplitude, period, horizontaltranslation, and equation of the axis need to be determined.
Use the maximum and minimummeasurements of the tides to calculate theamplitude of the function. This gives thevalue of a in the equation.

NEL 355NEL 355
6.6
Chapter 6
A function that models the tides at Cape Capstan is
Since the depth of the water is greater than 2 m at 6:30 p.m., the sailboat can safely exit the harbour.
8 2.80 m
5 4.4 cos a18p
25b 1 5.6
H(18) 5 4.4 cos a4p
25(6.5 2 2)b 1 5.6
H(t) 5 4.4 cos a4p
25(t 2 2)b 1 5.6.
c 5 5.6
c 510 1 1.2
2
k 52p
12.55
4p
25
12.5k 5 2p
12.5 52p
k
Period 52p
k In a sinusoidal function, the horizontaldistance between the maximum andminimum points represents half of one cycle.
Since a maximum tide and a minimum tideoccur 6 h 15 min apart, the period must be12.5 h. The period can be used to determinethe value of k in the equation.
The parent cosine function starts at amaximum point.If we let represent noon, then ourfunction needs a maximum at (or 2 p.m.).We use a horizontal translation right 2 units.Therefore .d 5 2
t 5 2t 5 0
To verify the solution, enter the function inthe equation editor as Y1.Use the value operation to confirm a hightide at 2 p.m. and a low tide at 8:15 p.m. (t 5 8.25).
(t 5 2)
Use the value operation to determine thedepth of the water at 6:30 p.m. (t 5 6.5).
To determine the water level at 6:30 p.m.,let t 5 6.5.
The equation of the axis is the mean of themaximum and minimum points. This can be used to determine the value of c in theequation.

NEL356 NEL356
Reflecting
A. What characteristics of your model would change if you used a sinefunction to model the problem?
B. What role did the maximum value play in determining the requiredhorizontal translation?
C. If was set at 2 p.m. instead of noon, how would the equationchange? Would this make a difference to your final answer?
t 5 0
APPLY the Math
EXAMPLE 2 Representing a situation described by data using a sinusoidal equation
The following table shows the average monthly means of the daily (24 h) temperatures in Hamilton, Ontario. Eachmonth’s average temperature is represented by the day in the middle of the month.
a) Plot the temperature data for Hamilton, and fit a sinusoidal curve to the points.b) Estimate the average daily temperature in Hamilton on the 200th day of the year.
Solution A: Using the data and reasoning about the characteristics of the graph
a)
Plot the data, and sketch a smooth curvethrough the points.
The curve appears to be sinusoidal, so useas the model for
this situation.y 5 a sin (k(t 2 d)) 1 c5
10
15
Tem
pera
ture
(°C
)
Day of year
0
–5
25
20
100 200 300 400
Hamilton AverageTemperature
t
T(t)
6.6 Modelling with Trigonometric Functions
Month Jan. Feb. Mar. Apr. May June July Aug. Sep. Oct. Nov. Dec.
Day ofYear
15 45 75 106 136 167 197 228 259 289 320 350
8C 24.8 24.8 20.2 6.6 12.7 18.6 21.9 20.7 16.4 10.5 3.6 22.3

NEL 357
so
b)
This model predicts that the average daily temperature in Hamilton on the 200th day of the year is about
Since sinusoidal functions are periodic, they can be used (whereappropriate) to make educated predictions.
21.8 °C.
8 21.8 °C
T(200) 5 13.35 sin a 2p
365(200 2 116)b 1 8.55
T(t) 5 13.35 sin a 2p
365(t 2 116)b 1 8.55
T(t) 5 13.35 sin a2p
365(t 2 116)b 1 8.55
k 52p
365
k 52p
periodPeriod 5
2p
k,
c 5 8.55
c 521.9 1 (24.8)
2
c 5maximum 1 minimum
2
a 5 13.35
a 521.9 2 (24.8)
2
a 5maximum 2 minimum
2Estimate the maximum and minimumtemperatures for the year from the graph.Use these temperatures to calculate thevalues of a and c. The value of a gives theamplitude. The sine function has beenstretched vertically by a factor of 13.35.
The value of c gives the horizontal axis. The sinefunction has been vertically translated by8.55 units on the Temperature axis. Lightly drawa horizontal line through your graph at this value.
The value of k in the equation is determinedby the period. Assume that the cycle repeatsitself every year .(365 days)
To determine the value of d, estimate wherethe horizontal axis first intersects the curve.
Since this graph appears to have beentranslated to the right, d 8 116.
Verify the result by entering the data into L1and L2 in a graphing calculator and creating ascatter plot. Enter the sine function into Y1and observe that it matches the data.
Replace the parameters in the general sineequation.
Let and evaluate the sine function.t 5 200,
Chapter 6NEL 357
6.6
5
10
15
Tem
pera
ture
(°C
)
Day of year
0
–5
25
20
100 200 300 400
Hamilton AverageTemperature
t
T(t)

NEL358 NEL358
The population size, O, of owls (predators) in a certain region can be modelled
by the function where t represents the time in
months and represents January. The population size, m, of mice (prey) in
the same region is given by the function
a) Sketch the graphs of these functions.b) Compare the graphs, and discuss the relationships between the two populations.c) How does the mice-to-owls ratio change over time?d) When is there the most food per owl? When is it safest for the mice?
Solution
a) Graph the prey function.
Graph the predator function.
0
900
800
1000
1100
1200
Owl Population
10 20 30 40Time (months)
Ow
l pop
ulat
ion
t
O(t)
0
16000
14000
18000
20000
22000
24000
26000 m(t)Mouse Population
10 20 30 40Time (months)
Mou
se p
opul
atio
n
t
m(t) 5 20 000 1 4000 cos Qpt12R.
t 5 0
O(t) 5 1000 1 100 sin Qpt12R,
EXAMPLE 3 Analyzing a situation that involves sinusoidal models
The mouse population has a maximumof 24 000 and a minimum of 16 000.
The amplitude of the curve is 4000.
The axis is the line
so the period
period
period
The period is 24 months.
5 2p 312p
5 24
52pp
12
52pk k 5
p12,
m(t) 5 20 000.c 5 20 000
a 5 4000
m(t) 5 4000 cos apt12b 1 20 000.
The owl population has a maximum of1100 and a minimum of 900.
The amplitude of the curve is 100.
The axis is the line
as above, so this period is also
24 months.
k 5p
12
O(t) 5 1000.c 5 1000
a 5 100
O(t) 5 100 sin apt12b 1 1000.
6.6 Modelling with Trigonometric Functions

NEL 359
b)
c) The following table shows the ratio of mice to owls at key points in the first four years.
0
900
800
1000
1100
1200
10 20 30 40Time (months)
Ow
l pop
ulat
ion
0
16000
14000
18000
20000
22000
24000
26000
Mouse Population
10 20 30 40
Mou
se p
opul
atio
n
Owl Population
Time (months)
t
m(t)
t
O(t)
The graphs can be compared,since the same scale was used onboth horizontal axes. As the owlpopulation begins to increase, the mouse population begins todecrease. The mouse populationcontinues to decrease, and thishas an impact on the owlpopulation, since its food supplydwindles. The owl populationpeaks and then also starts todecrease. The mouse populationreaches a minimum and begins to rise as there are fewer owls to eat the mice. As the mousepopulation increases, foodbecomes more plentiful for theowls. So their population beginsto rise again. Since both graphshave the same period, thispattern repeats every 24 months.
Time Mice OwlsMice-to-Owl
Ratio
0 24 000 1000 24
6 20 000 1100 18.2
12 16 000 1000 16
18 20 000 900 22.2
24 24 000 1000 24
There seems to be a pattern.Enter the mouse function intoY1 of the equation editor of agraphing calculator, and enterthe owl function into Y2. Turnoff each function, and enter
The resulting graph is shown.The ratio of mice to owls is also sinusoidal.
Y3 5 Y1>Y2.
Chapter 6NEL 359
6.6

NEL360 NEL360
CHECK Your Understanding1. A cosine curve has an amplitude of 3 units and a period of radians.
The equation of the axis is and a horizontal shift of radians
to the left has been applied. Write the equation of this function.
2. Determine the value of the function in question 1 if
and
3. Sketch a graph of the function in question 1. Use your graph toestimate the x-value(s) in the domain where toone decimal place.
PRACTISING4. The height of a patch on a bicycle tire above the ground, as a function
of time, is modelled by one sinusoidal function. The height of thepatch above the ground, as a function of the total distance it hastravelled, is modelled by another sinusoidal function. Which of thefollowing characteristics do the two sinusoidal functions share:amplitude, period, equation of the axis?
y 5 2.5,0 , x , 2,
11p6 .
3p4 ,x 5
p2 ,
p4y 5 2,
3p
In Summary
Key Ideas• The graphs of and can model periodic phenomena when
they are transformed to fit a given situation. The transformed functions are ofthe form and where
• is the amplitude and
• is the number of cycles in radians, when the • d gives the horizontal translation• c is the vertical translation and is the horizontal axis
Need to Know• Tables of values, graphs, and equations of sinusoidal functions can be used as
mathematical models when solving problems. Determining the equation of theappropriate sine or cosine function from the data or graph provided is the mostefficient strategy, however, since accurate calculations can be made using theequation.
y 5 c
period 52pk2p0 k 0
a 5max 2 min
20 a 0
y 5 a cos (k(x 2 d)) 1 c ,y 5 a sin (k(x 2 d)) 1 c
y 5 cos xy 5 sin x
d) The most food per owl occurs when the ratio of mice to owls is the highest(there are more mice per owl).
The safest time for the mice occurs at the same time, when the ratio of mice to owls is the highest (there are fewer owls per mouse).
This occurs near the end of the 21st month of the two-year cycle.
6.6 Modelling with Trigonometric Functions

NEL 361
5. Mike is waving a sparkler in a circular motion at a constant speed. The tip of the sparkler is moving in a plane that is perpendicular tothe ground. The height of the tip of the sparkler above the ground, as a function of time, can be modelled by a sinusoidal function. At the sparkler is at its highest point above the ground.a) What does the amplitude of the sinusoidal function represent in
this situation?b) What does the period of the sinusoidal function represent in this
situation?c) What does the equation of the axis of the sinusoidal function
represent in this situation?d) If no horizontal translations are required to model this situation,
should a sine or cosine function be used?
6. To test the resistance of a new product to temperature changes, theproduct is placed in a controlled environment. The temperature inthis environment, as a function of time, can be described by a sinefunction. The maximum temperature is the minimumtemperature is and the temperature at is It takes 12 h for the temperature to change from the maximum to theminimum. If the temperature is initially increasing, what is theequation of the sine function that describes the temperature in thisenvironment?
7. A person who was listening to a siren reported that the frequency ofthe sound fluctuated with time, measured in seconds. The minimumfrequency that the person heard was 500 Hz, and the maximumfrequency was 1000 Hz. The maximum frequency occurred at
and . The person also reported that, in 15, she heard the maximum frequency 6 times (including the times at and
). What is the equation of the cosine function that describesthe frequency of this siren?
8. A contestant on a game show spins a wheel that is located on a plane perpendicular to the floor. He grabs the only red peg on thecircumference of the wheel, which is 1.5 m above the floor, and pushesit downward. The red peg reaches a minimum height of 0.25 m abovethe floor and a maximum height of 2.75 m above the floor. Sketch twocycles of the graph that represents the height of the red peg above thefloor, as a function of the total distance it moved. Then determine the equation of the sine function that describes the graph.
t 5 15t 5 0
t 5 15t 5 0
30 °C.t 5 0260 °C,120 °C,
t 5 0,
K
A
Chapter 6NEL 361
6.6

NEL362 NEL362
9. At one time, Maple Leaf Village (which no longer exists) had NorthAmerica’s largest Ferris wheel. The Ferris wheel had a diameter of 56 m, and one revolution took 2.5 min to complete. Riders could see Niagara Falls if they were higher than 50 m above the ground.Sketch three cycles of a graph that represents the height of a riderabove the ground, as a function of time, if the rider gets on at a heightof 0.5 m at Then determine the time intervals when therider could see Niagara Falls.
10. The number of hours of daylight in Vancouver can be modelled by asinusoidal function of time, in days. The longest day of the year isJune 21, with 15.7 h of daylight. The shortest day of the year isDecember 21, with 8.3 h of daylight.a) Find an equation for the number of hours of daylight on the
nth day of the year.b) Use your equation to predict the number of hours of daylight in
Vancouver on January 30th.
11. The city of Thunder Bay, Ontario, has average monthly temperaturesthat vary between and The following table gives theaverage monthly temperatures, averaged over many years. Determine theequation of the sine function that describes the data, and use yourequation to determine the times that the temperature is below
12. A nail is stuck in the tire of a car. If a student wanted to graph a sinefunction to model the height of the nail above the ground during a tripfrom Kingston, Ontario, to Hamilton, Ontario, should the studentgraph the distance of the nail above the ground as a function of time oras a function of the total distance travelled by the nail? Explain yourreasoning.
Extending
13. A clock is hanging on a wall, with the centre of the clock 3 m abovethe floor. Both the minute hand and the second hand are 15 cm long.The hour hand is 8 cm long. For each hand, determine the equationof the cosine function that describes the distance of the tip of thehand above the floor as a function of time. Assume that the time, t, isin minutes and that the distance, is in centimetres. Also assumethat is midnight.t 5 0
D(t),
0 °C.
17.6 °C.214.8 °C
n(t),
t 5 0 min.
T
C
Month Jan. Feb. Mar. Apr. May June July Aug. Sep. Oct. Nov. Dec.
AverageTemperature (°C) 214.8 212.7 25.9 2.5 8.7 13.9 17.6 16.5 11.2 5.6 22.7 211.1
6.6 Modelling with Trigonometric Functions
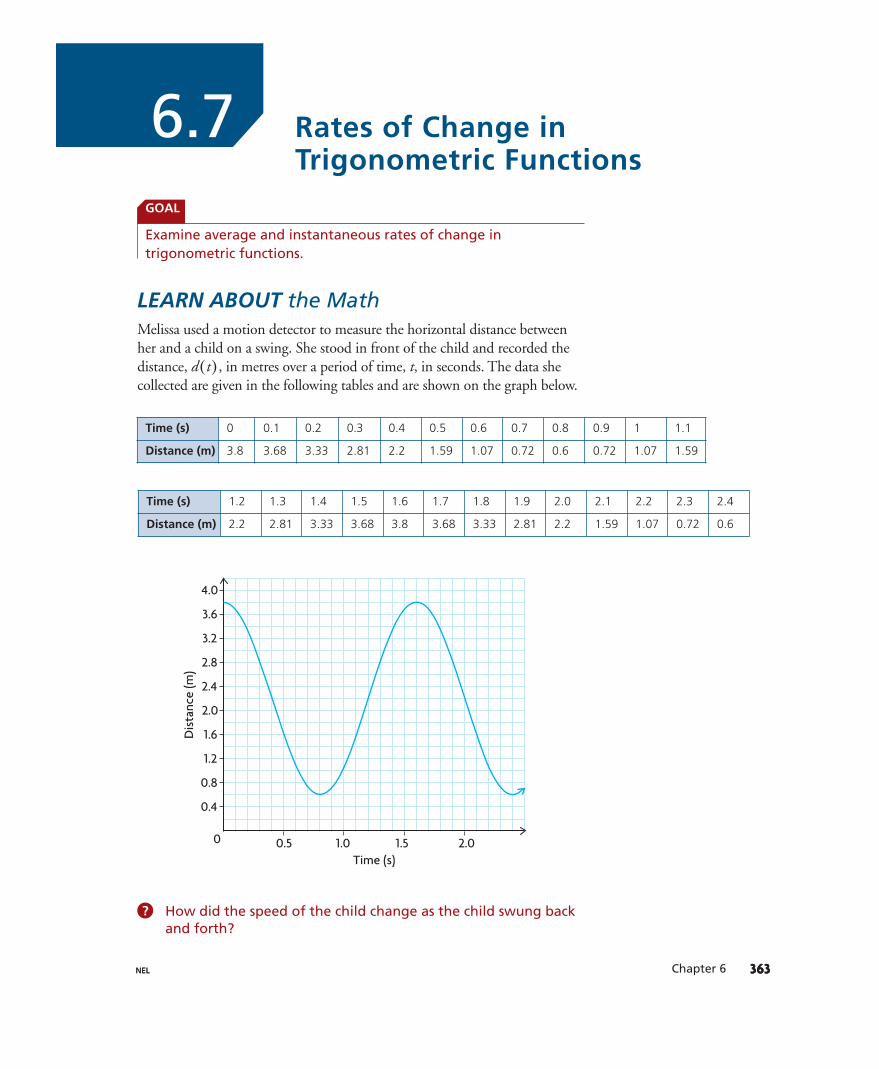
NEL 363NEL 363Chapter 6
LEARN ABOUT the MathMelissa used a motion detector to measure the horizontal distance betweenher and a child on a swing. She stood in front of the child and recorded thedistance, in metres over a period of time, t, in seconds. The data shecollected are given in the following tables and are shown on the graph below.
d(t),
Rates of Change inTrigonometric Functions
How did the speed of the child change as the child swung backand forth?
?
GOAL
Examine average and instantaneous rates of change intrigonometric functions.
Time (s) 0 0.1 0.2 0.3 0.4 0.5 0.6 0.7 0.8 0.9 1 1.1
Distance (m) 3.8 3.68 3.33 2.81 2.2 1.59 1.07 0.72 0.6 0.72 1.07 1.59
Time (s) 1.2 1.3 1.4 1.5 1.6 1.7 1.8 1.9 2.0 2.1 2.2 2.3 2.4
Distance (m) 2.2 2.81 3.33 3.68 3.8 3.68 3.33 2.81 2.2 1.59 1.07 0.72 0.6
0
0.4
0.8
1.2
1.6
2.0
2.4
2.8
3.2
3.6
4.0
0.5 1.0 1.5 2.0
Dis
tanc
e (m
)
Time (s)
6.7

NEL364 NEL364 6.7 Rates of Change in Trigonometric Functions
EXAMPLE 1 Using the data and the graph to analyze the situation
Use the data and the graph to discuss how the speed of the child changed as the child swung back and forth.
Solution
Analyze the motion.
Melissa began recording the motion when the child was thefarthest distance from the motion detector, which was 3.8 m. The child’s closest distance to the motion detector was 0.6 m and occurred at 0.8 s. The child was moving toward the motion detector between 0 s and 0.8 s and away from the motion detector between 0.8 s and 1.6 s.
Analyze the instantaneous velocity by drawing tangent linesat various points over one swing cycle.
Between 0 s and about 0.4 s, the child’s speed was increasing.
1.5
2.0
2.5
Dis
tanc
e (m
)
0
Time (s)1 2 3
1.0
0.5
3.5
3.0
Looking at the graph, the maximum value was3.8 and occurred at 0 s and 1.6 s. It took 1.6 sfor the child to swing one complete cycle.
Looking at the data and the graph, thedistances between the child and the motiondetector were decreasing between 0 s and 0.8 s,and increasing between 0.8 s and 1.6 s. Thispattern repeated itself every multiple of 1.6 s.
The slope of a tangent line on any distanceversus time graph gives the instantaneousvelocity, which is the instantaneous rate ofchange in distance with respect to time.
When the child was at the farthest point andclosest point from the motion detector, theinstantaneous velocity was 0.
On this interval, the tangent lines becomesteeper as time increases.
This
means the magnitudes of the slopes are
increasing. The tangent lines have negative
slopes, which means the distance between
the child and the motion detector continues
to decrease.
Speed 5 0 velocity 0 5 `Ddistance
Dtime` .
1.5
2.0
2.5
Dis
tanc
e (m
)
0
Time (s)1 2 3
1.0
0.5
3.5
3.0

NEL 365
On this interval, the tangent lines are gettingless steep as time increases. This means themagnitudes of the slopes are decreasing. Thetangent lines still have positive slopes, whichmeans the distance between the child and themotion detector is still increasing. The child isslowing down as the swing approaches thepoint where there is a change in direction fromaway from the detector to toward thedetector.
Between 0.4 s and about 0.8 s, the child’s speed was decreasing.
Between 0.8 s and about 1.2 s, the child’s speed was increasing.
Between 1.2 s and about 1.6 s, the child’s speed was decreasing.
1.5
2.0
2.5
Dis
tanc
e (m
)
0
Time (s)1 2 3
1.0
0.5
3.5
3.0
1.5
2.0
2.5
Dis
tanc
e (m
)
0
Time (s)1 2 3
1.0
0.5
3.5
3.0
1.5
2.0
2.5
Dis
tanc
e (m
)
0
Time (s)1 2 3
1.0
0.5
3.5
3.0
On this interval, the tangent lines are gettingless steep as time increases. This means themagnitudes of the slopes are decreasing. Thetangent lines still have negative slopes, whichmeans the distance between the child and themotion detector is still decreasing. The child isslowing down as the swing approaches thepoint where a change in direction occurs. Theslopes indicate a change in the child‘s positionfrom toward the detector to away from thedetector.
On this interval, the tangent lines are gettingsteeper as time increases. This means themagnitudes of the slopes are increasing. Thetangent lines have positive slopes, whichmeans the distance between the child and themotion detector is increasing. Therefore, themotion is away from the detector.
NEL 365Chapter 6
6.7

NEL366 NEL366
EXAMPLE 2 Using the slopes of secant lines to calculate average rate of change
Calculate the child’s average speed over the intervals of time as the child swung toward and away from the motiondetector on the first swing.
Solution
The child’s average speed was the same in both directions as the child swung back and forth.
1.5
2.0
2.5
01 2 3
1.0
0.5
3.5
3.0
Dis
tanc
e (m
)
Time (s)
The absolute value of the slope of a secantline on any distance versus time graph givesthe average rate of change in distance, withrespect to time or average speed.
The secant line that is decreasing has anegative slope, indicating that the distancebetween the child and the motion detectorwas decreasing between 0 s and 0.8 s.
The secant line that is increasing has apositive slope, indicating that the distancebetween the child and the motion detectorwas increasing between 0.8 s and 1.6 s.
Interval D DistanceD Time
Average Speed (m s)>
0 # t # 0.8 `0.6 2 3.80.8 2 0
` 024 0 5 4
0.8 # t # 1.6 `3.8 2 0.61.6 2 0.8
` 0 4 0 5 4
Use the data in the table and the relationship
to calculate the average speed.`D distance
D time`
Reflecting
A. Explain how the data in the table indicates the direction in which thechild swung.
B. Explain how the sign of the slope of each tangent line indicates thedirection in which the child swung.
C. How can you tell, from the graph, when the speed of the child was 0 m s?
D. If someone began to push the child after 2.4 s, describe what effectthis would have on the distance versus time graph.
APPLY the Math
>
6.7 Rates of Change in Trigonometric Functions

NEL 367
EXAMPLE 3 Using the difference quotient to estimate instantaneous rates of change
To model the motion of the child on the swing, Melissa determined that she could use the equation
where is the distance from the child to the motion detector, in metres,
and t is the time, in seconds. Use this equation to estimate when the child was moving the fastest and what speed the child was moving at this time.
Solution
The child must have been moving the fastest at around 0.4 s. Drawing a tangent line at supports this, since the tangent line appears to be steepest here.
Estimate the coordinates of two points on the tangent line to estimate its slope.Use and
The child was moving at about 6 m s.
Let
The child’s fastest speed was about 6.3 m s.>
8 026.28 0 or 6.28
8 `2.19372 2 2.2
0.001`
5 †S1.6 cos Q
p0.8(0.401)R 1 2.2T 2 S1.6 cos Q
p0.8(0.4)R 1 2.2T
0.001†
5 `d(0.401) 2 d(0.4)
0.001`
Speed 5 `d(0.4 1 0.001) 2 d(0.4)
0.001`
h 5 0.001.
Speed 5 `d(0.4 1 h) 2 d(0.4)
h`
>
Slope 50.5 2 3.50.7 2 0.2
5 26
(0.7, 0.5).(0.2, 3.5)
1.5
2.0
2.5
01 2 3
1.0
0.5
3.5
3.0
Dis
tanc
e (m
)
Time (s)
t 5 0.4
d(t)d(t) 5 1.6 cos Q p0.8tR 1 2.2,
The child moved slowest near the ends of theswing, approaching the points where achange in direction occurred. At these points,the tangent lines are horizontal so their slopesare 0. The child‘s speed was 0 m s at 0 s,0.8 s, and 1.6 s. The child‘s speed increasedbetween 0 s and 0.4 s, and then decreasedbetween 0.4 s and 0.8 s.
>
To get a better estimate of the child‘s speedat this time, use the difference quotient
where Use a verysmall value for h.
a 5 0.4.d(a 1 h) 2 d(a)
h ,
Chapter 6NEL 367
6.7
This speed is about 23 km h.>

NEL368 NEL368
The child was also travelling the fastest at around 1.2 s. Drawing a tangent line at supports this, since the tangent line appears to be steepest here.
Estimate the coordinates of two points on the tangent line to estimate the slope of the line.
Use and
The child was moving at about 6 m s.
Let
The child’s fastest speed was about 6.3 m s.>
8 0 6.28 0 or 6.28
5 `2.20628 2 2.2
0.001`
5 ∞S1.6 cos Q
p0.8(1.201)R 1 2.2T 2 S1.6 cos Q
p0.8(1.2)R 1 2.2T
0.001∞
5 `d(1.201) 2 d(1.2)
0.001`
Speed 5 `d(1.2 1 0.001) 2 d(1.2)
0.001`
h 5 0.001.
Speed 5 `d(1.2 1 h) 2 d(1.2)
h`
>
Slope 53.5 2 0.51.4 2 0.9
5 6
(1.4, 3.5).(0.9, 0.5)
1.5
2.0
2.5
01 2 3
1.0
0.5
3.5
3.0
Dis
tanc
e (m
)
Time (s)
t 5 1.2The child’s speed increased between 0.8 sand 1.2 s, and then decreased between1.2 s and 1.6 s.
To improve the estimate of the child‘s speedat this time, use the difference quotient
where Use a verysmall value for h.
a 5 1.2.d(a 1 h) 2 d(a)
h ,
6.7 Rates of Change in Trigonometric Functions

NEL 369
CHECK Your Understanding1. For the following graph of a function, state two intervals in which the
function has an average rate of change in that isa) zerob) a negative valuec) a positive value
p 2p0–2
2
4
6
8
–4
–6
–8
x
f (x) = –7 sin (x) – 1
y
f (x)
In Summary
Key Idea• The average and instantaneous rates of change of a sinusoidal function can be
determined using the same strategies that were used for other types offunctions.
Need to Know• The tangent lines at the maximum and minimum values of a sinusoidal
function are horizontal. Since the slope of a horizontal line is zero, theinstantaneous rate of change at these points is zero.
• In a sinusoidal function, the slope of a tangent line is the least at the pointthat lies halfway between the maximum and minimum values. The slope is thegreatest at the point that lies halfway between the minimum and maximumvalues. As a result, the instantaneous rate of change at these points is theleast and greatest, respectively. The approximate value of the instantaneousrate of change can be determined using one of the strategies below:• sketching an approximate tangent line on the graph and estimating its slope
using two points that lie on the secant line• using two points in the table of values (preferably two points that lie on
either side and/or as close as possible to the tangent point) to calculate theslope of the corresponding secant line
• using the defining equation of the trigonometric function and a very smallinterval near the point of tangency to calculate the slope of thecorresponding secant line
Chapter 6NEL 369
6.7

NEL370 NEL370
2. For this graph of a function, state two points where the function hasan instantaneous rate of change in that isa) zerob) a negative valuec) a positive value
3. Use the graph to calculate the average rate of change in on theinterval
4. Determine the average rate of change of the function
for each interval.
a) c)
b) d)
PRACTISING5. State two intervals where the function has an
average rate of change that isa) zerob) a negative valuec) a positive value
y 5 3 cos (4x) 2 4
p
2# x #
5p
4p
6# x #
p
2
p
3# x #
p
20 # x #
p
2
y 5 2 cos Qx 2p3R 1 1
0 2 31–1
6
2
4
–2
–4
x
y
4 5
y = f (x)
2 # x # 5.f (x)
0
3
1
2
4
5
6
–1
–2
x
y f (x) = 4 cos (x– ) + 2p4
p2
p 2p3p2
5p2
f (x)
K
6.7 Rates of Change in Trigonometric Functions

NEL 371
6. State two points where the function has aninstantaneous rate of change that isa) zerob) a negative valuec) a positive value
7. State the average rate of change of each of the following functions overthe interval a)
b)
c)
8. The height of the tip of an airplane propeller above the ground oncethe airplane reaches full speed can be modelled by a sine function. Atfull speed, the propeller makes 200 revolutions per second. At the tip of the propeller is at its minimum height above the ground.Determine whether the instantaneous rate of change in height at
is a negative value, a positive value, or zero.
9. Recall in Section 6.6, Example 3, the situation that modelled thepopulations of mice and owls in a particular area.
a) Determine an equation for the curve that models the ratio of miceper owl.
b) Use the curve to determine when the ratio of mice per owl has itsfastest and slowest instantaneous rates of change.
c) Use the equation you determined in part a) to estimate theinstantaneous rate of change in mice per owl when this rate is at its maximum. Use a centred interval of 1 month before to 1 month after the time when the instantaneous rate of change is at its maximum to make your estimate.
y
x0
4
12
8
16
20
24
Mic
e-to
-ow
l rat
io
Time (months)
Maximum point (22, 24.7)
Minimum point (10, 15.7)
168 24 4032 48
t 51
300
t 5 0,
y 51
4 cos (8x) 1 6
y 5 25 sin a12
xb 2 9
y 5 6 cos (3x) 1 2
p4 # x # p.
y 5 22 sin (2px) 1 7
T
Chapter 6NEL 371
6.7

NEL372 NEL372
10. The number of tons of paper waiting to be recycled at a 24 h recycling
plant can be modelled by the equation
where t is the time, in hours, and is the number of tons waiting to be recycled.a) Use the equation to estimate the instantaneous rate of change in tons
of paper waiting to be recycled when this rate is at its maximum. Tomake your estimate, use each of the following centred intervals:
i) 1 h before to 1 h after the time when the instantaneous rate ofchange is at its maximum
ii) 0.5 h before to 0.5 h after the time when the instantaneousrate of change is at its maximum
iii) 0.25 h before to 0.25 h after the time when the instantaneousrate of change is at its maximum
b) Which estimate is the most accurate? What is the relationshipbetween the size of the interval and the accuracy of the estimate?
11. A strobe photography camera takes photos at regular intervals to capturethe motion of a pendulum as it swings from right to left. A studenttakes measurements from the photo below to analyze the motion.
a) Plot the data, and draw a smooth curve through the points.b) What portion of one cycle is represented by the curve?c) Select the endpoints, and determine the average rate of change in
horizontal distance on this interval of time.d) Can you tell, from the photo, when the pendulum bob is moving
the fastest? Explain.e) Explain how your answer to part d) relates to the rate of change as
it is represented on the graph.
P(t)
P(t) 5 0.5 sin Qp6 t R 1 4,
Time (s) 0 0.1 0.2 0.3 0.4 0.5 0.6 0.7 0.8 0.9 1
Horizontal Distance fromRest Position* (cm)
7.2 6.85 5.8 4.25 2.2 0.0 22.2 24.25 25.8 26.85 27.2
*negative is left of rest position
6.7 Rates of Change in Trigonometric Functions

NEL 373
12. A ship that is docked in a harbour rises and falls with the waves. The
function models the vertical movement of the ship, h in metres, at t seconds.a) Determine the average rate of change in the height of the ship
over the first 5 s.b) Estimate the instantaneous rate of change in the height of the ship
at
13. For a certain pendulum, the angle shown is given by the equation
where t is in seconds and is in radians.
a) Sketch a graph of the function given by the equation.b) Calculate the average rate of change in the angle the pendulum
swings through in the interval c) Estimate the instantaneous rate of change in the angle the
pendulum swings through at d) On the interval , estimate the times when the pendulum’s
speed is greatest.
14. Compare the instantaneous rates of change of andfor the same values of x. What can you conclude? Are
there values of x for which the instantaneous rates of change of thetwo functions are the same?
Extending
15. In calculus, the derivative of a function is a function that yields theinstantaneous rate of change of a function at any given point.a) Estimate the instantaneous rate of change of the function
for the following values of and b) Plot the points that represent the instantaneous rate of change,
and draw a sinusoidal curve through them. What function haveyou graphed? Based on this information, what is the derivative of
16. a) Estimate the instantaneous rate of change of the function for the following values of and
b) Plot the points that represent the instantaneous rate of change,and draw a sinusoidal curve through them. What function haveyou graphed? Based on this information, what is the derivativeof f (x) 5 cos x?
p.x: 2p, 2p2 , 0, p2 ,f (x) 5 cos x
f (x) 5 sin x?
p.x: 2p, 2p2 , 0, p2 ,f (x) 5 sin x
f (x) 5 3 sin xf (x) 5 sin x
tP 30, 84t 5 1.5 s.
tP 30, 14.
uu 515 sin Q12 ptR
u
t 5 6.
h(t) 5 sin Qp5 tR
C
Chapter 6NEL 373
6.7
A
u

NEL374
3 Chapter Review
NEL374 Chapter Review
6 Chapter Review
FREQUENTLY ASKED QuestionsQ: What do the graphs of the reciprocal trigonometric
functions look like, and what are their definingcharacteristics?
A: Each of the primary trigonometric graphs has a correspondingreciprocal function:
y
u
0
3
1
2
–1
–3
–2
p 2p–p–2p
y = csc (u)
y = sin (x)y = sin (u)
y
u
0
3
1
2
–1
–3
–2
p 2p–p–2p
y = sec (u)
y = cos (u)
• has vertical asymptotes atthe points where
• has a period of radians,the same period as
• has the domain
• has the range5 yPR 0 0 y 0 $ 16
5xPR 0 x 2 np, nPI6
y 5 sin x2p
sin x 5 0• has vertical asymptotes at the points
where • has a period of radians, the same
period as • has the domain
• has the range 5 yPR 0 0 y 0 $ 165xPR 0 x 2 (2n 2 1)
p2 , nPI6
y 5 cos x2p
cos x 5 0
Cosecant Secant Cotangent
y 5 cot(x)
y 51
tan xy 5
1cos xy 5
1sin x
y 5 cot xy 5 sec xy 5 csc x
Q: How can you use a sinusoidal function to model aperiodic situation?
A: If you are given a description of a periodic situation, draw a roughsketch of one cycle. If you are given data, create a scatter plot.Based on the graph, decide whether you will use a sine model or acosine model. Use these graphs to determine the equation of the axis,the vertical translation, c, and the amplitude, a, of the function.
• See Lesson 6.5.• Try Chapter Review
Question 13.
Study Aid
y
u
0
3
1
2
–2
3
–1
y = tan (u)
0 p 2p–p–2p
y = cot (u)
• has vertical asymptotes at thepoints where crossesthe x-axis
• has zeros at the points wherehas asymptotes
• has a period of , the sameperiod as
• has the domain
• has the range 5 yPR65xPR 0 x 2 np, nPI6
y 5 tan xp
y 5 tan x
y 5 tan x
• See Lesson 6.6, Example 1.• Try Chapter Review
Questions 14, 15, and 16.
Study Aid
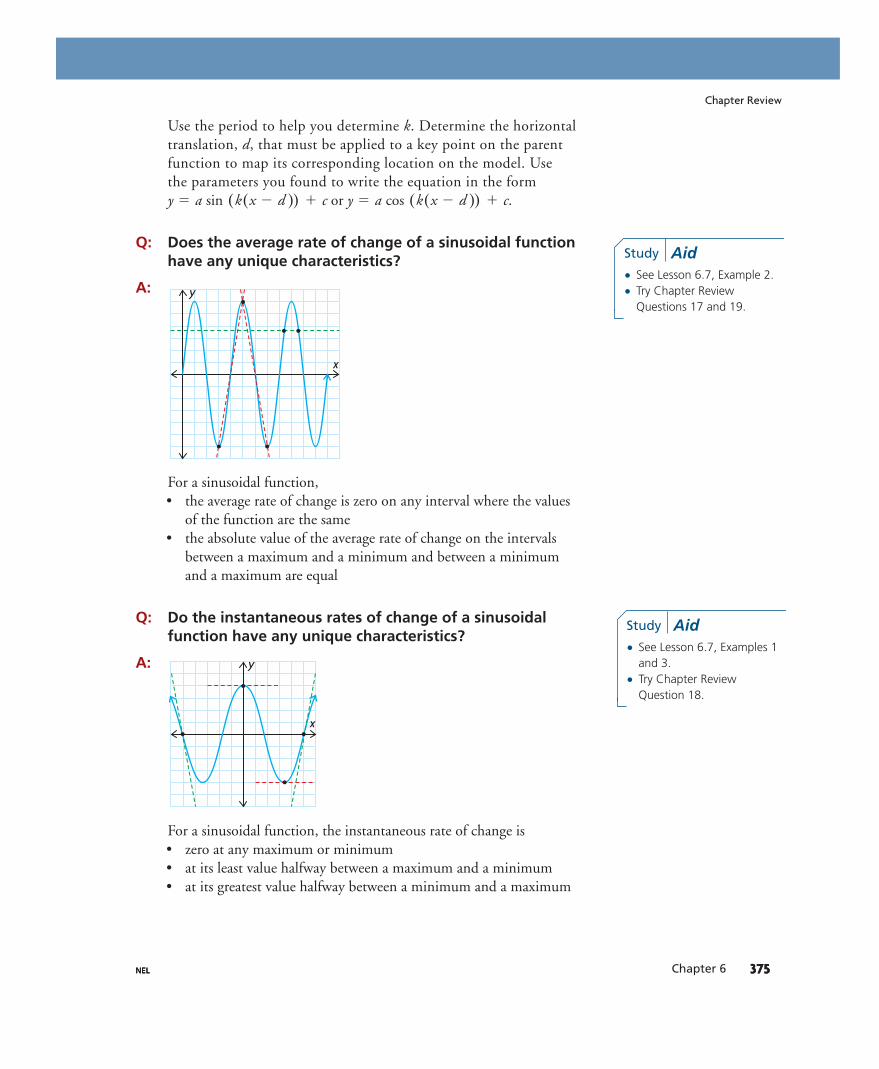
NEL 375NEL 375NEL Chapter 6
Use the period to help you determine k. Determine the horizontaltranslation, d, that must be applied to a key point on the parentfunction to map its corresponding location on the model. Usethe parameters you found to write the equation in the form
or
Q: Does the average rate of change of a sinusoidal functionhave any unique characteristics?
A:
For a sinusoidal function,• the average rate of change is zero on any interval where the values
of the function are the same• the absolute value of the average rate of change on the intervals
between a maximum and a minimum and between a minimumand a maximum are equal
Q: Do the instantaneous rates of change of a sinusoidalfunction have any unique characteristics?
A:
For a sinusoidal function, the instantaneous rate of change is• zero at any maximum or minimum• at its least value halfway between a maximum and a minimum• at its greatest value halfway between a minimum and a maximum
y
x
y
x
y 5 a cos (k(x 2 d )) 1 c.y 5 a sin (k(x 2 d )) 1 c
• See Lesson 6.7, Example 2.• Try Chapter Review
Questions 17 and 19.
Study Aid
• See Lesson 6.7, Examples 1and 3.
• Try Chapter ReviewQuestion 18.
Study Aid
Chapter Review

NEL376 NEL376 NEL
PRACTICE QuestionsLesson 6.1
1. An arc 33 m long subtends a central angle of a circle with a radius of 16 m. Determine themeasure of the central angle in radians.
2. A circle has a radius of 75 cm and a central angle of Determine the arc length.
3. Convert each of the following to exact radianmeasure and then evaluate to one decimal.a) c)b) d)
4. Convert each of the following to degreemeasure.
a) c)
b) d)
Lesson 6.2
5. For each of the following values of determine the measure of if
a) c)
b) d)
6. If and
determinea)b)c) the possible values of to the nearest tenth
7. A tower that is 65 m high makes an obtuseangle with the ground. The vertical distancefrom the top of the tower to the ground is 59 m. What obtuse angle does the tower makewith the ground, to the nearest hundredth of a radian?
Lesson 6.3
8. State the period of the graph of each function,in radians.a) c)b)
Lesson 6.4
9. The following graph is a sine curve. Determinethe equation of the graph.
10. The following graph is a cosine curve.Determine the equation of the graph.
11. State the transformations that have been appliedto to obtain each of the followingfunctions.a)
b)
c)
d) f (x) 5 2cos (2x 1 p)
f (x) 510
11 cos ax 2
p
9b 1 3
f (x) 5 cos a10ax 1p
12bb
f (x) 5 219 cos x 2 9
f (x) 5 cos x
0–1
1
2
3
–2
–3
–4
x
y
–p2–p p–3p
2p2
3p2
0
6
2
4
–2
x
y
–p p–2p 2p
y 5 cos xy 5 tan xy 5 sin x
usec utan u
0 # u # 2p,cos u 52513
212
2"3
2
"2
212
p
2# u #
3p
2.
usin u,
22p
32
5p
4
8p
3p
4
420°250°
160°20°
14p15 .
Chapter Review

NEL 377NEL 377
12. The current, I, in amperes, of an electric circuit isgiven by the function where t is the time in seconds.a) Draw a graph that shows one cycle.b) What is the singular period?c) At what value of t is the current a maximum
in the first cycle?d) When is the current a minimum in
the first cycle?
Lesson 6.5
13. State the period of the graph of each function,in radians.a) c)b)
Lesson 6.6
14. A bumblebee is flying in a circular motionwithin a vertical plane, at a constant speed. The height of the bumblebee above the ground,as a function of time, can be modelled by asinusoidal function. At , the bumblebee isat its lowest point above the ground.a) What does the amplitude of the sinusoidal
function represent in this situation?b) What does the period of the sinusoidal
function represent in this situation?c) What does the equation of the axis of the
sinusoidal function represent in this situation?d) If a reflection in the horizontal axis was
applied to the sinusoidal function, was thesine function or the cosine function used?
15. The population of a ski-resort town, as afunction of the number of months into the year,can be described by a cosine function. Themaximum population of the town is about 15 000 people, and the minimum population isabout 500 people. At the beginning of the year,the population is at its greatest. After six months,the population reaches its lowest number ofpeople. What is the equation of the cosinefunction that describes the population of this town?
16. A weight is bobbing up and down on a springattached to a ceiling. The data in the followingtable give the height of the weight above thefloor as it bobs. Determine the sine functionthat models this situation.
Lesson 6.7
17. State two intervals in which the function
has an average rate of
change that isa) zerob) a negative valuec) a positive value
18. State two points where the function has an instantaneous
rate of change that isa) zerob) a negative valuec) a positive value
19. A person’s blood pressure, in millimetres of mercury (mm Hg), is modelled by the
function
where t is the time in seconds.a) What is the period of the function? b) What does the value of the period mean in
this situation?c) Calculate the average rate of change in a
person’s blood pressure on the interval
d) Estimate the instantaneous rate of change ina person’s blood pressure at t 5 0.5.
tP 30.2, 0.34.
P(t) 5 100 2 20 cos Q8p3 tR,
P(t),
y 514 cos (4px) 2 3
y 5 7 sin Q15 xR 1 2
t 5 0
y 5 sec xy 5 cot xy 5 csc x
I(t) 5 4.5 sin (120pt),
t (s) 0.0 0.2 0.4 0.6 0.8 1.0 1.2 1.4 1.6 1.8 2.0 2.2
h(t)(cm)
120 136 165 180 166 133 120 135 164 179 165 133
Chapter Review
Chapter 6NEL 377

NEL378
3 Chapter Review
NEL378 Chapter Self-Test
6 Chapter Self-Test
1. Which trigonometric function has an asymptote at ?
2. Which expression does not have the same value as all the otherexpressions?
3. The function is reflected in the x-axis, vertically stretched by
a factor of 12, horizontally compressed by a factor of horizontally
translated units to the left, and vertically translated 100 units up.
Determine the value of the new function, to the nearest tenth,
when
4. The daily high temperature of a city, in degrees Celsius, as a function of the number of days into the year, can be described by the function
What is the average rate
of change, in degrees Celsius per day, of the daily high temperature ofthe city from February 21 to May 8?
5. Arrange the following angles in order, from smallest to largest:
, , ,
6. Write an equivalent sine function for
7. The point lies on the terminal arm of an angle in standardposition. If the angle measures 4.8775 radians, what is the value of yto the nearest unit?
8. The temperature, T, in degrees Celsius, of the surface water in aswimming pool varies according to the following graph, where t is thenumber of hours since sunrise at 6 a.m.a) Find a possible equation for the temperature of the surface water
as a function of time.b) Calculate the average rate of change in water temperature from
sunrise to noon.c) Estimate the instantaneous rate of change in water temperature
at 6 p.m.
(5, y)
y 5 cos Qx 1p8R.
3p
5110°
2p
3113°
5p
8,
T(d ) 5 220 cos Q 2p365 (d 2 10)R 1 25.
x 55p4 .
p6
35,
y 5 cos x
sin 3p
2, cos p, tan
7p
4, csc
3p
2, sec 2p, cot
3p
4
x 55p2
Time (h)
T
t
Tem
pera
ture
(°C
)
0
17
19
21
23
25
10 15 20 255

NEL 379
3 Chapter Review
NEL 379Chapter 6
6 Chapter Task
Investigating Changes in Temperature
The following table gives the mean monthly temperatures for Sudbury andWindsor, two cities in Ontario. Each month is represented by the day ofthe year in the middle of the month.
✔ Did you provide reasons foryour conjecture?
✔ Did you draw and labelyour graphs accurately?
✔ Did you determine whenthe mean daily temperatureis increasing the fastest inboth cities?
✔ Did you show all the stepsin your calculations of ratesof change and clearlyexplain your thinking?
Task Checklist
Month Jan. Feb. Mar. Apr. May June July Aug. Sep. Oct. Nov. Dec.
Day of Year 15 45 75 106 136 167 197 228 259 289 320 350
Temperature forSudbury (8C)
213.7 211.9 25.9 3.0 10.6 15.8 18.9 17.4 12.2 6.2 21.2 210.1
Temperature forWindsor (8C)
24.7 23.8 2.3 8.7 14.6 20.2 22.6 22.0 17.9 11.5 4.8 21.2
Which city has the greatest rate of increase in mean dailytemperature, and when does this occur?
A. Make a conjecture about which city has the greatest rate of increase inmean daily temperature. Provide reasons for your conjecture.
B. Create a scatter plot of mean monthly temperature versus day of theyear for each city.
C. Draw the curve of best fit for each graph.
D. Use your graphs to estimate when the mean daily temperatureincreases the fastest in both cities. Explain how you determined these values.
E. Use your graphs to estimate the rate at which the mean dailytemperature is increasing at the times you estimated in part D.
F. Determine an equation of a sinusoidal function to model the data foreach city.
G. Use the equations you found in part F to estimate the fastest rate atwhich the mean daily temperature is increasing.
?

NEL380 Cumulative Review
Chapters
Cumulative Review4–6Multiple Choice
1. What are the solutions of
a) c)b) d)
2. Which cubic function has zeros at and 4and passes through ?a)b)c)d)
3. Which value is not a solution of?
a) b) 2 c) 3 d) 5
4. What is the solution of ?
a) c)
b) d)
5. On which interval is ?
a) c)b) and d)
6. The height in metres of a diver above the pool’ssurface is given by where t is in seconds. When is the diver morethan 10.0 m above the pool?a) c)b) d)
7. The instantaneous rate of change of a cubicfunction is positive for negative for
and positive for Which isnot a possible set of zeros for the function?a)b)c)d)
8. Which value is the best estimate of theinstantaneous rate of change of the function
at the point ?
a) b) 0 c) 6.2 d) 5.5
9. Which is the graph of
a)
b)
c)
d)
y 51
x 2 2 3x?
26.5
(0, 0)f (x) 5 2x3 2 4x2 1 6x
x 5 20.73, x 5 2x 5 23x 5 20.73, x 5 1, x 5 2.73x 5 0, x 5 1
x . 2.0 , x , 2,x , 0,
0.7 , t , 1tP (0, 0.7)
tP (0, 1)t , 1.5
h(t) 5 25t2 1 3.5t 1 10,
xP (0, 2)x . 2x , 0xP (2`, 0)x . 2
f (x) , g(x)
xP c25
3, 1 dxP (25, 1)
25 # x # 125 # x #133
210 # 3x 1 5 # 8
222 2 3x , x 2 5
f (x) 5 6(x 1 1) (x 2 1) (x 2 4)
f (x) 5 36x3 2 144x2 2 6x 1 144f (x) 5 26x3 1 24x2 1 6x 2 24f (x) 5 2(x 2 1) (x 1 1) (x 1 4)
(2, 36)
21, 1,
23, 22, 0, 224, 23, 023, 0, 422, 0, 3, 2
x4 1 3x3 5 4x2 1 12x ?
y
x0
6
2 4 6
2
4
–2
–6
–4
–2–4–6
f (x )g (x )

NEL 381Chapters 4–6
10. What type of asymptote(s) does
have?
a) only verticalb) only horizontalc) both vertical and horizontald) only oblique
11. Which function has a vertical asymptote atand an oblique asymptote?
a) c)
b) d)
12. Which function has domain andis positive on ?
a) c)
b) d)
13. How does the function behave
as x approaches from the left?
a) c)
b) d)
14. What is the solution of
a) c)
b) d)
15. When solving a rational equation such as
what is a possible first step?
a) Graph each side as a function.b) Determine the zeros of the denominators.c) Multiply all terms by the lowest common
denominator.d) any of the above
16. The inequality is equivalent to
a)
b)
c)
d)
17. For which interval(s) is the inequality
true?
a) or b)c) or d)
18. What is the slope of the line tangent to
at ?
a) c)
b) d)
19. The position of an object moving along astraight line at time t seconds is given by
where s is measured in metres.
Which is the best estimate for the rate ofchange of s at s?a) m/s c) m/sb) m/s d) m/s
20. A sector of a circle with a radius of 3 m has a
central angle of What is the perimeter ofthe sector?
a) m c) m
b) m d) m5p
45p
41 6
5p
21 66
524
5p12 .
272929.6212
t 5 3
s(t) 52t 1 1t 2 4 ,
m 5 23m 5 23
2
m 5 3m 53
2
x 5 1y 53 2 x
2x
0 , x , 2 or x . 5x . 5x , 0
xP (0, 5)
xP (2, 5)xP (2`, 0)
x 2 3 .6
x 2 2
(2x 1 1) (x 2 2)
2# 0
(2x 2 1) (x 1 2)
x # 0
x(2x 2 3)
2# 1
(2x 1 1) (x 2 2)
x # 0
2x 2 3 #2x
2 2 3x5x 2 3 5
x 1 25x ,
x 5 213, x 5 3x 5 22, x 5 0
x 5 23, x 513x 5 0, x 5 1.5
3 2 2xx 1 2 5 3x?
f (x) S 2`f (x) S 0
f (x) S 15f (x) S `
35
f (x) 52 2 3x5x 2 3
j(x) 52 2 xx 1 3
g(x) 5x 1 2
x 2 3
h(x) 5x 2 2
x 1 3f (x) 5
x 1 23 2 x
5xPR 022 , x , 365xPR 0 x 2 36j(x) 5
x2 1 9x 2 3
g(x) 5x2 2 9x 2 3
h(x) 5x 1 3
x 2 3f (x) 5
x 2 3x2 2 9
x 5 3
f (x) 51
x2 1 3x 2 10
Cumulative Review

NEL382 Cumulative Review
21. Which of the following pairs of angles areequivalent?
a) and c) and
b) and d) all of the above
22. The point lies on the terminal arm ofangle What is the measure of in radians?a) 4.19 b) 119.74 c) 2.09 d) 2.62
23. If what are possible values of
and ?
a)
b)
c)
d)
24. Which of the following values of x, wheresatisfy sin ?
a) and c) and
b) and d) and
25. What is the equation of this transformation ofthe graph of ?
a)
b)
c)
d)
26. What transformations are needed to transform
into ?
a) horizontal compression by a factor ofhorizontal translation units left
b) horizontal stretch by a factor of 3,horizontal translation units left
c) vertical compression by a factor ofvertical translation 2 units up
d) horizontal stretch by a factor of 3,horizontal translation units left
27. One blade of a wind turbine is at an angle of to the upward vertical at time and
rotates counterclockwise one revolution every 2 seconds. The tip of the blade varies between 5 m and 41 m above the ground. Which equationis a model for the height, h, of the blade tip?
a)
b)
c)
d)
28. The instantaneous rate of change ofis negative on which
of the following intervals?
a) c) both a) and b)
b) d) neither a) nor b)
29. The population of blackflies at a lake innorthern Ontario can be modelled by the
function
where P is in millions and t is in months. Overwhich time interval is the average rate of changein the blackfly population the greatest?a) c)b) d) 10 # t # 181 # t # 7
7 # t # 160 # t # 4
P(t) 5 23.7 cos Qp6 (t 2 7)R 1 24.1,
p
2, x ,
3p
2
p
2, x ,
5p
6
y 5 2 sin(3x 2 p)
h 5 41 cos QpQt 1p
4RR 2 36
h 5 18 cos Qpt 2p
4R 2 23
h 5 41 cos Q2Qt 1p
4RR 2 5
h 5 18 cos Qpt 1p
4R 1 23
t 5 0,p42
2p
13,
2p
2p
13,
y 5 cos Q13(x 1 2p)Ry 5 cos x
y 5 2 sin(3x) 2 1
y 5 3 sina1
2xb 2 1
y 5 3 sin(2x) 2 1
y 5 3 sin(2(x 1 1))
y
x0
2
4
–4
–6
–20 p
4p2
p3p4–p4–p2
–p –3p4
y 5 sin x
5p
6p
65p
3p
3
11p
6
p
6
7p
6
p
6
x 5 0.5xP 30, 2p4,
cos u 5 212
, tan u 51
"3
cos u 5 21
2, tan u 5 2
1
"3
cos u 5 21
2, tan u 5 2"3
cos u 512
, tan u 5 2"3
tan ucos usin u 5 2
!32 ,
uu.(24, 7)
3p
4135°
23p
22270°
p
920°

NEL 383Chapters 4–6
InvestigationsThe Greatest Volume30. An open top box is made by cutting corners out of a 50 cm by 40 cm
piece of cardboard.a) Determine a mathematical model that represents the volume of
the box.b) Determine the length of the sides of each square that must be cut
that will result in a box with a volume of c) Determine the length of the sides of each square that must be cut
that will result in a box with maximum volume.d) Determine a range of sizes of the squares that can be cut from each
corner that will result in a box with a volume of at least
Combining Functions31. Consider the polynomial functions
Determine
a) the zeros of
b) the holes and asymptotes of and if any
c) any x-coordinate(s) where the tangents of and are
perpendicular, and the equation(s) of the tangent(s) at suchcoordinates
Transformations of Trigonometric Functions32. a) Investigate the effect of various types of transformations
(i.e., stretches/compressions, reflections, and translations) ofon its zeros, maximum and minimum values, and
instantaneous rates of change.b) Repeat part a) for and y 5 tan x.y 5 cos x
y 5 sin x
g(x)
f (x)
f (x)
g(x)
g(x)
f (x) ,f (x)
g(x)
f (x), g(x), f (x)
g(x) , and g(x)
f (x)
f (x) 5 x2 2 5x 1 6 and g(x) 5 x 2 3.
1008 cm3.
6000 cm3.
Cumulative Review

NEL 651Answers
An
swers
d) vertical asymptote:
x- y-
positive onand negative on
The function is never decreasing and isincreasing on and
6. Answers may vary. For example, consider
the function You know that
the vertical asymptote would be Ifyou were to find the value of the functionvery close to say or
you would be able to determinethe behaviour of the function on eitherside of the asymptote.
To the left of the vertical asymptote, thefunction moves toward To the rightof the vertical asymptote, the functionmoves toward
7. a)
b) and
c) or d) and
8. about 12 min9. days and 3.297 days
10. a) and b) and c) and d)
11. and 12. a)
b) and 13. a) 0.455 mg L h
b) mg L hc) The concentration of the drug in the
blood stream appears to be increasingmost rapidly during the first hour and ahalf; the graph is steep and increasingduring this time.
14. and
15. a) As the x-coordinate approaches the vertical asymptote of a rational func-tion, the line tangent to graph will getcloser and closer to being a verticalline. This means that the slope of theline tangent to the graph will getlarger and larger, approaching positiveor negative infinity depending on thefunction, as x gets closer to the verticalasymptote.
b) As the x-coordinate grows larger andlarger in either direction, the line tangent to the graph will get closer andcloser to being a horizontal line. Thismeans that the slope of the line tangentto the graph will always approach zeroas x gets larger and larger.
Chapter Self-Test, p. 310
1. a) Bb) A
2. a) If is very large, then that would
make a very small fraction.
b) If is very small (less than 1), then
that would make very large.
c) If then that would make
undefined at that point because
you cannot divide by 0.d) If is positive, then that would
make also positive because you are
dividing two positive numbers.3.
4. 4326 kg; $0.52/kg5. a) Algebraic; and
b) Algebraic with factor tableThe inequality is true on and on
6. a) To find the vertical asymptotes of the function, find the zeros of theexpression in the denominator. To find the equation of the horizontalasymptotes, divide the first two terms of the expressions in the numerator anddenominator.
b) This type of function will have a holewhen both the numerator and thedenominator share the same factor
Chapter 6
Getting Started, p. 314
1. a) 28°b) 332°
2. a)
b) 307°
3. a) c) e)
b) 0 d) f )
4. a) 60°, 300°b) 30°, 210°c) 45°, 225°d) 180°e) 135°, 315°f ) 90°
5. a)
b)
6. a) 45o to the left;
2
0
–2
y
158–158–308–458 308 458 608 758
x
amplitude 5 2y 5 0;period 5 120°;
R 5 5 yPR 0 21 # y # 16y 5 0;amplitude 5 1;period 5 360°;
x
1
0
–1
y
–908 908 18082708–2708–1808
R 5 5 yPR 0 21 # y # 16y 5 0;amplitude 5 1;period 5 360°;
x
1
0
–1
y
–908 908 18082708–2708–1808
211
2
2!2!3
2
!3
2
cot u 5 23
4sec u 5
5
3,csc u 5 2
5
4,
tan u 5 243
,cos u 535
,sin u 5 245
,
x2
0
–4
–2
–6
4 6
P(3, –4)
–4 –2 2
y
(x 1 a).
(25, 1.2).(210, 25.5)
x 5 23x 5 21
0
y
x
–8 86
4
2
–4
–6
–8
–2
6
8
42–2–4–6
1f (n)
f (n)
1f (n)
f (n) 5 0,
1f (n)
f (n)
1f (n)
f (n)
x 5 6.5x 5 8;x 5 5
>>20.04>>
x 5 210.2; x 5 2226; x 5 3
t . 64.7320.7261 , t , 00 , x , 1.5
21 , x , 022 , x , 21.3325 , x216 , x , 211
22.873 , x , 4.873x , 23x 5 1.82
x 5 3x 5 21x 5 2x 5 26
x 5 22
3x 5 0.2
x 5 6`.
2`.
f (6.01) 51
(6.01) 2 65 100
f (5.99) 51
(5.99) 2 65 2100
f (6.01))
f (5.99)(x 5 6
x 5 6.
f (x) 51
x 2 6.
(20.5, `).(2`, 20.5)
–3–4 3 40
16
8
–16
–8
–24
–32
24
32y
x
1 2–2 –1
20.5 , x , 0x . 0;x , 20.5
R 5 5 yPR 0 x 2 26;horizontal asymptote 5 2;
intercept 5 0;intercept 5 0;D 5 5xPR 0 x 2 20.56;x 5 20.5;
x 5 20.5;

NEL652 Answers
b) 60o to theright;
7. a is the amplitude, which determines howfar above and below the axis of the curveof the function rises and falls; k definesthe period of the function, which is howoften the function repeats itself; d is thehorizontal shift, which shifts the functionto the right or the left; and c is the verticalshift of the function.
Lesson 6.1, pp. 320–322
1. a) radians; 180°
b) radians; 90°
c)
d)
e) radians;
f ) 270°
g)
h) 120°
2. a)
b)
c)
d)
e)
f )
g)
h)
3. a) radians c) radians
b) radians d) radians
4. a) 300° c) 171.89°b) 54° d) 495°
5. a) 2 radians; 114.6°
b) cm
6. a) 28 cm
b) cm
7. a) radians e) radians
b) radians f ) radians
c) radians g) radians
d) radians h) radians
8. a) 120° e) 210°b) 60° f ) 90°c) 45° g) 330°d) 225° h) 270°
9. a) m
b) 162.5 m
c) cm
10. cm11. a) radians s
b) m12. a) 36
b) 0.8 m13. a) equal to
b) greater thanc) stay the same
14.
radians; radians;
radians; radians;
radians; radians;
radians; radians;
radians; radians;
radians; radians;
radians; radians;
radians; radians;
radians15. Circle B, Circle A, and Circle C16. about radians s
Lesson 6.2, pp. 330–332
1. a) second quadrant; positive
b) fourth quadrant; positive
c) third quadrant; positive
d) second quadrant; negative
e) second quadrant; negative
f ) fourth quadrant; negativep4 ;
p3 ;
p6 ;
p3
;
p3 ;
p4 ;
>144.5
360° 5 2p
330° 511p
6315° 5
7p
4
300° 55p
3270° 5
3p
2
240° 54p
3225° 5
5p
4
210° 57p
6180° 5 p
150° 55p
6135° 5
3p
4
120° 52p
390° 5
p
2
60° 5p
345° 5
p
4
30° 5p
60° 5 0
90˚
270˚
180˚
150˚135˚
120˚
210˚225˚
240˚
60˚45˚
0˚, 360˚
30˚
330˚315˚
300˚
8 377.0>8 0.418 88
4.50!2
325p
6
247p
4
4p
3
p
4
4p
3p
p
33p
2
5p
4
p
2
40p
3
25p
9
516p
9
10p
9
20p
9
5p
12
0 1
y
x
01
y
x
01
y
x
0 1
y
x
01
y
x
0
1
y
x
0
1
y
x
01
y
x
2p
3radians;
24p
3radians 5 2240°
3p
2radians;
2360°22p
2270°23p
2radians;
2180°2p radians;
p
2
p
yx
–2
–10 1808908 360845082708 540863087208
amplitude 5 1y 5 21;period 5 720°;

NEL 653Answers
An
swers
2. a) i)
ii)
iii)
iv)b) i)
ii)
iii)
iv)c) i)
ii)
iii)
iv)d) i)
ii)
iii)
iv)
3. a)
b)
c)
d)
4. a) c)
b) d)
5. a) d)
b) e) 2
c) f ) 2
6. a) d)
b) e)
c) f )
7. a) d)b) e)c) f )
8. a) d)
b) e)
c) f )
9.10.11.12. Draw the angle and determine the measure
of the reference angle. Use the CAST ruleto determine the sign of each of the ratiosin the quadrant in which the angle terminates. Use this sign and the value ofthe ratios of the reference angle to determine the values of the primarytrigonometric ratios for the given angle.
13. a) second or third quadrant
b) or
or
or
or
c) or 4.3214.
y
x3–1
2 –150°
–
y
x3
12
p6
5p6
–
u 8 1.97
25
12cot u 5
512
213
12,csc u 5
13
12
sec u 5 213
5,
212
5,tan u 5
12
5
21213
,sin u 51213
x 8 4.5 cmx 8 5.55 cmp 2 0.748 8 2.39
sec p
4csc
4p
3
sin 7p
6tan
5p
6
cot 5p
3cos
5p
4
u 8 6.12u 8 1.30u 8 0.84u 8 0.17u 8 3.61u 8 2.29
p5p
4
3p
2
11p
6
7p
6
4p
3
2!3
3
2!22
2!2
2
!3
2
sec 5p
6cos
p
3
cot 3p
4sin
p
6
cot a2p
6b 5 2!3
sec a2p
6b 5
2!3
3,
csc a2p
6b 5 22,
tan a2p
6b 5 2
!33
,
cos a2p
6b 5
!3
2,
sin a2p
6b 5 2
12
,
cot a7p
4b 5 21
sec a7p
4b 5 !2,
csc a7p
4b 5 2!2,
tan a7p
4b 5 21,
cos a7p
4b 5
!22
,
sin a7p
4b 5 2
!2
2,
cot (2p) 5 undefined sec (2p) 5 21, csc (2p) 5 undefined, tan (2p) 5 0, cos (2p) 5 21,sin (2p) 5 0,
cot a2p
2b 5 0
sec a2p
2b 5 undefined,
csc a2p
2b 5 21,
tan a2p
2b 5 undefined,
cos a2p
2b 5 0,
sin a2p
2b 5 21,
u 8p
2
cot u 505
5 0
sec u 55
05 undefined,
csc u 55
55 1,
tan u 55
05 undefined,
cos u 505
5 0,
sin u 55
55 1,
r 5 5
y
x0 2 4
–2
–4
6
8
2
4
–2–4
u 8 5.64
cot u 5 24
3sec u 5
5
4,
csc u 5 253
,tan u 5 234
,
cos u 54
5,sin u 5 2
3
5,
r 5 5
yx
0
–6
–8
–2
–4
–2 2 4 6 8
u 8 3.54
cot u 512
5sec u 5 2
13
12,
csc u 5 213
5,tan u 5
5
12,
cos u 5 21213
,sin u 5 2513
,
r 5 13
y x0 4–4–8–12–16
–4
–8
–12
u 8 0.93
cot u 534
sec u 553
,csc u 554
,
tan u 54
3,cos u 5
3
5,sin u 5
4
5,
r 5 10
y
x0
2
2 4 6 8 10–2
4
6
10
8

NEL654 Answers
By examining the special triangles, we see
15.
16. ;
;
;
17. a) The first and second quadrants bothhave a positive y-value.
b) The first quadrant has a positive y-value,and the fourth quadrant has a negativey-value.
c) The first quadrant has a positive x-value,and the second quadrant has a negativex-value.
d) The first quadrant has a positive x-valueand a positive y-value, and the thirdquadrant has a negative x-value and anegative y-value.
18. 119.20. The ranges of the cosecant and secant
functions are both In other words, the values of these
functions can never be between and 1.For the values of these functions to bebetween and 1, the values of the sineand cosine functions would have to begreater than 1 and less than which isnever the case.
21.
Lesson 6.3, p. 336
1. a) and have the sameperiod, axis, amplitude, maximum value,minimum value, domain, and range.They have different y- and -intercepts.
b) and have nocharacteristics in common except fortheir y-intercept and zeros.
2. a)
b) , , ,
c) i)
ii)
iii)
3. a)
b)c)
4. The two graphs appear to be identical.5. a)
b)
Lesson 6.4, pp. 343–346
1. a) period:
amplitude: horizontal translation: equation of the axis:
b) period: amplitude: horizontal translation:
equation of the axis:
c) period:
amplitude: horizontal translation: equation of the axis:
d) period: amplitude:
horizontal translation:
equation of the axis: 2. Only the last one is cut off.3.
period:
amplitude:
horizontal translation: to the left
equation of the axis:
4. a)
b)
c)
d)5. a)
equation of the axis is
b)equation of the axis is
c)equation of the axis is
d)equation of the axis is
6. a) vertical stretch by a factor of 4, verticaltranslation 3 units up
b) reflection in the x–axis, horizontalstretch by a factor of 4
c) horizontal translation to the right,vertical translation 1 unit down
d) horizontal compression by a factor of
horizontal translation to the leftp6
14,
p
y 5 22 cos Q12xR 2 1
y 5 21;amplitude 5 2,period 5 4p,
y 5 22.5 cos Q13xR 1 6.5
y 5 6.5;amplitude 5 2.5,period 5 6p,
y 5 26 sin (0.5x) 2 2y 5 22;
amplitude 5 6,period 5 4p,y 5 18 sin x
y 5 0;amplitude 5 18,period 5 2p,
f (x) 5 11 sin (4px)
f (x) 5 80 sin a1
3xb 2
9
10
f (x) 52
5 sin ap
5xb 1
1
15
f (x) 5 25 sin (2x) 2 4
y 5 4
p4
2
p2
x2
4
6
04
3pp
y
4––– p4
3p4 2
p2p
y 5 22
p6
5p
y 5 210
2
2p3
y 5 3
p4
12p
y 5 00
0.5
p2
nPItn 5p
21 np,
nPItn 5 np,
nPItn 5 2p 1 2np,nPItn 5 2np,
nPItn 5p
21 np,
nPItn 53p
21 2np,
nPItn 5p
21 2np,
nPItn 5 np,u 5 3.93
u 5 0.79u 5 22.36u 5 25.50
y 5 tan uy 5 sin u
u
y 5 cos uy 5 sin u
2!3 2 34
21,
21
21 y $ 16.
5 yPR 0 21 $ y or
cos 150° 8 20.26
tan D 588
5 1
cos D 58
8!25
!2
2
sin D 58
8!25
!2
2
AB 5 16
2 acos2 11p
6b5 asin2
11p
6b
2asin2 a11p
6bb 2 1
5 21
2
51
42
34
2 a!3
2b2
5 a21
2b2
asin2 11p
6b 2 acos2
11p
6b
5 212
5 2a1
4b 2 1
5 2a21
2b2
2 12asin2 a11p
6bb 2 1
cos a5p
6b 5 cos (2150°) 5 2
!32

NEL 655Answers
An
swers
7. a)
b)
c)
d)
8. a)
b)
c)
d)
e)
f )
9. a) The period of the function is This represents the time between onebeat of a person’s heart and the next beat.
b) 80
c)
d) The range for the function is between80 and 120. The range means thelowest blood pressure is 80 and thehighest blood pressure is 120.
10. a)
b) There is a vertical stretch by a factor of20, followed by a horizontal compression
by a of factor of , and then a horizontal
translation 0.2 to the left.
c)
11. a)
b) vertical stretch by a factor of 25,reflection in the -axis, verticaltranslation 27 units up, horizontal
compression by a factor of
c)
12.
13. Answers may vary. For example,
14. a)
b)
c)
15.
16. a) 100 mb) 400 mc) 300 md) 80 se)
Mid-Chapter Review, p. 349
1. a)b)c)d)
2. a)b)c)d)e)f )
3. a) 20b) 4 radians sc) 380 cm
4. a)
b)
c)
d)
e) 0
f )
5. a)b)c)d)e)f ) about 4.91
about 0.98about 4.44about 1.46about 0.86about 1.78
21
2
2"3
3
2"3
212
"2
2
p
>p
p
2140° 8 22.4 radians215° 8 3.8 radians330° 8 5.8 radians5° 8 0.1 radians450° 8 7.9 radians125° 8 2.2 radians165°
286.5°
720°
22.5°
about 23.561 94 m>s
y 5 4 sin a p
20(x 2 10)b 2 1
y 5 22 sin ap
4xb
y 5 cos (4px)
Q14p13 , 5R.
2p
7
y 5 225 cos a2p
3xb 1 27
10 k 0 5
32p
x
x
50
60
40
0
30
20
10
1 2 3 4 5 6
Time (s)
Dis
tanc
e ab
ove
the
grou
nd (c
m)
y
y 5 20 sin a5p
2(x 1 0.2)b
25p
Time (s)
Hor
izon
tal d
ista
nce
from
cent
re (c
m)
y
x
–10
–20
–30
30
10
20
0.2 0.4 0.6 0.8 1.0 1.2 1.4 1.6
y
x0
120
100
110
80
–20
90
1 2 3 4
65.
yx
0–2
–6
–4
p 2p2
3p2p
23p
2p
yx
0–2
–6
–4
p 2p
y
x0
6
2
4
–2p 2p
23p
2p
y
x0
6
2
4
–2p 2p
23p
2p
y
x0 p 2p
23p
2p
2
4
–2
–6
–4
y
x0
6
2
4
–2p 2p
23p
2p
f (x) 5 cos a2ax 1p
2bb
f (x) 5 3 cos ax 2p
2b
f (x) 5 cos a21
2xb
f (x) 51
2 cos x 1 3 Start with graph of y 5 sin x.
Reflect in the x-axis and stretch vertically by a factor of 2 to produce
graph of y 5 22 sin x.
Stretch horizontally by a factor of 2 toproduce graph of y 5 22 sin (0.5x).
Translate units to the right to produce
graph of y 5 22 sin Q0.5Qx 2p4 RR.
p4
Translate 3 units up to produce graph
of y 5 22 sin Q0.5Qx 2p4 RR 1 3.

NEL656 Answers
6. a)
b)
c)
d)
7. a)
b)
c)8. a)
b)
c)
d)
e)
f )
9.
Lesson 6.5, p. 353
1. a)b) no maximum valuec) no minimum value
2. a)
b) no maximum valuec) no minimum value
3. a)
b)
4.
0.79, 3.93
5. Yes, the graphs of andare identical.
6. Answers may vary. For example, reflect the graph of across the y-axis
and then translate the graph units to the left.
7. a)
b)
c)
d)
Lesson 6.6, pp. 360–362
1.
2. 2, 0.5, 0.973 943.
4. amplitude and equation of the axis5. a) the radius of the circle in which the
tip of the sparkler is movingb) the time it takes Mike to make one
complete circle with the sparklerc) the height above the ground of the
centre of the circle in which the tip of the sparkler is moving
d) cosine function
6.
7.
8.
x1
–1
2
3
0
y
p p 3p
Hei
ght
abov
e th
e fl
oor (
m)
Total distance travelled (m)
2 22p
y 5 21.25 sin a45
xb 1 1.5
y 5 250 cos a2p
3xb 1 750
y 5 90 sin a p
12xb 1 30
x 5 1.3
y
x
–2––
2
0
4
6
2p
2p p 2pp–2p
23p
23p
y 8
y 5 3 cos a23ax 1
p
4bb 1 2
x1
2
3
0–1
–2
–3
y
p 2p–p–2p
period 5 4p
1
2
3
0–1
–2
–3
y
p 2p–p–2p
period 5 2p
x2
4
6
0–2
–4
–6
y
23pp
23p
2p–p
2p––
period 5 p
x2
4
6
0–2
–4
–6
y
p 2p–p–2p2p
23p– 2
p– 23p
period 5 2p
p2
y 5 tan x
y 5 sec xy 5 csc Qx 1
p2 R
22.35,25.50,
nPItn 5p
21 np,
nPItn 5 np,
nPItn 5p
21 np,
nPItn 5 np,
y 513
sin a23ax 1p
8bb 2 23
x
–2
–4
0y
– 2p
23pp
2p–p– 2
3p
x2
4
6
8
0
y
– 2p
23pp
2p–p– 2
3p
0.5
–0.5
0
y
x
–2p
23pp 2p
2p–p–2p– 2
3p
x2
4
6
0
y
– 2p
23pp
2p–p– 2
3p
x
2
–2
0
y
– 2p
23pp
2p–p– 2
3p
y
x
–4
–8
–– –
4
0
8
2p
2p pp
23p
23p
y 5 0x 5 0, 6p, 62p, c;
y 5 1x 5 6p
2, 6
3p
2, 6
5p
2, c;
y 5 0x 5 0, 6p, 62p, c;
cos 5p
6
sec p
2
cot 3p
4
sin p
6

NEL 657Answers
An
swers
9.
10. a)
b)
11.
and 12. The student should graph the height of
the nail above the ground as a function of the total distance travelled by the nail,because the nail would not be travelling ata constant speed. If the student graphedthe height of the nail above the ground asa function of time, the graph would notbe sinusoidal.
13. minute hand:
second hand:
hour hand:
Lesson 6.7, pp. 369–373
1. a)
b)
c)
2. a)
b)
c)3. 04. a)
b) 0c)d)
5. a)
b)
c)
6. a)
b)
c)
7. a)b)c) 0
8. negative
9. a)
b) fastest: months, months,months, months;
slowest: months, months,months, months,months
c) mice per owl s10. a) i) 0.25 t h
ii) t hiii) 0.2612 t h
b) The estimate calculated in part iii) isthe most accurate. The smaller theinterval, the more accurate the estimate.
11. a)
b) half of one cyclec) cm sd) The bob is moving the fastest when it
passes through its rest position. You cantell because the images of the balls arefarthest apart at this point.
e) The pendulum’s rest position is halfwaybetween the maximum and minimumvalues on the graph. Therefore, at thispoint, the pendulum’s instantaneousrate of change is at its maximum.
12. a) 0b) m s
13. a)
b) 0.2 radians sc) Answers may vary. For example,
d) and 814. Answers may vary. For example, for
the instantaneous rate of change ofis approximately 0.9003,
while the instantaneous rate of change ofis approximately 2.7009.
(The interval was used.) Therefore, the instantaneous rate of changeof is at its maximum threetimes more than the instantaneous rate ofchange of However, thereare points where the instantaneous rate ofchange is the same for the two functions.For example, at it is 0 for bothfunctions.
15. a) 0, 1, 0, and b)
The function is Based onthis information, the derivative of
is 16. a) 0, 1, 0, and 0
b)
The function is Basedon this information, the derivative of
is
Chapter Review, pp. 376–377
1.
2.
3. a) radians
b) radians
c) radians
d) radians
4. a) 45° c) 480°b) d)
5. a) c)
b) d)
6. a)
b)
c)7. 2.00
about 5.14
sec u 5 2135
tan u 512
13
7p
6
4p
3
3p
4
5p
6
2120°2225°
7p
3
8p
9
25p
18
p
9
70p
33
16
2sin x.f (x) 5 cos x
f (x) 5 2sin x.
y
x
–4
–2–– –
–6
2
0
4
2p
2p pp
23p
23p
21,cos x.f (x) 5 sin x
f (x) 5 cos x.
y
x
–4
–2–– –
–6
2
0
4
2p
2p pp
23p
23p
2121,
x 5p2 ,
f (x) 5 sin x.
f (x) 5 3 sin x
2p4 , x ,
p4
f (x) 5 3 sin x
f (x) 5 sin x
x 5 0,t 5 0, 2, 4, 6,
about 223 radians>s.
>
u
t–0.05–0.10–0.15
–0.20
0.050.100.15
0
0.20
2 3 4 5 6 7 81
>20.5
>214.4
x4
8
0
–8
–40.4 0.6 0.8 1.0
Time (s)
Dis
tanc
e fr
om re
st p
osit
ion
(cm
)
0.2
y
>>about 0.2588
>>about 1.164
t 5 48t 5 36t 5 24
t 5 12t 5 0t 5 42t 5 30
t 5 18t 5 6
R(t) 5 4.5 cos a p
12tb 1 20.2
about 21.310about 20.7459
x 53
2x 5
1
2,
x 5 1x 5 0,
x 53
4x 5
1
4,
5p
4, x ,
3p
2
p
4, x ,
p
2,
p , x ,5p
40 , x ,
p
4,
p , x ,3p
20 , x ,
p
2,
about 21.554about 20.5157
about 0.465
x 5 2px 5 0,
x 55p
2x 5
p
2,
x 55p
4x 5
p
4,
5p
2, x , 3p
p
2, x ,
3p
2,
3p
2, x ,
5p
22
p
2, x ,
p
2,
p , x , 2p0 , x , p,
D(t) 5 8 cos Q p360 tR 1 300
D(t) 5 15 cos (2pt) 1 300;
D(t) 5 15 cos Qp30 tR 1 300;
304 , t , 3650 , t , 111
(t 2 116)b 1 1.4,T(t) 5 16.2 sin a 2p
365
y 8 13.87 hours
y 5 3.7 sin a 2p
365xb 1 12
x
20
40
60
0
yH
eigh
t ab
ove
the
grou
nd (m
)
Time (min)
1 2 3 4 5 6 7
, 6.52 min5.98 min , t, t , 4.02 min,3.48 min
0.98 min , t , 1.52 min,

NEL658 Answers
8. a) radiansb) radiansc) radians
9.
10.
11. a) reflection in the x-axis, vertical stretchby a factor of 19, vertical translation 9 units down
b) horizontal compression by a factor of horizontal translation to the left
c) vertical compression by a factor of
horizontal translation to the right,
vertical translation 3 units upd) reflection in the x-axis, reflection in the y-
axis, horizontal translation to the right12. a)
b)
c)
d)
13. a) radiansb) radiansc) radians
14. a) the radius of the circle in which thebumblebee is flying
b) the time that the bumblebee takes to fly one complete circle
c) the height, above the ground, of thecentre of the circle in which thebumblebee is flying
d) cosine function
15.
16.
17. a)b)
c)
18. a)
b)
c)
19. a) s
b) the time between one beat of a person’sheart and the next beat
c) 140d)
Chapter Self-Test, p. 378
1.2.3.4. C per day
5. 110°, 113°, and
6.
7.
8. a)
b) C per hourc) C per hour
Cumulative Review Chapters 4–6,pp. 380–383
1. (d) 9. (c) 17. (d) 25. (b)2. (b) 10. (c) 18. (b) 26. (d)3. (a) 11. (d) 19. (b) 27. (a)4. (c) 12. (a) 20. (b) 28. (c)5. (a) 13. (d) 21. (d) 29. (b)6. (b) 14. (c) 22. (c)7. (a) 15. (d) 23. (a)8. (c) 16. (a) 24. (d)
30. a) If x is the length in centimetres of a sideof one of the corners that have been cutout, the volume of the box is
cm3.b) 5 cm or 10 cmc) x 7.4 cmd)
31. a) The zeros of are or The zero of is The zero of
is does not have any
zeros.
b) has a hole at no asymptotes.
has an asymptote at and
c)
32. a) Vertical compressions and stretches donot affect location of zeros; maximumand minimum values are multipliedby the scale factor, but locations areunchanged; instantaneous rates ofchange are multiplied by the scalefactor.
Horizontal compressions and stretchesmove locations of zeros, maximums,and minimums toward or away fromthe y-axis by the reciprocal of the scalefactor; instantaneous rates of change aremultiplied by the reciprocal of scalefactor.Vertical translations change location ofzeros or remove them; maximum andminimum values are increased ordecreased by the amount of thetranslation, but locations areunchanged; instantaneous rates ofchange are unchanged.Horizontal translations move locationof zeros by the same amount as thetranslation; maximum and minimumvalues are unchanged, but locations aremoved by the same amount as thetranslation; instantaneous rates ofchange are unchanged, but locations aremoved by the same amount as thetranslation.
b) For the answer is the same asin part a), except that a horizontalreflection does not affect instantaneousrates of change. For theanswer is also the same as in part a),except that nothing affects themaximum and minimum values, sincethere are no maximum or minimumvalues for
Chapter 7
Getting Started, p. 386
1. a) 1 d) or
b) e)
c) 8 or f )
2. To do this, you must show that the two distances are equal:
Since the distances are equal, the line segments are the same length.
3. a)
b) radiansc) 61.9°
0.5
cot A 515
8sec A 5
17
15,csc A 5
17
8,
tan A 58
15,cos A 5
15
17,sin A 5
8
17,
DCD 5 #Q0 212R
21 (6 2 5)2 5
!5
2.
DAB 5 #(2 2 1)2 1 Q12 2 0R
25
!52
;
3 6 "216
23
21 6 "2222
7
25
2
2
3
y 5 tan x.
y 5 tan x,
y 5 cos x,
y 5 2xg(x)
f (x):y 5 x 2 2,
f (x)
g(x):x 5 1;
y 5 0.
x 5 2g(x)
f (x)
x 5 3;f (x)
g(x)
g(x)
f (x)x 5 2.
f (x)
g(x)
x 5 3.g(x)
x 5 3.x 5 2f (x)
3 , x , 12.88
(50 2 2x) (40 2 2x)x
about 0 °about 0.5 °
23cos a p
12xb 1 22
y 8 230
y 5 sin ax 15p
8b
2p
3
5p
8,
3p
5,
about 0.31 °y 8 108.5sec 2p
y 5 sec x
2129
x 53
4
x 57
8x 5
38
,
x 55
8x 5
1
8,
x 51
2x 5 0,
7.5p , x , 12.5p
0 , x , 2.5p,x , 17.5p12.5p ,
2.5p , x , 7.5p,10p , x , 15p0 , x , 5p,
h(t) 5 30 sin a5p
3t 2
p
2b 1 150
P(m) 5 7250 cos ap
6 mb 1 7750
p
2p
2p
1
80
1240
160
y
x0
3
1240
4
5
1
2
–1
–3
–2
–4
–5
1120
180
160
p
p9
1011,
p12
110,
y 5 23 cos a2ax 1p
4bb 2 1
y 5 5 sin ax 1p
3b 1 2
p
2p
2p
Related Documents


![Untitled-1 [talwargallery.com]€¦ · It is ironic that this blockbuster- ish splash should be made for the least flashy of women. Moham- edi's untitled, undated, under- stated works](https://static.cupdf.com/doc/110x72/5fcdb29fa5102806f33c979f/untitled-1-it-is-ironic-that-this-blockbuster-ish-splash-should-be-made-for.jpg)