44 CHAPTER-3 RESEARCH METHODOLOGY 3.1 INTRODUCTION This chapter shall elaborate on the methodology adopted by the researcher to conduct the proposed study. This chapter shall throw light on the research design adopted, nature of data collected, sources of data, the sampling plan proposed to be used, the research instrument to be utilized for the research and details relating to the representation and analysis of the collected data. 3.2 RESEARCH DESIGN The proposed research study is descriptive in nature, covering manufacturing industries situated in Union Territory of Puducherry. 3.3 NATURE AND SOURCE OF DATA Both primary and secondary data have been used for this research. Primary data was collected using a well structured questionnaire, which was administered personally to the executives of manufacturing undertakings in Union Territory of Puducherry. Secondary data was collected from the findings of Published Papers, Articles, Books, Prior Studies, Organizations‘ Bulletins, Annual Reports of the manufacturing units and from various web sites. 3.4 DATA COLLECTION INSTRUMENT 3.4.1 Initial Items Generation The survey instrument was initially developed based on review of previous literature, which addressed the basic theoretical constructs of Business Environment Characteristics of Manufacturing undertakings, Advanced Manufacturing Technologies of Manufacturing undertakings, Competitive Priorities of Manufacturing undertakings and Business Performance of Manufacturing undertakings. These constructs were further sub-divided into various domains, each consisting of number of statements. The Business Environment Characteristics construct is divided into six domains namely, Labour Availability, Business cost, Competitive Hostilities, Dynamism, Political Environment and Government Laws and Regulations. Similarly, the Advanced Manufacturing Technologies construct is sub-divided into three domains namely, Advanced Manufacturing Technology Implementation, Direct Advanced Manufacturing

Welcome message from author
This document is posted to help you gain knowledge. Please leave a comment to let me know what you think about it! Share it to your friends and learn new things together.
Transcript

44
CHAPTER-3
RESEARCH METHODOLOGY
3.1 INTRODUCTION
This chapter shall elaborate on the methodology adopted by the researcher to
conduct the proposed study. This chapter shall throw light on the research design
adopted, nature of data collected, sources of data, the sampling plan proposed to be used,
the research instrument to be utilized for the research and details relating to the
representation and analysis of the collected data.
3.2 RESEARCH DESIGN
The proposed research study is descriptive in nature, covering manufacturing
industries situated in Union Territory of Puducherry.
3.3 NATURE AND SOURCE OF DATA
Both primary and secondary data have been used for this research. Primary data
was collected using a well structured questionnaire, which was administered personally to
the executives of manufacturing undertakings in Union Territory of Puducherry.
Secondary data was collected from the findings of Published Papers, Articles, Books,
Prior Studies, Organizations‘ Bulletins, Annual Reports of the manufacturing units and
from various web sites.
3.4 DATA COLLECTION INSTRUMENT
3.4.1 Initial Items Generation
The survey instrument was initially developed based on review of previous
literature, which addressed the basic theoretical constructs of Business Environment
Characteristics of Manufacturing undertakings, Advanced Manufacturing Technologies
of Manufacturing undertakings, Competitive Priorities of Manufacturing undertakings
and Business Performance of Manufacturing undertakings. These constructs were further
sub-divided into various domains, each consisting of number of statements.
The Business Environment Characteristics construct is divided into six domains
namely, Labour Availability, Business cost, Competitive Hostilities, Dynamism, Political
Environment and Government Laws and Regulations. Similarly, the Advanced
Manufacturing Technologies construct is sub-divided into three domains namely,
Advanced Manufacturing Technology Implementation, Direct Advanced Manufacturing

45
Technology and Indirect Advanced Manufacturing Technology. The third construct of
Competitive Priorities is divided into six domains namely, Quality, Cost, Delivery,
Flexibility, Customer Focus and Knowhow. The fourth and final construct of Business
Performance consists of five statements. Totally 109 variables were included in the
preliminary schedule, of which 37 were included in the first construct, 24 in the second
construct, 43 in the third construct, and 5 variables were included in the fourth and final
construct.
The executives of the manufacturing firms were asked to provide perceptual
information on the performance of their company. Dess and Robinson (1984) have
recommended the utilization of perceived measures if objective measures are not
available. It is difficult to collect financial data of manufacturing undertakings from the
executives as the data may be confidential. Further, the executives may not have the data
in their memory and may not be able to recall the desired data for the study when the
survey is undertaken. Swamidass and Newel (1987) have also confirmed the difficulties
of using objective measures of performance due to the reluctance of the companies to
provide financial data. Hence, the executives of manufacturing units have been required
to rate the comparative market share and growth of sales of their undertaking in relation
to their competitors, in a Likert‘s Five Point Scale. Vickery et al. (1993) has also used
perceptual information to study the trends of Return of Investment and Return on Sales of
undertakings. Hence, the researcher decided to use the perceived measurement of
performance of the manufacturing units.
3.4.2 Qualitative Inquiry
Researcher held extensive consultations with the research supervisor and other
subject experts and industrial experts in the field of Operations Management. An In-depth
interview was conducted with a panel of ten best academicians, consisting of four experts
from Operations Management, two Statisticians, two Finance experts, one English expert
and one representative of the State Government. These experts from top and eminent
institutions such as Pondicherry University, NIT Tiruchy, and Anna University, Chennai.
Furthermore, the researcher held extensive consultations with ten industrial experts in the
rank of Chief General Managers and Managers at operational level and got valuable
inputs in drafting the schedule.

46
3.4.3 Face Validity and Content Analysis
The experts consulted were requested to carefully go through the research
constructs in the light of the objectives of the research. The experts evaluated the 109
constructs and selected the constructs to be included for the study based on the
compatibility and, representativeness, suitability and importance of the constructs, and
the capacity of the constructs to match with domain area and yield best accurate results,
those constructs not satisfying these parameters shall be summarily rejected and removed
from the schedule. Further, additional constructs suggested by the experts shall be
included in the schedule. Furthermore, the experts were requested to evaluate the
complete schedule for its simplicity, clarity, unambiguity, composition of the schedule,
feasibility of obtaining the desired information from the respondents and the length of the
schedule, and accordingly refine the schedule. The refined scale was further improved
based on the suggestions of industrial experts. Upon the successful completion of this
process, the number of variables constituting the Business Environment Characteristics of
Manufacturing firms were reduced to five for Business cost domain, five for Labour
Availability domain, five for Competitive Hostilities domain, four in respect of
Government Laws and Regulations domain, five in respect of Political Environment and
four in respect of Dynamism. Similarly, the number of variables constituting the
Advanced Manufacturing Technologies construct is arrived at six for Advanced
Manufacturing Technology Implementation domain, six for Direct Advanced
Manufacturing Technology domain and five in respect of the Indirect Advanced
Manufacturing Technology domain. The number of variables constituting the third
construct of Competitive Priorities is fixed at six for Quality domain, five for Cost
domain, five for Delivery domain, four for Flexibility domain, four for Customer Focus
and six in respect of the Knowhow domain. The fourth and final construct of Business
Performance consists of five variables without any sub-divisions of domains.
Hence, the total number of variables pertaining to Business Environment
Characteristics was reduced to 28, while those relating to Advanced Manufacturing
Technologies were reduced to 17, those relevant to Competitive Priorities were reduced
to 30 and the number of variables relating to Business Performance of the Manufacturing
undertakings was arrived at 5. Hence, the total numbers of constructs were reduced from

47
109 to 80. Further, the number of questions relating to the industrial profile of the
manufacturing units studied was enhanced from 10 to 13.
3.4.4 Pilot Study
Prior to the full-fledged resumption of the research process, a pilot study was
conducted on some 52 manufacturing undertakings located in Puducherry. Based on the
feedback obtained from the Pilot study, the researcher made minor modifications in the
questions pertaining to the industrial profile of the manufacturing units studied. These
questions were redesigned in statement forms to accommodate the respondent‘s
recommendations. Further, based on their feedback, some technical terms which were not
easily understandable for the respondents were suitably modified and substituted with
simpler terms.
Based on the inputs obtained from the Pilot study, the final schedule was drafted.
The final schedule consisted of five sections. The first section consisted of 13 questions
relating to the industrial profile of the units studied, while the second section consisted of
28 key determining variables to measure the business environment characteristics of the
manufacturing units. The third section endeavours to measure the advanced
manufacturing technologies of the manufacturing undertakings with the help of 17
variables in respect of 3 domains, while the fourth section tries to measure the
competitive priorities of the manufacturing units through 30 variables. The fifth and final
section consists of 5 key determining variables to measure the business performance of
the manufacturing undertakings. Five point Likert‘s Scale has been used in respect of
these 80 variables, with the scale values ranging from low level of priority attached to
high level of priority.
3.4.5 Reliability test for Data Collection Instrument
The next step is to test the reliability of the schedule. Reliability shall reveal the
accuracy and consistency of the results from the survey instrument. The result of the Pilot
study was tested for Reliability using the Cronbach alpha and the value of reliability was
found to be more than satisfactory level of 0.6 in respect of all the categories.
In addition to testing the reliability, the researcher has also tested the
Communality, which measures the percent of variance explained by the factors in a given
item. Furthermore, the researcher has tested the Normality, which indicates the normal

48
distribution of the data. While plotting the data in a graph, if a bell shaped curve is
arrived at, then the mean value is 0 and the value of standard deviation is 1, which
indicates that there is a standard normal distribution of the data (Lewis-Beck, Bryman &
Liao, 2004; Groebner & Shannon, 1990). Testing Normality is absolutely important for
multivariate data analysis (Hair et al. 2006).
The researcher then proceeded to test the Homogeneity of the data, which shall
indicate the uniqueness of the population. In addition, the researcher proceeded to test the
Multicollinearity, which presence when more than two independent variables represent
the common thing. Tabachnick & Fidell (2007) in his study suggested items from the
same construct in the data set, the correlation value higher than 0.90 between any
variables will create some problematic conditions in analysis. If it is more than above
author suggested value it is better to exclude a particular item is advisable. To evaluate
Multicollinearity, item to item correlations were calculated between each item. It helps to
solve the multicollinearuty problem in the data set.
Next, the researcher tested the Linearity of data, which reveals the existence of
linear relationships among the variables, which is important in multivariate analysis
techniques. Most multivariate techniques (including covariance structure modeling)
employed in this study implicitly believe that relationships between variables are linear.
Departures from linearity have an effect on calculated correlations between variables in
this study were carefully evaluated the linearity. The next step is to test the Individual
item reliability using factor loading to analyse the individual reliability of the variables.
Carmines and Zeller (1979) proposed factor loadings greater than or equal to 0.707.
However, several authors (Barclay et al., 1995; Chin, 1998) recommended that this
principle not to be supposed to strictly followed in exploratory studies; in some
circumstances factor loadings up to 0.5 or 0.6 can be accepted.
The next step is to test the Construct reliability, which sure that the internal
consistency of all the variables when they compute the similar idea by assessing how
aggressively the observable variables evaluate the latent variable (Fornell and Larcker,
1981). Construct reliability value should be more than 0.6 and it shows acceptable
reliability of the measurement items (Chen and Paulraj, 2004; Nunnally, 1978; Cronbach,
1951). Further, the researcher has proceeded to test the Convergent validity, which

49
establishes the relationship between observed constructors. It is the process of analyzing
scores of one constructor correlated with the scores of another measure, may be similar or
different. Fornell and Larcker (1981) assessed convergent validity, by using the average
variance extracted (AVE) and value should be 0.5 or above. The researcher has also
tested the Discriminant validity, which specifies that how much the given construct with
another construct in a model. This validity can be calculated by matching the AVE value
with the square of the correlations of the constructs.
3.5 SAMPLING
3.5.1 Sample Frame
Union Territory of Puducherry is the sample frame for the study. All the four
regions of Union Territory namely, Puducherry, Karaikal, Yanam, and Mahe. With a
current population of 11.1 lakhs and existence of well established 72 large scale
industries, 176 medium scale industries and 7950 small scale industries and the this
number being on the ever increase, offers tremendous scope for choosing Puducherry as
the sample frame for the study.
3.5.2 Sample Population
Business units engaged in manufacturing and those located in the four regions of
Pondicherry, Karaikal, Mahe and Yanam shall be the sample population for this study.
executives with titles of Directors, Chief Executives, Managing Directors, General
Managers and Senior Level Managers who have the leadership in different functional
areas like Operations, Marketing, Human Resources and Finance shall constitute the
sample population, from which sample shall be drawn for the conduct of this study.
3.5.3 Sample technique
The sample technique used for the study is Simple Random sampling method.
The names of 8588 units engaged in manufacturing as on 2011 were listed out and 365
sample units were drawn from this list using the Lottery Method.
3.5.4 Sample size
The most important part of any research is the proper calculation of appropriate
sample size for the survey. In the present research work, the formula
205.096.1 n has been used to calculate the appropriate sample size for the
study. Pilot study was conducted on manufacturing firms located in Puducherry. Based
50
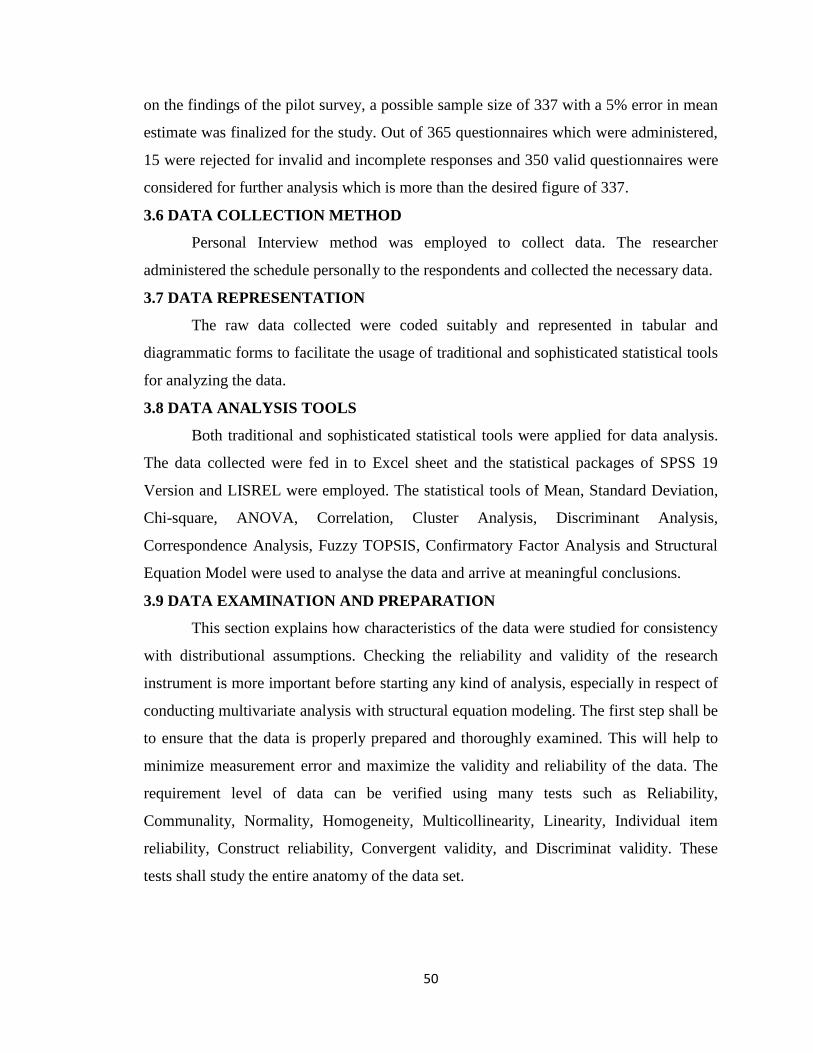
on the findings of the pilot survey, a possible sample size of 337 with a 5% error in mean
estimate was finalized for the study. Out of 365 questionnaires which were administered,
15 were rejected for invalid and incomplete responses and 350 valid questionnaires were
considered for further analysis which is more than the desired figure of 337.
3.6 DATA COLLECTION METHOD
Personal Interview method was employed to collect data. The researcher
administered the schedule personally to the respondents and collected the necessary data.
3.7 DATA REPRESENTATION
The raw data collected were coded suitably and represented in tabular and
diagrammatic forms to facilitate the usage of traditional and sophisticated statistical tools
for analyzing the data.
3.8 DATA ANALYSIS TOOLS
Both traditional and sophisticated statistical tools were applied for data analysis.
The data collected were fed in to Excel sheet and the statistical packages of SPSS 19
Version and LISREL were employed. The statistical tools of Mean, Standard Deviation,
Chi-square, ANOVA, Correlation, Cluster Analysis, Discriminant Analysis,
Correspondence Analysis, Fuzzy TOPSIS, Confirmatory Factor Analysis and Structural
Equation Model were used to analyse the data and arrive at meaningful conclusions.
3.9 DATA EXAMINATION AND PREPARATION
This section explains how characteristics of the data were studied for consistency
with distributional assumptions. Checking the reliability and validity of the research
instrument is more important before starting any kind of analysis, especially in respect of
conducting multivariate analysis with structural equation modeling. The first step shall be
to ensure that the data is properly prepared and thoroughly examined. This will help to
minimize measurement error and maximize the validity and reliability of the data. The
requirement level of data can be verified using many tests such as Reliability,
Communality, Normality, Homogeneity, Multicollinearity, Linearity, Individual item
reliability, Construct reliability, Convergent validity, and Discriminat validity. These
tests shall study the entire anatomy of the data set.

51
3.9.1 Reliability
Internal consistency of the data can be verified using Reliability test. Cronbach
alpha has been applied to verify the internal consistency and reliability of the data.
Cronbach coefficient alpha is commonly used to measure the reliability of a set of two or
more construct indicators (Cronbach, 1951). It is calculated on the internal consistency
based on average correlation among items. The value of Cronbach alpha should exceed
the threshold limit of 0.60 to consider the data as reliable (Nunnally, 1978). Cronbach's
alpha value is directly related to the number of items. More the number of items included
in the study, higher shall be the. The Cronbach's alpha value in respect of various items
included in this study is displayed in the following table.
Table 3.1 Cronbach's alpha reliability test for Business Environment
Characteristics domains
SL.
No
Variables Cronbach's
Alpha if
Item Deleted
Cronbach'
s Alpha
Business cost
1 Mounting labor cost .846
.848
2 Mounting material cost .818
3 Mounting transportation cost .813
4 Mounting utility cost .812
5 Mounting rent .793
Labour availability
6 Scarcity of managerial Personnel .883
.903
7 Dearth of technicians .884
8 Deficiency of clerical Personnel .876
9 Scarcity of skilled and Specialized Personnel .879
10 Shortage of Direct Labour .884
Competitive hostility
11 Stumpy profit margins .870
.896
12 Dilapidating Local demand .865
13 Dilapidating International demand .861
14 Dilapidating Product Standards .888
15 Dilapidating Quality of Acquired Inputs .877
Government laws and regulations
16 Complex governmental regulations and
procedures .833
.863 17 Ambiguous government laws and regulations .814
18 Red Tapism and Delays .804
19
Government‘s protectionism Policy Towards
Industries .848

52
Table 3.1 Cronbach's alpha reliability test for Business Environment
Characteristics domains (continued)
SL.
No
Variables Cronbach's
Alpha if
Item Deleted
Cronbach'
s Alpha
Political environment
20 Country balance of payment status .874
.889
21 Bilateral and Multi-lateral Governmental
Agreements .857
22 Nation‘s Political Stability .861
23 Regulatory Mechanism for Protecting Investments .865
24 Military Coalitions with fellow countries .867
Dynamism
25 Tempo of innovative operations processes .827
.834 26 Changing customer Aspirations in the industry .763
27 Emerging challenges from competitors .754
28 Rate of information diffusion .778
The above table displays that the value of Cronbach's α coefficient of all the
factors included under the BEC domains range from 0.834 to 0.903. This establishes the
reliability of all the factors included under the BEC domain. Furthermore, the estimated
value of Cronbachs Alpha in respect of all the variables exceeds the ―Alpha if Item
Deleted" value and hence, no item needs to be dropped from the study.
Table 3.2 Cronbach's alpha reliability test for AMT domains
SL.
No Variables
Cronbach's
Alpha if Item
Deleted
Cronbach's
Alpha
AMT implementation
1 Planning .889
.895
2 Requirement Analysis .870
3 Cost/Benefit Analysis .870
4 Technology assessment .873
5 Development and Implementation .870
6 Training .884
Direct AMT
7 Computer numerical control (CNC) machines .882
.890 8 Robotics (Ro) .873
9 Flexible manufacturing system (FMS) .870
10 Automated material handling systems (AMHS) .866

53
Table 3.2 Cronbach's alpha reliability test for AMT domains (continued)
SL.
No Variables
Cronbach's
Alpha if Item
Deleted
Cronbach's
Alpha
11 Automated guided vehicles (AGV) .862
12 Rapid prototyping (RP) .874
Indirect AMT
13 Computer aided design (CAD) .902
.912
14 Material requirement planning (MRP) .883
15 Statistical process control (SPC) .879
16 Bar coding (BC) .893
17 Material resource planning (MRPII) .900
The above table displays that the Cronbach's α coefficient of all the factors
included under the AMT domain range from 0.890 to 0.912. This indicates that all the
factors included under the AMT domain have good internal consistency. Similarly, the
estimated value of Cronbachs Alpha value exceeds the ―Alpha if Item Deleted" value in
respect of all the items and hence all the items included under the three factors need not
be dropped from the study.
Table 3.3 Cronbach's alpha reliability test for Competitive Priority domains
SL.
No Variables
Cronbach's Alpha
if Item Deleted
Cronbach's
Alpha
Quality
1 Low defect rate .877
.877
2 Performance quality .846
3 Product Reliability .836
4 Environmental aspect .861
5 Certification .860
6 Product durability .855
Cost
7 Low costs .797
.830
8 Value added costs .780
9 Quality costs .779
10 Activity based measurement .795
11 Continuous improvement .828
Delivery
12 Fast delivery .855
.872 13 On time delivery .834
14 Right quality .840
54
Table 3.3 Cronbach's alpha reliability test for Competitive Priority domains
(continued)
SL.
No Variables
Cronbach's Alpha
if Item Deleted
Cronbach's
Alpha
15 Right amount .833
16 Dependable promises .863
Flexibility
17 Design adjustments .772
.804 18 Volume change .715
19 Product Mix changes .754
20 Broad product line .777
Customer focus
21 After sales service .833
.842 22 Product customization .773
23 Customer information .782
24 Measurement of satisfaction .777
Know how
25 Knowledge management .908
.916
26 Creativity .894
27 Continuous learning .894
28 Problem solving skills .897
29 Training/education .901
30 R&D .909
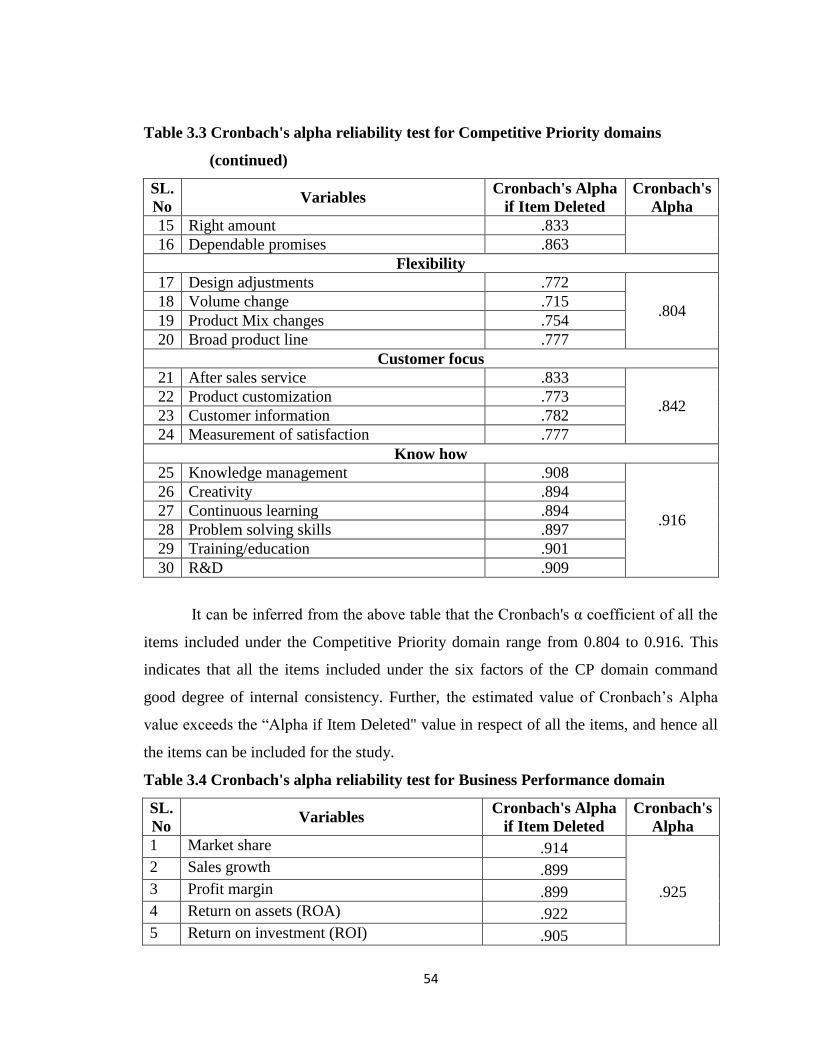
It can be inferred from the above table that the Cronbach's α coefficient of all the
items included under the Competitive Priority domain range from 0.804 to 0.916. This
indicates that all the items included under the six factors of the CP domain command
good degree of internal consistency. Further, the estimated value of Cronbach‘s Alpha
value exceeds the ―Alpha if Item Deleted" value in respect of all the items, and hence all
the items can be included for the study.
Table 3.4 Cronbach's alpha reliability test for Business Performance domain
SL.
No Variables
Cronbach's Alpha
if Item Deleted
Cronbach's
Alpha
1 Market share .914
.925
2 Sales growth .899
3 Profit margin .899
4 Return on assets (ROA) .922
5 Return on investment (ROI) .905
55
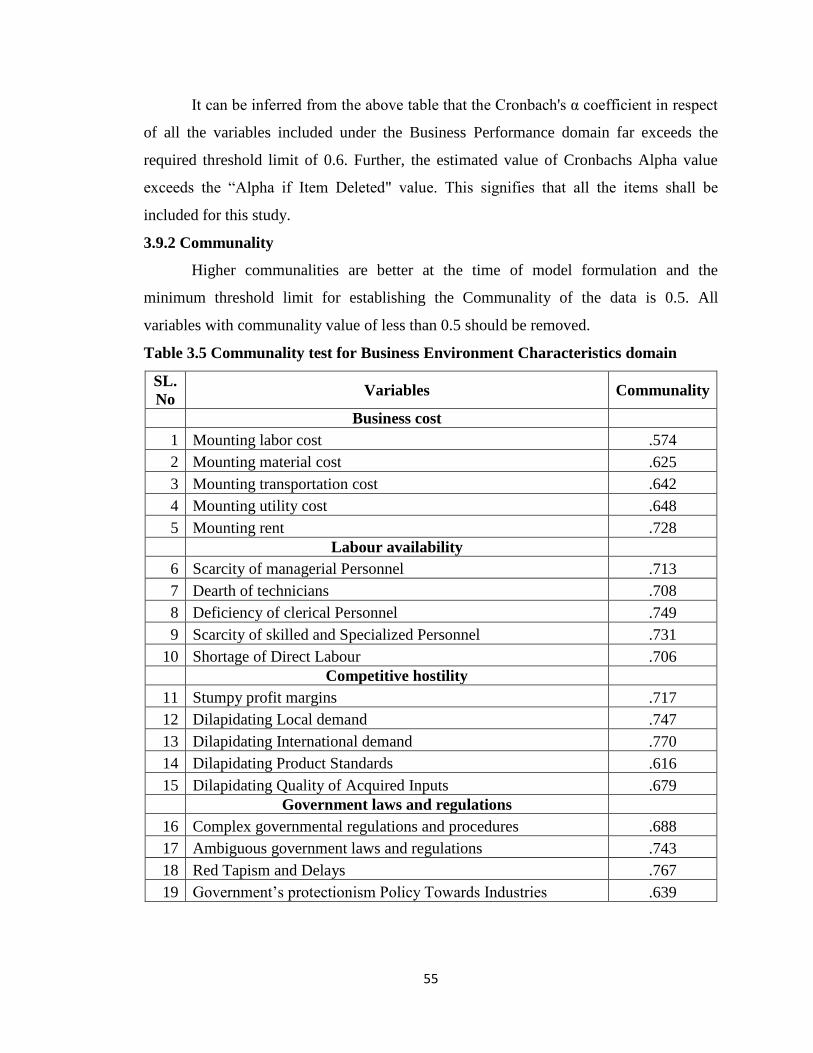
It can be inferred from the above table that the Cronbach's α coefficient in respect
of all the variables included under the Business Performance domain far exceeds the
required threshold limit of 0.6. Further, the estimated value of Cronbachs Alpha value
exceeds the ―Alpha if Item Deleted" value. This signifies that all the items shall be
included for this study.
3.9.2 Communality
Higher communalities are better at the time of model formulation and the
minimum threshold limit for establishing the Communality of the data is 0.5. All
variables with communality value of less than 0.5 should be removed.
Table 3.5 Communality test for Business Environment Characteristics domain
SL.
No Variables Communality
Business cost
1 Mounting labor cost .574
2 Mounting material cost .625
3 Mounting transportation cost .642
4 Mounting utility cost .648
5 Mounting rent .728
Labour availability
6 Scarcity of managerial Personnel .713
7 Dearth of technicians .708
8 Deficiency of clerical Personnel .749
9 Scarcity of skilled and Specialized Personnel .731
10 Shortage of Direct Labour .706
Competitive hostility
11 Stumpy profit margins .717
12 Dilapidating Local demand .747
13 Dilapidating International demand .770
14 Dilapidating Product Standards .616
15 Dilapidating Quality of Acquired Inputs .679
Government laws and regulations
16 Complex governmental regulations and procedures .688
17 Ambiguous government laws and regulations .743
18 Red Tapism and Delays .767
19 Government‘s protectionism Policy Towards Industries .639

56
Table 3.5 Communality test for Business Environment Characteristics domain
(continued)
SL.
No Variables Communality
Political environment
20 Country balance of payment status .648
21 Bilateral and Multi-lateral Governmental Agreements .734
22 Nation‘s Political Stability .711
23 Regulatory Mechanism for Protecting Investments .694
24 Military Coalitions with fellow countries .685
Dynamism
25 Tempo of innovative operations processes .567
26 Changing customer Aspirations in the industry .747
27 Emerging challenges from competitors .764
28 Rate of information diffusion .712
It can be observed from the above table that the communality value in respect of
all the items exceed the threshold limit of 0.5 and hence all items may be included for the
proposed study.
Table 3.6 Communality test for Advance Manufacturing Technology domain
SL.
No Variables Communality
AMT Implementation
1 Planning .546
2 Requirement Analysis .704
3 Cost/Benefit Analysis .709
4 Technology assessment .680
5 Development and Implementation .706
6 Training .597
Direct AMT
7 Computer numerical control (CNC) machines .558
8 Robotics (Ro) .643
9 Flexible manufacturing system (FMS) .668
10 Automated material handling systems (AMHS) .705
11 Automated guided vehicles (AGV) .744
12 Rapid prototyping (RP) .618

57
Table 3.6 Communality test for Advance Manufacturing Technology domain
(continued)
SL.
No Variables Communality
Indirect AMT
13 Computer aided design (CAD) .682
14 Material requirement planning (MRP) .790
15 Statistical process control (SPC) .812
16 Bar coding (BC) .745
17 Material resource planning (MRPII) .728
It can be observed from the above table that the communality value in respect of
all the items exceed the threshold limit of 0.5 and hence all items may be included for the
proposed study.
Table 3.7 Communality test for Competitive Priority domain
SL.
No Variables Communality
Quality
1 Low defect rate .477
2 Performance quality .693
3 Product Reliability .768
4 Environmental aspect .593
5 Certification .597
6 Product durability .634
Cost
7 Low costs .598
8 Value added costs .678
9 Quality costs .660
10 Activity based measurement .619
11 Continuous improvement .456
Delivery
12 Fast delivery .619
13 On time delivery .721
14 Right quality .688
15 Right amount .725
16 Dependable promises .571

58
Table 3.7 Communality test for Competitive Priority domain (continued)
SL.
No Variables Communality
Flexibility
17 Design adjustments .584
18 Volume change .727
19 Product Mix changes .640
20 Broad product line .580
Customer focus
21 After sales service .503
22 Product customization .753
23 Customer information .737
24 Measurement of satisfaction .753
Know how
25 Knowledge management .642
26 Creativity .759
27 Continuous learning .767
28 Problem solving skills .741
29 Training/education .699
30 R&D .624
It can be observed from the above table that the communality value in respect of
all but one items exceed the threshold limit of 0.5 and hence all but that one items may be
included for the proposed study. The communality value in respect of low defect rate is
below 0.5 and hence this item is dropped from the study.
Similarly, the communality value in respect of the item ―Continuous
improvement‖ is less than the recommended value of 0.5 and hence this item is also
dropped from the study.
Table 3.8 Communality test for Business Performance domain
SL.
No Variables Communality
1 Market share .737
2 Sales growth .824
3 Profit margin .824
4 Return on assets (ROA) .677
5 Return on investment (ROI) .791

59
The above table displays that the communality value in respect of all the items far
exceed the minimum desirable value of 0.5 and hence all the items may be included for
the study without dropping any of them.
3.9.3 Normality
In general terms, normality specifies that the data are normally distributed.
Normally distributed data will result in the formation of a bell-shaped curve. Data with
high Normality will yield a mean of zero and standard deviation of one. (Groebner &
Shannon, 1990; Lewis-Beck et al. 2004). Normality of data is indispensable for arriving
at SEM using LISREL and lack of normality will adversely affect the goodness-of-fit
indices and standard error (Hair et al. 2006; Jöreskog and Sörbom, 1996; Baumgartner
and Homburg, 1996). Hence, the normality of data has been tested and the results are
discussed in the following sections. Normality of data can be tested using Kurtosis and
Skewness. Skewness may be positive (if the tail of the curve points towards left) or
negative (if the tail of the curve points towards right) (Groebner & Shannon, 1990).
Similarly, Kurtosis indicates the peakedness of the distribution curve. Positive Kurtosis
will lead to the curve with high peak, while negative Kurtosis will lead to a flat curve
(Everitt, 2006). Kurtosis should be in the range of +3 and -3, while Skewness should be
in the range of +1 to -1 (Lewis-Beck et al. 2004; Hair et al. 2006).
Table 3.9 Normality test for Business Environment Characteristics domain
SL.
No Variables Skewness Kurtosis
Business cost
1 Mounting labor cost -0.549 0.127
2 Mounting material cost -0.212 -1.219
3 Mounting transportation cost -0.439 -0.93
4 Mounting utility cost -0.414 -0.856
5 Mounting rent -0.333 -1.23
Labour availability
6 Scarcity of managerial Personnel 0.32 -0.136
7 Dearth of technicians 0.353 -0.322
8 Deficiency of clerical Personnel 0.421 -0.471
9 Scarcity of skilled and Specialized Personnel 0.199 -0.726
10 Shortage of Direct Labour 0.314 -0.783

60
Table 3.9 Normality test for Business Environment Characteristics domain
(continued)
SL.
No Variables Skewness Kurtosis
Competitive hostility
11 Stumpy profit margins -0.677 -0.389
12 Dilapidating Local demand -0.709 -0.396
13 Dilapidating International demand -0.635 -0.477
14 Dilapidating Product Standards -0.905 0.624
15 Dilapidating Quality of Acquired Inputs -0.912 0.378
Government laws and regulations
16 Complex governmental regulations and procedures -0.134 -0.583
17 Ambiguous government laws and regulations 0.041 -0.555
18 Red Tapism and Delays -0.04 -0.712
19 Government‘s protectionism Policy Towards Industries -0.091 -0.545
Political environment
20 Country balance of payment status 0.142 -0.225
21 Bilateral and Multi-lateral Governmental Agreements 0.061 -0.722
22 Nation‘s Political Stability 0.072 -0.513
23 Regulatory Mechanism for Protecting Investments 0.013 -0.698
24 Military Coalitions with fellow countries 0.094 -0.712
Dynamism
25 Tempo of innovative operations processes -0.493 -0.101
26 Changing customer Aspirations in the industry -0.473 -0.128
27 Emerging challenges from competitors -0.639 0.287
28 Rate of information diffusion -0.414 -0.231
The above table shows that the data in respect of all the variables easily pass the
normality test as the Skewness value is in the range of +1 to -1 and the value of Skewness
ranges between +3 and -3. Hence, all the variables are normally distributed.
Table 3.10 Normality test for Advance Manufacturing Technology domains
SL.
No Variables Skewness Kurtosis
Implementation AMT
1 Planning -0.847 0.283
2 Requirement Analysis -0.665 -0.322
3 Cost/Benefit Analysis -0.631 -0.446
4 Technology assessment -0.776 0.066
5 Development and Implementation -0.724 -0.185
6 Training -0.759 -0.297

61
Table 3.10 Normality test for Advance Manufacturing Technology domains
(continued)
SL.
No Variables Skewness Kurtosis
Direct AMT
7 Computer numerical control (CNC) machines 0.623 -0.495
8 Robotics (Ro) 1.12 0.154
9 Flexible manufacturing system (FMS) 1.012 -0.3
10 Automated material handling systems (AMHS) 1.103 -0.179
11 Automated guided vehicles (AGV) 1.303 0.498
12 Rapid prototyping (RP) 0.806 0.08
Indirect AMT
13 Computer aided design (CAD) 0.556 -1.2
14 Material requirement planning (MRP) 0.156 -1.206
15 Statistical process control (SPC) 0.254 -1.287
16 Bar coding (BC) 0.251 -1.444
17 Material resource planning (MRPII) -0.307 -0.853
The above table displays that the normality conditions in respect of the data is met
with the value of Kurtosis and Skewness falling within the desired range.
Table 3.11 Normality test for Competitive Priority domains
SL.
No Variables Skewness Kurtosis
Quality
1 Performance quality -0.839 0.326
2 Product Reliability -0.804 0.244
3 Environmental aspect -0.967 0.379
4 Certification -0.896 0.433
5 Product durability -0.767 0.061
Cost
6 Low costs 0.031 -0.595
7 Value added costs -0.426 0.02
8 Quality costs -0.626 0.289
9 Activity based measurement -1.146 0.353
Delivery
10 Fast delivery -1.045 1.326
11 On time delivery -1.155 1.279
12 Right quality -1.305 1.779
13 Right amount -1.097 1.055
14 Dependable promises -0.796 0.19

62
Table 3.11 Normality test for Competitive Priority domains (continued)
SL.
No Variables Skewness Kurtosis
Flexibility
15 Design adjustments -0.332 -0.388
16 Volume change -0.473 -0.745
17 Product Mix changes -0.549 0.127
18 Broad product line -0.631 -0.278
Customer focus
19 After sales service -0.484 -0.214
20 Product customization -0.512 -0.055
21 Customer information -0.457 -0.275
22 Measurement of satisfaction -0.421 -0.243
Know how
23 Knowledge management -0.886 0.345
24 Creativity -0.953 0.17
25 Continuous learning -0.996 0.409
26 Problem solving skills -1.054 0.465
27 Training/education -1.049 0.274
28 R&D -1.104 0.512
From the above table 3.11 the normality tests are conducted for six domains of
competitive priorities such as Quality, Cost, Delivery, Flexibility, Customer Focus and
Know-how the results shows that all the value are within the range of -2 to +2 of
skewness and kurtosis. This indicate that the above six domains are considered to be
normally distributed.
Table 3.12 Normality test for Business Performance domain
SL.
No Variables Skewness Kurtosis
1 Market share -0.355 -0.343
2 Sales growth -0.467 -0.419
3 Profit margin -0.329 -0.491
4 Return on assets (ROA) -0.144 -0.614
5 Return on investment (ROI) -0.088 -0.547
It can be observed from the above table that the data is normally distributed as the
desired norms relating to Skewness and Kurtosis is well met.

63
3.9.4 Linearity
Testing for linear relationships between the variables is important in multivariate
analysis techniques. Most multivariate techniques (including covariance structure
modeling) implicitly believe that relationships between variables are linear. Departures
from linearity have an effect on calculated correlations between variables. Statistical tools
such as regression, correlation and SEM can be performed only if the data is linear.
Table 3.13 Linearity test
Equation
Model Summary Parameter Estimates
R
Square F df1 df2 Sig. Constant b1 b2 b3
Linear .099 38.178 1 348 .000 2.178 .308
Logarithmic .096 37.042 1 348 .000 2.101 .970
Inverse .077 29.103 1 348 .000 4.015 -2.217
Quadratic .099 19.164 2 347 .000 1.940 .452 -.020
Cubic .099 12.739 3 346 .000 1.932 .461 -.023 .000
Compound .091 34.816 1 348 .000 2.241 1.099
Power .091 34.801 1 348 .000 2.177 .302
S .075 28.330 1 348 .000 1.377 -.702
Growth .091 34.816 1 348 .000 .807 .095
Exponential .091 34.816 1 348 .000 2.241 .095
Logistic .091 34.816 1 348 .000 .446 .910
Dependent Variable: Low costs
Independent Variable: Performance quality

64
Figure 3.1 Linearity test
The author has randomly picked two variables (low cost and performance quality)
to verify the Linearity of the data. The above table shows that the R2 value is 0.091,
which is high enough to denote that the data are linear.
3.9.5 Homogeneity
Homogeneity of data is a prerequisite to applying any statistical technique in all
research. Homogeneous data can be obtained from a unique population. Usually some
outside forces will affect, change and abrupt the data while carrying the research. Frankly
speaking maintaining homogeneity data is critical one. To test the homogeneity of the
data set, the author used one demographic variable of Nature of product dealt by the
enterprise and BEC domain.
Table 3.14 Test of Homogeneity of Variances for BEC domain
SL.
No
Variables Levene
Statistic
df
1 df2 Sig.
Business cost
1 Mounting labor cost 0.514 1 348 0.474
2 Mounting material cost 1.109 1 348 0.293
3 Mounting transportation cost 3.44 1 348 0.064
4 Mounting utility cost 0.777 1 348 0.379
5 Mounting rent 3.118 1 348 0.078

65
Table 3.14 Test of Homogeneity of Variances for BEC domain (continued)
SL.
No
Variables Levene
Statistic
df
1 df2 Sig.
Labour availability
6 Scarcity of managerial Personnel 0.526 1 348 0.469
7 Dearth of technicians 1.654 1 348 0.199
8 Deficiency of clerical Personnel 2.175 1 348 0.141
9 Scarcity of skilled and Specialized Personnel 1.326 1 348 0.25
10 Shortage of Direct Labour 2.455 1 348 0.118
Competitive hostility
11 Stumpy profit margins 0.034 1 348 0.854
12 Dilapidating Local demand 3.118 1 348 0.078
13 Dilapidating International demand 0.101 1 348 0.751
14 Dilapidating Product Standards 0.722 1 348 0.396
15 Dilapidating Quality of Acquired Inputs 0.34 1 348 0.56
Government laws and regulations
16 Complex governmental regulations and
procedures 0.062 1 348 0.804
17 Ambiguous government laws and regulations 0.721 1 348 0.396
18 Red Tapism and Delays 0.785 1 348 0.376
19 Government‘s protectionism Policy Towards
Industries 0.025 1 348 0.874
Political environment
20 Country balance of payment status 0.733 1 348 0.392
21 Bilateral and Multi-lateral Governmental
Agreements 1.654 1 348 0.199
22 Nation‘s Political Stability 2.91 1 348 0.089
23 Regulatory Mechanism for Protecting
Investments 1.409 1 348 0.236
24 Military Coalitions with fellow countries 2.51 1 348 0.114
Dynamism
25 Tempo of innovative operations processes 3.055 1 348 0.071
26 Changing customer Aspirations in the industry 3.863 1 348 0.05
27 Emerging challenges from competitors 2.85 1 348 0.09
28 Rate of information diffusion 2.978 1 348 0.085
The above table displays that, using Levene Statistic, there is no significant
relationship among all the factors studied. It can be seen that the value of significance in
respect of the demographic variable of Nature of Product dealt by the enterprise and BEC
domain is more than 0.05. This shows that there is no element of homogeneity present in
the data set. Hence, it can be said that the data are in Heterogeneous form.

66
Table 3.15 Test of Homogeneity of Variances for AMT domains
SL.
No
Variables Levene
Statistic df1 df2 Sig.
Implementation AMT
1 Planning 1.756 1 348 0.186
2 Requirement Analysis 1.203 1 348 0.273
3 Cost/Benefit Analysis 1.001 1 348 0.318
4 Technology assessment 1.123 1 348 0.255
5 Development and Implementation 0.268 1 348 0.605
6 Training 3.619 1 348 0.055
Direct AMT
7 Computer numerical control (CNC) machines 1.231 1 348 0.268
8 Robotics (Ro) 3.629 1 348 0.058
9 Flexible manufacturing system (FMS) 0.511 1 348 0.475
10 Automated material handling systems (AMHS 0.032 1 348 0.858
11 Automated guided vehicles (AGV) 3.151 1 348 0.077
12 Rapid prototyping (RP) 0.002 1 348 0.963
Indirect AMT
13 Computer aided design (CAD) 2.725 1 348 0.1
14 Material requirement planning (MRP) 1.374 1 348 0.242
15 Statistical process control (SPC) 2.582 1 348 0.109
16 Bar coding (BC) 1.347 1 348 0.247
17 Material resource planning (MRPII) 0.285 1 348 0.594
The above table shows that Levene Statistic is not significant among the factors as
the significance value in respect of the demographic variable of Nature of product dealt
by the enterprise and AMT exceeds 0.05, suggesting absence of homogeneity in the data
set.
Table 3.16 Test of Homogeneity of Variances for CP domains
SL.
No
Variables Levene
Statistic df1 df2 Sig.
Quality
1 Performance quality 1.732 1 348 0.189
2 Product Reliability 2.093 1 348 0.149
3 Environmental aspect 0.392 1 348 0.532
4 Certification 2.087 1 348 0.149
5 Product durability 0.369 1 348 0.544
Cost
6 Low costs 0.206 1 348 0.65
7 Value added costs 3.629 1 348 0.058
8 Quality costs 1.08 1 348 0.299
9 Activity based measurement 2.095 1 348 0.149

67
Table 3.16 Test of Homogeneity of Variances for CP domains (continued)
SL.
No
Variables Levene
Statistic df1 df2 Sig.
Delivery
10 Fast delivery 0.385 1 348 0.535
11 On time delivery 0.17 1 348 0.68
12 Right quality 0 1 348 0.987
13 Right amount 1.216 1 348 0.271
14 Dependable promises 0.166 1 348 0.684
Flexibility
15 Design adjustments 3.126 1 348 0.062
16 Volume change 1.093 1 348 0.297
17 Product Mix changes 0.514 1 348 0.474
18 Broad product line 3.719 1 348 0.055
Customer focus
19 After sales service 0.603 1 348 0.438
20 Product customization 0.866 1 348 0.353
21 Customer information 3.619 1 348 0.052
22 Measurement of satisfaction 2.751 1 348 0.098
Know how
23 Knowledge management 0.616 1 348 0.433
24 Creativity 0.008 1 348 0.928
25 Continuous learning 0.005 1 348 0.945
26 Problem solving skills 1.984 1 348 0.16
27 Training/education 2.169 1 348 0.142
28 R&D 0.088 1 348 0.766
The above table shows that Levene Statistic is not significant among the factors
and the value of significance in respect of the demographic variable of Nature of Product
dealt by the enterprise and CP domain exceed the 0.05 mark, suggesting the absence of
homogeneity in the data set.
Table 3.17 Test of Homogeneity of Variances for BP domain
SL.
No
Variables Levene
Statistic df1 df2 Sig.
1 Market share 3.111 1 348 0.063
2 Sales growth 3.752 1 348 0.054
3 Profit margin 3.719 1 348 0.055
4 Return on assets (ROA) 0.094 1 348 0.759
5 Return on investment (ROI) 0.462 1 348 0.497

68
It can be observed from the above table that the Levene Statistic is not significant among the factors. This suggests the
absence of homogeneity among the data. Hence, the data available can be used for statistical analysis.
3.9.6 Multicollinearity
Multicollinearity presents if two or more independent variables assess the same thing. Tabachnick & Fidell (2007)
suggested that the correlation values exceeds 0.90 in respect of variables in the same data set, can cause statistical problems
and such variables should be dropped from the study.
Table 3.18 Correlations for Business Environment Characteristics domain
1 2 3 4 5 6 7 8 9 10 11 12 13 14 15 16 17 18 19 20 21 22 23 24 25 26 27 28
1 1.00
2 0.37 1.00
3 0.50 0.50 1.00
4 0.42 0.57 0.56 1.00
5 0.50 0.65 0.59 0.60 1.00
6 0.29 0.18 0.20 0.24 0.23 1.00
7 0.35 0.23 0.28 0.25 0.26 0.67 1.00
8 0.27 0.16 0.21 0.24 0.25 0.68 0.65 1.00
9 0.30 0.20 0.19 0.21 0.21 0.62 0.65 0.68 1.00
10 0.29 0.11 0.13 0.20 0.16 0.63 0.60 0.66 0.68 1.00
11 0.14 0.38 0.30 0.33 0.32 0.13 0.13 0.04 0.06 0.05 1.00
12 0.23 0.37 0.34 0.35 0.31 0.14 0.16 0.08 0.06 0.06 0.70 1.00
13 0.16 0.32 0.31 0.31 0.33 0.16 0.11 0.05 0.06 0.07 0.73 0.69 1.00
14 0.17 0.30 0.35 0.30 0.28 0.10 0.09 0.07 0.06 0.09 0.53 0.61 0.58 1.00
15 0.17 0.25 0.30 0.23 0.30 0.18 0.18 0.08 0.08 0.09 0.59 0.62 0.66 0.60 1.00
16 0.21 0.08 0.10 0.12 0.03 0.39 0.38 0.34 0.39 0.44 0.05 0.00 0.02 0.07 0.12 1.00
17 0.15 0.17 0.15 0.14 0.12 0.41 0.43 0.40 0.48 0.47 0.08 0.05 0.05 0.12 0.20 0.63 1.00
18 0.20 0.06 0.09 0.06 0.04 0.45 0.40 0.39 0.50 0.46 -.01 -.02 -.01 0.05 0.06 0.63 0.69 1.00
19 0.07 0.06 0.04 0.05 -.02 0.30 0.31 0.33 0.33 0.36 -.03 -.06 -.08 0.01 0.04 0.53 0.57 0.61 1.00
20 0.06 0.11 0.10 0.18 0.09 0.32 0.25 0.34 0.32 0.39 0.05 0.02 0.03 0.10 0.08 0.32 0.40 0.41 0.41 1.00
21 0.09 -.04 0.02 0.06 0.01 0.33 0.28 0.36 0.27 0.42 -.03 -.02 -.05 0.03 0.04 0.42 0.42 0.47 0.49 0.63 1.00
22 0.12 0.00 -.01 0.02 -.07 0.33 0.30 0.36 0.37 0.37 -.09 -.06 -.10 0.05 0.00 0.44 0.40 0.45 0.44 0.60 0.62 1.00
23 0.07 -.09 -.02 0.00 -.13 0.30 0.25 0.37 0.28 0.39 -.10 -.03 -.09 0.01 0.06 0.42 0.36 0.45 0.51 0.53 0.68 0.66 1.00
24 0.05 0.00 -.02 0.04 0.00 0.36 0.28 0.38 0.34 0.43 -.06 -.03 -.03 0.05 0.04 0.34 0.39 0.43 0.40 0.60 0.63 0.63 0.59 1.00
25 0.17 0.26 0.32 0.30 0.33 0.12 0.09 0.12 0.09 0.09 0.10 0.18 0.04 0.14 0.10 0.22 0.11 0.16 0.13 0.25 0.18 0.13 0.08 0.09 1.00
26 0.39 0.40 0.45 0.42 0.42 0.21 0.20 0.17 0.20 0.18 0.22 0.31 0.20 0.23 0.13 0.24 0.15 0.18 0.08 0.23 0.16 0.15 0.11 0.11 0.44 1.00
27 0.35 0.45 0.47 0.38 0.38 0.20 0.20 0.13 0.15 0.18 0.20 0.30 0.23 0.22 0.19 0.23 0.13 0.16 0.09 0.25 0.14 0.14 0.08 0.13 0.49 0.69 1.00
28 0.29 0.44 0.43 0.47 0.45 0.17 0.14 0.13 0.09 0.15 0.24 0.30 0.23 0.22 0.20 0.11 0.09 0.10 0.05 0.19 0.14 0.06 0.07 0.11 0.41 0.67 0.65 1.00

69
Variable
code
Variable Variable
code
Variable Variable
code
Variable
1 Mounting labor cost 11 Stumpy profit margins 20
Country balance of payment
status
2 Mounting material cost 12 Dilapidating Local demand 21
Bilateral and Multi-lateral
Governmental Agreements
3 Mounting transportation
cost 13
Dilapidating International
demand 22 Nation‘s Political Stability
4 Mounting utility cost 14
Dilapidating Product
Standards 23
Regulatory Mechanism for
Protecting Investments
5 Mounting rent 15
Dilapidating Quality of
Acquired Inputs 24
Military Coalitions with
fellow countries
6 Scarcity of managerial
Personnel 16
Complex governmental
regulations and procedures 25
Tempo of innovative
operations processes
7 Dearth of technicians 17
Ambiguous government
laws and regulations 26
Changing customer
Aspirations in the industry
8 Deficiency of clerical
Personnel 18 Red Tapism and Delays 27
Emerging challenges from
competitors
9 Scarcity of skilled and
Specialized Personnel 19
Government‘s protectionism
Policy Towards Industries 28 Rate of information diffusion
10 Shortage of Direct Labour
It can be observed from the above table that the correlation values in respect of all the variables does not exceed the
prescribed value of 0.90, and hence, it can be concluded that there is no multicollinearuty problems in the data.

70
Table 3.19 Correlations for Advance Manufacturing Technology
1 2 3 4 5 6 7 8 9 10 11 12 13 14 15 16 17
1 1.00
2 0.61 1.00
3 0.56 0.68 1.00
4 0.51 0.60 0.63 1.00
5 0.50 0.63 0.65 0.66 1.00
6 0.44 0.54 0.55 0.60 0.63 1.00
7 0.21 0.16 0.12 0.18 0.18 0.10 1.00
8 0.04 0.01 -.02 0.03 -.08 -.04 0.51 1.00
9 0.16 0.08 0.05 0.13 0.06 0.07 0.55 0.57 1.00
10 0.12 0.09 0.04 0.10 0.10 0.09 0.49 0.61 0.68 1.00
11 0.06 0.04 -.03 0.04 0.04 0.00 0.56 0.63 0.65 0.71 1.00
12 0.00 0.01 0.00 0.05 0.03 0.02 0.56 0.58 0.51 0.57 0.62 1.00
13 0.23 0.02 0.05 0.10 0.03 0.01 0.48 0.45 0.54 0.52 0.44 0.42 1.00
14 0.12 0.11 0.03 0.15 0.10 0.09 0.47 0.46 0.51 0.52 0.46 0.45 0.67 1.00
15 0.06 -.04 -.02 0.06 -.01 0.05 0.49 0.49 0.56 0.55 0.50 0.50 0.70 0.77 1.00
16 0.16 0.06 0.03 0.12 0.05 0.05 0.47 0.51 0.60 0.52 0.50 0.43 0.62 0.69 0.73 1.00
17 0.14 0.09 0.05 0.14 0.03 0.05 0.42 0.44 0.54 0.51 0.45 0.44 0.61 0.71 0.69 0.69 1.00
Variable
code
Variable Variable
code
Variable
1 Planning 10 Automated material handling systems (AMHS)
2 Requirement Analysis 11 Automated guided vehicles (AGV)
3 Cost/Benefit Analysis 12 Rapid prototyping (RP)
4 Technology assessment 13 Computer aided design (CAD)
5 Development and Implementation 14 Material requirement planning (MRP)
6 Training 15 Statistical process control (SPC)
7 Computer numerical control (CNC) machines 16 Bar coding (BC)
8 Robotics (Ro) 17 Material resource planning (MRPII)
9 Flexible manufacturing system (FMS)
It can be observed from the above table that the correlation values in respect of all the variables does not exceed the
prescribed value of 0.90, and hence, it can be concluded that there is no multicollinearuty problems in the data.

71
Table 3.20 Correlations for Competitive Priority domains 1 2 3 4 5 6 7 8 9 10 11 12 13 14 15 16 17 18 19 20 21 22 23 24 25 26 27 28
1 1.00 2 0.72 1.00
3 0.53 0.61 1.00
4 0.54 0.61 0.53 1.00 5 0.52 0.61 0.58 0.65 1.00
6 0.31 0.30 0.27 0.25 0.33 1.00
7 0.41 0.39 0.32 0.35 0.35 0.63 1.00 8 0.35 0.38 0.32 0.38 0.41 0.53 0.57 1.00
9 0.39 0.41 0.36 0.38 0.39 0.47 0.59 0.52 1.00
10 0.39 0.41 0.38 0.40 0.41 0.39 0.34 0.38 0.41 1.00 11 0.42 0.46 0.39 0.43 0.45 0.32 0.32 0.30 0.40 0.67 1.00
12 0.48 0.49 0.43 0.45 0.44 0.33 0.33 0.33 0.43 0.54 0.61 1.00
13 0.44 0.42 0.40 0.40 0.48 0.33 0.34 0.33 0.44 0.53 0.64 0.68 1.00 14 0.43 0.46 0.40 0.42 0.44 0.31 0.33 0.33 0.31 0.47 0.52 0.54 0.59 1.00
15 0.23 0.30 0.28 0.23 0.25 0.25 0.29 0.31 0.33 0.19 0.28 0.27 0.33 0.32 1.00
16 0.35 0.31 0.31 0.27 0.31 0.37 0.36 0.36 0.39 0.32 0.37 0.34 0.40 0.34 0.50 1.00 17 0.30 0.24 0.23 0.22 0.23 0.29 0.24 0.31 0.31 0.33 0.32 0.30 0.36 0.31 0.49 0.62 1.00
18 0.28 0.25 0.31 0.23 0.25 0.24 0.34 0.31 0.29 0.21 0.25 0.23 0.28 0.30 0.46 0.56 0.42 1.00
19 0.19 0.27 0.20 0.27 0.23 0.26 0.29 0.29 0.28 0.31 0.25 0.21 0.28 0.27 0.21 0.18 0.20 0.16 1.00 20 0.18 0.34 0.26 0.26 0.18 0.24 0.30 0.26 0.25 0.27 0.18 0.20 0.19 0.23 0.31 0.20 0.14 0.20 0.51 1.00
21 0.23 0.34 0.28 0.33 0.27 0.22 0.28 0.29 0.35 0.27 0.20 0.22 0.24 0.18 0.28 0.19 0.20 0.17 0.46 0.66 1.00 22 0.22 0.32 0.29 0.34 0.32 0.25 0.31 0.30 0.34 0.37 0.25 0.29 0.24 0.22 0.22 0.20 0.16 0.18 0.47 0.68 0.69 1.00
23 0.32 0.37 0.39 0.37 0.37 0.40 0.37 0.39 0.40 0.41 0.44 0.35 0.36 0.37 0.36 0.36 0.31 0.23 0.31 0.36 0.33 0.35 1.00
24 0.32 0.39 0.37 0.42 0.41 0.28 0.35 0.32 0.39 0.40 0.45 0.45 0.42 0.33 0.37 0.35 0.27 0.31 0.31 0.35 0.37 0.41 0.72 1.00 25 0.34 0.39 0.39 0.38 0.37 0.32 0.32 0.33 0.39 0.40 0.39 0.42 0.38 0.40 0.36 0.40 0.32 0.31 0.27 0.32 0.29 0.32 0.65 0.70 1.00
26 0.31 0.31 0.31 0.39 0.37 0.32 0.35 0.33 0.38 0.32 0.37 0.34 0.37 0.33 0.36 0.30 0.26 0.29 0.31 0.28 0.29 0.30 0.62 0.70 0.73 1.00
27 0.32 0.34 0.31 0.32 0.35 0.28 0.38 0.36 0.38 0.31 0.34 0.35 0.38 0.39 0.40 0.42 0.33 0.29 0.24 0.32 0.25 0.30 0.58 0.59 0.73 0.67 1.00 28 0.21 0.24 0.30 0.26 0.32 0.27 0.31 0.27 0.32 0.31 0.31 0.32 0.31 0.24 0.29 0.34 0.18 0.24 0.19 0.24 0.23 0.27 0.49 0.67 0.59 0.61 0.64 1.00

72
Variable
code
Variable Variable
code
Variable
1 Performance quality 15 Design adjustments
2 Product Reliability 16 Volume change
3 Environmental aspect 17 Product Mix changes
4 Certification 18 Broad product line
5 Product durability 19 After sales service
6 Low costs 20 Product customization
7 Value added costs 21 Customer information
8 Quality costs 22 Measurement of satisfaction
9 Activity based measurement 23 Knowledge management
10 Fast delivery 24 Creativity
11 On time delivery 25 Continuous learning
12 Right quality 26 Problem solving skills
13 Right amount 27 Training/education
14 Dependable promises 28 R&D
It can be observed from the above table that the correlation values in respect of all
the variables does not exceed the prescribed value of 0.90, and hence, it can be concluded
that there is no multicollinearuty problems in the data.
Table 3.21 Correlations for Business Performance domain
Items Market
share
Sales
growth
Profit
margin
Return
on assets
(ROA)
Return on
investment
(ROI)
Market share 1.00
Sales growth 0.78 1.00
Profit margin 0.73 0.80 1.00
Return on assets (ROA) 0.56 0.67 0.69 1.00
Return on investment (ROI) 0.70 0.73 0.76 0.71 1.00
It can be observed from the above table that the correlation values in respect of all
the variables does not exceed the prescribed value of 0.90, and hence, it can be concluded
that there is no multicollinearuty problems in the data.
It can be observed from the aforesaid discussion that the data available is
absolutely qualitative to proceed to the next step of analysis to yield reliable results.
Hence, the data screening process has concluded successfully and the data is ready to be
used for further analysis, especially multivariate analysis.

73
Hence, it can be concluded that the research instrument used for this study and the data collected using the same is
absolutely reliable and valid. The blue print of the entire study is depicted in the following flow chart.
3.10 Blueprint of the Proposed Study
A snapshot of the entire study is portrayed in the following flow chart.
Figure 3.1 Blueprint of the Proposed Study
Related Documents