52 CHAPTER 3 GENDER DIFFERENCES Males and females are inherently different in many ways. In this chapter a brief examination of the anthropometric differences in their hands, and an in-depth examination of their neuro-muscular differences will be provided. These two aspects of gender differences are relevant to the performance of grip strength tests with Jamar TM and Jamar TM -like (JLD) handgrip dynamometers. The neuromuscular differences in dexterity, neural control of muscles, muscle anatomy, muscle architecture and perceived exertion levels will be given. Despite the documented differences in these areas, they do not provide a clear answer individually, in combination, or collectively, as to why males are stronger than females of comparable size. Also, they do not give an answer to the question of why there have been documented variations in reliability of maximal grip strength performances between the genders. There is presently a lack of studies involving the upper limb that have related forearm and hand neuro-muscular factors to maximal isometric grip strength. ANTHROPOMETRIC DIFFERENCES OF THE HAND BETWEEN THE GENDERS Once puberty commences, a significant gender difference in the size of male and female hands develops. Hand size naturally relates to grip strength: the longer the bones, the longer the muscles and hence the greater the number of contractile units (sarcomeres) that can be incorporated. Lengthening muscle by adding sarcomeres in series is typically associated with only increasing the speed of a muscle contraction and not its force. However, this relationship changes if the velocity of the contraction of a short muscle and a long muscle are maintained equally. In this case the additional sarcomeres in series allow each sarcomere to contract at a slower absolute contraction velocity, allowing it to generate greater force. Thus for any given shortening velocity, the muscle with longer fibres maintains higher force than the short muscle, especially as the velocity increases (Lieber, 2002). This relationship holds true, providing that

Welcome message from author
This document is posted to help you gain knowledge. Please leave a comment to let me know what you think about it! Share it to your friends and learn new things together.
Transcript

52
CHAPTER 3
GENDER DIFFERENCES
Males and females are inherently different in many ways. In this chapter a brief
examination of the anthropometric differences in their hands, and an in-depth
examination of their neuro-muscular differences will be provided. These two aspects
of gender differences are relevant to the performance of grip strength tests with
JamarTM and JamarTM-like (JLD) handgrip dynamometers. The neuromuscular
differences in dexterity, neural control of muscles, muscle anatomy, muscle
architecture and perceived exertion levels will be given. Despite the documented
differences in these areas, they do not provide a clear answer individually, in
combination, or collectively, as to why males are stronger than females of comparable
size. Also, they do not give an answer to the question of why there have been
documented variations in reliability of maximal grip strength performances between
the genders. There is presently a lack of studies involving the upper limb that have
related forearm and hand neuro-muscular factors to maximal isometric grip strength.
ANTHROPOMETRIC DIFFERENCES OF THE HAND
BETWEEN THE GENDERS
Once puberty commences, a significant gender difference in the size of male and
female hands develops. Hand size naturally relates to grip strength: the longer the
bones, the longer the muscles and hence the greater the number of contractile units
(sarcomeres) that can be incorporated. Lengthening muscle by adding sarcomeres in
series is typically associated with only increasing the speed of a muscle contraction
and not its force. However, this relationship changes if the velocity of the contraction
of a short muscle and a long muscle are maintained equally. In this case the additional
sarcomeres in series allow each sarcomere to contract at a slower absolute contraction
velocity, allowing it to generate greater force. Thus for any given shortening velocity,
the muscle with longer fibres maintains higher force than the short muscle, especially
as the velocity increases (Lieber, 2002). This relationship holds true, providing that

53
other factors, such as muscle architecture, length of the moment arm and tendon
length proportions are kept unchanged.
There is consensus that the hand lengths of 13-year-old males and females are not
significantly different, but by the age of 17 males have significantly longer hands than
females (Pheasant, 1996). Kulaksiz and Gozil (2002) found that young adult males
have significantly longer hands (p < .001) in relation to their body height than
females, and these males have squarer shaped hands than age-matched females. From
the middle of the adolescent years onwards the hands of males are significantly wider
than those of females (Kulaksiz & Gozil, 2002; Pheasant, 1996). A detailed analysis
of hand dimensions is given in Chapter 7, Part 1a. There is a positive correlation
between hand surface area and grip strength which is examined in Chapter 7, Part 3.
GENDER AND DEXTERITY
If the greater muscular strengths of males were due to a more efficient motor control
system, it would be expected that men would also possess greater dexterity than
women. Only studies involving adult participants were located. MacDermid, Fehr and
Lindsay (2002) found that gender was “inconsistently related to dexterity times, but
women tended to be faster than men” (p. 115).
GENDER DIFFERENCES IN MUSCLES THAT RELATE TO
GRIP STRENGTH
The literature has consistently found that on average males are stronger than females
(MacDermid et al., 2002; Massey-Westropp et al., 2004; Mathiowetz, Wiemer &
Federman, 1986). It is generally thought that this is because males have greater
muscle bulk. Due to a larger amount of contractile tissue, greater muscle bulk results
in greater strength, providing that the architecture of the muscle fibres within the
muscles being compared is similar (Lieber, 2002). However, the study of Aghazadeh,
Lee and Waikar (1993) found that in a sample of 33 females and 59 males, aged
between 18 and 71 years, when the fat free cross sectional area (FFCSA) of the

54
forearm muscles was taken into account it “alone could not explain the differences in
the grip strengths of males and females” (p. 80).
The strength of a muscle can be expressed in kilograms per unit of cross-sectional
area, creating a ratio that corrects for differences in CSA. In relation to grip strength,
the magnitude of the difference between the genders, for this ratio has been
determined by Padmavathi, Bharathi & Vaz, 1999. They found a significant
difference of about 22% between the males and females in the ratio of the maximum
voluntary isometric grip strength to forearm muscle area (kg/cm2). Ages of the 70
males and 53 females ranged from 17 to 30 years old. Thus an examination of the
gender differences in skeletal muscle structure and function during the adolescent
years may help explain the grip strength and the reliability of the grip strength
differences consistently seen between the genders in the literature. To consider the
skeletal muscle function, it is appropriate to review the neural mechanisms controlling
it, namely the motor units.
Motor unit physiology
The motor unit (MU) consists of a single alpha-motor neuron and the colony of
muscle fibres it innervates. The cell bodies of the alpha-motor neurons reside in the
ventral horn of the spinal cord. The strength of a voluntary or reflex contraction
depends on the number of participating motor units (McComas, 1998). All muscle
fibres (cells) within a MU are of the same type in mature mammals though there can
be a large range in their lengths. For example, in 1991 Ounjian et al. (as cited in
Lieber, 2002) found that muscle fibres within a MU can range from 8 mm to 50 mm
in the cat tibilias anterior. The muscles themselves consist of a heterogeneous group
of muscle fibres, with properties varying from fast twitch (i.e., fast contracting) to
slow twitch, and from fatigue resistant to fatigue sensitive types. Although muscle
fibres can be classified into 8 different types based on histo-chemical techniques,
more than 95% of muscle fibres belong to only three types, namely fast oxidative
glycolytic (FOG) also called type 2A or IIA, fast glycolytic (FG) also called type 2B
or IIB and slow oxidative (SO) also called type I (Lieber, 2002). These three types of
muscle fibres relate to three types of MUs. McComas (1998) has presented a review
of studies indicating that the above sharply divided categories of motor unit types

55
might not be so applicable to humans, who may have types reflecting more of a
continuum of properties. Although all muscle fibres within a MU are of the same
type, they can still exhibit a range of oxidative capabilities, based on a study of cat
tibialis anterior muscle by Martin, Bodin-Fowler, Roy, Eldred and Edgerton (1988).
The proportions of these fibre types in a given muscle appear to be set early in
embryogenesis, based on avian myoblast studies conducted in 1986 (Miller &
Stockdale, 1986). Also during embryogenesis each individual motor neuron appears
to innervate selectively only those muscle fibres that are of the same type (Miller &
Stockdale, 1987).
Muscle fibre type proportions in humans is varied, with about a quarter of fair-
skinned north American men and women having either less than 35% or more than
65% of slow twitch type I fibres in their vastus lateralis muscle. It appears that about
40% of the phenotype variance is influenced by environmental factors (such as levels
of muscular contractile activity), and a further 45% is associated with hereditary
factors. These estimates suggest that a difference of about 30% or less in type I fibres
among individuals could be explained exclusively by differences in the levels of
muscular contractile activity (Simoneau & Bouchard, 1995). Hormonal influences on
these proportions will be discussed later in this chapter.
Force generation and motor units
A review of McComas in 1998 noted that a typical muscle within the thenar eminence
group in the human hand has about 70 to 100 motor units. Some large muscles such as
the biceps may also have 100 motor units, but can obviously generate much greater
forces than the thenar muscles. Thus the number of motor units is important in force
generation, but so are many other aspects of our musculoskeletal architecture.
However with regard to motor units, McComas (1998) stated that there appeared to be
a genetic basis for the range of motor units per muscle, as individuals with
comparatively large numbers of motor units in one muscle also had large numbers in
other muscles.

56
There are two strategies used to generate increasing force by a muscle. The first is
rate coding, whereby motor units are stimulated with increasing frequency so that the
tension developed by each resultant muscle twitch is superimposed onto the next
muscle twitch while the tension is still lingering from the first twitch (Jones & Round,
1990).
The second strategy to increase muscle force is to recruit more motor units. This is
based on a pattern called the Henneman’s size principle that states that small motor
units are utilized when the muscle is required to generate small forces, and
progressively larger motor units are activated concomitantly with the need to generate
larger muscle forces (Jones & Round, 1990). This in turn appears to relate to the
larger motor units having motor neurons with higher excitation thresholds. The small
motor units are typically those involving fatigue resistant slow twitch muscle fibres,
namely the slow oxidative type I fibres. The large MUs typically incorporate rapidly
fatiguing, fast twitch muscle fibres namely the fast glycolytic type IIB fibres (Lieber,
2002).
Concerning the above two strategies, which strategy is used is partially dependent on
proprioceptive feedback from the musculo-tendinous unit in question. Little research
work appears to have been done with forearm muscle behaviour. However, a recent
lower limb study by Pasquet, Carpentier and Duchateau (2005) examined how both
MU recruitment and the discharge rate of individual MUs were influenced by changes
in tibialis anterior fascicular length at various intensities of isometric strength. They
demonstrated in 8 humans that by changing the degree of ankle dorsi-flexion and
plantar-flexion, and thus the fascicular length, both motor unit recruitment and
discharge rate were altered. When the ankle angle was moved from 10 degrees of
plantar-flexion to 10 degrees of dorsi-flexion, the torque produced during maximal
voluntary contraction (MVC) was significantly reduced and the average surface EMG
increased. The latter increase was associated with the motor units being activated at
lower recruitment thresholds with short, compared with long muscle fascicle length,
either when expressed in absolute values measured in Nm or in percentage terms
relative to their respective MVC. Increased rate coding was mainly present at low
torque levels (<10% MVC), when the muscle-tendon complex was compliant
(relatively relaxed), whereas recruitment of additional motor units played a dominant

57
role at higher torque levels with decreased compliance (10-35% MVC). Thus the
amount of stretch applied to a muscle influenced which strategy was used.
Interestingly, changes in discharge rate due to changes in fascicular length may not be
consistently applied to all the MUs in a muscle. Christova, Kossev and Radicheva
(1998) studied 138 superficial and deep MUs in the biceps brachii of five healthy
subjects during isometric contractions at three different elbow angles. Changes in the
elbow angle resulted in changes in the fascicular length. They noted that when the
fascicular length was shortened, only about 50% of the MUs increased their discharge
rate at a given torque compared to the rates observed at two other longer fascicular
lengths. The remaining MUs either lowered, or did not alter their rates. It is possible
that gender differences exist in the systems influencing MU recruitment and discharge
rate, but no research is available which has compared the genders.
Gender differences in motor units
There are gender-related differences in strategies used for force generation. When a
muscle contracts the resultant electrical signal can be collected by EMG and studied
by statistical methods such as power spectral analysis. Cioni, Giannini, Paradiso,
Battistini, Navona & Starita (1994) studied the EMG activity of the tibialis anterior
muscle of 15 men and 15 women. The median frequency of the power spectrum
(MedPF) increased in both genders with increasing torque developed by the muscle,
but women exhibited a slower increase in torque than men. Cioni et al. suggested
from this result and other factors, that the recruitment of new motor units takes
precedence over rate coding in women at low torque levels during voluntary muscle
contractions.
Motor unit activation reflects the proportion of motor units that are stimulated by a
maximum voluntary contraction compared to the total number available. In relation to
motor units of the elbow flexors (biceps brachii) and knee extensors (vastus medialis),
Miller, MacDougall, Tarnopolsky and Sale (1993) found that there were no
significant differences between the genders in terms of the number of motor units, the
size of the motor units (i.e. the number of muscle fibres per motor unit) and the motor
unit activation for these muscles. As these two muscles were disparate, it is possible
that these findings are relevant to all other peripheral skeletal muscles. These findings
58
indicate that men do not have a physiological advantage with their ability to
maximally activate their motor units, as confirmed by Belanger and McComas (1981).
GENDER DIFFERENCES AND MUSCLE FIBRES
Following discussion of gender differences in the neural control of muscles, the next
section considers gender differences in the muscles themselves.
Muscle fibre numbers
The number of muscle fibres a person possesses appears to be set by about the age of
2 years, when the transformation of some of the type 2 fibres to type 1 is completed
(Oertel 1988). The consistent number of muscle fibres in later years has been
supported by several studies comparing bodybuilders with controls. MacDougall,
Sale, Always and Sutton (1984) found that 5 elite body builders, 7 intermediate body
builders and 13 age-matched controls had numbers of muscle fibres that did not
correlate with biceps brachii strength. They concluded that heavy resistance training
did not increase muscle fibre numbers, although it did increase muscle cross-sectional
size. When comparing males and females Miller et al. (1993) concluded that the
greater strength of males was due to larger fibre sizes, not greater numbers of fibres.
The smaller muscle fibre sizes of women have also been used to help explain various
EMG findings. Cioni et al. (1994) found that the median frequency of the power
spectrum (MedPF) from EMG readings of the tibialis anterior muscle increased in
both genders with increasing torque developed by the muscle. However, women
displayed significantly lower MedPF values for any given percentage of their
maximum voluntary contraction as compared to men. This was said to be consistent
with women having less larger sized muscle fibres as found by Henriksson-Larsén
(1985). Ryushi, Hakkinen, Kauhanen and Komi (1988) also noted that women had
smaller fibre sizes for each of the three muscle fibre types studied compared to males.
Bilodeau, Arsenault, Gravel and Bourbonnais (1992) also found that EMG power
spectrum readings (in particular median frequency and mean power frequency) were
also significantly lower in women as compared to men when the muscles were being

59
exerted in the range of 10 to 80% of the maximal voluntary contraction of the triceps,
biceps and anconeus muscles. Skin fold thickness and fibre type characteristics were
theorized as the reasons for the gender differences. Thus the findings from these
various muscles may well apply to many other skeletal muscles in the two genders.
Gender differences in relation to hypertrophy training
Bell and Jacobs (1990) found that during training designed to increase muscle size,
males increased their fast twitch muscle fibre area over and above that of the slow
twitch fibre area, whereas women increased both proportionately.
Gender differences in electro-mechanical response times
A gender difference in the strength of elbow flexors is partially due to differences in
electro-mechanical response times (Bell & Jacobs, 1986). These response times refer
to the delay between the arrival of a stimulus to a research participant, for example a
visual stimulus upon which the participant is expected to flex a certain muscle, and
the resultant change in the EMG reading; and the delay between the change in the
EMG reading and the actual development of force. The former delay has been named
the pre-motor time (PMT) and the latter named the electro-mechanical delay (EMD).
In a study by Bell and Jacobs (1986) 46 males and 40 females did not significantly
differ in their PMT but the males had shorter EMD times. Bell and Jacobs stated that
it was possible that the EMD difference between the genders was simply a function of
their different strengths. However, it was also postulated that it was due to inherent
differences in the series elastic component within the muscle tissue. This in turn
would have influenced the rate of force generation. It was possible that the EMD
related to lateral force generation and therefore could help explain not only longer
times to generate force, but also total force produced.
Gender differences in the relationship between muscle cross-sectional area
(CSA) and force generation
The maximum force that a muscle produces depends in part on its maximum CSA.

60
Maughan and Nimmo (1984) found a correlation of r = .70 (p < .01) between the
maximum voluntary isometric strength of knee extensors and their CSA in 15 healthy,
young, adult, male volunteers. Strength per muscle CSA increases with age in boys
from 7 to 18 years, but not necessarily in direct proportion (Kanehisa, Ikegawa,
Tsunoda & Fukunaga, 1995). Data from 130 boys indicated that the ratio of isokinetic
strength to CSA in their elbow flexors increased during these years. The proposed
reason was that the children were maturing in their ability to activate these muscles
voluntarily.
Other factors have been found that affect this relationship during these growing years.
In a study by Ramsay, Blimkie, Smith, Garner, MacDougall and Sale (1990),
prepubertal boys increased their isometric and isokinetic strength during resistance
training without corresponding increases in their muscle CSA, as determined by
computerized axial tomography (CAT) scans. Their suggested explanations for these
strength gains included increases in percentage motor unit activation, improved motor
unit co-ordination within muscles, increased co-ordination between muscles and
increased firing frequencies. The boys also demonstrated significant increases in
evoked twitch torque, which is a method used for measuring the intrinsic force
producing capacity of muscles, in this case the elbow flexors and knee extensors.
According to Ramsay et al. the most likely explanations for these increases, were
various improvements in the excitation-coupling within the myofibrils. Their other
suggestions included myofibril packing density increases, and muscle compliance. It
is possible that these explanations for differences in strength in the absence of
differences in CSA, may also help explain the differences between the genders.
Ryushi et al. (1988) noted that nine physically active men had nearly twice the
isometric force production per unit of cross-sectional area in their leg extensors than
ten physically active women. In contrast to this Ichinose, Kanehisa, Ito, Kawakami
and Fukunaga (1998) noted that there were no significant gender differences in the
relationship between isokinetic force measured at two velocities and CSA in the
triceps brachii of their Japanese Olympic athletes.

61
Gender and muscle fibre type proportions
Gender differences in the proportions of the different muscle fibre types have been
found to exist. From autopsies, Henriksson-Larsén (1985) noted that in the tibialis
anterior muscle, the females had significantly smaller cross sectional areas of type 1
and type 2 fibres than the males. However Henriksson-Larsén also noted that the
relative number of type 2 fibres was not different between the genders. Another
gender difference was that females had 25% less of their muscle cross-sectional area
occupied by muscles fibres than males, and that females had a greater concentration
of type 2 fibres in the anterior surface of the muscle as compared to the males. The
earlier described study by Cioni et al. (1994) considered that the lower mean root
mean square (RMS) values of the EMG in females could be explained by these
anatomical differences.
Differences in the proportions of the muscle fibre types appear to partially relate to
hormonal factors. Post-mortems of the deltoid and vastus lateralis muscles of humans
aged from 1 week old to 20 years old revealed that before the age of 15 years (and
thus presumably the full effects of puberty), there are no gender differences in the
diameters of type 1 and 2 muscle fibres (Oertel, 1988). Also both genders had the
percentage of type I fibres in the deltoid increase from approximately 48% at less than
6 months of age to 62% at the age of two years. These proportions then remained
constant until around the ages of 10 to 15 years. Oertel (1988) found that type 2 fibres
tended to be smaller than type 1 until the age of 15. Then for the males, from ages 15
to 20, the type 2 fibres became thicker than the type 1 fibres, whereas for the females
of that age, type 2 fibres tended to be of a smaller diameter than type 1 fibres.
Administration of testosterone to healthy young men increased their myofibril protein
synthesis (Ferrando, Tipton & Doyle, 1998, as cited in Wolfe, Ferrando, Sheffield-
Moore and Urban, 2000). The experiment was repeated with elderly men and the
same result was achieved (Urban, Bodenburg & Gilksion, 1995, as cited in Wolfe et
al., 2000). The elderly men significantly increased their strength without increasing
their muscle mass. This finding led to the speculation that increased protein synthesis
per se can result in increased strength (Wolf, et al., 2000). Again, this may help to

62
explain the gender differences that occur despite similar muscle CSAs.
A longitudinal study of plasma testosterone and elbow flexor isometric strength in 50
boys and 50 girls from the ages of 8 to 17 years demonstrated that increases in
testosterone in the boys coincided with the divergence in strength between the boys
and the girls (Round, Jones, Honour & Nevill, 1999). It was theorized that
testosterone was responsible for the selective increase in size of the bony upper girdle
compared to the lower girdle. The data showed quantitative and qualitative
differences between the genders in the pattern of growth of the upper arm, suggesting
that the proportionately longer humeri of males were partially responsible for the
strength differences. Despite such seemingly strong evidence, there were findings that
conflicted with the above results in regard to the link between testosterone and muscle
strength (Gregory, Greene, Thompson, Scrimgeour & Rennie, 1992).
The influence of testosterone on the strength divergence of males and females at
puberty appears to be due to it promoting hypertrophy (increases in muscle fibre size)
rather than hyperplasia (increases in muscle fibre number). Mero, Jaakkloa and Komi
(1991) showed a positive and significant correlation between percentage muscle fibre
areas of fast twitch type II and serum testosterone in 18 young (11 to 13-year-old)
male volunteers, Type I were not studied. The findings of Sinha-Hikim et al. (2002)
indicated that older males (18 to 35-year-olds) responded similarly as administration
of testosterone increased in a dose dependent manner type I and type II fibre CSA,
and did not alter their relative fibre number proportions. However, type II showed a
significant response only at the highest doses of testosterone.
It is probable that maximum force generation differences between the genders cannot
be exclusively explained in terms of differences in muscle fibre composition, as there
is not necessarily a relationship between fibre type and strength. This is because even
between individual males no relationship has been observed to exist between muscle
strength and muscle fibre composition. The ratio of muscle strength to CSA has not
been related to differences in proportions of the different fibre types. Type 1, type II
A and type II B fibre types were studied in 15 healthy young, male, untrained
volunteers by Maughan and Nimmo (1984) who concluded that there was no
difference in the isometric force per unit area that the different muscle fibre types

63
could generate. Similarly, Bodine, Roy, Eldred and Edgerton (1987) were cited by
Lieber (2002) as having demonstrated that fast twitch muscle fibres generate only
slightly more muscle tension than slow twitch muscle fibres in the cat tibilias anterior
muscle.
Gender differences and myofibre connective tissue factors
Pisano, Miscio, Colombo and Pinelli (1996) found that females do appear to have a
lower degree of muscle stiffness in their hands than males. As this is also observable
in the lower limb (Granata, Wilson & Padua, 2002) then it may also apply to many
other skeletal muscles. Females also have less stiffness and hysteresis in the tendon
structures of their gastrocnemius compared to males (Kubo, Kanehisa, & Fukunaga,
2003). Hysteresis was defined as the energy lost as heat during the stretch-shortening
cycle that occurs with muscle contraction and relaxation. A low hysteresis value
indicates that only a small percentage of energy is lost during the cycle. The gender
differences in stiffness and hysteresis may be part of the explanation as to why
females have a longer electro-mechanical delay in the gastrocnemius and the elbow
flexors than males (Bell & Jacobs, 1986).
When examining the percentage of intra-muscular, non-contractile tissue in general,
Miller et al. (1993) found a significant difference in the vastus lateralis, but not in the
biceps brachii, with a sample of eight females having significantly more non-
contractile tissue than eight males. Greater percentages of connective tissue may
reduce the amount of force production.
In contrast to Miller et al. (1993), Toft, Lindal, Bonaa and Jenssen (2003) found that
male (n = 58) and female (n = 33) vastus lateralis muscle had similar percentages of
connective tissue. The different results of these two studies may relate to differences
in sample sizes, or differences in techniques, such as sizes, or sites of the biopsy
samples.
Gender differences in muscle vascularization
It might be postulated that males have a richer blood supply to their muscles and

64
hence could have greater metabolic efficiency than women. However, in a study of
body builders and control participants with a total of ten females and nine males, Bell
and Jacobs (1990) noted that the number of capillaries per muscle fibre, and the
number of capillaries per area of muscle, were similar in both genders.
The larger study by Toft et al. (2003) found that capillary density in the vastus
lateralis muscle was different between the genders in their younger participants, but
was similar in their older participants. Capillary density was measured in terms of the
number of capillaries per muscle fibre. In the younger males, the number of
capillaries per muscle fibre was significantly greater than in the younger females. The
age of the women varied from 26 to 63 years old and the men varied from 40 to 67.
Males and females were then split into younger and older groups, by a split at the
median age of each group. This led to an uneven age match for the groups. As Bell
and Jacobs (1990) noted that hypertrophy training, which increases the size of muscle
fibres, but not their numbers, appears to increase the number of capillaries per fibre,
then perhaps the disparity between the genders noted by Toft et al. (2003) arose due to
differences in the sizes of the fibres between the genders.
When counts of capillaries were made in relation to specific fibre types, capillary
numbers per fibre significantly increased for both fast and slow contracting muscle
fibres as the fibres increased in size. This was demonstrated in 11 healthy, young
males undergoing a strength-training program (McCall, Byrnes, Dickinson, Pattany &
Fleck, 1996). This finding is in agreement with Bell and Jacobs (1990).
Gender differences & muscle architecture
Muscle architecture directly influences force production (Brand & Hollister, 1999;
Tubiana et al., 1996). Increasing the pennation angle (the angle of the muscle fibres in
relation to the force-generating axis) will result in a decrease in strength if no other
factors change. Force production relates to the cosine of the pennation angle. The
cosine of 30 degrees is .87, whereas the cosine of zero degrees is 1. The difference
between these values is only 13%. However if the pennation angle increases, a greater
number of fibres can be incorporated in a smaller volume of muscle (Lieber, 2002).

65
In calf muscles, women have smaller pennation angles than men (Chow, Medri,
Martin, Leekam, Agur & McKee, 2000). This same relative pattern is present when
comparing young men and women in regard to the long head of triceps brachii
muscles (Kubo et al., 2003).
However, interactions of various muscle parameters complicate the picture. Ichinose
et al. (1998) noted that the range in variation of pennation angles in Japanese
Olympians was similar in the two genders and that pennation was significantly
correlated to muscle thickness, relative to limb length. They found that there was no
gender difference in the degree of correlation. When comparing the elite athletes of
the two genders within each of three Olympic events (soccer, judo and gymnastics)
only gymnasts showed a significant gender difference in pennation angle, with
females having smaller angles than males. They concluded that when considerations
were made for differences in muscle size, there was almost no difference in the angles
between the genders.
In the presence of a hand fracture, bone length can be of great importance. For
example, if a bone is shortened due to a fracture, the pennation angle of its attached
muscles can be disadvantaged, resulting in decreased strength generation. A cadaver
study by Meunier, Hentzen, Ryan, Shin and Lieber (2004) of pathological shortening
of the ring finger metacarpal demonstrated that at 10 mm of bone shortening the
interosseous muscle fibre lengths had increased to 125% of optimum fibre length and
the pennation angle had decreased by 50%. They predicted that with this scenario the
muscle would be capable of only approximately 55% of its optimum power,
compared with its resting position.
Other factors influence the pennation angles. One of these is tendon creep (tendon
elongation), which may be expected to be greater in men, due to the larger forces that
they can exert. Tendon creep due to repeated isometric maximal voluntary
contractions was associated with a significant increase in pennation angle and a
significant decrease in fascicular length in medial gastrocnemius muscle in six
healthy, male volunteers (Maganaris, Baltzopoulos & Sargeant, 2002).

66
GENDER DIFFERENCES AND OCCULT FACTORS
There are large, unexplained, inter-individual differences in the ability to recruit all
MUs in a muscle. Belanger and McComas (1981) found that about half of their 28
research participants had great difficulties obtaining full activation of their plantar-
flexor muscle MUs, whereas this was not the case for the tibialis anterior. Thus it may
be that in some cases, these same unidentified differences may be aligned to one, or
the other gender. Further research is needed in this area.
GENDER DIFFERENCES IN PERCEIVED EXERTION
Perceived exertion levels during isometric muscle contractions of the upper limb have
not been extensively studied. King and Finet (2004) found that 18 to 79-year-old
males and females tended to overestimate the amount of perceived grip strength force
needed at 10 lbs, 30 lbs and 50 lbs force when compared with practiced target levels
of these forces. However, the females were significantly closer in their re-enactment
of the targeted forces than males (F 1,198 = 39.16, p < .01). Age was also a significant
factor (F 2,198 = 5.09, p < .01), with the younger ones being better able to reproduce
the requested force levels. The combination of the hand used with the force level
required, was also a significant factor (F 2,198 = 4.70, p < .01). The dominant hand was
better able to approximate the target forces, especially at higher grip strength forces.
All the females were much closer with their perceived levels of force for the 50 lb
force than their age-matched male counterparts. King and Finet considered that this
was because the 50-pound force level of force was probably near the maximum level
that these females could generate. Thus it was easier for them to reproduce a near
maximal force than for the males to produce a high, but sub- maximal force.
Nevertheless, as the level of force increased so did the standard deviations for both
genders, demonstrating more variance amongst the participants at the higher levels.
King and Finet surmised that as the level of force increased, the level of difficulty in
repeating that force also increased. Ratings of perceived exertion do not necessarily
relate to differences in MU activation patterns. Hunter and Enoka (2002) found that
whilst one mixed gender group was able to increase their sub-maximal voluntary
isometric contraction endurance times over three successive repetitions, another

67
similar group were not able to, yet both had similar ratings of perceived exertion.
RELIABILITY
It appears that there is little agreement in the literature concerning the sources of
gender differences in muscle physiology and muscle behaviour. This could be due to
variations in research methodology, age of the participants, the muscles tested, the
levels of forces that the muscles were asked to work at, either isometrically, or
isotonically and many other such factors. Perhaps not surprisingly, biopsy and needle
EMG studies examining gender differences in healthy children, or adolescents, were
not found in the literature. Few of the above findings would appear useful in
explaining the differences in reliability of grip strength values between teenage males
and teenage females.
CONCLUSION
Males and females are different in many respects that may affect maximal isometric
grip strength testing. The physical differences become measurably greater as
teenagers advance through the hormonal changes that puberty brings. After puberty,
males generally have longer, wider and relatively squarer hands than females. These
factors have in themselves have been promoted as the reason for the greater grip
strength of males. But beyond this simple premise, the cause for their stronger grip
strength is attributable to many factors, including the multiple effects of higher
testosterone levels in the males. In this chapter anthropometric and neuromuscular
differences between the two genders, as they relate to grip strength, have been
examined. No clear reasons have emerged for the gender differences in maximal
voluntary grip strength when muscle cross-sectional area is equal, although some
research points to differences in motor unit behaviour with sub-maximal strength
testing. Researchers have not provided an answer for why there may be a difference in
the reliability of grip strength performance between the two genders. In further
chapters the implications of these factors, in relation to the grip strength performance
of teenagers and their reliability values over clinically relevant time periods will be
discussed.

68
CHAPTER 4
A LITERATURE REVIEW OF THE EFFECT OF HANDEDNESS ON ISOMETRIC GRIP STRENGTH DIFFERENCES OF THE
LEFT AND RIGHT HANDS.
When estimating pre-injury grip strength for compensation and rehabilitation
purposes, two methods have been identified in the literature: (a) comparison with the
unaffected hand, assuming a unilateral injury and (b) reference to grip strength
normative data, for bilateral injuries. Researchers are divided as to whether a
significant difference exists between the grip strengths of the two healthy hands.
Reviews by Clerke and Clerke (2001) in Appendix A and Bohannon (2003) show
that some authors argue that handedness affects the grip strength ratio. However,
according to these reviewers, there are variations in the definition of handedness, its
effect on grip strength ratios, and the methods of assessing handedness as it relates to
grip strength. Inappropriateness of the current use of some of the brief, self-report
questionnaires for determining handedness for grip strength purposes is presented.
The impact of the effect of handedness on grip strength ratios cannot be clarified until
a consistent definition and evaluation method for assessing handedness is developed.
This handedness definition then needs to be applied to appropriately designed grip
strength studies.
In a sample of accident and emergency departments in southeast Queensland,
Australia in 1997, 24% of all the presenting patients had suffered injuries to their
hands or wrists (E. Miles, Queensland Injury Surveillance Unit, personal
communication, June 25,1998). Many of the seriously hand-injured people would
most probably have been referred to hand therapists for hand rehabilitation programs.
Thus a need exists to objectively evaluate the effectiveness of the chosen therapy
programs in order to ensure the delivery of optimal care, discontinue services only
when appropriate, provide useful medico-legal evaluations, and to justify the cost and
length of services to account payees. An injury to the dominant hand is usually more
disabling, and a significant loss of grip strength impairs the ability to perform many
daily living tasks. Accordingly, as part of an objective assessment for hand injuries,
accurate evaluations of handedness and grip strength should be taken. The purpose of

69
the literature review in this chapter is to examine current research on the effect of
handedness on grip strength ratios.
METHODS FOR DETERMINING GRIP STRENGTH Grip strength has been measured in a number of ways. Isotonically, it has been
measured with vigorimeters, or rolled sphygmomanometer cuffs (American Medical
Association, 1993; Bohannon, 1991). Muscles can be worked isokinetically under
constant velocity whilst lengthening or shortening and can be measured using
isokinetic devices (Dvir, 1997, 1999). Isometric contractions can be measured using
isometric strain gauges. This has been the preferred method, over the years
(Bohannon, 1991; Fairfax, Balnave & Adams, 1995; Kerr et al., 2006).
Over the last five decades, various designs for isometric strain gauges have been
proposed and these were discussed in Chapter 2, Part 4 (the history of grip strength
assessment tools). In that section it was established that the JamarTM1 or JamarTM-like
dynamometers (JLD) have become commonly used handgrip dynamometers in
clinical and research settings. The American Society of Hand Therapists (1992) and
the American Medical Association (American Medical Association, 1993;
Cocchiarella & Andersson, 2000) recommended the use of JLD to assess grip
strength. For ease of comparison between studies and the previously described
reasons, the discussion in this chapter is limited to an examination of grip strength
research that has used JLD, to determine whether hand dominance has an effect on the
grip strength performance of the left and right hands.
JLD have been described in Chapter 2, Part 4. From 1954 to 2005, many studies were
published that advanced normative data using these types of dynamometers. The
largest and most cited of these are considered here. For the estimation of the loss of
grip strength after an injury, the American Society of Hand Therapists (1992)
recommend comparison of grip strength scores with the contralateral hand, or
longitudinal comparison with earlier values from the patient. The Guides to the
1 J.A. Preston Corporation, 60 Page Road, Clifton, New Jersey 07102.

70
Evaluation of Permanent Impairment (Cocchiarella & Anderson, 2000) also
recommend direct comparisons with the uninjured contralateral hand for unilateral
injuries, or data base comparisons for bilateral injuries. This topic has been expanded
in Chapter 2, Part 3.
The concept that no significant difference exists between the grip strengths of the left
and right hands for all persons has been challenged by several studies. Among right-
hand dominant people (dextralists) and left-hand dominant people (sinistralists), a
wide range of grip strength differences can exist between the dominant and the non-
dominant hand (Balogun & Onigbinde, 1992; Bechtol, 1954). Studies such as that of
Crosby and Wehbé (1994), found that left-handed adults had a grip strength ratio
(expressed as a percentage difference) of up to 40% between their two healthy hands.
Many studies have concurred that the right hand is commonly the strongest hand by
approximately 10%. The left hand of sinistralists is not often stronger than their right
hand, but it is commonly equal in strength to the right hand. Incel, Ceceli, Durukan,
Erdem and Yorgancioglu (2002) found that for adults, the right hand was on average
8.2% stronger than the left hand in dextralists, but for sinistralists the left hand was on
average only 3.2% stronger. This general trend has also been found to apply to
school-aged children (Häger-Ross & Rösblad, 2002). To be able to examine the effect
of handedness on the grip strength ratio of the two hands, the dominant hand must
first be clearly and consistently identified with the aid of highly reliable and valid
handedness assessment tools.
DEFINING HANDEDNESS
Handedness can be viewed from three different aspects: (a) the relative preference for
one hand in the execution of various unimanual tasks (Annett, 1970a, 1970b; Brown,
Roy, Rohr, Snider & Bryden, 2004; Peters, 1998); (b) the greater skillfulness or
proficiency of one hand in the performance of these tasks (Annett, 1970a; Peters,
1998; Triggs, Calvanio, Levine, Heaton & Heilman, 2000); or (c) the greater strength
of one hand (Bowman & Katz, 1984; Chau, Petry, Bourgkard, Huguenin, Remy &
Andre, 1997). Thus depending on the specific definition, the dominant hand may not

71
always be the preferred hand for performing certain tasks such as writing, or be the
most skilful or dexterous hand (Brown et al., 2004; Mathiowetz et al., 1986); or be the
strongest hand (Crosby & Wehbé, 1994; Hanten et al., 1999; Provins, Milner & Kerr,
1982; Zverev & Kamadyaapa, 2001). Also the dominant hand is not necessarily the
steadiest hand (Simon, 1964).
When handedness is viewed as a combination of all these dimensions, the concept can
be seen as multi-dimensional. It could be argued that if handedness is considered in
this manner, the dimensions of handedness need to be studied separately, because a
weak dextralist in one dimension could be a strong sinistralist in another. For
example, it is well-documented that there are older adults who, when they were
children, were forced to learn to write with their right hand, but have always preferred
to execute most other fine motor tasks with their left hand. Chronic pain in the
dominant hand may force a person to use their non-dominant hand for resistive tasks,
such as opening jars. The author has heard reports from adults who recalled being
unable to use their dominant hand due to prolonged immobilization from an injury
during the critical phase of learning to write when they were children, and so taught
themselves to write with their non-dominant hand. Such exceptions to any rule will
always need consideration.
Handedness, defined as the hand preferred for performing certain unimanual tasks, is
a common way of defining hand dominance. However, the number and nature of the
tasks in any handedness inventory designed to determine a global handedness
preference with high validity and reliability is central to any definition (Provins et al.,
1982). Many researchers have found that as a general trend hand preference
distribution in humans is J shaped, wherein the majority of people can be classified as
preferring to use their right hand for various common tasks and the minority as
preferring to use their left hand. This differentiation is fully established in right-
handed children between 5 and 7 years of age and in left-handed children by 9 years
of age (Mandell, Nelson & Cermak, 1984). More recently, real-time ultrasound
research has shown that this process of differentiation begins in utero (see Figure
4.1), with the right hand being preferentially sucked from 15 weeks of gestation in
children who at the age of 10-12 years were dextralist; the converse was weakly

72
correlated for the fifteen 10 to 12 year old sinistralists in the study (Hepper, Wells &
Lynch, 2005).
If it is accepted that handedness preferences lie along a continuum from people who
are consistently left-handed for all one-handed tasks, to people who are consistently
right-handed for these same tasks (Annett, 1970a; Hardyck & Petrinovich, 1977) the
terms ‘degrees of laterality’, or synonymously ‘degrees of handedness’ can be used.
Within this linear continuum, are mixed-handed people who prefer to do some tasks
with one hand and other tasks with the other hand; such people are not uncommon
(Annett, 1970a). In contrast, Annett considers that ambidexterity, in the sense of equal
preference for both hands when performing skilled actions such as writing, is rare.
Figure 4.1. Child at 14 weeks gestation sucking thumb. This image was taken by a sonographer who was able to view the sucking motions of the baby on the ultrasound monitor. This picture is a side profile of the head, nose pointing upward and thumb in mouth, as indicated by the white arrow.
HANDEDNESS & GRIP STRENGTH RESEARCH Many grip strength researchers have classified their research participants as either
dextralists or sinistralists (Balogun & Onigbinde, 1992; Bowman & Katz, 1984;
Chatterjee & Chowdhuri, 1991; Crosby & Wehbé 1994; Desrosiers, Bravo, et al.,
Point of chin
Nose
Wrist
Fingers
Thumb in mouth

73
1995; Fullwood, 1986; Hanten et al., 1999; Newman et al., 1984; Petersen et al.,
1989), with no attempt to sort them into smaller sub-groups, according to the
handedness continuum. Thus an examination of these studies does not help to clarify
how degrees of laterality affect the grip strength ratio of a person. Other researchers
have ignored the possibility that the grip strength ratio of sinistralists could be
different to that of dextralists, as indicated by their pooling of the grip strength values
of the dominant hand of the sinistralists with the dominant hand of the dextralists
(Bäckman, Johansson, Häger, Sjöblom & Henriksson, 1989; Burke, Tuttle,
Thompson, Jannay & Weber, 1953; Chau et al., 1997; Härkönen et al., 1993; Jarit,
1991; Lunde, Brewer & Garcia, 1972; Mathiowetz et al., 1986; Reikeras, 1983;
Toews, 1964).
Depending on the definition of handedness, consistent right-handers may constitute
only 47% of an average patient population (Coren & Previc, 1996). Different grip
strength ratios may apply to non-consistent right-handers, as compared to consistent
left-handers. This needs to be carefully investigated so that clinicians and medico-
legal assessors can estimate the unilateral loss of grip strength as precisely as possible
for each patient. A grip strength ratio profile can be built that takes into account the
degree of hand dominance, occupational preferences and pre-injury requirements for
hand strength for each person.
It would appear that none of the grip strength researchers have considered how the
grip strength difference between the left and right hands may be influenced when one
hand is preferred for precision, non-resistive tasks such as dealing cards, or applying
make-up, and the other hand is preferred for gross grip, resistive tasks such as
hammering, or opening vacuum sealed jars. For example, a young mother may prefer
her right hand for precision tasks, such as writing, and her left hand for resistive tasks,
such as rocking cots, or carrying babies. Thus the left, less skilled arm may develop to
be stronger than the right arm. Although Hebbal & Mysorekar (2003) used a number
of skilled resistive tasks in their observational assessment of 11 tasks, which included
hammering, lifting, carrying, holding objects and pushing and pulling doors they did
not sort their participants into multiple hand preference groups, only into right and
left-hand dominant groups.

74
Methods of Assessing Handedness in Grip Strength Studies
To date, the issue of whether and how to determine handedness in the context of grip
strength studies has been dealt with in a variety of ways. Five different approaches are
evident from the literature:
1) Using forearm and arm girth measurements for determining the dominant hand;
2) Not stating how hand dominance was assessed;
3) Choosing to ignore hand dominance;
4) Using multiple item hand preference questionnaires, or observations of the
performance of multiple standardized tasks;
5) Using one or two item questionnaires.
The first approach, proposed by Kirkpatrick (1957), did not supply supporting data
showing that the dominant side is indeed larger than its non-dominant counterpart. No
data was supplied about the relationship (linear or otherwise) between simple
circumferential measurements and the grip strength differences of the two hands.
Later Davies (1990) demonstrated a linear relationship between lean forearm volume
(which incorporated the use of skin fold calipers) and grip strength.
The second approach, used by many authors, does not state how handedness was
determined (Bäckman et al., 1989; Burke et al., 1953; Chatterjee & Chowdhuri, 1991;
Chau et al., 1997; Crosby & Wehbé, 1994; Harkonen et al., 1993; Kellor et al., 1971;
King & Finet, 2003; Lunde et al., 1972; Mathiowetz, Kashman, Volland, Weber,
Dowe & Rogers, 1985; Mathiowetz et al., 1986; Swanson et al., 1970). This omission
prevents replication of these prospective studies. Also the handedness assessment
methods of their authors cannot be evaluated.
The rationale for the third approach, choosing to ignore hand dominance (Fike &
Rousseau, 1982; National Isometric Muscle Strength Data Consortium, 1996), has
been based on the premise that determining handedness is too complex a task to
accurately assess, or that the number of sinistralist participants was not large enough
to warrant, or enable a separate statistical analysis. This approach was sometimes
done after an initial tally was done to determine the numbers of sinistralists and
dextralists in the sample (Desrosiers, Bravo, Hébert, & Dutil, 1995; Hamilton et al.,

75
1994; Härkönen et al., 1993; Kellor et al., 1971; Mathiowetz, Kashman et al., 1985).
Other researchers did not explicitly state why they then ignored these dominance
groupings (after the handedness assessment) when presenting their data. They simply
pooled their grip strength data into two groups: all left hands and all right hands
(Agnew & Maas, 1982; Bassey & Harries, 1993; Fullwood, 1986; Newman et al.,
1984). Hanten et al. (1999) sorted their data into left versus right hands and dominant
versus non-dominant hands. However the norms they presented were based on left
versus right hands, rather than according to handedness, because they found that more
participants were stronger in their right hand, regardless of their hand dominance.
The fourth approach for handedness classifications involved the use of questionnaires,
inventories, or observations. The historical backdrop to the development of the
existing handedness inventories was the desire to develop questionnaires that reflected
cognitive asymmetries. Early researchers aimed to create questionnaires that were as
universally applicable as possible, with items that were familiar, non-gender specific,
relevant across broad age spans and common to many cultures (Annett, 1970a;
Oldfield, 1971). Recognizing the enormity of this task Peters (1998) proposed a
method for developing self-reporting questionnaires. He highlighted the validity of
within-culture questionnaires, rather than one penultimate questionnaire. None of
these authors stated that they considered the amount of strength required to perform
the tasks should be part of their criteria for item selection. Thus it appears that no
inventories have been intentionally developed to highlight people who perform
resistive tasks with one hand and non-resistive tasks with the other hand. Thus an
inventory does not yet exist that reflects the magnitude and the direction of the left
and right grip strength difference on the basis of a preferred hand for tasks requiring
strength.
Of those grip strength studies that used handedness inventories (Balogun & Ongbinde,
1992; Desrosiers, Bravo et al., 1995; Häger-Ross & Rösblad, 2002; Schmidt &
Toews, 1970), or observed the performance of standardized tasks (Hebbal &
Mysorekar, 2003), none used the inventories in a way that could be employed to assist
in understanding the relationship between degrees of handedness and grip strength.
They did not present their grip strength data categorized according to degrees of
handedness; rather they categorized research participants as left, or right-handed. Two

76
research groups (Desrosiers, Bravo et al., 1995; Desrosiers, Bravo & Hébert, 1997;
Schmidt & Toews, 1970) used this classification to enable them to test the dominant
hand first, simply to standardize their methodology.
Two methods were identified for utilizing the fifth approach to assess handedness.
Firstly, participants were asked to state whether they were left or right-handed, but
they were not given a definition of hand dominance (Fairfax et al., 1995; Hamilton et
al., 1994; Kellor et al., 1971; Mathiowetz et al., 1984; Petersen et al., 1989).
Secondly, participants were asked which hand they preferred to use for one, or two
specific tasks, such as writing, eating, or cutting with scissors (Bowman & Katz,
1984; Fullwood, 1986; Jarit, 1991; Mathiowetz, Kashman et al., 1985).
The study of Hanten et al. (1999) used a combination of these last two methods. If the
child participants were unsure of whether they were left or right-handed, they were
asked with which hand they ate and wrote. Similarly, if the adult participants in the
study of Schmidt and Toews (1970) were unsure of their dominant hand, they were
given a multi-item handedness questionnaire, although the details of this
questionnaire were not published.
Questionnaire items concerning the hand preferred for eating, or the hand preferred for
writing are seen as being the least valid for determining handedness (Annett, 1985;
Rajan et al., 2005). For example, the hand used for eating is often dictated by the
culture (Subirana, 1969). Writing can be a particularly misleading index of general
hand preference (Hardyck, Goldman & Petrinovich, 1975). Until recently, the literate
world has vigorously encouraged all students to learn to write with their right hands
(Harris, 1990; Teng, Lee, Yang & Chang, 1976). Because a wide variety of familiar
unilateral tasks exist that could be included in handedness inventories, the avoidance
of using writing as the sole item for handedness classifications seems prudent.
Effect of Handedness on Grip Strength Given the inconsistencies in definition and the variety of assessments used to measure
handedness, determining the effect of handedness (on grip strength) from grip

77
strength studies is complex. Bearing this in mind, the major findings of this literature
review will now be reported.
Petersen et al. (1989) referred to the “10% rule” that therapists allegedly use as a
general guideline for setting rehabilitation goals. This rule states that the dominant
hand is approximately 10% stronger than the non-dominant hand. No objective
research from that era was found to support the rule.
The difference in strength between the two hands can be as high as 40% (Crosby &
Wehbé, 1994). In the 1970 study of Schmidt and Toews, 15% of their female
participants (n = 80) and 23% of their male participants (n = 1,128), were stronger in
their non-dominant hand. Thus the 10% rule could not be applied to either gender,
especially as the difference in strength between the hands could be much larger.
Some studies divided their participants into sinistralists and dextralists, then analyzed
the data for the two groups separately. Again it was found that considerable numbers
of both sinistralists and dextralists have a stronger non-dominant hand (Balogun &
Onigbinde, 1992; Pearn & Bullock, 1979; Swanson et al., 1970). Up to 29% of
sinistralists and 20% of dextralists had grip strength differences between 15% and
30% for their two hands (Crosby & Wehbé, 1994). Petersen et al. (1989) found that
female dextralists had an individual mean percentage difference of 15.8% in grip
strength between their two hands. Thus there is a considerable magnitude of
difference in strength between the two hands of many sinistralists and dextralists; the
direction of this difference is also not consistent.
The grip strength of ambidextrous persons does not appear to have been studied at all.
Some studies excluded such people (Petersen et al.; Schmidt & Toews, 1970), others
re-classified them (Chau et al., 1997; Desrosiers, Bravo et al., 1995). One study
(Zverev & Kamadyaapa, 2001) sorted its 174 healthy adults (males n = 102, females n
= 74) into right (n = 158), left (n = 10) and mixed handed (n = 8) groups, depending
on which hand they used to perform six common tasks. A mixed-handed person was
anyone who did not perform all of these tasks with the same hand. Although they
came to the conclusion that, on average, there was a 3 to 6 % difference in the
strength of the two hands for the three handedness groups, at times the strength
difference between the two hands was as great as 19.5%. Further, numbers of

78
participants in their smaller groups constrained conclusions. One paediatric study
(Yim, Cho & Lee, 2003) divided their 5 to 12-year-old males and females into right-
handed, left-handed and “both hand users” for a two item (pencil and ball-throwing)
assessment of handedness. They found that handedness did not affect grip strength in
the males, but that the left-handed females were significantly weaker than the other
two female handedness groups. Further details about these studies are given in
Chapter 9 when the grip strength ratio is examined.
In summary, current published studies are limited in their ability to assist in the
estimation of pre-injury grip strength based on a patient’s non-injured hand. Trying to
determine the pre-morbid grip strength of both hands in a person with bilateral hand
injuries has not often been done. Also other factors, such as anthropometric
dimensions and types of occupations and sports played have often been overlooked
when creating population sub-groups in these databases.
As a general guideline it would appear that with regard to dextralists, up to 20 % are
expected to have a grip strength difference between the two hands of more than 15%,
with the right hand usually being the stronger hand. The grip strength difference for
up to 29% of sinistralists is more than 15%, with the right hand being the stronger
hand in just over 50% of sinistralists (Crosby & Wehbé, 1994). This wide individual
variation in grip strength differences, from zero to 40%, indicates that it would not be
safe to assume that a person had achieved full recovery of their hand strength when
the strength of the injured hand equalled that of the uninjured contralateral hand.
Treating therapists need to obtain detailed information about pre-injury hand usage
patterns for each patient with hand-injuries. This information should assist in
estimating which hand should have been stronger pre-morbidly, and by what
magnitude. Furthermore, people who prefer one hand for moderately to strongly
resistive tasks and the other hand for precision tasks cannot be identified using
handedness questionnaires that do not list a broad spectrum of tasks.

79
THE SEARCH FOR A SUITABLE HANDEDNESS INVENTORY
The numbers of items included in handedness assessments have ranged from two to
75 (Provins et al., 1982). In a clinical setting, asking a patient to fill in an inventory
with 75 items would take an impractically long time. The Edinburgh Handedness
Inventory (EHI) (Oldfield, 1971) has been used for over thirty years and is still used
to classify handedness today, although often with slight modifications (Hepper et al.,
2005). It was developed to be a simple, brief, self-report, pen and paper assessment
listing ten handedness items, in the short version. It includes a variety of resistive and
non-resistive items. (There is a longer version with 20 items as well as an eye and a
foot preference item included in the original article).
To complete this handedness inventory the participant is asked to indicate whether
they always use their right hand, or always use their left hand, or either hand for the
following ten tasks: writing, drawing, throwing a ball, cutting with scissors, using a
toothbrush, using a knife for food preparation, self- feeding with a spoon, the hand
which is upper most on a broom when sweeping, striking a match, and opening the lid
of a box. The final derived score is the Laterality Quotient (LQ), which ranges from
+100, demonstrating that the right hand is preferred for all 10 items, to –100,
demonstrating that the left hand is preferred for all 10 items, see Appendix D for
further details. This numerical grading system allows for the expression of the
magnitude and direction of laterality biases and also makes it possible to compare the
LQ with other quantitative scores, such as grip strength, via correlation coefficients
and multiple linear regression equations.
The LQ of the EHI has demonstrated good to excellent Pearson’s Product Moment
Correlation Coefficient values of 0.75 to 0.86 (McMeekan & Lishman, 1975) and has
been used by grip strength researchers in the past (Desrosiers, Bravo et al., 1995;
Häger-Ross & Rösblad, 2002). A database search in June 2005 with the search
engines: Journals @ OVID, CINAHL, OVID Medline and PsycINFO (1967 to June
week 1, 2005) found 579 articles pertaining to the EHI. The majority of these articles
used the EHI, or an adapted version of it, as a “benchmark” measurement of
handedness. Its relationship with grip strength biases has been studied in adults

80
(Triggs et al., 2000) and children overseas (Häger-Ross & Rösblad, 2002), but to date
not in detail and not with Australian teenagers. Critics of the EHI have found several
items which are either superfluous, or not valid for indicating one preferred hand, two
tasks in particular; the hand held uppermost on a broom and the hand used to lift the
lid of a box were not indicative of general handedness (Ransil & Schachter, 1994;
McFarland & Anderson, 1980; Williams, 1991). These tasks are considered to be
bimanual and require minimal skill.
Since the fieldwork for this thesis was completed other groups have modified the
handedness items of the EHI. Dragovic (2004) found that there was large
measurement error in the items of using a broom and opening a lid and considered
drawing to be redundant because writing was of such a similar nature. A paper from
an Irish researcher (Hepper et al., 2005) utilized substitutions that reflected current
technology. They deleted using a broom, striking a match and opening a lid. Instead
they inserted using a TV or other remote control, holding a can or bottle to open it,
and writing text messages on a mobile phone. Interestingly, though they found that
“subsequent analysis revealed that 49 [out of 60] of the children [aged 10 to 12] did
not use a mobile phone and hence this question was dropped from the analysis” (¶. 4).
Unlike Dragovic, they retained drawing as an item.
CONCLUSION
From this literature review it can be seen that the effect of handedness on grip
strength remains unclear. Researchers in the area of psychology have developed a
number of handedness inventories, but not for the purpose of assessing the impact of
the degrees of handedness on the grip strength bias between the two hands. Further,
researchers in the area of grip strength have not closely investigated the possible
effects of the magnitude and direction of handedness, to assist in the estimating of
pre-morbid hand strength for the individual patient. Thus based on the available
research, clear conclusions about the interplay of these two factors cannot be
achieved. Further research is therefore needed to develop handedness assessments that
highlight the dominant hand for moderately to strongly resistive skilled tasks, and

81
thereby allow individuals to be sorted into groups along the continuum from
consistently left-handed, to consistently right-handed. The assessment needs to
accommodate mixed-handed and ambi-dexterous people. An adapted EHI shows
promise in this area. The hand dominance and grip strength relationship needs to be
explored in large well-designed, standardized studies. The current thesis will
contribute toward the clarification of these important concepts. The stability of the
grip strength ratio also needs to be examined. If it is not acceptably stable, the pre-
injury strength of one hand based on self-reporting questionnaires, prediction
equations, and the grip strength performance of the contralateral healthy hand at any
one point in time will be hard to estimate. These issues are also examined later in this
thesis.

82
CHAPTER 5
AIMS AND GENERAL METHODS OF THE THESIS Relatively weak grip strength is usually an indicator of a severe hand injury and a
lengthy time required for rehabilitation. An increase from the baseline grip strength
over time is viewed as an indication of recovery (El-Karef, 2005; MacDermid,
Richards & Roth, 2001). Although measuring grip strength with JamarTM and
JamarTM-like dynamometers (JLD) is a well accepted and much used practice, there
are questions about the reliability of the measures made with these tools. Reliability
studies usually conclude that these tools have excellent reliability, with intraclass
correlation coefficients ranging from 0.91 to 0.98 (Bohannon & Schaubert, 2005;
Hamilton et al., 1994; Lagerström & Nordgren, 1998). Despite this, and their
acceptance in the rehabilitation and medico-legal arena, there is often unexplained
variation in the grip strength of a person from test session to test session and within
the one test session (Mathiowetz, 1990). Some people have been found to produce
grip strength values that are more reliable than others. There are yet to be identified
factors that contribute to variations, or fluctuations, in strength scores by healthy
hands from one test occasion to the next.
The overall aims of conducting this research were threefold: firstly, to develop a
reliable and valid handedness questionnaire which expressed handedness with
magnitude and direction; secondly, to establish a grip strength database for urban
Australian teenagers, with an accompanying prediction model for estimating the pre-
morbid grip strength especially for bilaterally hand-injured teenagers; and thirdly, to
assess the reliability of the grip strength scores of the two hands. This third aim had
two aspects. The factors that affect reliability were to be investigated and the
reliability of the grip strength ratio values was to be ascertained. These findings have
important therapy-intervention and medico-legal implications.2
2 The information from these experiments has been disseminated publicly by way of
journal articles and conference presentations over the last 6 years. The publications
and presentations have been listed at the beginning of this thesis.

83
High-school aged teenagers were chosen as the participants for this prospective
research project for several reasons. First, because they were seen to be a potentially
injury-free population, who would be available for repeat testing within a month.
Second, because there are no current Australian grip strength normative databases for
this age group. No studies have compared the reliability of the grip strength scores of
older teenagers with younger ones, or compared the strengths of teenagers of differing
anthropometric dimensions. The senior high school students were expected to be
nearing their full physical strength. The younger teenagers were a less homogenous
group, as they were entering puberty, rapidly developing physical strength, and
experiencing relatively uneven growth spurts (Neu, Rauch, Rittweger, Manz &
Schoenau, 2002). Thus they were of interest to compare with the seniors for reliability
of their maximal isometric grip strength (which will simply be referred to as grip
strength for the remainder of the thesis). Also, it is usually only in the early to mid-
teenage years that the gender difference in grip strength begins to emerge, and thus
gender comparisons become valid (De Smet & Vercammen, 2001; Neu, Rauch,
Rittweger, Manz & Schoenau, 2002).
The current project conducted three inter-related experiments examining the above
gaps in our knowledge of hand strength, the reliability of hand strength testing and the
effect of handedness on grip strength. One pool of semi-urban teenagers was selected
for study homogeneity. The first subsidiary aim was to find a culturally appropriate
multiple-item handedness questionnaire. It was intended that this would be used to
express the handedness of a teenager, in terms of degrees of laterality. The Edinburgh
Handedness Inventory (EHI) (Oldfield, 1971) appeared to be an appropriate choice,
though modifications were made to meet local needs. A comparative experiment with
the new modified EHI was conducted with a sample of local adults.
Secondly, the grip strength of 238 of these handedness-assessed teenagers were
measured, along with anthropometric and bio-data, with the aim of establishing a
database for grip strength norms in this age group, which could be sorted by age,
gender, or body dimensions. The rationale for this is elaborated upon in Chapter 7,

84
Part 1 that examines the representativeness of the sample group as compared to
published norms.
Thirdly, the grip strength test was repeated with 154 of these teenagers. These three
experiments have been partitioned into seven smaller studies for the flow of the
presentation of the thesis and are presented in Table 5.1 for clarity.
Table 5.1. Organization of the Three Experiments of the Thesis Experiment 1
Development of reliable and valid handedness questionnaire
Experiment 2
A Identification of and investigation of confounding variables for the
sample
B Measure of grip strength and comparison with published data to
establish validity of sample
C Regression analysis combining 2A and 2B to determine which of the
observed variables has the greatest impact on grip strength
Experiment 3
Repeat test the same sample to assess reliability of:
A Dominant hand versus non-dominant hand grip strength scores
B Grip strength ratio
C Grip strength scores with 3 hand-shape groups per gender
METHODS Research participants
A convenience sample of high school aged teenagers was recruited for the study. All
year levels were used for background information about hand dominance preferences.
Junior (13-year-old) and senior (17-year-old) high school students were used as
sample groups to compare their grip strength abilities. This sample of students came
from an outer-urban high school in Brisbane. The Principal agreed to allow the project
to be conducted within normal school hours (between 9 am and 3 pm) and provided a
suitable, on-site, quiet, air-conditioned room.

85
Recruitment of Participants
Although the research with the teenagers was conducted as part of general school-
time activities, it was advertised in the general community to raise awareness of its
indirect benefits to the teenage population at large. The project was advertised at
social functions that were held by the school, at general assemblies and in the school
newsletter. The local community newspaper also ran an article on the research being
conducted at the school.
The comparative group of adults for the experiment with the handedness
questionnaire were between 20 and 72 years of age. The adults were recruited as a
sample of convenience from patients, or their accompanying drivers, or relatives, who
were in the waiting room of a combined physiotherapy and hand injury clinic. Hand-
injured persons being treated by the author were excluded. A sign was displayed in
the waiting room inviting people to participate in the study. People either volunteered,
or were approached, if it was known to be convenient for them, see Appendix E. The
ethnic background of the majority of the teenaged and adult participants was
considered to be of an Anglo-Saxon origin.
Ethical Approval
Ethical approval was obtained from Institutional Ethics Committees for each part of
the three experiments. Information and guardian consent forms were distributed
throughout the school, see Appendix F. In relation to the teenagers, there was the
intention to not call any teenager for grip strength testing who had not returned these
forms, signed by a legal guardian. After several weeks and several reminders, the
return rate was 30%. The Science Master considered this return rate to be higher than
the usual rate for general school forms, which he stated was usually around 20%,
indicating comparative enthusiasm for this project. It was then decided to use a
passive consent process, whereby all the guardians were sent another notice, this time
informing them that if they did not object it was assumed that they consented to the
participation of their teenager. It was stated that if at any time they, or their teenager,
wished to withdraw, it would be without prejudice. This process of data collection has

86
been previously used for large school community surveys of health and nutrition
(Robinson et al., 1993). No guardian responded.
At the time of data gathering, the sole tester (the author) had been a registered
Occupational Therapist for 15 years and had been using the GripTrackTM handgrip
dynamometer (JTech Medical Industries, Utah, USA) for 18 months prior to the
commencement of the study. The author conducted all the project research, including
project publicity at the school, administration of all questionnaires, and recording of
all anthropometric parameters and grip strength tests.
The Edinburgh Handedness Inventory
The teenagers and the adults were asked to fill in an adapted version of the Edinburgh
Handedness Inventory (EHI10), or a modified version (EHI14) in which four new items
were added to the 10 original handedness items. The adapted version substituted
some words to make them clearer for an Australian audience and gave the instructions
verbally instead of in writing. The two versions of this simple ‘mark the box’
questionnaire are provided in Appendix D. Further details of the rationale for these
forms have been provided in Chapter 6. The adults were tested after a small number
of the teenagers were surveyed and some design problems had become obvious;
further details are given in Chapter 6.
Procedure for Calculating Degrees of Handedness
The EHI was used in a number of ways. To gain a more accurate picture than usual of
the spectrum of degrees of handedness the teenagers were divided into three
handedness groups according to their Laterality Quotient (LQ) (refer to Chapter 6 and
Appendix D for further details). If the LQ of a teenager was between –70 and –100
they were classified as left-handed; if it was between –60 and +60 they were classified
as mixed-handed; if it was between +70 and +100 they were classified as right-
handed. These groupings were consistent with the concept of a person being either
consistently right-handed, inconsistently right-handed, consistently left-handed and so
forth (Briggs & Nebes, 1975). Any teenagers with an LQ of zero were asked to report
which hand they considered to be their dominant hand.

87
This classification process enabled an analysis by the degrees of handedness, rather
than Briggs and Nebes (1975) “arbitrary distribution into thirds” for the three
handedness groups. These current three handedness groups, within the grip strength
tested group, were compared with the non-grip strength tested group to ensure that a
normal distribution of right, left and mixed-handers were represented in the grip
strength tested group, see Chapter 7, Part 2, Hand Dominance Groups.
The Personal Profile Form (PPF)
The PPF given to the teenagers asked questions about exercise participation, past
upper limb injuries, current pain and bio-data (date of birth, gender, etc) see
Appendix G. The PPF design was based on the general principles for collecting data
from teenagers, as outlined in Dashiff (2001).
Equipment for the Anthropometric Measurements
The height of each student was recorded with a free-standing stadiometer (Portable
Height Scale, Mentone Educational Centre, Melbourne, Australia) as used by various
Australian health and fitness surveys (as cited in Booth, Chey, Wake, Norton,
Hesketh, Dollman & Robertson, 2003).
The weight (mass at sea level) of each student was measured with a new electronic
self-calibrating, auto-zeroing, portable bathroom scale (Tanita, Model 1607, Tokyo,
Japan), which was purchased for the study, as used by other Australian researchers
(Booth et al., 2003). The accuracy of this particular set of scales was measured with
government certified weights totalling 70 kilograms at the beginning and end of the
data collection.
Hand lengths were recorded with a standard metal ruler with millimetre markings.
Hand circumferences were taken with the Figure Finder Tape Measure (Novel
Products, Rockton, IL USA), which allows consistent application of 100 gm of
tension, according to the manufacturer, to overcome inaccuracies of inconsistent
tensioning, which can give inaccuracies of ±25 mm (Pheasant, 1990).

88
Procedure for Conducting Anthropometric Measurements
Height, weight and hand size measurements were taken when the students were being
individually grip strength tested. No other student, or research assistant, was present
when these procedures were done, to minimise the self-consciousness, or
embarrassment that the students may have felt (Dashiff, 2001). The door to the
research room was kept open and the student was always positioned nearest to the
door, to decrease any possible feelings of their being threatened.
Height (Stature) Measurements
Whilst their height was being measured, students stood straight, in their socked feet,
with their backs lightly touching the vertical pole of the stadiometer. For accuracy of
the readings the examiner stood on a small stool to be able to directly eyeball the
height level and round its reading to the nearest 0.5 centimetres, although others have
recorded it to the nearest 0.1 cm (Booth et al., 2003).
Weight (Body Mass) Measurements
Each student had their weight recorded whilst they were in their socked feet, school
shirts and school shorts. They were not asked to disrobe any further, as no greater
accuracy of weight was needed for the purpose of the study. Weight was recorded to
the nearest 0.1 kg, as done previously (Booth et al., 2003).
Hand Dimensions
Only the dimensions of the dominant hand (as determined by the handedness
inventory score) were recorded, as it was assumed that the two hands would be of a
sufficiently similar width and length to place them both in the one hand shape
category (long, average or square).
When measuring hand lengths, the students were asked to place their dominant
forearm and supinated hand flat on a table, as recommended (Crawford, 1996). A

89
metal ruler was placed upon the palm longitudinally, and the arches of the hand were
gently flattened against the table by the ruler, whilst the distance from the tip of the
middle finger to the midline of the distal wrist crease was measured (Firrell & Crain,
1996; Okunribido, 2000; Pheasant, 1990). Hand lengths were recorded to the nearest
millimetre.
Hand widths have been defined as the distance between the radial side of the 2nd
metacarpal joint, to the ulnar side of the 5th metacarpal joint (Abdel-Malek, Ahmed,
el-Sharkawi & el-Hamid, 1990; Firrell & Crain, 1996). In the present study, the width
was calculated by dividing the circumference of the hand by two. When measuring
hand circumferences the tape was placed around the 2nd to 5th metacarpal-phalangeal
joints, with the thumb moderately extended away from the side of the hand, for ease
of access for the tape. The hand was gently pressed onto a tabletop (to flatten out the
distal palmar arch) and circumferences were recorded to the nearest millimetre.
Grip Strength Measuring Equipment
All participants were tested with the GripTrackTM, a computer-linked handgrip
dynamometer (Figure 5.1), which has the same dimensions and handle positions as
the analogue Jamar™ model, with the only external difference being that the
GripTrack™ does not have the analogue dial mounted at the top of the handle. Thus it
is 120 grams lighter (for the other differences see Chapter 7). The GripTrackTM
consists of a BaselineTM hydraulic handgrip dynamometer (manufactured by
Fabrication Enterprises Inc., New York, USA), an interface box functioning as an
analogue/digital converter to convert the hydraulic pressure forces into electrical
signals. The converter was linked to a computer. The linking of the device to the
computer assisted in the elimination of transcription and interpretation errors that an
examiner may encounter when manually recording results. The computer rounded the
force readings to the nearest pound of force (Newtons being the correct unit of
measurement for such a force), but was set to display the force reading on the monitor
screen to the nearest kilogram of force (to comply with metric notation and to be
consistent with many previous studies). The force readings recorded here can be
changed to Newtons by multiplying the kilogram force readings by 9.81. The
computer generated individual printouts of performance.

90
Calibration of the GripTrackTM Equipment
To prepare and maintain the equipment, weighted calibration checks using
government certified masses were conducted prior to the commencement of the
project, regularly throughout it, and upon completion of it. The weights were
suspended from a thermoplastic collar as recommended by Fess (1987). The
GripTrack™ was also given a zero calibration reference check, via the calibration
count of the analogue/digital converter, at the beginning of each testing day, as
automatically prompted by the software. Refer to Part 2 of Chapter 7 for the results
of the calibration tests.
Pre-grip Strength Test Survey Forms
The students in Years 8 and 12 were asked to complete a Personal Profile Form
(PPF). These forms were given out in class groupings. The regular class teacher was
present, but the author conducted the form-filling sessions and answered any
questions in relation to the project. Classes were chosen to reflect the whole range of
academic abilities within the school.
All the questions were verbally delivered to class groupings of 15 to 30 students.
Before commencing, students were given a brief explanation of the purpose of the
research and told that their participation in each phase of data collection was
voluntary, as done by others Australian researchers with teenagers (Booth, Okely,
Chey, Bauman & Macaskill, 2002a). The questions were delivered from a rehearsed
script and each student was seated at an individual desk. The project and the tester
(the author) were introduced to the teenagers as being independent of the school
curriculum. The tester was of the same ethnicity as the majority of the teenagers.
Questions that may have evoked an emotional response were read last (such as the
upper limb pathology questions), as recommended (Dashiff, 2001).
Grip Strength Testing Procedure and Test Environment
The teenagers were individually grip strength tested in a quiet room to help decrease
distractions. The room was comfortably air-conditioned to control for extreme air

91
temperature, which have been shown to effect grip strength performance (Pearson,
MacKinnon, Meek, Myers & Palmer, 1982). Each teenager was seated in an upright,
armless, school chair of a standard height. They sat with their arms unsupported,
shoulders loosely adducted by their side in neutral rotation. The arm being tested was
flexed at 90 degrees at the elbow and the forearm was also in neutral rotation, as
recommended (Fess, 1992). By demonstration, the tester requested each teenager to
position his, or her wrist in neutral to 20 degrees of extension and neutral to 10
degrees of ulnar deviation. This position was visually monitored and repositioned if
required. The teenagers were encouraged to recreate this same position for each hand
on each handle squeeze, because large changes in these ranges of positions can alter
grip strength performance (Fong & Ng, 2001; Oxford, 2000). They were instructed to
position their hands centrally on the GripTrackTM™ handle; this position was
visually monitored and corrected as needed. See Figure 5.1 for the test environment.
The dominant hand was always tested first. Any teenagers with a Laterality Quotient
of zero were asked to choose the hand that they considered to be their dominant hand.
Each progressive handle position of the GripTrackTM created a larger handle size. The
teenagers were tested on all five-handle positions, progressing from the smallest
(position 1) to the largest handle position (position 5), to mimic clinic procedures and
to ensure that there were no errors in handle size order upon retest. The hands were
alternated after three repetitions on one handle position. No warm ups were given and
the teenagers were not familiar with the GripTrack™ prior to testing.
The teenagers were not able to see the computer monitor displaying the real-time grip
effort readings and no feedback regarding performance was given during the testing.
However, encouragement was provided by requesting the teenagers to “Squeeze
harder... harder… relax!” during every squeeze, as recommended (Hamilton et al.,
1994; Mathiowetz et al., 1984). The volume and tone of the standard verbal
commands were kept consistent. There was a fifteen second rest break between each
trial and a one-minute rest break for each hand, between each handle position, as
monitored with a stopwatch. During the rest breaks the teenagers sat quietly with
their hands pronated in their laps. Each trial lasted approximately 2.5 seconds (i.e. the
length of time taken for the verbal commands), which was long enough for the forces
92
to peak and waver, as monitored on the computer screen. At the end of the grip testing
session, the teenagers were individually told their strongest force reading,
encouraging competitiveness and enthusiasm for the project. Also the rationale for re-
testing was explained.
Figure 5.1. The author conducting testing in the school laboratory.
Footnote: Monitor was temporarily re-aligned for the photograph
GENERAL PRESENTATION OF AND JUSTIFICATION FOR THE USE OF VARIOUS STATISTICAL ANALYSES
Correlation between two determinations, test-retest, is one method of expressing the
accuracy of measurement relative to the parameter dispersion. Such a correlation is
termed a reliability coefficient. In these studies, when assessing test-retest reliability
Pearson’s Product Moment Correlation Coefficient (r), intraclass correlation
coefficients (ICC) models 2,1 and 3,1 with p < .05 (Portney & Watkins, 2000), were
used via SPSS (Graduate Pack Version 11.0 for Windows, Chicago, IL). These
reliability indices were used for assessing both the Laterality Quotients and the grip
strength values over two test sessions, for comparisons with other studies.

93
It was considered necessary to calculate both ICC models 2,1 and 3,1 to confirm that
no additive, or multiplicative biases were present in the experiments. The ICC (2,1) is
sensitive to additive and multiplicative biases; ICC (3,1) is only sensitive to
multiplicative biases, in contrast r is sensitive to neither (Maher & Adams, 1995; Rey,
Plapp, Stewart, Richards & Bashir, 1987). By way of examples, additive bias would
occur if the second score was always three points, or three kilograms of force higher
than the first, multiplicative bias would occur if the second score was always three
times greater than the first. By comparing the relative values of these three indices it
is possible to elucidate such biases more readily. If they vary by more than 0.1 then
bias is suspected. This form of analysis has been termed the Rey et al. (1987)
reliability index breakdown method (Maher & Adams, 1995). The 95% confidence
intervals (95% CI) were also calculated and presented for the ICCs so that the
population mean, as opposed to merely the sample mean, could be predicted with
95% confidence to lie between the upper and lower confidence interval values that
were calculated. Thus if 100 similar groups of teenagers or adults were taken from the
general population, 95 of these would be expected to have either their ICC upper or
lower limits to include the population mean (Tilley, 1999).
Handedness is not normally distributed in the general population, but rather it is J-
shaped; the majority of people are right-handed for most tasks, some are mixed-
handed and a few are left-handed for most tasks. For examining the retest reliability
of aspects of the EHI Spearman’s rho and Kappa were used. Spearman’s rho is
typically used when the data is not normally distributed. Kappa possesses a more
precise measure of agreement, but unlike rho, Kappa is usually used for normally
distributed attributes. Akin to rho it does not provide information concerning the
direction and magnitude of test-retest agreement (Ransil & Schachter, 1994). Kappa
and rho can range from –1.0 to +1.0, with –1.0 indicating complete disagreement
beyond chance and +1 indicating complete agreement beyond chance, between the
two occasions that a task, or item is measured (Ransil & Schachter, 1994). All Kappa
and rho values obtained here were in the positive range. These two statistical methods
were appropriate for examining the reliability of the individual items on the EHI, as
they were given nominal numbers to track changes in the preferences of the
participants over time.

94
Measurement error in these experiments included all sources of errors such as
instrument, participant, and tester error. The Standard Error of Measurement (SEM),
which equals the square root of the product of the total variance and 1–ICC (Stratford
and Goldsmith, 1997) was derived from the SPSS results. The SEM estimates the
magnitude of measurement error between tests of an individual, over designated time
periods. SEM values provide such information in the original units of measurement
(Stratford and Goldsmith, 1997). The SEM has been described as the most desired
index of reliability (Rothstein, 1985).
Two statistical terms now need to be explained, Z scores and alpha. Z scores indicate
how far a score is away from the mean score using units of standard deviations.
Stating that a student’s grip strength result (score) has a Z score of +1 indicates that
the score is one standard deviation above the mean. This in turn indicates that 34.13%
of the scores (which is one standard deviation of scores) lie between it and the mean
of the grip strength scores if the sample of grip strength scores follows a normal
distribution. Z scores are important as they allow comparisons of the relative standing
of two or more scores to be made, even if the scores are from samples with different
means and different standard deviations (Tilley, 1999).
Alpha refers to the probability of rejecting a null hypothesis when the null hypothesis
is actually true (a type 1 error). If alpha is chosen to be 5% alpha is set at .05. Then
the null hypothesis will be erroneously rejected 5% of the time when in fact it is true
(Tilley, 1999).
Zalpha/2 in SEM equations correspond to the chance of making a type 1 error (Eliasziw,
Young, Woodbury, & Fryday-Field, 1994), which in this study that would be to
mistakenly conclude that a student’s grip strength score on retest had a value that
indicated a real change in grip strength had occurred (and not just an irrelevant normal
fluctuation), when it had not.
Thus an individual at retest would need to have a change in scores equal to Zalpha/2
times the square root of two, times the SEM, in order for the change to be regarded as
a real change, not just normal variability. This value is the minimum difference to be
exceeded (MDE), and is regarded as being superior to the use of 95% confidence

95
intervals for the purpose of detecting real change (Eliasziw et al., 1994). Zalpha/2 is 1.96
when alpha is .05, and thus the first part of the MDE equation condenses down to 2.77
and so the equation can be written as
MDE = 2.77 x √2 x SEM.
When it was necessary to consider whether two groups were independent with respect
to a variable, such as height, independent samples t tests were conducted to compare
the mean heights of these two groups. For example, t tests were conducted to
determine whether the 17-year-old males were significantly taller than the 13-year-old
males.
Scatter plots were also used to visually clarify the strength and shape of a relationship.
For example, they enabled an examination of whether there was a linear relationship
between two variables, such as height and grip strength (Portney & Watkins, 2000).
Regression equations were used to examine the predictability of the grip strength of
one hand, when only a number of variables were known. Multiple linear regression
equations were used when more than one variable was considered and contrasted with
grip strength. Linear equations were used because the dependent variable (grip
strength) has a linear relationship with such independent variables as age, through the
growing years. This relationship only becomes curvilinear with age when it is
extended from early childhood into the later geriatric years, as it increases linearly
throughout childhood, plateaus from the ages of 20 to 50 years, and then starts to
decline until it is again quite weak, in frail elderly people. Further explanations
concerning the use of regression equations are given in Chapter 7, Part 3 where the
variables that affect grip strength are examined.
In order to examine the possible effects of and interactions between variables, such as
hand shape, gender, hand dominance and grip strength, analyses of variance
(ANOVAs) and planned trend contrasts were used. The size of the effects of these
variables were also calculated and are discussed further in Chapter 10.
A variety of statistical packages were used in the analyses of these experiments. Most
often used were the analyses available through SPSS, Microsoft Excel and PSY: a

96
program for contrast analysis from the web site of the University of New South Wales
(Bird, accessed in 2004).

97
CHAPTER 6
RELIABILITY AND VALIDITY OF THE MODIFIED EDINBURGH HANDEDNESS INVENTORY
Experiment 1
It would be logical to assume that the dominant hand was more active than the non-
dominant hand and that the consequently greater muscular demands would result in
greater strength for this hand. It would also be logical to presume that once a hand-
injured patient had stated which hand was their dominant hand, they had also
identified their pre-morbidly strongest hand. In reality the relationship between
dominance and strength is not so clear-cut. One of the problems is that dominance can
be defined in many ways as discussed in Chapter 4 and upper limb strength can also
be measured in many ways, as highlighted in the review of hand strength tools in
Chapter 2.
The Edinburgh Handedness Inventory
When handedness has been defined as the preferred hand for common tasks, the
Edinburgh Handedness Inventory (EHI) (Oldfield, 1971) has been shown to be a valid
assessment for expressing hand dominance. It has good overall reliability, especially
if it is only needed to classify patients into two, or three handedness groups, along the
continuum from consistently right- to consistently left-handed. As stated in Chapter 4,
the EHI has been popular for studies involving large samples of adults. However,
several of its tasks could be substituted for more currently relevant daily tasks, to
improve its validity and reliability.
Clinicians need up-to-date information about tools. They need to know if the EHI is
useful for the current generation of teenagers. They need a tool to identify those
teenagers who are strongly lateralised in their hand dominance and so would be quite
disadvantaged by a severe injury to their dominant hand, as compared to a teenager
who is ambi-dexterous, or who is mixed-handed and thus has some proficiencies with
their less-often preferred hand. They also need to know if it can indicate the pre-
morbidly stronger hand, and to what degree hand dominance correlates with the

98
strength difference between the two hands. An interesting point here is that research
with the EHI has shown that adults who are strongly lateralized with their hand
dominance, are proportionally more highly represented in repetitive strain injury
clinics than mixed-handed, or ambi-dexterous people (Kucera & Robins, 1989).
A large sample of teenagers and adults were to be given the EHI for a between-groups
comparison and for a comparison with other studies. After a pilot survey was
conducted it became evident that some of the tasks on the original inventory
generated confusion amongst the participants; tasks such as (a) which hand they held
upper-most on a broom, and (b) which hand they used to open a lid, both generated
much discussion and gesticulations. It would be desirable to replace these tasks with
strongly uni-manual tasks requiring strength and skill, as discussed in Chapter 4. The
exact number of tasks needed for such an inventory to have validity as a
representation of ‘general handedness’ would always be debatable, but Curt, Mesbah,
Lellouch and Dellatooas (1997) found that ten to twelve tasks was adequate. In a
clinical setting one virtue of a ten-item test is its brevity, for time efficiency, whilst
not sacrificing overall test validity.
The Adapted and Modified EHI
The EHI was changed in two ways. Firstly, the questions about eye and foot
dominance were deleted, leaving the original 10 handedness tasks from the short form
intact, although the instructions were altered by having them given verbally instead of
in writing. This adapted version of the EHI was labelled the EHI10. Secondly, four
tasks were added that all required strength and skill. This modified version was
labelled the EHI14. The new tasks were hammering, use of a racquet, use of a
screwdriver and the preferred shoulder for resting a bat on when preparing to hit a ball
(batting shoulder). These tasks have demonstrated excellent content validity and retest
reliability. Provins et al. (1982) found that screwdrivers were used exclusively in one
hand by 73 to 80% of their men and women, respectively. Hammers were used
exclusively in one hand by 81 to 84% of their men and women. Williams (1991)
found 91% of respondents used racquets in only one hand and 100% of respondents
hammered with only one hand. Raczkowski and Kalat (1974) had 95 to 100%

99
agreement between test 1 and test 2 for these four items. These tasks were familiar to
the local population; see Appendix D for the two versions.
The aim of conducting Experiment 1 was to answer the following four questions:
A. How reliable was the final score, the Laterality Quotient (the LQ), of the
EHI10?
B. How reliable were each of the original 10 tasks of the EHI10?
C. What was the content validity of each of the 10 original tasks?
D. Did the four new tasks demonstrate greater content validity and superior
reliability than some of the existing tasks?
The responses to these four questions are presented in Parts A, B, C and D
respectively. With regard to question C, the content validity of each of the EHI10
tasks as indicators of unilateral preference was examined in two ways. Firstly, if the
majority of the teenagers and adults indicated that they were “comfortable” using
either hand for a particular task, it would have low content validity for determining
hand dominance. Secondly, the frequency of the performance of each task by the
dominant hand would be an indication of the strength of the relationship of that task
with the dominant hand.
METHODS FOR PART A, B AND C
Seven hundred teenagers were asked to fill in the EHI forms in class groupings. A
total of 65 adults were approached individually in the waiting area of a physiotherapy
clinic as a sample of convenience, see Chapter 5 for further details. The adults were
followed up either at their next physiotherapy appointment, or by phone. The retest
time interval for both samples was two to four weeks depending on their availability.
Standard instructions were read to all the teenagers in class groupings and to the
adults individually.

100
Statistical Analysis for Part A
To assess the reliability of the LQs over the two to four week retest interval, Pearson’s
Correlation Coefficients (r) with p < .05, were calculated using SPSS (Graduate Pack
Version 11.0 for Windows, Chicago, IL). ICC models 2,1 and 3,1 along with their
95% confidence intervals (95% CI) and p values were also calculated for the LQs, for
comparison with the results of others. Kappa (k) and Spearman’s rank correlation
coefficients (rho or rs) were used as reliability measures also, because of their
suitability for analysing this type of ordinal, non-parametric data.
Measurement error was calculated using the Standard Error of Measurement (SEM).
The SEM was used to calculate the Minimum Difference to be Exceeded (MDE),
which further details presented in Chapter 5.
Once determined by this experiment, the MDE could be used to assist clinicians in
being able to detect if there had been a real change in the hand dominance patterns of
their patients over time. For example, if the LQ from the EHI of a particular patient
was +20 and the MDE value had been established to be 30, the change in the LQ from
one test to the next would need to be greater than 30 (out of a possible 100), before a
real change could be considered to have occurred in that patient’s hand dominance.
With this method there would be only a 5% chance of mistakenly concluding that
there was a real change in the dominance pattern of this patient when the change was
only due to measurement error. The clinician would then need to look at the direction
of the change to determine whether the change was towards becoming more right-
handed (a more positive value, such as +50) or more left-handed (a more negative
value, such as –10).
Statistical Analysis for Part B
To examine the reliability of each task in the EHI10, the initial and retest responses
were given nominal values. If a person always used their left hand for a task that
response was given the value of 1, if they used either hand that response was given
the value of 2, if they always used their right hand that response was given the value
of 3. Kappa and rho were used to analyse the reliability of the tasks.

101
Statistical Analysis for Part C
Firstly, the tasks that were indicated as being performed with equal preference for
either hand were tallied. Secondly, the participants were classified as right-handed if
initially their LQ lay between +100 and +10, and left-handed if their LQ lay between
–10 and –100. Anybody with an LQ of zero was asked whether they considered
themselves to be left or right-handed and classified accordingly. Then the preferred
hand for each individual item was sorted under these two groups. This method of
classification gave a simple visual way of identifying each task as an indicator of left
or right handedness, as done by Curt et al. (1997).
METHODS FOR PART D
The four new tasks were added in two stages after it was found that sweeping and
some other tasks were seen to be ambiguous, or confusing by the participants. Thus
after the EHI10 was administered to a pilot study of teenagers and adults, others were
trialed with the EHI14. It was intended that the results could be incorporated into
future projects.
Statistical Analysis for Part D
The content validity of the four new tasks were analysed in two ways; (a) by tallying
the frequency with which they were used in either hand, and (b) by tallying the
percentage of participants who used these tasks in their dominant hand. The reliability
of each of these new tasks was analysed using the Kappa coefficient.
RESULTS
There were 658 teenagers and 64 adults from both genders, who completed the EHI10
once. It was from these participants that 45 teenagers and 45 adults were repeat-
tested. Time constraints precluded the repeat testing of all the participants. Because
the four new tasks were added late in the data gathering period only 181 teenagers and
42 adults had the opportunity to respond to the hammering item, and 125 of these

102
teenagers and all of the 42 adults were asked to respond to the three other additional
tasks. Of the 42 adults who were asked to respond to the additional tasks only 24 of
them were able to be repeat tested for these items.
Part A
How Reliable was the Final Score, the Laterality Quotient (the LQ) of the EHI10?
For the LQ of the teenagers, the r, ICC (2,1) and ICC (3,1) could all be rounded to
.90, with p < .05 for all the results. For the LQ of the adults, the r, ICC (2,1) and ICC
(3,1) were all able to be rounded to .78 with p < .05 for all results. Accordingly, the
ICC (3,1) results, their 95% confidence intervals and the MDEs are presented in
Table 6.1, along with the Kappa and rho values.
Table 6.1 Reliability Values for the LQ of the EHI for Teenagers and Adults
Group ICC(3,1) ICC 95% CI Kappa rho MDE Teenagers .896 .819 – .941 .715 .816 23.79 Adults .779 .632 –.872 .692 .537 23.56 Note. MDE = Minimum Difference to Exceed p < .05
Part B
How Reliable Were Each of the Original 10 Tasks of the EHI10?
Of the possible 5,400 changes in preferred handedness (consisting of six possible
changes per task, for ten tasks, for 45 teenagers and 45 adults) between the initial test
and the retest, 71 changes (2.6%) were made by the teenagers and 48 changes (1.8%)
were made by the adults.
An analysis of the direction of the 119 changes revealed that only seven changes were
due to a change from consistently using the right hand to consistently using the left

103
hand for a given task, five of these changes were made by the adults. Five changes
were noted in the reverse direction, they were exclusively made by the adults. The
largest percentage of change (54/119 = 45.4%) was from a task being consistently
used in the right hand to being used in either hand. There were similar numbers of
responses where the participants (48/119 = 40.3%) moved from a position of using
either hand to consistently using the right hand. These changes are presented in
Figure 6.1.
On retest, the teenagers most often changed their responses about which hand they
used to open lids. The hand that held a spoon was their next most often changed task.
The adults most often changed their responses for which hand they held upper-most
on a broom, followed by which hand they used to open lids.
Figure 6.1. Number of response changes per task
The reliability of each item was calculated using k and rs as previously done (Ransil &
Schachter,1994), and displayed in Table 6.2. The hand preferred for writing never
changed. The hand preferred for drawing only changed for one teenager. Ten
teenagers and 18 adults did not make any changes to their inventories at retest.
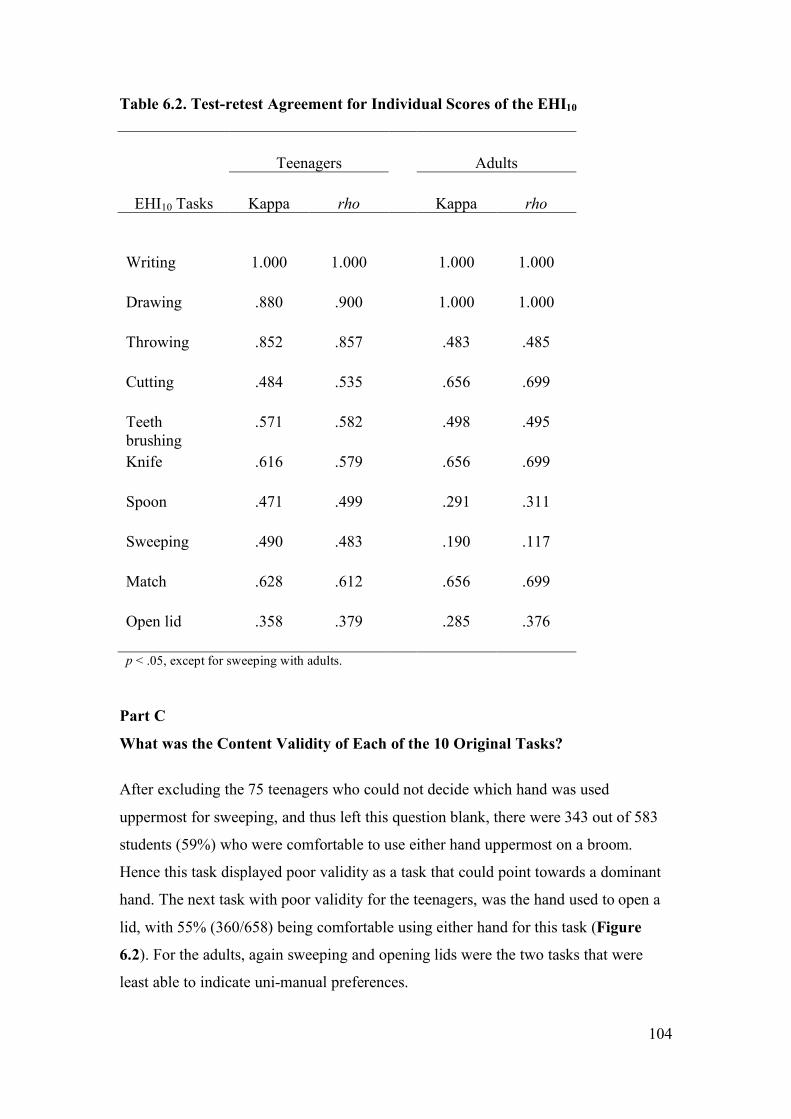
104
Table 6.2. Test-retest Agreement for Individual Scores of the EHI10
Teenagers
Adults
EHI10 Tasks Kappa rho Kappa rho
Writing 1.000 1.000 1.000 1.000
Drawing .880 .900 1.000 1.000
Throwing .852 .857 .483 .485
Cutting .484 .535 .656 .699
Teeth brushing
.571 .582 .498 .495
Knife .616 .579 .656 .699
Spoon .471 .499 .291 .311
Sweeping .490 .483 .190 .117
Match .628 .612 .656 .699
Open lid .358 .379 .285 .376
p < .05, except for sweeping with adults. Part C
What was the Content Validity of Each of the 10 Original Tasks?
After excluding the 75 teenagers who could not decide which hand was used
uppermost for sweeping, and thus left this question blank, there were 343 out of 583
students (59%) who were comfortable to use either hand uppermost on a broom.
Hence this task displayed poor validity as a task that could point towards a dominant
hand. The next task with poor validity for the teenagers, was the hand used to open a
lid, with 55% (360/658) being comfortable using either hand for this task (Figure
6.2). For the adults, again sweeping and opening lids were the two tasks that were
least able to indicate uni-manual preferences.

105
Figure 6.2. Percentage of teenagers and adults who stated that they were comfortable performing these tasks with either hand.
The percentage of teenagers and adults who always used their dominant hand for the
listed tasks in the EHI10 are given in Table 6.3. Despite the fact that the sample of
adult left-handers was small, when the responses were tallied according to whether it
was the dominant hand that performed a task, there were very few tasks that were not
indicators of unilateral preferences. There were 18 teenagers in the right-dominant
group who indicated that they wrote with their left hand and one right-dominant adult
who preferred left-handed writing and left-handed drawing. For teenagers Table 6.3
indicated that the EHI10 has 7 out of its 10 tasks that were strong indicators of
unilateral handedness, for those that were right-handed. Over 70% of the adults
performed all the listed tasks in their right hands all the time. Thus for these people,
these tasks are good indicators of hand preferences. The left-handers demonstrated
more of a mixed dominance, illustrating the point that many ‘non-right handers’ (or
people who are not consistently right-handed) have a dominant hand, which is defined
by the task.

106
Table 6.3. Numbers (%) of Teenagers and Adults Who Always Used Their Dominant Hand (Dom) for the Listed Tasks in the EHI10
Teenager
Adult
Item (R) Doma (L) Domb (R) Domc (L) Domd
Writing 570 (97.0) 85 (95.5) 60 (98.4) 2 (66.7)
Drawing 560 (95.0) 84 (94.3) 60 (98.4) 3 (100.0)
Throwing 455 (77.4) 54 (60.7) 55 (90.2) 1 (33.3)
Cutting 502 (85.4) 52 (58.4) 60 (98.4) 1 (33.3)
Teeth brushing
344 (58.8) 49 (55.1) 56 (91.8) 3 (100.0)
Knife 496 (84.4) 39 (43.8) 60 (98.4) 3 (100.0)
Spoon 398 (67.7) 66 (74.1) 55 (90.2) 3 (100.0)
Sweeping 168 (28.6) 32 (36.0) 44 (72.1) 1 (33.3)
Match 474 (80.6) 56 (63.0) 58 (95.1) 2 (66.7)
Open Lid 252 (42.9) 33 (37.0) 45 (73.8) 1 (33.3)
an = 588. bn = 89. cn = 61. dn = 3
Part D
Did the Four New Tasks Demonstrate Greater Validity and Superior Reliability?
There were some incomplete EHI forms, as indicated by the sample sizes in Tables
6.4 and 6.5. For the teenagers there were only 5.5% (10/181) who used a hammer in
either hand, 22.5% (28/124) who used a racquet in either hand, 20% (25/124) who
used a screwdriver in either hand and 8.0% (10/125) who rested a bat on either
shoulder. With respect to the adults, none indicated that they would prefer to use a
hammer in either hand. Only 7.1% (3/42) used a racquet in either hand, 11.9% (5/42)
used a screwdriver in either hand, and 2% (1/42) rested a bat on either shoulder.
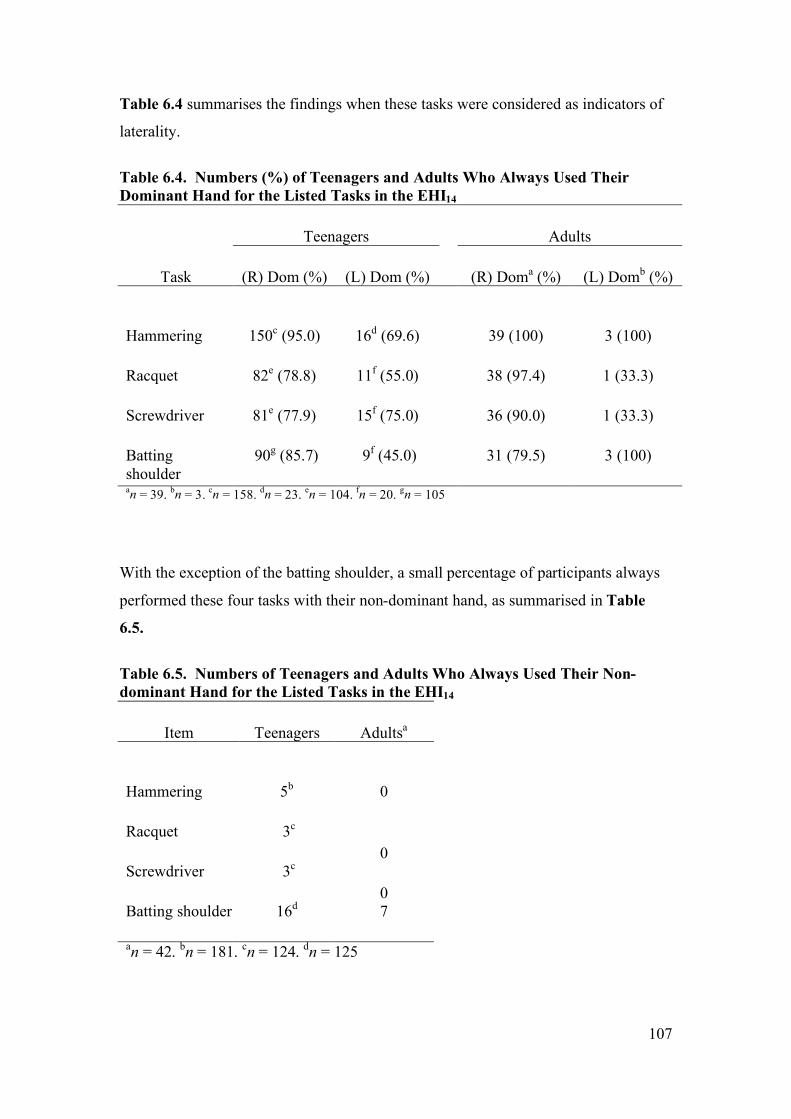
107
Table 6.4 summarises the findings when these tasks were considered as indicators of
laterality.
Table 6.4. Numbers (%) of Teenagers and Adults Who Always Used Their Dominant Hand for the Listed Tasks in the EHI14
Teenagers Adults
Task (R) Dom (%) (L) Dom (%) (R) Doma (%) (L) Domb (%)
Hammering 150c (95.0) 16d (69.6) 39 (100) 3 (100)
Racquet 82e (78.8) 11f (55.0) 38 (97.4) 1 (33.3)
Screwdriver 81e (77.9) 15f (75.0) 36 (90.0) 1 (33.3)
Batting shoulder
90g (85.7) 9f (45.0) 31 (79.5) 3 (100)
an = 39. bn = 3. cn = 158. dn = 23. en = 104. fn = 20. gn = 105
With the exception of the batting shoulder, a small percentage of participants always
performed these four tasks with their non-dominant hand, as summarised in Table
6.5.
Table 6.5. Numbers of Teenagers and Adults Who Always Used Their Non-dominant Hand for the Listed Tasks in the EHI14
Item Teenagers Adultsa
Hammering 5b 0
Racquet 3c 0
Screwdriver 3c 0
Batting shoulder 16d 7
an = 42. bn = 181. cn = 124. dn = 125

108
None of the teenagers were repeat-tested for all four new tasks. There were 24 of the
adults who completed the EHI14, their results are given below in Table 6.6 below.
Table 6.6. Test-retest Agreement for the Four New Tasks Considered for the EHI.
Task rho
Hammering
.840
Racquet 1.000
Screwdriver .805
Batting Shoulder .805
DISCUSSION
The original EHI, created over 30 years ago, had some tasks that scored low reliability
and had doubtful validity for dominance patterns, such as sweeping and opening lids.
The purposes of this experiment were to report the reliability of the EHI with local
participants, and to investigate whether it could be improved by substituting some of
the tasks with poor reliability values and low validity with more modern, more
reliable and more appropriate tasks, this has been achieved. The tasks of sweeping
and lifting a lid could be superseded by hammering and screwdriver hand.
Part A
How Reliable was the Final Score, the Laterality Quotient (the LQ) of the EHI10?
The reliability values of the LQ from the EHI10 for both the teenagers and the adults
were, according to Portney and Watkin’s definition, good to excellent when using
Pearson’s r, or an ICC (Portney & Watkins, 2000). When using r, McMeekan and
Lishman (1975) also found that the LQ of the EHI had good to excellent reliability for
a group of adult men and women, with unspecified ages. Their right-handed
participants (n = 23) achieved an r = .75 (p < .01) and their left-handed participants

109
(n = 28) achieved an r = .86 (p < .01). Compared to the general community, their
study had proportionately high numbers of left-handers because they actively
recruited left-handed people. The current study had the typical small percentage of
left-handed participants, thus it was not possible to separately analyse the left-handers
for this part of the analysis.
Ransil and Schachter (1994) repeat tested 735 adults by mail from various
professional groups over an 18-month period. The age and gender of the participants
were not stated. They modified their EHI by giving their participants five response
options (always left, usually left, no preference, usually right and always right). The
present study kept the original three options (‘always right’, ‘either hand’ or ‘always
left’). Despite this difference, their use of Kappa and rho make it possible to compare
their results with that of the present study. When they chose to use Kappa and rho as
their statistical tools they knew that their larger number of response options would
result in a greater probability of random error, and a greater correlation by chance,
thereby decreasing their Kappa and rho values. So not surprisingly, their Kappa value
of .222 was lower than the .715 and .692 for the teenagers and adults respectively in
the present study. Their rho at .715 was only slightly weaker than that of the current
sample of teenagers at .816, but notably stronger than the adults at .537.
The MDE values for the teenagers and the adults were 23.79 and 23.56 respectively.
As the Laterality Quotients are only scored in ten point increments, both these values
would need to be rounded up for application purposes and thus a change of more than
30 points could be considered to be a real change beyond measurement error.
Part B
How Reliable Were Each of the Original 10 Tasks of the EHI10?
As can be seen in Table 6.2 the rho values for the teenagers were only above .750 for
writing, drawing and throwing and only above this level for writing and drawing for
the adults. The adults had slightly different retest reliability values for the various
tasks as compared to the teenagers, most notably with throwing and sweeping. More
teenagers changed their responses than adults, but to a lesser magnitude. When the
teenagers made a change it was most often from using their right hand for a task all

110
the time, to using either hand. This was proportionately a smaller change than that
made by the adults, who for any given task typically changed from using their right
hand consistently, to using their left hand consistently. This behaviour was reflected
in the Kappa and rho values of the individual tasks presented in Table 6.2. As
discussed in Chapter 5, Kappa possesses a more precise measure of agreement, as it
rules out chance in this situation (Ransil & Schechter, 1994). Unlike rho, Kappa is
usually used for normally distributed attributes, and handedness is J-shaped in its
distribution, with a large majority of people being right-handed. Akin to rho, it does
not provide information concerning the direction and magnitude of test-retest
agreement (Ransil & Schachter). Hence the slightly different Kappa and rho results.
Only one adult reported changes to two highly reliable tasks. She was a teacher.
Initially she indicated that she could write and draw with either hand, but considered
herself to be left-handed, as indicated on her bio-data form, see Appendix E. During
the follow up phone interview for her repeat test, she explained that when she first
became a teacher she found that she could not manage to write, or draw on a
blackboard with her left hand. She explained that this was because the chalk smudged
too much. So she taught herself to become proficient in these blackboard duties with
her right hand. Thus the hand she used for these tasks was defined by the exact task.
Many of the adults wanted to discuss their EHI responses with the author when they
were initially filling in their forms, or at retest. They stated that they had not
previously taken note of which hand they used to perform the unskilled tasks. Upon
repeat testing some of the adults spontaneously stated that they had changed their
preference for which hand they used to throw a ball (for their dogs) because they had
suffered periods of shoulder pain necessitating a change in their throwing arm, so they
were confused as to which was their preferred throwing arm, the more accurate one,
or the less painful one.
Bryden (1977) tested 984 male and female university students aged 19 to 24 years.
Both the EHI and the Crovitz-Zener inventories were administered in the one session
(Crovitz & Zener, 1962). These two tests had five tasks in common; writing, drawing,
throwing, using scissors and teeth brushing. This duplication acted as a test retest set
up for these tasks, although there were only a few minutes between seeing the item in

111
the EHI and seeing it in the Crovitz-Zener inventory. These common tasks had a
stated correlation range of .80 to .90; the particular correlation coefficient was not
stated. Bryden certainly found higher agreement than the current wide range of rho
values that were between .485 to 1.0 for these same tasks. Not actually performing a
test retest scenario may have decreased the chance of some of the errors in Bryden’s
study, as participants may have been able to review their responses as they progressed
through to the second inventory. The large sample size in his study would also have
reduced the impact of a few extremely divergent responses.
Although Dorthe, Blumenthal, Jason and Lantz (1995) used Pearson’s r values to
evaluate 129 university students (ages and gender not stated) with an EHI, using a 7
point response scale, this study and the current one are in agreement about the two
most and two least reliable tasks, with the exception that the current study found the
use of spoons less reliable than that of knives. This is assumedly because knives
require much more precision for safety reasons and thus people can more clearly
visualise themselves using knives.
Again the results from another study (Ransil & Schachter,1994) were slightly
divergent to that of the present study. Both studies found that writing and drawing
were the two most reliable tasks, but the 735 adults surveyed by Ransil and Schachter
placed teeth brushing as the third most reliable task. Their least reliable tasks were
using a knife (10th), opening lids (9th), and striking matches (8th), compared to opening
lids (10th), sweeping (9th) and spoon usage (8th), in the present study. Their rho value
ranged from .670 to .852, whereas in the present study rho ranged from .117 to 1.0.
The order of the Kappa results for the current sample of teenagers mirrored those of
Ransil and Schachter for writing (1st), drawing (2nd) and throwing (3rd). Both studies
also agreed that opening lids had the lowest reliability value.
Familiarity with a task (Bryden, 1977) and the accompanying ability to imagine
oneself performing the task (White & Ashton, 1976) have both been hypothesized to
influence the reliability of tasks in self-report handedness inventories. When the
sweeping item was read to the teenagers, many of them laughed and made comments
such as “I don’t know which hand I hold uppermost on a broom, I never sweep the
floor!” Or they were observed to frown and move their arms in the air in a sweeping

112
action. Despite the adults stating that sweeping was a familiar task, they also had
difficulties imagining their hand placement for this task and often spontaneously
stood up to mime the action. It may be conjectured that hand placement typically
changes frequently during sweeping. Thus defining the task more precisely eg.,
sweeping across the floor from left to right may have improved its reliability, but
would not be a true representation of the complete task. The tasks of opening lids,
sweeping and self-feeding with a spoon do not require great dexterity and so which
hand is used for these tasks is not crucial and thus may not be visualised as easily as
using a knife, or drawing.
Although using different reliability statistics, different scoring methods and different
sample sizes, the general conclusion from the literature and from the present
experiment was that writing and drawing displayed excellent reliability, opening lids
and sweeping demonstrated poor reliability. Thus the highly skilled tasks were the
most reliable, the less cognitively demanding tasks were the least reliable. The study
of the adults highlights the point that the preferred hand for some tasks (such as ball
throwing) will change as people age and accumulate long-term pain and impairments.
Part C
What was the Content Validity of Each of the 10 Original Tasks?
Some tasks proved to be poor indicators of hand preference. Only 56% of the left-
handed and 59% of the right-handed teenagers used toothbrushes, brooms, or opened
lids with their dominant hand. The tasks that the left-handers often used in their right
hand were tasks that often could not be performed in the left hand, such as cutting
with scissors and using a knife. The standard orientation of knife and scissor blades
would typically preclude them from efficient left-hand usage. There were also 61% of
left-handers who did not exclusively throw a ball with their dominant hand. Thus for
left-handed teenagers, the EHI in its current form does not provide many strong
indicators of their dominant hand for a range of tasks which are not dictated by tool
design, or possible coaching/teaching influences. The left-handed adults had a similar
pattern of hand usage. Conclusions for the left-handed adults cannot be made as their
sample size of three was too small.

113
Bryden (1977), McFarland & Anderson (1980), Provins et al., (1982) and Williams
(1991) all found that sweeping and lid-opening were often performed with either
hand. McFarland & Anderson wrote about some tasks as being “manually
ambiguous” such as sweeping and opening a lid. These would be expected to have
low validity for handedness inventories. Provins et al. argued that the concept of the
validity of an inventory task depended on the concept, or definition of handedness,
and that activities requiring two hands and strength (eg., sweeping) would always be
less lateralized than one-handed skilled tasks such as writing.
Part D
Did the Four New Tasks Demonstrate Greater Content Validity and Superior
Reliability Than Some of the Existing Tasks?
Briggs and Nebes stated “the best single predictor of handedness may be the use of a
hammer” (Briggs & Nebes, 1975, p. 237). It has been used in recent grip strength
studies that have considered handedness (Hebbal & Mysorekar, 2003). Hammering
was a strong indicator of handedness in the current study, with 100% of the adults and
95% of the teenagers reporting hammering only with their dominant hand. Thus its
reliability was much higher than that of many of the original ten tasks. There was
much talk and mirth amongst both the teenagers and the adults when they considered
using their non-dominant hand to hammer, as accidents were thought likely to result
from this. The other three new tasks were also much stronger indicators of unilateral
preferences and achieved much higher reliability figures than sweeping and opening
lids, as also found by others.
Williams (1991) found that 91% (101/111) of undergraduate volunteers aged 18 to 21
(gender not stated) had a preferred hand for use of a racquet and all his participants
had a preferred hand for hammering. Provins et al. (1982) found both these tasks to be
well lateralized also. Ninety percent of males (840/934) and 88.2% (910/1,032) of
females used a racquet in one hand only. Eighty-one percent of males and 84.3% of
females used a hammer in only one hand. Use of a screwdriver was almost as strongly
lateralized. Raczkowski and Kalat (1974) found that 100% of their respondents
(41/41) stating that they would not swap their batting shoulder. Thus the findings of
these other studies are in agreement with the present findings.

114
Recent studies have deleted sweeping and lid opening from their adapted EHI
inventories (Dragovic, 2004; Hepper et al., 2005). Hepper et al. also deleted striking a
match, but did not give a reason for this decision. Thus consistent with Dragovic and
Hepper et al. the tasks of sweeping and opening lids could be deleted, but in
disagreement with Darovic, they should be superseded, not merely deleted. The
substitutions should be resistive tasks requiring skill, to give balance to the inventory,
as discussed in Chapter 4.
Other authors have found many other tasks that have excellent validity and are highly
reliable. The optimal number of tasks necessary to include in an inventory to clarify
the degree of hand dominance is of course debatable, and depends on the aims of the
tester (Curt et al., 1997; Provins et al., 1982). It is one of the challenges of the
clinician to find out the critical tasks that an individual patient must return to; but to
be able to summarise trends with a short, representative inventory will help pre-empt
the type of one-handed tasks that will need to be retrained, or adapted.
LIMITATIONS AND FUTURE RECOMMENDATIONS
The current experiment had several limitations. The repeat tested groups lacked
sufficiently large numbers of left-handed people and ideally could have been much
larger in sample size. Two repetitions of the EHI may have revealed clearer reliability
patterns for the participants. The EHI14, or the new EHI10 with the task substitutions
could also be repeat-tested to determine their levels of reliability. The four new tasks
should be repeat tested with a sample of teenagers to confirm their high level of
reliability for this age group.
In this present study, the handedness of the participants could have been assessed by
observations of the hand that performed a set number of tasks and compared these
with the EHI results. Time constraints did not allow this approach on a person-by-
person basis, but this limitation would not preclude such observations from being part
of a normal clinical assessment.

115
CONCLUSION
A simple and quick handedness questionnaire was required to quantify the degree of
hand dominance in a sample of teenagers, so that the effect of their handedness on
grip strength could be examined. Other handedness studies have not included this age
group. Although the original EHI10 had a number of tasks that were not highly
reliable, or valid indicators of uni-lateral preferences, its Laterality Quotient was
shown to have moderate to good reliability and validity as a tool to be used with urban
Australian teenagers and adults. For clinical relevance, the minimum difference to be
exceeded for a change in the Laterality Quotient of the EHI10 to be considered to be a
real change was 30 points.
The tasks of sweeping and lifting the lid of a box could be deleted from the test, due
to their poor reliability and poor content validity in assessing handedness. They could
be replaced with hammering and screwdriver usage. The substitution of the two items
would not alter the scoring or handedness classification methodology, however it
would give a shift in bias to tasks requiring strength and accuracy.
The relationship between the LQ and grip strength will be explored in the next
chapter.

116
CHAPTER 7
REPRESENTATIVENESS OF THE RESEARCH PARTICIPANTS
When measuring samples from a population it is not valid to extrapolate the results of
the findings to the general population if the sample is not a true representation of the
population. For example, if the heights of 10-year-old children were taken from a
sample of 10-year-olds from a paediatric endocrinology clinic, which specialises in
growth retardation, the heights of these children would not validly reflect the mean
and normal distribution of healthy 10-year-olds. If the sample of teenagers who
participated in the current grip strength research were all active members of the local
tennis club, they might have, on average, stronger grip strengths than some of their
peers, leading to a biased sample. In this thesis there has been a concerted effort to
ascertain that the participating teenagers were representative of the normal range in as
many aspects as possible, so that the results of the grip strength testing will be able to
be validly applied to the wider population of Australian teenagers.
This chapter has been divided into four sections. First, the anthropometric variables of
height, weight, body mass index (BMI), hand length, hand width and body
proportionality have been reported for this sample and compared to known norms.
Second, the prevalence of lifetime upper limb injuries sustained by these teenagers
has been presented and compared to that of local and international data collected from
industrialised nations. Third, the physical exercise levels were recorded and compared
to known data for teenagers, because exercise levels have been found to correlate
highly with muscular strength (Pujol, Barnes, Unterreiner, 2005). Fourth, hand
dominance groups were studied and compared to that of the general distribution of
handedness groups within the wider population, so that any findings for the
handedness and grip strength correlations could be generalised to the wider
population.
117
EXPERIMENT 2
PART 7.1A
ANTHROPOMETRIC VALUES
Grip strength throughout adolescence is dependent not only on age and gender (De
Smet & Vercammen, 2001; Doré, Rudolph, Diallo, Van, 2002; Mathiowetz et al.,
1986), but also on anthropometric characteristics such as height, weight (Rauch et al.,
2002; Sartorio, Lafortuna, Pogliaghi & Trecate, 2002), and hand length (Häger-Ross
& Rösblad, 2002). The range of body sizes between individuals is accentuated around
adolescent growth spurts (Mirwald, Baxter-Jones, Bailey & Beunen, 2002). Because
body size has such an impact on muscle strength, Jaric (2002) proposed that
normative databases for grip strength should be presented in body size and body
dimension groups, not just age and gender groups. Recording the anthropometric
characteristics of the grip strength of the current sample of teenagers make it possible
to sort them by these parameters, if required in the future.
It is hypothesized that the shape of a hand could affect its maximal grip strength
values and the reliability of these values. The impact of hand shape, defined as hand
width divided by hand length (the W/L ratio), does not appear to have been previously
investigated. Thus hand length and hand width (via hand circumference
measurements) should be recorded. Hand circumference has been defined here as the
three dimensional dorso-ventral measurement around the metacarpal-phalangeal joints
of the second to fifth digits.
The aims of this particular aspect of the grip strength study were twofold:
(a) to measure and present the anthropometric parameters for the sample, and then to
(b) compare them with the general population, to assess whether this sample was a
fair representation of the normal distribution of body sizes for Australian teenagers.

118
The problems with current Australian normative data for height and weight
The currently used Australian norms were created from data collected in 1929 and
1959 (Hamill, Dvizid, Johnson, Reed & Roche, 1977) and published in their current
form in 1989 (Pharmacia Growth Service, 1989a, 1989b). They are used throughout
the Queensland public hospital system (Dr Kylie Baker, Accident and Emergency
Specialist, personal communication, December, 2005). The expert panel of prevention
of obesity and overweight from the National Health & Medical Research Council
(NHMRC) now consider them to be out of date, because over the last 20 to 30 years
the means and ranges for heights, weights, and BMI for Australian teenagers have
increased (NHMRC, 1997). Some health care professionals prefer to use the North
American Centre for Disease Control (CDC) growth charts, which were released in
December 2000. Data from five North American health examination surveys collected
between 1963 and 1994 and five supplementary data sources were combined to
establish this particular growth chart data set (Kuczmarski et al., 2000). It is with
these charts that the current sample will be compared. See Appendix H for the data.
Height
Data from Australia in 1969, 1985 and 1997 demonstrated that the mean height of
male and female teenagers had increased by 3.1 cm and 1.2 cm respectively, over this
time period (Booth et al., 2003). New normative data is being collected by the World
Health Organization from eight countries including Australia, but is not currently
approved by the Australian NHMRC for use in Australia.
Thus Appendix H.1 is based on the CDC height charts. These charts show that 13-
year-old males and females are of similar heights, with 17-year-old males almost 20
cm taller than they were at 13 years of age. In contrast to the males, 17-year-old
females only grow an average of 6 cm in this four-year period.

119
Weight
The Pharmacia Growth Service weight charts, also from 1989, are also currently used
in Australian hospitals (Pharmacia Growth Service, 1989). As for the height charts,
these weight charts are also currently being revised and so it is recommended that the
CDC Weight Charts be used for comparisons with new local data, see Appendix H.2.
The National Nutrition Survey data from 1995 showed that Australian teenagers were
on average heavier in 1995 than they were in 1985 (NHMRC, 1997), and the
prevalence of being overweight, or obese, has also increased in this time period.
Based on data from Australia taken in 1969, 1985 and 1997, the mean weight of
teenage males and females has increased by 3.9 kg and 2.0 kg respectively, over this
time period (Booth, Wake, Armstrong, Chey, Hesketh & Mathur ,2001). So although
they will be expected to be heavier than in previous decades, if the current sample of
teenagers is to represent trends in the general population, it would be expected that the
13-year-old males and females will be of a similar weight and that the next heaviest
group will be the 17-year-old females and that the 17-year-old males will be the
heaviest group.
Body Mass Index
Classifying teenagers by their BMI provides a system to study the relationship of their
body shapes with their grip strength abilities. There are a number of ways to calculate
the BMI of a person (Gibson, 1990). Quetelet’s index is acceptable in Australia
(Booth et al., 2003; NHMRC, 1997). The formula is body weight in
kilogrammes/height in metres2. Lazarus, Baur, Webb and Blyth (1996) found that
BMI was an excellent indicator of body fat measured by dual X-ray absorptiometry in
people aged 4 to 20 years. Cole, Bellizzi, Flegal & Dietz (2000) derived age and
gender-specific cut-off values for teenagers and these values as presented in
Appendix H.3 will be used for the BMI comparisons in this thesis.
Some BMI trends are helpful to note. An increase in BMI values is seen in males
between the ages of 13 and 17 years. It is related to an increase in fat-free muscle bulk
due to increased testosterone levels throughout the years of puberty (Sinha-Hikim et

120
al., 2002; Storer et al., 2003). This increase is not so marked in adolescent females
because the slight increase in body fat experienced by the females is combined with a
non-significant increase in muscle bulk during this same period of growth, and
adipose tissue is lighter than muscle (Gibson, 1990). Thus it is expected that the BMI
of the participant females will be similar to that of the females in the Sydney-based
study of O’Dea and Abraham (1995), who found mean BMIs of 19.4 and 21.1 for the
pre- and postmenarche 13-year-old girls respectively. Approximately 20% of the
teenagers in the sample will be expected to be overweight, or obese (New South
Wales Schools Fitness and Physical Activity Survey of 1997, as cited in Booth et al.,
2001).
Hand Dimensions
No Australian database was found for hand dimensions such as hand length, hand
width, the width/length ratio (W/L ratio), or hand surface area.
Hand lengths
It must be assumed that the 50th percentile is equivalent to the mean for this data.
Large population databases from overseas have presented 50th percentile hand lengths
for both 13-year-old males and females as 17.0 cm, and for 17-year-old males and
females as 19.0 and 17.5 cm, respectively (Pheasant, 1996). A much smaller, but
more recent database presented the mean hand length for 13-year-old males (n = 52)
as 18.1 cm, for 13-year-old females (n = 45) as 17.6 cm, for 17-year-old males (n =
18) as 19.1 cm and for 17-year-old females (n = 20) as 18.0 cm (Amirsheybani,
Crecelius, Timothy, Pfeiffer, Saggers & Manders, 2001). Skeletal growth of the hand
ceases earlier for females than males. Nishikawa (1998) found that 98% of the growth
of male and female hands was completed by 13.5 and 15.5 years of age respectively.
Thus it is expected that the current sample of 13-year-old males and females will have
similar hand lengths, and that the 17-year-old males will, on average, have hands 2
cm longer than the other groups.

121
Hand widths
There is consensus from around the world that from the adolescent years into
adulthood, the hands of males are significantly wider than that of females (Abdel-
Malek et al., 1990; Merkies et al., 2000; Subirá & Malgosa, 1988). The increased
width is mainly attributed to an increase in the muscle bulk of the intrinsic muscles
that is expressed in the greater grip strength of older teenage males, as shown by
Mathiowetz et al. (1986) and many other studies. Fiftieth percentile data from
Pheasant (1996) states that 13-year-old males have slightly broader hands than 13-
year-old females at 8.0 cm, compared to 7.5 cm. Also 17-year-old males have hand
widths of 9.0 cm, as compared to 7.5 cm for 17-year-old females, whose hand widths,
on average, have ceased growth by this age.
Hand surface area
Amirsheybani et al. (2001) found that although the hand surface area of both genders
increases to the age of 17, it starts to plateau by the age of 14. They found that the
males in each age group had higher hand surface areas as compared to their body
surface areas (0.82%), than the females (0.81%). As hand surface area is dependent to
some degree on bone width and length, not just soft tissue bulk, it is interesting to
note that the sequence of nine skeletal ossification events in the hands and wrists of 6
to 22 year-olds is similar in males and females, though the females advance more
quickly (Chang, Wu & Chen, 1990). Thus the lack of increased surface area of the
hands of the females from the age of 13 to 17 years in the study of Amirsheybani et
al. (2000) is probably due to the cessation of bone growth already having occurred.
Hand shape
In regards to hand shape, Abdel-Malek et al. (1990) found that 18 to 23-year-old
Egyptian males had bigger (longer and wider) hands than age-matched Egyptian
females. For both genders, they also found that 68% of the variation in body height

122
was accounted for in hand length, but only 4% of the variation in body height related
to hand width. These results did not have any gender differences. Skeletal length and
hand length should be expected to be strongly correlated, but as hand width takes into
account muscle bulk of the intrinsic muscles, it would be expected that hand width
would not necessarily be strongly correlate with stature (height).
METHODS The methods for taking the anthropometric dimensions of height, weight, hand length
and hand circumference of the sample were presented in the general methods section
of Chapter 5. The surface area of each hand was calculated by multiplying the length
by the width in accordance with others (Amirsheybani et al., 2001; Rossiter, Chapman
& Heywood, 1996).
STATISTICAL ANALYSIS Outliers
Mean anthropometric values and their standard deviations (SD) for a relatively small
sample can only be a reasonable representation of the general population if there are
no outliers skewing the data, thus before these calculations were made, scatter plots
were scrutinized for outlying data points. Outliers were checked for recording and
transcription errors from the original recordings. Means and their SDs were then
calculated and any outlier with a value greater than 3 SD was excluded from further
analysis for that variable, as suggested by Portney and Watkins (2000) and the means
and SD were then recalculated without these outliers. See Appendix H for details of
the outliers.
Body Mass Index (BMI)
The BMI values for this study were calculated using Quetelet’s index. As for recent
Australian studies (Booth et al., 2001; Booth et al., 2003), the age and gender-specific
BMI cut-off values for the classifications of ‘overweight’ and ‘obese’ for children and

123
adolescents, were taken from the compilation of international BMI surveys as
presented by Cole et al. (2000), refer to Appendix H.3.
Comparison of Anthropometric Values Within the Sample of Teenagers
Independent samples t tests were performed with SPSS Version 11 to compare the
means of each body dimension (height, weight, BMI, hand length, hand width, hand
surface area and hand W/L ratio) for each age and gender group, to determine whether
there were significant differences between each group, as observed in larger
databases. As the currently available norms are out of date, this was another way of
confirming the normal anthropometric proportions of this sample of teenagers. For
example, the literature indicates that 17-year-old males are significantly taller than 13-
year-old males (Tanner, 1962). Thus a t test was performed between the mean height
of the 17-year-old males and the mean height of the 13-year-old males, to ascertain
whether the measured difference was significant. As multiple t tests increase the
chances of making a Type 1 error (Tilley, 1999), a relatively low p value of .01 was
taken as the level of significance, rather than the standard .05. The t values that were
used to calculate the eta square indices (which are a way of expressing the strength of
the significance of the results) were all taken from the t values for unequal variance,
because each sample group had different variance values. For example, the weight
variance for the 13-year-old males and for the 17-year-old females was 162.06 and
80.93 respectively. The eta square indices were calculated using the formula of Green,
Salkind and Akey (2000), as follows:
Eta square = ________t2 ______
t2 + (N1 + N2 –2)
Scatter plots were used to graphically illustrate the correlations between
anthropometric variables and to screen for outliers. The correlation coefficients r and
the adjusted R2 values were also used for regression analyses to assess the strength of
the relationship between the variables, such as hand length versus body height and
hand width versus hand length, for each of the age and gender sub-groups.

124
RESULTS Equipment calibration
For this part of the experiment only the electronic scales required a calibration check,
as the other pieces of equipment did not have moving or electronic parts that could
alter over time. When the electronic scales were measured with government certified
weights of 70 kilograms at the beginning and end of the project they were found to
read true to the nearest 0.1 of a kilogram.
There were missing data for a small number of the tested teenagers for some of the
variables. These are noted under the relevant sections.
Height, Weight and BMI
The mean heights, weights and BMIs for each age and gender group, are presented in
Table 7.1.
Outliers
There were outliers for height (n = 2), weight (n = 2) and BMI (n = 3). These seven
outliers were excluded from the final presentation of the means and SDs so as not to
distort a comparison with the population averages. Details of the outliers are given in
Appendix H.
These seven data value outliers were not deleted from any other calculations, such as
the independent samples t tests for comparisons between sub-groups.
The t test result tables for height, weight and BMI comparisons are given in
Appendix I. Between the 13-year-old males and 13-year-old females, there was no
significant difference in mean height, weight or BMI. However, the 17-year-old males
were significantly taller and heavier, than the 17-year-old females, but their BMI was
not significantly greater. As expected within the genders, the 17-year-old males were

125
significantly taller and heavier, with greater BMIs than the 13-year-old males. For the
females, the 17-year-olds were significantly taller and heavier, but their BMIs were
not significantly greater than the 13-year-olds. Thus they were proportionately larger,
not more obese, or proportionately more muscular than their younger counterparts.
The strength of these significant results can be seen from the eta-squared values in
Appendix I, with the strongest difference being between the average height of the 13-
year-old and 17-year-old males. For these two groups 62.7% of their height difference
was explained by their age difference.
A comparison of the anthropometric values between the 13-year-old males and the
17-year-old females is relevant to the grip strength analysis in Part 2 of this chapter.
When comparing these two groups, the females had significantly greater height,
weight and BMI values. The strength of these differences was relatively weak at 8.2,
15.9 and 14.3% of the difference in these three variables, respectively being
accounted for by their age and gender. It was considered superfluous to compare the
13-year-old females with the 17-year-old males as the parameters of the 17-year-old
males were obviously much greater than that of the 13-year-old females.
The BMI values in Table 7.2 demonstrate an over-weight problem amongst the
teenagers, as expected by the research of Booth et al. (2001).
Table 7.1. Mean Height in cm, Mean Weight in kg and BMI for all Groups
Group n Height (SD)
Weight (SD)
BMI
13 y.o. males
67
159.2 (8.8)!
50.0 (11.7)!
19.7 (3.3)!
13 y.o females 52 158.9 (5.6)! 52.3 (11.2)! 20.8 (4.1)
17 y.o. males 53 177.4 (5.2)*! 69.7 (10.2)*! 21.9 (2.8)!
17 y.o. females 62 163.6 (5.9)*! 59.7 ( 8.5)*! 22.4 (3.3)
*Indicates a significant difference between gender groups of the same age. !Indicates a significant difference between age groups of the same gender.

126
Table 7.2. Number (%) of Students That Where Over-Weight and Obese
Group
Overweight (%)
Obese (%) 13 y.o. males
14 (20.8)
1 (1.5)
13 y.o. females
13 (24.5)
3 (5.6)*
17 y.o. males
7 (12.9)
1 (1.9)*
17 y.o. females
13 (20.6)
2 (3.2)*
Note. Based on the BMI criteria of Cole et al. (2000). *One teenager from each of the groups in Table 7.6 was considered to be an outlier in the population comparison, but has been left in this present tally.
HAND DIMENSIONS
Hand measurements were unable to be obtained for five of the 13-year-old students.
Hand length
See Table 7.3 for hand length results. There was no significant difference between the
hand lengths of the 13-year-old males and the 13-year-old females
(t = 1.261, p = .210). The 17-year-old females had hand lengths that were not
significantly longer than the 13-year-old females (t = 0.467, p = .642). The 17-year-
old males had hands that were significantly longer than the next longest group, the 13-
year-old males (t = 9.121, p < .001, eta square = .418), although the strength of this
difference (at 41.8% of the hand length accounted for by the age of the males) was
weaker than the difference in height, which was 62.7%.
Hand width
See Table 7.3 for hand width results. The hands of the 13-year-old males were
significantly wider than those of the 13-year-old females (t = 3.787, p < .001, eta
square = .113) and the 17-year-old females (t = 5.620, p < .001, eta square = .202).
There was a significant difference between the widths of the 13-year-old males and
the 17-year-old males (t = 6.247, p < .001, eta square = .252). There was no
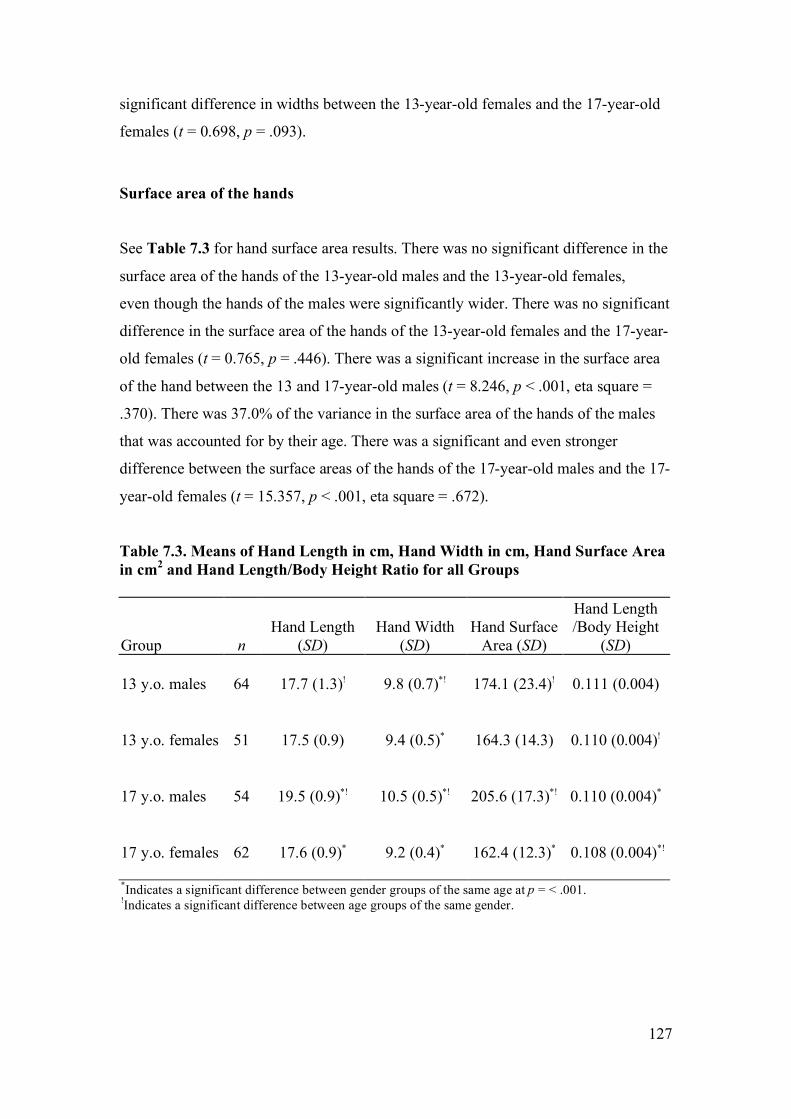
127
significant difference in widths between the 13-year-old females and the 17-year-old
females (t = 0.698, p = .093).
Surface area of the hands
See Table 7.3 for hand surface area results. There was no significant difference in the
surface area of the hands of the 13-year-old males and the 13-year-old females,
even though the hands of the males were significantly wider. There was no significant
difference in the surface area of the hands of the 13-year-old females and the 17-year-
old females (t = 0.765, p = .446). There was a significant increase in the surface area
of the hand between the 13 and 17-year-old males (t = 8.246, p < .001, eta square =
.370). There was 37.0% of the variance in the surface area of the hands of the males
that was accounted for by their age. There was a significant and even stronger
difference between the surface areas of the hands of the 17-year-old males and the 17-
year-old females (t = 15.357, p < .001, eta square = .672).
Table 7.3. Means of Hand Length in cm, Hand Width in cm, Hand Surface Area in cm2 and Hand Length/Body Height Ratio for all Groups Group
n
Hand Length
(SD)
Hand Width
(SD)
Hand Surface
Area (SD)
Hand Length /Body Height
(SD)
13 y.o. males
64
17.7 (1.3)!
9.8 (0.7)*!
174.1 (23.4)!
0.111 (0.004)
13 y.o. females
51 17.5 (0.9)
9.4 (0.5)*
164.3 (14.3)
0.110 (0.004)!
17 y.o. males
54 19.5 (0.9)*!
10.5 (0.5)*!
205.6 (17.3)*!
0.110 (0.004)*
17 y.o. females
62 17.6 (0.9)*
9.2 (0.4)*
162.4 (12.3)*
0.108 (0.004)*!
*Indicates a significant difference between gender groups of the same age at p = < .001. !Indicates a significant difference between age groups of the same gender.

128
THE RELATIONSHIP OF HAND DIMENSIONS WITH OTHER
VARIABLES
Hand length versus body height
Hand length and body height were linearly related for all groups. For the 13-year-old
males r = .883, adjusted R2 = .777; 13-year-old females r = .642, adjusted R2 = .400;
17-year-old males r = .646, adjusted R2 = .406; and 17-year-old females r = .638,
adjusted R2 = .397. Thus 77.7%, 40.0%, 40.6% and 39.7% of the variance in hand
length was accounted for by body height in these four groups respectively, the most
notable group being the 13-year-old males.
Hand length/body height ratio
The hand length/body height ratio was created by dividing each participant’s hand
length by their body height, as done previously (Kulaksiz & Gozil, 2002), see Table
7.3. The only group that was significantly different to the others was the 17-year-old
females, who had slightly but significantly shorter hands in relation to their body
heights.
Hand width versus hand length
Hand widths were most strongly correlated with hand lengths for the 13-year-old
males. The other three groups had weaker but significant correlations, see Table 7.4.

129
Table 7.4. Correlation Values for Hand Width with Hand Length and the W/L Ratio Values
Hand Width Hand Length Correlations
Group
n
r
Adjusted R2
W/L ratio Mean (SD)
13 y.o. males
63
.810
.651
0.551 (0.021)*!
13 y.o. females
51
.438
.175
0.537 (0.030)*
17 y.o. males
54
.569
.311
0.539 (0.024)*!
17 y.o. females 62
.325
.091
0.525 (0.026)*
*Indicates a significant difference between gender groups of the same age. !Indicates a significant difference between age groups of the same gender. p < .001.
The W/L ratio
The closer the W/L ratio came to one, the squarer the hand shape, see Table 7.4.
Scatter plots were created to check for outliers. One outlier was detected in the 13-
year-old males group and one in the 17-year-old females group. These were deleted
from the mean and t test calculations. The 13-year-old males had significantly higher
W/L ratio values than the 13-year-old females (t = 2.958, p = .004, eta square = .075)
and the 17-year-old males had significantly higher W/L ratio values than the 17-year-
old females (t = 3.051, p = .003, eta square = .075). Thus the males had squarer
shaped hands than the females. The 13-year-old males had a significantly higher W/L
ratio compared to the 17-year-old males (t = 2.942, p = .004, eta square = .073). The
13-year-old females did not have significantly different W/L ratios to the 17-year-old
females (t = 2.286, p = .024).

130
DISCUSSION From the above results it can be seen that males keep growing in all the measured
parameters between the ages of 13 and 17 years, but females tend to cease growth of
their hands, although they continue to grow in height and weight between these two
age groups. These results are consistent with the existing local and international
literature with regards to these parameters.
Height
When compared to the CDC height charts, the mean heights of the sample of
teenagers was slightly taller than that of the height charts. The 13-year-old males were
3.2 cm taller, the 13-year-old females were 1.9 cm taller, the 17-year-old males were
2.4 cm taller, and the 17-year-old females were 0.6 cm taller. This data is consistent
with the reported national trends for height increases over the last three decades
(Booth et al., 2003).
Weight
When compared to the CDC weight charts, the mean weights for all the sample
groups were heavier than the 50th percentile readings for the normative data, as
predicted in the introduction of this chapter. The 13-year-old males were 4.5 kg
heavier, the 13-year-old females were 6.3 kg heavier, the 17-year-old males were 4.7
kg heavier and the 17-year-old females were 4.7 kg heavier. Although 50th percentiles
do not always equal mean scores, in a population with an assumedly normal shaped
curve, these two figures should theoretically be equal. Based on data cited in Booth et
al. (2003) the mean weight of teenage males and females has increased by 3.9 kg and
2.0 kg respectively, over this time period.
The greater mean weights of the teenagers in the present data set are a little higher
than the national average, which was based on surveys by Booth et al. (2003)
compiled from data originating in the more southerly states, excluding Queensland.
The mean difference between the sample and teenage populations of these other

131
States mirrors the comparatively higher prevalence of being overweight or obese as an
adult living in Brisbane, as compared to adults living in the southern states (NHMRC,
1997). This comparison is justified as trends in adulthood weight gains have been
shown to typically commence in childhood (Wang, Patterson & Hills, 2002).
Body Mass Index
When compared to the prevalence of being overweight, or obese from a large survey
conducted in New South Wales (NSW) in 1997 (Booth et al., 2003) (n = 1,458 for the
13-year-old age group), the prevalence of being overweight in the current sample of
13-year-old males was greater by 5.3%, but the prevalence of being obese was less by
3.3%. The prevalence of being overweight or obese in the current sample of 13-year-
old females was greater by 9.9%, and 2.3% respectively. The prevalence of being
overweight or obese increased from 1985 to 1997 (Booth et al., 2003), but the
increase in the current sample does not reflect a further increase, as this data was
collected in 1997 and 1998.
Depending on whether the adult, or younger teenager norms are taken, the current
sample of 17-year-olds has either relatively slightly greater, or slightly lower
prevalence, of being overweight or obese, as compared to the only available norms
which are based on either 15-year-olds (Booth et al., 2003), or adults (NHMRC,
1997).
The current study found that the mean BMI for 13-year-old females of 21.08 (SD
4.49) was within the range published by Sydney-based researchers (O’Dea &
Abraham, 1995).
Hand dimensions and ethnicity
As hand dimensions are linked to ethnicity (Reeves, Varakamin & Henry, 1996),
errors can be made in attempting to make tight comparisons between Australian and
overseas populations. Even within the one ethnic group there can be differences in
hand sizes, as found in one study which surveyed the hand sizes of women working
132
on farms in three areas of Nigeria (Okunribido, 2000). Also periodic revision of all
Australian growth percentiles have been advocated, due to the changing mix of the
population and the socio-economic factors in urban Australia (Guaran, Wein, Sheedy,
Walstab & Beischer, 1994). With regard to Australian teenagers, W/L ratio databases
have not been previously published, so this new survey data may serve as a database
for the shape of the hands of the average Australian teenager.
Hand length
The 17-year-old males had hand lengths that were significantly longer than all of the
other groups. All of the other groups had hand lengths that were not significantly
different to each other. The comparative relationship between the four groups was
consistent with the research from overseas, as presented earlier in this chapter.
Of greater relevance to the grip strength aspect of the study, the mean hand lengths
were comparable to matched age and gender samples from another grip strength study
of Swedish children by Häger-Ross & Rösblad (2002). Their 13-year-old males (n =
20) and 13-year-old females (n = 22) had mean hand lengths that were 0.70 cm and
0.39 cm shorter than the matched groups in the present study. The mean hand lengths
of their 16-year-old males (n = 22) and 16-year-old females (n = 16) were 0.06 cm
and 0.03 cm longer than their matched groups in the present study, respectively. Thus
although the hands of their 13-year-olds were shorter than those of the 13-year-olds in
the present study, by the age of 16 they had surpassed that of the 17-year-olds in the
current study. They used a hand length measurement derived from hand tracings,
using the radial styloid process as their proximal landmark. This difference in
measurement technique and their smaller sample size may explain most, if not all, of
the differences between the two samples. Thus the grip strength comparisons will still
be valid.
In comparison to the 50th percentile for heights reported by Pheasant (1996), the mean
heights of the teenagers in the current study were consistently taller by a range of 1.5
to 4.1 cm. As hand length is proportional to body length (Abdel-Malek et al., 1990)

133
and the height of Australian teenagers have increased over the last three decades
(Booth et al., 2003), these results give a consistent and valid picture of the current
sample of teenagers being representational of urban Australian teenagers for hand
length.
Hand width
In the current sample, the 13-year-old males had hand widths that were significantly
wider than either of the female groups. The 17-year-old males had significantly wider
hands. There are no local databases for comparison.
The 50th percentile hand widths for male and female British 13 and 17-year-olds
(Pheasant, 1996) were between 1.55 cm and 1.88 cm narrower than the age and
gender matched present teenagers. The widths of the current sample were derived
from half of the circumferences. Pheasant did not take hand thickness into account
when measuring widths, thus these seemingly greater widths in all of the present
groups may not be so if hand thickness was subtracted from the results. In one study
of rural farming women, the average hand thickness was found to be between 2 and 3
cm (Okunribido, 2000). Thus a difference of approximately 2 cm between the data of
Pheasant and the current study is consistent with this disparity.
A study in the Netherlands reported the hand circumferences of 40 males and 41
females grouped in the one age span of 13 to 19 years of age (Merkies et al., 2000).
Their mean hand circumferences were 0.77 cm and 0.18 cm greater for males and
females respectively, than those of the combined age groups of the present study.
There were similar ranges and standard deviation values between the two groups.
Thus again the present results can be said to be reasonable.

134
Hand surface area
Amirsheybani et al. (2001) reported hand surface areas (as calculated from hand
length and hand width graphs) that were less than that of the present study. This was
probably due to the different methods for calculating hand widths and the effect of
averaging their male and female results. They found that the surface area of the hand
for the 13-year-olds and 17-year-olds was approximately 135 cm2 and 142.5 cm2
respectively, which was notably less than the values of the current study. See Table
7.3 for comparison. The relationship between the surface area of a hand and its ability
to generate grip strength is examined in Part 3 of this chapter.
Hand length and body height correlations
The relationship between hand length and body height is dynamic over the adolescent
years, especially during growth spurts that are noted to occur earlier in females than
males. The low correlation coefficients for the body height versus hand length
relationship in the current study may well be due to these factors. It is interesting to
note that the correlation was greatest with the 13-year-old males, who may not have
started, or only just commenced these “uneven” growth spurts (Taranger & Hagg,
1980).
Hand length/body height ratio
When comparing only the dominant hands of the 17-year-olds in the current study
with the right hands of the young adults in the study of Kulaksiz and Gozil (2002)
(which was not split by age), the two studies concur that males have significantly
longer hands (p < .001) in relation to their body height, than females. Thus in the
current study the 17-year-old males who were of the same height as the 17-year-old
females, may have been able to generate greater grip strength with their relatively
longer hands and thus greater lever arms. The biomechanics of this has been discussed
in the anatomy section of Chapter 1.

135
Hand width versus hand length and the W/L ratio
The males in the current study had squarer shaped hands than the females. This
gender difference in hand shape, is in agreement with a larger overseas study
(n = 393) (Kulaksiz & Gozil, 2002). The hands of the males became squarer, as they
became older teenagers. As some of them became significantly stronger, their muscle
bulk would have expanded their hand widths, but not their hand lengths. The females
had greater variation in their ratios of hand widths to hand lengths, as expressed by
their lower correlation values and higher SDs. This variation in hand width being
independent of hand length was also found in an Egyptian study (Abdel-Malek et al.,
1990). In contrast to the present study, they found no significant gender difference in
their adults. The impact of the relationship between hand shape, grip strength force,
and the reliability of the grip strength force, are dealt with in Chapter 10 and also
reported in Clerke et al. (2005) in Appendix B.
Reliability of the anthropometric measurements
Height, weight, hand circumference and hand length were taken slowly and with care,
but they were not repeat tested for three reasons. Firstly, it was considered that these
parameters would not change significantly within a retest period of 1 to 4 weeks, as
the proportionality of the length and width of the upper limb bones stabilises from
mid-adolescence (Ackland & Bloomfield, 1996). For hand widths to increase the
teenagers would need to be performing intense upper limb training to increase the
muscle mass of the intrinsic muscles of the hand. Significant changes within a four-
week period are considered unlikely (M. Henneberg, personal communication 10th
June 2004). Also all these teenagers were in school full-time, and no student reported
going on a sports camp between the first and the second test dates. This is note worthy
as intense physical education classes over a three-week period, have been shown to
increase the grip strength of 16 year-old females (Pujol, et al., 2005).
Secondly, extreme accuracy for these particular parameters was not deemed to be
necessary for this study, as previously published paediatric grip strength research
published reference ranges for grip strength by height in 10 cm increment groups

136
(Rauch et al., 2002). Others have accepted height and hand length with accuracies of
+0.25 cm and weight with an accuracy of +0.1 kg, (Häger-Ross & Rösblad, 2002).
Thirdly, the instruments and methods used were considered to be the ‘benchmark’ for
highly reliable and valid anthropometric measurements (Booth et al., 2003). The hand
dimensions were not repeat-measured because studies have found other upper limb
measurements to be stable with high levels of reliability (Green & Briggs, 1989;
Henneberg et al., 2001).
STUDY LIMITATIONS
Reliability
It could be argued that ideally the reliability of the methods should have been
examined by repeat testing every teenager within a short time period, such as 4 weeks.
Other researchers (as cited in Booth et al., 2001) have taken height readings to the
nearest 0.1 cm. This could have been done in the current study in which the heights
were recorded to the nearest 0.5 cm. Ideally measurements of subcutaneous fat, such
as skin fold calliper measurements, could also have been included for the assessment
of obesity.
Ethnicity
Ethnicity has an influence on anthropometric ratios (Reeves et al., 1996) and may
therefore impact upon grip strength generation with JamarTM-like dynamometers.
Thus recording the ethnicity of each of the teenagers may have been of value.
Henneberg and George (1993) write that anatomical and anthropometric differences
between people should not be based on racial groups (such as ‘black’ or ‘white’), but
“on nationality, territorial origin or socio-economic parameters.” In light of this, the
terms ‘ethnicity’ or ‘ethnic background’ seem to be reasonable when wishing to
describe a population, as the reader needs to know if the surveyed population is
representative of and can be generalised to the local populus. This current sample
appeared to be mainly of an Anglo-Saxon origin. Also all students were able to
communicate fluently in English during the grip strength tests and the form filling
sessions, and so were assumed to have lived in Australia for at least a number of

137
years, as opposed to recent refugees, who may have issues of malnutrition and growth
retardation.
The classification into territorial origin may have been regarded as a sensitive matter
by some of the students. Also in our Australian multicultural society, teenagers of
mixed ethnic background would have been difficult to classify. Thus classification of
healthy urban teenagers into groups with similar ethnic origins within our
multicultural society is not deemed necessary.
Pubertal stage
As pubertal stage has an effect on BMI for females (O’Dea & Abraham, 1995) and
grip strength for males (Kreipe & Gewanter, 1985), pubertal stage could have been
recorded with a reliable, self-evaluation method, such as the Tanner method (Kreipe
& Gewanter, 1985). Formal written guardian consent (rather than passive consent)
would have been considered necessary to help ensure that the teenagers did not feel
that the project was an inappropriate invasion of their privacy. Rather than the sole
female researcher (the author) presenting the Tanner photos of the stages of male
genitalia maturation to the male students, a male researcher would have been viewed
as a more appropriate person to do this within our society, as done previously (Kreipe
& Gewanter, 1985). The usefulness of this information needed to be weighed against
its possible negative ramifications. It could be argued that the recording of this self-
evaluation method may have been seen to be personally threatening, and this in turn
may have reduced the participation rate, or even jeopardised the support of the school
for the research.
Hand dimensions and right-left asymmetry
Some paediatric studies have found a statistically significant asymmetry between the
lengths of the two hands in children aged 4 to 9 years (Means & Walters, 1982).
Others have found no differences in the surface areas of the two hands in 800 people
in the broader age range of 2 to 89 year olds (Amirsheybani et al., 2001). Upper arm
asymmetry in post-pubescence, right-handed teenagers, has been reported, but not in
younger teenagers (Cole, Burwell, Polak & Webb, 1998; Schell, Johnston, Smith &

138
Paolone, 1985). Whilst evidence exists that handedness influences the bilateral
dimensions of the arm (Hebbal & Mysorekar, 2003; Kulaksiz & Gozil, 2002),
Martorell, Mendoza, Mueller and Pawson (1988) found that the difference between
the right and left sides was not greater than measurement error. Hand width
asymmetry is linked to handedness in right-handed adults, as hand usage reflects soft
tissue bulk, usage and therefore strength (Abdel-Malek et al., 1990). Thus there is
some evidence to suggest that the anthropometric measurements of both hands should
have been recorded in the present study. This would have allowed for a correlation
analysis of dominance, hand asymmetry and grip strength.
SUMMARY
The anthropometric characteristics of a sample of Brisbane teenagers have been
measured and reported in this chapter and the data compared to that of the general
population to assess whether this sample could be considered to be a fair
representation of the normal range of heights, weights, BMIs and hand dimensions of
Australian teenagers. From the most recent Australian and overseas data, it appears
that the current sample of teenagers can, in all measured parameters, be considered to
be a valid representation of the wider Australian population of teenagers. Thus it
would also be valid to consider applying their grip strength results to that of other
Australian teenagers. As recommended (Jaric, 2002), the grip strength data can
potentially be presented in age, gender, BMI and hand dimension groupings, made
possible by the recording of their anthropometric characteristics.
The shape of the female hands were significantly different to that of the males. There
appears to be no information published about this ratio, or its effect on the grip
strength of teenagers. The significance of the effect of hand shape on grip strength
will be presented in Chapter 10.

139
EXPERIMENT 2
PART 7.1B
LIFETIME INJURY PREVALENCE
The aim of conducting this research project was to study the grip strength of normal,
healthy teenagers. Originally it was thought that they would be a ‘pristine’ group as
they were still in school and so presumably had not been exposed to work-related
injuries. They were screened for upper limb pathology before grip strength testing.
However, as data collection progressed it became clear from an examination of the
responses on their Personal Profile Forms that many of the teenagers had previously
experienced upper limb injuries, including fractures. The question therefore arose as
to whether their prevalence of upper limb injuries was representative of the general
teenage population in Australia, or whether they were by chance, a more accident-
prone group. This was important because although students were not grip strength
tested if they had current pathology, or pain, past research has found that serious past
upper limb injuries can affect grip strength for up to two years (MacDermid et al.,
2001).
Investigation of the past injuries of the grip-strength-tested teenagers would provide
data to describe the lifetime upper limb injury prevalence of this sample, and compare
this figure with that of the existing local and world literature. For practical reasons,
injury details were confined to reporting pain, pathology requiring surgery and the
number of past upper limb fractures that each student had suffered in their lifetime.
METHODS
The teenagers were asked to indicate the number and location of the past fractures and
the location of any present pain on their PPF. Further details about the data gathering
methodology are given in Chapter 5, and the form is reproduced in Appendix G.

140
STATISTICAL ANALYSIS
The statistical analysis for this section consisted of entering age and gender split
information into a SPSS spreadsheet for analysis of the total lifetime number of their
upper limb fractures and surgery.
RESULTS
There were 437 teenagers in the 13-year-old and 17-year-old age groups who filled in
the Personal Profile Forms.
Past Upper Limb Fractures
There were 436 teenagers who answered this question. There were 31 and 33% of the
13-year-old males and females and 44 and 33% of the 17-year-old males and females
respectively, who had at some stage in their lives experienced at least one upper limb
fracture. Some of them had suffered multiple fractures on multiple fingers, and on a
number of occasions. Some were uncertain about the dates and locations of these
fractures, simply writing comments such as “lots of broken fingers” and “heaps of
breaks can’t remember when [or which fingers]”. For the purposes of statistical
analysis it was assumed that these unspecified numbers of multiple fractures would
amount to at least three fractures per teenager and so were recorded as such. On this
basis, the mean number of fractures per teenager was calculated. Older teenagers had
higher mean numbers of fractures than younger teenagers. See Table 7.5.

141
Table 7.5. Mean Number of Fractures per Teenager
Age and Gender Groups
n
Mean Number of Fractures (SD)
13 y.o. Males
74 0.45 (0.80)
13 y.o. Females 69 0.49 (0.80)
17 y.o. Males 120 0.68 (0.94)
17 y.o. Females 173 0.52 (0.89)
Past Upper Limb Surgical Operations
Seven (4.9%) of the 13-year-old teenagers (n = 142) and 15 (5.1%) of the 17-year-
olds (n = 291) reported previously undergoing upper limb surgery, see Table 7.6.
Table 7.6. Number (%) of Teenagers Reporting Past Upper Limb Surgery
Age and Gender
Groups n
Number reporting surgery (%)
13 y.o. Males
73 3 (4.1)
13 y.o. Females 69 4 (5.7)
17 y.o. Males 120 10 (8.3)
17 y.o. Females 171 5 (2.9)

142
DISCUSSION
Comparison of Fracture Rates with the General Population
The number of fractures experienced by the teenagers in the present study may appear
large, with almost half of the 13-year-olds and over half of the 17-year-olds, reporting
past upper limb fractures. However, it can be considered that the published incidence
rates of upper limb fractures, which are exclusively from Accident and Emergency
Departments, are lower than the actual incidence in the community. This is because
many teenagers in Brisbane would see a local medical practitioner for diagnosis and
management of an uncomplicated fracture, and would not require referral to a
hospital. In 2002, the Queensland Division of General Practice (of the Australian
Medical Association) was not aware of services collecting injury data from general
practitioners (personal communication, July 2002). Another complicating factor is
that Accident and Emergency Department data is typically only period-incidence data,
not lifetime prevalence data. That older teenagers had a higher mean number of
fractures was expected, as these figures are an accumulation of slightly longer lives.
There was a noticeable gender difference in the mean number of fractures in the older
teenagers. By the age of 17, the females had only accumulated an average of another
0.03 fractures each; whereas by the age of 17 the males had accumulated another 0.23
fractures each. Thus it would appear that 17-year-old females suffer a much higher
percentage of their total fractures by the age of 13, as compared to the males. This
trend can be supported by local data from the Queensland Injury Surveillance Unit,
which found that 456 females aged between 10 and 14 years presented to Southeast
Queensland Accident and Emergency departments for upper limb injuries in 1998 to
1999, compared to only 101 females aged between 15 to 19 years in the same one
year period (R. Hocking, Queensland Injury Surveillance Unit, personal
communication, July 2002). By the age of 17, the males had sustained more injuries
than the females. The data from the Queensland Injury Surveillance Unit reported that
840 males between the ages of 10 and 14 and 392 males between the ages of 15 and
19 presented to these hospitals in the same time period. These data could not be
broken down into smaller age groupings for a more exact comparison. If so, the

143
picture may have been different, as Landin (1983) found that for Swedish children the
peak age for fractures in boys was 13 to 14, whereas in girls it was 11 to 12 years of
age. Contrary to this, two other overseas studies found that the peak age for fractures
was 12 years of age, regardless of gender (Hassan & Dorani, 2001; Mahabir, Kazemi,
Cannon & Courtemanche, 2001).
Data from overseas confirm that teenage males have a greater risk of injury than
teenage females, and some studies put this ratio at 2 to 1 (Hassan & Dorani, 2001;
Landin, 1983), or 3 to 1 (Mahabir et al., 2001). They also have more than double the
risk of fatal injuries (Danseco, Miller & Spicer, 2000). Thus the results from the
current sample are consistent with local and overseas trends.
Accuracy of Self-reported Fractures
It could be argued that the seemingly high prevalence of fractures in the current
sample of teenagers was due to over-estimates in self-reporting. In adult populations,
researchers in Europe (Ismail et al., 2000) and Australia (Ivers, Cumming, Mitchell &
Peduto, 2002) have found false positive rates of self-reporting fractures (for all types
of bone fractures) at 11% and 10.7% respectively. Thus the self-reported number of
upper limb fractures in the current study may have contained a false positive element.
This possibility is diminished by the fact that both these other studies found that wrist
fractures had only small percentages of either false positives or false negatives; 3%
for false negative in Ismail et al. (2001) and 2.2% for false positives in Ivers et al.
(2002). Assuming teenagers to be as accurate in this self-reporting task as older
people, the reported fracture results do not contain a significant amount of inaccuracy
and can thus be accepted at face value. No studies of the prevalence of false-positive
reporting of finger or hand fractures were able to be located.
Serious Past Upper Limb Pathology, as Indicated by of the Need for Upper Limb
Surgery
A comparison of the present findings with the wider local population was not possible
because the South East Queensland Injury Surveillance Unit did not have specific data

144
available for upper limb surgery. However they did collect gender-split data on the
number of upper limb injuries that presented in Accident and Emergency Departments
and that resulted in hospital admissions for 10 to 14-year-olds and 15 to 19-year-olds.
It is reasonable to consider that these hospital admissions were an indication of the
severity of the injuries. The data indicated the need for surgical procedures, such as
general anaesthetics and internal fixation of fractures. They found that:
for 840 injuries to 10 to 14-year-old males, 211 (25%) required hospital admission;
for 392 injuries to 15 to 19- year-old males, 60 (15.3%) required hospital admission;
for 456 injuries to 10 to 14- year-old females, 91 (20%) required hospital admission;
for 101 injuries to 15 to 19- year-old females, 10 (10%) required hospital admission.
These local hospitalisation figures are slightly different to present findings that the
younger teenagers had similar rates of surgical intervention and the older females
required less than half of the surgical interventions of their age-matched males.
The literature suggests that the incidence of injuries experienced by teenagers is
increasing due to the greater number of high-risk and high-speed sports (such as
skateboard stunt jumping, trail motorbike riding and snow boarding) and these
activities increasing popularity (Auringer & Anthony, 1999; Fountain & Meyers,
1996). The study of Landin (1983) spanned three decades from 1953 to 1983. He
found that the risk of fractures had doubled in both boys and girls in the 0 to 16 year
old age group. Sports and various play activities as a cause of fractures had increased
by a factor of five in that period. It may be assumed that it has increased further in the
last twenty years. As industry improves its safety measures for adult workers and
more teenagers participate in high-risk sports, the shift from hand therapists treating
mainly an adult population to treating a higher percentage of teenagers will probably
be seen in coming years.
SUMMARY
In this section the lifetime upper limb fracture and surgery prevalence figures have
been presented for the sample of teenagers. A comparison of the lifetime injury rates
has been made with that of the existing local and world literature point incidence

145
rates. It was found that the patterns of age and gender proportions for fractures
experienced in the teenager years were similar to the data of others. The levels of
injury severity, as indicted by the percentage of the sample that required surgical
intervention, were similar to other samples of injured teenagers in South East
Queensland. Thus although teenagers who are still attending school full-time have not
been exposed to industrial accidents, they are still not a totally injury-free group, for
the purpose of studying uninjured people, but the current group do seem to represent
the likely injury and prevalence rates in the wider population of Australian teenagers.

146
EXPERIMENT 2
PART 7.1C
EXERCISE LEVELS
As exercise levels are positively correlated with physical fitness and grip strength
(Pujol et al., 2005), it was deemed important to establish that this sample of teenagers
was typical of the general population of Australian urban teenagers. If this sample had
a greater than normal percentage of athletes, or sedentary teenagers, as judged by the
number of hours of sport they played each week, it would be a biased sample and
could not be considered to represent the normal range of fitness and therefore upper
limb strength as indicated by grip strength, in the wider teenage population. In the
next section of this thesis the correlations of upper limb strength, via grip strength
testing, with general fitness levels will be examined to investigate how the two
variables are inter-related, refer to Chapter 7, Part 3 for further details.
A survey of 2,026 high school aged teenagers in New South Wales found that 75% of
the boys participated in at least moderate exercise each week, compared to only 65%
of the girls (Booth et al., 2002). It also reported that older teenage girls were less
physically active than younger ones. Booth et al. found a drop in activity levels from
summer to winter, which was most noticeable with the females. Overseas studies have
found similar trends. A study examining the physical activity levels of 12 and 15-
year-old males and females in Northern Ireland (Boreham, Twist, Savage, Cran, &
Strain, 1997) found that the most active group was the 12-year-old males, then the 15-
year-old males, followed by the 12-year-old females and lastly the 15-year-old
females. The 12-year-old males were almost twice as active as the 15-year-old
females. It is assumed that urban teenagers in Brisbane would be expected to behave
in a similar fashion to those in New South Wales and other industrialised regions.
The aims of studying the exercise levels of the participants were to: (a) describe the
exercise levels of the current sample, and (b) to compare these exercise levels with
that of the wider Australian population of teenagers in order to evaluate whether the
sample was representative of Australian teenagers in this respect.

147
METHODS
The Person Profile Forms (PPF) contained four parts relating to regular physical
activities or exercise, outside of school hours. The students were asked to indicate the
following (as numbered in the PPF):
5a) the number of hours of sport, or regular exercise per week, participated in
during the summer months;
5b) the number of hours of sport, or regular exercise per week, participated in
during the winter months;
6) the number of hours of bicycling per week, including commuting;
7) list the sports played, including regular, but informal sport, such as jogging in
the park, or walking a dog.
This recall questionnaire method (Boreham et al., 1997) and its definitions of formal
and informal, regular physical activities/exercise, and the division of these activities
into summer and winter months has been used with other samples of Australian
teenagers (Booth et al., 2002). The hours were grouped into segments of 0 to 1, 1 to 4,
4 to 8, and >8 hours per week. The teenagers were asked to circle one of these groups
for each of the questions 5a), 5b) and 6. The form is replicated in Appendix G. All
the responses were entered into a SPSS spreadsheet for frequency analyses.
STATISTICAL ANALYSIS
The statistical analysis consisted of age and gender split frequency tallies for the
hours of sport in summer and winter separately, the hours of bicycle riding and the
types of sports, per teenager. This information could then be used later in a regression
analysis to determine whether there was any positive correlation with grip strength.
RESULTS
Out of 437 teenagers who were surveyed there were 415 who legibly completed the
exercise level questions of the PPF.

148
Types of Sports Played
There were a variety of sports played, with no predominance of sports requiring
mainly good upper limb strength as compared to ‘lower limb’ sports. For example,
those who participated in tennis, or cricket in the summer (requiring good grip
strength) often also played rugby, soccer, or went cross-country running in the winter.
Number of Hours of Organised Sport, or Regular Exercise per Week
From the responses there were 82.8% of the 13-year-olds and 67.3% of the 17-year-
olds who participated in organised sport or regular exercise, outside school hours each
week, for at least half of the school year. Only 9% of the teenagers engaged in 8 or
more hours of sport, or regular exercise per week, for at least half of the school year.
Half of these teenagers were the 17-year-old males, 21 of whom played more than 8
hours of sport in the winter and 15 who played more than 8 hours of sport in the
summer. Similar percentages of teenagers played sport in the summer and winter
months separately, see Table 7.7. Some teenagers only participated in physical
exercise outside school hours either during the summer, or the winter months. Table
7.8 compares the number of teenagers who exercised (bicycled or played sport)
throughout the year with the number of teenagers who did not participate in any
regular exercise (outside school hours) throughout the year.
Table 7.7. Number (%) of Teenagers Participating in Sport Each Week
Age and Gender Groups
Summer (%)
Winter (%) 13 y.o. malesa
51 (75.0)
50 (73.5)
13 y.o. femalesb 40 (74.1) 41 (75.9)
17 y.o. malesc 75 (60.1) 81 (65.3)
17 y.o. femalesd 93 (55.0) 80 (47.3)
an = 68. bn = 54. cn = 124. dn = 169.

149
Number of teenagers who did no regular exercise throughout the year
There were only a few 13-year-olds who did not play after-hours sport, or ride a
bicycle each week. The group that exercised the least were the 17-year-old females,
see Table 7.8 for the details.
Table 7.8. Number (%) of Teenagers Exercising Throughout the Year Compared with Those Who Did No Exercise.
Age and Gender Groups Exercising Not Exercising
13 y.o. malesa 43 (63.2) 4 (5.9)
13 y.o. femalesb 36 (66.7) 4 (7.4)
17 y.o. malesc 71 (57.2) 19 (15.3)
17 y.o. femalesd 64 (37.9) 60 (35.3)
an = 68. bn = 54. cn = 124. dn = 169.
Hours of Riding a Bicycle per Week
Bicycle riding is of particular relevance due to the need to grip the handlebars. There
were 414 teenagers who completed the bicycling section of the PPF. The mean hours
of bicycle riding (including commuting) indicated that more males rode bicycles more
often, than females. The percentage of teenagers not riding at all increased with age
and was more pronounced in the females. Thus 77% and 44% of the 13-year-old
males and females respectively, rode a bicycle; whereas 46% and 11% of the 17-year-
old males and females respectively, cycled. The vast majority of those teenagers who
rode a bicycle did so for 1 to 4 hours per week. Only 24 rode their bikes for 8 or more
hours per week, 20 of these were 13-year-old males.

150
DISCUSSION
The exercise levels of the local teenagers were similar to those in New South Wales
and overseas; the 13-year-old males were the most active and they were almost twice
as active throughout the year as many 17-year-old females. Approximately 75% of
male and female 13-year-olds were participating in exercise in either the summer or
the winter in the current group, although this figure dropped markedly by the age of
17 for both genders, but more so for the females. Most teenagers that engaged in
physical activity in the winter months continued with some form of exercise in the
summer months. The surveys conducted by Booth et al. (2002) were conducted in the
same year as much of the present data was collected. The two studies had striking
similarities in the exercise levels of the subgroups of teenagers. Booth et al. studied 13
and 15-year-old males and females. They found a drop in activity levels from summer
to winter. The current study found no drop in summer to winter activity levels for the
boys, but it did for the 17-year-old girls, from 55% participating in physical activities
to 47.3%. If the study of Booth et al. had extended to the age of 17 it may have found
similar patterns of declining exercise levels due to part-time jobs and increased study
commitments in the 17-year-old males, as the football season ended and the study
commitments increased towards end of year exams. The activity patterns of the
teenagers in the study by Boreham et al. (1997) were similar to that of the present
sample, except that the present 17-year-old males were notably less active than the
present 13-year-old males.
Number of teenagers who did not exercise regularly
The proportions of overweight and obese teenagers in the current sample can be
related to their activity levels. There were more overweight and obese females than
males and more females who were not regularly exercising, as compared to the males.
These obesity levels were reported in the anthropometric values section, earlier in this
chapter.

151
STUDY LIMITATIONS
The self-reported levels of exercise and bicycle riding employed as an indirect
indication of upper limb strength may not give a complete picture for older school-
aged teenagers. This is because many of the Year 12 students verbally reported that
they had ceased intensive sport only several months prior to the survey, to either take
up an after-school job, or to devote more time to their studies. The students who took
up the part-time jobs would be expected to be generally stronger than the ones who
opted for the more sedentary occupation of extended study hours, since the jobs were
typically physically demanding, such as working at fast food restaurants, packing
shelves in supermarkets, or “pumping gas” at local petrol stations. These part-time
jobs were not systematically recorded, and so it was not possible to estimate how
many of the 17-year-olds who were not participating in sport were being sedentary
after school and how many were working vigorously.
Thus the exercise levels of the teenagers used in this grip strength study have been
surveyed using levels of participation in sport and physical activities as indicators of
physical fitness. The data showed that this sample did not have a disproportionately
high number of elite athletes, or sedentary teenagers, who might bias the mean grip
strength values in this study. Their exercise levels generally followed the trends
shown in other studies. It can be concluded that the levels of activity found were
representative of other teenagers in the wider Australian community.

152
EXPERIMENT 2
PART 7.1D
HAND DOMINANCE GROUPS
One of the aims of conducting this research was to assess the influence of degrees of
hand dominance on the grip strength of a sample of teenagers in terms of: (a) its
influence on the grip strength difference between the two hands, and (b) the grip
strength score reliability of the dominant versus the non-dominant hand.
In this section the current grip strength participants are described in terms of their
distribution into three hand dominance groups; right, left and mixed-handed. Then
they are compared with other teenagers at the same school, who were not grip
strength tested, but who filled in the EHI forms. Lastly, these teenagers are compared
with the wider Australian population, to determine whether they did represent a
normal cross-section of teenagers in terms of their degrees of handedness.
METHODS
In the general methods section of Chapter 5, the method of completing the EHI and
calculating the degrees of handedness were given. Details of the adapted EHI are
given in Chapter 6, with a copy in Appendix D.
STATISTICAL ANALYSIS
The statistical analysis for this section consisted of age and gender split frequency
tallies for the three handedness groups.
RESULTS
There were 658 teenagers, in each yearly age group from 13 to 17-year-olds, with
fully completed EHI forms, which included the 235 grip strength tested teenagers.
The grip strength tested group were compared to the total pool of 658 teenagers for

153
their percentages of right, left and mixed-handed teenagers, as illustrated in Figure
7.1.
Figure 7.1. Comparison of % of hand dominance groups between the entire pool of teenagers and the grip strength tested teenagers.
DISCUSSION
The distribution of each handedness group was similar between the grip strength
tested group (n = 235) and the larger pool of teenagers (n = 658). This demonstrates
that there was not a disproportionate preponderance of one type of handedness group
in the grip strength tested teenagers, as compared to the general mix in the wider
teenage population at the local school.
Accepting that handedness lies on a continuum, with a J-shaped distribution, with the
majority of people being right-handed, less being mixed-handers, and a marked tail of
strong left-handers, then these teenagers are similar in their hand preference patterns
to the wider community as found in the United Kingdom (Williams, 1991) and in
Australia (Provins et al., 1982). Thus the comparison of the data for these teenagers
with the wider Australian population and the overseas data strongly suggests that
these teenagers did represent a normal cross-section of teenagers, in terms of their
distribution of handedness preferences.

154
CHAPTER 7
PART 7.2
THE ISOMETRIC GRIP STRENGTH TESTING OF 235
TEENAGERS
Grip strength is regarded as a good indication of general upper limb strength and
therefore, degree of functional recovery (MacDermid et al., 2002). Knowing the
normal range for grip strength values within an age and gender group can inform the
treating clinicians about the relative hand strength of an individual, as compared to his
or her peers, especially when comparisons with the contralateral hand are not
possible, due to bilateral upper limb injuries.
It has been well documented that throughout the years of childhood and adolescence
grip strength increases (Rauch et al., 2002; Sartorio et al., 2002; Vaz, Hunsberger &
Diffey, 2002; Yim et al., 2003). The grip strength of males accelerates sharply after
the onset of puberty at 11 to 14 years of age, whereas the increase in the grip strength
of females tends to slow down or plateau after the age of 14 (Häger-Ross & Rösblad,
2002; Mathiowetz et al., 1986; Montoye & Lamphiear, 1977; Neu et al., 2002;
Newman et al., 1984). The amount of fat-free muscle is correlated highly with grip
strength in teenagers (Henneberg, Brush & Harrison, 2001; Sartorio et al., 2002). The
increasing levels of testosterone and greater participation in sport, relate to increasing
grip strength in boys as they proceed through puberty (Kriepe & Gewanter, 1985).
These findings help to explain the well-documented increasing grip strength
difference between the two genders throughout the teenage years (De Smet &
Vercammen, 2001; Häger-Ross & Rösblad, 2002; Henneberg et al., 2001; Mathiowetz
et al., 1986; Neu et al., 2002).
Grip strength researchers have employed a variety of methods and grip strength
measuring tools to compile their databases. Various researchers have reported the grip
strength values of only the dominant hand (Häger-Ross & Rösblad, 2002), only the
non-dominant hand (Rauch et al., 2002), both the dominant and non-dominant hands
by pooling all the hands together (Sartorio et al., 2002). Other researchers combined

155
the grip strength data of their participants’ right and left hands (Newman et al., 1984).
Some used only one trial (De Smet & Vercammen, 2001; Kreipe & Gewanter, 1985),
or the mean of three trials (Mathiowetz et al., 1986), or the maximal trial out of two
(Neu et al., 2002; Rauch et al., 2002), or three trials (Häger-Ross & Rösblad, 2002;
Sartorio et al., 2002). The studies often tested the teenagers on only one handle
position. Range values for the grip strength means were not often presented.
There are currently no published grip strength norms using the GripTrackTM. Being
released in 1997, it is relatively new to the marketplace. Recent studies have used
similar computer-linked, isometric grip strength tools and have found them to be
acceptable substitutes for the analogue versions (Shechtman, et al., 2003; Shechtman,
Gestewitz & Kimble, 2005), although one research group, Svens and Lee (2005), did
not consider that the values from the two versions were interchangeable.
The aims for this chapter were: (a) to report the maximum voluntary isometric grip
strength (grip strength) values of a sample of healthy, Brisbane-based teenagers using
the GripTrackTM (b), to compare the effects of age and gender on grip strength within
the teenager years (c), to present the grip strength correlation between the two healthy
hands and (d), to compare the grip strength means of the two hands with those from
other local and overseas databases.
Validity of the GripTrackTM to Measure Grip Strength
The validity of data from this study as a representative database for the grip strength
of Australian teenagers hinges on the validity of using the computer-linked
GripTrackTM to measure grip strength. Content or face validity is defined as how well
a measure appears to measure what it is supposed to measure. Concurrent or
criterion-related validity is defined as how well a measure correlates to a well-
established measure of the same variable (Tilley, 1999). The content validity of grip
strength measurements via hand-held dynamometers has been well-established for
over 50 years (Bechtol, 1954; Kirkpatrick, 1956), with such instruments as the
JamarTM hand grip dynamometer, being the “gold standard” for isometric grip
strength testing and is often considered to be readily accessible to “all physicians” (De
Smet & Vercammen, 2001). The GripTrackTM, although slightly lighter, has the same

156
physical dimensions as the analogue JamarTM handle and so it can be assumed that it
will be testing the same muscles in the same way as the JamarTM, provided that it is
used in the same standard test positions. The GripTrackTM has dispensed with the
bellows system but is still based on a hydraulic system. The criterion-related validity
of the grip strength results for the GripTrackTM will be considered later in the
discussion section of this chapter, when they are compared with other studies of
teenagers conducted with the JamarTM.
Presentation of Grip Strength Data
Researchers are divided as to whether to present isometric grip strength values based
on the mean of two or three trials, or the strongest of a number of trials (Bohannon,
1991). Those that use the strongest trial (Chattered & Chowdhuri, 1991; Crosby &
Wehbé 1994; Davies, 1990; Neu et al., 2001), reason that the other trials may
represent warm-ups, or the effect of fatigue. Also, the mean of several trials has not
been shown to achieve significantly higher reliability values than the strongest trial
(Hamilton et al., 1994; Mathiowetz et al., 1984). Massey-Westropp et al. (2004)
commenced a study with 3 consecutive trials, but found that “a number of subjects
complained of fatigue and pain” (p. 516) after completing 3 trials on each hand for
two different dynamometers, so these researchers changed their method during the
study, to that of using only one trial per hand, for each instrument.
The grip strength values given in the present thesis are based on the strongest grip
strength score for each hand, over 15 trials per hand. Many of the previously
paediatric and young adult databases used the mean of two (Yim, et al., 2003), or
three trials (Agnew & Maas, 1982; Firrell & Crane, 1996; Mathiowetz et al, 1986).
Researchers are also divided as to which hand to base the grip strength databases
upon. In this present study the data has been sorted by dominance, rather than left and
right hands, because the grip strength difference between the two hands can be more
accurately estimated if the dominant hand is known, as discussed in Part 3 of Chapter
7. Thus the strongest grip strength score of the dominant hand was labelled DomT1,
indicating it to be the strongest score of the first or only, grip strength testing session
(154 teenagers were repeat grip strength tested for the reliability section of the study);
the strongest grip strength score of the non-dominant hand for the first or only test
157
session was labelled Non-domT1. It is acceptable to present either the value of the
strongest squeeze, or the average of the three squeezes, on the optimal handle size.
The strongest squeeze has been used throughout this thesis, in line with the concept of
a “real potential maximum” and as performed by Petersen et al. (1989) and others.
Although the literature regarding the effects of handedness on grip strength points to
the need to divide research participants into multiple groups for their degrees of
laterality (such as right, left and mixed-handed groups), all but two (Yim et al., 2003;
Zverev & Kamadyaapa, 2001) of the existing grip strength studies divided their
participants into two groups; either by left and right hands, or by dominant and non-
dominant hands. Thus in order to be comparable with many of these other studies this
section of the thesis will only divide the participants by their dominant and non-
dominant hands, rather than by three handedness groups as well. In Part 3 of this
chapter, which presents the variables that influence grip strength the participants have
been divided into the three handedness groups of left, right and mixed-handed.
METHODS
For such a prospective, observational study to have sufficient data to reach
statistically significant numbers, at least 200 teenagers needed to be grip strength
tested; 100 who were 13-year-olds and 100 who were 17-year-olds, with even
numbers of males and females in each age group.
Selection Criteria for Grip Strength Testing
To be eligible for grip strength testing, each teenager was to have no current upper-
limb pain, no serious pre-existing upper limb injuries, nor any pathology, as self-
reported on their Personal Profile Form (PPF) which could impact upon their grip
strength performance. Each teenager was to be free from any short-term prescribed
medications that might artificially inflate their grip strength abilities, such as
“performance enhancing steroids”, stimulants, or sedatives, as self-reported. They
needed to be available for repeat grip strength testing in the same environment, within
1 to 4 weeks.

158
Anthropometric Measurements of the Grip Strength Tested Teenagers
Chapter 5 contains the general methods for recording height, weight, hand
circumference and hand length, and Chapter 7, Part 1 details the calculations of the
BMI values for the teenagers. The effects of these variables upon grip strength are
examined in Part 3 of this chapter.
Grip Strength Measuring Equipment, Testing Procedures and Test Environment
All participants were tested with the GripTrackTM (JTech Medical Industries, Utah,
USA) in a suitable testing environment, using standardised procedures, as previously
described in Chapter 5.
Calibration of the GripTrackTM Equipment
The sole GripTrackTM tool used for the duration of the project was calibration
checked throughout the months of grip strength testing. The procedure for this is
given above in Chapter 5, and the results are presented below.
STATISTICAL ANALYSIS
Independent samples t tests were used to decide whether differences between the grip
strength means of the age and gender split groups were significant. The unequal
variance results were reported instead of the equal variance results, as the two
populations were often of unequal sizes. The Standard Error of the Measurement
(SEM) for the grip strength results of the different age and gender groups were
calculated, the rationale has been described in Chapter 5. The similarities between the
grip strength measurements of the two hands will be presented in terms of how
strongly they correlate with each other using r, and differences in strength levels
examined using paired sample t tests. Further analysis of the behaviour of the two
hands in relation to each other and in relation to their level of grip strength reliability
over one or four weeks are covered in Chapters 8, 9 and 10.

159
RESULTS
Calibration results for the GripTrackTM
The GripTrack™ used in the study maintained good accuracy. During the repeated
calibration checks, when a 10 kg mass was suspended from its handle, the mass error
never exceeded + 1 kg and was often zero. When a 20 kg mass was suspended, the
error never exceeded + 2 kg and was generally + 1 kg at the most, but was usually
zero. Errors of the magnitude of 3 kg were only found when masses of 50 kg or more
were suspended from the handles on handle positions four or five (the two largest
handle sizes).
These calibration errors were minor and would only affect the results for individual
hands, not the ratio results (refer to Chapter 9 for further discussion of the grip
strength ratio). This is because it can be assumed that the errors did not develop
between the time it took for the right hand and then the left hand to be tested, which
was within one minute. Also only four right hands (1.7% of right hands) and three left
hands (1.25% of left hands) achieved their maximal grip strength value on handle
position four, and as expected no teenager achieved a maximal grip strength value on
handle position five (Firrell & Crane, 1996). Only one of these seven hands had a
maximal grip strength value of over 50 kg force, so calibration errors of this order
would not have effected the overall results.
Sample Numbers
A total of 235 teenagers had valid grip strength tests; with 119 males and 116 females.
If pain was reported during grip strength testing, the teenager’s data were excluded
from the analysis. Two teenagers declined to be grip strength tested. This high level of
project participation allowed for even cross-sectional sampling of the student body in
the school, through the full range of academic and athletic abilities and body sizes and
shapes. See Table 7.9 for the age and gender breakdowns.

160
Suburb of Residence: Demographics
The suburb in which the school is located is a middle income-earning area on the
outskirts of Brisbane. The completed Personal Profile Forms indicated that the
teenagers came from the acreage areas as well as the suburbs and thus they had
similar opportunities to be outdoors and active after school hours.
Current Prescribed Medications
The PPF results indicated that none of the teenagers were under the influence of any
performance manipulating drugs. The teenagers were not asked to report the use of
illegally obtained drugs, assuming that they would not voluntarily self-report such
matters. However, an Australian survey of high school aged adolescents (n = 13,355)
by Handelsman and Gupta (1997), found that 3.2% of males had at some time abused
anabolic-androgenic steroids and 1.7% of them had abused them within the 4 weeks
prior to the survey. For the females, 1.2% had at some stage abused steroids and 0.4%
of them had abused them within the 4 weeks prior to that survey. Abuse was defined
as the use of these steroids without a prescription from a doctor. Considering these
percentages and the commonly accepted concerns about the abuse of drugs in the
Australian teenage community at large, it is unlikely that there was no one in this
sample under the influence of performance-manipulating drugs. Despite this
possibility, this small incidence of drug-abuse would, at most, only marginally
influence the overall results.
Average versus strongest force reading
By using paired sample t tests for each of the four age and gender groups, the
difference between the three force readings on the optimal handle size and the
strongest force reading for each teenager were not significant and thus have not been
reported.

161
Dominant Hand Grip Strength (DomT1) For All Groups
For each age and gender group Table 7.9 presents the DomT1 mean grip strength
values, their SD and SEM. The strongest group was the 17-year-old males, followed
by the 13-year-old males, then the 17-year-old females and weakest were the 13-year-
old females, with the following t test results: the 13-year-old males were significantly
stronger than the 13-year-old females (t = 4.023, p < .001), but they were not
significantly stronger than the 17-year-old females (t = 0.7000, p = .486). The 17-
year-old females were significantly stronger than the 13-year-old females (t = –4.408,
p < .001). The SD and the SEM were greater for the dominant hands of both groups of
males, as compared to both groups of females. This demonstrated greater variability
in the males and greater error in being able to estimate the mean grip strength of all
Australian teenage males from this sample, as compared to that of the teenage
females.
Table 7.9. The Strongest Dominant Hand (DomT1) and Strongest Non-dominant
Hand (Non-domT1) Grip Strength Scores For All Males and Females.
DomT1 Non-domT1
Group Age (SD) Mean kg f SD
SEM kg f
Mean kg f SD
SEM kg f
13 y.o. malesa 13.49 (0.40) 31.05*! 7.8 0.95 28.59*! 7.21 0.88
13 y.o. femalesb 13.27 (0.37) 26.51*! 4.4 0.6 24.68*! 4.49 0.62
17 y.o. malesc 17.23 (0.50) 48.22*! 8.05 1.1 45.28*! 8.21 1.13
17 y.o. femalesd 16.91 (0.39) 30.26*! 4.71 0.6 27.13*! 4.22 0.54
an = 66. bn = 54. cn = 53. dn = 63. *Indicates a significant difference between gender groups of the same age. !Indicates a significant difference between age groups of the same gender.

162
Non-dominant Hand Grip Strength (Non-domT1) For All Groups
For each age and gender group Table 7.9 presents the Non-domT1 mean grip strength
values, their standard deviations and standard error of the means. In a manner similar
to that for the dominant hands, each of the non-dominant hand groups were strength-
ranked in the following order: 17-year-old males, 13-year-old males, 17-year-old
females, 13-year-old females, with the following t test results: the 13-year-old males
were significantly stronger than the 13-year-old females (t = 3.630, p < .001), but they
were not significantly stronger than the 17-year-old females (t = 1.410, p = .161). The
17-year-old females were significantly stronger than the 13-year-old females
(t = –2.998, p = .003). The SDs and the SEM were again greater for the males than the
females.
Comparison of the Mean Grip Strength of the Dominant Hand to the Non-dominant Hand and the Left and Right Hands
When using paired t tests to compare the dominant hand with the non-dominant hand
for each of the four groups, all groups had a significant difference between the mean
strength of their two hands. The strength of the relationship between the two hands
was weaker for the older teenagers as compared to the 13-year-olds as judged by their
r values, with a correspondingly greater mean difference, see Table 7.10. Paired t
tests results were similar for the right and left hand comparison, see Table 7.11.
Paired t tests results for the right hand compared with the dominant hand, showed that
there was no significant difference between these two hands for the 13-year-olds, but
they were significantly different at the .05 level for the 17-year-old males, whilst they
approached significance for the 17-year-old females, see Table 7.12. Paired t tests
results for the left hand compared with the non-dominant hand, were almost identical
to the results of the right versus the dominant hand (see Table 7.13).
When the hands were simply divided into left or right dominant determined according
to a positive or a negative Laterality Quotient on the EHI, the right hand was the
dominant hand in 87% of the teenagers and the dominant hand was the strongest hand
in 76% of the teenagers, with 81% of the right-handers having the right hand as the
strongest hand. There were 37% of the left-handers who had their left hand as their
strongest hand. The paired sample t tests demonstrated that the right dominant hand

163
was significantly stronger than the left non-dominant hand for all groups except for
the 17-year-old males. Thus for this sample it is valid to present the grip strength data
as either right and left hands, or as dominant and non-dominant hands. However it
should be noted in general, that left-handers might not have the same grip strength
differences between their two hands as right-handers.
Table 7.10. Correlation Statistics Between DomT1 and Non-DomT1 for the Age and Gender Split Groups
Group r Mean Diff SD SEM SEM 95% CI t values*
13 y.o. males .92 2.46 3.06 0.37 1.72 – 3.21 F(1,66) = 6.60
13 y.o. females .90 1.83 1.95 0.27 1.29 – 2.37 F(1,52) = 6.84
17 y.o. males .86 3.15 4.24 0.58 1.98 – 4.32 F(1,52) = 5.42
17 y.o. females .77 3.06 3.17 0.4 2.27 – 3.86 F(1,62) = 7.67
Note. r = Pearson's correlation coefficient; Mean Diff = mean difference. *p < .001.
Table 7.11. Correlation Statistics Between Left and Right Hands for the Age and Gender Split Groups
Group r Mean Diff SD SEM SEM 95% CI t values*
13 y.o. males .91 2.43 3.17 0.39 1.65 – 3.21 F(1,66) = 6.28
13 y.o. females .90 1.80 1.97 0.27 1.26 – 2.33 F(1,52) = 6.58
17 y.o. males .91 4.02 3.40 0.47 3.08 – 4.96 F(1,52) = 8.60
17 y.o. females .68 2.33 3.75 0.47 1.39 – 3.28 F(1,62) = 4.94
Note. r = Pearson's Correlation Coefficient; Mean Diff = mean difference. *p < .001.

164
Table 7.12. Correlation Statistics Between Dominant and Right Hands for the Age and Gender Split Groups
Group r Mean Diff SD SEM SEM 95% CI t values
13 y.o. males .98 -0.04 1.59 0.19 -0.43 – 0.34 F(1,66) = 0.23a
13 y.o. females .99 0.02 0.46 0.06 -0.11 – 0.15 F(1,52) = 0.30b
17 y.o. males .98 -0.43 1.51 0.21 -0.84 – 0.01 F(1,52) = 2.07c
17 y.o. females .95 0.36 1.57 0.2 -0.03 – 0.76 F(1,62) = 1.85d
Note. r = Pearson's correlation coefficient; Mean Diff = mean difference. ap = .818. bp = .766. cp = .043. dp = .070.
Table 7.13. Correlation Statistics Between Non-dominant and Left Hands for the Age and Gender Split Groups
Group r Mean Diff SD SEM SEM 95% CI t values
13 y.o. males .98 -0.07 1.40 0.17 -0.41 – 0.27 F(1,66) = 0.44a
13 y.o. females .99 -0.02 0.46 0.06 -0.14 – 0.11 F(1,52) = 0.30b
17 y.o. males .98 0.43 1.53 0.21 0.01 – 0.85 F(1,52) = 2.07c
17 y.o. females .94 -0.36 1.57 0.20 -0.76 – 0.03 F(1,62) = 1.85d
Note. r = Pearson's correlation coefficient; Mean Diff = mean difference. ap = .663. bp = .766 cp = .043. dp = .070.
DISCUSSION
Grip strength testing was conducted within normal school hours (between 9 am and 3
pm) and in a suitable on-site, quiet, air-conditioned room. It was conducted in this
way to allow for good cross-sectional sampling and for the recruitment of most of the
student body and not just volunteers, as volunteers have been previously shown to be

165
of a different psychological profile to that of randomly selected research participants
(Rikli & Arnett, 1978). The very low refusal rate across the academic streams also
indicated good cross-section sampling. As expected, older teenage males were
stronger than the young teenage males and the males throughout these years of
adolescence were stronger than age-matched females. The grip strength difference
between the 13 and 17-year-old females was small but significant. The strength
difference between the 13-year-old and 17-year-old males was significant and larger.
There was a significant difference between the dominant and non-dominant hands for
each age and gender group. These results lend weight to the validity of generalising
the current grip strength trends to the wider Australian population, since these results
are consistent with the general age and gender trends of other Australian and overseas
studies, as discussed in the introduction. The following discussion will now compare
the means, SDs and ranges of each age and gender groups with other studies.
Comparison with Published Normative Databases for Teenagers Grip Strength
It is only appropriate to compare the grip strength results of this current study with
those taken with other isometric grip strength measurement tools, such as the JamarTM
or Jamar-like handgrip dynamometers. There were 15 databases found for making the
comparison. A table of the countries where the studies were located and brief
descriptions of the grip strength tools employed in these studies are provided in Table
7.14 on page 169. Some studies did not include young teenagers, some did not extend
to older teenagers. Thus for the 13-year-olds there were 11 studies with which to
compare their results (Tables 7.15 and 7.16, pages 170-1), and for the 17-year-old
teenagers, 10 studies with which to compare their results (Tables 7.17 and 7.18, pages
172-3). Because much of the research used different isometric tools and different
methodologies, only general comparisons can be made between the current grip
strength values and those reported in the other studies.
From examining Table 7.15 it can be seen that the mean grip strength of the 13-year-
old males in the present study was greater than of the strength reported in all the other
studies of 12 to 14-year-old males. Their DomT1 was between 1.2 kg f and 9.3 kg f
stronger than the other groups. Their Non-domT1 hand was between 1.0 kg f and

166
8.6 kg f stronger than the other groups. The grip strength means of both hands of the
current group were close to the combined right and left hand strength values for a
Brisbane-based study from 1984, in which the researchers used a custom-made
isometric tool with 12 to 13-year-old males (Newman et al., 1984). The grip strength
ranges of the current study were similar to that of the study of Mathiowetz et al.
(1986).
The DomT1 of the 13-year-old females in the current study was stronger than that of
all the other studies of young teenage females by to 0.5 to 5.5 kg f, although it was
close to that of Newman et al. (1984) and Mathiowetz et al. (1986). For Non-domT1,
only the females from the study of De Smet and Vercammen (2001) were stronger
than that of the 13-year-old females in the present study, just by 0.8 kg f. All the other
groups were between 1.7 and 5.7 kg f weaker. The grip strength ranges were
comparable with those of Häger-Ross & Rösblad (2002), Mathiowetz et al. (1986)
and Rauch et al. (2002), see Table 7.16.
The DomT1 of the 17-year-old males in the current study were stronger by 0.3 to
9.6 kg f compared to the dominant, or right hands of other older teenagers, or young
adult males in other studies, with the exception of two of the other studies, see Table
7.17. One explanation for the greater strength is that the size and strength of teenagers
have been increasing over recent years. Regarding the two exceptions, the dominant
hand of the current 17-year-old males were 2.4 kg f weaker than the 17 to 23-year-
olds in the sample of Davies (1985). They were also 1.6 kg f weaker than the 16-year-
olds from the study of Häger-Ross and Rösblad (2002). The dominant hands of the 17
to 23-year-olds in the study by Davies (1988) were 2.4 kg f stronger and the 16-year-
olds from the study of Häger-Ross and Rösblad were 1.6 kg f stronger than the current
sample. With regard to grip strength ranges, the current 17-year-olds had a similar
range in the grip strength of their dominant hands to the right hands of the 17-year-old
males of the study of Mathiowetz et al. (1986). There were four other studies that
presented data for the left, or non-dominant hands. The Non-domT1 of the present
study was between 3.5 kg f and 10.3 kg f stronger than those of the other studies, with
slightly different maximum and minimum values, see Table 7.17.

167
The DomT1 of the 17-year-old females had a similar grip strength value with the
dominant, or right hands of other older teenager females, or young adult females and
all the groups had similar grip strength values (see Table 7.18). The current females
ranged from 2.1 kg f weaker to 3.7 kg f stronger. There were four other studies that
presented data for the left, or non-dominant hands of females. The Non-domT1 of the
present group was between 2.0 kg f weaker and 3.2 kg f stronger than the other four
studies. The range and standard deviations for each study were similar.
Others have shown that the optimal handle position is not always position 2,
especially for youths (Firrell & Crain, 1996). The majority of the grip strength studies
cited only used position 2, or a single handle position of another isometric grip
strength testing tool (Häger-Ross & Rösblad, 2002; Mathiowetz et al., 1986; Rauch et
al., 2002). The protocol in the current study was to test the teenagers on all the handle
sizes. This may explain some of the differences in the grip strength means between
the present and other databases.
In summary, whilst care is needed when attempting to compare results from one study
to another due to different sample sizes, different methodologies and different
dynamometers, all the studies reported similar grip strength means, especially for the
older teenage females. The dominant, or the right hand, was between 1 and 7 kg f
stronger than the non-dominant or left hand, but it was usually only 2 to 3 kg f
stronger than the other hand. The exception was the 13-year-old females (n = 27) in
the study of De Smet and Vercammen (2002), who were 2.7 kg f stronger in their
non-dominant left hands, as compared with their dominant right hands. These findings
suggest that hand grip testing is a robust measurement method and that minor
variations in protocol have little effect on the data obtained.
The 2 to 3 kg f strength difference between the two hands in the current study were
significant although the greatest disparity was in the two hands of the 17-year-old
males, as judged by their greater mean difference and greater SD. Their higher SEM
and higher upper 95% CI demonstrated that it would be harder to predict the strength
of one hand based on the strength of the other hand, because they had a wider range of
strength differences between their two hands than the other groups.

168
Strength and anthropometric variables
This study showed that between the two genders 13-year-old teenagers had similar
grip strength means, although these means were significantly different. However, the
height and weight of the 13-year-old males and females were not significantly
different (see Part 1 of this chapter). Thus although the 13-year-old males were
stronger than the 13-year-old females, they were not significantly taller or heavier.
Other studies concurred that females do not increase their grip strength considerably
past the mid-teenage years, but that males have significantly greater grip strength by
their late teenage years. The 17-year-old males in the current study were, on average,
17 kg force stronger than their 13-year-old counterparts. In comparison the 17-year-
old females were on average 3.57 kg f stronger than their 13-year-old counterparts.
SUMMARY AND CONCLUSION
The grip strength values for 235 healthy Brisbane-based teenagers have been
measured and presented in age and gender groupings, with some interesting findings.
The 17-year-olds were significantly stronger than the 13-year-olds and the average
male in each age group was significantly stronger than the average female in the
matched age group. This finding was true for both the dominant and non-dominant
hands. The grip strength values of the two hands were highly correlated with each
other, although they demonstrated small but significant strength differences. These
grip strength differences were most noticeable in the 17-year-old females.
The grip strength values of each age and gender group were compared to that of other
local and international studies. It was found that although the age and gender-matched
grip strength results were not identical to the other studies, they were sufficiently
similar to consider the current results to be in close keeping with general trends. Thus
the grip strength values reported here can validly be applied to other urban Australian
teenagers.
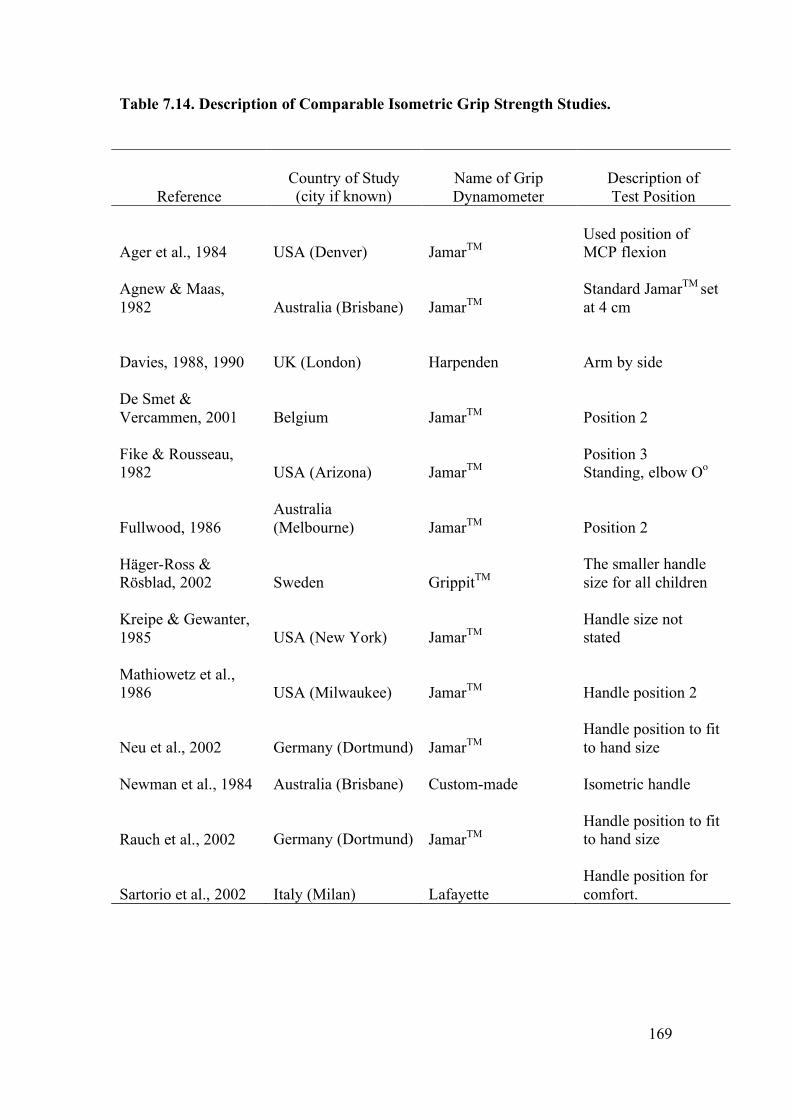
169
Table 7.14. Description of Comparable Isometric Grip Strength Studies.
Reference
Country of Study (city if known)
Name of Grip Dynamometer
Description of Test Position
Ager et al., 1984
USA (Denver)
JamarTM
Used position of MCP flexion
Agnew & Maas, 1982
Australia (Brisbane)
JamarTM
Standard JamarTM set at 4 cm
Davies, 1988, 1990
UK (London)
Harpenden
Arm by side
De Smet & Vercammen, 2001
Belgium
JamarTM
Position 2
Fike & Rousseau, 1982
USA (Arizona)
JamarTM
Position 3 Standing, elbow Oo
Fullwood, 1986
Australia (Melbourne)
JamarTM
Position 2
Häger-Ross & Rösblad, 2002
Sweden
GrippitTM
The smaller handle size for all children
Kreipe & Gewanter, 1985
USA (New York)
JamarTM
Handle size not stated
Mathiowetz et al., 1986
USA (Milwaukee)
JamarTM
Handle position 2
Neu et al., 2002
Germany (Dortmund)
JamarTM
Handle position to fit to hand size
Newman et al., 1984 Australia (Brisbane)
Custom-made
Isometric handle
Rauch et al., 2002
Germany (Dortmund)
JamarTM
Handle position to fit to hand size
Sartorio et al., 2002
Italy (Milan) Lafayette
Handle position for comfort.

170
Table 7.15 Comparisons of Younger Teenage Males’ Grip Strength in Kg Force
(SD).
(R) Hand (L) Hand
Reference Age
(years) n Mean (SD) Range Mean (SD) Range
Ager et al., 1984 12 24 24.0 (7.2) 24.5 (6.5)
Clerke present data 12 - 14 67 31.1a (7.8) 17 - 48 28.6b (7.2) 16 - 47
Davies, 1990 12.8 19 23.8c (4.7)
De Smet & Vercammen, 2001 13 46 29.9ad (6.7)
27.6bd (6.3)
Fullwood, 1986 12 10 22.0 (3.8) 20.0 (3.2)
Häger-Ross & Rösblad, 2002 13 20 27.5a (6.7) 14 – 39
Kreipe & Gewanter, 1985 13 118 21.8c (5.0)
Mathiowetz et al., 1986
12 - 13 34 26.0 (6.9) 15 - 44 25.0 (7.6) 10 - 48
Neu et al., 2002 12 - 13 31 21.5b (5.9)
Newman et al., 1984 13 100 30.0c
Rauch et al., 2002 13 158 22.4b 14.7 – 35.0
Sartorio et al., 2002 13.1 94
27.3a (+6.0)
26.1b (+5.5)
aDominant Hand. bNon-dominant Hand. c Combined right and left hand data. dResults for right dominant subjects only, excluded 5 left-handed males in the 13-year-old age group.

171
Table 7.16 Comparison of Younger Teeange Females’ Grip Strength in Kg Force
(SD).
(R) Hand (L) Hand
Reference Age
(years) n Mean (SD) Range Mean (SD) Range
Ager et al., 1984 12 25 21.0 (4.5) 22.5 (5.5)
Clerke present data 12 - 14 54 26.5a (4.4) 15 - 34 24.7b (4.5) 13 - 35
Davies, 1990 12.8 23 21.0c (3.5)
De Smet & Vercammen, 2001 13 27 22.5ad (5.4) 25.2bd (4.6)
Fullwood, 1986 12 12 21.0 (4.7) 19.0 (4.1)
Häger-Ross & Rösblad, 2002 13 22 23.6a (6.5)
11.2 – 36.7
Mathiowetz et al., 1986
12 - 13 36 26.0 (4.8) 18 - 36 23.0 (5.3) 11 - 34
Neu et al., 2002 12 - 13 27 21.3b (5.6)
Newman et al., 1984 13 82 26.0c
Rauch et al., 2002 13 157 20.4b 14.5 – 38.0
Sartorio et al., 2002 13.1 64 24.3a (+4.5)
22.9b (+4.8)
aDominant Hand. bNon-dominant Hand. cCombined right and left hand data. dResults for right dominant subjects only, excluded 5 left-handed females in the 13-year-old age group.

172
Table 7.17. Comparisons of Older Teeanger Males’ Grip Strength in Kg Force
(SD).
(R) Hand (L) Hand
Reference Age
(years) n Mean (SD) Range Mean (SD) Range
Agnew & Maas, 1982 16 - 25 33 39.6a (7.96)
Bäckman et al, 1995 17 - 18 10
47.9a (2.34)
Clerke present data 16 - 18 54 48.2b(8.1)
29 - 67
45.3c (8.2)
29 - 61
Davies, 1988 17 - 23 37 50.6b (7.6)
Fike & Rousseau, 1982 16 - 20 16 44.1 (10.0)
39.1 (8.0)
Häger-Ross & Rösblad, 2002 16 22 49.8b (7.5)
Kreipe & Gewanter, 1985 17 246 38.6a (5.5)
Mathiowetz et al, 1986 16 - 17 31 42 (8.7)
29 - 67 35 (8.6)
18 - 55
Neu et al., 2002 16 - 17 32
39.5b (8.1)
Newman et al, 1984 17 31 43.3a
Rauch et al., 2002 17 158 41.8b 26 - 69
aCombined right and left hand data. bDominant Hand. cNon-dominant Hand.

173
Table 7.18. Comparisons of Older Teenage Females’ Grip Stregth in Kg Force
(SD).
(R) Hand (L) Hand
Reference Age
(years) n Mean (SD) Range Mean (SD) Range
Agnew & Maas, 1982 16 - 25 35 29.4a (4.24)
Bäckman et al, 1995 17 - 18 10 27.7a (5.5)
Clerke present data 16 - 18 62 30.3b(4.7)
16 - 39
27.1c (4.2)
15 - 36
Davies, 1988 17 - 23 42 30.4b (4.9)
Fike & Rousseau, 1982 16 - 20 17 26.6 (4.9)
223.9 (4.0)
0 16 16 32.4b (5.7)
Mathiowetz et al, 1986 16 - 17 35 30 (7.4)
10 - 57
25.6 (6.3)
10 - 39
Neu et al., 2002 16 - 17 22
28.9c (4.8)
Newman et al, 1984 17 42 29a
Rauch et al., 2002 17 157 27.5c 18 - 45
aCombined right and left hand data. bDominant Hand. cNon-dominant Hand.

174
CHAPTER 7
PART 7.3
VARIABLES AFFECTING GRIP STRENGTH
The rapidly changing biomechanical and psychosocial stresses of the teenage years
are inherent risk factors for musculoskeletal injuries (Lewin, Davis & Hops, 1999).
The number of serious injuries in these years is increasing due to the number and
nature of high velocity, or extreme sports, such as snow boarding (Sutherland,
Holmes & Myers, 1996) and so a greater number of these teenagers will be seen in
hand clinics and will require rehabilitation. In the USA it is estimated that one in
fourteen teenagers will visit a hospital for a sports-related injury (Auringer &
Anthony, 1999). When a unilateral upper limb injury occurs, the pre-injury grip
strength of that hand can often be estimated from the grip strength of the uninjured
hand (Häger-Ross and Rösblad, 2002; Hanten et al., 1999; Newman et al., 1984).
A wide range of bilateral injuries have been reported in the literature, such as
carpometacarpal dislocations of both thumbs (Khan, Ryan & Teplitz, 2003), bilateral
ulnar stress fractures due to inappropriate use of weight-bearing crutches (McGoldrick
& O’Brien, 1988), median nerve palsies in cyclists (Braithwaite, 1992) and stress
injuries to distal growth plates of the radii in young gymnasts (Di Fiori &
Mandelbaum, 1996). When bilateral injuries occur, the pre-injury grip strength of
these two hands needs to be estimated from other variables.
In a sample of 10 to 69 year olds, age and gender have certainly been found to be
excellent indicators of premorbid grip strength (Montoye & Lamphiear, 1977).
However within the genders, any particular age group has a wide range of normal grip
strength values. For example in the current research, the grip strength of a healthy 13-
year-old male ranged from 17 to 48 kg f, although the mean grip strength for this
group was 31.1 kg f, with a standard deviation of 7.8 kg f. Thus it is most likely that
his grip strength would fall between 23.3 kg f and 38.9 kg f. This estimation could be
narrowed down further if other variables could be found which would point to which

175
end of this range he was likely to fall within. Häger-Ross and Rösblad (2002) found
that knowing his height improved the ability to narrow down the range, because tall
13-year-old males were found to be stronger than short 13-year-old males. These
researchers achieved prediction models in which 81% of the variance between the
actual and predicted grip strength was accounted for by using height as the only
independent variable, in their sample of 4 to 16-year-old males. Rauch et al. (2002)
found that for 6 to 19-year-old males, 85% of the variance in grip strength could be
accounted for by height. Such predictive models that incorporate height look
promising for assisting clinicians with pre-morbid grip strength estimations. But the
wide childhood height range that naturally occurred within these two studies was
critical to the strong and positive relationship that height had with grip strength.
In contrast to these paediatric studies, Everett and Sills (1952) found that for 14 to 29-
year-old males, they could only account for 35.6% of the variance in grip strength by
height (r = .597, R2 = .356). They had a residual of .644 meaning that 64.4% of the
difference between their actual and their predicted grip strength scores could not be
explained by the variable of height. This low level of predictability probably arose
because they only collected data from a narrower height range, the heights of 14 to
29-year-olds. Thus although the idea of estimating grip strength from consulting only
height and gender appears attractive as a time saver for a clinician, it can lead to low
levels of predictability and high levels of error, or residuals.
When Everett and Sills (1952) considered the combined variables of hand width,
height, hand length, finger length and mesomorphy the multiple correlations model
resulted in a much higher correlation value of r = .784, and a stronger prediction
model of R2 = .615. These combined variables accounted for 61.5% of the variance
between the actual and predicted grip strength. But that still left 38.5% of the variance
unaccounted for in their males.
Many variables influence grip strength. Finding a perfect correlation and subsequent
prediction model between one or more independent variables and grip strength is near
impossible (Portney & Watkins, 2000; Tilley, 1999). However the variables most
strongly associated and predictive of grip strength values, whether in isolation or in
combination, have not been fully investigated for urban Australian teenagers. To have

176
these variables identified and to narrow the residuals (or error of prediction) would be
helpful in rehabilitation and medico-legal assessments.
Prediction models
When discussing the prediction models the independent variables were
interchangeably named as predictor variables and the dominant and non-dominant
handgrip strength values were interchangeably named the dependent or criterion
variables.
Gender Effect on Grip Strength
Men have significantly stronger grip strength than women, although women have
greater grip endurance (Padmavathi et al., 1999). This grip strength difference persists
after correction for forearm muscle area (Padmavathi et al., 1999). These gender
differences are not seen until pubertal changes (measured by testosterone levels)
commence at 11 to 14 years of age (Ramos, Frontera, Llopart & Feliciano, 1998),
with one recent study finding the exception. Yim et al. (2003) used the mean of two
trials on handle position 2 of a JamarTM dynamometer to find that 370 Korean boys in
the young age range of 5 to 12 years had significantly stronger grip strength means
than 342 age-matched females, within every yearly age group.
The current study found that teenage males have different body shapes and have
significantly stronger grip strength abilities than age-matched females, see Chapter 7,
Parts 1 and 2. So now the variables affecting grip strength will be presented as gender
split groups.
Variables and predictive abilities
Experiments were carried out to: (a) measure the ability of the grip strength score of
one hand to predict the grip strength score of the other hand; (b) evaluate the
influence that a number of other variables have upon the grip strength of a healthy
hand; and (c) to determine the predictive abilities of these variables for grip strength.
177
It was expected that the combination of gender, age, exercise levels and hand surface
area would give the most accurate prediction equations abilities for grip strength,
when both hands were injured. It was also expected that these four variables would
add power to the prediction models that used the grip strength of the contralateral
hand. These approaches were previously undertaken by a number of researchers, as
will be discussed below, but first some statistical terms are defined in relation to their
use here.
STATISTICAL TERMS
Association versus prediction
Correlation statistics have been used in several sections of this thesis to describe the
size and direction of the linear relationship (association) between two variables. Now
regression is to be used to predict a score on one variable from the score on one or
more variables. Thus bivariate linear regression equations are to be used to predict
the grip strength of one hand, the criterion variable, based on a single independent
variable, the predictor variable, associated with it in a linear fashion, such as the
opposite hand. The grip strength of the dominant hand is expected to increase linearly
and in proportion with the grip strength of the non-dominant hand. The use of
multiple linear regression equations allowed the prediction of the grip strength
readings of one hand from a set of multiple independent variables. These relationships
do not have causal implications. That is, the independent variables do not cause or
determine the size of the dependent variable (Tabachnick & Fidell, 2001).
Outliers
Bivariate scatter plots assisted in determining whether the assumption of a linear
relationship between grip strength and each independent variable was valid, because
these particular correlation and regression models can only be conducted with
variables that have a linear (as opposed to a curved, or quadratic) relationship with
each other. The spread of the data points on the scatter plots assisted in the visual
observation of the association between the two. Outliers were also identified via this

178
method. If their value was greater than 3 SDs from the mean of that value they were
discarded from the analysis. An outlier is a case (data point) with such extreme value
on a variable that it distorts the statistics. As outliers were deleted at the stage of the
bivariate analysis, screening the data at the level of the multivariate analysis was not
needed. More information about how and why outliers were treated is detailed in the
statistical analysis section.
Least squares regression lines
Least squares regression lines, or the ‘lines of best fit’ were drawn on scatter plots.
These are lines that ‘best’ describe the orientation of all data points in a scatter plot
(Portney & Watkins, 2000). The slopes of such lines give information about the
strength of association and direction of the relationship between any two variables.
Multiple linear regression analysis – stepwise model
Performing these multiple linear regression analyses in a stepwise fashion (also
known as statistical regression) allowed the SPSS software to calculate which
variables, or combination of variables, were the most important in predicting the
criterion variable. Ensuring the representativeness of the sample (as demonstrated in
Chapter 7, Parts 1 and 2) and deleting the outliers assisted in being able to do this
particular type of analysis that was needed to achieve useful prediction equations for
grip strength (Tabachnick & Fidell, 2001).
When independent variables are highly correlated (such as hand length and body
height, see Chapter 7, Part 1A) the apparent importance of a particular variable to the
prediction equation can be reduced, “whittled away”, or “essentially knocked … out
of the solution” (Tabachnick & Fidell, 2001, p. 9). Thus when Häger-Ross and
Rösblad stated that “the contribution of age, weight and hand length were significant
for both girls and boys (p < .001 in all cases), while height did not add anything to the
model for the boys” (2002, ¶ 14) the complexity of the correlation of the independent
variables with the dependent variable can be appreciated. When “variables are
correlated, the overall relationship remains the same, but the apparent importance of

179
variables to the solution changes depending on … the strategy used” (Tabachnick &
Fidell, 2001, p. 10).
Residuals
As the prediction equations generated from regression models cannot be expected to
fully predict a criterion variable from one or more predictor variables, the results have
an inherent degree of error. Häger-Ross and Rösblad (2002) had 13% of the variance
in the grip strength of their boys not accounted for when they had considered age,
height, weight and hand length. This error between the predicted grip strength values
and the actual values is the residual. In the current study the residual represented the
difference between the actual grip strength values and the predicted values. The
greater the residual, the further the estimates of grip strength will be from the actual
values.
Selecting a criterion variable
Researchers have been inconsistent in which hands are to be used for grip strength
studies, the right and left, or the dominant and non-dominant hands. Initially, two
pairs of criterion variables for this non-experimental study were examined:
1a. The strongest grip strength score (out of three squeezes of the GripTrackTM
handle on five handle positions) of the dominant hand (DomT1) on the initial,
or the only, grip strength testing session;
1b. The strongest grip strength score of the right hand on the initial, or the only
grip strength testing session;
2a. The strongest grip strength score (out of three squeezes of the GripTrackTM
handle on five handle positions) of the non-dominant hand (Non-domT1) on
the initial, or the only, grip strength testing session;
2b. The strongest grip strength score of the left hand on the initial, or the only grip
strength testing session.
The right and left hands correlated very highly with the dominant and non-dominant
hands, respectively, both pairs at r = .99. Using a paired sample t test also

180
demonstrated that there were no significant differences between the means of the
strongest grip strength score of the dominant hand and that of the right hand
(t = -0.09, p = .93). Also the dominant hand generated the greatest grip strength in
93.3% of the students and for 87% of the teenagers the dominant hand was the right
hand. There was no significant difference between the mean grip strength of the non-
dominant hand and the left hand (t = -0.288, p = .774).
Computing an Effect Size
When using correlation and regression models an effect size has been defined as a
measure of the magnitude of association or predictive abilities, between two or more
variables. The larger the effect size, the more likely it was that these variables had a
significant impact on the dependent, or criterion variable (Portney & Watkins, 2000).
Green et al. (2000) applied this to regression models by explaining that “there are two
types of effect sizes for multiple regression analysis: multiple correlation indices to
assess the overall effect of the predictors on the dependent variable, and part and
partial correlations to asses the relative effects of individual predictors” (p. 266).
METHODS
Maximal voluntary, isometric, grip strength tests (grip strength tests) were performed
by 238 healthy teenagers (122 males, 116 females), using the standard ASHT
protocols. Further details of the sample and testing methodology have been given in
the methods section of Chapter 5.
There were 12 predictor variables; gender, age (rounded to 0.1 of a year) at date of
test (TESTage), height, weight, body mass index (BMI), hand length, hand width,
hand surface area (Hand S.A.), hand shape as expressed by the hand width/length
ratio (W/L ratio), average hours of sport or regular exercise per week, hours of bicycle
riding per week, and the grip strength of either the dominant hand (DomT1), or the
non-dominant hand (Non-domT1), depending on which hand was being examined.
These variables were chosen because research and clinical reasoning considered them
to have a significant correlation with grip strength, and had found them to have

181
positive predictive relationships with grip strength. For example, hand size (Bear-
Lehmann, Kafko, Mah, Mosquera & Reilly, 2002) and hand length (Häger-Ross and
Rösblad, 2002) have correlated positively and strongly with grip strength in children
and teenagers.
With regard to the physical fitness variable, although some studies have shown that
some forms of physical exercise (martial arts and some gym programmes) do not
correlate with increased grip strength in adults compared to controls (Douris, Chinan,
Gomez, Steffens & Weiss, 2004; Sinaki, Canvin, Phillips & Clarke, 2004), some other
studies (Ducher, Jaffre, Arlettaz, Benhamou & Courteix, 2005; Pujol et al., 2005;
Roberts, O’Dea, Boyce & Mannix, 2002) and clinical reasoning consider that physical
fitness and hours of gripping bicycle handles to ride bicycles would correlate
positively with grip strength in teenagers and thus could account for some of the
variance in grip strength between teenagers of the same gender and age.
STATISTICAL ANALYSIS
The current analyses have been presented in a number of ways; t tests, bivariate
correlations, bivariate linear regression and stepwise multiple linear regression
analyses, to highlight the variables that were correlated with and those that were
predictive of grip strength. The line of best fit, or the regression line, was drawn on
the scatter plots for the DomT1 and Non-domT1 relationship (see Figure 7.2) and the
DomT1 and BMI relationships of the males and females separately (see Figures 7.3
and 7.4). The rationale for this was given earlier.
All scatter plots, their lines of best fit, correlation indices and regression models were
created using SPSS. The bivariate linear correlation values were squared and adjusted
to arrive at the values that related the criterion variables (DomT1, or Non-domT1) to
the predictor variables (height, weight etc., as listed above). Multiple linear regression
equations were used to create the strongest combination of predictor variables that
most accurately predicted the DomT1 and the Non-domT1 values separately.

182
Z scores
The Z scores were presented to express the amount of influence, or standardised
weight, each of the significant variables contributed to the models. These Z scores
were the Beta standardized coefficients generated in the stepwise multiple regression
models.
Chosen models
A random-effects model was chosen for both the bivariate and multiple regression
models, as opposed to a fixed-effect model. This was for two reasons. Firstly, the
experiment was of a non-experimental design, there was no intervention applied to the
participants. Secondly, the relationship between the variables was a linear one, as
confirmed by scrutinizing the scatter plots for each bivariate relationship. Each score
on one variable was independent of other scores on the same variable; the grip
strength of one teenager was independent of the grip strength of another teenager.
Each variable, such as height, was a continuous variable, as opposed to a dichotomous
variable, such as gender. Prediction equations were generated from the multiple
regression models using the methods of Green et al. (2000). The significance tests
were derived from this model as recommended (Green et al., 2000). The level of
significance for all tests was set at p < .01.
According to Green et al. (2000), the only correlation indices needed for this type of
study design were the Pearson product-moment correlation coefficient (r) and its
squared value (r2) and adjusted r2. Green et al. recommended that Pearson’s r should
be denoted here as R (not r), when it has been used as a multiple correlation index
between predicted criterion scores and actual criterion scores. Green et al. stated:
R can range from 0 to 1. A value of 0 means there was no linear relationship
between the predicted scores and the criterion scores. A value of 1 implies that
the linear combination of the predictor variables perfectly predicted the
criterion variable… Values between 0 and 1 indicated a less than perfect linear
relationship between the predicted and criterion scores, but one or more of the

183
Xs [independent variables] are useful to some extent in predicting Y [actual
grip strength scores]. (p. 267)
To interpret R values, R was squared and multiplied by 100 to make “a percent of
variance accounted for” interpretation. But R and R2 are overestimates of their
corresponding population values. To compensate for this adjusted R2 (R2adj) was
calculated, which is based on a fixed-effect model, as this provided a more
conservative approach.
Residuals
The residual, or the measure of error of prediction in the prediction models, also
needed to be taken into consideration and has been stated with each model. The
squared value of the residuals provides a measure of error of prediction. A clinically
useful way to express this is to use the standard deviation of the distribution of the
errors, this is called the Standard Error of the Estimate (SEE) and has been presented
in the original units of the criterion variable. That is to say the SEE have been
presented in kg f. Whilst it is desirable to have the R and R2 values approaching 1.0 it
is also desirable to have the SEE kg f values small, as this indicates a low level of
prediction error.
Outliers
There are four reasons for outliers to exist in data. First, the value can be a data entry
error. Second, missing value codes may be read as real data. Third, the outlier may
not be from the population that was intended to be sampled. Fourth, the outlier is a
more extreme case than the normal distribution. These errors were minimised by a)
checking the original data, b) checking the missing data codes in the SPSS
spreadsheets, c) screening for hand injuries, and d) acknowledging that any remaining
outliers were extremes within the sample. Thus once the first three processes were
completed any remaining outliers were discarded because the results of the analyses
are intended to be used for making inferences (or providing estimates of central
tendencies in the teenage population at large), not just describing the sample (Portney
& Watkins, 2000; Tabachnick & Fidell, 2001). Univariate outliers can be identified

184
on scatter plots, as they are visually separate from the cluster. They are notably further
away from the mean than all the other data points. Their outlying values were deleted
from those analyses, as stated in the anthropometric section.
Ability to generalise the results
The sample of teenagers was representative of the average urban Australian teenager
for all measured parameters. For the regression analysis to be valid the
sample must display a normal and linear distribution of the measured
variables. This has been confirmed by the analyses in Chapter 7, Part 1
and Part 2, in respect to their anthropometric and grip strength means,
SDs and ranges.
RESULTS
Maximal isometric grip strength data was collected from 238 healthy teenagers (122
males, 116 females), using the standard ASHT protocols (refer to Chapter 5, general
methods). Three students had invalid data for one or other hand, but were kept in the
analysis for the valid hand, so as to retain maximal numbers for the various analyses.
Thus there were only 235 pairs of dominant and non-dominant hands used in the
current analysis. Some participants had missing data for some variables (eg., height,
or hand length). There were complete data sets for all variables for 225 of the 235
teenagers. Missing data was spread throughout the age and gender groups with no
particular group more affected than another. The missing data was correctly coded for
SPSS to treat them as such.
There were a number of independent variables that did not have as strong an
association or predictive abilities for grip strength as they had done in the research of
others. When split concurrently by age and gender, many of the predictor variables
became weak predictors of grip strength, demonstrating that too great a restriction in
the range of values, within one variable, has a large impact on its correlation and
prediction abilities for grip strength. Thus for this section the participants were only
divided by gender, not both age and gender.

185
Variables That Were Not Predictive
The scatter plots, correlation values and regression models found that for the criterion
variables of either DomT1 or Non-DomT1, the predictor variables of the hand W/L
ratio, average hours of sport, or regular exercise per week and hours of bicycle riding
per week, did not approach significance for the males, or the females.
Analysis by Scatter Plot and Consideration of Outliers
The significant independent variables had similar correlation values for the dominant
and non-dominant hands. The scatter plots for each independent variable that reached
significance demonstrated a linear relationship between it and the grip strength of
both hands. Each hand was the strongest predictor of the contralateral hand, with the
most amount of variance between the predicted and actual grip strength values
accounted for by this variable alone, as demonstrated in a number of ways. One way
was by the narrow spread of the data points along the line of best fit (the regression
line), see Figure 7.2 and 7.3. There were no obvious sub-groups within the gender
groups, except when it came to TESTage. The students were either an average of
13.38 years old, or 17.07 years old. In contrast, the other scatter plots demonstrated
that there were no clusterings into obvious sub-groups. There were tall 13-year-olds
and short 17-year-olds, long-handed 13-year-olds and square-handed 17-year-olds etc.
However, there were some outliers, who were found in the anthropometric analysis
(see Chapter 7, Part 1, Anthropometric Values).

186
Figure 7.2. Relationship between dominant (DomT1) and non-dominant hand grip strength (Non-domT1) in kilograms force (kg f) for the Males.
Males
Non-DomT1 (Kg f)
70605040302010
Dom
T1 (
Kg f
)
70
60
50
40
30
20
10
Figure 7.3. Relationship between dominant (DomT1) and non-dominant hand grip strength (Non-domT1) in kilograms force (kg f) for the Females.

187
Females
Non-DomT1 (Kg f)
40302010
Dom
T1 (
Kg f
)
50
40
30
20
10
The correlations of DomT1 and Non-domT1 with height, weight, hand length, hand
width, hand surface area, age and BMI are presented in Table 7.19 as gender split
groups. The prediction abilities of these independent variables are also listed in these
same tables. Overall the results showed that the grip strengths of the two hands were
highly correlated with each other at r = .950 for the males and r = .838 for the
females. For the males, height, weight, hand length, hand width and hand surface area
were all well correlated with grip strength for both hands. BMI was moderately
correlated, and age poorly correlated. For the females, these variables were
moderately to poorly correlated. TESTage did not reach a level of significance.
Table 7.19. Bivariate Correlations (R) and Adjusted R2 (R2
adj) Between Dominant and Non-Dominant Hand Grip Strength and Other Variables for the Males and Females.
Males Females
Variable
DomT1 R
value (R2adj)
Non-DomT1 R value (R2
adj) DomT1 R
value (R2adj)
Non-DomT1 R value (R2
adj)
DomT1 1.00 (1.00) .950 (.902) 1.00 (1.00) .838 (.702)
Non-DomT1 .950 (.902) 1.000 (1.00) .838 (.702) 1.00 (1.00)
Height .768 (.589) .773 (.594) .512 (.255) .523 (.267)

188
Hand S.A. .773 (.594) .779 (.603) .500 (.243) .602 (.356)
Hand Length .768 (.587) .773 (.594) .450 (.195) .560 (.308)
Weight .724 (.520) .720 (.514) .422 (.171) .484 (.228)
TESTage .275 (.068) .334 (.104) NS NS
Hand Width .698 (.483) .702 (.488) .380 (.137) .438 (.185)
BMI .505 (.249) .489 (.232) .240 (.049)* .303 (.084) Note. DOMT1 = dominant handgrip strength; Non-domT1 = non-dominant handgrip strength; Hand S.A. = hand surface area; TESTage = age in years to the nearest 0.1 years; BMI = body mass index. NS = not significant at .01 level, *p = .01, all other p < .01.
Figure 7.4. Relationship between body mass index (BMI) and dominant handgrip strength in kilograms force (DomT1) for all males.
Males
BMI
40302010
DomT1
70
60
50
40
30
20
10
Figure 7.5. Relationship between body mass index (BMI) and dominant handgrip strength in kilograms force (DomT1) for all females.
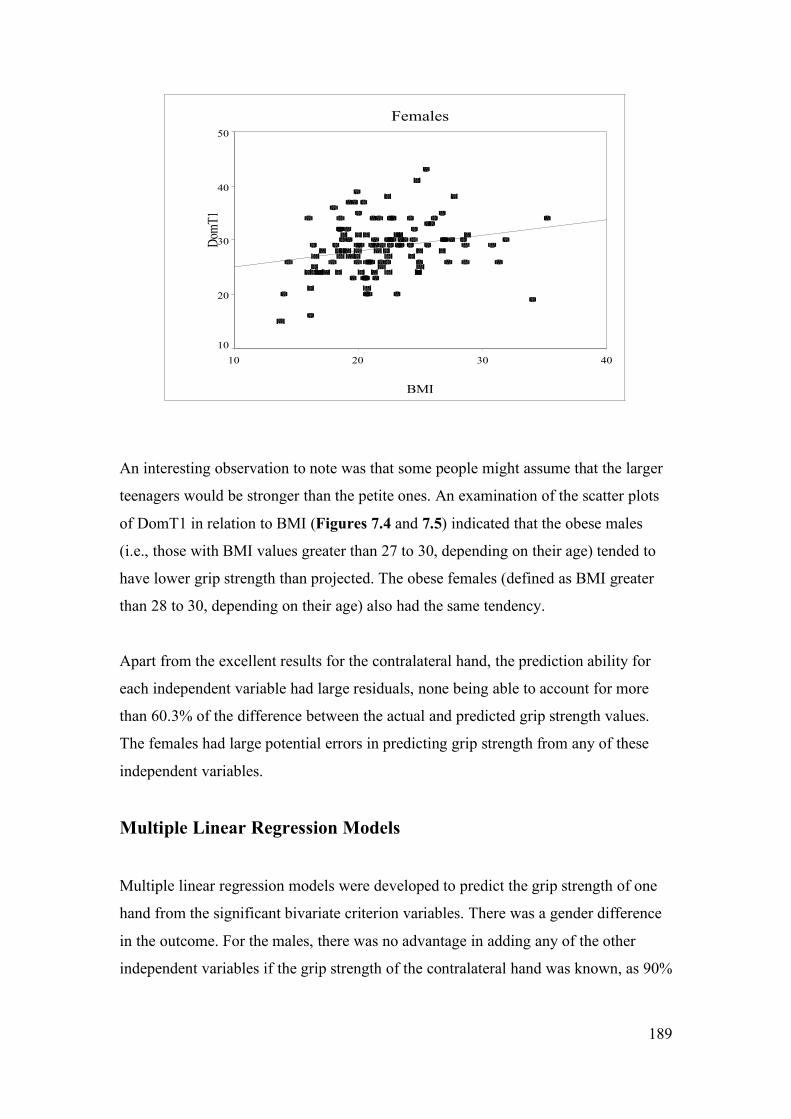
189
Females
BMI
40302010
DomT1
50
40
30
20
10
An interesting observation to note was that some people might assume that the larger
teenagers would be stronger than the petite ones. An examination of the scatter plots
of DomT1 in relation to BMI (Figures 7.4 and 7.5) indicated that the obese males
(i.e., those with BMI values greater than 27 to 30, depending on their age) tended to
have lower grip strength than projected. The obese females (defined as BMI greater
than 28 to 30, depending on their age) also had the same tendency.
Apart from the excellent results for the contralateral hand, the prediction ability for
each independent variable had large residuals, none being able to account for more
than 60.3% of the difference between the actual and predicted grip strength values.
The females had large potential errors in predicting grip strength from any of these
independent variables.
Multiple Linear Regression Models
Multiple linear regression models were developed to predict the grip strength of one
hand from the significant bivariate criterion variables. There was a gender difference
in the outcome. For the males, there was no advantage in adding any of the other
independent variables if the grip strength of the contralateral hand was known, as 90%

190
of the variance in the known hand was accounted for in the other hand, with a SEE of
3.7 Kg f and F(1, 117) = 1090.1, p < .01.
Because the correlation of the two hands was not that high for the females (r = .838,
R2adj .702), with a SEE of 2.7 Kg f, with F(1, 110) = 262.0, p < .01, there was a small
improvement in the prediction of the grip strength of the non-dominant hand when
Hand S.A. was added to the equation (r = .865, R2adj .743, F(2, 109) = 161.5, p < .01).
The SEE was then decreased to 2.3 Kg f. The Z score of the dominant hand (Z = .716)
was naturally greater than that of Hand S.A. (Z = .242). For the prediction of the
dominant hand’s grip strength none of these other independent variables contributed.
Bilateral hand injuries
If the grip strength of the other hand was not known, as in the case of bilateral hand
injuries, there were some criterion variables that contributed to the prediction of grip
strength for both genders. For predicting the grip strength of the dominant hands of
the males, height and Hand S. A. accounted for 62.6% of the variance between the
actual and the predicted grip strengths, with a SEE of 7.05 Kg f (F(2, 113) = 97.2,
p < .01). For predicting the grip strength of the non-dominant hands of the males,
height and Hand S. A. accounted for 63.5% of the variance, with a SEE of 6.8 Kg f
(F(2, 112) = 100.3, p < .01). Hand S.A. was slightly more important than height for
the models of both the dominant and non-dominant hands. For the dominant hand,
Hand S.A. Z = .468 and height Z = .358. For the non-dominant hand Hand S.A.
Z = .470 and height Z = .361.
For the females, when predicting the grip strength of the dominant hand Hand S. A.
(Z = .344) and height (Z = .344) contributed equally and accounted for only 33.9% of
the variance, with a SEE of 4.0 Kg f (F(2, 109) = 29.5, p < .01). For predicting the
grip strength of the non-dominant hand Hand S. A. (Z = .462) contributed a little more
than height (Z = .301), and together they accounted for 42.8% of the variance, with a
SEE of 3.4 Kg f. Refer to the prediction models in Table 7.20 for the formulae.

191
Table 7.20. Prediction Models R, R2adj and SEE in Kg f for the Dominant and
Non-dominant Grip Strength. Model Prediction Equations R R2
adj SEE Females When the dominant hand grip strength is known:
1 Non-dom = -6.193 + .655(DomT1) + .083(Hand S.A.) .865 .743 2.3
Males When both grip strengths are unknown:
2 Dom = -58.947 + .210(Hand S.A.) + .348(Height) .795 .626 7.1
3 Non-dom = -59.202 + .204(Hand S.A.) + .340(Height) .801 .635 6.8
Females When both grip strengths are unknown:
4 Dom = -35.238 + .129(Hand S.A.) + .265(Height) .592 .339 4.0 5
Non-dom = -33.994 + .159(Hand S.A.) + .212(Height)
.662
.428
3.4
Note. Dom = dominant hand grip strength; Non-dom = non-dominant hand grip strength; Hand S.A. = hand surface area in cm2
DISCUSSION
For the males, five independent variables correlated well with grip strength; namely
hand surface area, height, hand length, hand width and weight. These correlations
were weaker for the females. The correlations for the dominant hand of the males
ranged from R = .698 to .773, whereas for females they ranged from R = .380 to .512.
On the whole, the non-dominant hand displayed similar but usually higher correlation
values than the dominant hand. The strongest single correlation was between the two
hands at R = .950 for the males and R = .838 for the females.
For the males, the combination of the variables of hand surface area and height
achieved moderate predictive values for the grip strength of one hand, if the grip

192
strength of the other hand was unknown. For the females the predictive abilities of
these same variables was poor, with no other independent variables giving better
predictability. The most accurate way to predict the grip strength of one hand was to
know the grip strength of the other hand, in which case 90.2% of the difference
between the actual and predicted grip strength values could be accounted for in the
males as contrasted to 70.2% for the females. The SEEs are relatively small at 3.7 and
2.7 Kg f for the males and females respectively.
When the other hand is not available as a reference point, the accuracy of the grip
strength prediction is lowered considerably and consequently the SEE rise. When
hand surface area and height are put into a prediction model, between 33.9 and 63.5%
of the variance is accounted for. It is much more difficult to be confident about the
predicted grip strength values for the females than the males. Other variables, such as
exercise levels do not increase the predictive abilities significantly.
In general, when grip strength research participants have been sub-divided into
narrow groups with restricted ranges for their criterion and predictor variable values,
the predictive strength of the models has been greatly reduced. A reason for relatively
poor predictive abilities is that using these models is “not that simple” (Portney &
Watkins, 2000). Predictive relationships are not causal. “Statistical associations by
themselves do not provide sufficient evidence of causality... [also] it is important to
restrict generalization of predictive relationships to the population on which the data
were obtained” (Portney & Watkins, 2000, p. 535).
When the grip strength of one hand was unknown the bivariate linear regression
analyses were limited in their very nature, because as with most behavioural and
physiological phenomena, such as generating grip strength force, many unknown
factors and variables come into play every time a person performs that task. The
multiple linear regression models moved a little closer to being able to accurately
predict actual grip strength than the bivariate models, but again the residuals for these
models were high.
The first difficulty in making comparisons between studies is that only a small
proportion of grip strength studies have included teenagers. The males have tended to
193
have greater correlation values with grip strength for all predictor variables, than the
females, as was currently found also. Only a few studies have given correlation values
for individual predictor variables. Some of them only gave R values (Chatterjee &
Chowdhuri, 1991; Everett & Sills, 1952); others presented R2 values (Häger-Ross &
Rösblad, 2002; Neu et al., 2001). Adjusted R2 values were not often presented, thus
comparing prediction models with the current data was not straightforward.
Variables That Were Not Predictive
Certain anticipated predictor variables were not significant in predicting grip strength.
The shape of the hand does not correlate with grip strength, or assist its prediction
models. The impact of hand shape on grip strength is expanded upon in Chapter 10
and has been presented in Clerke et al. (2005). It was unexpected that no correlation
was found between the number of hours of exercise per week, or bicycle riding and
handgrip strength. This was possibly because those teenagers who were bike riding
did not perform arduous hill climbing which involves strong grip strength, or as they
used triathlon forearm support bars which decreased the necessity for strong
prolonged grip strength.
In a study of adults, 31 and 32-year-old men (n = 2,188) in physically demanding
jobs, had significantly stronger grip strength values than those performing lighter
work. In contrast, there was no significant grip strength differences in five different
levels of physical demanding job categories for age matched women (n = 1,987), with
the exception of women who performed very heavy work (Tammelin, Näyhä,
Rintamäki & Zitting, 2002). This may have been because the increasingly strenuous
jobs of the women generally did not demand progressive increases in grip strength,
whereas the succession of tasks for the males did. General physical fitness as a result
of regular physical activity, or a physically demanding job, does not necessarily
correlate with upper limb strength because upper limb strength is often only increased
by specific upper limb strength training. For example, a study with middle aged
people found that people who practiced a certain form of martial arts, soo bahk (n = 9)
were physically fitter than age matched controls (n = 9) in terms of aerobic capacity
and the number of push ups they could do, however their grip strength was not
significantly different (Douris et al., 2004). In contrast, Hunter, Thompson and Adams

194
(2000) found that in a group of 217 Australian women, increased physical activity
levels did correlate positively with grip strength. Perhaps because the increased
activity related to more involvement in physical exercise involving gripping, for
example, walking with weights, softball etc.
Many paediatric studies have shown the benefit of exercise on fitness, as reviewed by
Klepper (2003). However, if the exercise is not specifically directed at upper limb
strength it can not be expected that the grip strength of the fitter children will be any
greater than that in a control group of peers. The study of Sunnegårdh, Bratteby,
Nordesjö and Nordgren (1988) also found no association between physical activities
and muscle strength. They postulated that this was because they used “general
estimates of physical activity, while muscle strength variables are fairly specifically
influenced by different types of muscle activity” (Sunnegårdh et al., 1988, p. 297).
Pujol et al. (2005) found that upper limb and general fitness training did increase the
grip strength of teenaged girls. The types of sports played by the current group of
teenagers were analysed and found to have as many sports involving upper limb
strength (tennis, baseball etc.) as lower limb strength (cross-country running, soccer
etc.). Thus there was not a bias towards strength-demanding sports of only one muscle
group, within the sample. Most of the teenagers who did play sport played a mixture
of sports throughout the year. For example, those who played tennis in the summer
often did cross-country running in the winter. One other explanation for the lack of a
correlation between exercise levels and grip strength was that those that had a
physically demanding part-time job, but did not play after-hours sport would not have
been visible in the analysis, because part-time jobs were not recorded.
Age Versus Grip Strength
Many recent, large studies have confirmed that grip strength correlates highly with
age in the childhood and teenage years, but these studies encompassed much larger
age ranges than that of the current study. For example, in the study of Neu et al.
(2002) their males had a strong age correlation with grip strength (R2 = .83), with only
a slightly lower correlation for their females (R2 = .79). Their study had an age range
of 6 to 23 years and a sample size of 366 children and adolescents. Interestingly,
Everett and Sills (1952) (n = 400) had lower R values (R2 = .22) for their males in an

195
older age range (14 to 29 years). As grip strength changes little over this 14 to 29 year
age range and has generally plateaued by the age of 19 in males (Montoye &
Lamphiear, 1977), their narrower grip strength range would have led to their lower
correlations and poorer predictive abilities. Thus the poor predictive values for the
males (R2 adj = .068) in the current study and the non-significant correlations for the
females (R2 adj = .007) can be explained by the much narrower age range of 13 to 17-
year-olds.
Height Versus Grip Strength
In paediatric studies, height has been well correlated with grip strength, providing that
there has been a large spread of heights in the sample (Häger-Ross & Rösblad, 2002;
Rauch et al, 2002: Vaz et al., 2002). Chatterjee and Chowdhuri (1991) achieved a
high R value for their 7 to 73 year old males, R = .88 for the right hand and R = .87 for
the left hand. Rauch et al. (2002) stated that height should logically be strongly
correlated with grip strength; because height reflected the lengths of the muscles,
bones and lever arms and that these were the main determinants of upper extremity
muscle force. In their sample of 6 to 19 year olds, the males (n = 148) and females (n
= 157) each had height to grip strength correlations of R = .92.
In contrast, Everett & Sills (1952) reported a height and grip strength correlation for
males of R = .597 which was below the male correlation values of the current study
(R = .768 for DomT1, and R = .773 for Non-DomT1) for the age range 13 to 17 years.
Again their restricted range would most probably be the cause for the lower
correlations. Vaz et al. (2002) supplied gender split scatter plots which mirrored the
scatter pattern of the data points being all close to the line of best fit, for male and
female heights under 150 cm tall, with the data points dispersing above this height.
This trend was not so evident in the females in the current study, but was in the males
over 160 cm tall.
Weight Versus Grip Strength
In the current study, weight correlated moderately strongly with DomT1 for the males
(R = .724) and only moderately for the females (R = .422) with similar results for

196
Non-DomT1. With increased weight above 55 kg, the spread of the scatter plot data
points was much broader than with weights below 55 kg, this was most pronounced
with the males. A possible reason for the low correlation in the larger teenagers, as
Rauch et al. (2002) pointed out, was that there is little logic in trying to relate the
force of non-weight-bearing muscles such as that of the forearm, to weight.
In contrast to the present study, the study of Chatterjee and Chowdhuri (1991) found
relatively high R values between weight and grip strength for males
(R = .86). Perhaps this is because there were less overweight men in their Indian
sample, as indicated by the mean weight of the 20 to 29-year-olds being 53.75 kg
(SD = 6.70). The older men maintained the same weight, or only decreased it by 2 kg,
with little change in the SD until they reached 50 years old. Chatterjee and Chowdhuri
gave a mean weight for the 10 to 19-year-olds as 39.67 kg (SD of 10.38 kg), but as
this is a period of rapid overall growth and development, the mean weight for this
young age range is not particularly meaningful. A more recent study found a weight
to grip strength correlation of R = .34 to .58, depending on the handle size in
consideration (MacDermid et al., 2002).
The Brisbane based study of Newman et al. (1984) indicated that amongst age
groupings of two yearly intervals (for 5 to 18-year-olds) there were generally grip
strength to weight correlations of R > .5, but some of the age groupings only
generated R < .3. Again these poor correlation values are consistent with the narrow
weight ranges that would occur within the two-year sub-groups they analysed.
BMI Versus Grip Strength
For children and adolescents, grip strength has been found to be largely dependent on
body size, rather than age, and is gender biased in favour of males from the
commencement of puberty (Doré, et al., 2002; Rauch et al., 2002; Sinaki, Limburg,
Wollan, Rogers & Murtaugh, 1996). In the current study the same trends were found.
The vigour of this body size and grip strength relationship was greatest for the males,
and was maximal when the variables of height and weight were used independently,
not combined as BMI.

197
There appeared to be a critical cut-off point for a strong relationship between BMI
and grip strength. Other research indicates that there are no differences in the intrinsic
strength, or contractile properties of the elbow flexor and knee extensor muscles
between obese and non-obese pre-adolescent boys (Blimkie, Ebbesen, MacDougall,
Bar-Or & Sale, 1989). The question must then be asked, why do the obese boys have
less power when normalised for weight? Blimkie et al. suggested that other factors,
such as the handicapping effect of excess fat mass probably accounted for the reduced
motor performance of obese children. It is possible that these same factors accounted
for the present observations about the obese boys and girls.
A larger sample size may have revealed a greater effect of obesity on grip strength in
the females than in the males. This is because obese women have been found to have
a suppressed release of plasma epinephrines (adrenaline) in response to isometric grip
strength testing, as compared to obese men (Gustafson & Kalkhoff, 1982).
Epinephrine is a promoter of skeletal muscle hypertrophy, probably in part due to its
action of reducing the rate of myofibrilae breakdown. Thus less epinephrine is linked
with increased myofibrilae breakdown, and in turn less muscle bulk in the obese
females, as compared to the males. Epinephrine increases the levels of calpastatin,
which in turn inhibits the proteolytic enzyme calpain (Speck, Collingwood, Bardsley,
Tucker, Gilmour, & Buttery, 1993). Calpain degrades cytoskeleton and myofibrilae
components (Belcastro, Shewchuk & Raj, 1998), and are part of the muscular atrophy
process (Jackman & Kandarian, 2004). Calpain also plays a role in regulating muscle
glucose metabolism and muscle mass (Otani et al., 2004).
Hand Length Versus Grip Strength
The dimensions of the female hands differed to that of the male hands in this study
(see Chapter 7, Part 1). This gender difference has been documented (Subirá &
Malgosa, 1988). It may partially be this disparity that has impacted upon the hand
length-grip strength relationship differently in the two genders. The hand length of the
males had a stronger correlation with grip strength (R = .768 for DomT1, R = .773 for
Non-DomT1), than the hand length of the females (R =. 450 for DomT1, R = .560 for
Non-DomT1). The length of the muscles and their lever arms may be different

198
between the two genders, and may be critical to the generation of grip strength. In
comparison, Häger-Ross and Rösblad (2002) found a much stronger relationship
between hand length and grip strength for males (R = .91) and females (R = .85).
Their wider range of hand lengths in their 4 to 16-year-old age range no doubt
assisted in this. In contrast, Everett and Sills (1952) found a modest relationship with
R = .503 in a sample of males, which was largely near the end of, or had completed
the majority of their physical growth.
Hand Width Versus Grip Strength
Hand width can be an indication of intrinsic muscle bulk and therefore hand strength.
Subirá and Malgosa (1988) found wider mean hand widths in manual workers than
sedentary workers. Merkies et al. (2000) gave no supporting statistics, but stated that
in a sample of 530 males and females “hand circumference was a significant predictor
of GS [grip strength] in males but not in females” (2000, p. 1399). It could therefore
be expected that hand width had a strong relationship with grip strength in the present
study, however this was not the case. Hand width had a slightly weaker correlation
with grip strength for the males and the females than hand length. One study of adults
contradicted the current findings. Everett and Sills (1952) found a slightly stronger
relationship between hand width and grip strength (R = .628) than hand length and
grip strength (R = .503).
The noticeably lower R value for the hand width with grip strength correlation of the
females in the present study can be explained by their lack of hand width variance.
There was no significant difference in the hand widths of the 13 and 17-year-old
females, although there was a small but significant difference between the grip
strength means of the two groups. In comparison, the 13 and 17-year-old males had a
significant and large difference in their hand widths and also in their grip strength
means, refer to Chapter 7, Parts 1 and 2.
Hand Surface Area Versus Grip Strength
The overall size of the hand (as indicated by the surface area) had a slightly stronger
correlation with grip strength than either of the independent variables of hand width,

199
or hand length independently. This may be because in general, the bigger the hand,
the bigger the body; and the bigger the body, the more strength it can generate (unless
it is adipose tissue rather than muscle bulk that is the main contributor to body size).
If the current sample of males and the females were tested on the same handle
position, the females may have been disadvantaged in some way, because there is an
optimal grip handle size for each adult woman depending on her hand span, but adult
men all perform equally well on the one pre-set handle size (Ruiz-Ruiz, Mesa,
Gutiérrez & Castillo, 2002). The present gender differences in correlation values and
predictive abilities for this variable cannot be explained by each female not using her
optimal handle size.
Multiple Linear Regression Models
A number of researchers have used multiple linear regression models to predict the
grip strength of teenagers. A number of models were created to match these. When
the variables of TESTage, height, weight and hand length were put in a stepwise
linear regression model for the males, as done by Häger-Ross and Rösblad (2002),
hand length and weight were the only included variables. These two variables
accounted for 62.3% (R2 = .630, R2adj = .623) of the variance in DomT1 for the males,
with hand length being the variable with the highest predictive ability (Z score =
.542), then weight (Z score = .301). Height and hand length were correlated with each
other, refer to Chapter 7, Part 1a for the details. Height had the same bivariate
correlation value with grip strength as had hand length (r = .768). When predictor
variables have similar bivariate correlations with a criterion variable, and when they
correlate highly with each other they have shared or overlapping variance (influence,
or effect) on the criterion variable. In these situations they often mutually exclude
each other from a regression model (Tabachnick & Fidell, 2001). Non-DomT1 results
were similar, with 62.7% (R2 = .633, R2adj = .62.7) of the variance accounted for.
For the females, when predicting the grip strength of the dominant hand the stepwise
regression model retained height, weight and hand length. This model was only able
to account for 32.6% (R2 = .344, R2adj .326) of their variance in DomT1. This left a
large residual of 67.4% of the grip strength difference between the actual and

200
predicted grip strength unaccounted. The results for Non-DomT1 were slightly better.
The same combination of predictor variables was included in the final model
calculated by SPSS. Thus 43.1% (R2 = .446) of the variance was accounted for in this
particular model. For the dominant hand, the Z scores showed height (Z = .290),
weight (Z = .250), and then hand length (Z = .199) to have the highest predictive
abilities. The order was the same for the non-dominant hand, but the weightings (the Z
scores) were slightly different for each variable, with Z = .351 for height, Z = .305 for
weight, then Z = .189 for hand length.
In contrast, Häger-Ross and Rösblad (2002) found that for their age range of 4 to 16
years, there was excellent predictability of the grip strength of a hand when
combining age, height, weight and hand length, with their males achieving an R2 = .87
and their females achieving R2 = .83. Assumedly it was their larger sample size (n =
530) and wider age range that accounted for greater accuracy in their predictive
abilities. Everett and Sills (1952) found that a combination of hand width, height,
weight, hand length, finger length, and mesomorphy produced R = .7837, with hand
width, weight and height producing R = .7335. Again these models with more
accurate predictive abilities used broader age and grip strength ranges that the present
study.
In summary, the individual variables of height, weight, BMI, hand length, hand width,
hand surface area and the grip strength of one hand had various levels of ability to
predict the pre-morbid grip strength of the other hand. The most accurate way to
predict the grip strength of one hand was to use the other hand, if it was available. If a
male teenager had suffered bilateral hand injuries their height and hand surface area
were able to predict their grip strength with a moderate amount of accuracy, 62.6 to
63.5% of the difference between the predicted and actual grip strength were accounted
for in this model, with 6.8 to 7.1 Kg f of possible error. If they were female with
bilateral injuries, it was very difficult to predict their grip strength without large
residuals.
Other independent variables such as TESTage, the number of hours of exercise or
bicycle riding per week, and the W/L ratio of the hand were poorly or not correlated

201
with grip strength and thus could not contribute to predicting the grip strength of a
teenager.
LIMITATIONS OF THE STUDY
Instead of using BMI to express body size, stronger correlations may have been found
with the Tanner stages of puberty, as each stage greatly affects skeletal muscle
development. Kreipe and Gewanter (1985) examined the correlation between grip
strength and self-assessed Tanner stages for adolescent males. They found that the
two variables were highly correlated (R = .803) which lead to an R2 value of .644.
They recommended that no other anthropometric variables were needed to estimate
grip strength, for the purposes of screening boys for readiness to play contact sports.
The review of Jaric (2002) agreed with them. When adjusted this value would not
have given greater prediction accuracy than the combination of hand length and
weight, thus it may not be necessary to ask such personal questions of the males.
Forearm girth of the participants (as a reflection of lean muscle volume) was not
measured in the current study. It may have been able to account for more of the
variance in grip strength, with a smaller SEE than other predictor variables. Vaz et al.
(2002) found that for 5 to 18-year-olds, when forearm circumference was used as a
predictor for grip strength it could account for 78% of the variance in grip strength
(R2adj = .78, SEE = 4.74 kg f). However age alone could account for 81% of the
variance (R2adj = .81, SEE = 4.40 kg f), with little advancement on this when forearm
circumference and height were combined with age within a linear regression model
(R2adj = .84, SEE = 3.99 kg f). The slightly larger SEEs for the males (7.1 kg f for
DomT1 and 6.8 kg f for Non-DomT1) in the multiple linear regression models of the
current study, may have been reduced with forearm circumference included in the
predictor variables. Of course a wider age range would also have increased the
predictive strengths of the variables, but would have been at the expense of focusing
on the years of puberty in which so little grip strength research has been conducted.

202
CONCLUSION
The independent variables of height, weight, hand length, hand width, hand surface
area, and BMI were significantly correlated with grip strength, for both genders. Each
of these variables was more strongly correlated with grip strength for the males than
for the females. The predictor variables for predicting the grip strength value of a
hand (apart from the grip strength of the contralateral hand) were height and hand
surface area.
For teenagers with bilateral hand injuries, although it would be desirable to arrive at a
prediction formula for the pre-morbid grip strength of one hand based on such
variables as anthropometric values and sporting/fitness levels, it was not possible to
account for a high percentage of the variance between the actual and predicted grip
strengths, this was especially so for the females. Within these models the residuals
meant that between 36.5 and 66.1% or the difference in the actual and predicted grip
strength could not be accounted for. The SEEs were between 3.4 and 7.1 kg f. Many
other unidentified variables also influence the grip strength and the prediction of grip
strength values for these teenagers.
Thus the grip strength of one hand can only be predicted with a small amount of error
if the grip strength of the other hand is known. The SEE in this bivariate regression
model is between 2.3 and 3.7 kg f, with the grip strength of one hand of a male
teenager accounting for 90.2% of the variance in the grip strength of the other hand
and 70.2% of the variance accounted for if the teenager is a female. The female grip
strength prediction equations for the non-dominant hand can be improved slightly if
her hand surface area is added to the equation. Thus clinicians treating teenagers with
bilateral hand injuries need to be mindful of the margins for error in these models, and
record gender, height and hand surface area (via hand length and hand width
measurements) to arrive at the most accurate prediction of the pre-morbid grip
strength value of an individual teenage patient.
Related Documents