Chapter 3 Chapter 3 1 Chapter 3. Highway Design Chapter 3. Highway Design for Performance for Performance 2. 2. Determine the level of Determine the level of service on a basic freeway service on a basic freeway segment under specified segment under specified traffic characteristics traffic characteristics Only section 2 is covered in CE361 (We study more about this topic in CEEn 562 Traffic Engineering): By the end of this chapter the student will be able to: Lesson objectives of Section 3.2: Define and calculate the capacity of a multilane interstate highway. Determine level of service with various traffic mixes and lane configurations. Basic freeway segment capacity analysis shows you the essence of capacity analysis of other facilities

Chapter 3 1 Chapter 3. Highway Design for Performance 2.Determine the level of service on a basic freeway segment under specified traffic characteristics.
Dec 21, 2015
Welcome message from author
This document is posted to help you gain knowledge. Please leave a comment to let me know what you think about it! Share it to your friends and learn new things together.
Transcript

Chapter 3Chapter 3 11
Chapter 3. Highway Design for Chapter 3. Highway Design for PerformancePerformance
2.2. Determine the level of service on a Determine the level of service on a basic freeway segment under basic freeway segment under specified traffic characteristicsspecified traffic characteristics
Only section 2 is covered in CE361 (We study more about this topic in CEEn 562 Traffic Engineering): By the end of this chapter the student will be able to:
Lesson objectives of Section 3.2:
Define and calculate the capacity of a multilane interstate highway.
Determine level of service with various traffic mixes and lane configurations.
Basic freeway segment capacity analysis shows you the essence of capacity analysis of other facilities

22Chapter 3Chapter 3
Basic freeway segments: Segments of the freeway that are outside of the influence area of ramps or weaving areas and have uniform traffic and roadway conditions.
I-15 under construction
3.2.1 Freeway definitions
33Chapter 3Chapter 3
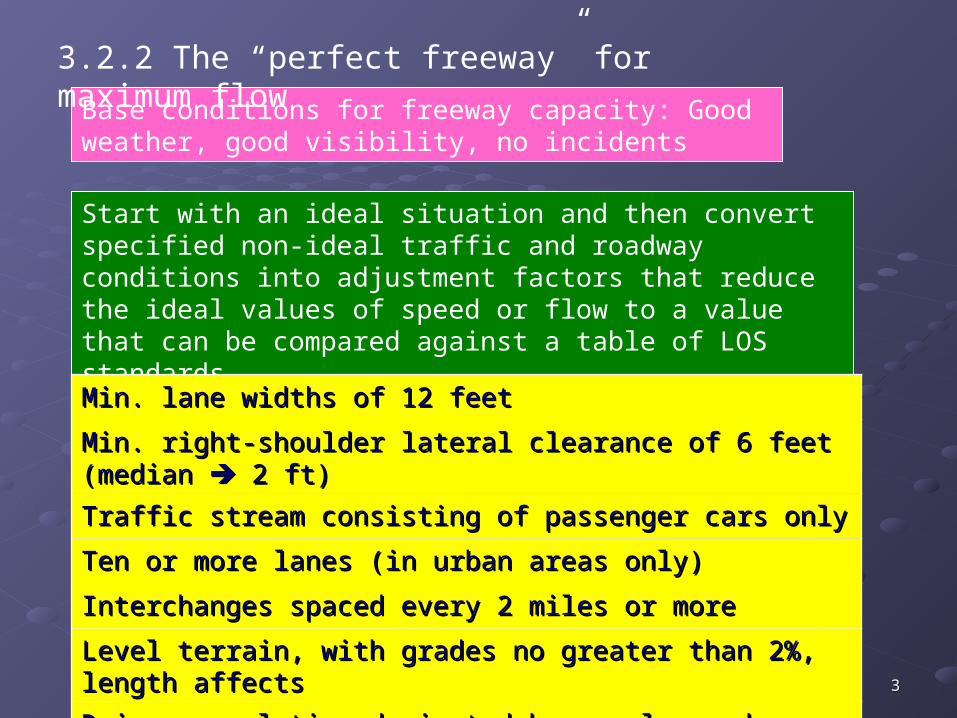
Base conditions for freeway capacity: Good weather, good visibility, no incidents
Start with an ideal situation and then convert specified non-ideal traffic and roadway conditions into adjustment factors that reduce the ideal values of speed or flow to a value that can be compared against a table of LOS standards.
Min. lane widths of 12 feetMin. lane widths of 12 feet
Min. right-shoulder lateral clearance of 6 feet (median Min. right-shoulder lateral clearance of 6 feet (median 2 ft) 2 ft)
Traffic stream consisting of passenger cars onlyTraffic stream consisting of passenger cars only
Ten or more lanes (in urban areas only)Ten or more lanes (in urban areas only)
Interchanges spaced every 2 miles or moreInterchanges spaced every 2 miles or more
Level terrain, with grades no greater than 2%, length affectsLevel terrain, with grades no greater than 2%, length affects
Driver population dominated by regular and familiar usersDriver population dominated by regular and familiar users
3.2.2 The “perfect freeway” for maximum flow
44Chapter 3Chapter 3
LOS C or D
LOS B
LOS A
LOS E or F
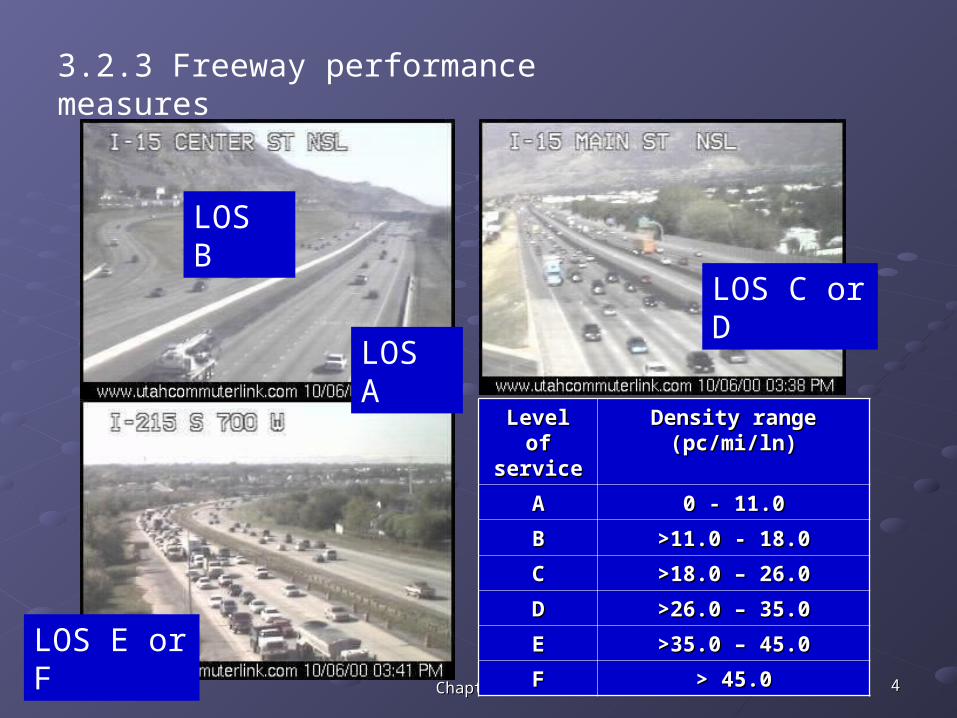
Level of Level of serviceservice
Density range (pc/mi/ln)Density range (pc/mi/ln)
AA 0 - 11.00 - 11.0
BB >11.0 - 18.0>11.0 - 18.0
CC >18.0 – 26.0>18.0 – 26.0
DD >26.0 – 35.0>26.0 – 35.0
EE >35.0 – 45.0>35.0 – 45.0
FF > 45.0> 45.0
3.2.3 Freeway performance measures

55Chapter 3Chapter 3
Performance measures can be: Density, speed, and volume-to-capacity (v/c ratio)
Interpolate if necessary.
3.2.3 Freeway performance measures (cont.)

66Chapter 3Chapter 3
Density criteria are independent of Free Flow Speed level, Table 3-13.
3.2.3 Freeway performance measures (cont.)

77Chapter 3Chapter 3
Service flow rates vs. service volumesService flow rates vs. service volumes
What is used for capacity analysis is service flow rate. The actual number of vehicles that can be served during one peak hour is service volume. This reflects the peaking characteristic of traffic flow.
SVi = SFi * PHF
Stable flow
Unstable flow
Density
Flo
w
SFA
SFE
AB
C
D
E F
88Chapter 3Chapter 3
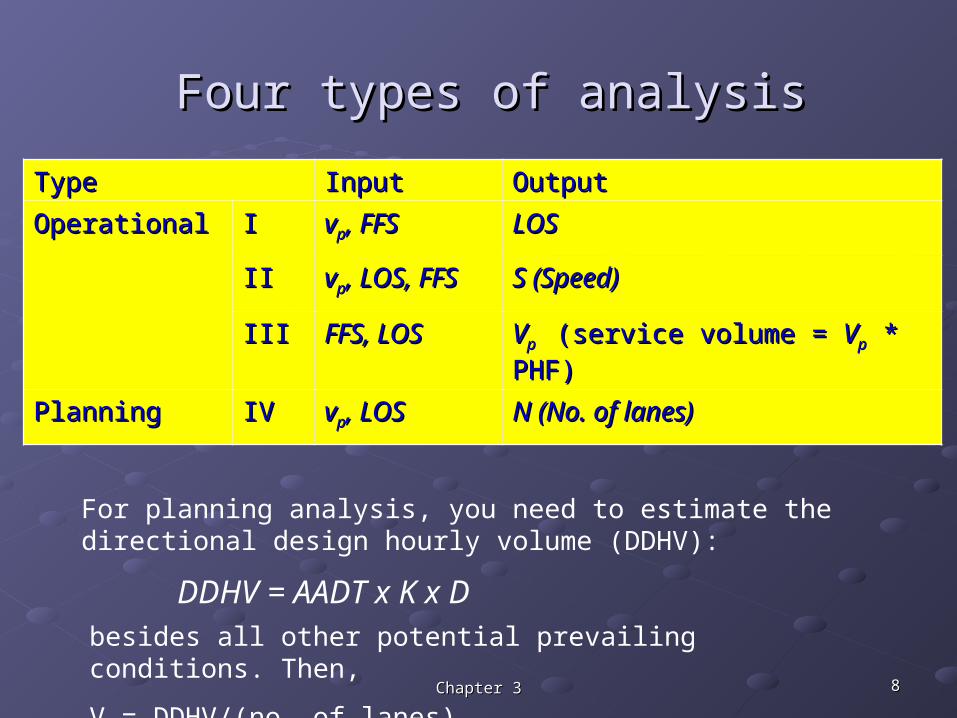
Four types of analysisFour types of analysis
TypeType InputInput OutputOutput
OperationalOperational II vvpp, FFS, FFS LOSLOS
IIII vvpp, LOS, FFS, LOS, FFS S (Speed)S (Speed)
IIIIII FFS, LOSFFS, LOS VVp p (service volume = (service volume = VVpp * PHF) * PHF)
PlanningPlanning IVIV vvpp, LOS, LOS N (No. of lanes)N (No. of lanes)
For planning analysis, you need to estimate the directional design hourly volume (DDHV):
DDHV = AADT x K x Dbesides all other potential prevailing conditions. Then,
V = DDHV/(no. of lanes)

99Chapter 3Chapter 3
You want to find out LOS, Speed, and Density.
Step 1: Define and segment the freeway sections as appropriate
Step 2: Based on the measured or estimated free-flow speed (eq. 3.11, See the next slide) on the freeway segment, construct an appropriate speed-flow curve of the same shape as the typical curves shown in Figure 3.9.
Step 3: Using the flow rate, vp, read up to the free-flow speed curve identified in step 2 and determine the average passenger car speed (This is not FFS!) and LOS corresponding to that points
Step 4: Determine the density of flow as D = vp /S
Step 5: Determine the LOS using the density ranges in Table 3.12.
3.2.4 Applications (Operational analysis), Operation (LOS)
1010Chapter 3Chapter 3
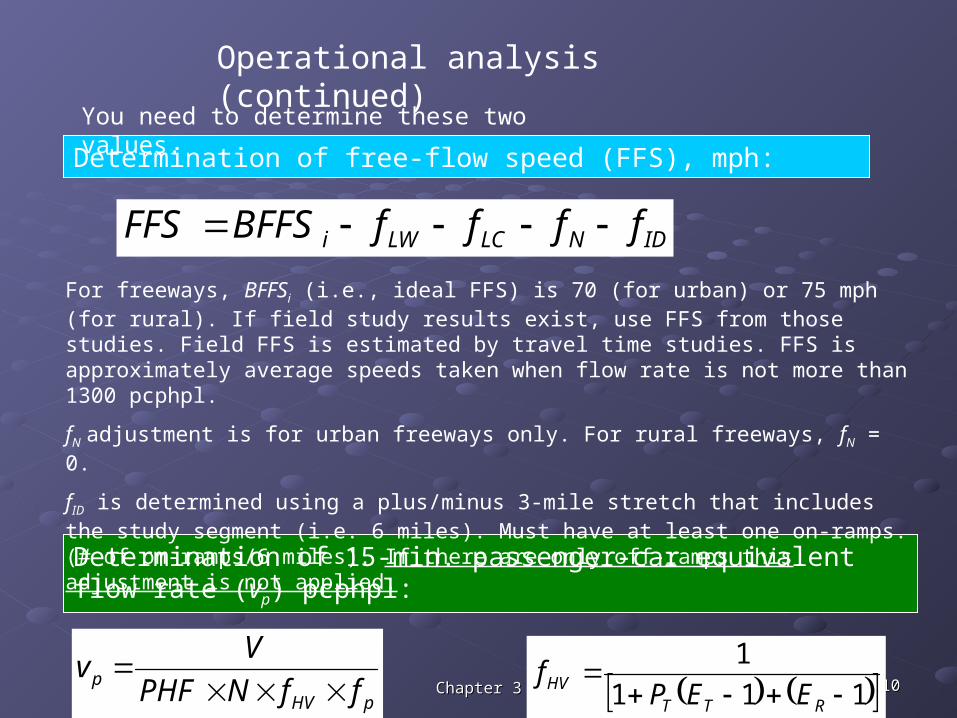
Determination of free-flow speed (FFS), mph:
Determination of 15-min. passenger-car equivalent flow rate (vp) pcphpl:
IDNLCLWi ffffBFFSFFS
pHVp ffNPHF
Vv
For freeways, BFFSi (i.e., ideal FFS) is 70 (for urban) or 75 mph (for rural). If field study results exist, use FFS from those studies. Field FFS is estimated by travel time studies. FFS is approximately average speeds taken when flow rate is not more than 1300 pcphpl.
fN adjustment is for urban freeways only. For rural freeways, fN = 0.
fID is determined using a plus/minus 3-mile stretch that includes the study segment (i.e. 6 miles). Must have at least one on-ramps. (# of on-ramps/6 miles). If there are only off-ramps this adjustment is not applied.
Operational analysis (continued)
You need to determine these two values.
111
1
RTTHV EEP
f
1111Chapter 3Chapter 3
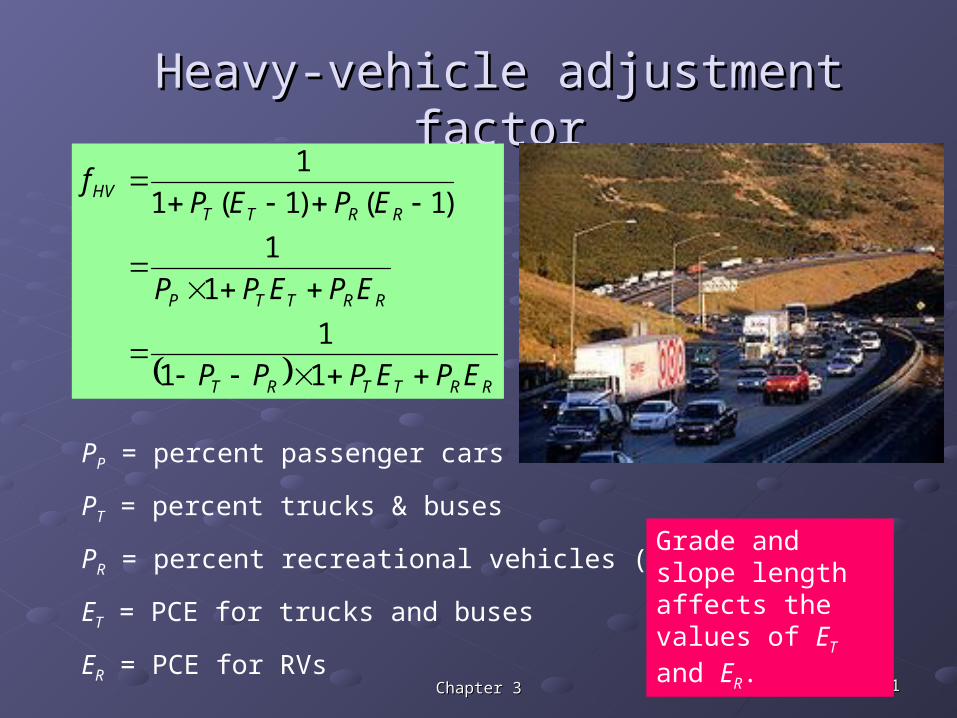
Heavy-vehicle adjustment factorHeavy-vehicle adjustment factor
RRTTRT
RRTTP
RRTTHV
EPEPPP
EPEPP
EPEPf
11
1
1
1
)1()1(1
1
PP = percent passenger cars
PT = percent trucks & buses
PR = percent recreational vehicles (RVs)
ET = PCE for trucks and buses
ER = PCE for RVs
Grade and slope length affects the values of ET and ER.

1212Chapter 3Chapter 3
Once you have Once you have FFSFFS and and vvpp……
You can determine density which is the primary measure of effectiveness of basic freeway segments.
S
vD p
For the LOS range from A to D, S (speed) is basically FFS. Toward the upper end of LOS D to E, S does decrease from FFS as shown in the speed-flow rate diagram.
1313Chapter 3Chapter 3
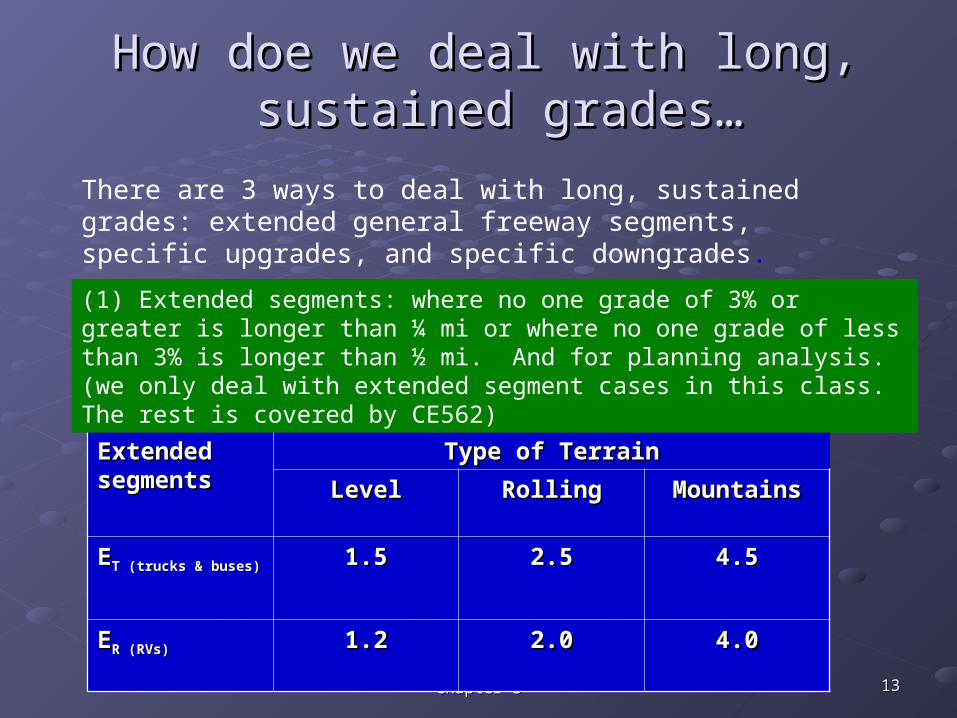
How doe we deal with long, How doe we deal with long, sustained grades…sustained grades…
Extended Extended segmentssegments
Type of TerrainType of Terrain
LevelLevel RollingRolling MountainsMountains
EET (trucks & buses)T (trucks & buses) 1.51.5 2.52.5 4.54.5
EER (RVs)R (RVs) 1.21.2 2.02.0 4.04.0
There are 3 ways to deal with long, sustained grades: extended general freeway segments, specific upgrades, and specific downgrades.
(1) Extended segments: where no one grade of 3% or greater is longer than ¼ mi or where no one grade of less than 3% is longer than ½ mi. And for planning analysis. (we only deal with extended segment cases in this class. The rest is covered by CE562)

1414Chapter 3Chapter 3
How we deal with long, sustained grades…How we deal with long, sustained grades…(cont.) (cont.) (This will be covered in CE562 in detail.)(This will be covered in CE562 in detail.)
(2) Specific upgrades: Any freeway grade of more than ½ mi for grades less than 3% or ¼ mi for grades of 3% or more. (For a composite grade, see the next slide.) Use the tables for ET and ER for specific grades.
(3) Specific downgrades:
If the downgrade is not severe enough to cause trucks to shift into low gear, treat it as a level terrain segment.
Otherwise, use the table for downgrade ET
For RVs, downgrades may be treated as level terrain.
(PC equivalents for these two cases are not covered by the text. Just remember these adjustments may need to be done for long sustained grades.)
1515Chapter 3Chapter 3
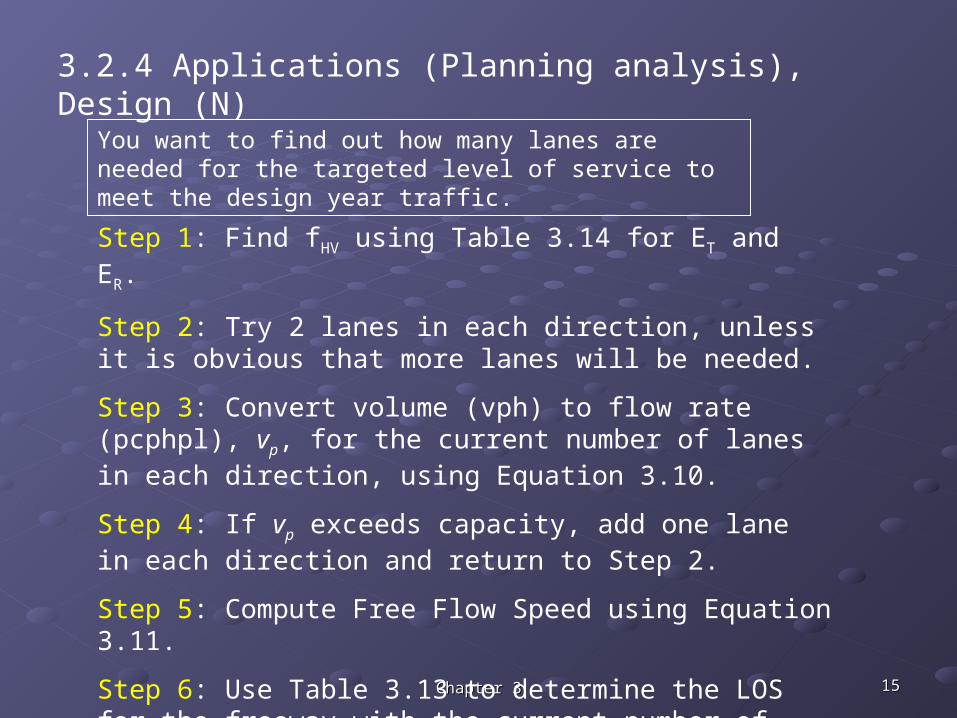
3.2.4 Applications (Planning analysis), Design (N)
You want to find out how many lanes are needed for the targeted level of service to meet the design year traffic.
Step 1: Find fHV using Table 3.14 for ET and ER.
Step 2: Try 2 lanes in each direction, unless it is obvious that more lanes will be needed.
Step 3: Convert volume (vph) to flow rate (pcphpl), vp, for the current number of lanes in each direction, using Equation 3.10.
Step 4: If vp exceeds capacity, add one lane in each direction and return to Step 2.
Step 5: Compute Free Flow Speed using Equation 3.11.
Step 6: Use Table 3.13 to determine the LOS for the freeway with the current number of lanes being considered. If the LOS is not good enough, add another lane and return to Step 3.
Related Documents