Technical Report Documentation Pal!e I 2. Government Accession No. 3. Recipient's Catalog No. 1. Report No. FHWA/TX-04/0-1752-12 4. Title and Subtitle 5. Report Date PERFORMANCE MEASURES FOR ANALYZING REAL-TIME FREEWAY OPERATIONS October 2003 7. Author(s) Robert E. Brydia and Kevin N. Balke 9. Performing Organization Name and Address Texas Transportation Institute The Texas A&M University System College Station, Texas 77843-3135 12. Sponsoring Agency Name and Address Texas Department of Transportation Research and Technology Implementation Office P. 0. Box 5080 Austin, Texas 78763-5080 15. Supplementary Notes 6. Performing Organization Code 8. Performing Organization Report No. Report 0-1752-12 10. Work Unit No. (TRAIS) 11. Contract or Grant No. Project No. 0-1752 13. Type of Report and Period Covered Technical Report: September 2002 -August 2003 14. Sponsoring Agency Code Project performed in cooperation with the Texas Department of Transportation and the Federal Highway Administration. Project Title: TransLink® Research Program 16. Abstract The concept of real-time performance measurement analyzes feedback from the operational response to freeway incident conditions and provides a quantitative methodology for assessing the impacts of various operational strategies. The significance of this technique is that it can enhance the efficiency of freeway incident management. Even a small percent reduction in the length of an incident would accrue millions of dollars of time-savings for the affected portion of the roadway. The design and construction of a real-time performance measurement system require an understanding of the performance measures and their application to transportation, a review of the state-of-the-practice in performance measurement, and an experimental design on which to build a prototype system. 17. KeyWords 18. Distribution Statement Performance Measures, Real-Time, Freeway Operations, Simulation No restrictions. This document is available to the public through NTIS: 19. Security Classif.( of this report) Unclassified Form DOT F 1700.7 cs-72) National Technical Information Service Springfield, Virginia 22161 http://www.ntis.gov 1 20. Security Classif.(ofthis page) 21. No. of Pages Unclassified 42 I 22. Price Reproduction of completed page authorized

Welcome message from author
This document is posted to help you gain knowledge. Please leave a comment to let me know what you think about it! Share it to your friends and learn new things together.
Transcript
Technical Report Documentation Pal!e I 2. Government Accession No. 3. Recipient's Catalog No. 1. Report No.
FHW A/TX-04/0-1752-12 4. Title and Subtitle 5. Report Date
PERFORMANCE MEASURES FOR ANALYZING REAL-TIME FREEWAY OPERATIONS
October 2003
7. Author(s)
Robert E. Brydia and Kevin N. Balke 9. Performing Organization Name and Address
Texas Transportation Institute The Texas A&M University System College Station, Texas 77843-3135
12. Sponsoring Agency Name and Address
Texas Department of Transportation Research and Technology Implementation Office P. 0. Box 5080 Austin, Texas 78763-5080
15. Supplementary Notes
6. Performing Organization Code
8. Performing Organization Report No.
Report 0-1752-12 10. Work Unit No. (TRAIS)
11. Contract or Grant No.
Project No. 0-1752
13. Type of Report and Period Covered
Technical Report: September 2002 -August 2003 14. Sponsoring Agency Code
Project performed in cooperation with the Texas Department of Transportation and the Federal Highway Administration. Project Title: TransLink® Research Program 16. Abstract
The concept of real-time performance measurement analyzes feedback from the operational response to freeway incident conditions and provides a quantitative methodology for assessing the impacts of various operational strategies.
The significance of this technique is that it can enhance the efficiency of freeway incident management. Even a small percent reduction in the length of an incident would accrue millions of dollars of time-savings for the affected portion of the roadway.
The design and construction of a real-time performance measurement system require an understanding of the performance measures and their application to transportation, a review of the state-of-the-practice in performance measurement, and an experimental design on which to build a prototype system.
17. KeyWords 18. Distribution Statement
Performance Measures, Real-Time, Freeway Operations, Simulation
No restrictions. This document is available to the public through NTIS:
19. Security Classif.( of this report)
Unclassified
Form DOT F 1700.7 cs-72)
National Technical Information Service Springfield, Virginia 22161 http://www.ntis.gov
1
20. Security Classif.(ofthis page) 21. No. of Pages
Unclassified 42 I 22. Price
Reproduction of completed page authorized

PERFORMANCE MEASURES FOR ANALYZING REAL-TIME FREEWAY OPERATIONS
by
Robert E. Brydia Associate Research Scientist
Texas Transportation Institute
and
Kevin N. Balke, Ph.D., P.E. TransLink® Center Director
Texas Transportation Institute
Report 0-1752-12 Project Number 0-1752
Project Title: TransLink® Research Program
Performed in cooperation with the Texas Department of Transportation
and the Federal Highway Administration
October 2003
TEXAS TRANSPORTATION INSTITUTE The Texas A&M University System College Station, Texas 77843-3135

DISCLAIMER
The contents of this report reflect the views of the authors, who are responsible for the facts and the accuracy of the data presented herein. The contents do not necessarily reflect the official view or policies of the Federal Highway Administration (FHWA) or the Texas Department of
. Transportation (TxDOT). This report does not constitute a standard, specification, or regulation. The engineer in charge was Kevin N. Balke, P.E. (Texas, #66529).
The United States Government and the State of Texas do not endorse products or manufacturers. Trade or manufacturers' names appear herein solely because they are considered essential to the object of this report.
v
--------- -- --- --------------------,
ACKNOWLEDGMENTS
This project was conducted as part of the TransLink® research program and was performed in cooperation with the Texas Department of Transportation and the Federal Highway Administration. The project team recognizes the following TransLink® partners for their generous support of the TransLink® research program:
• U.S. Department of Transportation, Federal Highway Administration; • Texas Department of Transportation; • Metropolitan Transit Authority of Harris County; • Texas Transportation Institute; and • Rockwell International.
The project team would also like to recognize the following individuals for their support of this specific project:
• David Gibson, Federal Highway Administration; • Mark Olson, Federal Highway Administration; • AI Kosik, Traffic Operations Division, Texas Department of Transportation; • Richard Reeves, Traffic Operations Division, Texas Department of Transportation; • Sally Wegmann, Houston District, Texas Department of Transportation; • Terry Sams, Dallas District, Texas Department of Transportation; • Wallace Ewell, Fort Worth District, Texas Department ofTransportation; and • Pat Irwin, San Antonio District, Texas Department of Transportation.
Vl
TABLE OF CONTENTS
Page
List of Figures ............................................................................................................................. viii List Of Tables ................................................................................................................................ ix CHAPTER 1: INTRODUCTION ............................................................................................... l
FREEWAY TRAFFIC MANAGEMENT .................................................................................. 1 INCIDENT MANAGEMENT CONCEPTS .............................................................................. 1 INCIDENT MANAGEMENT STATE-OF-THE-PRACTICE .................................................. 2 THE NEED FOR A REAL-TIME INCIDENT MANAGEMENT FEEDBACK SYSTEM ..... 2
CHAPTER 2: PERFORMANCE MEASURES ......................................................................... 5 WHAT IS A PERFORMANCE MEASURE? ............................................................................ 5 WHY USE PERFORMANCE MEASUREMENT? ................................................................... 5 WHAT IS A GOOD PERFORMANCE MEASURE? ............................................................... 6 PERFORMANCE MEASUREMENT SYSTEMS .................................................................... 6 PERFORMANCE MEASURES IN TRANSPORTATION ....................................................... 7 WIDE-SCALE COMPARISONS ............................................................................................... 7 DEFINING PERFORMANCE MEASURES FOR TRANSPORTATION SYSTEMS ............ 8 DATA FOR PERFORMANCE MEASUREMENT ................................................................... 9 SUMMARY .............................................................................................................................. 11
CHAPTER 3: STATE-OF-THE-PRACTICE IN TRANSPORTATION PERFORMANCE MEASURES ................................................................................................................................ 13
OPERATIONAL PERFORMANCE MEASURES USED IN TEXAS ................................... 13 OPERATIONAL PERFORMANCE MEASURES IN OTHER STATES .............................. 14 EVOLVING TOWARD MORE SOPHISTICATED OPERATIONAL PERFORMANCE MEASURES ............................................................................................................................. 16 SUMMARY .............................................................................................................................. 17
CHAPTER 4: APPLICATION FRAMEWORK .................................................................... 19 CONSTRUCTING A REAL-TIME PERFORMANCE MEASURES APPLICATION ......... 19 A SIMULATION FRAMEWORK ........................................................................................... 19 EXPERIMENTS WITH THE PROTOTYPE ........................................................................... 22
CHAPTER 5: CONCLUSIONS ................................................................................................ 27 REFERENCES ............................................................................................................................ 29
vii
LIST OF FIGURES
Page
Figure 1. Relationship of Performance Measures to Goals and Objectives .................................. 8 Figure 2. Performance Measures in TxDOT AMTS ................................................................... 14 Figure 3. Two-way Information Flow ofProtoype System ......................................................... 20 Figure 4. Hardware-in-the-Loop Architecture ofProtoype System ............................................ 21 Figure 5. Hardware-in-the-Loop Components ............................................................................. 21 Figure 6. Normal Operations within the Experimental Design ................................................... 23 Figure 7. Incident Occurs within Experimental Design ............................................................... 23 Figure 8. Operational Response ................................................................................................... 24 Figure 9. Simulation Response to Operator Input. ...................................................................... 24 Figure 10. Performance Measure Analysis Area ......................................................................... 25 Figure 11. Multi-Faceted Operator Response .............................................................................. 26 Figure 12. Additional Simulation Response to Operator Input. .................................................. 26
Vlll

LIST OF TABLES
Page
Table 1. Performance Measures Used in Traffic Web Sites ........................................................ 16 Table 2. Sample Operational Performance Measures .................................................................. 18
IX

CHAPTER!: INTRODUCTION
FREEWAY TRAFFIC MANAGEMENT
The concept of Freeway Traffic Management, as stated in the Freeway Management Handbook, is to control, guide, and warn traffic to improve the flow of people and goods on limited access facilities (1). Although subsequent versions of the manual have expanded the definition and scope of freeway traffic control, the root goal remains the same-to operate a freeway facility in such a manner to provide for the safe and efficient movement of goods and people.
One aspect of achieving that goal has been the advent of freeway management systems. A freeway management system generally encompasses the elements of field-based infrastructure, communications, and a control center. Field infrastructure, such as inductive pavement loops, cameras, and dynamic message signs (DMSs), sends information over the communication links to monitoring systems located in the control center. Typically, a combination of people and computer software "look" at the monitored facilities and make decisions based on the data being "seen" from the field.
Freeway management systems are not new. Indeed, some cities have been engaged in some aspects of freeway management since 1960. Over time, as systems have been implemented, the control center elements have been housed in transportation management centers (TMCs). While the specific objectives of the TMC may vary by city and facility, the primary goal is the active management of the freeway system. One component of this management is the mitigation of congestion, either recurrent or single time. This mitigation is often the critical task of TMC operations and planning.
INCIDENT MANAGEMENT CONCEPTS
Mitigating congestion and restoring the roadway to normal operations is the driving force behind building an incident management system. The basis for incident management operations is monitoring the current conditions of the freeway system and reacting to changes in those conditions.
As an example, a typical response to detecting an incident may be to shut down a lane or move to a different ramp metering strategy. Each action has the potential to alter the flow of vehicles into the affected area, which has implications on both the response time of emergency vehicles and the disruption of the upstream traffic.
Additional responses might also include disseminating information to motorists approaching the area (e.g., by displaying route diversion messages on the dynamic messages signs). Publication of, and utilization of, diversion routes are an accepted element of many incident response scenarios. The TMC may also coordinate the emergency response effort and provide travel information and incident specifics to the response team.
1
The key to incident management is having knowledge of the current freeway conditions. As described previously, this knowledge typically occurs through the monitoring of devices, such as inductive pavement loops, that can measure speed, volume, and lane occupancy. Other technologies, such as acoustic, Lidar, automatic vehicle identification, and more, can also be used, with each having their corresponding advantages and disadvantages. A typical system will also include cameras that can be moved and zoomed to view different areas. These devices supplement electronic data collection and allow TMC personnel to gather visually as much information about an incident as possible.
At the TMC, the monitoring systems utilize software to retrieve the information from the roadway devices and alert operators to any significant changes about traffic conditions. In San Antonio, Texas, for example, the TransGuide TMC uses a 2-minute rolling average of speed values from inductive pavement loops as the measure by which freeway performance is analyzed. When the speed drops below a certain threshold, an alarm is sounded, indicating a possible incident. The threshold levels at which an alarm sounds can be set by roadways, times of day, or other factors, by individual operators to help make distinctions between incidents and recurring congestion (2).
When an alarm sounds and visual verification of an incident occurs, the operators of the TMC typically implement operational strategies designed to mitigate the results of the incident. They generally base these operational changes on the accumulated experience and knowledge of traffic engmeers.
INCIDENT MANAGEMENT STATE-OF-THE-PRACTICE
The state-of-the-practice in current incident management systems focuses on identification of an incident and rapid implementation of an established recovery plan. Unfortunately, most response scenarios end at the point of implementation. There are no mechanisms in place to monitor the area, refine the plan, and continue to improve the operational response to achieve better results.
Additionally, what qualifies as a better result is often not known. While past experiences from similar incidents are a vast resource for implementing a response, they are of little use in determining the current roadway performance from that response. The following questions often go unanswered because of a lack of data and the capability to perform such evaluations:
• Are the operator's actions having any effect on the system? • Is the traffic moving through the congested area faster? • Is the length of the queue upstream of the incident shorter? • Are speeds higher than they would be for some other type of operator response?
THE NEED FOR A REAL-TIME INCIDENT MANAGEMENT FEEDBACK SYSTEM
Real-time performance measurement is an analysis technique used to answer such questions. A real-time performance measure system provides feedback from the operational response to
2
incident conditions and provides a quantitative methodology for assessing the impacts of various operational strategies.
The significance of this feedback system is that it offers the ability to enhance the efficiency of freeway incident management. Even a small percent reduction in the length of an incident accrues millions of dollars of time-savings for the affected portion of the roadway.
Constructing a framework for the real-time application of performance measure analysis will allow operators to fine-tune their incident response methodologies and move closer to the optimal mitigation strategy. Also, such systems can be applied to a multi-faceted response scenario to examine the factors that influence additional responses and at what time should those additional measures be implemented.
The design and construction of such a system requires several items:
• an understanding of performance measurement, • an understanding of how performance measures are applied to transportation, • a review of the state-of-the-practice in transportation performance measurement, • an examination of additional performance measures that might enhance real-time
operations, and • methodology for constructing a real-time performance measurement system.
The remaining chapters of this report will discuss these needs in more detail.
3

-----------------------
CHAPTER2: PERFORMANCE MEASURES
WHAT IS A PERFORMANCE MEASURE?
The quantity ofliterature related to performance measures is considerable and extends far beyond the field of transportation. In fact, the use of performance measures occurs in nearly all fields of study. This underscores their applicability for use in analyses and decision making processes.
Merriam Webster's Dictionary defines performance as the 'manner of reacting to stimuli' (3). Measure is defined as 'an estimate of what is to be expected' (4). Assembling the terms, a system performance measure is therefore 'an estimate of what is to be expected from a system responding to a stimulus'. In the broader scope, within the field of transportation, the term and a corresponding definition does not yet appear in published guides such as the Transportation Expressions (5), an on-line reference guide from the Bureau of Transportation Statistics containing definitions and acronyms for several thousand terms used within the field.
However, the Office of Operations ofthe Federal Highway Administration (FHWA) has published the following definition of performance measurement.
"A process of assessing progress towards achieving predetermined goals, including information on the efficiency with which resources are transformed into goods and services (outputs), the quality of those outputs (how well they are delivered to the clients and the extent to which the clients are satisfied) and outcomes (the results of a program activity compared to its intended purpose), and the effectiveness of government operations in terms of the specific contributions to program objectives." (6)
This definition and much of the information that is contained in the document is an outgrowth of a cross-cutting study published in 1997 by then Vice President Al Gore entitled Serving the American Public: Best Practices in Performance Measurement (7). This study and final report was one result ofthe U.S. Government Performance and Results Act of 1993. The goal ofthis act was to establish a strategic planning and performance measurement system for the Federal Government ( 8).
WHY USE PERFORMANCE MEASUREMENT?
Although lengthy and scholarly passages such as the FHW A definition exist, a performance measure is perhaps best stated colloquially as a yardstick to measure progress toward goals. Perhaps the next question that follows is why use performance measures at all? What do they offer to the user or the agency?
For a variety of reasons, most systems or processes get evaluated after they are in-place. Performance measures offer a way to conduct these evaluations, based on facts and data, and determine the progress toward the goals. The use of performance measurement can help to
5
highlight or determine any problems, as well as identify corrective actions. Overall, performance measurement is a valuable tool in managing any improvement process. The use of performance measures also documents accomplishments and provides valuable feedback to the customer base.
WHAT IS A GOOD PERFORMANCE MEASURE?
Having established that performance measures can be a valuable tool, it is important to understand what makes a good performance measure. The literature (6,7,8,9,10) describes several factors that are characteristics of any good performance measure. First and foremost, a performance measure must measure or gauge the right item. It does so by focusing on the goals and objectives and determining if they are being met. A performance measure should focus on the end result-not the measurement itself.
The second trait of a good performance measure is that it is accepted. Generally, acceptance will occur if the measure is simple, understandable, unambiguous, and meaningful to the customer, regardless of whom the customer is. To gain customer acceptance, agencies may use different measures for different customers.
The third trait is that performance measures must be responsive and/or sensitive to the data they are measuring. The measure must clearly show any trends, minimums, or maximums. A performance measure that is insensitive to these events within the data will not be meaningful to the customer because it can not accurately depict the progress toward the system goals.
The fourth and final trait of a good measure is more directed to the agency compiling the information, rather than the customer. It is vital to support a good performance measure with economical data collection. Measures that require large and expensive data collection are not likely to be determined very often, due to time and/or budgetary constraints. This makes the measure untimely and insensitive to smaller changes, and ultimately will not convey meaningful results.
PERFORMANCE MEASUREMENT SYSTEMS
Although performance measures can certainly be used on an as-needed basis, their true value will be realized from a systematic plan, application, and implementation ( 6, 7, 1 0). A typical system generally employs a concise set of balanced measures. This balance helps to identify what data are needed, how much, how they should be collected, and for how long. The system plan should also identify the analysis techniques that will be used and should relate each performance measure back to system goals and objectives. Finally, the outcome of performance measures should also be addressed in any system plan, as the communication and reporting of results are critical to convey understanding beyond the immediate group.
In summary, the use of performance measures is widespread across many industries and fields. Both the public and private sectors have embraced performance measures to evaluate the effectiveness of systems, determine progress toward established goals, and communicate information to their customers. Because performance measures function as a gauge of the current status of a given system, their utilization over time provides valuable trend and tracking
6
data that can be documented and utilized for information, feedback, and improvements. Performance measurement implementations typically take place within the framework of a systematic process, beginning with what measures should be collected and how the output of these measures should be delivered to interested parties.
PERFORMANCE MEASURES IN TRANSPORTATION
As in other industries, the use of performance measures in transportation is not a new innovation. Indeed, many of the basic tenants oftransportation, such as capacity analysis, have always been based upon performance measures. The Highway Capacity Manual has generally referred to these as measures of effectiveness (MOE) (11). Density, speed, and volume have all been used as MOEs for different types of analyses. In addition to transportation operations, performance measures are frequently used in other areas of the transportation field, such as pavements, structures, right-of-way (ROW) and utility work, and communications.
The use of performance measures to analyze systems is of critical importance to transportation. Through consistent application and quantification of these measures, engineers gain the ability to measure and compare situations across different times and different areas. Indeed, wide-scale performance measure comparisons are both possible and utilized frequently.
WIDE-SCALE COMPARISONS
One of the best-known wide-scale comparisons of performance measurement data in transportation is the Urban Mobility Study, published yearly by the Texas Transportation Institute (12). This study examines congestion across 75 urban areas in the United States using data from 1982 through 2001. The study provides a basis for understanding the extent of mobility problems within the United States.
The main performance measure used in the study is the Travel Time Index (TTl), which measures the ratio of the time for a trip taken in peak conditions to the time for the same trip in off-peak conditions. As an example, a TTl of 1.4 means that a 30-minute trip in off-peak conditions will take 42 minutes in peak conditions. While the travel time index is the main performance measure utilized, the study includes many such measures and adds new measures over time to help explain the trends in urban mobility.
A similar methodology of looking at wide-scale impacts has been utilized for the assessment of damage to transportation systems, most notably earthquake damage (13). Although more specific in application than the Urban Mobility Study, this study developed new performance measures using data that would still be readily accessible after a natural disaster. The measures also were utilized to evaluate the spatial and temporal characteristics of the damage. These measures could also be tracked during the repair process and used to indicate the status of recovery and restoration efforts to interested parties. The study methodology also allowed the measures to be applied to two other major earthquakes experienced by California (Lorna Prieta in 1989 and Northridge in 1994) to determine comparative restoration periods and system performance. Lessons could then be drawn across the study areas to examine restoration techniques and time frames which differ by country.
7
DEFINING PERFORMANCE MEASURES FOR TRANSPORTATION SYSTEMS
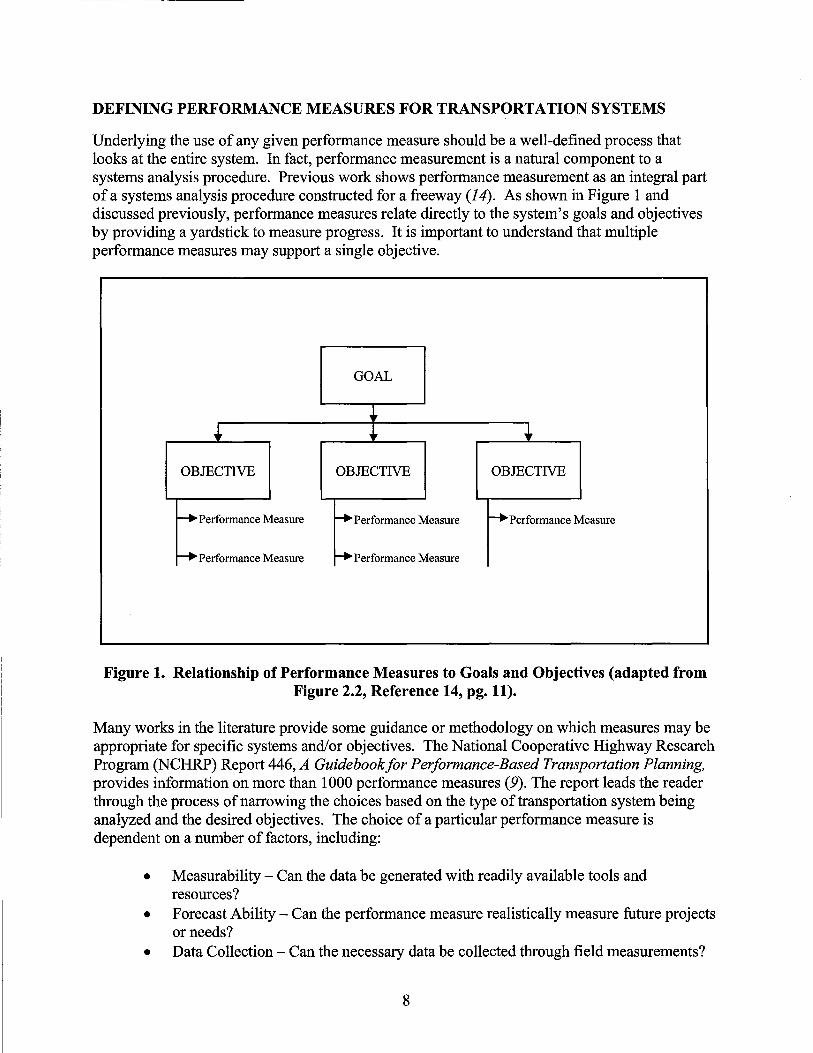
Underlying the use of any given performance measure should be a well-defined process that looks at the entire system. In fact, performance measurement is a natural component to a systems analysis procedure. Previous work shows performance measurement as an integral part of a systems analysis procedure constructed for a freeway (14). As shown in Figure 1 and discussed previously, performance measures relate directly to the system's goals and objectives by providing a yardstick to measure progress. It is important to understand that multiple performance measures may support a single objective.
GOAL
r • • OBJECTIVE OBJECTIVE OBJECTIVE
~Performance Measure ...,. Performance Measure r-.Performance M easure
~Performance Measure ~Performance Measure
Figure 1. Relationship of Performance Measures to Goals and Objectives (adapted from Figure 2.2, Reference 14, pg. 11 ).
Many works in the literature provide some guidance or methodology on which measures may be appropriate for specific systems and/or objectives. The National Cooperative Highway Research Program (NCHRP) Report 446, A Guidebook for Performance-Based Transportation Planning, provides information on more than 1000 performance measures (9). The report leads the reader through the process of narrowing the choices based on the type of transportation system being analyzed and the desired objectives. The choice of a particular performance measure is dependent on a number of factors, including:
• Measurability- Can the data be generated with readily available tools and resources?
• Forecast Ability- Can the performance measure realistically measure future projects or needs?
• Data Collection- Can the necessary data be collected through field measurements?
8
• Clarity- Will the measure be understandable? • Usefulness- Is the measure of direct relation to the issue or concern? • Temporal Characteristics - Can the measure be used to differentiate results in
different time periods? • Geographic Scale- Will the measure be applicable to all areas of the system? • Control- Can the characteristic being measured be controlled or influenced by
changes in the system? • Relevance - Is the measure applicable to the current evaluation process? • Diagnostics- Can the measure be used to pinpoint corrective actions in the system?
An important topic also discussed in NCHRP 446 includes the differentiation of performance measures that reflect output or outcome. Measures that reflect output are indicators of resources utilized or perhaps the scope of activities performed. Output measures identify information about the management of resources and are most useful in a performance-based system.
In contrast, measures that reflect outcome are often more indicative of how well an agency meets the goals and objectives. Outcome-based measures are more likely to be significant and understandable to the general public. However, both types of measures are useful, and a successful performance measurement system generally includes both ( 15). Consider, for example, an area of concern related to safety in icy conditions. An output measure might be the number of tons of salt applied to the roadway. While this measure has a majority of the 10 characteristics listed above and is easily understood and measured, it is most applicable to the agency in charge of the roadways. The corresponding outcome measure might be the number of ice-related accidents. This measure is more easily understood by the traveling public and can be shown over time and large areas to highlight improvements to the system (9). Both types of measures work in conjunction to provide a complete analysis and evaluation of the system.
In addition to looking at the factors discussed above, determination of the appropriate performance measures must also consider other aspects of the system. One important consideration is who will be using the measures. There are a number of different types of activities that take place in a transportation environment, from planning and design to operations and maintenance. Careful consideration of each of these specific needs will create a stronger success potential for a performance measurement system. Performance measurement systems should also consider users beyond the general public. These users can include elected officials, the media, and users in the judicial system, to name but a few (16).
Another consideration is the increasing assessment of the multi-modality of transportation systems. As such, measures that concentrate on the mobility of the entire system, rather than a specific mode, may prove to be very useful and necessary. Mode-specific measures may be used in conjunction with the multi-modal approach to identify any deficiencies and to determine individual mode effects (16).
DATA FOR PERFORMANCE MEASUREMENT
At the heart of any performance measure are the data used in the calculations or assessment. While performance measures should not be chosen based on data alone, the availability of data to
9
support the desired measures is an essential consideration. Choosing measures which require extensive collection or manipulation beyond the resources of the agency will minimize the benefits that could be gained from a performance measurement system.
There are numerous aspects to data collection which are necessary to support a performance measurement system. The most critical aspect of the data collection is ensuring the integrity of the data. The old adage of "garbage in, garbage out" applies to performance measures as well. Other factors to consider include the time frame of data collection, the geographic area, the scope, and aggregation techniques (17).
The need for accurate and detailed data to support performance measures points to the requirement for some type of formal data collection and storage or archival system. Ad hoc data collection, while perhaps feasible in limited or special situations, is not capable of providing the constant and consistent input necessary for an ongoing performance measurement process.
One example of a data archival system constructed for supporting a performance measurement system was the DataLink system at the Texas Transportation Institute (18,19,20). First developed in 1996 and expanded with additional capabilities through 1998, DataLink utilized inductive loop data from the San Antonio TransGuide transportation management center in San Antonio, Texas. At the time of the DataL ink system construction, TransGuide operated 26 miles of freeway on three major freeways surrounding the central business district. Data of speed, volume, and occupancy were collected from the loops every 20 seconds. Loop spacing was every half-mile in every mainlane. The amount of raw data collected exceeded 100 megabytes per day.
DataLink pioneered a number of considerations related to data management for performance measures. The primary consideration for the system architecture was the data storage requirements. Because of the enormous amounts of data being collected, appropriate strategies were necessary to keep storage costs within reason. DataLink employed a 5-minute aggregation routine to reduce the storage requirements by approximately 93 percent.
In a similar consideration to the size of the overall storage, the desired storage and retrieval capabilities necessitated the use of a relational database. Common desktop databases could not handle the requirements of the system, and a larger enterprise level database was utilized. Researchers developed specialized screening rules to ensure data integrity within the database. Performance measures identified the number of data elements that were used in the calculation to ensure proper interpretation of the results.
The ability to easily access and work with the data contained within the database was a crucial factor in making the system feasible. A number of references have stated that the ability to easily obtain and access data is critical to the overall performance management system. DataL ink utilized an open-standards web interface to provide access to and manipulation of the data within the system. The use of open standards eliminated the need for specialized programming or database skills on the part of system user and expanded the ability to use the system to anyone in the target agency.
10
In its most basic capabilities, DataLink output provided speed, volume, and occupancy information at user specified time intervals and locations. The aggregation techniques could be used to report on time periods from five minutes to one day. DataLink output also supported the calculation of performance measures based on both lane and corridor aggregation techniques.
The DataLink system was research-based and explored a number of never before examined questions pertaining to large-scale data archiving activities within transportation. A similar, but operational, system was constructed in Montgomery County, Maryland (21). The Data Acquisition and Hardware (DASH) system used many of the same components as DataL ink. The system employed screening techniques for data integrity, automatically updated itself as new detectors were brought on-line, was updated with new data once a day, and allowed multiple end-user queries. DASH provided significant benefits to Montgomery County, including the ability to collect and store more accurate and precise data, improve information sharing throughout the agency, and reduce the need for supplementary traffic data collection.
A number of smaller-scale analysis systems were constructed using archived data to analyze and obtain performance measures for more focused objectives. One such study performed travel time analyses on the Katy Freeway in Houston, Texas (22). The objective was to quantify travel time savings on the toll lanes as compared to the mainlanes. While this study was not a largescale exercise that required capabilities beyond a standard personal computer and desktop software, the evaluation procedure followed the same basic framework as the other implementations to ensure the results were consistent with the requirements.
SUMMARY
The literature examined in this review is diverse and contains several key points. First, it should be recognized that the use of performance measures is not specific to transportation, but rather is employed in all facets of modem life. Whether related to output or outcome, performance measures can communicate information and create understanding among diverse groups. Most importantly, performance measures provide a way of charting the progress toward goals and objectives for whatever system is being evaluated.
The second key point is that performance measures are best used inside a comprehensive framework that provides for all aspects of the measurement process. The typical components include:
• identification of goals, • determination of objectives, • selection of appropriate performance measures, • data collection, • data quality checking, and • design of performance measure presentations specific to audience.
11
When utilized within this framework, performance measures are applicable across temporal and spatial areas and can be used in very large-scale analyses and multi-year comparisons and tracking of system characteristics.
The third key point is that the design and collection of the data to support a performance measurement system are critical components and complex undertakings. Rigid adherence to standards, an understanding of the information technology associated with these systems, and how to turn the data into valuable information are central to any data archival and retrieval system.
Fourth, a number of prototypes and small-scale systems have demonstrated the feasibility of building data collection systems to generate performance measures. Note that prior efforts have worked with archived or aged data. The bottom line, however, is that performance measurement programs have been successful and have proven the concepts contained in the literature.
Finally, recognize that the use of performance measurement systems is increasing. Indeed, recent literature has called for the development of a performance measurement system and the establishment of specific measures relating to the entire National Highway System that would be the same across all roadways and states (23). In addition, the Federal Highway Administration has recently commissioned a series of 11 white papers on the use of performance measures for transportation operations (24). Clearly, the use of a performance measurement system remains a viable and current topic in transportation.
The future of performance measurement is to move into the arena of real time. While previous efforts have all worked with archived or aged data, real-time use is not only possible, but can offer significant benefits, when employed appropriately. The primary undertaking for this work is therefore to construct a framework for using performance measures for real-time operations. However, prior to building that framework, one must understand the state-of-the-practice in transportation performance measures.
12
CHAPTER3: STATE-OF-THE-PRACTICE IN
TRANSPORTATION PERFORMANCE MEASURES
The performance measures in use across all aspects of transportation are extensive and varied. Some measure the output of the agency, such as number oflane miles painted with a white stripe. Other measures are outcome related, such as the reduction in accidents due to worn pavement markings. In addition, performance measures can be found for multiple categories, such as:
• Accessibility -the ability of people and goods to reach services, destinations, and modes;
• Mobility -the relative ease or difficulty involved in making a trip; • Economic -the cost benefits and impacts of the transportation system; • Quality of Life - measures that account for such items as aesthetics and sense of
satisfaction; • Environmental- the impact on or savings of natural resources; • Safety- measures involving roadway conditions, accidents, and times related to
incidents; • Efficiency - the use of resources to produce a given output; and • System Preservation- physical condition of infrastructure and equipment (9).
Most performance measures supporting operations fall into the category of safety, i.e., they measure a roadway condition or a time related to roadway conditions.
Typically, operational performance measures are gathered, displayed, and then discarded. Many management systems utilize some kind of aggregation or rolling average to provide feedback over a longer time period than the data collected at the side of the roadway. A typical reporting period for many roadway sensors is 20-30 seconds. However, many software applications display information in terms of 1-, 2-, or 5-minute increments. This aggregation reduces the variability in the data reporting and helps to eliminate false incident detections.
OPERATIONAL PERFORMANCE MEASURES USED IN TEXAS
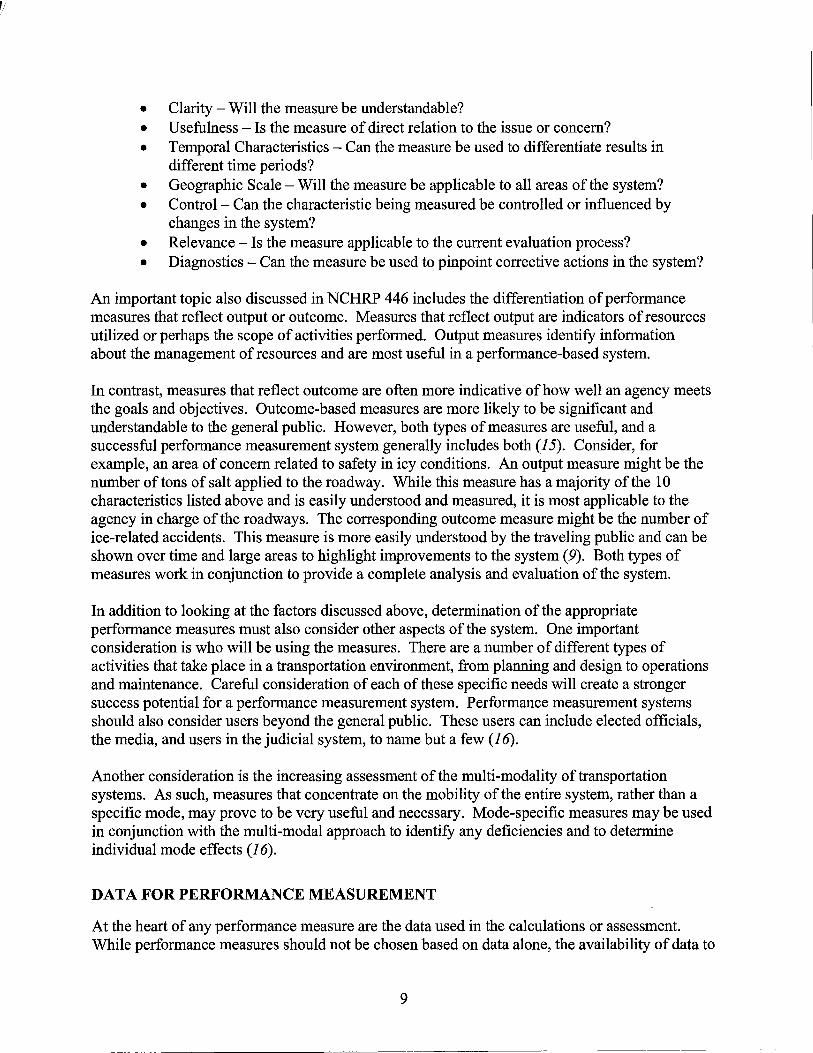
Like most freeway management software applications, the Texas Department of Transportation uses performance measures in its TMC software. Although the software can vary by TMC, a typical installation examines data from the roadway and reports speed, volume, and occupancy. Figure 2 shows a screen capture from the TxDOT Advanced Transportation Management Software (ATMS) utilized by TxDOT in many of its TMCs.
As seen in the figure, operators can look at the volume at varying levels of aggregation. Inductive pavement loops typically report data every 20 to 30 seconds. Aggregation is used to combine data into larger time intervals for display to, and interpretation by, operators. Figure 2 also shows speed and occupancy values across different detector stations. The TxDOT ATMS
13
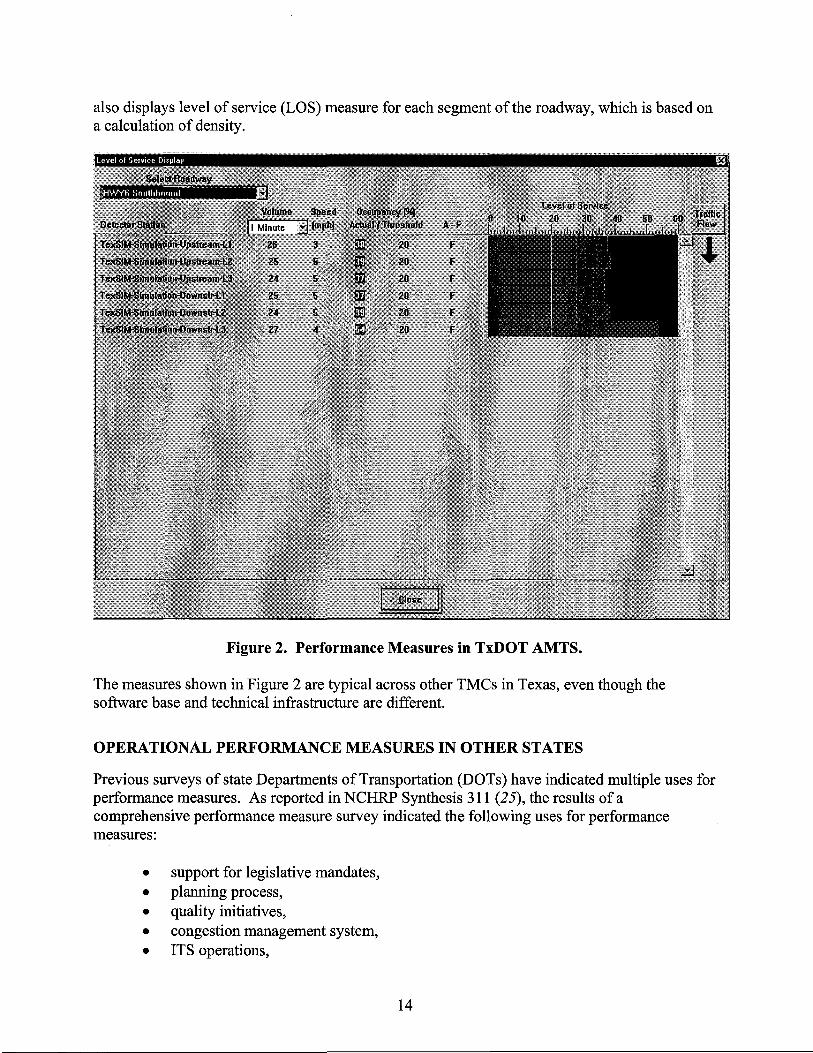
also displays level of service (LOS) measure for each segment ofthe roadway, which is based on a calculation of density.
Figure 2. Performance Measures in TxDOT AMTS.
The measures shown in Figure 2 are typical across other TMCs in Texas, even though the software base and technical infrastructure are different.
OPERATIONAL PERFORMANCE MEASURES IN OTHER STATES
Previous surveys of state Departments of Transportation (DOTs) have indicated multiple uses for performance measures. As reported in NCHRP Synthesis 311 (25), the results of a comprehensive performance measure survey indicated the following uses for performance measures:
• support for legislative mandates, • planning process, • quality initiatives, • congestion management system, • ITS operations,
14
• safety management system, and • permitting process for commercial driveways.
The report also noted that larger population areas may be more likely to have a performance measurement program in place to address mobility issues that are not present in smaller areas. Additionally, the report indicates the opportunity for improvement in the use of performance measures to support operations (25).
Armed with the recent results of the performance measures survey from the NCHRP report, researchers chose not to duplicate the survey as they felt little additional information would be gathered. Additionally, such a survey would have involved significant time and cost, and surveys traditionally have low response rates. Instead, researchers chose an innovative way to obtain additional information on the performance measures in use within DOTs and TMCs.
As a result of the proliferation of the Internet, a wide variety of web sites exist that provide information related to traffic and roadway conditions. Because the data for these web sites typically come from the TMC that operates the roadway, investigation of these sites provided a surrogate survey for the operational performance measures in use.
In all, researchers examined nearly 100 web sites to determine the type of information that was being provided. In some cases, the web sites are published by the state or TMC, in others, the information and web site are provided by a third-party information provider, generally under an advertising or cost arrangement with the DOT. In reality, the data or performance measure used by the web site is the same performance measure used within the TMC. Hence, the study of the web sites serves as a surrogate for determining the operational performance measures in use at other locations.
Table I lists the results of the web site survey. There are two items that are important to understand when examining this table. First, there are multiple locations where more than one web site publishes traffic information. A typical example might be a city where the TMC publishes information as well as making it available to third-party information providers. The third-party sites may provide value-added services to customers. In this survey, there was no way to determine the "official" traffic site for an area, so all web sites that were found were included in the survey results. The data in Table 1 represent 97 traffic web sites representing 51 locations within the United States.
The second item to note regarding Table 1 is that different descriptors of the web site information may well mean the same thing. As an example, a web site detailing alerts generally provides the same information as a web site detailing incidents on the roadway. Likewise, the use of the word "conditions" typically means the same as alerts and conditions. Table 1 therefore shows a number of categories where there is more than one descriptor of the information provided at web sites of this type.
15
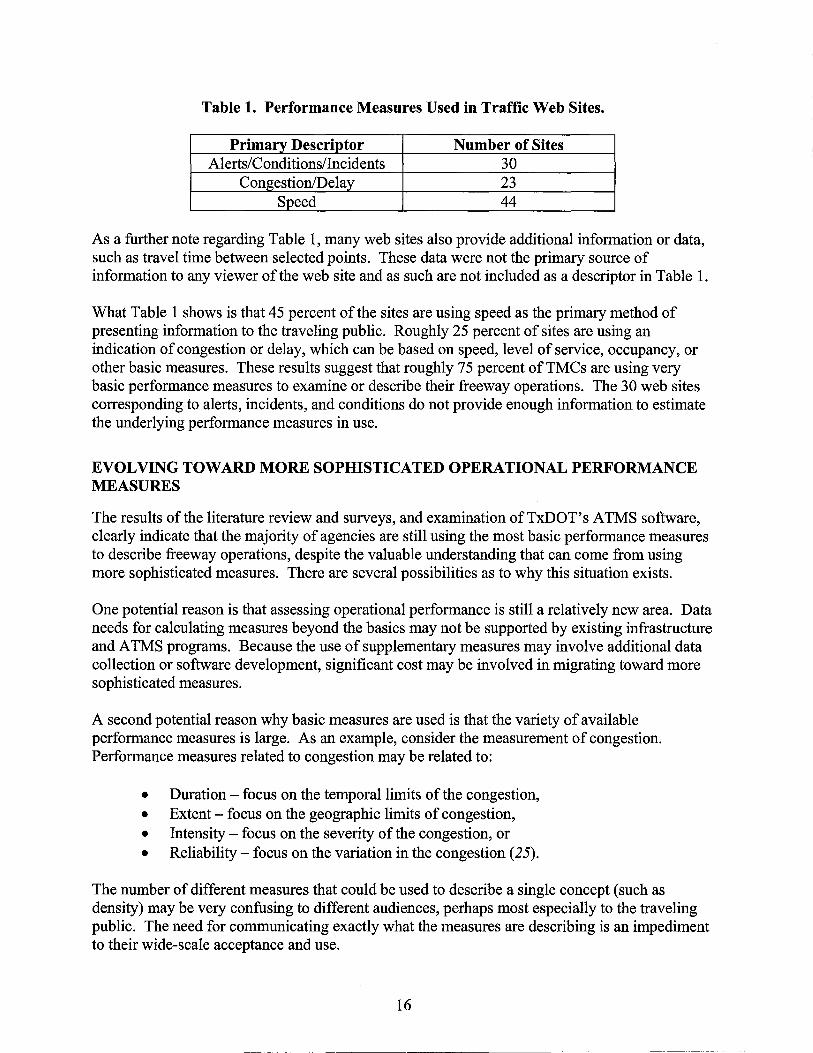
Table 1. Performance Measures Used in Traffic Web Sites.
Primary Descriptor Number of Sites Alerts/Conditions/Incidents 30
Congestion/Delay 23 Speed 44
As a further note regarding Table 1, many web sites also provide additional information or data, such as travel time between selected points. These data were not the primary source of information to any viewer of the web site and as such are not included as a descriptor in Table 1.
What Table 1 shows is that 45 percent of the sites are using speed as the primary method of presenting information to the traveling public. Roughly 25 percent of sites are using an indication of congestion or delay, which can be based on speed, level of service, occupancy, or other basic measures. These results suggest that roughly 75 percent ofTMCs are using very basic performance measures to examine or describe their freeway operations. The 30 web sites corresponding to alerts, incidents, and conditions do not provide enough information to estimate the underlying performance measures in use.
EVOLVING TOWARD MORE SOPHISTICATED OPERATIONAL PERFORMANCE MEASURES
The results of the literature review and surveys, and examination ofTxDOT's ATMS software, clearly indicate that the majority of agencies are still using the most basic performance measures to describe freeway operations, despite the valuable understanding that can come from using more sophisticated measures. There are several possibilities as to why this situation exists.
One potential reason is that assessing operational performance is still a relatively new area. Data needs for calculating measures beyond the basics may not be supported by existing infrastructure and ATMS programs. Because the use of supplementary measures may involve additional data collection or software development, significant cost may be involved in migrating toward more sophisticated measures.
A second potential reason why basic measures are used is that the variety of available performance measures is large. As an example, consider the measurement of congestion. Performance measures related to congestion may be related to:
• Duration- focus on the temporal limits of the congestion, • Extent - focus on the geographic limits of congestion, • Intensity - focus on the severity of the congestion, or • Reliability- focus on the variation in the congestion (25).
The number of different measures that could be used to describe a single concept (such as density) may be very confusing to different audiences, perhaps most especially to the traveling public. The need for communicating exactly what the measures are describing is an impediment to their wide-scale acceptance and use.
16
A third potential reason why more sophisticated measures are not used may be the data necessary to support their use. Many of these more sophisticated measures require a baseline-a point of comparison for understanding normal conditions. This comparison requires data from the roadway to be collected, stored, and made available for comparison use.
Consider the use of speed as a performance measure. It is generally well understood and because it provides an indication of the system at a specific location and point in time, it requires no reference point. In comparison, consider the use of queue length after an incident. In order to be effective, this performance measure has to be examined over time. Is the queue length decreasing or increasing? How far back from the incident does the queue start? Analyzing these performance measures may provide a more detailed understanding of an incident and the operational response to clear it from the roadway, but it requires a baseline in time and space that translates to extensive data needs.
The archival of data to support this need is not an insignificant task. The roadway infrastructure generates a tremendous volume of data. As an example, consider that the 26-mile phase one deployment in San Antonio, Texas, generates nearly 1 gigabyte of raw data per day (19). While that amount is not as difficult to deal with as it was even 5 years ago, expanding the coverage area to three or four times the phase one deployment and keeping the data for a year would result in the need for more than a terabyte of space. That amount of data storage can be costly and is certainly not a trivial matter to incorporate into an archive data library. Also, the time required to process and perform calculations using that much data must be considered in any system design.
SUMMARY
The literature clearly demonstrates that the study of performance measures is pervasive across multiple disciplines. Within the field of transportation, significant benefits can be realized from having a systematic means of assessing system performance.
The state-of-the-practice review highlights that the current usage of performance measures for operational assessment is done using very basic measures that do not require large degrees of data, calculations, and interpretation. However, many sources have shown the advantages to using more sophisticated performance measures analysis, more descriptive measures, and in fact, using these in support of real-time operational analysis (9,12,17,19,20,21,25).
While it is clear that real-time analysis is a significant departure from current practice, the potential benefits are enormous. Congestion in the 75 largest urban areas costs nearly 70 billion dollars per year in lost time ( 12). If the use of more sophisticated performance measurement processes could increase the operational efficiency even one-half of 1 percent, the congestion costs would be decreased by nearly 350 million dollars.
Compiled from a number of sources, Table 2 lists a wide variety of additional performance measures that could be used to support operations (9,25). Similar to those measures in use today, each performance measure listed in Table 2 has distinct advantages, disadvantages, application,
17
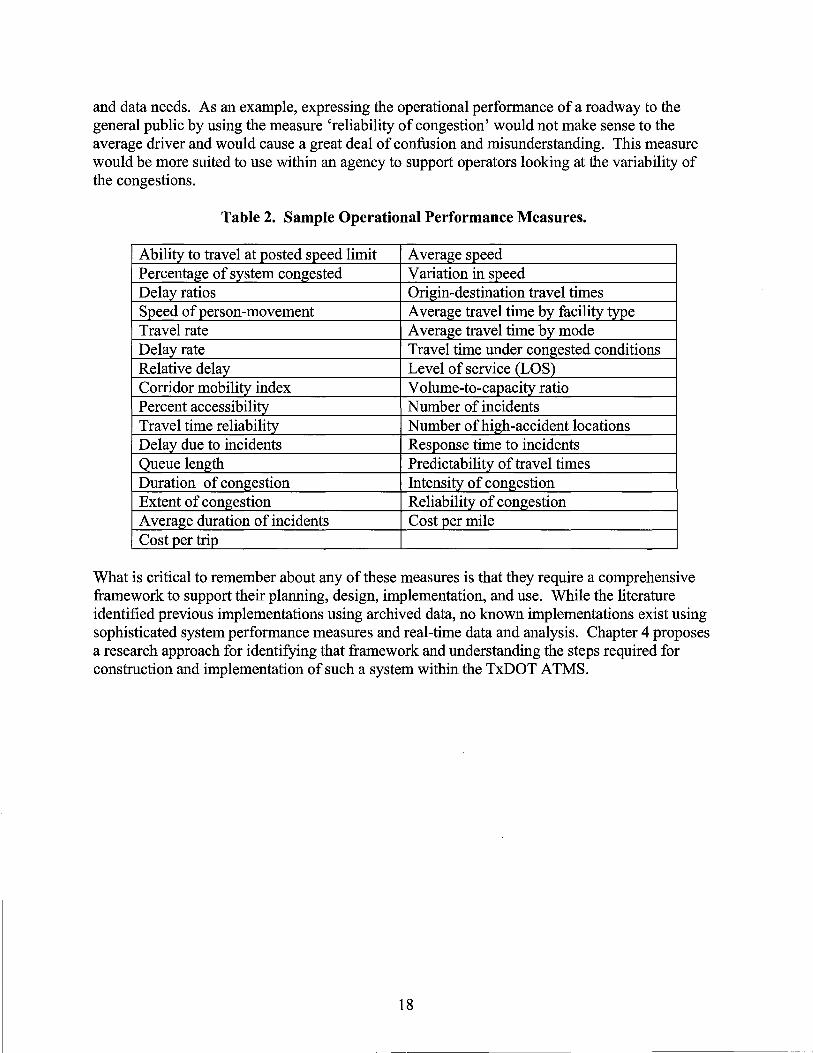
and data needs. As an example, expressing the operational performance of a roadway to the general public by using the measure 'reliability of congestion' would not make sense to the average driver and would cause a great deal of confusion and misunderstanding. This measure would be more suited to use within an agency to support operators looking at the variability of the congestions.
Table 2. Sample Operational Performance Measures.
Ability to travel at posted speed limit Average speed Percentage of system congested Variation in speed Delay ratios Origin-destination travel times Speed of person-movement Average travel time by facility type Travel rate Average travel time by mode Delay rate Travel time under congested conditions Relative delay Level of service (LOS) Corridor mobility index Volume-to-capacity ratio Percent accessibility Number of incidents Travel time reliability Number of high-accident locations Delay due to incidents Response time to incidents Queue length Predictability of travel times Duration of congestion Intensity of congestion Extent of congestion Reliability of congestion Average duration of incidents Cost per mile Cost per trip
What is critical to remember about any of these measures is that they require a comprehensive framework to support their planning, design, implementation, and use. While the literature identified previous implementations using archived data, no known implementations exist using sophisticated system performance measures and real-time data and analysis. Chapter 4 proposes a research approach for identifying that framework and understanding the steps required for construction and implementation of such a system within the TxDOT ATMS.
18
CHAPTER4: APPLICATION FRAMEWORK
CONSTRUCTING A REAL-TIME PERFORMANCE MEASURES APPLICATION
The findings to date consist of literature searches, surveys, and prior work by the authors. Although not currently done, this body of evidence clearly shows that the analysis of system performance measures can be used in real time to support operations. Specifically, the use of real-time performance measures can be used to determine the advantages or disadvantages of a particular response to a freeway incident. The final test is to build a prototype system.
Numerous obstacles exist to constructing this system. The primary obstacle is the fact that incidents are a single-event occurrence. Unless incidents occur at the same place at the same time with the same characteristics, TMCs have little or no capability to effectively compare the results of one action with those of another. In addition, it would take enormous data collection efforts to gather repeatable incident data at multiple locations along a freeway corridor. In fact, it is quite likely that such a task is not even possible.
In addition to the repeatability concern, most TMCs do not store the data needed to establish the baseline comparisons. A baseline is critically important to the procedure so that changes to the roadway can be compared to a 'normal' condition. Currently, any assessment of the advantages or disadvantages of a particular strategy is done after the fact, with no quantitative data available to objectively examine the results. It would be very expensive to modify an existing TMC's infrastructure to store the required data.
Finally, the body of knowledge pertaining to using real-time system performance measures for operational analysis is limited. Numerous questions still exist and must be investigated. Some examples are:
• What measures should be constructed? • From what point on the facility should data be gathered? • How can the sensitivity of various operator actions be examined using operational
data? • What is the impact of different data collection time frames on the real-time
measures?
As a result of these concerns, the logical approach is to build a prototype system using simulation.
A SIMULATION FRAMEWORK
The use of simulation provides numerous advantages. Most importantly, researchers can simulate incident conditions at any location along the corridor. The time, duration, and severity of the incident can be controlled. Traffic volumes entering the incident area can also be varied to represent multiple real-world situations.
19
Additionally, the data requirements for real-time analysis can be implemented in a simulation environment without significant cost. This allows for the investigation of questions such as what levels of data collection are required and what is the effect of different levels of aggregation on the performance measures. Finally, the use of a simulation-based prototype allows for the investigation of multiple performance measures. In short, simulation allows for a multi-faceted investigation into the use of real-time performance measures for improving operational response.
The framework for the real-time performance measures prototype has been developed around the advanced transportation management system used by the Texas Department of Transportation. Developed and maintained by the Traffic Operations Division (TRF) ofTxDOT, the ATMS software is used across the state in small to medium sized cities. The software has a wellestablished core set of functions and is undergoing continuous development. Based on the Windows® operating system platform, the software is TxDOT's key component in building freeway management systems throughout Texas.
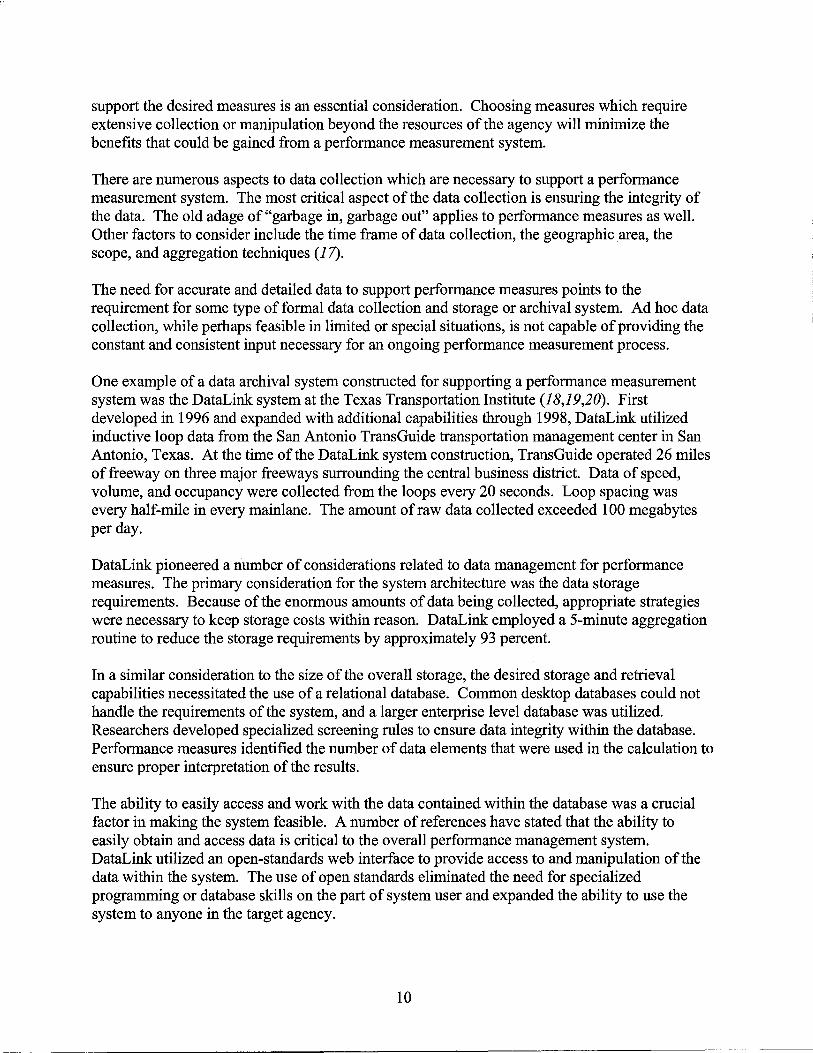
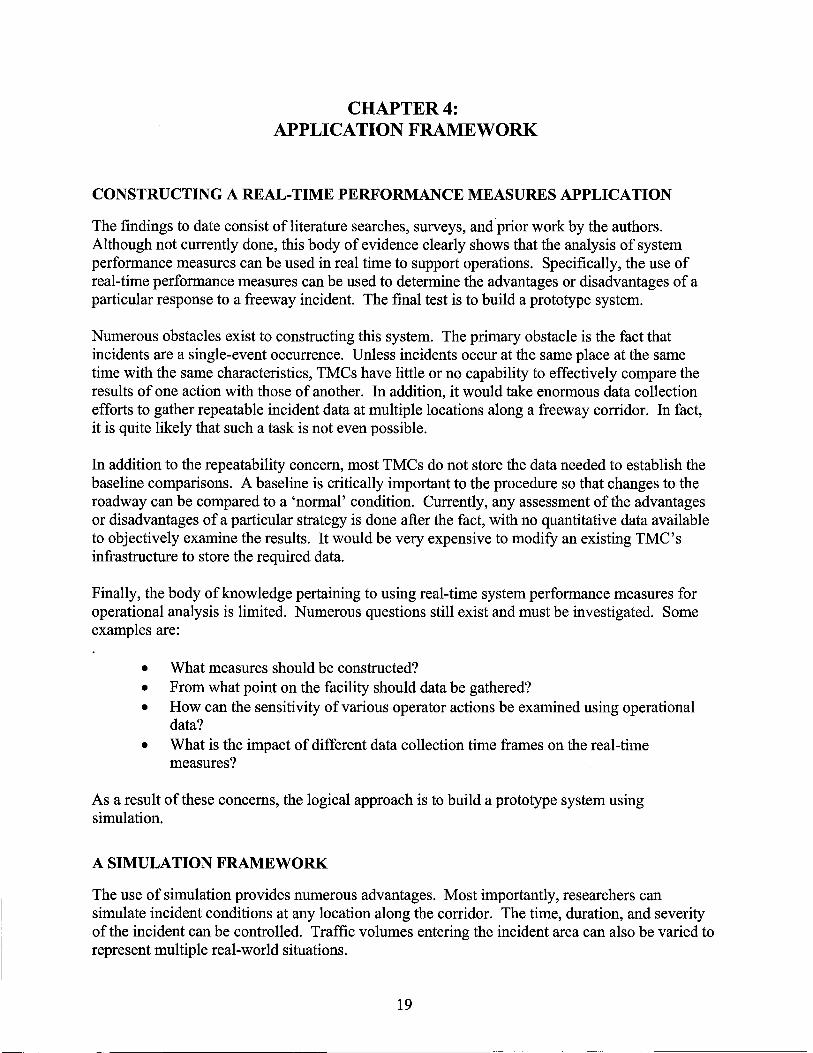
Figure 3 shows the high-level architecture of the simulation framework for the prototype system. Although most simulation systems use one-way information flows, the key to this prototype is the development of a two-way information flow. In this manner, information flows from the simulation into the ATMS system, and operator changes from the ATMS are reflected back into the simulation.
Situu~ation Model
TxDOT ATMS
Figure 3. Two-way Information Flow of Protoype System.
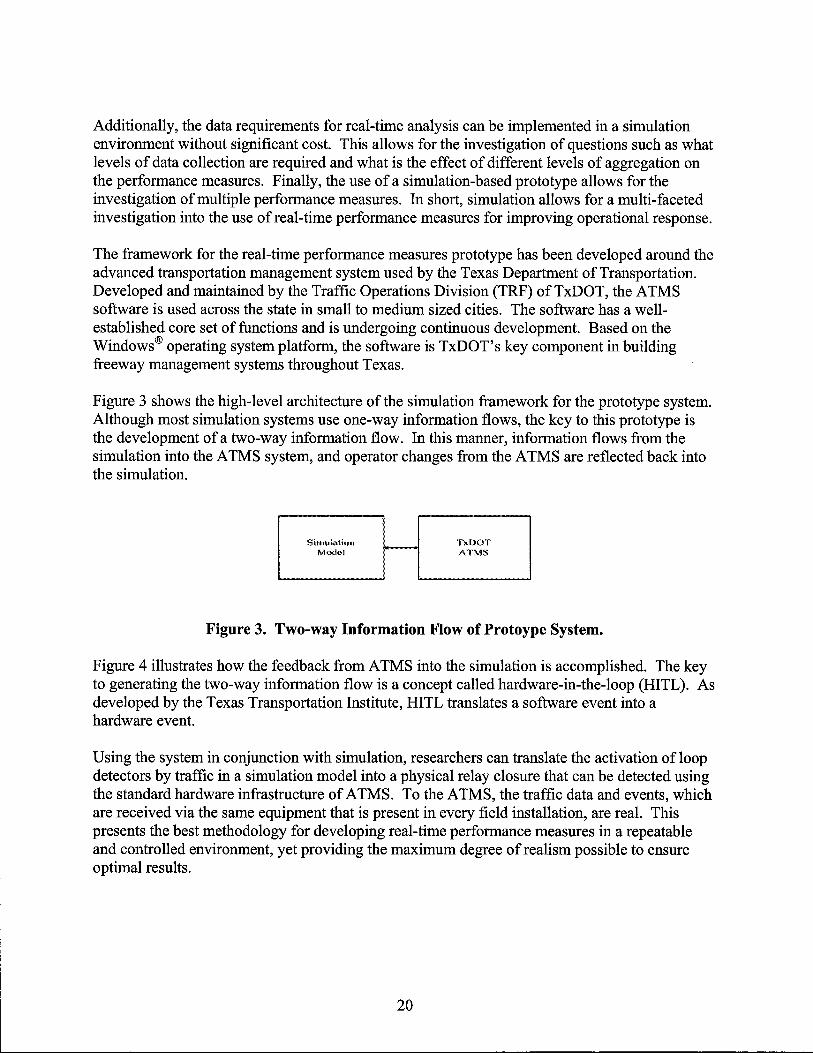
Figure 4 illustrates how the feedback from ATMS into the simulation is accomplished. The key to generating the two-way information flow is a concept called hardware-in-the-loop (HITL). As developed by the Texas Transportation Institute, HITL translates a software event into a hardware event.
Using the system in conjunction with simulation, researchers can translate the activation ofloop detectors by traffic in a simulation model into a physical relay closure that can be detected using the standard hardware infrastructure of ATMS. To the ATMS, the traffic data and events, which are received via the same equipment that is present in every field installation, are real. This presents the best methodology for developing real-time performance measures in a repeatable and controlled environment, yet providing the maximum degree of realism possible to ensure optimal results.
20
SIMULATION 1---<: MODEL
TxrlOT A'rMS
Figure 4. Hardware-in-the-Loop Architecture of Protoype System.
There are three components to HITL. The first is an interface between the simulation model and the field equipment. The field equipment consists of a local control unit (LCU) and a system control unit (SCU). The HITL interface takes software detections and creates a physical impulse that can be detected using the LCU, which is a standard piece of equipment employed by TxDOT to communicate to field devices.
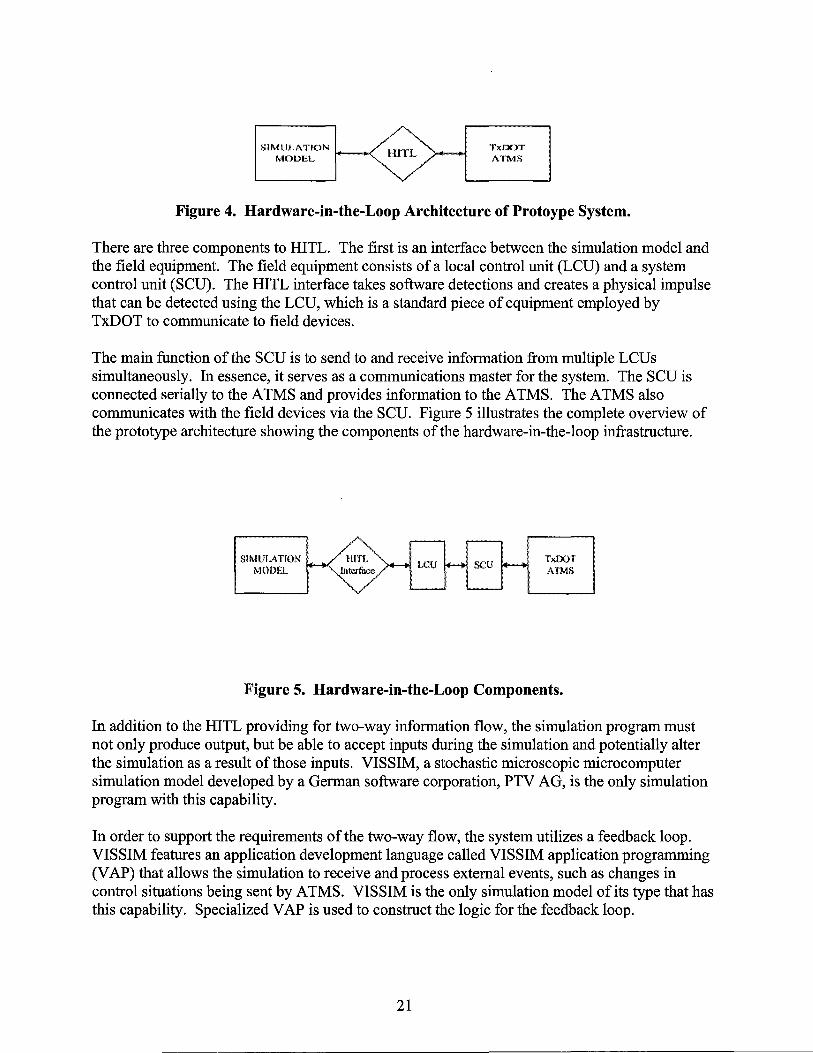
The main function ofthe SCU is to send to and receive information from multiple LCUs simultaneously. In essence, it serves as a communications master for the system. The SCU is connected serially to the ATMS and provides information to the ATMS. The ATMS also communicates with the field devices via the SCU. Figure 5 illustrates the complete overview of the prototype architecture showing the components of the hardware-in-the-loop infrastructure.
SIMULATION MOO&L
TxDOT AIMS
Figure 5. Hardware-in-the-Loop Components.
In addition to the HITL providing for two-way information flow, the simulation program must not only produce output, but be able to accept inputs during the simulation and potentially alter the simulation as a result of those inputs. VISSIM, a stochastic microscopic microcomputer simulation model developed by a German software corporation, PTV AG, is the only simulation program with this capability.
In order to support the requirements of the two-way flow, the system utilizes a feedback loop. VISSIM features an application development language called VISSIM application programming (V AP) that allows the simulation to receive and process external events, such as changes in control situations being sent by ATMS. VISSIM is the only simulation model of its type that has this capability. Specialized VAP is used to construct the logic for the feedback loop.
21
EXPERIMENTS WITH THE PROTOTYPE
One of the keys to a successful research endeavor is understanding the boundaries of the prototype application. Because the current version of ATMS interfaces to inductive pavement loops, dynamic message signs, and changeable lane assignment signals (CLAS) (also known as lane control signals, LCS), operator responses are limited in scope. However, the use ofLCS devices does afford a degree of flexibility in examining incident response.
A typical scenario is an incident that occurs in the far-left lane of the freeway. At some point in time after allowing for traffic loading, an incident will be programmed into the simulation model. Upstream of the incident, LCSs will be used to shut down the incident lane using a standard transition sequence of a yellow directional arrow prior to the incident, followed by a red X at the incident location. Representative performance measures will be constructed, examined, archived, and compared to examine any changes in the roadway performance or operations. These measures may include the basic parameters of speed, volume, and occupancy, but could also include queue length, travel times, and other measures.
Figures 6 through 10 illustrate the experimental design for the prototype. The decision points in this scenario are multi-fold. Depending on the volume level or traffic compositions within the simulation, the freeway may not deteriorate to the point of needing any additional operator actions or control beyond the use of the LCSs. However, under certain conditions, the shutdown of a lane will have impacts that can not be negated solely by the use of LCSs. In this situation, the performance measure framework can be used to trigger additional operator actions.
When the performance measures indicate that the freeway conditions have deteriorated past a certain point, an operator alert can be programmed to suggest that the operator take additional measures to control the incident.
22
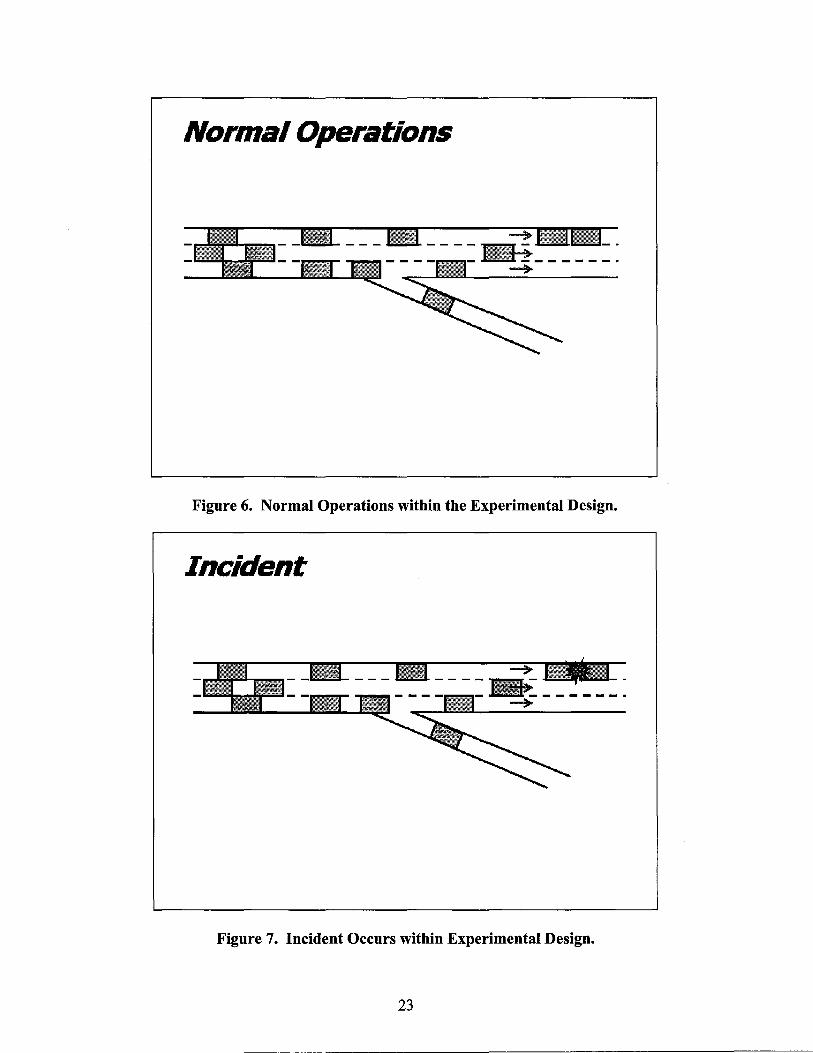
Normal Operations
Figure 6. Normal Operations within the Experimental Design.
Incident
Figure 7. Incident Occurs within Experimental Design.
23
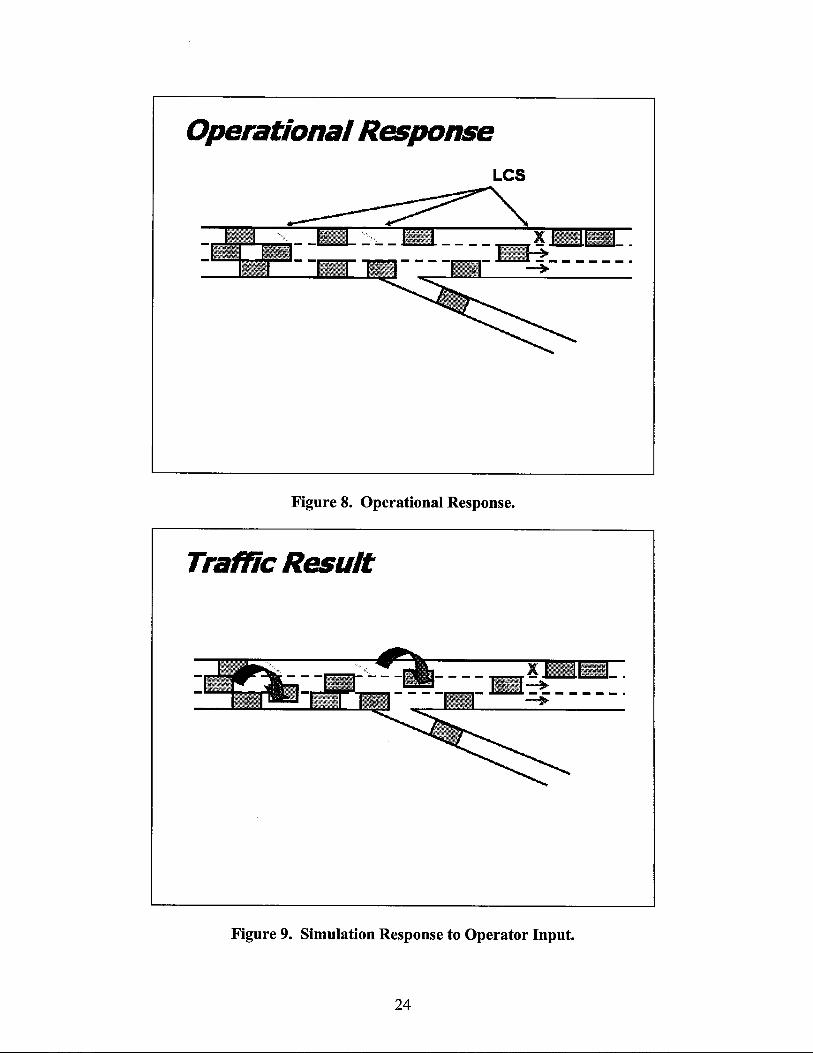
Operational Response LCS
Figure 8. Operational Response.
Traffic Result
Figure 9. Simulation Response to Operator Input.
24
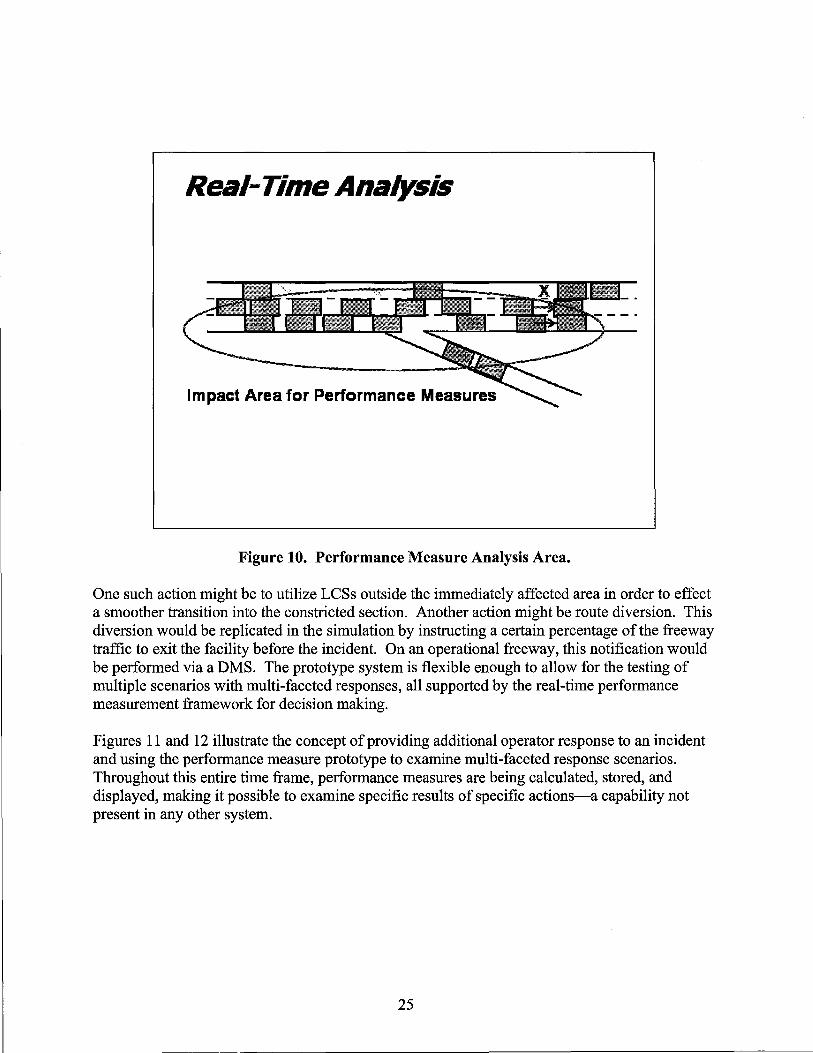
Real-Time Analysis
Impact Area for Performance Measures
Figure 10. Performance Measure Analysis Area.
One such action might be to utilize LCSs outside the immediately affected area in order to effect a smoother transition into the constricted section. Another action might be route diversion. This diversion would be replicated in the simulation by instructing a certain percentage of the freeway traffic to exit the facility before the incident. On an operational freeway, this notification would be performed via a DMS. The prototype system is flexible enough to allow for the testing of multiple scenarios with multi-faceted responses, all supported by the real-time performance measurement framework for decision making.
Figures 11 and 12 illustrate the concept of providing additional operator response to an incident and using the performance measure prototype to examine multi-faceted response scenarios. Throughout this entire time frame, performance measures are being calculated, stored, and displayed, making it possible to examine specific results of specific actions-a capability not present in any other system.
25
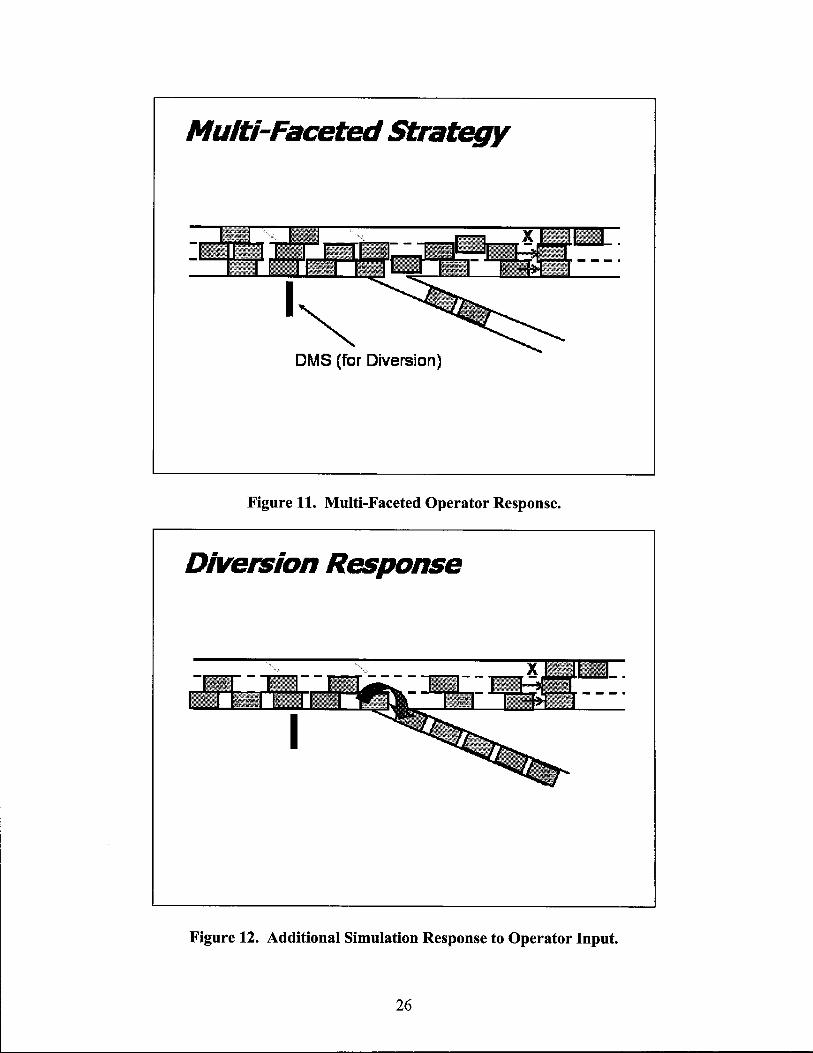
Multi-Faceted Strategy
DMS (for Diversion)
Figure 11. Multi-Faceted Operator Response.
Diversion Response
Figure 12. Additional Simulation Response to Operator Input.
26
CHAPTERS: CONCLUSIONS
The use of performance measures is increasing across virtually all disciplines. Transportation is no different, with the literature revealing hundreds of uses for performance measures to analyze all aspects of transportation, including safety, efficiency, mobility, and many more.
However, performance measures have not been widely used to support real-time applications. This lack of implementation is most likely due to the obstacles in establishing a comprehensive performance measurement system that supports real-time applications. With real-time usage, baselines must be obtained and stored for comparison against non-normal conditions. This leads to significant data archiving needs. Repeatability is an issue, as incidents are random events and data are often quite limited in a real-world situation.
However, marrying simulation with an ATMS application will allow the investigation of realtime performance measures to examine freeway operations. This report has briefly described the history of performance measures in general, examined the state-of-the-practice in performance measures usage in transportation, and proposed a framework, methodology, and experimental design for a prototype system. This prototype will allow an operator to examine the benefits of a particular response to an incident. This system will help approach the optimal mitigation strategy for freeway incidents.
27

REFERENCES
1. Freeway Management Handbook. Prepared for FHWA, U.S. Department of Transportation, by the Texas Transportation Institute, Texas A&M University System, College Station, TX, August 1997.
2. TransGuide. Technology In Motion. Published by the Texas Department of Transportation, 3500 NW Loop 40, San Antonio, TX, 2000.
3. Merriam-Webster OnLine. Merriam-Webster's Collegiate Dictionary. Definition 5 for "Performance." http://www.m-w.com Accessed August 10,2003.
4. Merriam-Webster OnLine. Merriam-Webster's Collegiate Dictionary. Definition 1c for "Measure." http://www.m-w.com Accessed August 10, 2003.
5. Bureau of Transportation Statistics. Transportation Expressions. http://www.bts.gov/btsprod/expr/expsearch.html Accessed August 10, 2003.
6. Federal Highway Administration. Office of Operations. "Transportation Performance Measures" http://www.ops.fhwa.dot.gov/Travel/Deployment Task Force/perf measures.htm Accessed August 12, 2003.
7. "Serving The American Public: Best Practices in Performance Measurement," National Performance Review by Vice President Al Gore, June 1997. http:/ I govinfo.library. unt.edu/npr/library/papers/benchmrk/nprbook.htm Accessed August 14, 2003.
8. Government Performance Results Act of 1993. One Hundred Third Congress of the Unites States. http://www. whitehouse.gov/omb/mgmt-gpra!gplaw2m.html Accessed August 14, 2003. .
9. A Guidebook for Performance-Based Transportation Planning. NCHRP 446. Transportation Research Board, National Research Council, Washington, D.C., 2000.
10. Pickrell, Steven, and Lance Neumann. Use of Performance Measures in Transportation Decision Making. Conference Proceedings 26. "Performance Measures to Improve Transportation Systems and Agency Operations." Transportation Research Board, National Research Council, Irvine, CA, November 2001.
11. Highway Capacity Manual. Special Report 209 (3rd edition). Transportation Research Board, National Research Council, Washington, D.C., 1994.
12. Lomax, Tim, and Dave Schrank. 2003 Urban Mobility Study. Texas Transportation Institute. http://mobility.tamu.edu/ums/ Accessed September 30, 2003.
29
13. Chang, Stephanie E., and Nobuota Nojima. Measuring Post-Disaster Transportation System Performance: The 1995 Kobe Earthquake in Comparative Perspective. Transportation Research Part A. 2001, pp. 475-499.
14. Brydia, Robert E. A Systems Approach to Freeway Design. Master's Thesis in Civil Engineering. The Pennsylvania State University, 1991.
15. Abbott, Eugene E., Joseph Cantalupo, and Linda B. Dixon. Performance Measures. Linking Outputs and Outcomes to Achieve Goals. In Transportation Research Record 1617. Transportation Research Board, National Research Council, Washington, D.C., 1998. pp. 90-95.
16. Pratt, Richard H., and Timothy J. Lomax. Performance Measures for Multimodal Transportation Systems. In Transportation Research Record 1518. Transportation Research Board, National Research Council, Washington, D.C., 1996. pp. 85-93.
17. Dalton, Doug, Joseph Nestler, John Nordbo, Bob St. Clair, Earnest Wittwer, and Mark Wolfgram. Transportation Data and Performance Measurement. Conference Proceedings 26. "Performance Measures to Improve Transportation Systems and Agency Operations." Transportation Research Board, National Research Council, Irvine, CA, November, 2001.
18. Stout, Thomas L., Jyh-Charn Liu, Robert E. Brydia, and Christopher M. Poe. "TransLink Information Database Requirements." Interim Report to Texas Department of Transportation. TX-97/2988-2, October 1996.
19. Turner, Shawn M., Robert E. Brydia, Jyh-Charn Liu, and William L. Eisele. "ITS Data Management System: Year One Activities," Research Report 1752-2. Texas Transportation Institute, College Station, TX, August 1997.
20. Brydia, Robert E., Shawn M. Turner, William. L. Eisele, and Jyh-Charn Liu. "Development of an ITS Data Management System." Presented at the 77th Annual Meeting of the Transportation Research Board, Washington, D.C., January 11-16, 1998.
21. Roisman, Richard 1., Ronald C. Welke, and Don Ostrander. The Montgomery County, Maryland, DASH System: Forecasting Future Traffic Volumes Using Real-Time Traffic Data. Compendium of Papers. Institute of Transportation Engineers, Nashville, TN, 2000. p. 18.
22. Turner, Shawn M. Using ITS Data for Transportation System Performance Measurement. Conference Proceedings. "Traffic Congestion and Traffic Safety in the 21st Century: Challenges, Innovations, and Opportunities." American Society of Civil Engineers, Chicago, IL, June 1997. pp. 340-346.
2 3. Hartgen, David T. "The Case for National Highway Performance Standards." The Urban Transportation Monitor, Volume 16, Number 12, June 28,2002.
30

24. Harding, John T. Transportation System Performance: Experts Identify Challenges and Expectations. ITE Journal. Volume 72, Number 11, Washington, D.C., November 2002. pp. 46-47.
25. "Performance Measures for Operational Effectiveness of Highway Segments and Systems." NCHRP Synthesis 311. Transportation Research Board, National Research Council, Washington, D.C., 2003.
31

Related Documents