Chapter 26 – Population Chapter 26 – Population growth & regulation growth & regulation World population clock

Chapter 26 – Population growth & regulation World population clock World population clock.
Jan 11, 2016
Welcome message from author
This document is posted to help you gain knowledge. Please leave a comment to let me know what you think about it! Share it to your friends and learn new things together.
Transcript

Chapter 26 – Population growth Chapter 26 – Population growth & regulation& regulation
World population clock
Chapter 26 – Population Growth & Chapter 26 – Population Growth & RegulationRegulation
• What is a population?What is a population?
• What causes population size changes?What causes population size changes?
• How is the human population changing?How is the human population changing?
• What are the environmental effects of What are the environmental effects of population changes?population changes?

What is a population?What is a population?
• All members of All members of a species that a species that live within an live within an ecosystem and ecosystem and can potentially can potentially interbreedinterbreed
Population growth
A. Factors influencing population growth (p. 514)1. Birthrate
2. Death rate
3. Migrationa. Immigration
b. Emigration

Population growthPopulation growth
B. Biotic potential—maximal B. Biotic potential—maximal growth rate given ideal growth rate given ideal conditions (p. 514)conditions (p. 514)
1.1. Produces Produces exponential growthexponential growth if not restrainedif not restrained
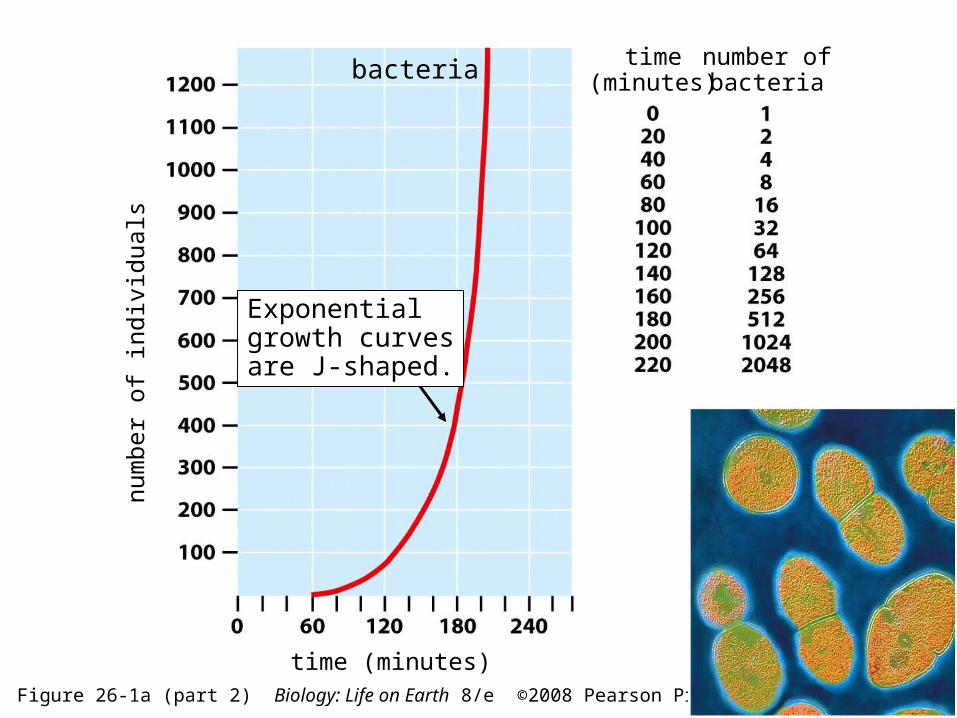
Figure 26-1a (part 2) Biology: Life on Earth 8/e ©2008 Pearson Prentice Hall, Inc.
num
ber
of in
divi
dual
s
time (minutes)
time(minutes)
number ofbacteriabacteria
Exponentialgrowth curvesare J-shaped.

Figure 26-5 Biology: Life on Earth 8/e ©2008 Pearson Prentice Hall, Inc.
num
ber
of c
rane
s
year
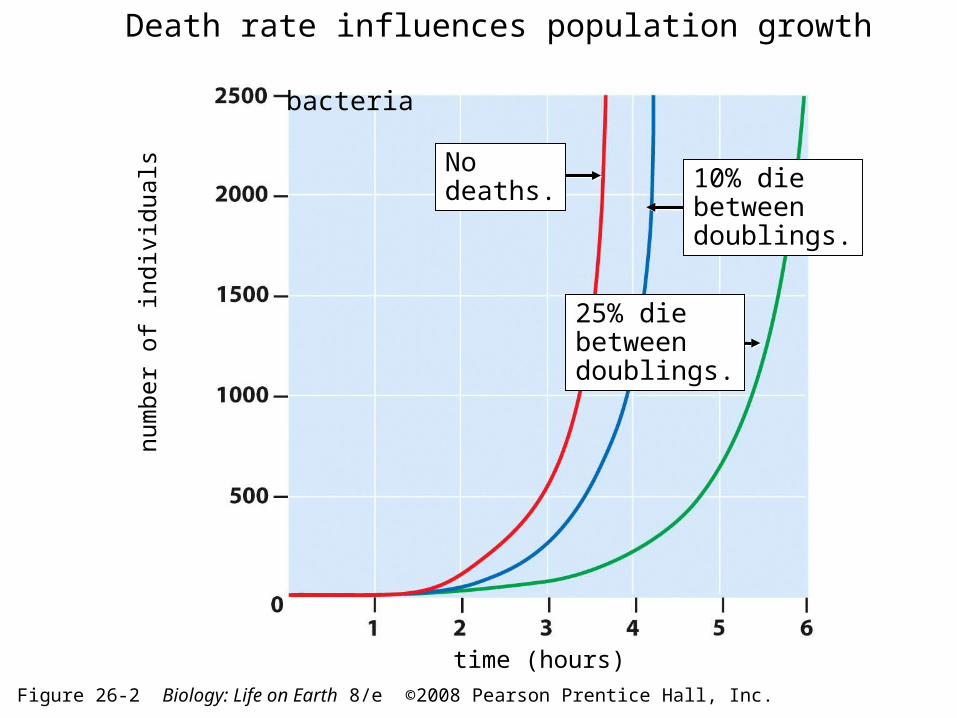
Figure 26-2 Biology: Life on Earth 8/e ©2008 Pearson Prentice Hall, Inc.
num
ber
of in
divi
dual
s
time (hours)
bacteria
25% diebetweendoublings.
Nodeaths. 10% die
betweendoublings.
Death rate influences population growth
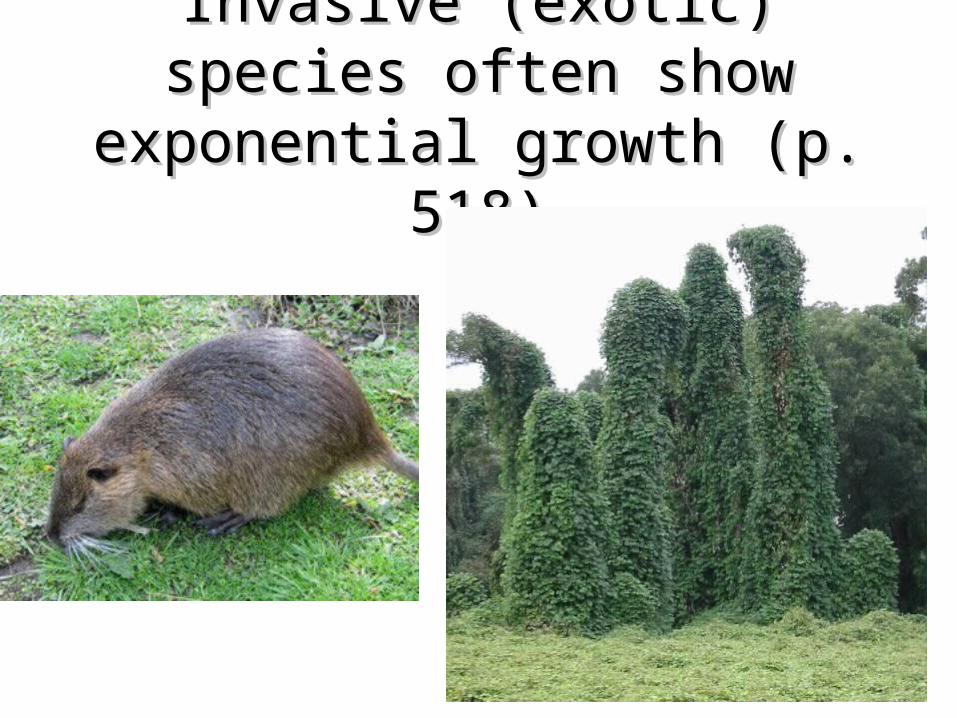
Invasive (exotic) species often Invasive (exotic) species often show exponential growth (p. 518)show exponential growth (p. 518)

Population growthPopulation growth
C. Environmental resistance limits population growth (p. 518)
1. Decreases birthrate, increases death rate
2. Density-dependent factorsa. Predation
b. Parasitism, disease
c. Competition (inter- and intraspecific)
d. Food & space

Human activity can influence Human activity can influence population growthpopulation growth
Clark
Lewis

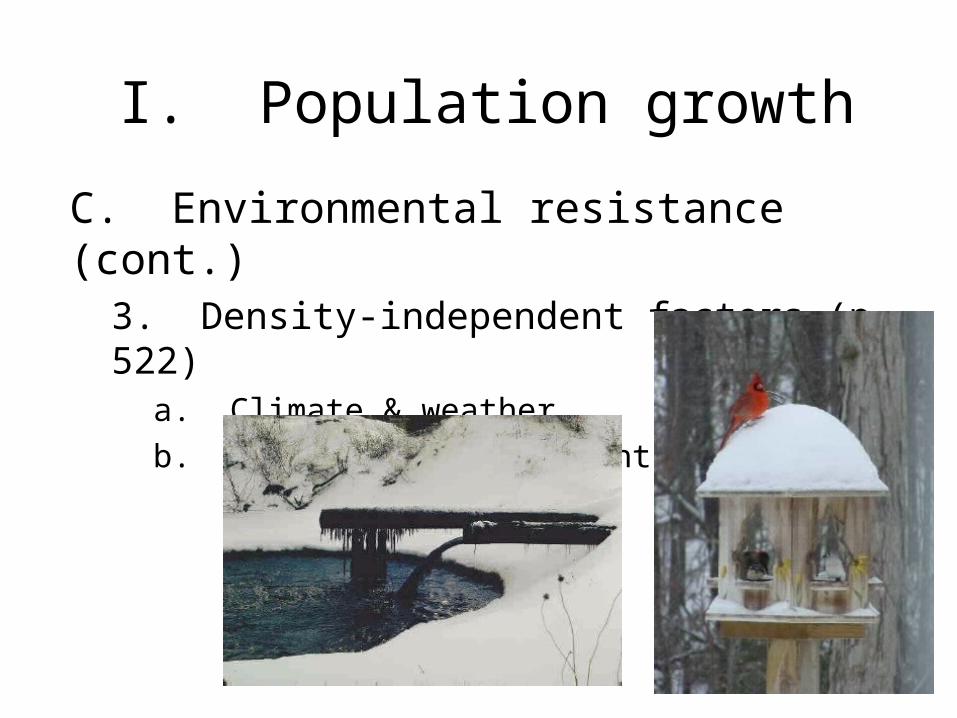
I. Population growth
C. Environmental resistance (cont.)3. Density-independent factors (p. 522)
a. Climate & weather
b. Pesticides & pollutants
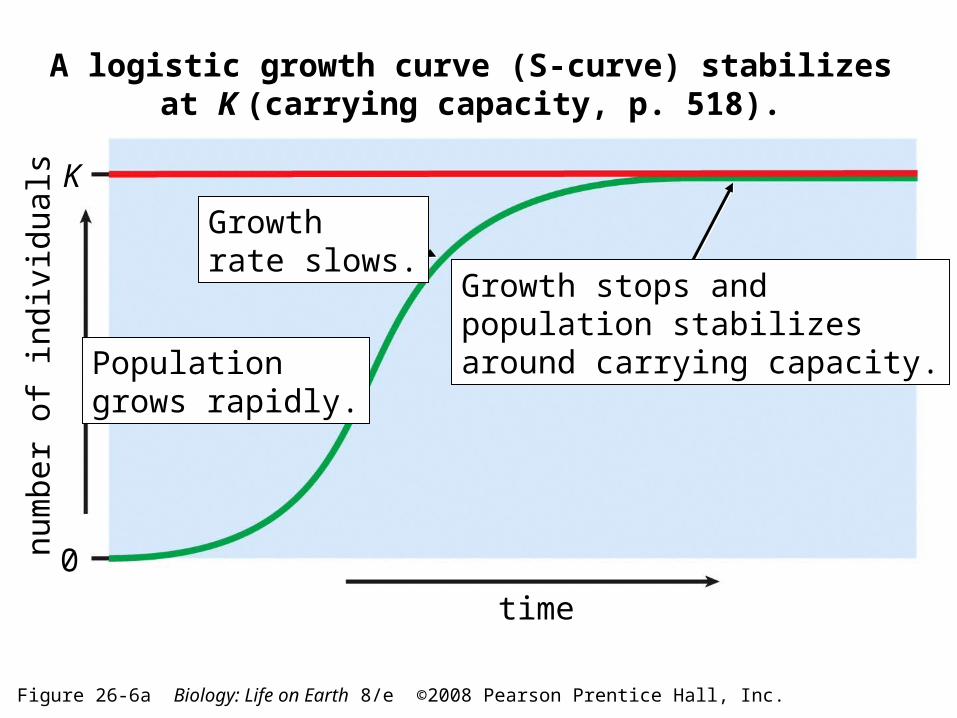
Figure 26-6a Biology: Life on Earth 8/e ©2008 Pearson Prentice Hall, Inc.
A logistic growth curve (S-curve) stabilizes at K (carrying capacity, p. 518).
K
0
num
ber
of in
divi
dual
s
time
Growth stops andpopulation stabilizesaround carrying capacity.
Growthrate slows.
Populationgrows rapidly.
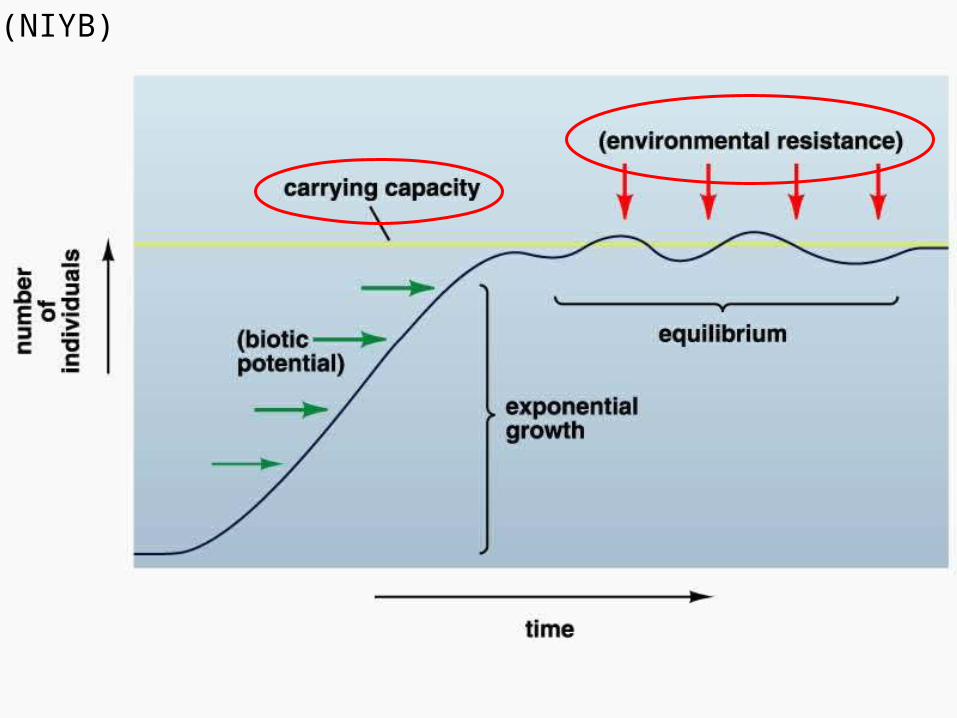
(NIYB)
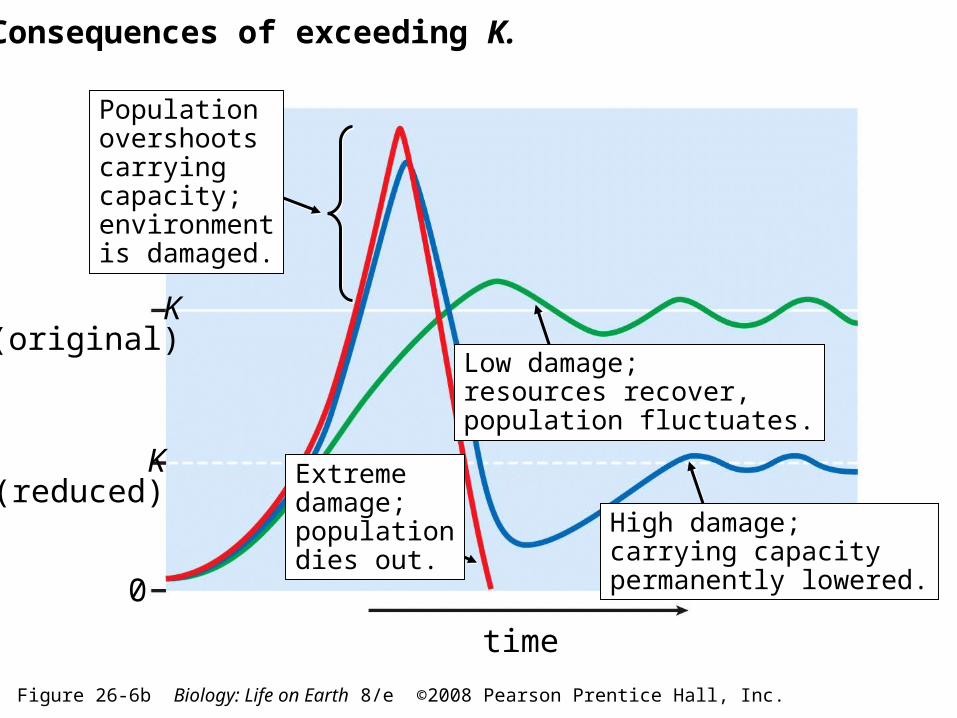
Figure 26-6b Biology: Life on Earth 8/e ©2008 Pearson Prentice Hall, Inc.
0
time
Consequences of exceeding K.
K(original)
K(reduced)
Populationovershootscarryingcapacity;environmentis damaged.
Extremedamage;populationdies out.
Low damage;resources recover,population fluctuates.
High damage;carrying capacitypermanently lowered.

Figure 26-3 Biology: Life on Earth 8/e ©2008 Pearson Prentice Hall, Inc.
pop
ula
tion
de
nsi
ty
0
month
Jan Mar May Jul Sep Nov
“bust”“boom”
Favorable growthconditions occur.
Nutrients are depleted.
Boom-and-bust population cycle (p. 517)
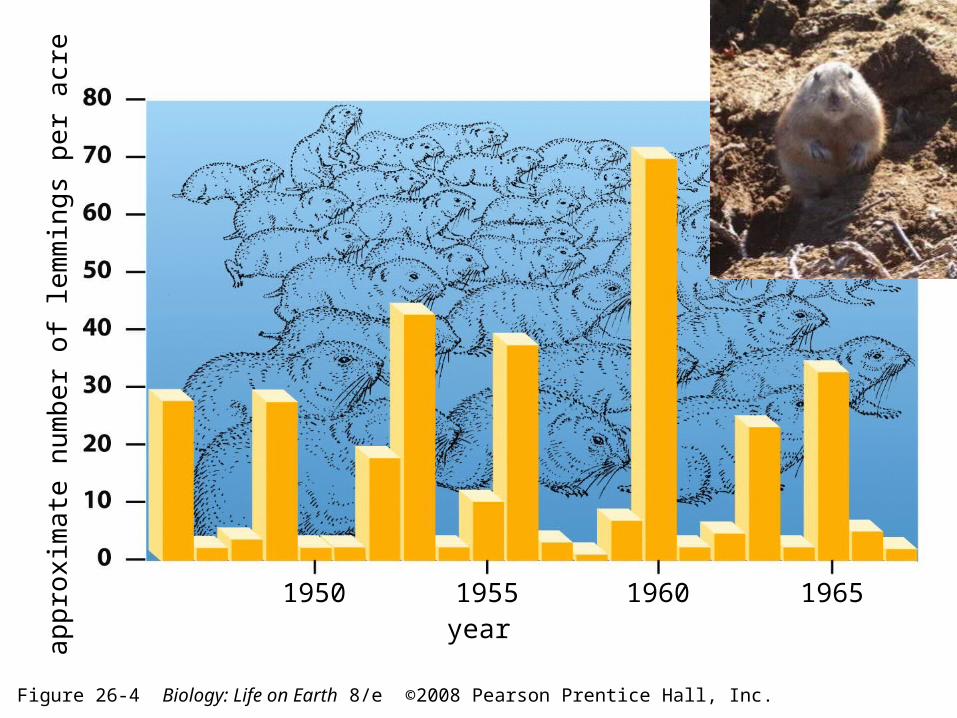
Figure 26-4 Biology: Life on Earth 8/e ©2008 Pearson Prentice Hall, Inc.
app
roxi
mat
e n
um
be
r o
f le
mm
ing
s p
er
acr
e
1965196019551950year
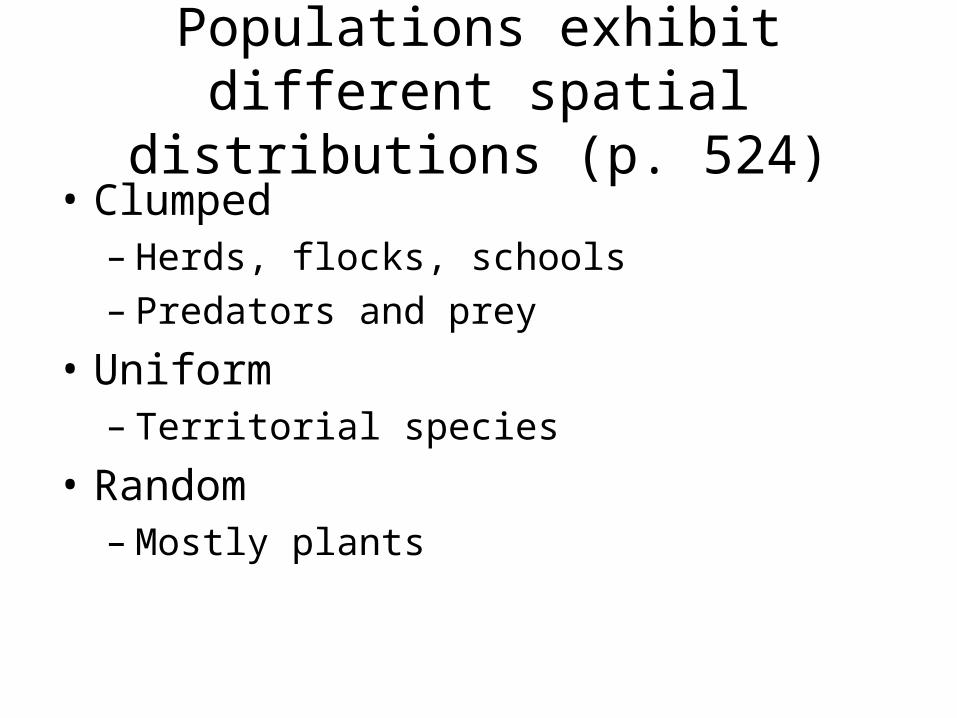
Populations exhibit different spatial distributions (p. 524)
• Clumped– Herds, flocks, schools– Predators and prey
• Uniform– Territorial species
• Random– Mostly plants
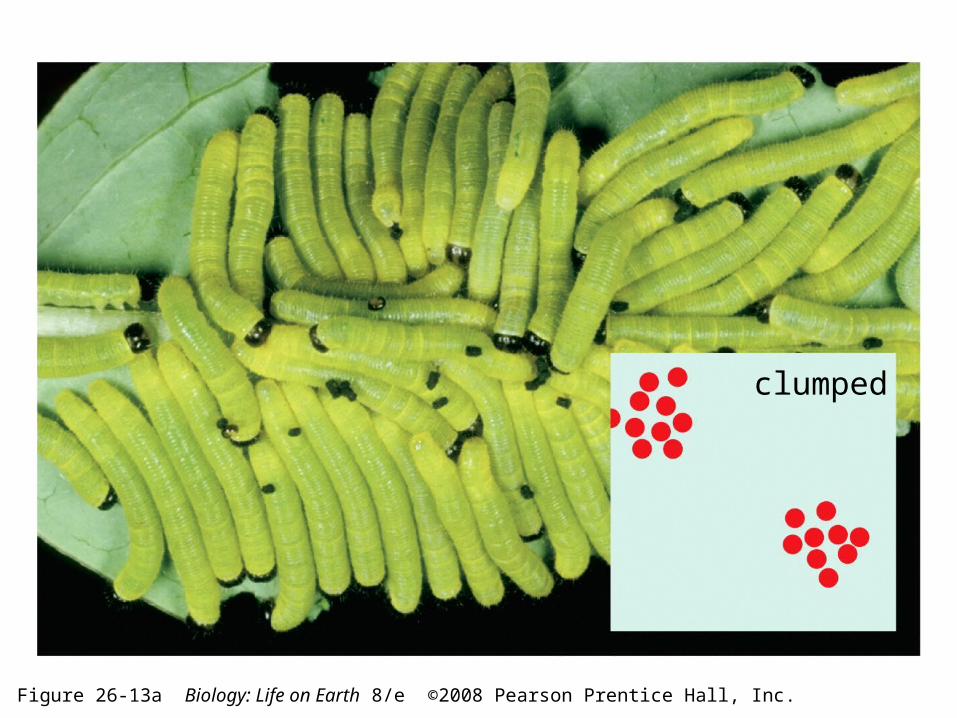
Figure 26-13a Biology: Life on Earth 8/e ©2008 Pearson Prentice Hall, Inc.
clumped
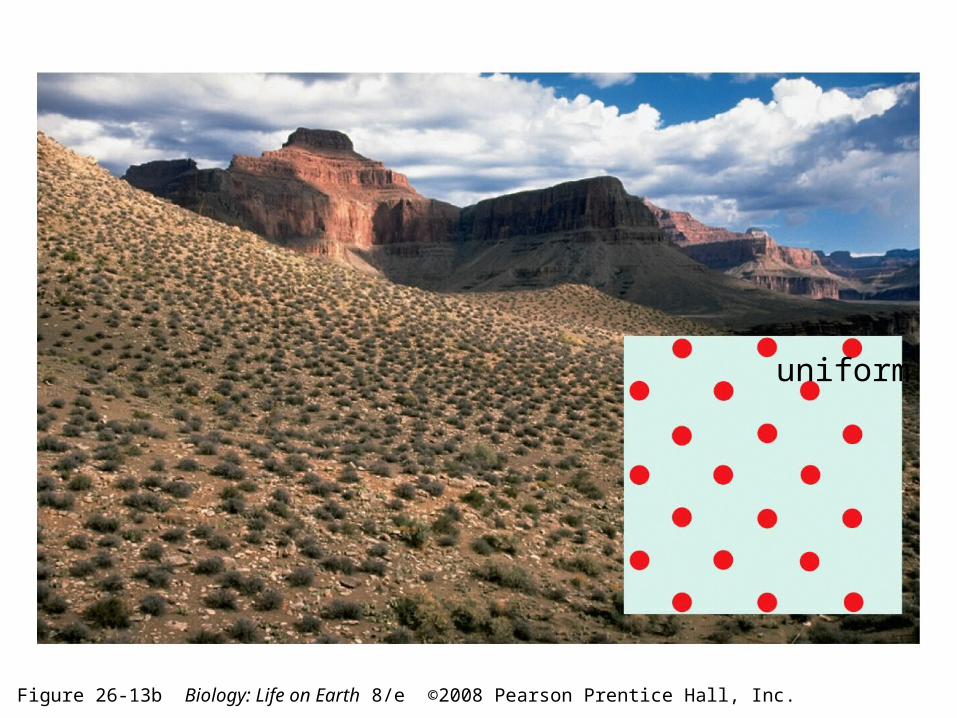
Figure 26-13b Biology: Life on Earth 8/e ©2008 Pearson Prentice Hall, Inc.
uniform
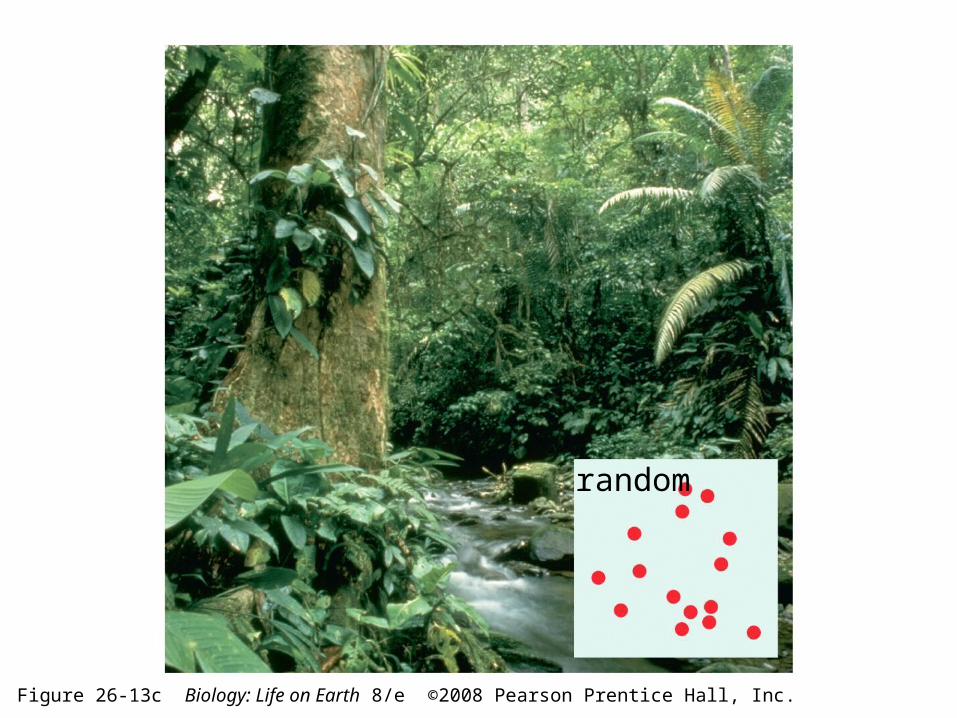
Figure 26-13c Biology: Life on Earth 8/e ©2008 Pearson Prentice Hall, Inc.
random
Populations exhibit differences in survivorship (p. 525)
• Early-loss– Large numbers of offspring
• Constant-loss– Equal chance of dying at all ages– Some birds
• Late-loss– Few offspring– Large and long-lived animals

Figure 26-14b Biology: Life on Earth 8/e ©2008 Pearson Prentice Hall, Inc.
num
ber
of s
urvi
vors
early loss(dandelion)
constant loss(American robin)
late loss(human)
age(in percentage of maximum life span)
Which of the following concerning Which of the following concerning populations is true?populations is true?
1)1) A population consists of all the species that A population consists of all the species that interact within a defined ecosysteminteract within a defined ecosystem
2)2) Populations always exhibit exponential growthPopulations always exhibit exponential growth
3)3) A population consists of all members of an A population consists of all members of an interbreeding species in a defined areainterbreeding species in a defined area
4)4) Both 1 and 2Both 1 and 2
5)5) Both 2 and 3Both 2 and 3

Which of the following serves as a form of Which of the following serves as a form of density-independent environmental density-independent environmental
resistance?resistance?
1)1) Availability of foodAvailability of food
2)2) Infectious diseaseInfectious disease
3)3) A droughtA drought
4)4) All of theseAll of these
5)5) None of theseNone of these
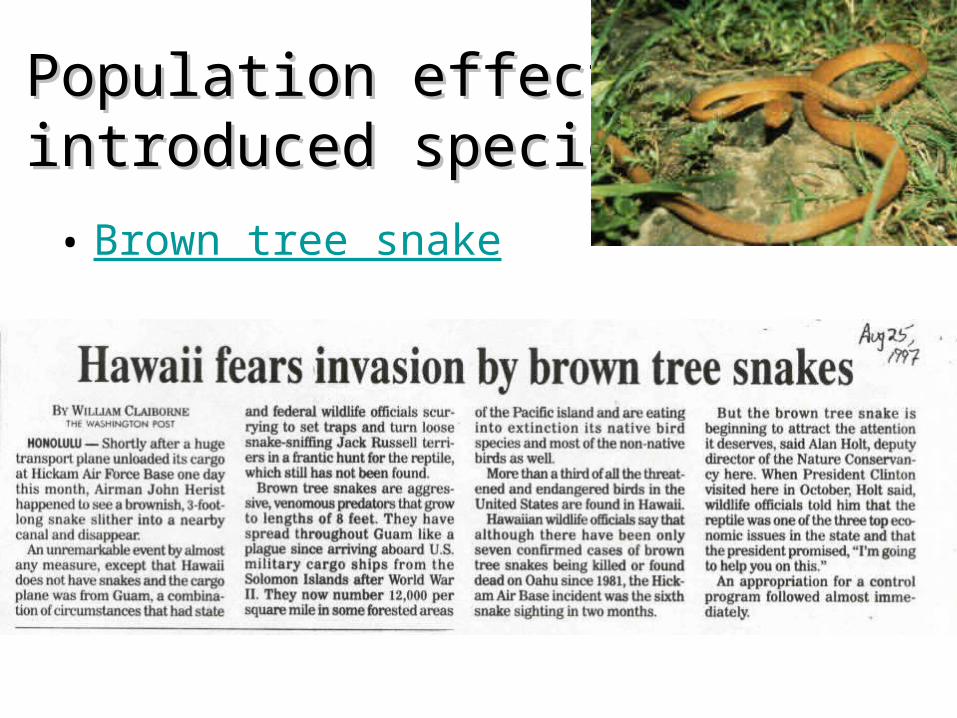
Population effects of Population effects of introduced speciesintroduced species
• Brown tree snake

Brown tree snakes
• Will the brown tree snake population continue to show positive growth?

Figure 26-15 Biology: Life on Earth 8/e ©2008 Pearson Prentice Hall, Inc.
Date
Technical andcultural advances
Industrial andmedicaladvances
Agricultural advances
123
Billions Time to addeach billion(years)All of humanhistory
1312131433
1804
201219991987197419601927
1
234567*
*projected bubo
nic
plag
ue
billi
ons
of p
eopl
e
2012*
1830
1975
1960
1930
1987
19992006
Human population growth
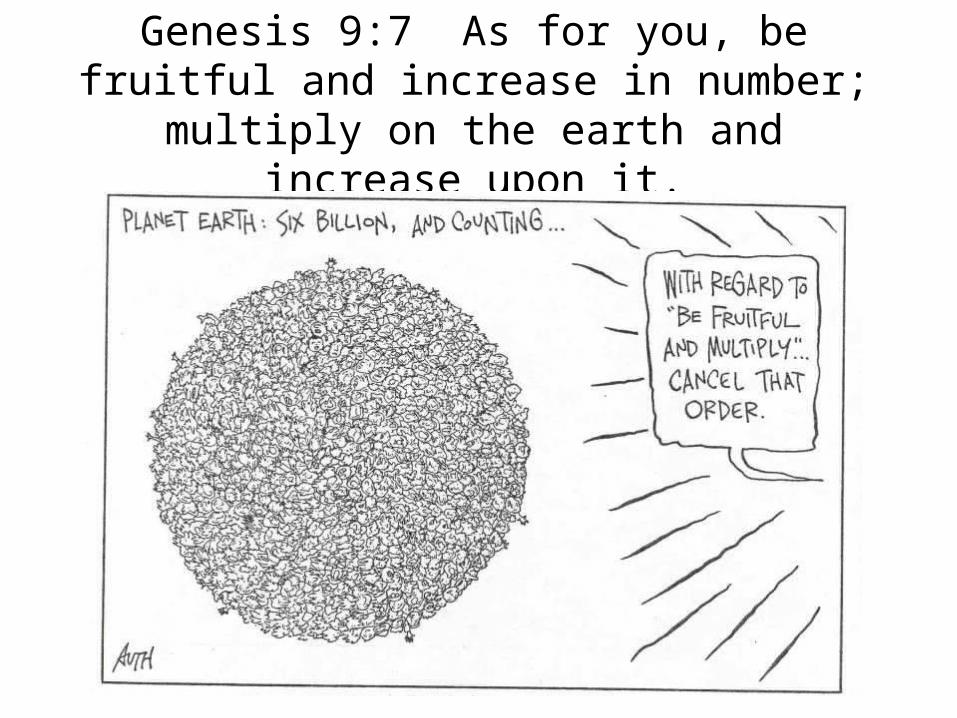
Genesis 9:7 As for you, be fruitful and increase in number; multiply on the earth
and increase upon it.
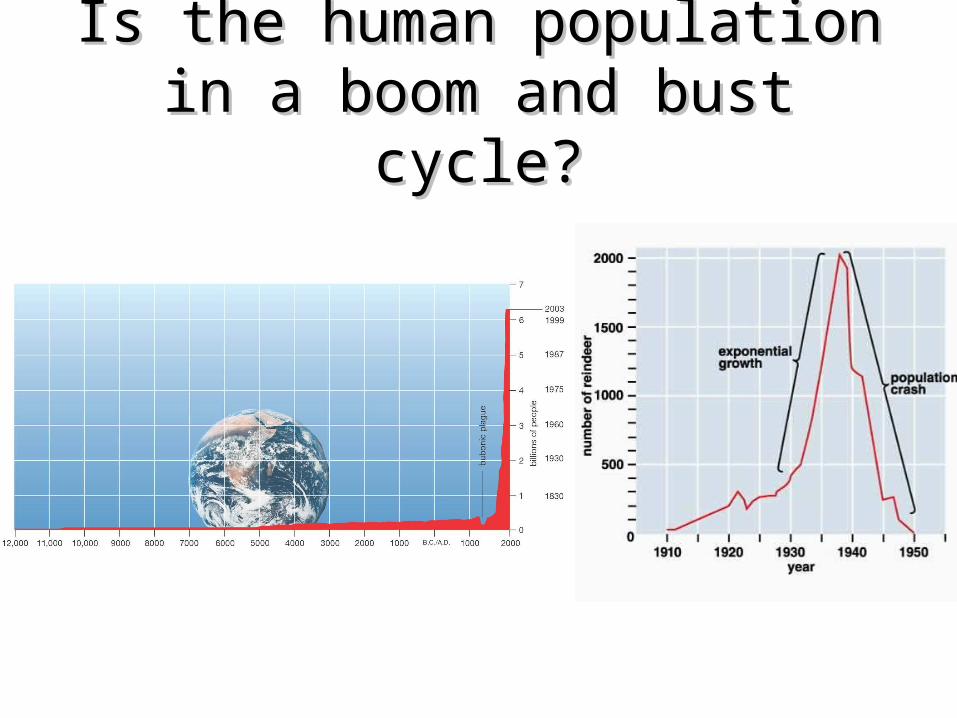
Is the human population in a Is the human population in a boom and bust cycle?boom and bust cycle?
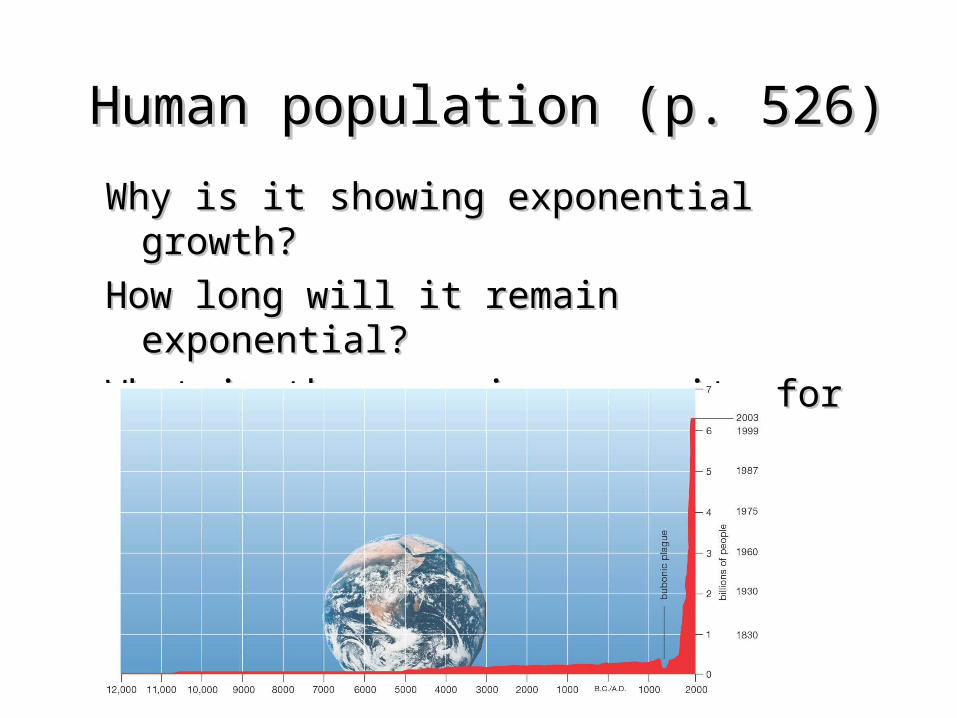
Human population (p. 526)Human population (p. 526)
Why is it showing exponential growth?Why is it showing exponential growth?
How long will it remain exponential? How long will it remain exponential?
What is the carrying capacity for humans?What is the carrying capacity for humans?

Human population growth – why growing so fast?
D. Our species continues to overcome environmental resistances
1. Medical advances, agricultural revolution

Figure 26-17 Biology: Life on Earth 8/e ©2008 Pearson Prentice Hall, Inc.
developed countries
2006: 6.5 billion
popu
latio
n (b
illio
ns)
year
developing countries
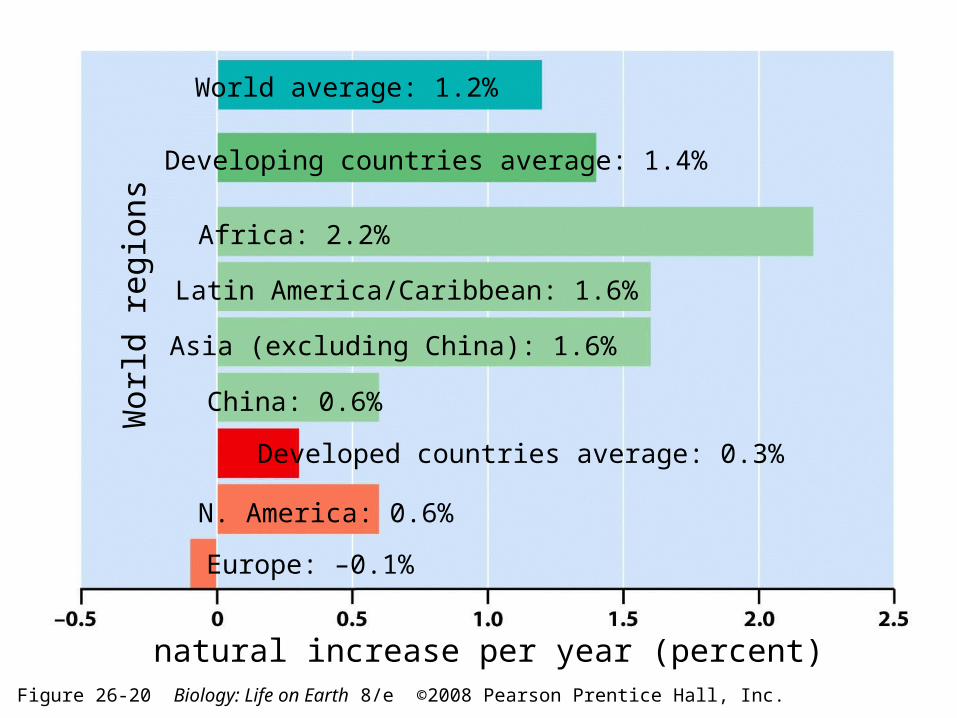
Figure 26-20 Biology: Life on Earth 8/e ©2008 Pearson Prentice Hall, Inc.
Developing countries average: 1.4%W
orld
reg
ions
natural increase per year (percent)
Europe: –0.1%
N. America: 0.6%
Developed countries average: 0.3%
China: 0.6%
Asia (excluding China): 1.6%
Latin America/Caribbean: 1.6%
Africa: 2.2%
World average: 1.2%

Age-structure diagrams predict future growth (p. 529-530)
RLF (p. 528) typically leads to stable population size

Figure 26-19 Biology: Life on Earth 8/e ©2008 Pearson Prentice Hall, Inc.
15 - 29
(a) Developed countries
0 - 14
75 and older
60 - 74
45 - 59
30 - 44
15 - 29
0 - 14
75 and older
60 - 74
45 - 59
30 - 44
age
femalemale
age
femalemale
(b) Developing countries
postreproductive (45–79 yr)
prereproductive (0–14 yr)
reproductive (15–44 yr)
millions of people
millions of people
2025 20502006
Age-structure diagrams online
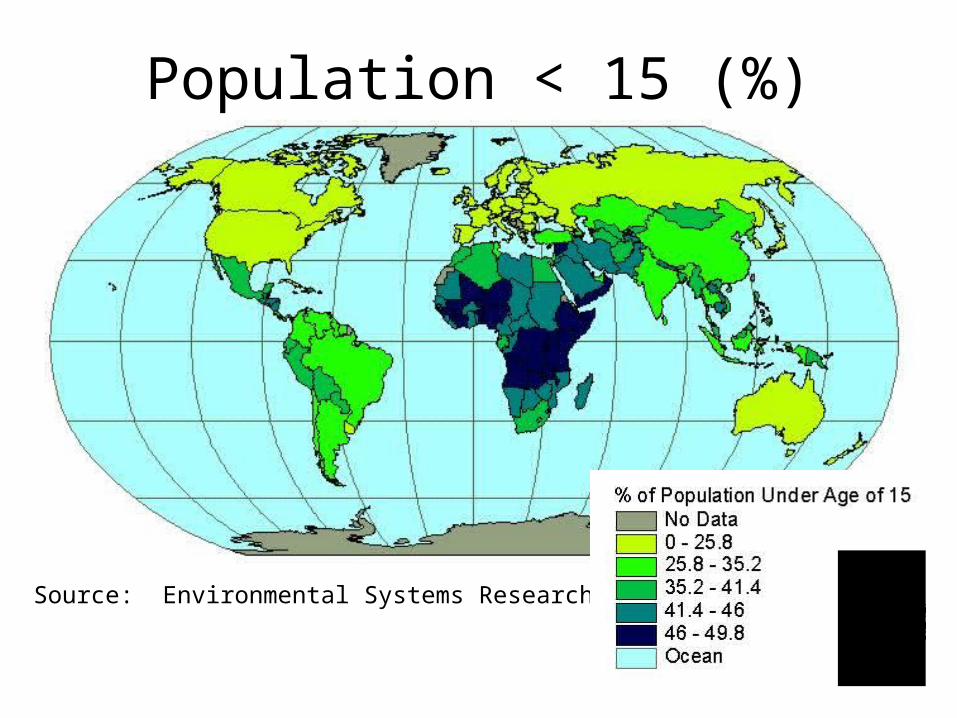
Population < 15 (%)
Source: Environmental Systems Research Institute
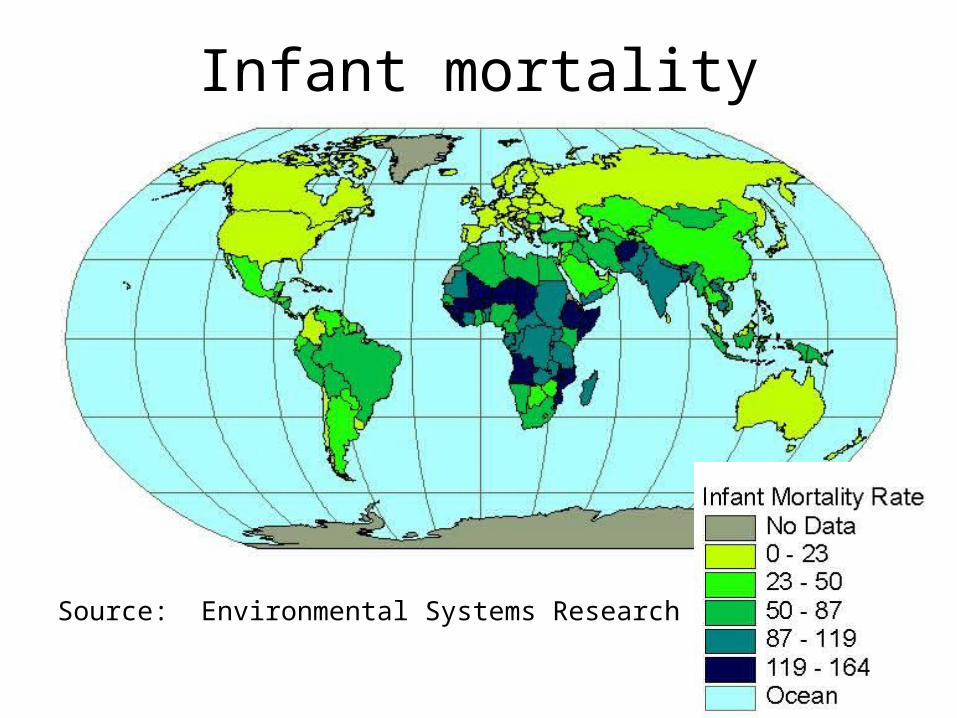
Infant mortality
Source: Environmental Systems Research Institute

Population growth rate (%)
Source: Environmental Systems Research Institute
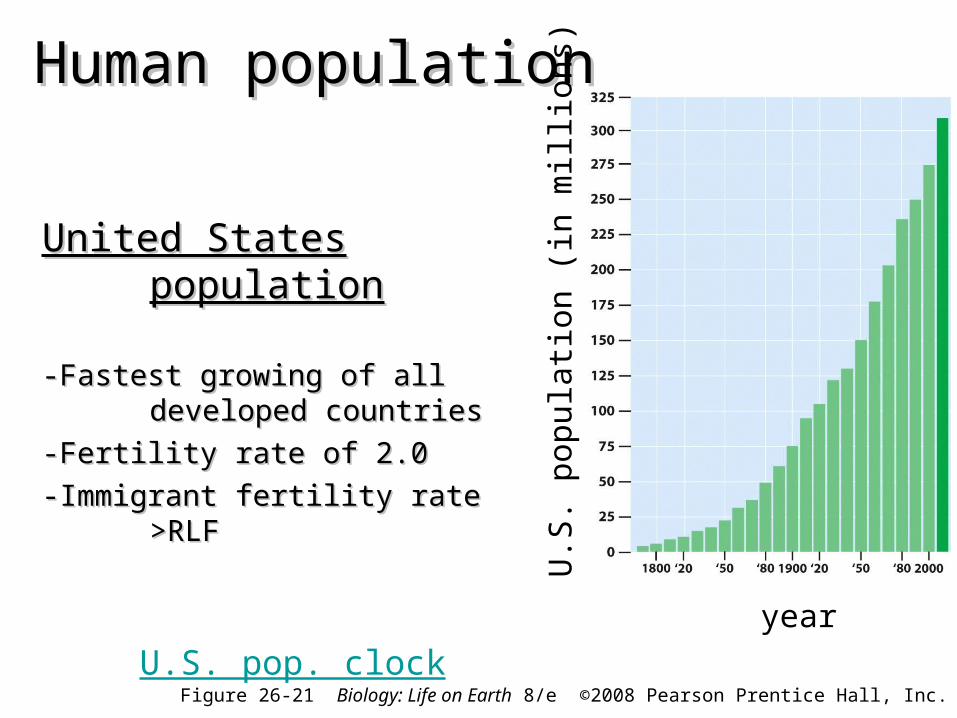
Human populationHuman population
United States populationUnited States population
-Fastest growing of all developed -Fastest growing of all developed countriescountries
-Fertility rate of 2.0-Fertility rate of 2.0
-Immigrant fertility rate >RLF-Immigrant fertility rate >RLF
U.S. pop. clock
U.S
. po
pula
tion
(in m
illio
ns)
year
Figure 26-21 Biology: Life on Earth 8/e ©2008 Pearson Prentice Hall, Inc.

U.S. population growth – is it a U.S. population growth – is it a problem?problem?
a.a. U.S. citizen uses 6x more energy than U.S. citizen uses 6x more energy than world averageworld average
b.b. <5% of population, but<5% of population, but-consumes 25% of energy-consumes 25% of energy-22% of carbon dioxide & CFC -22% of carbon dioxide & CFC emissions emissions
c.c. Avg. of 3600 cal/day vs. world avg. of Avg. of 3600 cal/day vs. world avg. of 2700 cal/day2700 cal/day
d.d. Ecological footprintEcological footprint (p. 528 &533) 24ac (p. 528 &533) 24ac pp, compared to 5.4ac pp worldwidepp, compared to 5.4ac pp worldwide
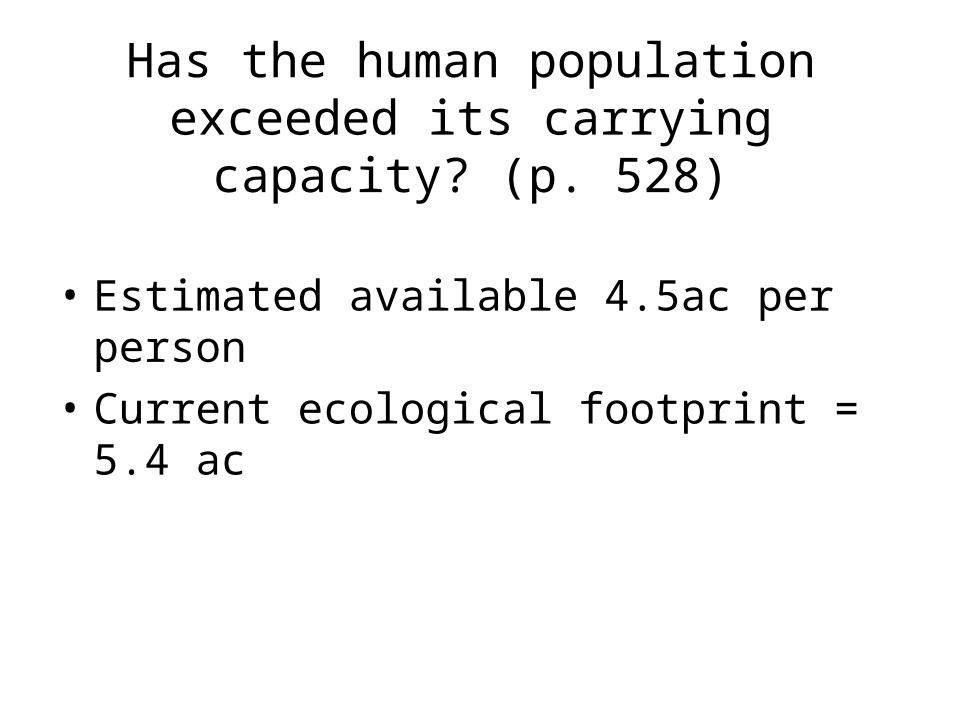
Has the human population exceeded its carrying capacity? (p. 528)
• Estimated available 4.5ac per person
• Current ecological footprint = 5.4 ac

U.S. population growthU.S. population growth
• By 2050 (Union of Concerned Scientists By 2050 (Union of Concerned Scientists prediction):prediction):– crop/pasture land reduced in halfcrop/pasture land reduced in half– food prices 3-5x higherfood prices 3-5x higher– 30-50% of income spent on food (vs. 12%)30-50% of income spent on food (vs. 12%)
Sources: http://www.ucsusa.org/http://www.ers.usda.gov/Briefing/CPIFoodAndExpenditures/Data/
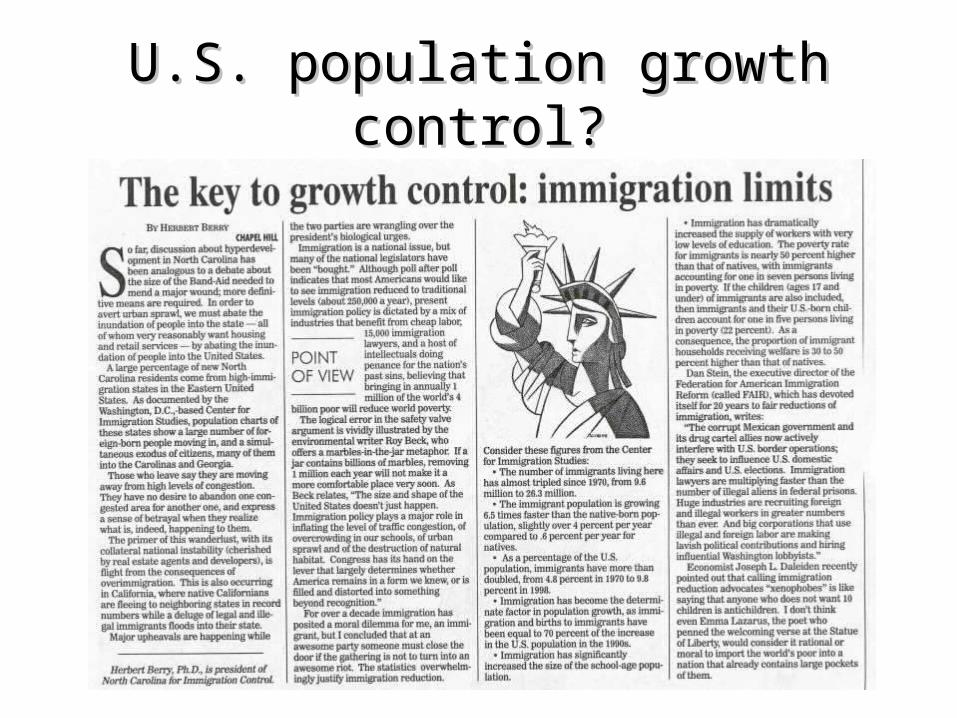
U.S. population growth control?U.S. population growth control?

Controlling population growthControlling population growth

How might a Christian respond to How might a Christian respond to human population growth?human population growth?
Are we abusing God’s creation?Are we abusing God’s creation? Do other species, as God’s creation, Do other species, as God’s creation,
have a right to space and natural have a right to space and natural resources?resources?
What about birth control?What about birth control? What about those in need?What about those in need?

1 John 3:17-18 (NIV)1 John 3:17-18 (NIV)
- 17 If anyone has material possessions and 17 If anyone has material possessions and sees his brother in need but has no pity on him, sees his brother in need but has no pity on him, how can the love of God be in him?how can the love of God be in him?
- 18 Dear children, let us not love with words or 18 Dear children, let us not love with words or tongue but with actions and in truth.tongue but with actions and in truth.
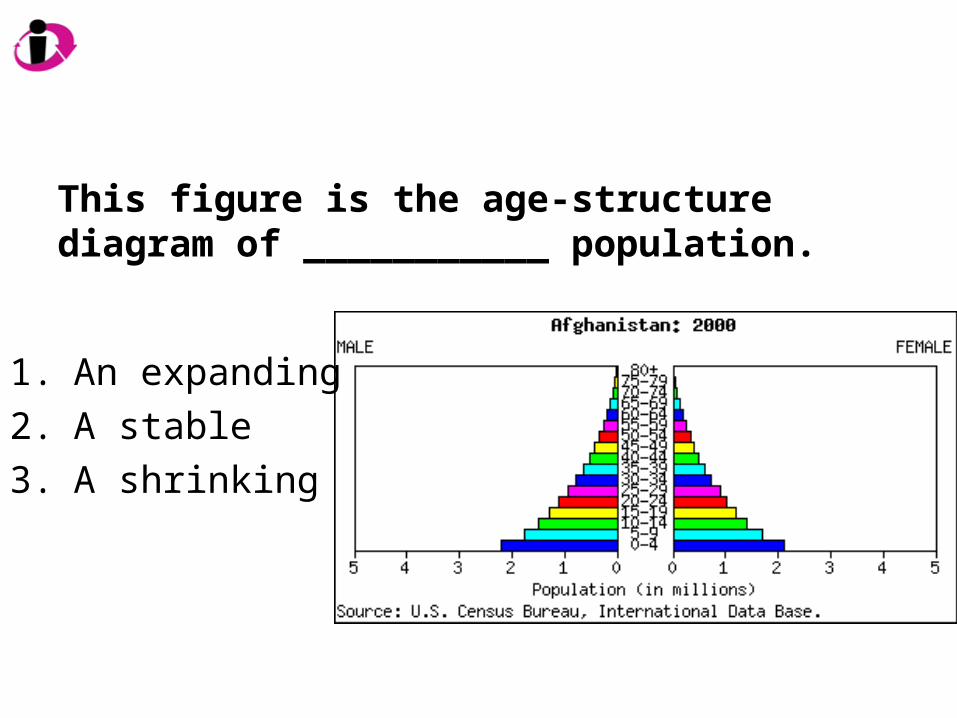
This figure is the age-structure diagram of ___________ population.
1. An expanding
2. A stable
3. A shrinking

Which of the following concerning the Which of the following concerning the human population is true?human population is true?
1)1) The United States has the fastest growing The United States has the fastest growing human population in the worldhuman population in the world
2)2) Developing countries have a slower growth Developing countries have a slower growth rate than developed countriesrate than developed countries
3)3) The human population is growing The human population is growing exponentiallyexponentially
4)4) All of theseAll of these
5)5) None of theseNone of these
Related Documents