Chapter 21

Chapter 21. Learn why managers use budgets Develop strategy PlanActControl 3Copyright 2009 Prentice Hall. All rights reserved.
Dec 22, 2015
Welcome message from author
This document is posted to help you gain knowledge. Please leave a comment to let me know what you think about it! Share it to your friends and learn new things together.
Transcript

Chapter 21

Learn why managers use budgets

3Copyright 2009 Prentice Hall. All rights reserved.

Copyright 2009 Prentice Hall. All rights reserved. 4

Understand the components of the master budget

Set of budgeted financial statements and supporting schedules
Three types:◦ Operating◦ Capital expenditures◦ Financial
Copyright 2009 Prentice Hall. All rights reserved. 6

Sales budget
Operating expenses budget
Purchases and cost of goods sold budget
Inventory budget
Budgeted income statement
Copyright 2009 Prentice Hall. All rights reserved. 7

8
Budgeted income statement
Cash budget
Budgeted balance
sheet
Budgeted statement of cash flows
Capital expenditures
budget
Financial budget
Copyright 2009 Prentice Hall. All rights reserved.

Prepare an operating budget

Forecast of sales revenues Cornerstone of master budget
◦ Level of sales affects all elements
10Copyright 2009 Prentice Hall. All rights reserved.
Budgeted total sales
Sales priceExpected number of units sold

11
Purchases = Cost of goods sold + Ending inventory – Beginning inventory
Copyright 2009 Prentice Hall. All rights reserved.
Cost of goods sold = Beginning inventory + Purchases – Ending inventory
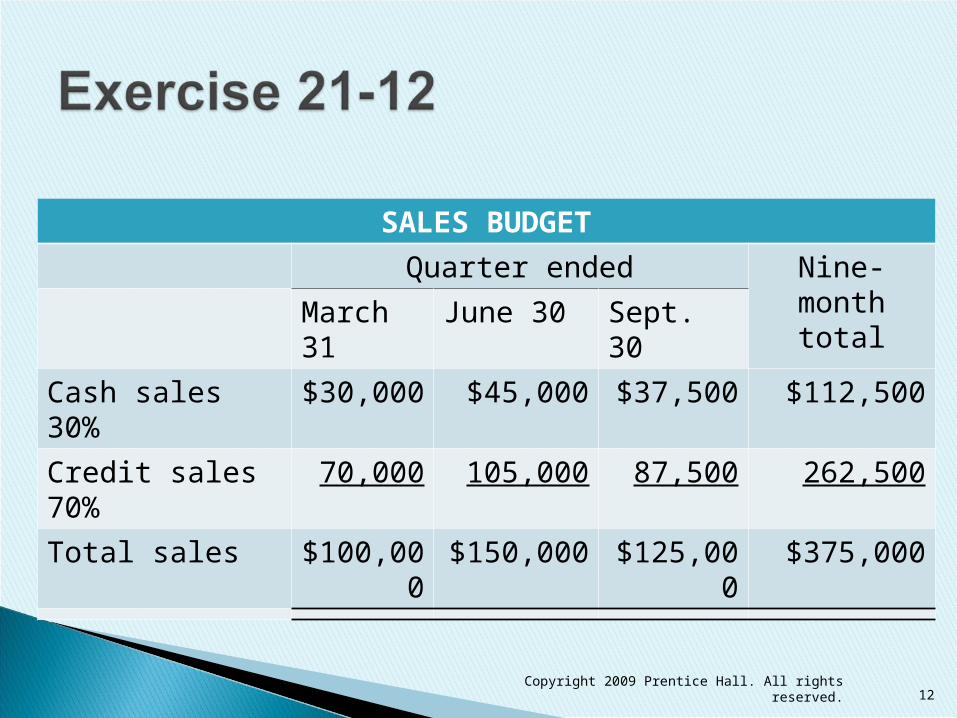
SALES BUDGET
Quarter ended Nine-month total
March 31
June 30 Sept. 30
Cash sales 30% $30,000 $45,000 $37,500 $112,500
Credit sales 70%
70,000 105,000 87,500 262,500
Total sales $100,000
$150,000 $125,000
$375,000
Copyright 2009 Prentice Hall. All rights reserved. 12
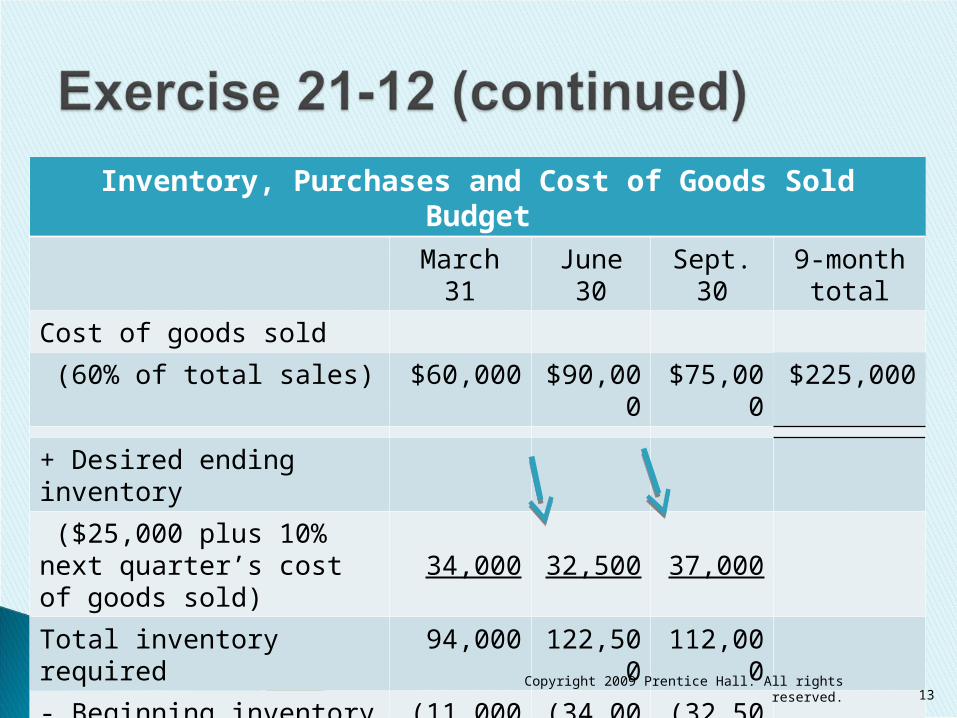
Inventory, Purchases and Cost of Goods Sold BudgetMarch
31June 30 Sept.
309-month
total
Cost of goods sold
(60% of total sales) $60,000 $90,000
$75,000
$225,000
+ Desired ending inventory
($25,000 plus 10% next quarter’s cost of goods sold)
34,000 32,500 37,000
Total inventory required 94,000 122,500
112,000
- Beginning inventory (11,000) (34,000)
(32,500)
= Budgeted purchases $83,000 $88,500
$79,500
Copyright 2009 Prentice Hall. All rights reserved. 13

Expenses can be either fixed or variable Includes items such as:
◦ Salaries◦ Rent◦ Insurance◦ Advertising
Copyright 2009 Prentice Hall. All rights reserved. 14
Prepare a financial budget

Copyright 2009 Prentice Hall. All rights reserved. 16

Details how the business expects to go from the beginning cash balance to the desired ending balance
Four major parts:◦ Cash collections from customers◦ Cash payments for purchases◦ Cash payments for operating expense◦ Cash payments for capital expenditures
17Copyright 2009 Prentice Hall. All rights reserved.

Cash collections from customers◦ Cash sales from the sales budget◦ Collections of previous month’s credit sales
Accounts receivable Cash payments for purchases
◦ Payment of current month purchases from the purchases budget
◦ Payment of prior month purchases Accounts payable
18Copyright 2009 Prentice Hall. All rights reserved.

Payments for operating expense◦ Use data from operating expense budget◦ Do not include noncash expenses such as
depreciation Payments for capital expenditures
◦ Use budgeted data
19Copyright 2009 Prentice Hall. All rights reserved.

Copyright 2009 Prentice Hall. All rights reserved. 20
Beginning cash balance 10$ 4$ Cash collections 8 12 Cash available 18 16 Cash payments:
Purchases of inventory 10 8 Operating expenses 2 2 Capital expenditures 4 1
Total cash payments 16 11 Ending cash balance before financing 2 5
Less: minimum cash balance (4) (4) Cash excess (deficiency) (2) 1 Financing of cash deficiency Borrowing 2 Payments (1)
Total effects of financing 2 (1) Ending cash balance 4$ 4$
Cash Budget

Copyright 2009 Prentice Hall. All rights reserved. 21
(a)
Book value of equipment:
Cost $22,000
Less: Accumulated depreciation
(7,000)
Book value $15,000
Plus: Gain 4,000
Expected cash receipt $19,000

Copyright 2009 Prentice Hall. All rights reserved. 22
August September
Expected sales in units 7,800 9,100
Selling price $13 $13
Expected sales $101,400 $118,300
Cash sales (30%) 30,420 35,490
Credit sales (70%) 70,980 82,810
Cash sales $35,490
September credit sales collected
82,810 x ¾ 62,108
August credit sales collected
70,980 x ¼ 17,745
Expected cash collections in September
$115,343
Copyright 2009 Prentice Hall. All rights reserved. 23
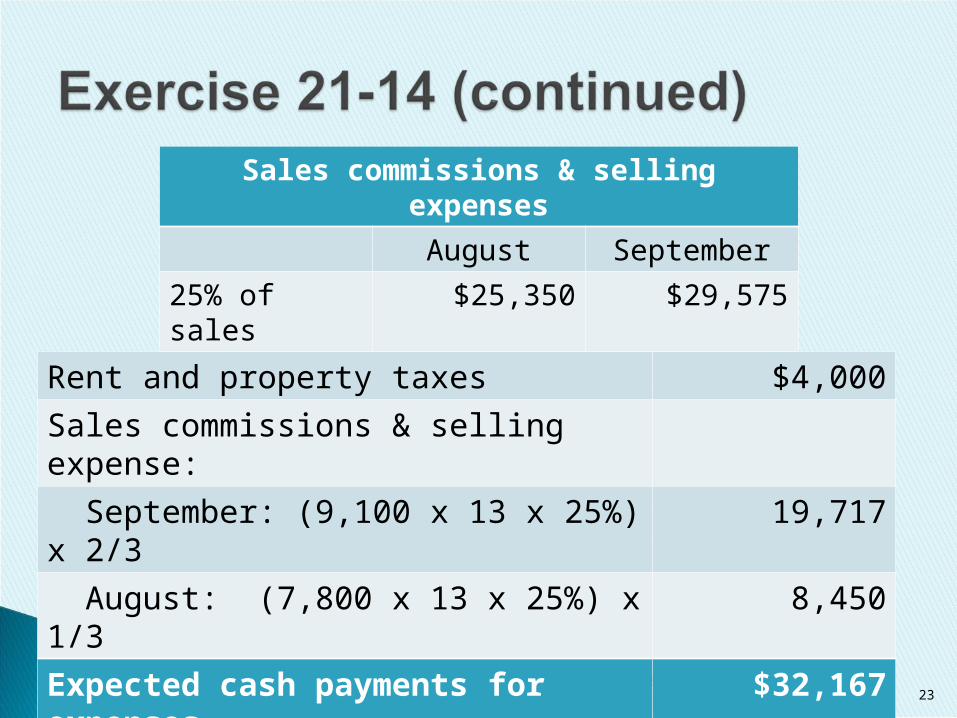
Rent and property taxes $4,000
Sales commissions & selling expense:
September: (9,100 x 13 x 25%) x 2/3
19,717
August: (7,800 x 13 x 25%) x 1/3 8,450
Expected cash payments for expenses
$32,167
Sales commissions & selling expenses
August September
25% of sales $25,350 $29,575

Use sensitivity analysis in budgeting
Actual results often differ from budgeted amounts
Sensitivity analysis◦ What-if technique that determines the result if
predicted amounts differ from those budgeted Spreadsheet programs used for budgeting
make sensitivity analysis cost-effective
25Copyright 2009 Prentice Hall. All rights reserved.

Copyright 2009 Prentice Hall. All rights reserved. 26
Company’s individual operating units roll up budgets to prepare company-wide budget
Budget management software used◦ Often part of Enterprise Resource Planning (ERP)
system Software allows managers to spend more
time analyzing data
Copyright 2009 Prentice Hall. All rights reserved. 27

Prepare performance reports for responsibility centers

Subunit of organization whose manager is accountable for specific activities
Four types:
29Copyright 2009 Prentice Hall. All rights reserved.

Cost center◦ Managers accountable for costs only
Goal – to control costs Revenue center
◦ Managers primarily accountable for revenues Goal – increase revenues
Profit center◦ Managers accountable for both revenues and
costs Goal – increase profits
Copyright 2009 Prentice Hall. All rights reserved. 30

Investment center◦ Managers accountable for investments, revenues,
and costs◦ Responsible for:
Generating sales Controlling expenses Managing investment needed to earn the income
◦ Goal – increase return on investment, residual income, or economic value added
Copyright 2009 Prentice Hall. All rights reserved. 31

Performance reports compare budgeted and actual amounts
Reporting at all levels:◦ Division (investment centers)◦ Product lines (profit centers)◦ Production (cost centers)◦ Sales (revenue centers)
Management by exception◦ Shows variances between actual and budgeted
amounts
32Copyright 2009 Prentice Hall. All rights reserved.

Related Documents