Education Budgets A Study of Selected Districts of Pakistan United Nations Educational, Scientific and Cultural Organization UNESCO Islamabad

Welcome message from author
This document is posted to help you gain knowledge. Please leave a comment to let me know what you think about it! Share it to your friends and learn new things together.
Transcript
8/11/2019 Education Budgets
http://slidepdf.com/reader/full/education-budgets 1/71
Education Budgets A Study of Selected Districts of Pakistan
United Nations
Educational, Scientific and
Cultural Organization
UNESCO Islamabad
8/11/2019 Education Budgets
http://slidepdf.com/reader/full/education-budgets 2/71
Published by UNESCO Islamabad, Pakistan
UNESCO Office, Serena Business Complex,
7th Floor, Sector G-5, Islamabad
Email: [email protected]
Website: www.unesco.org.pk
© UNESCO 2013
All rights reserved
ISBN 978-969-8035-14-3
The designations employed and the presentation of material throughout this publication do not
imply the expression of any opinion whatsoever on the part of UNESCO concerning the legalstatus of any country, territory, city or area or of its authorities, or concerning the delimitation of
its frontiers or boundaries.
The authors are responsible for the choice and the presentation of the facts contained in this
book and for the opinions expressed therein, which are not necessarily those of UNESCO and do
not commit the Organization.
Design/Layout: Sirisak Chaiyasook
Front cover photo: © UNESCO Isalamabad
Pakistan/11/OS/039-1
8/11/2019 Education Budgets
http://slidepdf.com/reader/full/education-budgets 3/71
The state shall provide free andcompulsory education to all children of
the age of five to sixteen years in such
manner as may be determined by law.
Article 25-A
Constitution of Pakistan
8/11/2019 Education Budgets
http://slidepdf.com/reader/full/education-budgets 4/71
Preface
UNESCO functions as an advisor to the Government, an advocate of international norms and standards,
a convener of relevant stakeholders, a clearing-house for dissemination and sharing of information and
knowledge, a laboratory of innovative ideas and a provider of technical assistance to improve national
capacity.
In accordance with its mandate, UNESCO commissioned this study on the education budgeting
processes followed in some selected districts of Pakistan. Its basic purpose was to trace the practices
of budget allocation, priorities, utilization and people’s participation in the preparation of education
budgets. Conducted by the Centre for Peace and Development Initiative (CPDI), this study is a pioneer
effort, providing invaluable information on, and lessons learnt in, education budget formulation for
improvement of the education system in Pakistan, within the framework of the Local Governance
Ordinance (LGO) 2011.
This report furnishes details of the annual education budget making process, its implementation and
effectiveness along with the individual and comparative analyses of the education budgets in selected
districts. The study highlights several aspects of the budget making process which seek serious policy
attention to make it, among others, transparent and participatory. It raises issues that across districtsbudget allocations for the education sector are uneven, inadequate and annual increases are, at best,
marginal in real terms. Salary-related expenses are predominant in district education budgets, allowing
limited funds for non-salary expenditures essential for maintenance and development of the system.
Weak governance persists as a serious challenge.
The key value of this study lies in its timing and its usefulness in the very near future. Of recent, given
the additional challenges to education governance and finance, the budgeting process has gained
prominence. In July 2011, under the 18th Amendment of the Constitution, education was fully devolved
to the provinces. This has added to the responsibilities of the provinces as now the educational policy,
planning and curriculum development has been placed within the provincial mandate. In addition,
Article 25-A of the Constitution calls for the provision of free and compulsory education to all children
of the ages five to sixteen years. With more resources awarded to the provinces under the 7th National
Finance Commission (NFC) Award 2010, provincial education budgets are now expected to cater to a
variety of additional dimensions. These are expected to address advocacy for appropriate legislation,
enhancement of institutional capacity, curriculum development, increased coverage of service delivery,
etc. Lessons learnt from this study would, indeed, provide invaluable guidance for improved budgeting
procedures and practices.
UNESCO is grateful to all individuals involved in the preparation of this study, including Provincial and
District Government officials, CPDI team, UN staff and the civil society at large.
Dr. Kozue Kay Nagata
Director/Representative
UNESCO Islamabad
8/11/2019 Education Budgets
http://slidepdf.com/reader/full/education-budgets 5/71
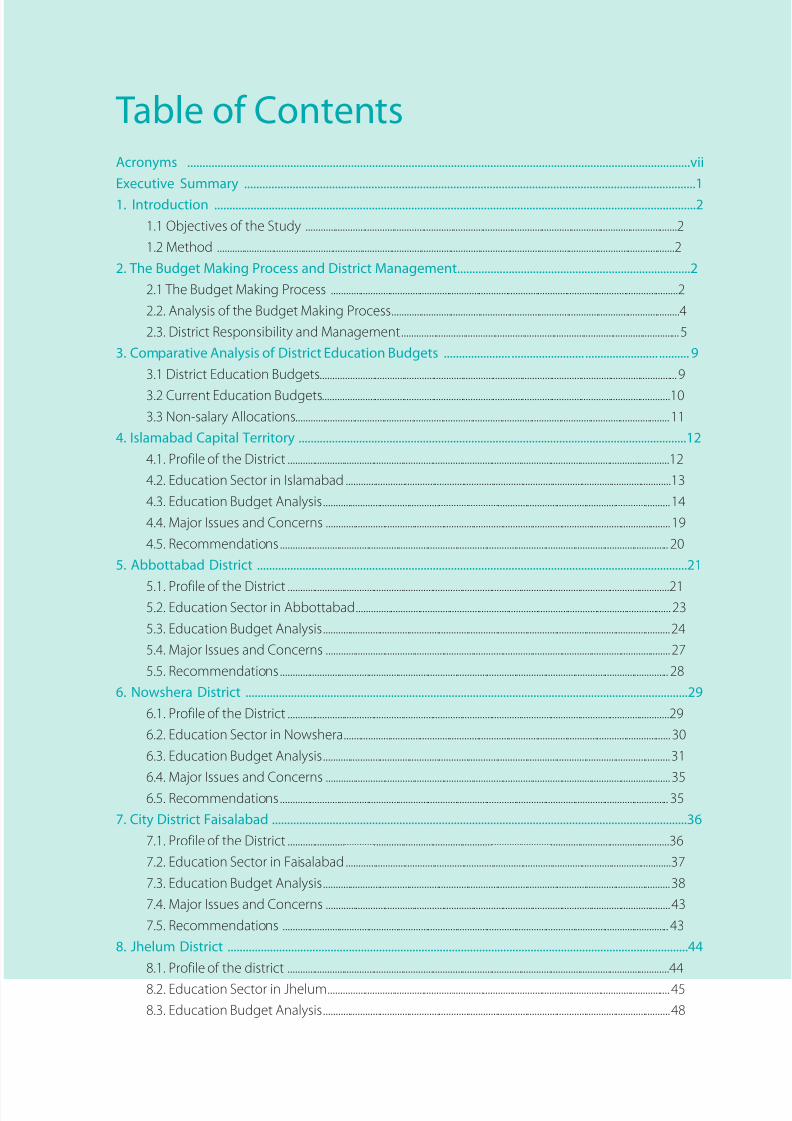
Table of ContentsAcronyms ......................................................................................................................................................................vii
Executive Summary .....................................................................................................................................................1
1. Introduction ...............................................................................................................................................................2
1.1 Objectives of the Study .......................................................................................................................................................2
1.2 Method ..........................................................................................................................................................................................2
2. The Budget Making Process and District Management.............................................................................2
2.1 The Budget Making Process .............................................................................................................................................2
2.2. Analysis of the Budget Making Process .....................................................................................................................4
2.3. District Responsibility and Management .................................................................................................................5
3. Comparative Analysis of District Education Budgets ...................... ........................ ........................ .......... 9
3.1 District Education Budgets .................................................................................................................................................9
3.2 Current Education Budgets .............................................................................................................................................10
3.3 Non-salary Allocations ........................................................................................................................................................11
4. Islamabad Capital Territory ................................................................................................................................12
4.1. Profile of the District ...........................................................................................................................................................12
4.2. Education Sector in Islamabad ....................................................................................................................................13
4.3. Education Budget Analysis .............................................................................................................................................14
4.4. Major Issues and Concerns ............................................................................................................................................19
4.5. Recommendations .............................................................................................................................................................. 20
5. Abbottabad District ..............................................................................................................................................21
5.1. Profile of the District ...........................................................................................................................................................215.2. Education Sector in Abbottabad ................................................................................................................................ 23
5.3. Education Budget Analysis .............................................................................................................................................24
5.4. Major Issues and Concerns ............................................................................................................................................27
5.5. Recommendations .............................................................................................................................................................. 28
6. Nowshera District ..................................................................................................................................................29
6.1. Profile of the District ...........................................................................................................................................................29
6.2. Education Sector in Nowshera ..................................................................................................................................... 30
6.3. Education Budget Analysis .............................................................................................................................................31
6.4. Major Issues and Concerns ............................................................................................................................................35
6.5. Recommendations .............................................................................................................................................................. 35
7. City District Faisalabad .........................................................................................................................................36
7.1. Profile of the District ...........................................................................................................................................................36
7.2. Education Sector in Faisalabad ....................................................................................................................................37
7.3. Education Budget Analysis .............................................................................................................................................38
7.4. Major Issues and Concerns ............................................................................................................................................43
7.5. Recommendations ............................................................................................................................................................. 43
8. Jhelum District ........................................................................................................................................................44
8.1. Profile of the district ...........................................................................................................................................................44
8.2. Education Sector in Jhelum ........................................................................................................................................... 45
8.3. Education Budget Analysis .............................................................................................................................................48
8/11/2019 Education Budgets
http://slidepdf.com/reader/full/education-budgets 6/71
8.4. Major Issues and Concerns .............................................................................................................................................52
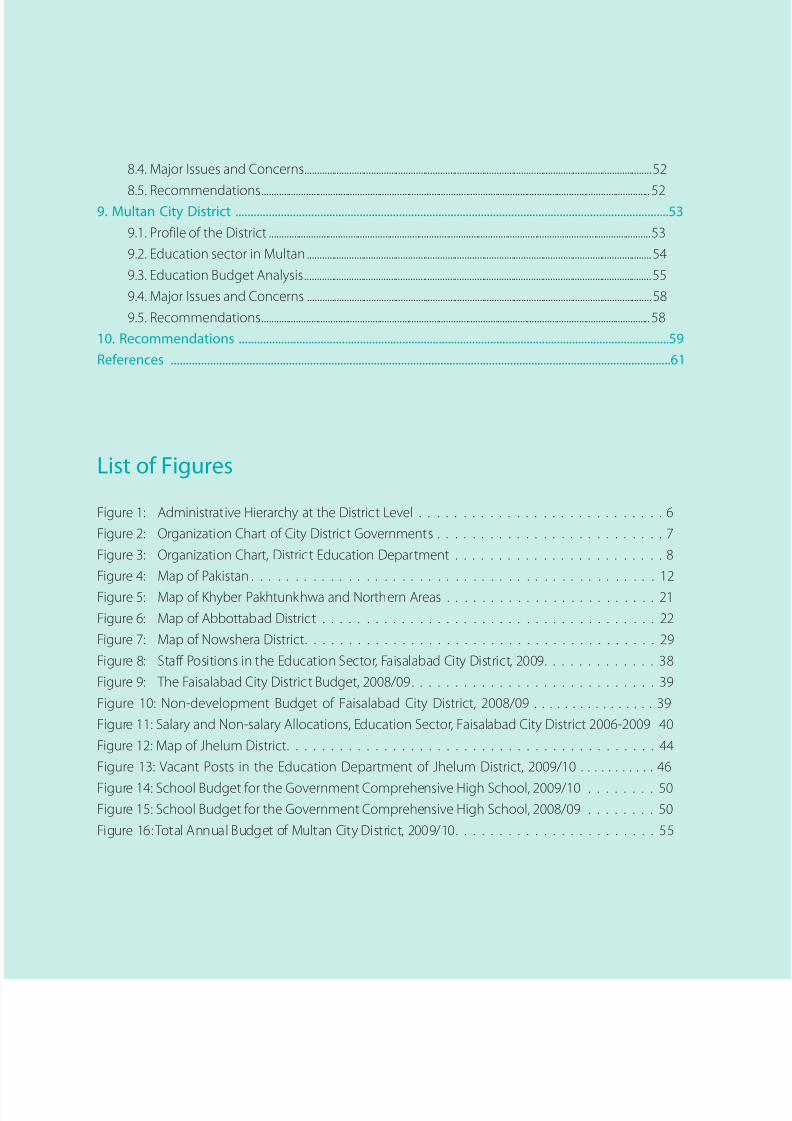
8.5. Recommendations .............................................................................................................................................................. 529. Multan City District ...............................................................................................................................................53
9.1. Profile of the District ...........................................................................................................................................................53
9.2. Education sector in Multan ............................................................................................................................................54
9.3. Education Budget Analysis .............................................................................................................................................55
9.4. Major Issues and Concerns ............................................................................................................................................58
9.5. Recommendations .............................................................................................................................................................. 58
10. Recommendations ..............................................................................................................................................59
References .....................................................................................................................................................................61
List of Figures
Figure 1: Administrative Hierarchy at the District Level . . . . . . . . . . . . . . . . . . . . . . . . . . . . 6
Figure 2: Organization Chart of City District Governments . . . . . . . . . . . . . . . . . . . . . . . . . . 7
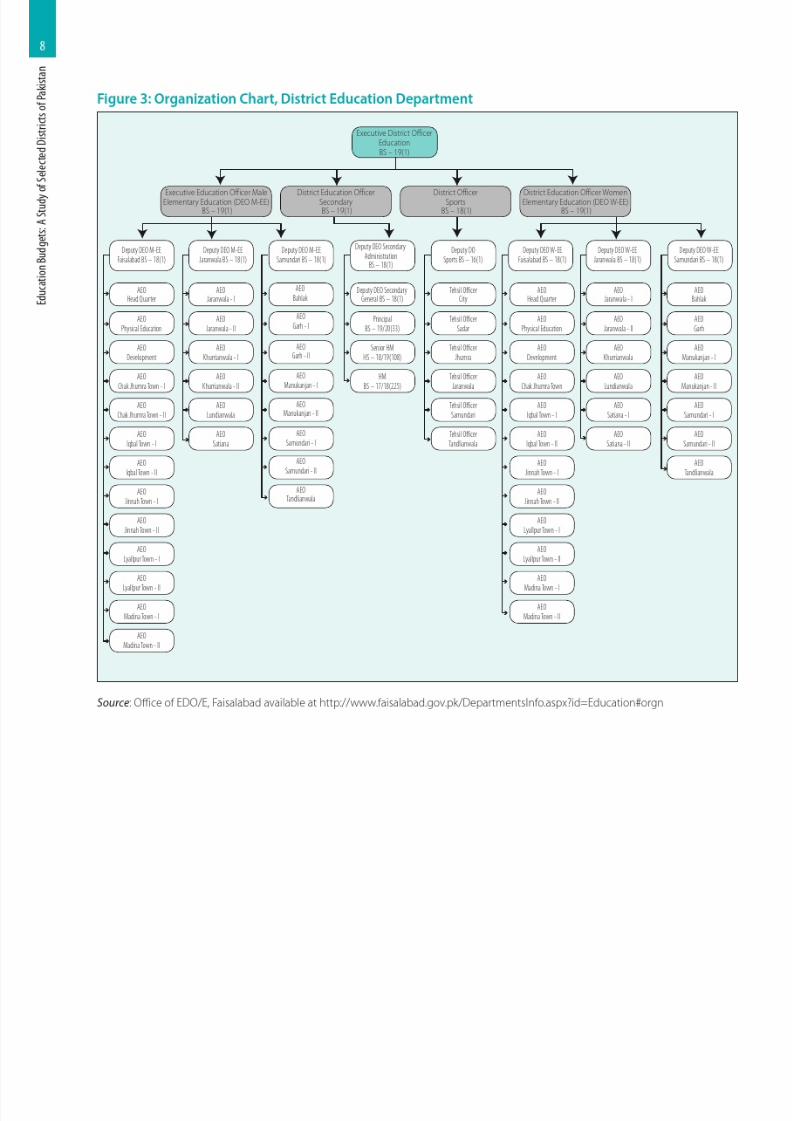
Figure 3: Organization Chart, District Education Department . . . . . . . . . . . . . . . . . . . . . . . . 8
Figure 4: Map of Pakistan . . . . . . . . . . . . . . . . . . . . . . . . . . . . . . . . . . . . . . . . . . . . . . 12
Figure 5: Map of Khyber Pakhtunkhwa and Northern Areas . . . . . . . . . . . . . . . . . . . . . . . . 21
Figure 6: Map of Abbottabad District . . . . . . . . . . . . . . . . . . . . . . . . . . . . . . . . . . . . . . 22
Figure 7: Map of Nowshera District. . . . . . . . . . . . . . . . . . . . . . . . . . . . . . . . . . . . . . . . 29
Figure 8: Staff Positions in the Education Sector, Faisalabad City District, 2009. . . . . . . . . . . . . 38
Figure 9: The Faisalabad City District Budget, 2008/09. . . . . . . . . . . . . . . . . . . . . . . . . . . . 39
Figure 10: Non-development Budget of Faisalabad City District, 2008/09 . . . . . . . . . . . . . . . . 39
Figure 11: Salary and Non-salary Allocations, Education Sector, Faisalabad City District 2006-2009 40
Figure 12: Map of Jhelum District. . . . . . . . . . . . . . . . . . . . . . . . . . . . . . . . . . . . . . . . . . 44
Figure 13: Vacant Posts in the Education Department of Jhelum District, 2009/10 . . . . . . . . . . . 46
Figure 14: School Budget for the Government Comprehensive High School, 2009/10 . . . . . . . . 50
Figure 15: School Budget for the Government Comprehensive High School, 2008/09 . . . . . . . . 50
Figure 16: Total Annual Budget of Multan City District, 2009/10. . . . . . . . . . . . . . . . . . . . . . . 55
8/11/2019 Education Budgets
http://slidepdf.com/reader/full/education-budgets 7/71
viiE x e c u t i v e
S u mm a r y
1 .I n t r o d u c t i o n
2 .T h e B u d g e t M a k i n
g P r o c e s s a n d
D i s
t r i c t M a n a g e m e n t
3 . C o m
p a r a t i v e A n a
l y s i s o f
D i s t r i c t E d u c a t i o n B
u d g e t s
4 .I s l a m a b a d C a p i t a l
T e r r i t o r y
5 .A b b o t t a b a d D i s t r i c
t 6 .N o w s h e r a D i s t r i c t
7 . C i t y D i s t r i c t
F a i s a l a b a d
8 . J h e l u m D i s t r i c t
9 .M u l t a n C i t y
D i s t r i c t
1 0 .R e c o mm e n d a t i o n s
R
e f e r e n c e s
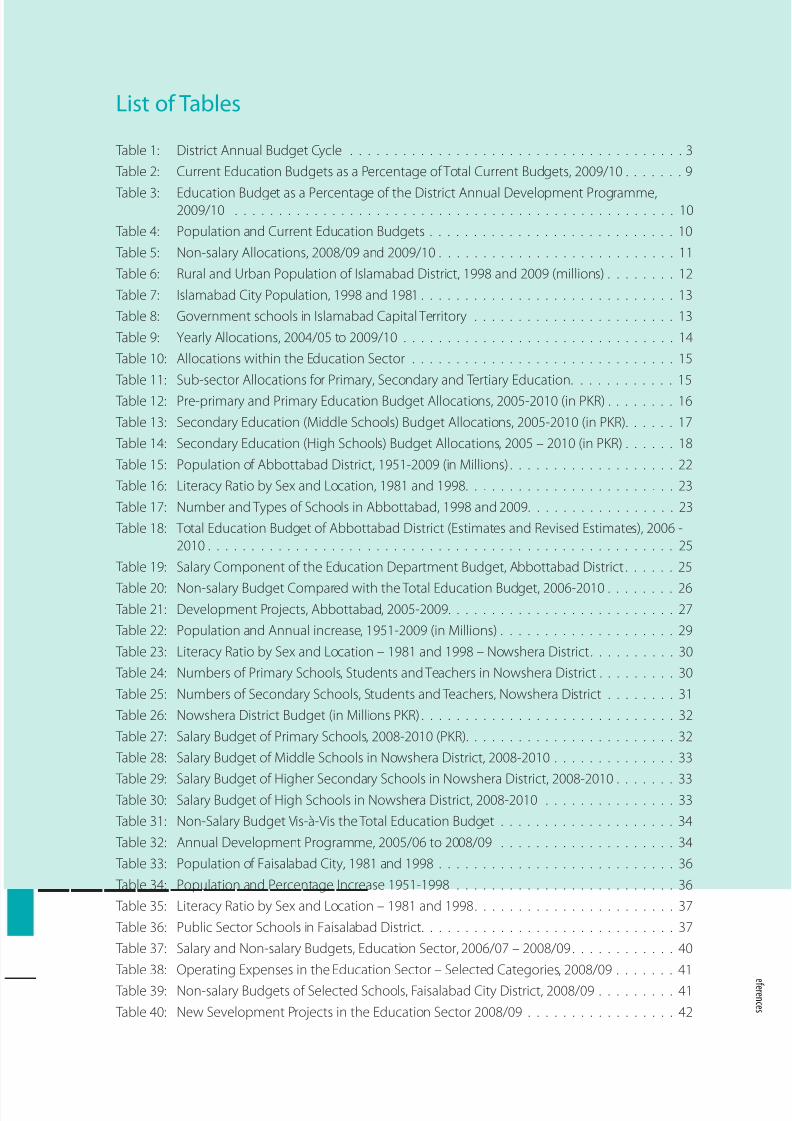
List of Tables
Table 1: District Annual Budget Cycle . . . . . . . . . . . . . . . . . . . . . . . . . . . . . . . . . . . . . . 3
Table 2: Current Education Budgets as a Percentage of Total Current Budgets, 2009/10 . . . . . . . 9
Table 3: Education Budget as a Percentage of the District Annual Development Programme,2009/10 . . . . . . . . . . . . . . . . . . . . . . . . . . . . . . . . . . . . . . . . . . . . . . . . . . 10
Table 4: Population and Current Education Budgets . . . . . . . . . . . . . . . . . . . . . . . . . . . . 10
Table 5: Non-salary Allocations, 2008/09 and 2009/10 . . . . . . . . . . . . . . . . . . . . . . . . . . . 11
Table 6: Rural and Urban Population of Islamabad District, 1998 and 2009 (millions) . . . . . . . . 12
Table 7: Islamabad City Population, 1998 and 1981 . . . . . . . . . . . . . . . . . . . . . . . . . . . . . 13
Table 8: Government schools in Islamabad Capital Territory . . . . . . . . . . . . . . . . . . . . . . . 13
Table 9: Yearly Allocations, 2004/05 to 2009/10 . . . . . . . . . . . . . . . . . . . . . . . . . . . . . . . 14
Table 10: Allocations within the Education Sector . . . . . . . . . . . . . . . . . . . . . . . . . . . . . . 15
Table 11: Sub-sector Allocations for Primary, Secondary and Tertiary Education. . . . . . . . . . . . 15
Table 12: Pre-primary and Primary Education Budget Allocations, 2005-2010 (in PKR) . . . . . . . . 16
Table 13: Secondary Education (Middle Schools) Budget Allocations, 2005-2010 (in PKR). . . . . . 17
Table 14: Secondary Education (High Schools) Budget Allocations, 2005 – 2010 (in PKR) . . . . . . 18
Table 15: Population of Abbottabad District, 1951-2009 (in Millions) . . . . . . . . . . . . . . . . . . . 22
Table 16: Literacy Ratio by Sex and Location, 1981 and 1998. . . . . . . . . . . . . . . . . . . . . . . . 23
Table 17: Number and Types of Schools in Abbottabad, 1998 and 2009. . . . . . . . . . . . . . . . . 23
Table 18: Total Education Budget of Abbottabad District (Estimates and Revised Estimates), 2006 -
2010 . . . . . . . . . . . . . . . . . . . . . . . . . . . . . . . . . . . . . . . . . . . . . . . . . . . . . 25
Table 19: Salary Component of the Education Department Budget, Abbottabad District . . . . . . 25
Table 20: Non-salary Budget Compared with the Total Education Budget, 2006-2010 . . . . . . . . 26 Table 21: Development Projects, Abbottabad, 2005-2009. . . . . . . . . . . . . . . . . . . . . . . . . . 27
Table 22: Population and Annual increase, 1951-2009 (in Millions) . . . . . . . . . . . . . . . . . . . . 29
Table 23: Literacy Ratio by Sex and Location – 1981 and 1998 – Nowshera District. . . . . . . . . . 30
Table 24: Numbers of Primary Schools, Students and Teachers in Nowshera District . . . . . . . . . 30
Table 25: Numbers of Secondary Schools, Students and Teachers, Nowshera District . . . . . . . . 31
Table 26: Nowshera District Budget (in Millions PKR) . . . . . . . . . . . . . . . . . . . . . . . . . . . . . 32
Table 27: Salary Budget of Primary Schools, 2008-2010 (PKR). . . . . . . . . . . . . . . . . . . . . . . . 32
Table 28: Salary Budget of Middle Schools in Nowshera District, 2008-2010 . . . . . . . . . . . . . . 33
Table 29: Salary Budget of Higher Secondary Schools in Nowshera District, 2008-2010 . . . . . . . 33 Table 30: Salary Budget of High Schools in Nowshera District, 2008-2010 . . . . . . . . . . . . . . . 33
Table 31: Non-Salary Budget Vis-à-Vis the Total Education Budget . . . . . . . . . . . . . . . . . . . . 34
Table 32: Annual Development Programme, 2005/06 to 2008/09 . . . . . . . . . . . . . . . . . . . . 34
Table 33: Population of Faisalabad City, 1981 and 1998 . . . . . . . . . . . . . . . . . . . . . . . . . . . 36
Table 34: Population and Percentage Increase 1951-1998 . . . . . . . . . . . . . . . . . . . . . . . . . 36
Table 35: Literacy Ratio by Sex and Location – 1981 and 1998. . . . . . . . . . . . . . . . . . . . . . . 37
Table 36: Public Sector Schools in Faisalabad District. . . . . . . . . . . . . . . . . . . . . . . . . . . . . 37
Table 37: Salary and Non-salary Budgets, Education Sector, 2006/07 – 2008/09 . . . . . . . . . . . . 40
Table 38: Operating Expenses in the Education Sector – Selected Categories, 2008/09 . . . . . . . 41
Table 39: Non-salary Budgets of Selected Schools, Faisalabad City District, 2008/09 . . . . . . . . . 41
Table 40: New Sevelopment Projects in the Education Sector 2008/09 . . . . . . . . . . . . . . . . . 42
8/11/2019 Education Budgets
http://slidepdf.com/reader/full/education-budgets 8/71
E d u c a t i o n
B u d g e t s : A
S t u d y
o f S e l e c t e d
D i s t r i c t s o f P a k i s t a n
viii
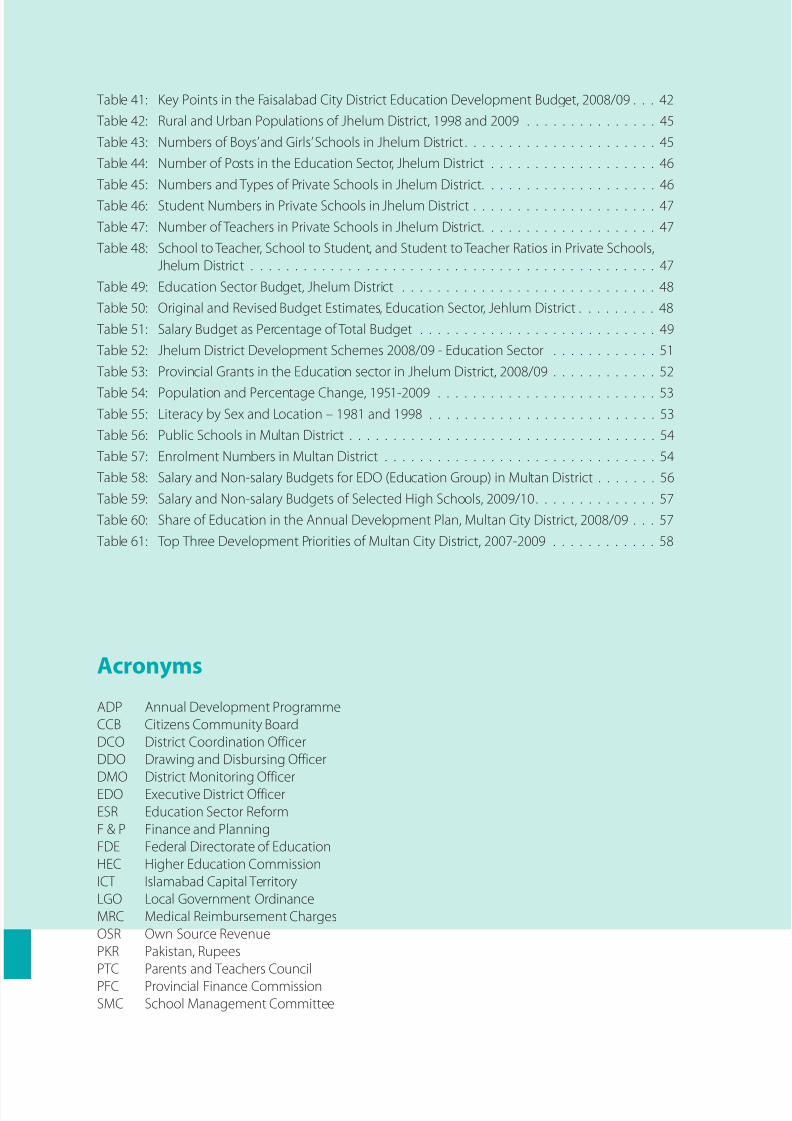
Acronyms
ADP Annual Development Programme
CCB Citizens Community Board
DCO District Coordination Officer
DDO Drawing and Disbursing Officer
DMO District Monitoring Officer
EDO Executive District Officer
ESR Education Sector Reform
F & P Finance and Planning
FDE Federal Directorate of Education
HEC Higher Education Commission
ICT Islamabad Capital Territory
LGO Local Government Ordinance
MRC Medical Reimbursement Charges
OSR Own Source Revenue
PKR Pakistan, Rupees
PTC Parents and Teachers Council
PFC Provincial Finance CommissionSMC School Management Committee
Table 41: Key Points in the Faisalabad City District Education Development Budget, 2008/09 . . . 42
Table 42: Rural and Urban Populations of Jhelum District, 1998 and 2009 . . . . . . . . . . . . . . . 45
Table 43: Numbers of Boys’ and Girls’ Schools in Jhelum District . . . . . . . . . . . . . . . . . . . . . . 45
Table 44: Number of Posts in the Education Sector, Jhelum District . . . . . . . . . . . . . . . . . . . 46
Table 45: Numbers and Types of Private Schools in Jhelum District. . . . . . . . . . . . . . . . . . . . 46
Table 46: Student Numbers in Private Schools in Jhelum District . . . . . . . . . . . . . . . . . . . . . 47
Table 47: Number of Teachers in Private Schools in Jhelum District. . . . . . . . . . . . . . . . . . . . 47
Table 48: School to Teacher, School to Student, and Student to Teacher Ratios in Private Schools,
Jhelum District . . . . . . . . . . . . . . . . . . . . . . . . . . . . . . . . . . . . . . . . . . . . . . 47
Table 49: Education Sector Budget, Jhelum District . . . . . . . . . . . . . . . . . . . . . . . . . . . . . 48
Table 50: Original and Revised Budget Estimates, Education Sector, Jehlum District . . . . . . . . . 48
Table 51: Salary Budget as Percentage of Total Budget . . . . . . . . . . . . . . . . . . . . . . . . . . . 49
Table 52: Jhelum District Development Schemes 2008/09 - Education Sector . . . . . . . . . . . . 51
Table 53: Provincial Grants in the Education sector in Jhelum District, 2008/09 . . . . . . . . . . . . 52
Table 54: Population and Percentage Change, 1951-2009 . . . . . . . . . . . . . . . . . . . . . . . . . 53 Table 55: Literacy by Sex and Location – 1981 and 1998 . . . . . . . . . . . . . . . . . . . . . . . . . . 53
Table 56: Public Schools in Multan District . . . . . . . . . . . . . . . . . . . . . . . . . . . . . . . . . . . 54
Table 57: Enrolment Numbers in Multan District . . . . . . . . . . . . . . . . . . . . . . . . . . . . . . . 54
Table 58: Salary and Non-salary Budgets for EDO (Education Group) in Multan District . . . . . . . 56
Table 59: Salary and Non-salary Budgets of Selected High Schools, 2009/10. . . . . . . . . . . . . . 57
Table 60: Share of Education in the Annual Development Plan, Multan City District, 2008/09 . . . 57
Table 61: Top Three Development Priorities of Multan City District, 2007-2009 . . . . . . . . . . . . 58

8/11/2019 Education Budgets
http://slidepdf.com/reader/full/education-budgets 9/71
8/11/2019 Education Budgets
http://slidepdf.com/reader/full/education-budgets 10/71
1E x e c u t i v e
S u mm a r y
1 .I n t r o d u c t i o n
2 .T h e B u d g e t M a k i n
g P r o c e s s a n d
D i s
t r i c t M a n a g e m e n t
3 . C o m
p a r a t i v e A n a
l y s i s o f
D i s t r i c t E d u c a t i o n B
u d g e t s
4 .I s l a m a b a d C a p i t a l
T e r r i t o r y
5 .A b b o t t a b a d D i s t r i c
t 6 .N o w s h e r a D i s t r i c t
7 . C i t y D i s t r i c t
F a i s a l a b a d
8 . J h e l u m D i s t r i c t
9 .M u l t a n C i t y
D i s t r i c t
1 0 .R e c o mm e n d a t i o n s
R
e f e r e n c e s
Executive Summary
This report presents the findings of a study of the education budgets of selected districts of Pakistan.
The purpose of the study was to probe into the practices of budget allocation, priorities, utilization and
people’s participation in the preparation of education budgets. This was the first study of its kind, and
was carried out by the Centre for Peace and Development Initiatives (CPDI) with the support of UNESCO.
This report furnishes details of the annual education budget making process, and its implementation
and effectiveness in selected districts. The report also provides individual and comparative analyses of
the education budgets in selected districts, in view of their total population and their developmental
requirements.
The study examined six districts: Islamabad Capital Territory (ICT ); Abbottabad District and Nowshera
District in Khyber-Pakhtunkhwa Province; and Faisalabad City District, Jhelum District and Multan City
District in Punjab Province.
Information for the study was collected through interviews and from secondary sources, including
relevant documents for budget making and annual budget books.
The study found that many flaws occur in the budget making process and the process is neither open
nor participatory. Local Government Ordinance (LGO) of 2001 and the Budget Rules of 2003 provide for
public consultations, presentation of the draft budget in the Council and effective input by stakeholders,
but such provisions are not followed in most of the districts studied. The process is dominated almost
exclusively by government staff (Deputy District Officers for Education), and the views of teachers,
parents, students and communities regarding needs and priorities are not taken into consideration
at any stage of the process. Civil society is not consulted and the budget making process is treated
as a confidential process. Furthermore, development priorities are not determined in an informed,
transparent or fair manner. The Budget Calendar, as provided in the Budget Rules of 2003, is not followed
and therefore does not ensure efficiency and public participation in the budgeting process. The budget
making process starts very late and the process is not completed in time.Across the districts, the budget allocations for the education sector are uneven and inadequate. Although
there has been an increase every year in the education budget in some districts, the budget increase
is minimal in real terms when Pakistan’s double digit inflation rate is taken into consideration. Given
the importance of teachers’ salaries, salary related expenses make up the majority of the education
budget. This leaves few funds for non-salary expenses (e.g. maintenance utilities, etc), however, which
are important for the smooth functioning of educational institutions. Furthermore, access to non-salary
funds is complicated.
In addition, spending on education tends to be biased in favour of education of males. In general, there
are more boys’ schools than girls’ schools in the surveyed districts, and boys’ schools consume more of
the education budget than girls’ schools.Other major challenges identified include limited education staff and low capacity, premature transfers
of concerned staff, political pressure on the budgeting process and over-dependence on provincial
governments.
This report recommends fair, equitable and needs-based allocation of education budgets. The Budget
Calendar should be strictly followed by the district governments. In particular, the provisions relating
to stakeholder consultations, timely completion of proposals, technical sanctions and presentations of
draft budgets should be adhered to. The overall budget for the education sector should be increased
and it is recommended that efforts be made to improve the condition of schools by providing adequate
facilities and support. Furthermore, non-salary allocations need to be increased significantly so that the
schools can cover their operating expenses. It is also necessary to make access to the funds for schoolssimpler and transparent. In addition, it is recommended that greater provisions be made for girls’ schools
and that the disparity in the numbers of educational institutions for boys and girls be reduced.
8/11/2019 Education Budgets
http://slidepdf.com/reader/full/education-budgets 11/71
E d u c a t i o n
B u d g e t s : A
S t u d y
o f S e l e c t e d
D i s t r i c t s o f P a k i s t a n
2
1. Introduction
Effective education sector budgeting is crucial for ensuring a high quality of education and for
improving the literacy rate. This study examines the education budgets in six districts of Pakistan:
Islamabad Capital Territory, Abbottabad District, Nowshera District, Faisalabad City District, Jhelum
District and Multan City District. This report provides a comparison and analysis of district education
budgets vis-à-vis the total budget allocation for the education sector and examines compliance with
the budget rules and calendar, gender and regional perspectives and implementation of the allocated
budget.
1.1 Objectives of the Study
The study aimed to understand various trends in terms of education budget allocations, priorities,
utilization and stakeholder participation in the budgeting process. It was expected that this study
would provide useful data and would highlight the trends related to resource allocation for the
education sector.
The specific objectives of the study were as follows:
… To review the budget making process for the education sector and assess whether it is effective and
how it can be improved.
… To analyze the budget documents relating to the education sector, especially in terms of allocations
and priorities, and gender and regional perspectives.
… To examine the implementation of education sector budget, especially the problem of low utilization,
and to analyze the roles of relevant institutions.
… To identify weaknesses and gaps at various stages of the budget cycle in relation to relevant procedures
or responsible organizations, and to make appropriate recommendations for improvement.
1.2 Method
The study utilized both primary and secondary sources of information. The primary sources of
information were interviews with key stakeholders. Interviewees included district education and
finance officers, teachers and head teachers of public schools and parents. The secondary sources
consisted of district budget books, budget-related laws and rules for the districts, and other related
documents.
2. The Budget Making Process and District Management2.1 The Budget Making Process
The management of financial resources available to the district governments and their further
allocation and re-allocation is the responsibility of the Finance and Planning Department. For the
education sector, budget preparation and related activities are jointly administered by the Elementary
and Secondary Education Department and the Finance and Planning Department.
The budget making process generally involves steps for preparing estimates for revenue generation
as well as for preparing expected expenditures.
8/11/2019 Education Budgets
http://slidepdf.com/reader/full/education-budgets 12/71
3E x e c u t i v e
S u mm a r y
1 .I n t r o d u c t i o n
2 .T h e B u d g e t M a k i n
g P r o c e s s a n d
D i s
t r i c t M a n a g e m e n t
3 . C o m
p a r a t i v e A n a
l y s i s o f
D i s t r i c t E d u c a t i o n B
u d g e t s
4 .I s l a m a b a d C a p i t a l
T e r r i t o r y
5 .A b b o t t a b a d D i s t r i c
t 6 .N o w s h e r a D i s t r i c t
7 . C i t y D i s t r i c t
F a i s a l a b a d
8 . J h e l u m D i s t r i c t
9 .M u l t a n C i t y
D i s t r i c t
1 0 .R e c o mm e n d a t i o n s
R
e f e r e n c e s
Definition: A Budget
Conventionally, a budget is a financial report containing estimates of income and expenses or
a plan for coordinating resource generation and utilization. In other words, it is a financial plan
incorporating receipts (cash in-flow) and outlays (cash out-flow) in a fiscal period (two years, one
year, six months or three months).
The budget rules of the provinces of Punjab and Khyber-Pakhtunkhwa provinces provide a detailed
procedure and calendar for preparing annual budgets. According to the rules, the district governments
must prepare the draft budget by the end of March, and should then discuss and debate the draft
in the District Council and refine it in the light of feedback received from various stakeholders. The
budget must be approved before the end of the month of June.1
The budget-making process for all districts in Punjab Province is governed by the Punjab District
Government and Tehsil Municipal Administration Budget Rules 2003. Under these Rules, Budget
Call Letters should be issued by the EDO Finance and Planning in September. All department heads,
including the education department, are required to submit the first draft of their department budget
till the end of December, including estimates for both current and development expenditures.Subsequently, the proposed development projects should then be referred to the District Development
Committee for consideration. In the meantime, Citizen Community Boards (CCBs) are expected to
develop proposals for development projects in their respective communities. These proposals should
then be submitted to the district government through the relevant department heads, who evaluate
the technical feasibility of the proposal. In March, the EDO Finance and Planning should compile the
full departmental budgets, request justifications for any increase in spending, and obtain approval
from the Development Committee for the proposed projects. The district nazim should then submit
the draft budget to the council in April. The council is expected to enact the annual budget before the
end of June. The process is very similar in Khyber-Pakhtunkhwa Province.
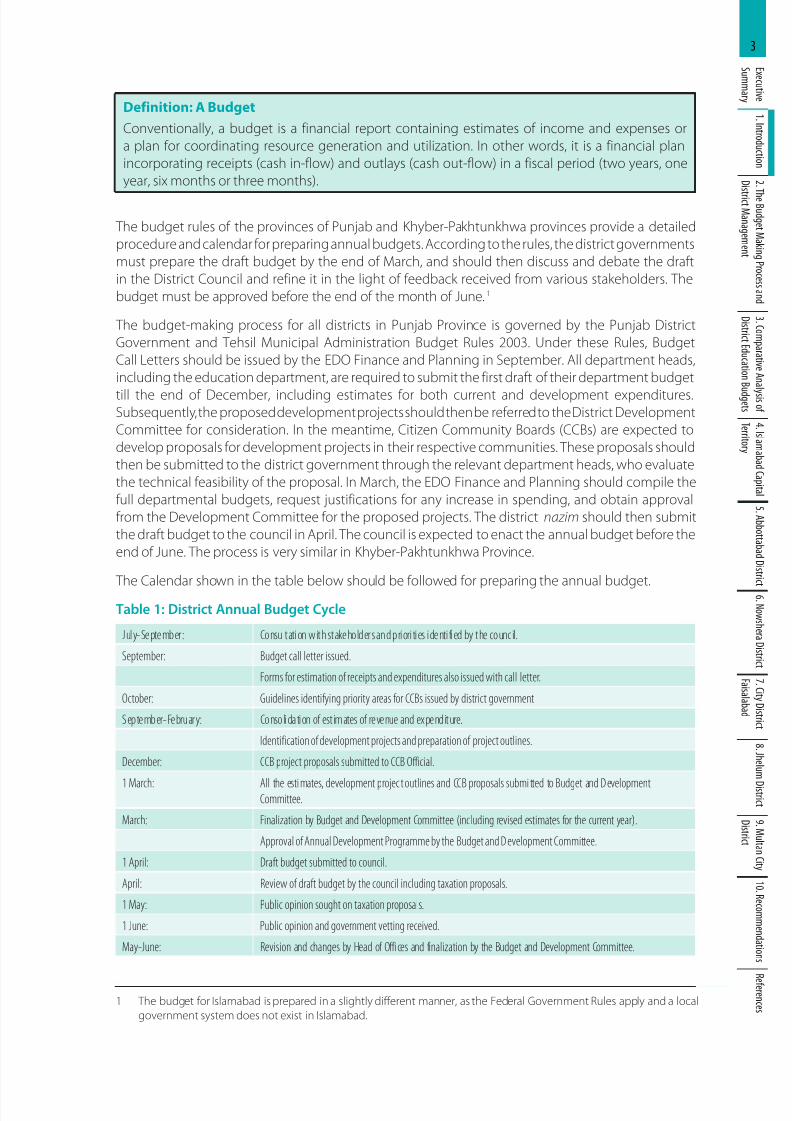
The Calendar shown in the table below should be followed for preparing the annual budget.
Table 1: District Annual Budget Cycle
July-September: Consultation with stakeholders and priorities identified by the council.
September: Budget call letter issued.
Forms for estimation of receipts and expenditures also issued with call letter.
October: Guidelines identifying priority areas for CCBs issued by district government
September-February: Consolidation of est imates of revenue and expenditure.
Identification of development projects and preparation of project outlines.
December: CCB project proposals submitted to CCB Official.
1 March: All the estimates, development projec t outlines and CCB proposals submitted to Budget and D evelopmentCommittee.
March: Finalization by Budget and Development Committee (including revised estimates for the current year).
Approval of Annual Development Programme by the Budget and D evelopment Committee.
1 April: Draft budget submitted to council.
April: Review of draft budget by the council including taxation proposals.
1 May: Public opinion sought on taxation proposals.
1 June: Public opinion and government vetting received.
May-June: Revision and changes by Head of Offi ces and finalization by the Budget and Development Committee.
1 The budget for Islamabad is prepared in a slightly different manner, as the Federal Government Rules apply and a local
government system does not exist in Islamabad.
8/11/2019 Education Budgets
http://slidepdf.com/reader/full/education-budgets 13/71
E d u c a t i o n
B u d g e t s : A
S t u d y
o f S e l e c t e d
D i s t r i c t s o f P a k i s t a n
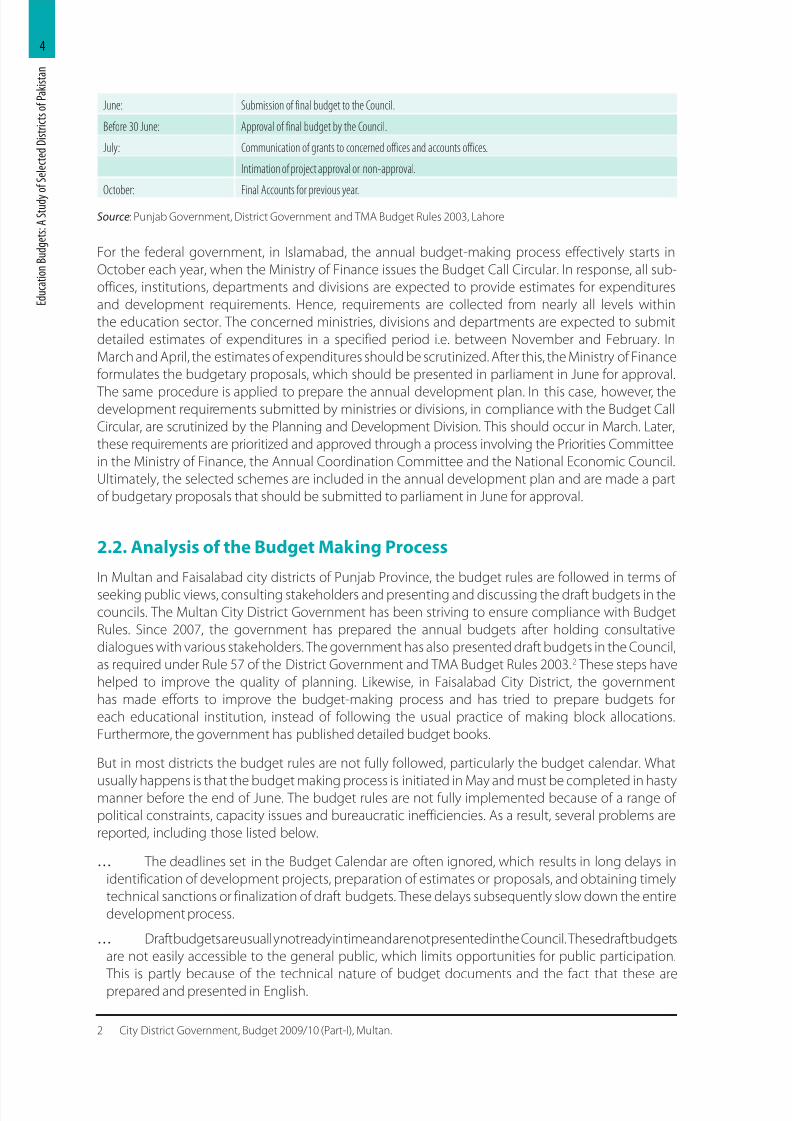
4
June: Submission of final budget to the Council.
Before 30 June: Approval of final budget by the Council.
July: Communication of grants to concerned offices and accounts offices.
Intimation of project approval or non-approval.
October: Final Accounts for previous year.Source: Punjab Government, District Government and TMA Budget Rules 2003, Lahore
For the federal government, in Islamabad, the annual budget-making process effectively starts in
October each year, when the Ministry of Finance issues the Budget Call Circular. In response, all sub-
offices, institutions, departments and divisions are expected to provide estimates for expenditures
and development requirements. Hence, requirements are collected from nearly all levels within
the education sector. The concerned ministries, divisions and departments are expected to submit
detailed estimates of expenditures in a specified period i.e. between November and February. In
March and April, the estimates of expenditures should be scrutinized. After this, the Ministry of Finance
formulates the budgetary proposals, which should be presented in parliament in June for approval.
The same procedure is applied to prepare the annual development plan. In this case, however, thedevelopment requirements submitted by ministries or divisions, in compliance with the Budget Call
Circular, are scrutinized by the Planning and Development Division. This should occur in March. Later,
these requirements are prioritized and approved through a process involving the Priorities Committee
in the Ministry of Finance, the Annual Coordination Committee and the National Economic Council.
Ultimately, the selected schemes are included in the annual development plan and are made a part
of budgetary proposals that should be submitted to parliament in June for approval.
2.2. Analysis of the Budget Making Process
In Multan and Faisalabad city districts of Punjab Province, the budget rules are followed in terms of
seeking public views, consulting stakeholders and presenting and discussing the draft budgets in thecouncils. The Multan City District Government has been striving to ensure compliance with Budget
Rules. Since 2007, the government has prepared the annual budgets after holding consultative
dialogues with various stakeholders. The government has also presented draft budgets in the Council,
as required under Rule 57 of the District Government and TMA Budget Rules 2003.2 These steps have
helped to improve the quality of planning. Likewise, in Faisalabad City District, the government
has made efforts to improve the budget-making process and has tried to prepare budgets for
each educational institution, instead of following the usual practice of making block allocations.
Furthermore, the government has published detailed budget books.
But in most districts the budget rules are not fully followed, particularly the budget calendar. What
usually happens is that the budget making process is initiated in May and must be completed in hastymanner before the end of June. The budget rules are not fully implemented because of a range of
political constraints, capacity issues and bureaucratic inefficiencies. As a result, several problems are
reported, including those listed below.
… The deadlines set in the Budget Calendar are often ignored, which results in long delays in
identification of development projects, preparation of estimates or proposals, and obtaining timely
technical sanctions or finalization of draft budgets. These delays subsequently slow down the entire
development process.
… Draft budgets are usually not ready in time and are not presented in the Council. These draft budgets
are not easily accessible to the general public, which limits opportunities for public participation.
This is partly because of the technical nature of budget documents and the fact that these are
prepared and presented in English.
2 City District Government, Budget 2009/10 (Part-I), Multan.
8/11/2019 Education Budgets
http://slidepdf.com/reader/full/education-budgets 14/71
5E x e c u t i v e
S u mm a r y
1 .I n t r o d u c t i o n
2 .T h e B u d g e t M a k i n
g P r o c e s s a n d
D i s
t r i c t M a n a g e m e n t
3 . C o m
p a r a t i v e A n a
l y s i s o f
D i s t r i c t E d u c a t i o n B
u d g e t s
4 .I s l a m a b a d C a p i t a l
T e r r i t o r y
5 .A b b o t t a b a d D i s t r i c
t 6 .N o w s h e r a D i s t r i c t
7 . C i t y D i s t r i c t
F a i s a l a b a d
8 . J h e l u m D i s t r i c t
9 .M u l t a n C i t y
D i s t r i c t
1 0 .R e c o mm e n d a t i o n s
R
e f e r e n c e s
… Stakeholders are not fully and effectively consulted in the process of identifying and prioritizing new
development projects. Usually councillors submit the development schemes, which may be based
on unjust favour or prejudice for a community, thus highlighting the priorities of one community
and neglecting the other.
… Development funds are distributed among various Union Councils and, since the available funds are
limited, very small projects can be implemented that sometimes require several years to complete. This impedes the smooth flow of Planning and Developments projects and prevents projects being
accomplished within the defined time frame.
The process in Islamabad also has a number of drawbacks that require the attention of relevant
authorities. The drawbacks are described below.
… The Budget Call Circular does not necessarily reach the lowest levels (i.e. primary and middle schools)
and, hence, the lowest level bodies do not always get an opportunity to identify their needs.
As per the procedure, the Budget Call Circular is only sent to relevant drawing and disbursing officers,
who are senior level officers and responsible for several sub-offices or schools. Usually the Budget
Call Circulars are not taken seriously and are dispatched quickly. The officers rarely consult the sub-
offices or schools under their jurisdiction before sending up information about the needs.
… Non-official stakeholders are not consulted at all.
Although parents, teachers, students and members of the communities are direct stakeholders,
and their views must be heard and weighed in the course of assessing problems and needs for
the annual budget, the formal procedure for budget making does not include any provision for
consulting with non-official stakeholders, nor do the relevant authorities consult these stakeholders
informally.
… The parliament and its committees are not involved in the process of identifying or prioritizing the
needs and developing budgetary proposals. The parliament has very short time (10 to 15 days), for
examining, analyzing and approving the whole annual budget.
The steps from the issuance of the Budget Call Circular to the formulation of budgetary proposals
exclude the elected leaders and members of the Parliament. It is only in June that the budgetary
proposals are presented before the parliament for formal approval, when changes are unlikely.
The role of elected representatives in budget making and approval is nominal, leaving too much
discretion with the executive branch, which has little or no appreciation of the needs and demands
expressed by communities.
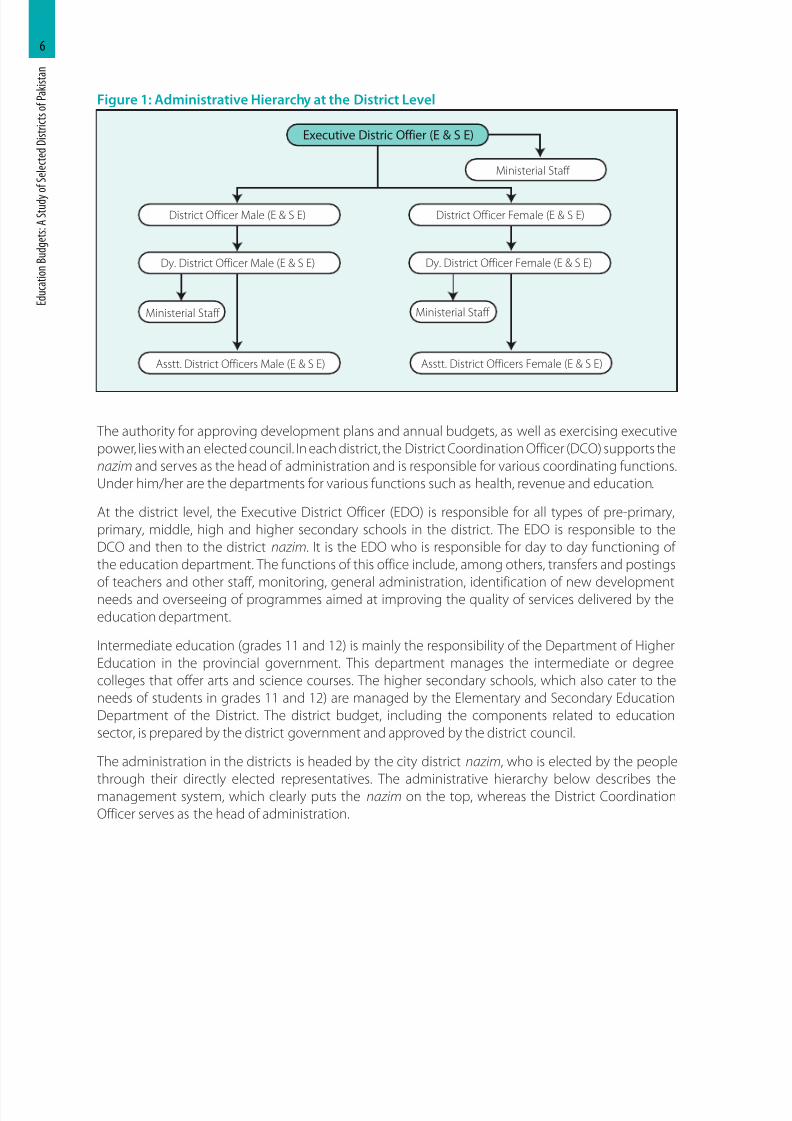
2.3. District Responsibility and Management
In Khyber-Pakhtunkhwa Province, Local Government Ordinance 2001 assigned the responsibility for
elementary and secondary education to the district governments. Likewise, in Punjab Province, themanagement and development planning of primary and secondary education has been assigned to
the districts (under the Punjab Local Government Ordinance 2001).
Each district government is headed by an elected district nazim, who is responsible for overseeing
and managing the administrative, planning and service delivery functions.
The figure below illustrates the administrative structure of the education department at the district
level.
8/11/2019 Education Budgets
http://slidepdf.com/reader/full/education-budgets 15/71
8/11/2019 Education Budgets
http://slidepdf.com/reader/full/education-budgets 16/71
7E x e c u t i v e
S u mm a r y
1 .I n t r o d u c t i o n
2 .T h e B u d g e t M a k i n
g P r o c e s s a n d
D i s
t r i c t M a n a g e m e n t
3 . C o m
p a r a t i v e A n a
l y s i s o f
D i s t r i c t E d u c a t i o n B
u d g e t s
4 .I s l a m a b a d C a p i t a l
T e r r i t o r y
5 .A b b o t t a b a d D i s t r i c
t 6 .N o w s h e r a D i s t r i c t
7 . C i t y D i s t r i c t
F a i s a l a b a d
8 . J h e l u m D i s t r i c t
9 .M u l t a n C i t y
D i s t r i c t
1 0 .R e c o mm e n d a t i o n s
R
e f e r e n c e s
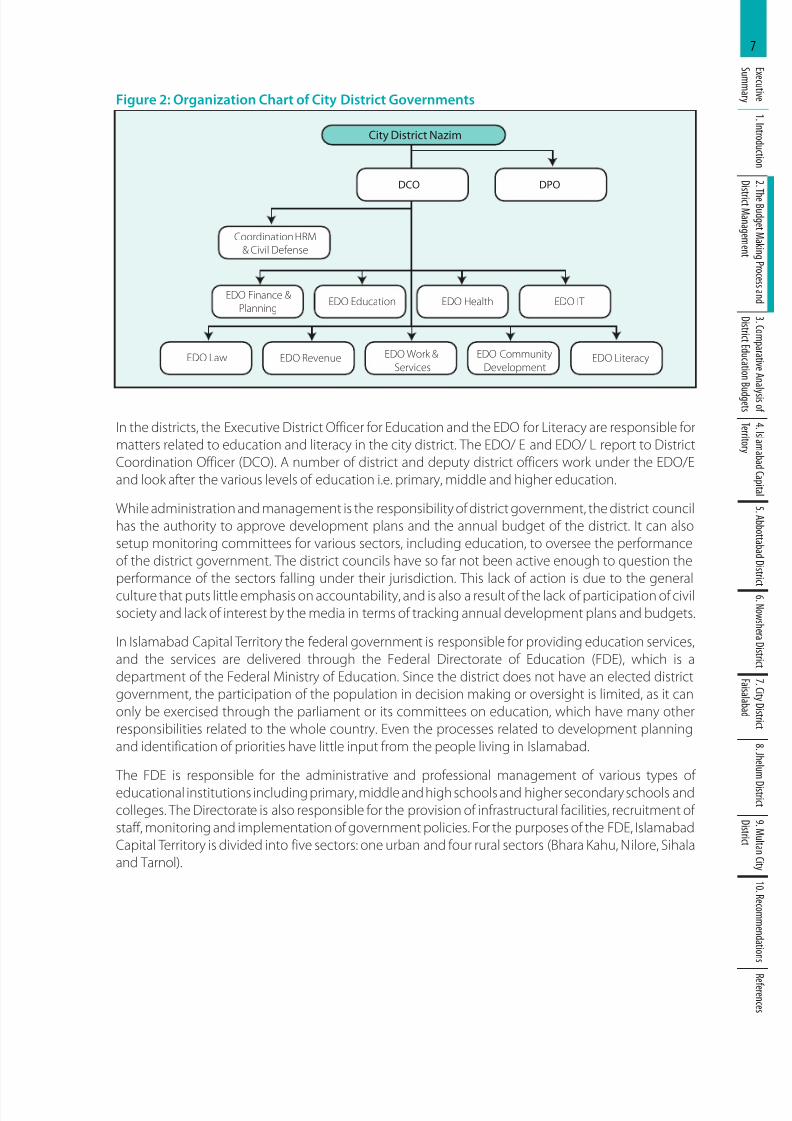
Figure 2: Organization Chart of City District Governments
City District Nazim
DPO
Coordination HRM& Civil Defense
EDO Finance &Planning
DCO
EDO Education EDO Health EDO IT
EDO Law EDO Revenue EDO Work &
Services
EDO Community
DevelopmentEDO Literacy
In the districts, the Executive District Officer for Education and the EDO for Literacy are responsible for
matters related to education and literacy in the city district. The EDO/ E and EDO/ L report to District
Coordination Officer (DCO). A number of district and deputy district officers work under the EDO/E
and look after the various levels of education i.e. primary, middle and higher education.
While administration and management is the responsibility of district government, the district council
has the authority to approve development plans and the annual budget of the district. It can also
setup monitoring committees for various sectors, including education, to oversee the performance
of the district government. The district councils have so far not been active enough to question the
performance of the sectors falling under their jurisdiction. This lack of action is due to the general
culture that puts little emphasis on accountability, and is also a result of the lack of participation of civil
society and lack of interest by the media in terms of tracking annual development plans and budgets.
In Islamabad Capital Territory the federal government is responsible for providing education services,
and the services are delivered through the Federal Directorate of Education (FDE), which is a
department of the Federal Ministry of Education. Since the district does not have an elected district
government, the participation of the population in decision making or oversight is limited, as it can
only be exercised through the parliament or its committees on education, which have many other
responsibilities related to the whole country. Even the processes related to development planning
and identification of priorities have little input from the people living in Islamabad.
The FDE is responsible for the administrative and professional management of various types of
educational institutions including primary, middle and high schools and higher secondary schools and
colleges. The Directorate is also responsible for the provision of infrastructural facilities, recruitment of
staff, monitoring and implementation of government policies. For the purposes of the FDE, Islamabad
Capital Territory is divided into five sectors: one urban and four rural sectors (Bhara Kahu, Nilore, Sihala
and Tarnol).
8/11/2019 Education Budgets
http://slidepdf.com/reader/full/education-budgets 17/71
8/11/2019 Education Budgets
http://slidepdf.com/reader/full/education-budgets 18/71
9E x e c u t i v e
S u mm a r y
1 .I n t r o d u c t i o n
2 .T h e B u d g e t M a k i n
g P r o c e s s a n d
D i s
t r i c t M a n a g e m e n t
3 . C o m
p a r a t i v e A n a
l y s i s o f
D i s t r i c t E d u c a t i o n B
u d g e t s
4 .I s l a m a b a d C a p i t a l
T e r r i t o r y
5 .A b b o t t a b a d D i s t r i c
t 6 .N o w s h e r a D i s t r i c t
7 . C i t y D i s t r i c t
F a i s a l a b a d
8 . J h e l u m D i s t r i c t
9 .M u l t a n C i t y
D i s t r i c t
1 0 .R e c o mm e n d a t i o n s
R
e f e r e n c e s
3. Comparative Analysis of District Education Budgets
3.1 District Education Budgets
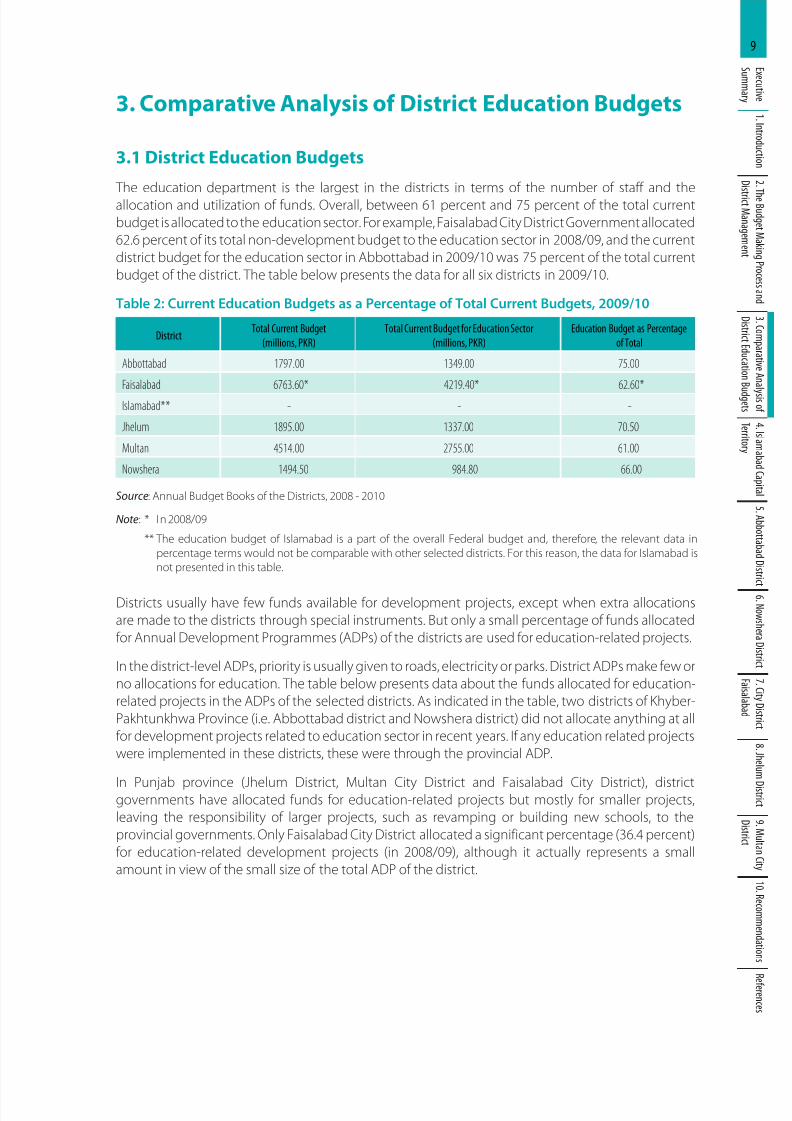
The education department is the largest in the districts in terms of the number of staff and the
allocation and utilization of funds. Overall, between 61 percent and 75 percent of the total current
budget is allocated to the education sector. For example, Faisalabad City District Government allocated
62.6 percent of its total non-development budget to the education sector in 2008/09, and the current
district budget for the education sector in Abbottabad in 2009/10 was 75 percent of the total current
budget of the district. The table below presents the data for all six districts in 2009/10.
Table 2: Current Education Budgets as a Percentage of Total Current Budgets, 2009/10
DistrictTotal Current Budget
(millions, PKR)
Total Current Budget for Education Sector
(millions, PKR)
Education Budget as Percentage
of Total
Abbottabad 1797.00 1349.00 75.00
Faisalabad 6763.60* 4219.40* 62.60*
Islamabad** - - -
Jhelum 1895.00 1337.00 70.50
Multan 4514.00 2755.00 61.00
Nowshera 1494.50 984.80 66.00
Source: Annual Budget Books of the Districts, 2008 - 2010
Note: * In 2008/09
** The education budget of Islamabad is a part of the overall Federal budget and, therefore, the relevant data in
percentage terms would not be comparable with other selected districts. For this reason, the data for Islamabad isnot presented in this table.
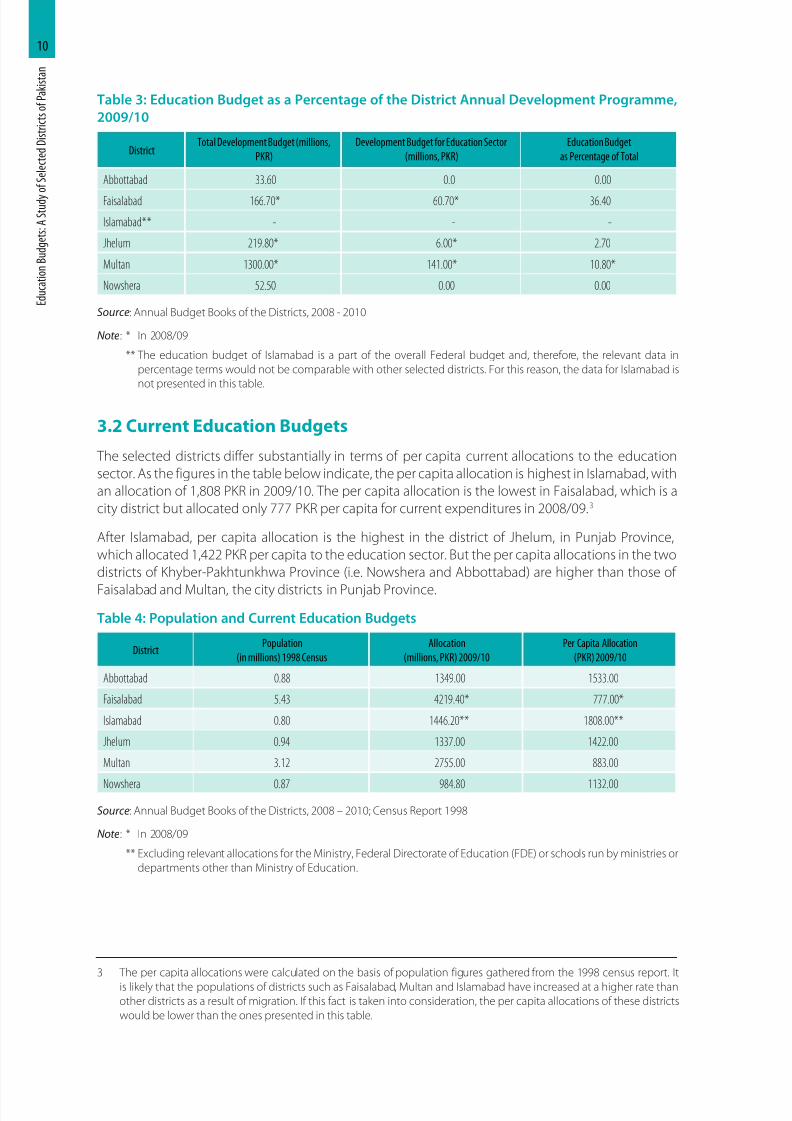
Districts usually have few funds available for development projects, except when extra allocations
are made to the districts through special instruments. But only a small percentage of funds allocated
for Annual Development Programmes (ADPs) of the districts are used for education-related projects.
In the district-level ADPs, priority is usually given to roads, electricity or parks. District ADPs make few or
no allocations for education. The table below presents data about the funds allocated for education-
related projects in the ADPs of the selected districts. As indicated in the table, two districts of Khyber-
Pakhtunkhwa Province (i.e. Abbottabad district and Nowshera district) did not allocate anything at all
for development projects related to education sector in recent years. If any education related projects
were implemented in these districts, these were through the provincial ADP.
In Punjab province (Jhelum District, Multan City District and Faisalabad City District), districtgovernments have allocated funds for education-related projects but mostly for smaller projects,
leaving the responsibility of larger projects, such as revamping or building new schools, to the
provincial governments. Only Faisalabad City District allocated a significant percentage (36.4 percent)
for education-related development projects (in 2008/09), although it actually represents a small
amount in view of the small size of the total ADP of the district.
8/11/2019 Education Budgets
http://slidepdf.com/reader/full/education-budgets 19/71
E d u c a t i o n
B u d g e t s : A
S t u d y
o f S e l e c t e d
D i s t r i c t s o f P a k i s t a n
10
Table 3: Education Budget as a Percentage of the District Annual Development Programme,
2009/10
DistrictTotal Development Budget (millions,
PKR)
Development Budget for Education Sector
(millions, PKR)
Education Budget
as Percentage of Total
Abbottabad 33.60 0.0 0.00
Faisalabad 166.70* 60.70* 36.40
Islamabad** - - -
Jhelum 219.80* 6.00* 2.70
Multan 1300.00* 141.00* 10.80*
Nowshera 52.50 0.00 0.00
Source: Annual Budget Books of the Districts, 2008 - 2010
Note: * In 2008/09
** The education budget of Islamabad is a part of the overall Federal budget and, therefore, the relevant data in
percentage terms would not be comparable with other selected districts. For this reason, the data for Islamabad isnot presented in this table.
3.2 Current Education Budgets
The selected districts differ substantially in terms of per capita current allocations to the education
sector. As the figures in the table below indicate, the per capita allocation is highest in Islamabad, with
an allocation of 1,808 PKR in 2009/10. The per capita allocation is the lowest in Faisalabad, which is a
city district but allocated only 777 PKR per capita for current expenditures in 2008/09.3
After Islamabad, per capita allocation is the highest in the district of Jhelum, in Punjab Province,
which allocated 1,422 PKR per capita to the education sector. But the per capita allocations in the two
districts of Khyber-Pakhtunkhwa Province (i.e. Nowshera and Abbottabad) are higher than those of
Faisalabad and Multan, the city districts in Punjab Province.
Table 4: Population and Current Education Budgets
DistrictPopulation
(in millions) 1998 Census
Allocation
(millions, PKR) 2009/10
Per Capita Allocation
(PKR) 2009/10
Abbottabad 0.88 1349.00 1533.00
Faisalabad 5.43 4219.40* 777.00*
Islamabad 0.80 1446.20** 1808.00**
Jhelum 0.94 1337.00 1422.00
Multan 3.12 2755.00 883.00
Nowshera 0.87 984.80 1132.00
Source: Annual Budget Books of the Districts, 2008 – 2010; Census Report 1998
Note: * In 2008/09
** Excluding relevant allocations for the Ministry, Federal Directorate of Education (FDE) or schools run by ministries or
departments other than Ministry of Education.
3 The per capita allocations were calculated on the basis of population figures gathered from the 1998 census report. It
is likely that the populations of districts such as Faisalabad, Multan and Islamabad have increased at a higher rate thanother districts as a result of migration. If this fact is taken into consideration, the per capita allocations of these districts
would be lower than the ones presented in this table.
8/11/2019 Education Budgets
http://slidepdf.com/reader/full/education-budgets 20/71
11E x e c u t i v e
S u mm a r y
1 .I n t r o d u c t i o n
2 .T h e B u d g e t M a k i n
g P r o c e s s a n d
D i s
t r i c t M a n a g e m e n t
3 . C o m
p a r a t i v e A n a
l y s i s o f
D i s t r i c t E d u c a t i o n B
u d g e t s
4 .I s l a m a b a d C a p i t a l
T e r r i t o r y
5 .A b b o t t a b a d D i s t r i c
t 6 .N o w s h e r a D i s t r i c t
7 . C i t y D i s t r i c t
F a i s a l a b a d
8 . J h e l u m D i s t r i c t
9 .M u l t a n C i t y
D i s t r i c t
1 0 .R e c o mm e n d a t i o n s
R
e f e r e n c e s
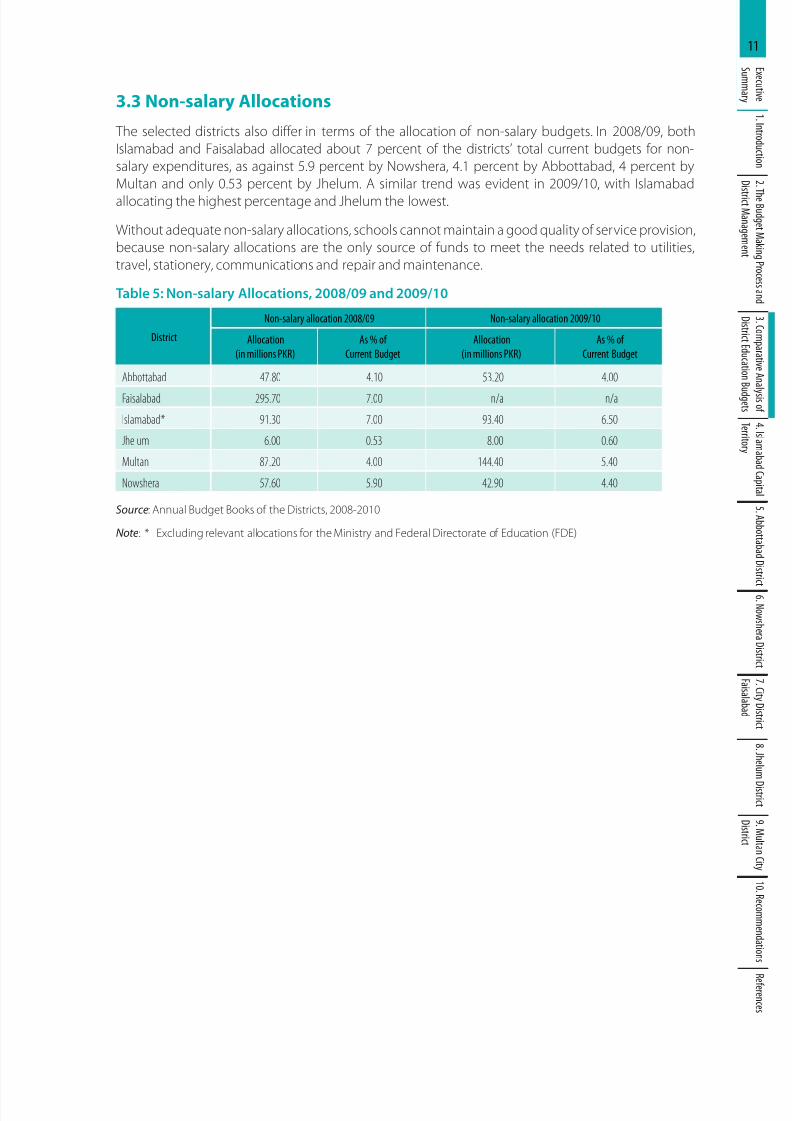
3.3 Non-salary Allocations
The selected districts also differ in terms of the allocation of non-salary budgets. In 2008/09, both
Islamabad and Faisalabad allocated about 7 percent of the districts’ total current budgets for non-
salary expenditures, as against 5.9 percent by Nowshera, 4.1 percent by Abbottabad, 4 percent by
Multan and only 0.53 percent by Jhelum. A similar trend was evident in 2009/10, with Islamabad
allocating the highest percentage and Jhelum the lowest.
Without adequate non-salary allocations, schools cannot maintain a good quality of service provision,
because non-salary allocations are the only source of funds to meet the needs related to utilities,
travel, stationery, communications and repair and maintenance.
Table 5: Non-salary Allocations, 2008/09 and 2009/10
District
Non-salary allocation 2008/09 Non-salary allocation 2009/10
Allocation
(in millions PKR)
As % of
Current Budget
Allocation
(in millions PKR)
As % of
Current Budget
Abbottabad 47.80 4.10 53.20 4.00
Faisalabad 295.70 7.00 n/a n/a
Islamabad* 91.30 7.00 93.40 6.50
Jhelum 6.00 0.53 8.00 0.60
Multan 87.20 4.00 144.40 5.40
Nowshera 57.60 5.90 42.90 4.40
Source: Annual Budget Books of the Districts, 2008-2010
Note: * Excluding relevant allocations for the Ministry and Federal Directorate of Education (FDE)
8/11/2019 Education Budgets
http://slidepdf.com/reader/full/education-budgets 21/71
E d u c a t i o n
B u d g e t s : A
S t u d y
o f S e l e c t e d
D i s t r i c t s o f P a k i s t a n
12
4. Islamabad Capital Territory
4.1. Profile of the District
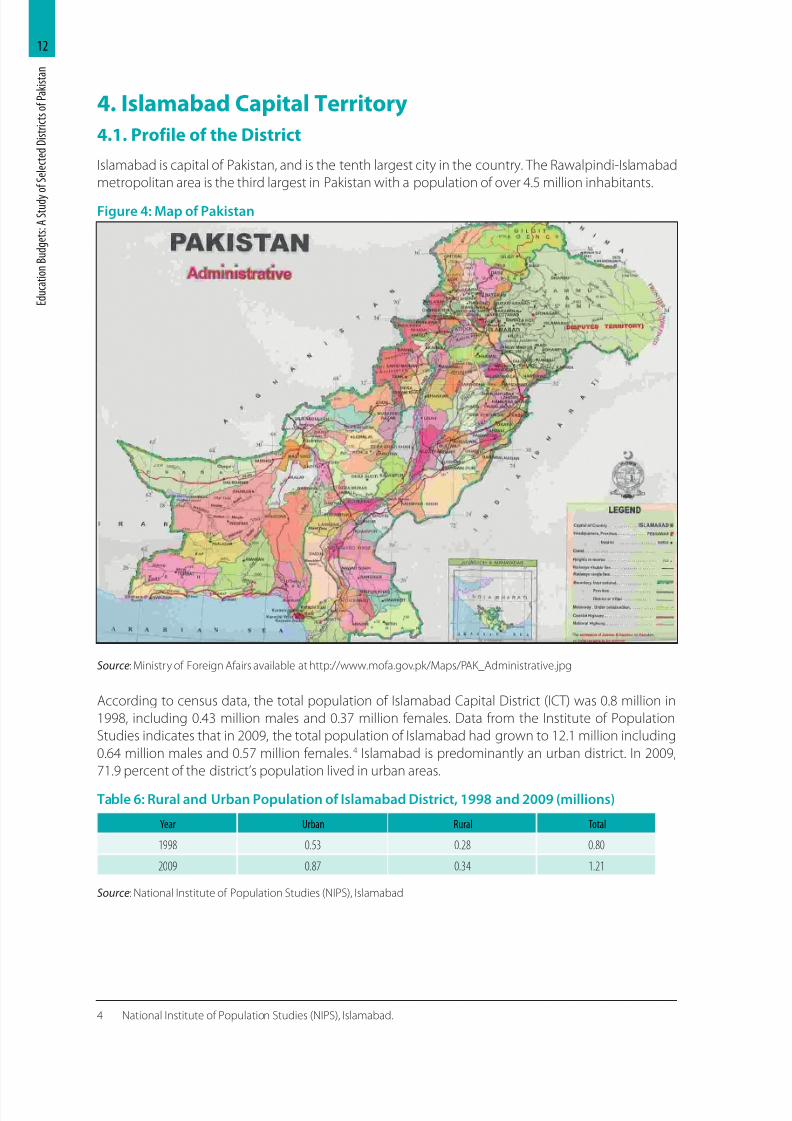
Islamabad is capital of Pakistan, and is the tenth largest city in the country. The Rawalpindi-Islamabad
metropolitan area is the third largest in Pakistan with a population of over 4.5 million inhabitants.
Figure 4: Map of Pakistan
Source: Ministry of Foreign Afairs available at http://www.mofa.gov.pk/Maps/PAK_Administrative.jpg
According to census data, the total population of Islamabad Capital District (ICT) was 0.8 million in
1998, including 0.43 million males and 0.37 million females. Data from the Institute of Population
Studies indicates that in 2009, the total population of Islamabad had grown to 12.1 million including
0.64 million males and 0.57 million females.4 Islamabad is predominantly an urban district. In 2009,
71.9 percent of the district’s population lived in urban areas.
Table 6: Rural and Urban Population of Islamabad District, 1998 and 2009 (millions)
Year Urban Rural Total
1998 0.53 0.28 0.80
2009 0.87 0.34 1.21
Source: National Institute of Population Studies (NIPS), Islamabad
4 National Institute of Population Studies (NIPS), Islamabad.
8/11/2019 Education Budgets
http://slidepdf.com/reader/full/education-budgets 22/71
13E x e c u t i v e
S u mm a r y
1 .I n t r o d u c t i o n
2 .T h e B u d g e t M a k i n
g P r o c e s s a n d
D i s
t r i c t M a n a g e m e n t
3 . C o m
p a r a t i v e A n a
l y s i s o f
D i s t r i c t E d u c a t i o n B
u d g e t s
4 .I s l a m a b a d C a p i t a l
T e r r i t o r y
5 .A b b o t t a b a d D i s t r i c
t 6 .N o w s h e r a D i s t r i c t
7 . C i t y D i s t r i c t
F a i s a l a b a d
8 . J h e l u m D i s t r i c t
9 .M u l t a n C i t y
D i s t r i c t
1 0 .R e c o mm e n d a t i o n s
R
e f e r e n c e s
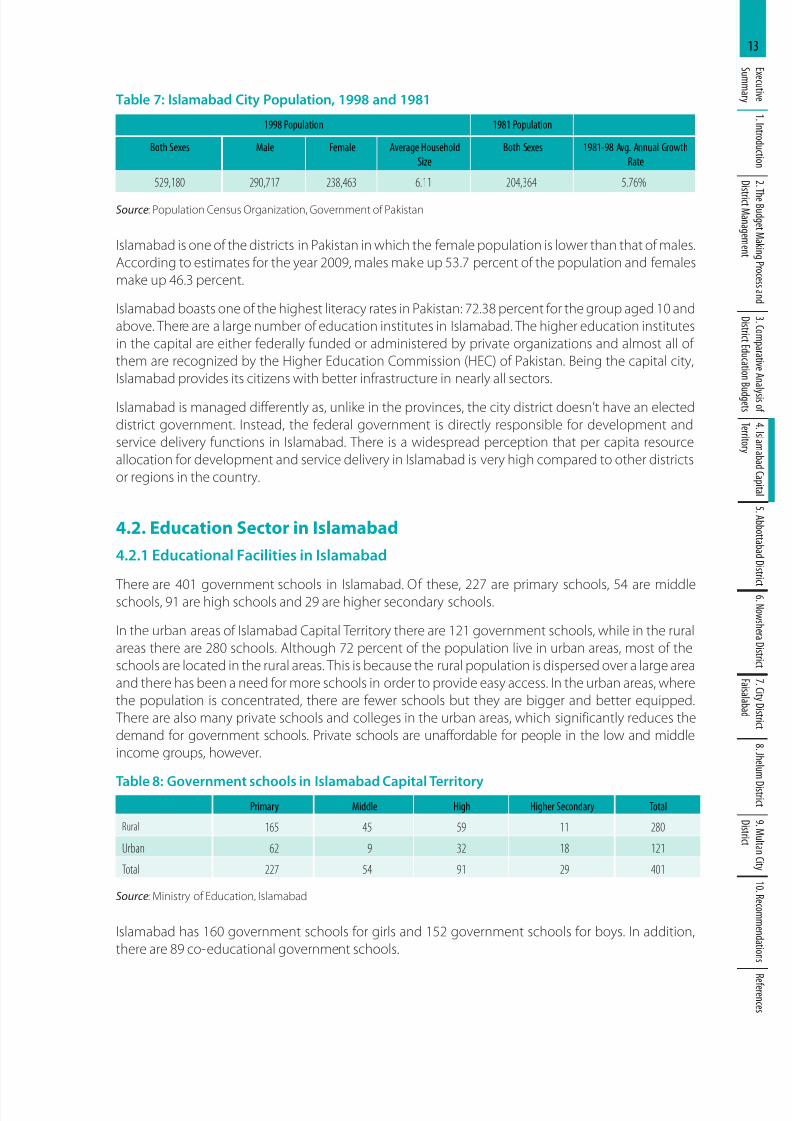
Table 7: Islamabad City Population, 1998 and 1981
1998 Population 1981 Population
Both Sexes Male Female Average Household
Size
Both Sexes 1981-98 Avg. Annual Growth
Rate
529,180 290,717 238,463 6.11 204,364 5.76%
Source: Population Census Organization, Government of Pakistan
Islamabad is one of the districts in Pakistan in which the female population is lower than that of males.
According to estimates for the year 2009, males make up 53.7 percent of the population and females
make up 46.3 percent.
Islamabad boasts one of the highest literacy rates in Pakistan: 72.38 percent for the group aged 10 and
above. There are a large number of education institutes in Islamabad. The higher education institutes
in the capital are either federally funded or administered by private organizations and almost all of
them are recognized by the Higher Education Commission (HEC) of Pakistan. Being the capital city,
Islamabad provides its citizens with better infrastructure in nearly all sectors.
Islamabad is managed differently as, unlike in the provinces, the city district doesn’t have an elected
district government. Instead, the federal government is directly responsible for development and
service delivery functions in Islamabad. There is a widespread perception that per capita resource
allocation for development and service delivery in Islamabad is very high compared to other districts
or regions in the country.
4.2. Education Sector in Islamabad
4.2.1 Educational Facilities in Islamabad
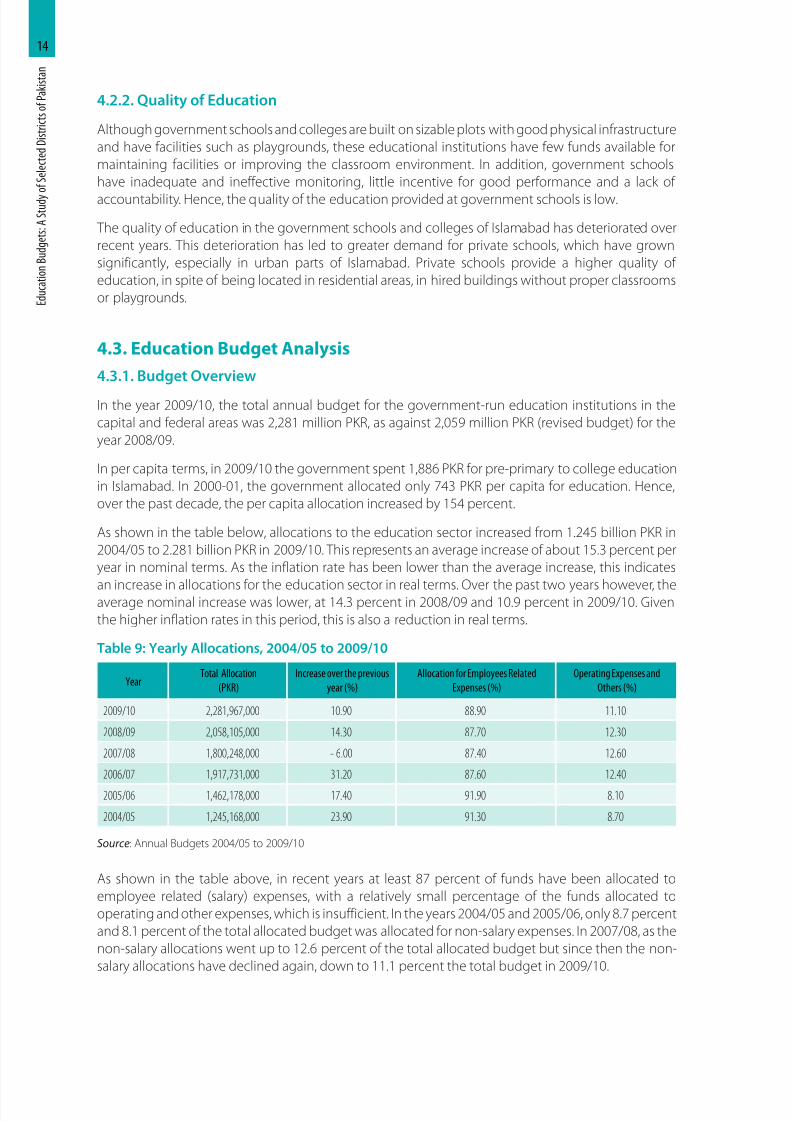
There are 401 government schools in Islamabad. Of these, 227 are primary schools, 54 are middleschools, 91 are high schools and 29 are higher secondary schools.
In the urban areas of Islamabad Capital Territory there are 121 government schools, while in the rural
areas there are 280 schools. Although 72 percent of the population live in urban areas, most of the
schools are located in the rural areas. This is because the rural population is dispersed over a large area
and there has been a need for more schools in order to provide easy access. In the urban areas, where
the population is concentrated, there are fewer schools but they are bigger and better equipped.
There are also many private schools and colleges in the urban areas, which significantly reduces the
demand for government schools. Private schools are unaffordable for people in the low and middle
income groups, however.
Table 8: Government schools in Islamabad Capital TerritoryPrimary Middle High Higher Secondary Total
Rural 165 45 59 11 280
Urban 62 9 32 18 121
Total 227 54 91 29 401
Source: Ministry of Education, Islamabad
Islamabad has 160 government schools for girls and 152 government schools for boys. In addition,
there are 89 co-educational government schools.
8/11/2019 Education Budgets
http://slidepdf.com/reader/full/education-budgets 23/71
E d u c a t i o n
B u d g e t s : A
S t u d y
o f S e l e c t e d
D i s t r i c t s o f P a k i s t a n
14
4.2.2. Quality of Education
Although government schools and colleges are built on sizable plots with good physical infrastructure
and have facilities such as playgrounds, these educational institutions have few funds available for
maintaining facilities or improving the classroom environment. In addition, government schools
have inadequate and ineffective monitoring, little incentive for good performance and a lack of
accountability. Hence, the quality of the education provided at government schools is low.
The quality of education in the government schools and colleges of Islamabad has deteriorated over
recent years. This deterioration has led to greater demand for private schools, which have grown
significantly, especially in urban parts of Islamabad. Private schools provide a higher quality of
education, in spite of being located in residential areas, in hired buildings without proper classrooms
or playgrounds.
4.3. Education Budget Analysis
4.3.1. Budget Overview
In the year 2009/10, the total annual budget for the government-run education institutions in the
capital and federal areas was 2,281 million PKR, as against 2,059 million PKR (revised budget) for the
year 2008/09.
In per capita terms, in 2009/10 the government spent 1,886 PKR for pre-primary to college education
in Islamabad. In 2000-01, the government allocated only 743 PKR per capita for education. Hence,
over the past decade, the per capita allocation increased by 154 percent.
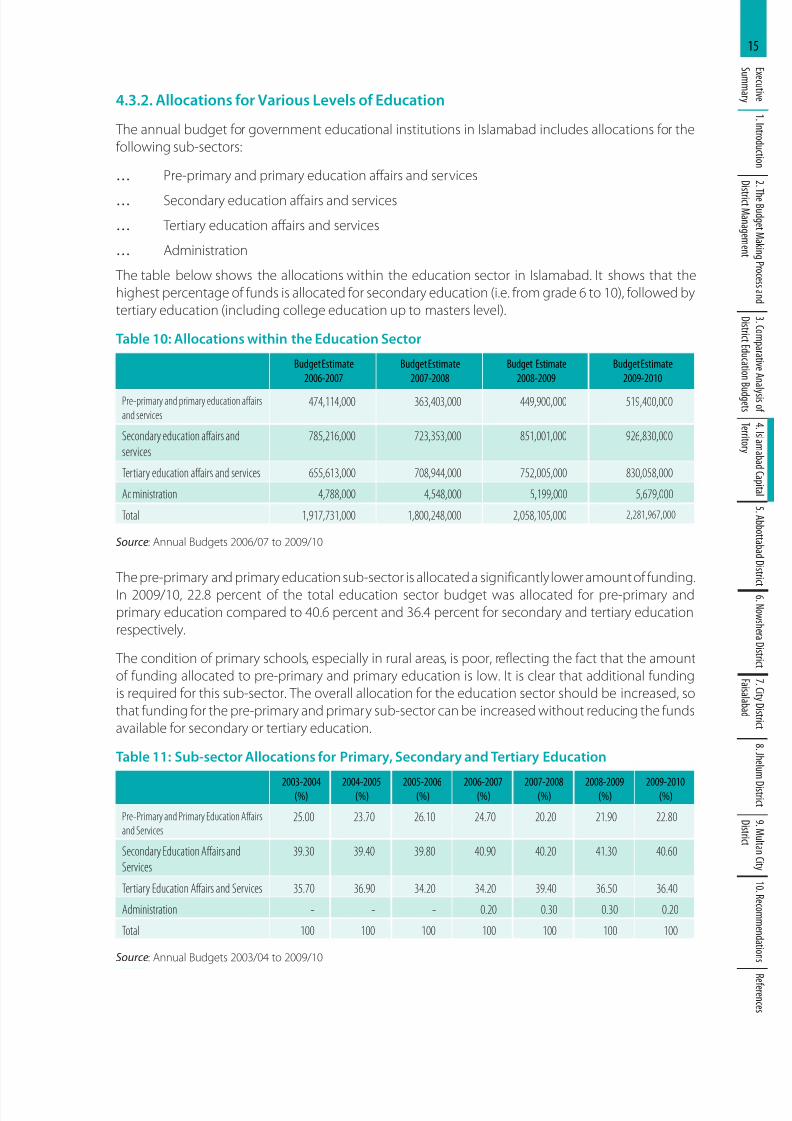
As shown in the table below, allocations to the education sector increased from 1.245 billion PKR in
2004/05 to 2.281 billion PKR in 2009/10. This represents an average increase of about 15.3 percent per
year in nominal terms. As the inflation rate has been lower than the average increase, this indicates
an increase in allocations for the education sector in real terms. Over the past two years however, theaverage nominal increase was lower, at 14.3 percent in 2008/09 and 10.9 percent in 2009/10. Given
the higher inflation rates in this period, this is also a reduction in real terms.
Table 9: Yearly Allocations, 2004/05 to 2009/10
YearTotal Allocation
(PKR)
Increase over the previous
year (%)
Allocation for Employees Related
Expenses (%)
Operating Expenses and
Others (%)
2009/10 2,281,967,000 10.90 88.90 11.10
2008/09 2,058,105,000 14.30 87.70 12.30
2007/08 1,800,248,000 - 6.00 87.40 12.60
2006/07 1,917,731,000 31.20 87.60 12.40
2005/06 1,462,178,000 17.40 91.90 8.10
2004/05 1,245,168,000 23.90 91.30 8.70
Source: Annual Budgets 2004/05 to 2009/10
As shown in the table above, in recent years at least 87 percent of funds have been allocated to
employee related (salary) expenses, with a relatively small percentage of the funds allocated to
operating and other expenses, which is insufficient. In the years 2004/05 and 2005/06, only 8.7 percent
and 8.1 percent of the total allocated budget was allocated for non-salary expenses. In 2007/08, as the
non-salary allocations went up to 12.6 percent of the total allocated budget but since then the non-
salary allocations have declined again, down to 11.1 percent the total budget in 2009/10.
8/11/2019 Education Budgets
http://slidepdf.com/reader/full/education-budgets 24/71
15E x e c u t i v e
S u mm a r y
1 .I n t r o d u c t i o n
2 .T h e B u d g e t M a k i n
g P r o c e s s a n d
D i s
t r i c t M a n a g e m e n t
3 . C o m
p a r a t i v e A n a
l y s i s o f
D i s t r i c t E d u c a t i o n B
u d g e t s
4 .I s l a m a b a d C a p i t a l
T e r r i t o r y
5 .A b b o t t a b a d D i s t r i c
t 6 .N o w s h e r a D i s t r i c t
7 . C i t y D i s t r i c t
F a i s a l a b a d
8 . J h e l u m D i s t r i c t
9 .M u l t a n C i t y
D i s t r i c t
1 0 .R e c o mm e n d a t i o n s
R
e f e r e n c e s
4.3.2. Allocations for Various Levels of Education
The annual budget for government educational institutions in Islamabad includes allocations for the
following sub-sectors:
… Pre-primary and primary education affairs and services
… Secondary education affairs and services
… Tertiary education affairs and services
… Administration
The table below shows the allocations within the education sector in Islamabad. It shows that the
highest percentage of funds is allocated for secondary education (i.e. from grade 6 to 10), followed by
tertiary education (including college education up to masters level).
Table 10: Allocations within the Education Sector
Budget Estimate
2006-2007
Budget Estimate
2007-2008
Budget Estimate
2008-2009
Budget Estimate
2009-2010
Pre-primary and primary education affairs
and services474,114,000 363,403,000 449,900,000 519,400,000
Secondary education affairs and
services
785,216,000 723,353,000 851,001,000 926,830,000
Tertiary education affairs and services 655,613,000 708,944,000 752,005,000 830,058,000
Administration 4,788,000 4,548,000 5,199,000 5,679,000
Total 1,917,731,000 1,800,248,000 2,058,105,000 2,281,967,000
Source: Annual Budgets 2006/07 to 2009/10
The pre-primary and primary education sub-sector is allocated a significantly lower amount of funding.
In 2009/10, 22.8 percent of the total education sector budget was allocated for pre-primary andprimary education compared to 40.6 percent and 36.4 percent for secondary and tertiary education
respectively.
The condition of primary schools, especially in rural areas, is poor, reflecting the fact that the amount
of funding allocated to pre-primary and primary education is low. It is clear that additional funding
is required for this sub-sector. The overall allocation for the education sector should be increased, so
that funding for the pre-primary and primary sub-sector can be increased without reducing the funds
available for secondary or tertiary education.
Table 11: Sub-sector Allocations for Primary, Secondary and Tertiary Education
2003-2004(%)
2004-2005(%)
2005-2006(%)
2006-2007(%)
2007-2008(%)
2008-2009(%)
2009-2010(%)
Pre-Primary and Primary Education Affairs
and Services25.00 23.70 26.10 24.70 20.20 21.90 22.80
Secondary Education Affairs and
Services
39.30 39.40 39.80 40.90 40.20 41.30 40.60
Tertiary Education Affairs and Services 35.70 36.90 34.20 34.20 39.40 36.50 36.40
Administration - - - 0.20 0.30 0.30 0.20
Total 100 100 100 100 100 100 100
Source: Annual Budgets 2003/04 to 2009/10
8/11/2019 Education Budgets
http://slidepdf.com/reader/full/education-budgets 25/71
E d u c a t i o n
B u d g e t s : A
S t u d y
o f S e l e c t e d
D i s t r i c t s o f P a k i s t a n
16
4.3.3. Allocations to Primary Education in Islamabad
In 2009/10, the total allocation for pre-primary and primary education in Islamabad Capital Territory was
519,400,000 PKR. This allocation was 15.5 percent higher than that for the previous year (449,900,000
PKR). An examination of the previous five years indicates, however, that the average annual increase
was only 7.3 percent. Although the allocation went up significantly in 2006/07 it decreased again in
the following year. In view of high inflation rates over the years, overall, there has been a reduction inthe allocation of funds in real terms.
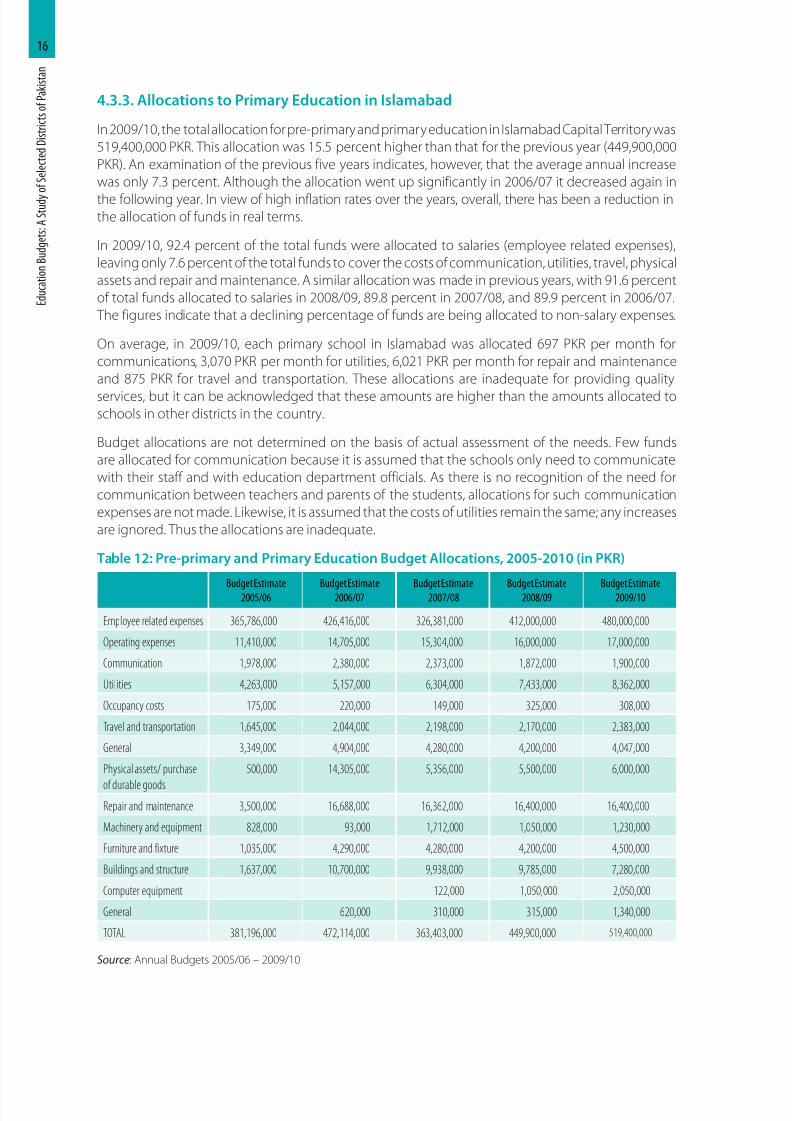
In 2009/10, 92.4 percent of the total funds were allocated to salaries (employee related expenses),
leaving only 7.6 percent of the total funds to cover the costs of communication, utilities, travel, physical
assets and repair and maintenance. A similar allocation was made in previous years, with 91.6 percent
of total funds allocated to salaries in 2008/09, 89.8 percent in 2007/08, and 89.9 percent in 2006/07.
The figures indicate that a declining percentage of funds are being allocated to non-salary expenses.
On average, in 2009/10, each primary school in Islamabad was allocated 697 PKR per month for
communications, 3,070 PKR per month for utilities, 6,021 PKR per month for repair and maintenance
and 875 PKR for travel and transportation. These allocations are inadequate for providing quality
services, but it can be acknowledged that these amounts are higher than the amounts allocated toschools in other districts in the country.
Budget allocations are not determined on the basis of actual assessment of the needs. Few funds
are allocated for communication because it is assumed that the schools only need to communicate
with their staff and with education department officials. As there is no recognition of the need for
communication between teachers and parents of the students, allocations for such communication
expenses are not made. Likewise, it is assumed that the costs of utilities remain the same; any increases
are ignored. Thus the allocations are inadequate.
Table 12: Pre-primary and Primary Education Budget Allocations, 2005-2010 (in PKR)
Budget Estimate2005/06 Budget Estimate2006/07 Budget Estimate2007/08 Budget Estimate2008/09 Budget Estimate2009/10
Employee related expenses 365,786,000 426,416,000 326,381,000 412,000,000 480,000,000
Operating expenses 11,410,000 14,705,000 15,304,000 16,000,000 17,000,000
Communication 1,978,000 2,380,000 2,373,000 1,872,000 1,900,000
Utilities 4,263,000 5,157,000 6,304,000 7,433,000 8,362,000
Occupancy costs 175,000 220,000 149,000 325,000 308,000
Travel and transportation 1,645,000 2,044,000 2,198,000 2,170,000 2,383,000
General 3,349,000 4,904,000 4,280,000 4,200,000 4,047,000
Physical assets/ purchase
of durable goods
500,000 14,305,000 5,356,000 5,500,000 6,000,000
Repair and maintenance 3,500,000 16,688,000 16,362,000 16,400,000 16,400,000
Machinery and equipment 828,000 93,000 1,712,000 1,050,000 1,230,000
Furniture and fixture 1,035,000 4,290,000 4,280,000 4,200,000 4,500,000
Buildings and structure 1,637,000 10,700,000 9,938,000 9,785,000 7,280,000
Computer equipment 122,000 1,050,000 2,050,000
General 620,000 310,000 315,000 1,340,000
TOTAL 381,196,000 472,114,000 363,403,000 449,900,000 519,400,000
Source: Annual Budgets 2005/06 – 2009/10
8/11/2019 Education Budgets
http://slidepdf.com/reader/full/education-budgets 26/71
17E x e c u t i v e
S u mm a r y
1 .I n t r o d u c t i o n
2 .T h e B u d g e t M a k i n
g P r o c e s s a n d
D i s
t r i c t M a n a g e m e n t
3 . C o m
p a r a t i v e A n a
l y s i s o f
D i s t r i c t E d u c a t i o n B
u d g e t s
4 .I s l a m a b a d C a p i t a l
T e r r i t o r y
5 .A b b o t t a b a d D i s t r i c
t 6 .N o w s h e r a D i s t r i c t
7 . C i t y D i s t r i c t
F a i s a l a b a d
8 . J h e l u m D i s t r i c t
9 .M u l t a n C i t y
D i s t r i c t
1 0 .R e c o mm e n d a t i o n s
R
e f e r e n c e s
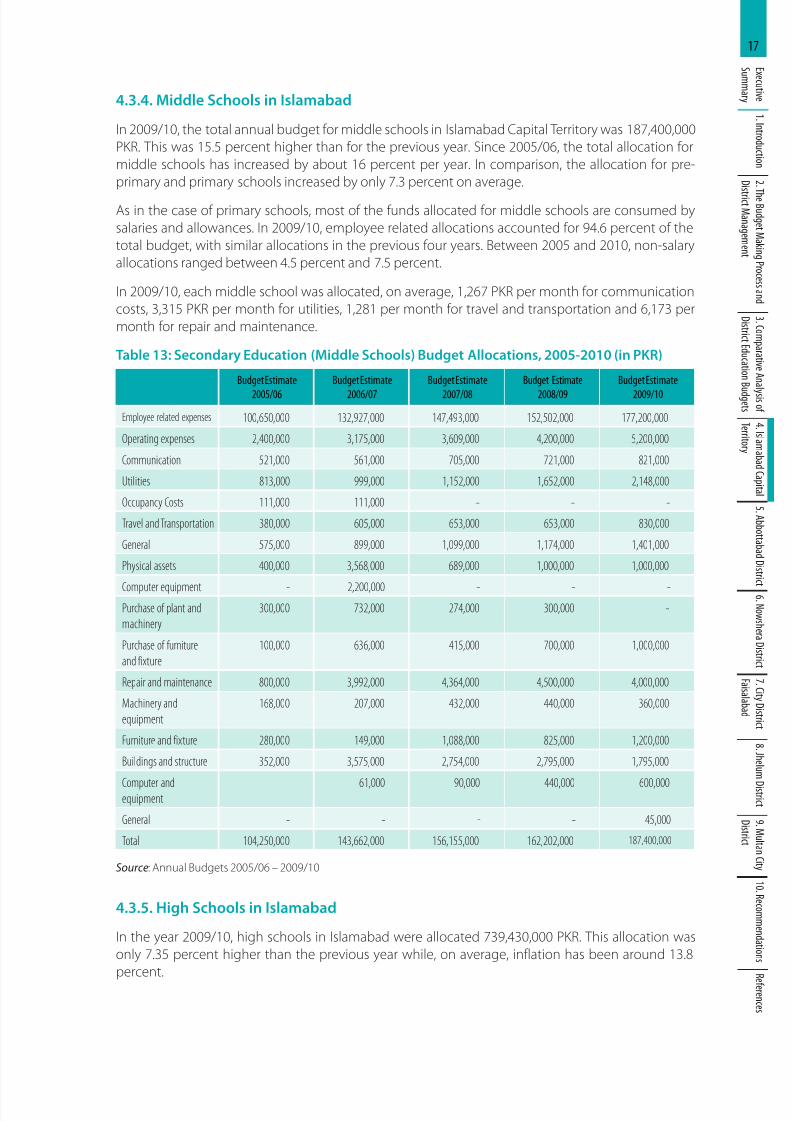
4.3.4. Middle Schools in Islamabad
In 2009/10, the total annual budget for middle schools in Islamabad Capital Territory was 187,400,000
PKR. This was 15.5 percent higher than for the previous year. Since 2005/06, the total allocation for
middle schools has increased by about 16 percent per year. In comparison, the allocation for pre-
primary and primary schools increased by only 7.3 percent on average.
As in the case of primary schools, most of the funds allocated for middle schools are consumed by
salaries and allowances. In 2009/10, employee related allocations accounted for 94.6 percent of the
total budget, with similar allocations in the previous four years. Between 2005 and 2010, non-salary
allocations ranged between 4.5 percent and 7.5 percent.
In 2009/10, each middle school was allocated, on average, 1,267 PKR per month for communication
costs, 3,315 PKR per month for utilities, 1,281 per month for travel and transportation and 6,173 per
month for repair and maintenance.
Table 13: Secondary Education (Middle Schools) Budget Allocations, 2005-2010 (in PKR)
Budget Estimate
2005/06
Budget Estimate
2006/07
Budget Estimate
2007/08
Budget Estimate
2008/09
Budget Estimate
2009/10
Employee related expenses 100,650,000 132,927,000 147,493,000 152,502,000 177,200,000
Operating expenses 2,400,000 3,175,000 3,609,000 4,200,000 5,200,000
Communication 521,000 561,000 705,000 721,000 821,000
Utilities 813,000 999,000 1,152,000 1,652,000 2,148,000
Occupancy Costs 111,000 111,000 - - -
Travel and Transportation 380,000 605,000 653,000 653,000 830,000
General 575,000 899,000 1,099,000 1,174,000 1,401,000
Physical assets 400,000 3,568,000 689,000 1,000,000 1,000,000
Computer equipment - 2,200,000 - - -Purchase of plant and
machinery
300,000 732,000 274,000 300,000 -
Purchase of furniture
and fixture
100,000 636,000 415,000 700,000 1,000,000
Repair and maintenance 800,000 3,992,000 4,364,000 4,500,000 4,000,000
Machinery and
equipment
168,000 207,000 432,000 440,000 360,000
Furniture and fixture 280,000 149,000 1,088,000 825,000 1,200,000
Buildings and structure 352,000 3,575,000 2,754,000 2,795,000 1,795,000
Computer andequipment
61,000 90,000 440,000 600,000
General - - - - 45,000
Total 104,250,000 143,662,000 156,155,000 162,202,000 187,400,000
Source: Annual Budgets 2005/06 – 2009/10
4.3.5. High Schools in Islamabad
In the year 2009/10, high schools in Islamabad were allocated 739,430,000 PKR. This allocation was
only 7.35 percent higher than the previous year while, on average, inflation has been around 13.8
percent.
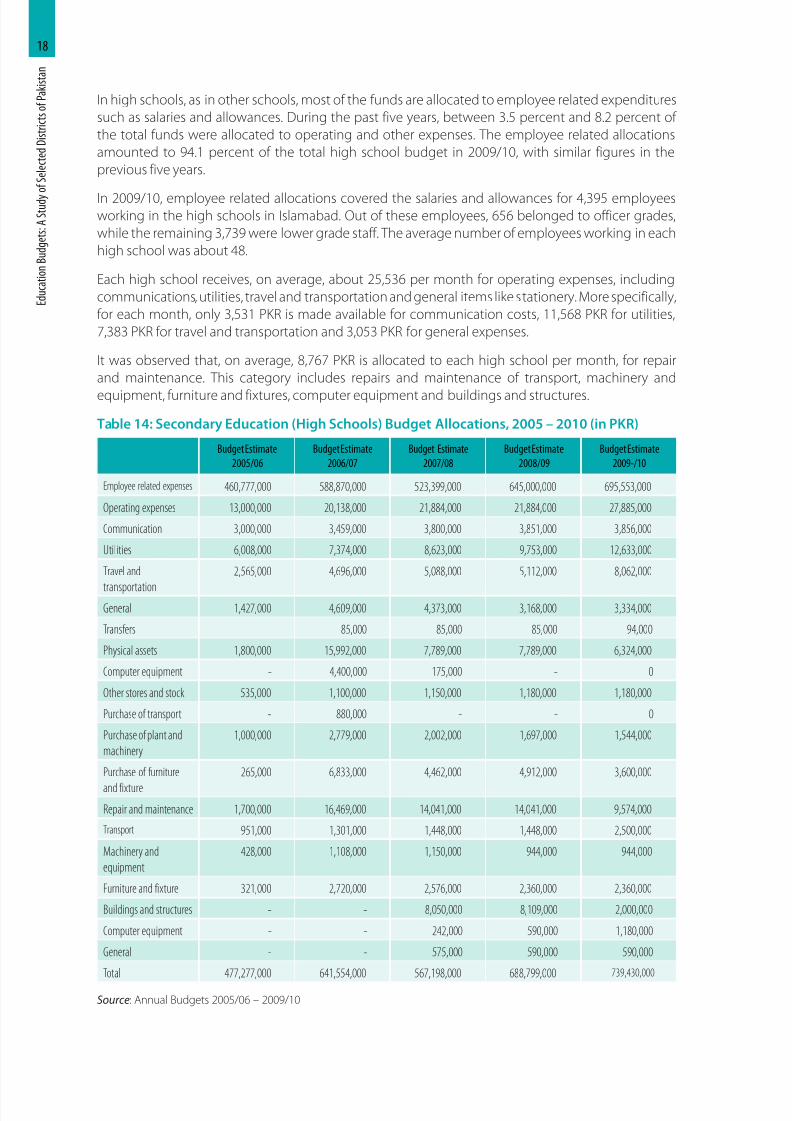
8/11/2019 Education Budgets
http://slidepdf.com/reader/full/education-budgets 27/71
E d u c a t i o n
B u d g e t s : A
S t u d y
o f S e l e c t e d
D i s t r i c t s o f P a k i s t a n
18
In high schools, as in other schools, most of the funds are allocated to employee related expenditures
such as salaries and allowances. During the past five years, between 3.5 percent and 8.2 percent of
the total funds were allocated to operating and other expenses. The employee related allocations
amounted to 94.1 percent of the total high school budget in 2009/10, with similar figures in the
previous five years.
In 2009/10, employee related allocations covered the salaries and allowances for 4,395 employeesworking in the high schools in Islamabad. Out of these employees, 656 belonged to officer grades,
while the remaining 3,739 were lower grade staff. The average number of employees working in each
high school was about 48.
Each high school receives, on average, about 25,536 per month for operating expenses, including
communications, utilities, travel and transportation and general items like stationery. More specifically,
for each month, only 3,531 PKR is made available for communication costs, 11,568 PKR for utilities,
7,383 PKR for travel and transportation and 3,053 PKR for general expenses.
It was observed that, on average, 8,767 PKR is allocated to each high school per month, for repair
and maintenance. This category includes repairs and maintenance of transport, machinery and
equipment, furniture and fixtures, computer equipment and buildings and structures.
Table 14: Secondary Education (High Schools) Budget Allocations, 2005 – 2010 (in PKR)
Budget Estimate
2005/06
Budget Estimate
2006/07
Budget Estimate
2007/08
Budget Estimate
2008/09
Budget Estimate
2009-/10
Employee related expenses 460,777,000 588,870,000 523,399,000 645,000,000 695,553,000
Operating expenses 13,000,000 20,138,000 21,884,000 21,884,000 27,885,000
Communication 3,000,000 3,459,000 3,800,000 3,851,000 3,856,000
Utilities 6,008,000 7,374,000 8,623,000 9,753,000 12,633,000
Travel and
transportation
2,565,000 4,696,000 5,088,000 5,112,000 8,062,000
General 1,427,000 4,609,000 4,373,000 3,168,000 3,334,000
Transfers 85,000 85,000 85,000 94,000
Physical assets 1,800,000 15,992,000 7,789,000 7,789,000 6,324,000
Computer equipment - 4,400,000 175,000 - 0
Other stores and stock 535,000 1,100,000 1,150,000 1,180,000 1,180,000
Purchase of transport - 880,000 - - 0
Purchase of plant and
machinery
1,000,000 2,779,000 2,002,000 1,697,000 1,544,000
Purchase of furniture
and fixture
265,000 6,833,000 4,462,000 4,912,000 3,600,000
Repair and maintenance 1,700,000 16,469,000 14,041,000 14,041,000 9,574,000
Transport 951,000 1,301,000 1,448,000 1,448,000 2,500,000
Machinery and
equipment
428,000 1,108,000 1,150,000 944,000 944,000
Furniture and fixture 321,000 2,720,000 2,576,000 2,360,000 2,360,000
Buildings and structures - - 8,050,000 8,109,000 2,000,000
Computer equipment - - 242,000 590,000 1,180,000
General - - 575,000 590,000 590,000
Total 477,277,000 641,554,000 567,198,000 688,799,000 739,430,000
Source: Annual Budgets 2005/06 – 2009/10
8/11/2019 Education Budgets
http://slidepdf.com/reader/full/education-budgets 28/71
19E x e c u t i v e
S u mm a r y
1 .I n t r o d u c t i o n
2 .T h e B u d g e t M a k i n
g P r o c e s s a n d
D i s
t r i c t M a n a g e m e n t
3 . C o m
p a r a t i v e A n a
l y s i s o f
D i s t r i c t E d u c a t i o n B
u d g e t s
4 .I s l a m a b a d C a p i t a l
T e r r i t o r y
5 .A b b o t t a b a d D i s t r i c
t 6 .N o w s h e r a D i s t r i c t
7 . C i t y D i s t r i c t
F a i s a l a b a d
8 . J h e l u m D i s t r i c t
9 .M u l t a n C i t y
D i s t r i c t
1 0 .R e c o mm e n d a t i o n s
R
e f e r e n c e s
4.3.6 Development Budget
Islamabad, being the Capital Territory, falls within the jurisdiction of the federal government; it is not
treated as a separate entity when making allocations. Its development needs, including the ones
relating to the education sector, are made as part of the Annual Development Plan (ADP) of the
federal government. Thus, the education-related development projects for Islamabad are presented
in the development budget of the Ministry of Education.
In the budget for 2009/10, the federal government allocated 209 million PKR for building 11 new
schools in Islamabad. Furthermore, 556.8 million PKR was allocated for upgrading existing institutions,
introducing new classes, building new blocks or providing additional facilities. These are significant
allocations and are very high if compared to other districts where allocations for education-related
development projects are very low.
Implementation of development projects in Islamabad has encountered some serious problems,
however, resulting in long delays and poor quality of work. The reasons for this include the following:
… The tendering process is slow as a result of bureaucratic red tape
… The staff responsible for implementing development projects are overburdened
… Delays in acquiring land or preparing feasibility reports
… Limited availability of competent contractors
… Delays in the procurement of funds
… Late submission of progress reports
… Frequent transfers and postings of responsible staff
… Reduction in funds or downward revisions in allocations in the budget
4.4. Major Issues and Concerns
From a review of budget documents and discussions with stakeholders, including teaching staff, a
range of concerns have been identified that should be addressed by the concerned authorities. These
concerns are summarized below.
… The salaries of teaching and other staff in government schools are low, which makes it difficult for
the education sector to attract high quality staff. The living expenses in Islamabad are very high, so
staff must take additional jobs, such as offering tuition services in private academies or at homes.
This situation makes it difficult for the staff to focus exclusively on their own profession.
… As few funds are available to cover operating expenses, equipment, repair and maintenance, the
facilities in government schools cannot be mobilized or kept in working condition. So, while toiletsexist, funds are not sufficient to keep them in a hygienic and working condition. Likewise, science
laboratories and playgrounds are not maintained.
… Schools face problems in accessing the funds allocated for them. The directors of primary and
middle schools do not have the power of drawing and disbursing and, therefore, they must seek
approval from the concerned authorized officers i.e. drawing and disbursing officers. The process is
inefficient and can facilitate corruption.
… The budget making process is not open, transparent or participatory. It is dominated almost
exclusively by the bureaucrats, while the views of parents, students and communities regarding the
needs and priorities are neglected.
… Elected representatives exercise few or no rights, as there is no elected body for Islamabad. On theother hand, the federal parliament, which has the authority to exercise this privilege, does not have
the time to discuss these matters.
8/11/2019 Education Budgets
http://slidepdf.com/reader/full/education-budgets 29/71
E d u c a t i o n
B u d g e t s : A
S t u d y
o f S e l e c t e d
D i s t r i c t s o f P a k i s t a n
20
… The procedure relating to utilization of funds is not transparent and lacks effective public oversight
and accountability. As a result, there are complaints regarding inefficient utilization and delays in
implementation of projects.
… Insufficient funds are allocated to meet special or additional needs of schools or teachers in rural
areas. For instance, teachers serving in rural schools, especially in girls’ schools, are not provided with
transport, which makes it difficult for them to get to work and affects their morale. The teachersworking in rural areas should be encouraged through providing incentives to overcome the
hardships involved in working in those areas.
4.5. Recommendations
On the basis of the findings of the study, the following recommendations are suggested for the
attention of policy makers, relevant authorities and stakeholders.
… The overall allocation for education in Islamabad Capital Territory should be increased.
… The condition of primary schools should be improved by providing adequate resources, facilities
and technical support.
… Needs for operating expenses should be determined through an open consultation process,
involving all the stakeholders. When determining needs, it is important to take into account the
necessity of more frequent communications and interactions among teachers and parents as well
as improving the classroom environment for higher quality learning.
… An appropriate and relatively easy mechanism should be established, by which the directors (heads)
of primary and middle schools can claim and utilize the funds allocated for them.
… In the absence of a local government system in Islamabad, a citizens’ consultative forum should
be established to discuss education-related matters pertaining to Islamabad Capital Territory
and advise the federal government on important issues and needs. The elected members of the
National Assembly from Islamabad, eminent citizens, civil society representatives, heads of selectededucational institutions and representatives of the FDE and Ministry of Education could constitute
this forum.
… The special needs of girls’ schools and rural schools should be carefully identified and emphasized.
… Annual budgets must make necessary provisions with the primary objective of providing high
quality education services to all.
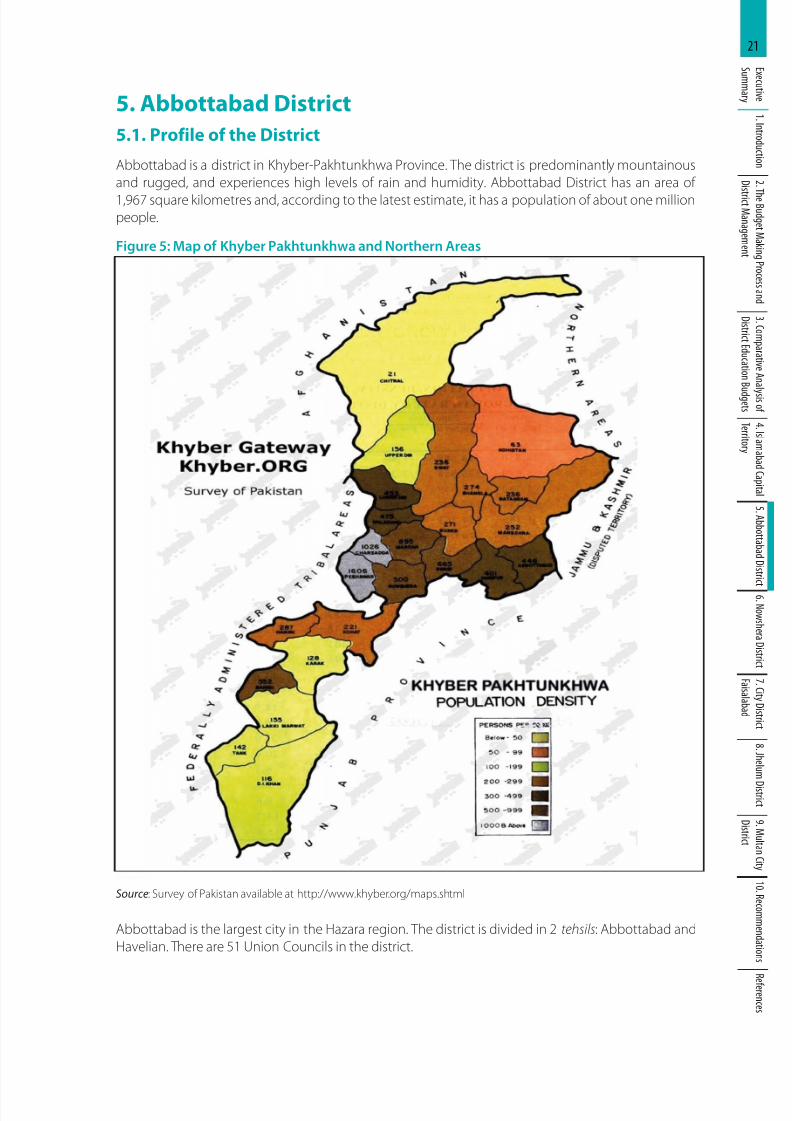
8/11/2019 Education Budgets
http://slidepdf.com/reader/full/education-budgets 30/71
21E x e c u t i v e
S u mm a r y
1 .I n t r o d u c t i o n
2 .T h e B u d g e t M a k i n
g P r o c e s s a n d
D i s
t r i c t M a n a g e m e n t
3 . C o m
p a r a t i v e A n a
l y s i s o f
D i s t r i c t E d u c a t i o n B
u d g e t s
4 .I s l a m a b a d C a p i t a l
T e r r i t o r y
5 .A b b o t t a b a d D i s t r i c
t 6 .N o w s h e r a D i s t r i c t
7 . C i t y D i s t r i c t
F a i s a l a b a d
8 . J h e l u m D i s t r i c t
9 .M u l t a n C i t y
D i s t r i c t
1 0 .R e c o mm e n d a t i o n s
R
e f e r e n c e s
5. Abbottabad District
5.1. Profile of the District
Abbottabad is a district in Khyber-Pakhtunkhwa Province. The district is predominantly mountainous
and rugged, and experiences high levels of rain and humidity. Abbottabad District has an area of
1,967 square kilometres and, according to the latest estimate, it has a population of about one millionpeople.
Figure 5: Map of Khyber Pakhtunkhwa and Northern Areas
Source: Survey of Pakistan available at http://www.khyber.org/maps.shtml
Abbottabad is the largest city in the Hazara region. The district is divided in 2 tehsils: Abbottabad and
Havelian. There are 51 Union Councils in the district.
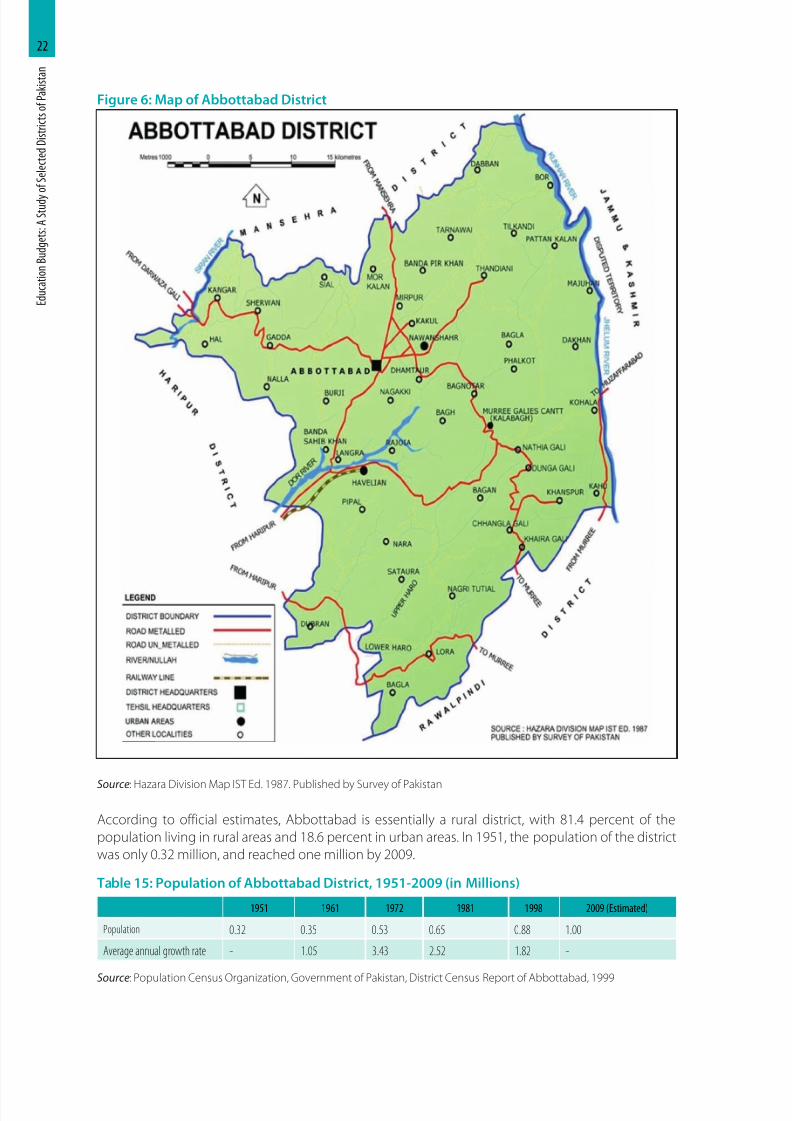
8/11/2019 Education Budgets
http://slidepdf.com/reader/full/education-budgets 31/71
E d u c a t i o n
B u d g e t s : A
S t u d y
o f S e l e c t e d
D i s t r i c t s o f P a k i s t a n
22
Figure 6: Map of Abbottabad District
Source: Hazara Division Map IST Ed. 1987. Published by Survey of Pakistan
According to official estimates, Abbottabad is essentially a rural district, with 81.4 percent of the
population living in rural areas and 18.6 percent in urban areas. In 1951, the population of the district
was only 0.32 million, and reached one million by 2009.
Table 15: Population of Abbottabad District, 1951-2009 (in Millions)
1951 1961 1972 1981 1998 2009 (Estimated)
Population 0.32 0.35 0.53 0.65 0.88 1.00
Average annual growth rate - 1.05 3.43 2.52 1.82 -
Source: Population Census Organization, Government of Pakistan, District Census Report of Abbottabad, 1999
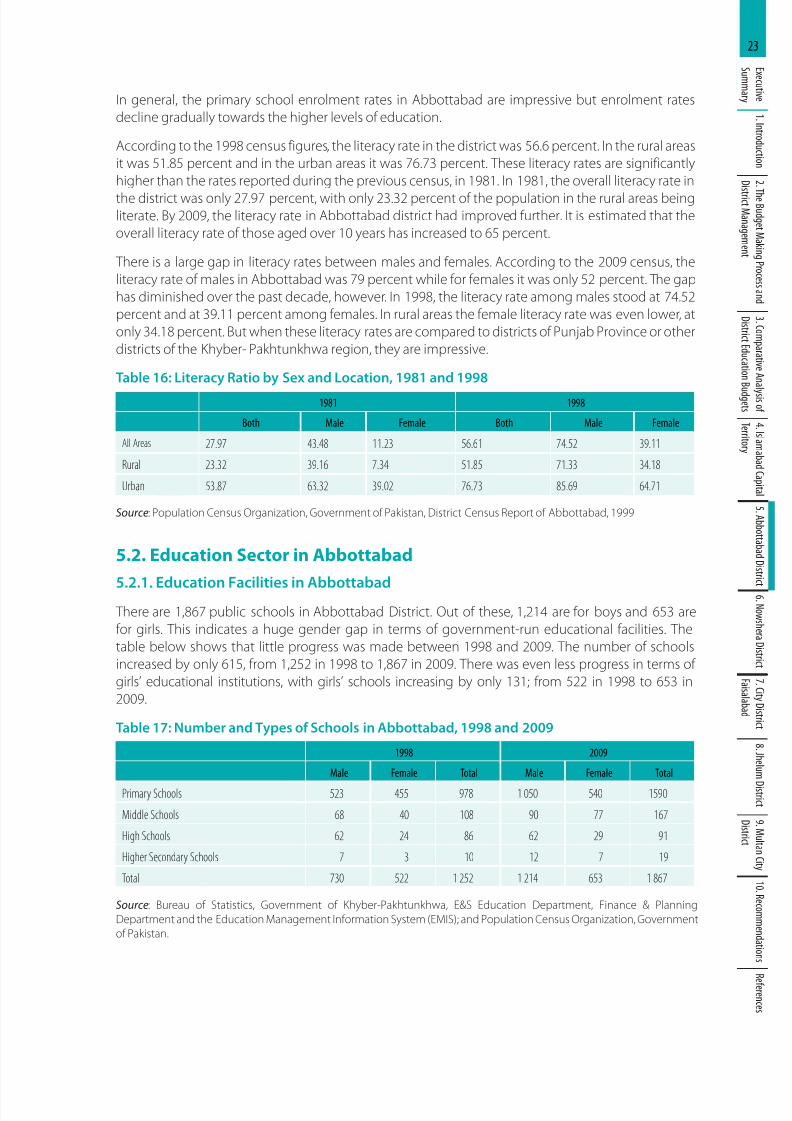
8/11/2019 Education Budgets
http://slidepdf.com/reader/full/education-budgets 32/71
23E x e c u t i v e
S u mm a r y
1 .I n t r o d u c t i o n
2 .T h e B u d g e t M a k i n
g P r o c e s s a n d
D i s
t r i c t M a n a g e m e n t
3 . C o m
p a r a t i v e A n a
l y s i s o f
D i s t r i c t E d u c a t i o n B
u d g e t s
4 .I s l a m a b a d C a p i t a l
T e r r i t o r y
5 .A b b o t t a b a d D i s t r i c
t 6 .N o w s h e r a D i s t r i c t
7 . C i t y D i s t r i c t
F a i s a l a b a d
8 . J h e l u m D i s t r i c t
9 .M u l t a n C i t y
D i s t r i c t
1 0 .R e c o mm e n d a t i o n s
R
e f e r e n c e s
In general, the primary school enrolment rates in Abbottabad are impressive but enrolment rates
decline gradually towards the higher levels of education.
According to the 1998 census figures, the literacy rate in the district was 56.6 percent. In the rural areas
it was 51.85 percent and in the urban areas it was 76.73 percent. These literacy rates are significantly
higher than the rates reported during the previous census, in 1981. In 1981, the overall literacy rate in
the district was only 27.97 percent, with only 23.32 percent of the population in the rural areas beingliterate. By 2009, the literacy rate in Abbottabad district had improved further. It is estimated that the
overall literacy rate of those aged over 10 years has increased to 65 percent.
There is a large gap in literacy rates between males and females. According to the 2009 census, the
literacy rate of males in Abbottabad was 79 percent while for females it was only 52 percent. The gap
has diminished over the past decade, however. In 1998, the literacy rate among males stood at 74.52
percent and at 39.11 percent among females. In rural areas the female literacy rate was even lower, at
only 34.18 percent. But when these literacy rates are compared to districts of Punjab Province or other
districts of the Khyber- Pakhtunkhwa region, they are impressive.
Table 16: Literacy Ratio by Sex and Location, 1981 and 1998
1981 1998
Both Male Female Both Male Female
All Areas 27.97 43.48 11.23 56.61 74.52 39.11
Rural 23.32 39.16 7.34 51.85 71.33 34.18
Urban 53.87 63.32 39.02 76.73 85.69 64.71
Source: Population Census Organization, Government of Pakistan, District Census Report of Abbottabad, 1999
5.2. Education Sector in Abbottabad
5.2.1. Education Facilities in Abbottabad There are 1,867 public schools in Abbottabad District. Out of these, 1,214 are for boys and 653 are
for girls. This indicates a huge gender gap in terms of government-run educational facilities. The
table below shows that little progress was made between 1998 and 2009. The number of schools
increased by only 615, from 1,252 in 1998 to 1,867 in 2009. There was even less progress in terms of
girls’ educational institutions, with girls’ schools increasing by only 131; from 522 in 1998 to 653 in
2009.
Table 17: Number and Types of Schools in Abbottabad, 1998 and 2009
1998 2009
Male Female Total Male Female Total
Primary Schools 523 455 978 1 050 540 1590
Middle Schools 68 40 108 90 77 167
High Schools 62 24 86 62 29 91
Higher Secondary Schools 7 3 10 12 7 19
Total 730 522 1 252 1 214 653 1 867
Source: Bureau of Statistics, Government of Khyber-Pakhtunkhwa, E&S Education Department, Finance & Planning
Department and the Education Management Information System (EMIS); and Population Census Organization, Government
of Pakistan.
8/11/2019 Education Budgets
http://slidepdf.com/reader/full/education-budgets 33/71
E d u c a t i o n
B u d g e t s : A
S t u d y
o f S e l e c t e d
D i s t r i c t s o f P a k i s t a n
24
5.2.2. Financing of Education
Public education in Abbottabad district is predominantly financed through funds provided by the
federal and provincial governments. The main channel for this financing is the Provincial Finance
Commission (PFC) award, through which the provincial government distributes funds among the
districts falling within its jurisdiction. The criteria for allocations include: population size and level of
development. The needs for development and non-development requirements of the districts areevaluated periodically through official channels by the provincial government.
The district is dependent on provincial or federal funding because it mobilizes very limited resources
on its own. In Abbottabad the federally funded Education Sector Reforms Programme and Education
for All (EFA) projects are significant sources of funds. In addition, a number of foreign-aid programmes
provide funding for various components of education through grants, loans and technical assistance.
5.2.3. Education Quality
The district is among a few districts known for their good results in the education sector, particularly
because of good private education facilities but also because of some well-known government-runinstitutions. Interestingly, the institutions offering the highest quality of schooling mostly serve the
settlers and boarders rather than the local population. Local people are often not able to send their
children to the good schools and higher education institutions located within the district, as they
tend to have lower incomes.
In general, the quality of education in government schools is below expectations and of minimum
standards. It is particularly so in schools in rural and remote areas. The poor quality of infrastructure
and instruction in government schools is responsible for low enrolments, high drop-out rates and
high failure rates. Enrolment is especially low in secondary schools. This is because only a small
proportion of students progress to these levels. Of those enrolled at this stage, about two thirds are
male students.
5.3. Education Budget Analysis
5.3.1. Budget Overview
In 2009/10, the total education budget of the district was 1,349 million PKR; higher than the allocation
of 1,165 million PKR in 2008/09 but slightly lower than the revised allocation in 2008/09 (about 1,394.5
million PKR). In 2006-07, the total district education budget was only RS 941.6 million, which means
that the budget increased by about 43 percent between 2006 and 2010. On average, this amounts
to an increase of about 10 percent per year, which is very low given the high inflation in Pakistan over
this period.
In addition, funds have also been spent in the district through the provincial Education Sector Reform
(ESR) programme. In 2009/10, the total education budget for the district, inclusive of ESR funds, was
1,352 million PKR. In per capita terms, Abbottabad District had an allocation of 1,352 PKR in 2009/10.
The table below provides data about the district education budget as well as for the ESR. As shown
in the table, the allocation for ESR has decreased significantly since 2006/07. The table also shows the
percentage change in the total education budget of the district compared to the previous year.
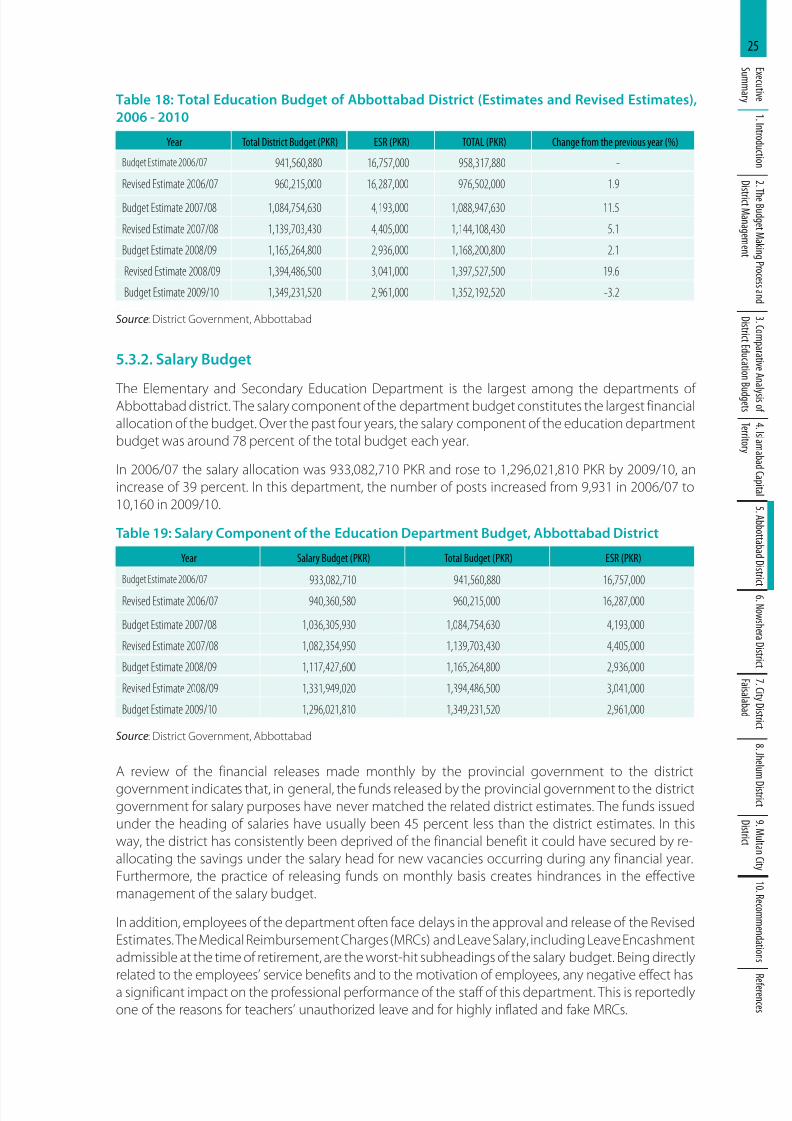
8/11/2019 Education Budgets
http://slidepdf.com/reader/full/education-budgets 34/71
25E x e c u t i v e
S u mm a r y
1 .I n t r o d u c t i o n
2 .T h e B u d g e t M a k i n
g P r o c e s s a n d
D i s
t r i c t M a n a g e m e n t
3 . C o m
p a r a t i v e A n a
l y s i s o f
D i s t r i c t E d u c a t i o n B
u d g e t s
4 .I s l a m a b a d C a p i t a l
T e r r i t o r y
5 .A b b o t t a b a d D i s t r i c
t 6 .N o w s h e r a D i s t r i c t
7 . C i t y D i s t r i c t
F a i s a l a b a d
8 . J h e l u m D i s t r i c t
9 .M u l t a n C i t y
D i s t r i c t
1 0 .R e c o mm e n d a t i o n s
R
e f e r e n c e s
Table 18: Total Education Budget of Abbottabad District (Estimates and Revised Estimates),
2006 - 2010
Year Total District Budget (PKR) ESR (PKR) TOTAL (PKR) Change from the previous year (%)
Budget Estimate 2006/07 941,560,880 16,757,000 958,317,880 -
Revised Estimate 2006/07 960,215,000 16,287,000 976,502,000 1.9
Budget Estimate 2007/08 1,084,754,630 4,193,000 1,088,947,630 11.5
Revised Estimate 2007/08 1,139,703,430 4,405,000 1,144,108,430 5.1
Budget Estimate 2008/09 1,165,264,800 2,936,000 1,168,200,800 2.1
Revised Estimate 2008/09 1,394,486,500 3,041,000 1,397,527,500 19.6
Budget Estimate 2009/10 1,349,231,520 2,961,000 1,352,192,520 -3.2
Source: District Government, Abbottabad
5.3.2. Salary Budget
The Elementary and Secondary Education Department is the largest among the departments ofAbbottabad district. The salary component of the department budget constitutes the largest financial
allocation of the budget. Over the past four years, the salary component of the education department
budget was around 78 percent of the total budget each year.
In 2006/07 the salary allocation was 933,082,710 PKR and rose to 1,296,021,810 PKR by 2009/10, an
increase of 39 percent. In this department, the number of posts increased from 9,931 in 2006/07 to
10,160 in 2009/10.
Table 19: Salary Component of the Education Department Budget, Abbottabad District
Year Salary Budget (PKR) Total Budget (PKR) ESR (PKR)
Budget Estimate 2006/07 933,082,710 941,560,880 16,757,000
Revised Estimate 2006/07 940,360,580 960,215,000 16,287,000
Budget Estimate 2007/08 1,036,305,930 1,084,754,630 4,193,000
Revised Estimate 2007/08 1,082,354,950 1,139,703,430 4,405,000
Budget Estimate 2008/09 1,117,427,600 1,165,264,800 2,936,000
Revised Estimate 2008/09 1,331,949,020 1,394,486,500 3,041,000
Budget Estimate 2009/10 1,296,021,810 1,349,231,520 2,961,000
Source: District Government, Abbottabad
A review of the financial releases made monthly by the provincial government to the district
government indicates that, in general, the funds released by the provincial government to the districtgovernment for salary purposes have never matched the related district estimates. The funds issued
under the heading of salaries have usually been 45 percent less than the district estimates. In this
way, the district has consistently been deprived of the financial benefit it could have secured by re-
allocating the savings under the salary head for new vacancies occurring during any financial year.
Furthermore, the practice of releasing funds on monthly basis creates hindrances in the effective
management of the salary budget.
In addition, employees of the department often face delays in the approval and release of the Revised
Estimates. The Medical Reimbursement Charges (MRCs) and Leave Salary, including Leave Encashment
admissible at the time of retirement, are the worst-hit subheadings of the salary budget. Being directly
related to the employees’ service benefits and to the motivation of employees, any negative effect hasa significant impact on the professional performance of the staff of this department. This is reportedly
one of the reasons for teachers’ unauthorized leave and for highly inflated and fake MRCs.
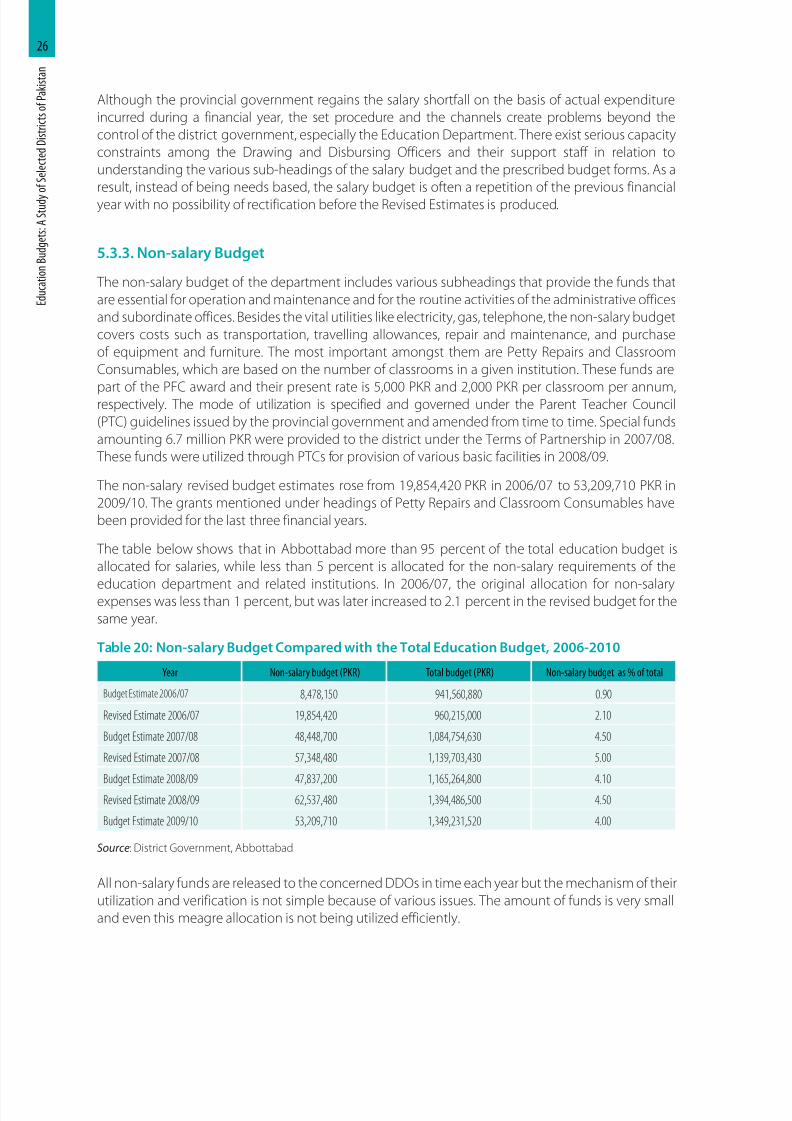
8/11/2019 Education Budgets
http://slidepdf.com/reader/full/education-budgets 35/71
E d u c a t i o n
B u d g e t s : A
S t u d y
o f S e l e c t e d
D i s t r i c t s o f P a k i s t a n
26
Although the provincial government regains the salary shortfall on the basis of actual expenditure
incurred during a financial year, the set procedure and the channels create problems beyond the
control of the district government, especially the Education Department. There exist serious capacity
constraints among the Drawing and Disbursing Officers and their support staff in relation to
understanding the various sub-headings of the salary budget and the prescribed budget forms. As a
result, instead of being needs based, the salary budget is often a repetition of the previous financial
year with no possibility of rectification before the Revised Estimates is produced.
5.3.3. Non-salary Budget
The non-salary budget of the department includes various subheadings that provide the funds that
are essential for operation and maintenance and for the routine activities of the administrative offices
and subordinate offices. Besides the vital utilities like electricity, gas, telephone, the non-salary budget
covers costs such as transportation, travelling allowances, repair and maintenance, and purchase
of equipment and furniture. The most important amongst them are Petty Repairs and Classroom
Consumables, which are based on the number of classrooms in a given institution. These funds are
part of the PFC award and their present rate is 5,000 PKR and 2,000 PKR per classroom per annum,respectively. The mode of utilization is specified and governed under the Parent Teacher Council
(PTC) guidelines issued by the provincial government and amended from time to time. Special funds
amounting 6.7 million PKR were provided to the district under the Terms of Partnership in 2007/08.
These funds were utilized through PTCs for provision of various basic facilities in 2008/09.
The non-salary revised budget estimates rose from 19,854,420 PKR in 2006/07 to 53,209,710 PKR in
2009/10. The grants mentioned under headings of Petty Repairs and Classroom Consumables have
been provided for the last three financial years.
The table below shows that in Abbottabad more than 95 percent of the total education budget is
allocated for salaries, while less than 5 percent is allocated for the non-salary requirements of the
education department and related institutions. In 2006/07, the original allocation for non-salaryexpenses was less than 1 percent, but was later increased to 2.1 percent in the revised budget for the
same year.
Table 20: Non-salary Budget Compared with the Total Education Budget, 2006-2010
Year Non-salary budget (PKR) Total budget (PKR) Non-salary budget as % of total
Budget Estimate 2006/07 8,478,150 941,560,880 0.90
Revised Estimate 2006/07 19,854,420 960,215,000 2.10
Budget Estimate 2007/08 48,448,700 1,084,754,630 4.50
Revised Estimate 2007/08 57,348,480 1,139,703,430 5.00
Budget Estimate 2008/09 47,837,200 1,165,264,800 4.10Revised Estimate 2008/09 62,537,480 1,394,486,500 4.50
Budget Estimate 2009/10 53,209,710 1,349,231,520 4.00
Source: District Government, Abbottabad
All non-salary funds are released to the concerned DDOs in time each year but the mechanism of their
utilization and verification is not simple because of various issues. The amount of funds is very small
and even this meagre allocation is not being utilized efficiently.
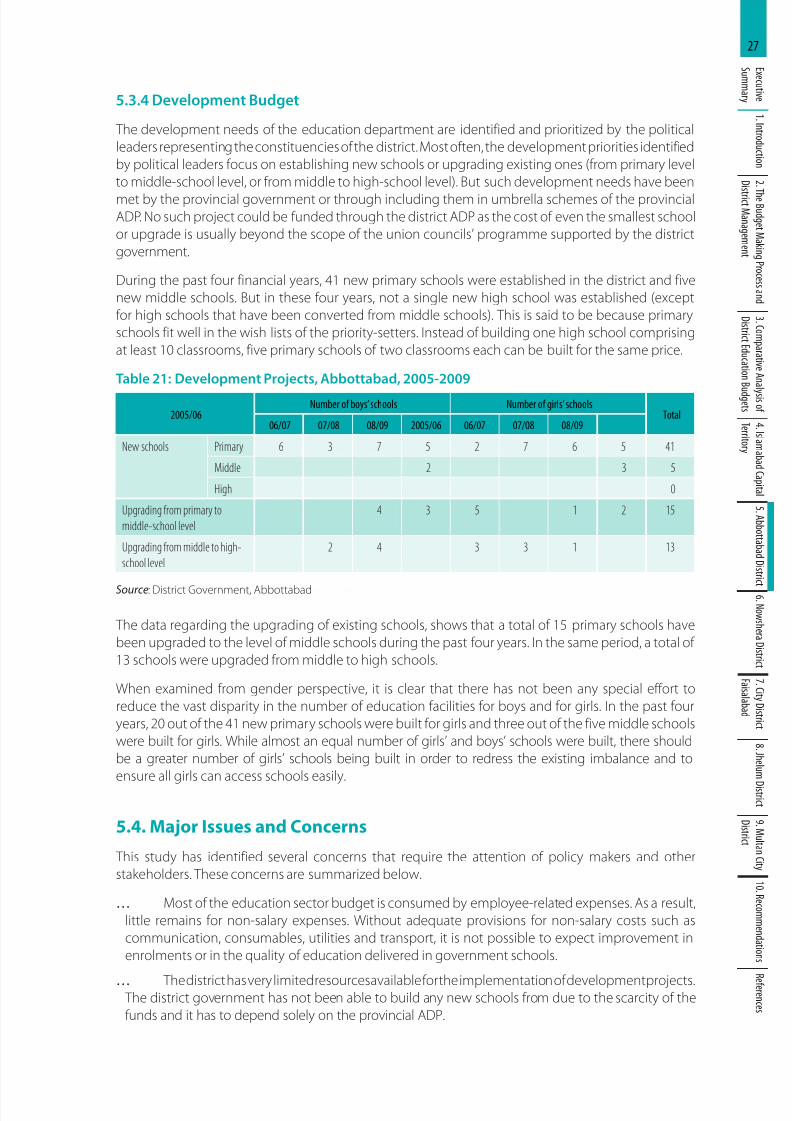
8/11/2019 Education Budgets
http://slidepdf.com/reader/full/education-budgets 36/71
27E x e c u t i v e
S u mm a r y
1 .I n t r o d u c t i o n
2 .T h e B u d g e t M a k i n
g P r o c e s s a n d
D i s
t r i c t M a n a g e m e n t
3 . C o m
p a r a t i v e A n a
l y s i s o f
D i s t r i c t E d u c a t i o n B
u d g e t s
4 .I s l a m a b a d C a p i t a l
T e r r i t o r y
5 .A b b o t t a b a d D i s t r i c
t 6 .N o w s h e r a D i s t r i c t
7 . C i t y D i s t r i c t
F a i s a l a b a d
8 . J h e l u m D i s t r i c t
9 .M u l t a n C i t y
D i s t r i c t
1 0 .R e c o mm e n d a t i o n s
R
e f e r e n c e s
5.3.4 Development Budget
The development needs of the education department are identified and prioritized by the political
leaders representing the constituencies of the district. Most often, the development priorities identified
by political leaders focus on establishing new schools or upgrading existing ones (from primary level
to middle-school level, or from middle to high-school level). But such development needs have been
met by the provincial government or through including them in umbrella schemes of the provincialADP. No such project could be funded through the district ADP as the cost of even the smallest school
or upgrade is usually beyond the scope of the union councils’ programme supported by the district
government.
During the past four financial years, 41 new primary schools were established in the district and five
new middle schools. But in these four years, not a single new high school was established (except
for high schools that have been converted from middle schools). This is said to be because primary
schools fit well in the wish lists of the priority-setters. Instead of building one high school comprising
at least 10 classrooms, five primary schools of two classrooms each can be built for the same price.
Table 21: Development Projects, Abbottabad, 2005-2009
2005/06Number of boys’ schools Number of girls’ schools
Total06/07 07/08 08/09 2005/06 06/07 07/08 08/09
New schools Primary 6 3 7 5 2 7 6 5 41
Middle 2 3 5
High 0
Upgrading from primary to
middle-school level
4 3 5 1 2 15
Upgrading from middle to high-
school level
2 4 3 3 1 13
Source: District Government, Abbottabad
The data regarding the upgrading of existing schools, shows that a total of 15 primary schools have
been upgraded to the level of middle schools during the past four years. In the same period, a total of
13 schools were upgraded from middle to high schools.
When examined from gender perspective, it is clear that there has not been any special effort to
reduce the vast disparity in the number of education facilities for boys and for girls. In the past four
years, 20 out of the 41 new primary schools were built for girls and three out of the five middle schools
were built for girls. While almost an equal number of girls’ and boys’ schools were built, there should
be a greater number of girls’ schools being built in order to redress the existing imbalance and to
ensure all girls can access schools easily.
5.4. Major Issues and Concerns
This study has identified several concerns that require the attention of policy makers and other
stakeholders. These concerns are summarized below.
… Most of the education sector budget is consumed by employee-related expenses. As a result,
little remains for non-salary expenses. Without adequate provisions for non-salary costs such as
communication, consumables, utilities and transport, it is not possible to expect improvement in
enrolments or in the quality of education delivered in government schools.
… The district has very limited resources available for the implementation of development projects. The district government has not been able to build any new schools from due to the scarcity of the
funds and it has to depend solely on the provincial ADP.
8/11/2019 Education Budgets
http://slidepdf.com/reader/full/education-budgets 37/71
E d u c a t i o n
B u d g e t s : A
S t u d y
o f S e l e c t e d
D i s t r i c t s o f P a k i s t a n
28
… The budget calendar, as provided in the Budget Rules of the Khyber Pakhtunkhwa Government, is
not strictly followed. As a result, the process of budget making, from preparation to implementation,
cannot be executed satisfactorily, and stakeholders are deprived of their right to participation.
… There is a vast disparity in the numbers of boys’ and girls’ educational facilities in Abbottabad but
little is being done to address this gap. Girls need more schools (than boys) to be able to have easy
access to education.
… Female teachers face difficulties when posted away from their places of residence. It is important
that they are adequately compensated and that they are able to easily get to work (e.g. through
providing transport to female teachers) and perform their duties.
5.5. Recommendations
In view of the findings of this study, the following recommendations are suggested.
… An increase is needed in the resources allocated through the PFC award and it is necessary that the
districts also improve their own resource generation capacity and efforts.
… It is necessary to increase the non-salary allocations considerably so that schools can operate
effectively.
… Efforts should be made to improve the procedures and the capacity of the staff to ensure that
schools can access and utilize the funds efficiently.
… The budgetary allocations should be subject to the performance of the relevant institutions. Such
Performance Based Budgeting, with a well defined monitoring policy, can help improve the quality
of education.
… All stakeholders, including the students, teachers and communities, should be consulted in the
process of identifying the budgetary needs of schools. Schools should highlight the priorities of the
students, teachers and parents at the time when they submit their proposals. … The Budget Calendar should be followed to ensure public participation in the process.
… Adequate provisions should be made for existing girls’ schools and to build new girls’ schools in
order to overcome the disparity in the numbers of educational institutions for boys and girls in the
district.
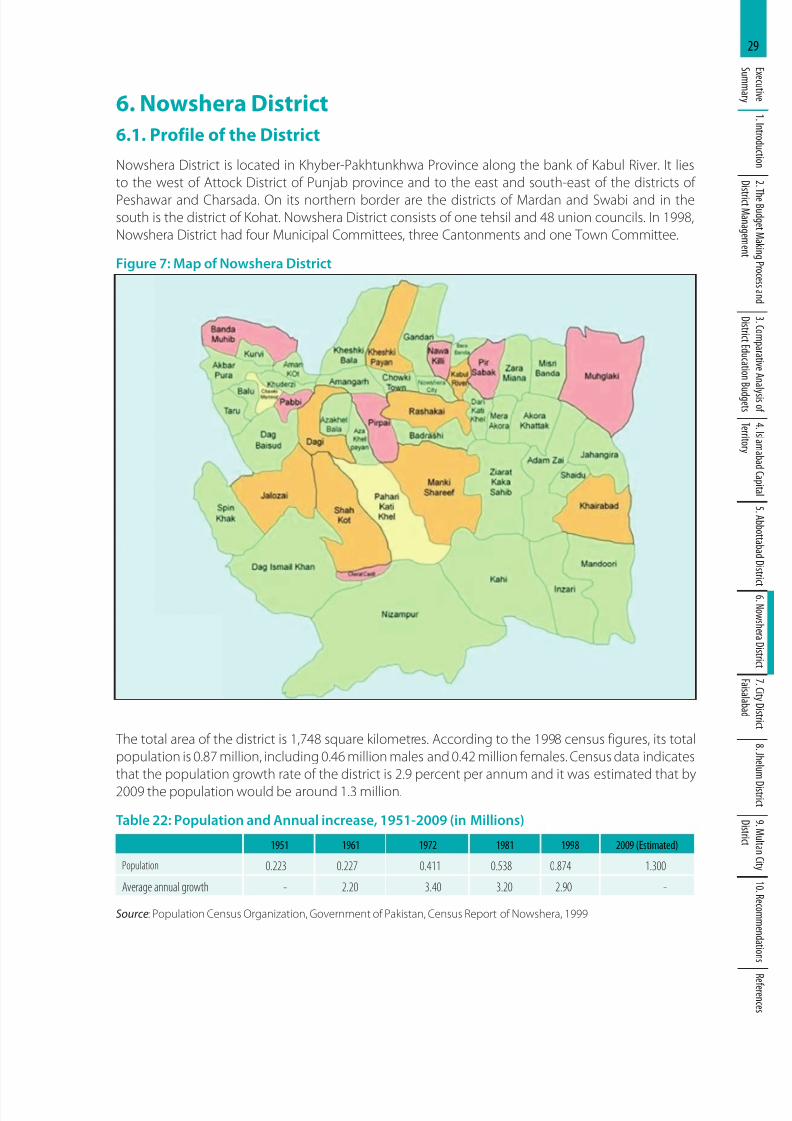
8/11/2019 Education Budgets
http://slidepdf.com/reader/full/education-budgets 38/71
29E x e c u t i v e
S u mm a r y
1 .I n t r o d u c t i o n
2 .T h e B u d g e t M a k i n
g P r o c e s s a n d
D i s
t r i c t M a n a g e m e n t
3 . C o m
p a r a t i v e A n a
l y s i s o f
D i s t r i c t E d u c a t i o n B
u d g e t s
4 .I s l a m a b a d C a p i t a l
T e r r i t o r y
5 .A b b o t t a b a d D i s t r i c
t 6 .N o w s h e r a D i s t r i c t
7 . C i t y D i s t r i c t
F a i s a l a b a d
8 . J h e l u m D i s t r i c t
9 .M u l t a n C i t y
D i s t r i c t
1 0 .R e c o mm e n d a t i o n s
R
e f e r e n c e s
6. Nowshera District
6.1. Profile of the District
Nowshera District is located in Khyber-Pakhtunkhwa Province along the bank of Kabul River. It lies
to the west of Attock District of Punjab province and to the east and south-east of the districts of
Peshawar and Charsada. On its northern border are the districts of Mardan and Swabi and in thesouth is the district of Kohat. Nowshera District consists of one tehsil and 48 union councils. In 1998,
Nowshera District had four Municipal Committees, three Cantonments and one Town Committee.
Figure 7: Map of Nowshera District
The total area of the district is 1,748 square kilometres. According to the 1998 census figures, its total
population is 0.87 million, including 0.46 million males and 0.42 million females. Census data indicates
that the population growth rate of the district is 2.9 percent per annum and it was estimated that by
2009 the population would be around 1.3 million.
Table 22: Population and Annual increase, 1951-2009 (in Millions)
1951 1961 1972 1981 1998 2009 (Estimated)
Population 0.223 0.227 0.411 0.538 0.874 1.300
Average annual growth - 2.20 3.40 3.20 2.90 -
Source: Population Census Organization, Government of Pakistan, Census Report of Nowshera, 1999
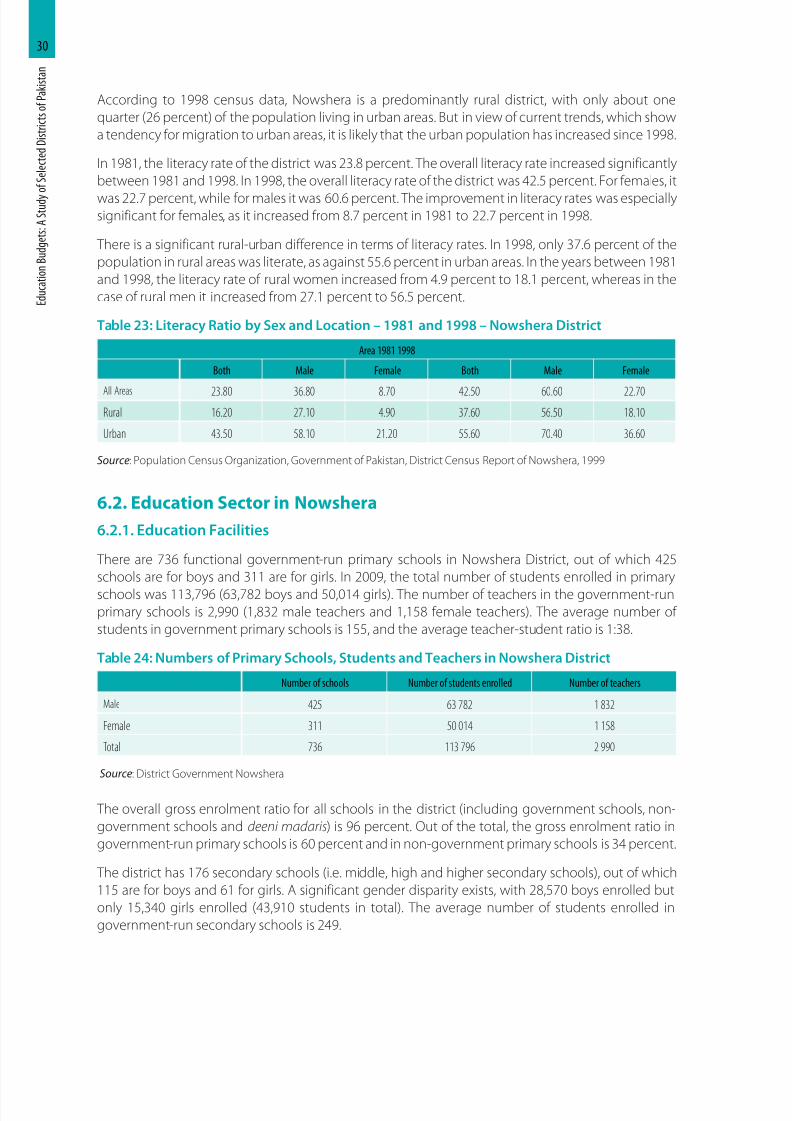
8/11/2019 Education Budgets
http://slidepdf.com/reader/full/education-budgets 39/71
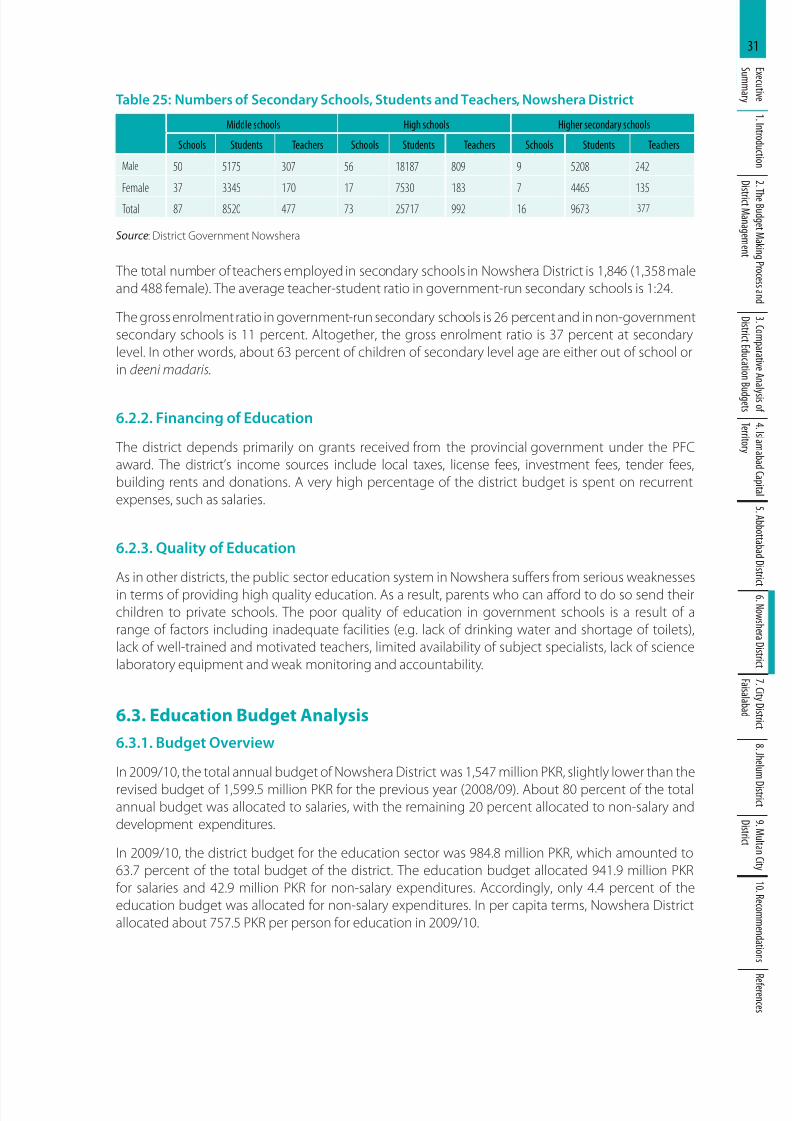
8/11/2019 Education Budgets
http://slidepdf.com/reader/full/education-budgets 40/71
31E x e c u t i v e
S u mm a r y
1 .I n t r o d u c t i o n
2 .T h e B u d g e t M a k i n
g P r o c e s s a n d
D i s
t r i c t M a n a g e m e n t
3 . C o m
p a r a t i v e A n a
l y s i s o f
D i s t r i c t E d u c a t i o n B
u d g e t s
4 .I s l a m a b a d C a p i t a l
T e r r i t o r y
5 .A b b o t t a b a d D i s t r i c
t 6 .N o w s h e r a D i s t r i c t
7 . C i t y D i s t r i c t
F a i s a l a b a d
8 . J h e l u m D i s t r i c t
9 .M u l t a n C i t y
D i s t r i c t
1 0 .R e c o mm e n d a t i o n s
R
e f e r e n c e s
Table 25: Numbers of Secondary Schools, Students and Teachers, Nowshera District
Middle schools High schools Higher secondary schools
Schools Students Teachers Schools Students Teachers Schools Students Teachers
Male 50 5175 307 56 18187 809 9 5208 242
Female 37 3345 170 17 7530 183 7 4465 135
Total 87 8520 477 73 25717 992 16 9673 377
Source: District Government Nowshera
The total number of teachers employed in secondary schools in Nowshera District is 1,846 (1,358 male
and 488 female). The average teacher-student ratio in government-run secondary schools is 1:24.
The gross enrolment ratio in government-run secondary schools is 26 percent and in non-government
secondary schools is 11 percent. Altogether, the gross enrolment ratio is 37 percent at secondary
level. In other words, about 63 percent of children of secondary level age are either out of school or
in deeni madaris.
6.2.2. Financing of Education
The district depends primarily on grants received from the provincial government under the PFC
award. The district’s income sources include local taxes, license fees, investment fees, tender fees,
building rents and donations. A very high percentage of the district budget is spent on recurrent
expenses, such as salaries.
6.2.3. Quality of Education
As in other districts, the public sector education system in Nowshera suffers from serious weaknesses
in terms of providing high quality education. As a result, parents who can afford to do so send theirchildren to private schools. The poor quality of education in government schools is a result of a
range of factors including inadequate facilities (e.g. lack of drinking water and shortage of toilets),
lack of well-trained and motivated teachers, limited availability of subject specialists, lack of science
laboratory equipment and weak monitoring and accountability.
6.3. Education Budget Analysis
6.3.1. Budget Overview
In 2009/10, the total annual budget of Nowshera District was 1,547 million PKR, slightly lower than the
revised budget of 1,599.5 million PKR for the previous year (2008/09). About 80 percent of the totalannual budget was allocated to salaries, with the remaining 20 percent allocated to non-salary and
development expenditures.
In 2009/10, the district budget for the education sector was 984.8 million PKR, which amounted to
63.7 percent of the total budget of the district. The education budget allocated 941.9 million PKR
for salaries and 42.9 million PKR for non-salary expenditures. Accordingly, only 4.4 percent of the
education budget was allocated for non-salary expenditures. In per capita terms, Nowshera District
allocated about 757.5 PKR per person for education in 2009/10.
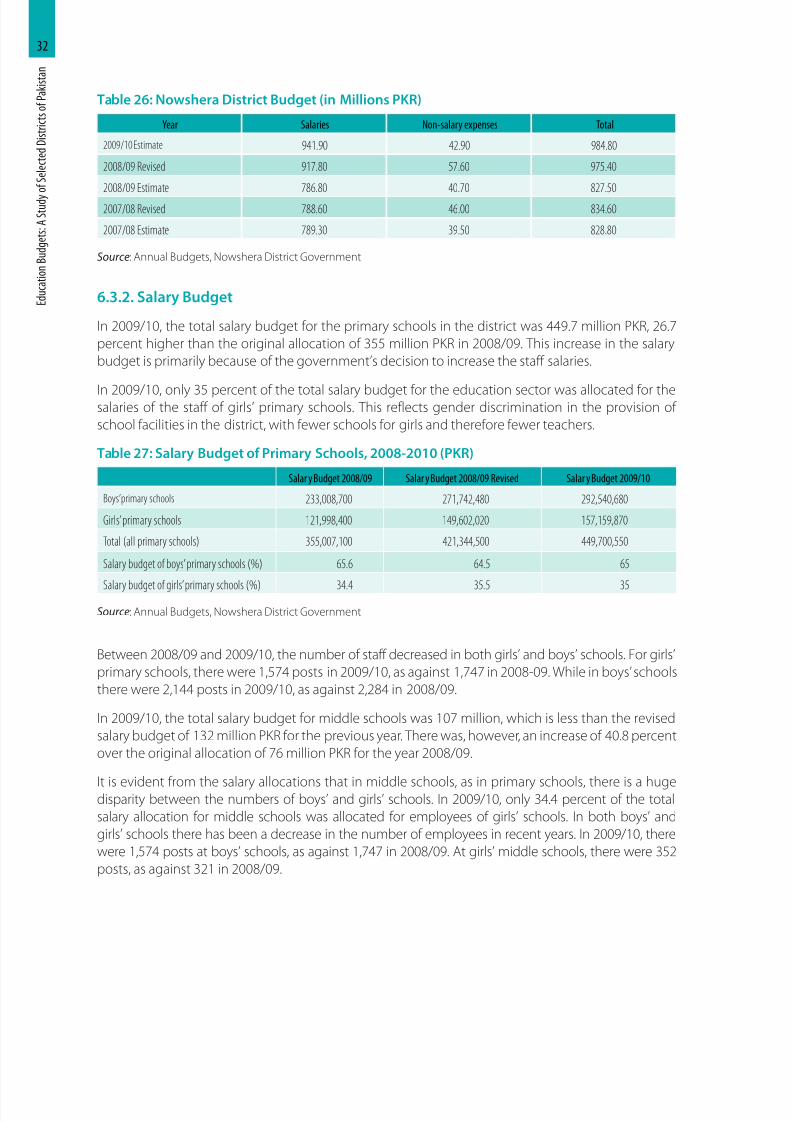
8/11/2019 Education Budgets
http://slidepdf.com/reader/full/education-budgets 41/71
E d u c a t i o n
B u d g e t s : A
S t u d y
o f S e l e c t e d
D i s t r i c t s o f P a k i s t a n
32
Table 26: Nowshera District Budget (in Millions PKR)
Year Salaries Non-salary expenses Total
2009/10 Estimate 941.90 42.90 984.80
2008/09 Revised 917.80 57.60 975.40
2008/09 Estimate 786.80 40.70 827.50
2007/08 Revised 788.60 46.00 834.60
2007/08 Estimate 789.30 39.50 828.80
Source: Annual Budgets, Nowshera District Government
6.3.2. Salary Budget
In 2009/10, the total salary budget for the primary schools in the district was 449.7 million PKR, 26.7
percent higher than the original allocation of 355 million PKR in 2008/09. This increase in the salary
budget is primarily because of the government’s decision to increase the staff salaries.
In 2009/10, only 35 percent of the total salary budget for the education sector was allocated for thesalaries of the staff of girls’ primary schools. This reflects gender discrimination in the provision of
school facilities in the district, with fewer schools for girls and therefore fewer teachers.
Table 27: Salary Budget of Primary Schools, 2008-2010 (PKR)
Salar y Budget 2008/09 Salar y Budget 2008/09 Revised Salar y Budget 2009/10
Boys’primary schools 233,008,700 271,742,480 292,540,680
Girls’primary schools 121,998,400 149,602,020 157,159,870
Total (all primary schools) 355,007,100 421,344,500 449,700,550
Salary budget of boys’primary schools (%) 65.6 64.5 65
Salary budget of girls’primary schools (%) 34.4 35.5 35
Source: Annual Budgets, Nowshera District Government
Between 2008/09 and 2009/10, the number of staff decreased in both girls’ and boys’ schools. For girls’
primary schools, there were 1,574 posts in 2009/10, as against 1,747 in 2008-09. While in boys’ schools
there were 2,144 posts in 2009/10, as against 2,284 in 2008/09.
In 2009/10, the total salary budget for middle schools was 107 million, which is less than the revised
salary budget of 132 million PKR for the previous year. There was, however, an increase of 40.8 percent
over the original allocation of 76 million PKR for the year 2008/09.
It is evident from the salary allocations that in middle schools, as in primary schools, there is a hugedisparity between the numbers of boys’ and girls’ schools. In 2009/10, only 34.4 percent of the total
salary allocation for middle schools was allocated for employees of girls’ schools. In both boys’ and
girls’ schools there has been a decrease in the number of employees in recent years. In 2009/10, there
were 1,574 posts at boys’ schools, as against 1,747 in 2008/09. At girls’ middle schools, there were 352
posts, as against 321 in 2008/09.
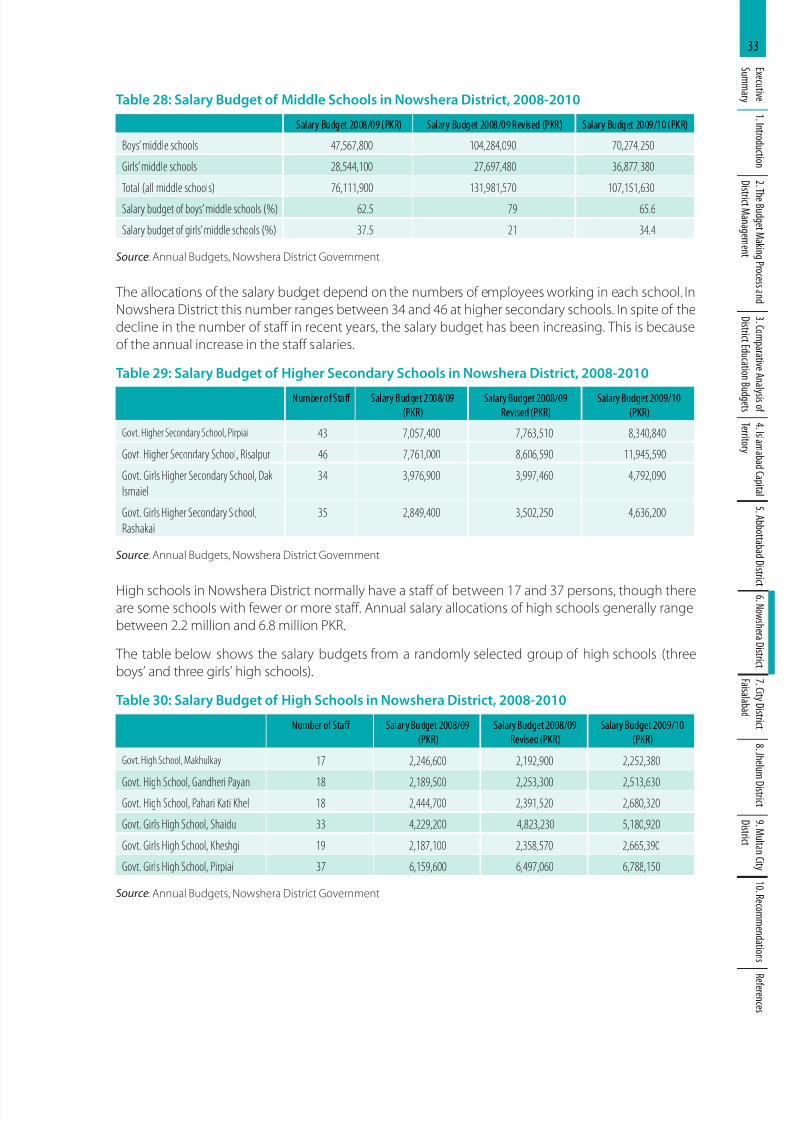
8/11/2019 Education Budgets
http://slidepdf.com/reader/full/education-budgets 42/71
33E x e c u t i v e
S u mm a r y
1 .I n t r o d u c t i o n
2 .T h e B u d g e t M a k i n
g P r o c e s s a n d
D i s
t r i c t M a n a g e m e n t
3 . C o m
p a r a t i v e A n a
l y s i s o f
D i s t r i c t E d u c a t i o n B
u d g e t s
4 .I s l a m a b a d C a p i t a l
T e r r i t o r y
5 .A b b o t t a b a d D i s t r i c
t 6 .N o w s h e r a D i s t r i c t
7 . C i t y D i s t r i c t
F a i s a l a b a d
8 . J h e l u m D i s t r i c t
9 .M u l t a n C i t y
D i s t r i c t
1 0 .R e c o mm e n d a t i o n s
R
e f e r e n c e s
Table 28: Salary Budget of Middle Schools in Nowshera District, 2008-2010
Salary Budget 2008/09 (PKR) Salary Budget 2008/09 Revised (PKR) Salary Budget 2009/10 (PKR)
Boys’middle schools 47,567,800 104,284,090 70,274,250
Girls’middle schools 28,544,100 27,697,480 36,877,380
Total (all middle schools) 76,111,900 131,981,570 107,151,630
Salary budget of boys’middle schools (%) 62.5 79 65.6
Salary budget of girls’middle schools (%) 37.5 21 34.4
Source: Annual Budgets, Nowshera District Government
The allocations of the salary budget depend on the numbers of employees working in each school. In
Nowshera District this number ranges between 34 and 46 at higher secondary schools. In spite of the
decline in the number of staff in recent years, the salary budget has been increasing. This is because
of the annual increase in the staff salaries.
Table 29: Salary Budget of Higher Secondary Schools in Nowshera District, 2008-2010
Number of Staff Salary Budget 2008/09
(PKR)
Salary Budget 2008/09
Revised (PKR)
Salary Budget 2009/10
(PKR)
Govt. Higher Secondary School, Pirpiai 43 7,057,400 7,763,510 8,340,840
Govt. Higher Secondary School, Risalpur 46 7,761,000 8,606,590 11,945,590
Govt. Girls Higher Secondary School, Dak
Ismaiel
34 3,976,900 3,997,460 4,792,090
Govt. Girls Higher Secondary School,
Rashakai
35 2,849,400 3,502,250 4,636,200
Source: Annual Budgets, Nowshera District Government
High schools in Nowshera District normally have a staff of between 17 and 37 persons, though thereare some schools with fewer or more staff. Annual salary allocations of high schools generally range
between 2.2 million and 6.8 million PKR.
The table below shows the salary budgets from a randomly selected group of high schools (three
boys’ and three girls’ high schools).
Table 30: Salary Budget of High Schools in Nowshera District, 2008-2010
Number of Staff Salar y Bu dget 2008/09
(PKR)
Salary Budget 2008/09
Revised (PKR)
Salary Budget 2009/10
(PKR)
Govt. High School, Makhulkay 17 2,246,600 2,192,900 2,252,380
Govt. High School, Gandheri Payan 18 2,189,500 2,253,300 2,513,630Govt. High School, Pahari Kati Khel 18 2,444,700 2,391,520 2,680,320
Govt. Girls High School, Shaidu 33 4,229,200 4,823,230 5,180,920
Govt. Girls High School, Kheshgi 19 2,187,100 2,358,570 2,665,390
Govt. Girls High School, Pirpiai 37 6,159,600 6,497,060 6,788,150
Source: Annual Budgets, Nowshera District Government
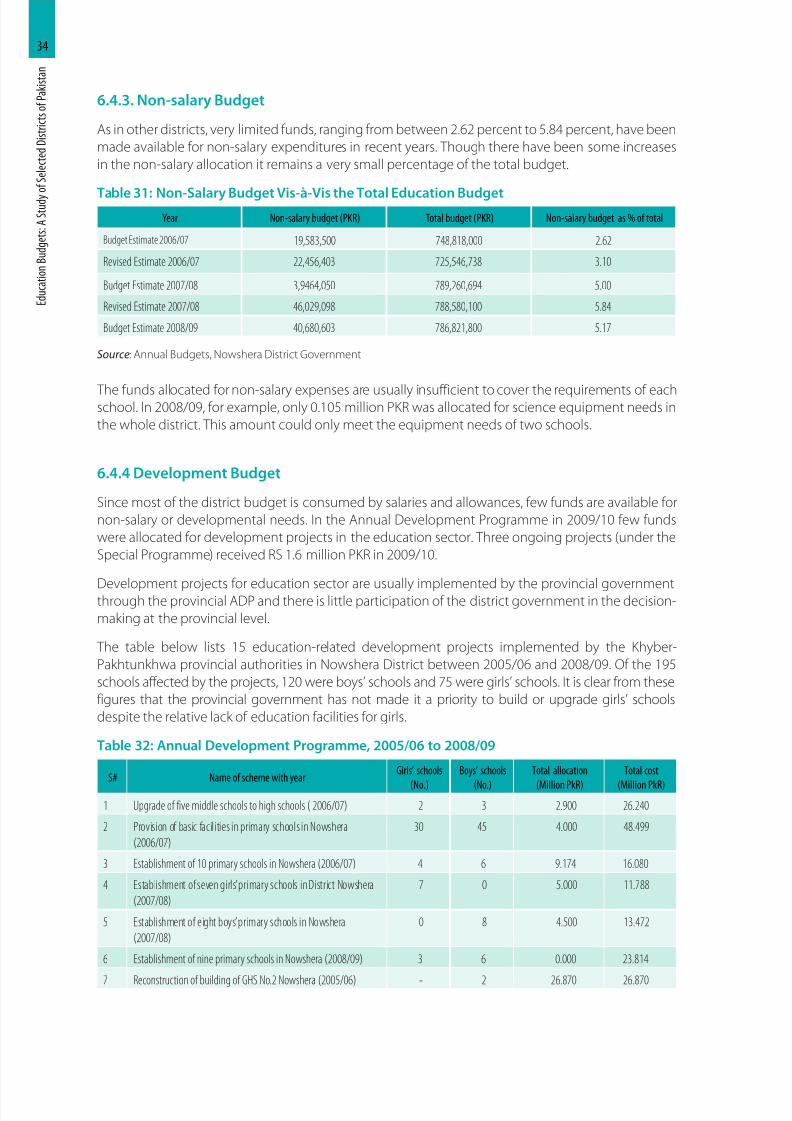
8/11/2019 Education Budgets
http://slidepdf.com/reader/full/education-budgets 43/71
E d u c a t i o n
B u d g e t s : A
S t u d y
o f S e l e c t e d
D i s t r i c t s o f P a k i s t a n
34
6.4.3. Non-salary Budget
As in other districts, very limited funds, ranging from between 2.62 percent to 5.84 percent, have been
made available for non-salary expenditures in recent years. Though there have been some increases
in the non-salary allocation it remains a very small percentage of the total budget.
Table 31: Non-Salary Budget Vis-à-Vis the Total Education BudgetYear Non-salary budget (PKR) Total budget (PKR) Non-salary budget as % of total
Budget Estimate 2006/07 19,583,500 748,818,000 2.62
Revised Estimate 2006/07 22,456,403 725,546,738 3.10
Budget Estimate 2007/08 3,9464,050 789,260,694 5.00
Revised Estimate 2007/08 46,029,098 788,580,100 5.84
Budget Estimate 2008/09 40,680,603 786,821,800 5.17
Source: Annual Budgets, Nowshera District Government
The funds allocated for non-salary expenses are usually insufficient to cover the requirements of eachschool. In 2008/09, for example, only 0.105 million PKR was allocated for science equipment needs in
the whole district. This amount could only meet the equipment needs of two schools.
6.4.4 Development Budget
Since most of the district budget is consumed by salaries and allowances, few funds are available for
non-salary or developmental needs. In the Annual Development Programme in 2009/10 few funds
were allocated for development projects in the education sector. Three ongoing projects (under the
Special Programme) received RS 1.6 million PKR in 2009/10.
Development projects for education sector are usually implemented by the provincial governmentthrough the provincial ADP and there is little participation of the district government in the decision-
making at the provincial level.
The table below lists 15 education-related development projects implemented by the Khyber-
Pakhtunkhwa provincial authorities in Nowshera District between 2005/06 and 2008/09. Of the 195
schools affected by the projects, 120 were boys’ schools and 75 were girls’ schools. It is clear from these
figures that the provincial government has not made it a priority to build or upgrade girls’ schools
despite the relative lack of education facilities for girls.
Table 32: Annual Development Programme, 2005/06 to 2008/09
S# Name of scheme with yearGirls’ schools
(No.)
Boys’ schools
(No.)
Total allocation
(Million PkR)
Total cost
(Million PkR)
1 Upgrade of five middle schools to high schools ( 2006/07) 2 3 2.900 26.240
2 Provision of basic facilities in primary schools in Nowshera
(2006/07)
30 45 4.000 48.499
3 Establishment of 10 primary schools in Nowshera (2006/07) 4 6 9.174 16.080
4 Establishment of seven girls’primary schools in District Nowshera
(2007/08)
7 0 5.000 11.788
5 Establishment of eight boys’primary schools in Nowshera
(2007/08)
0 8 4.500 13.472
6 Establishment of nine primary schools in Nowshera (2008/09) 3 6 0.000 23.814
7 Reconstruction of building of GHS No.2 Nowshera (2005/06) - 2 26.870 26.870
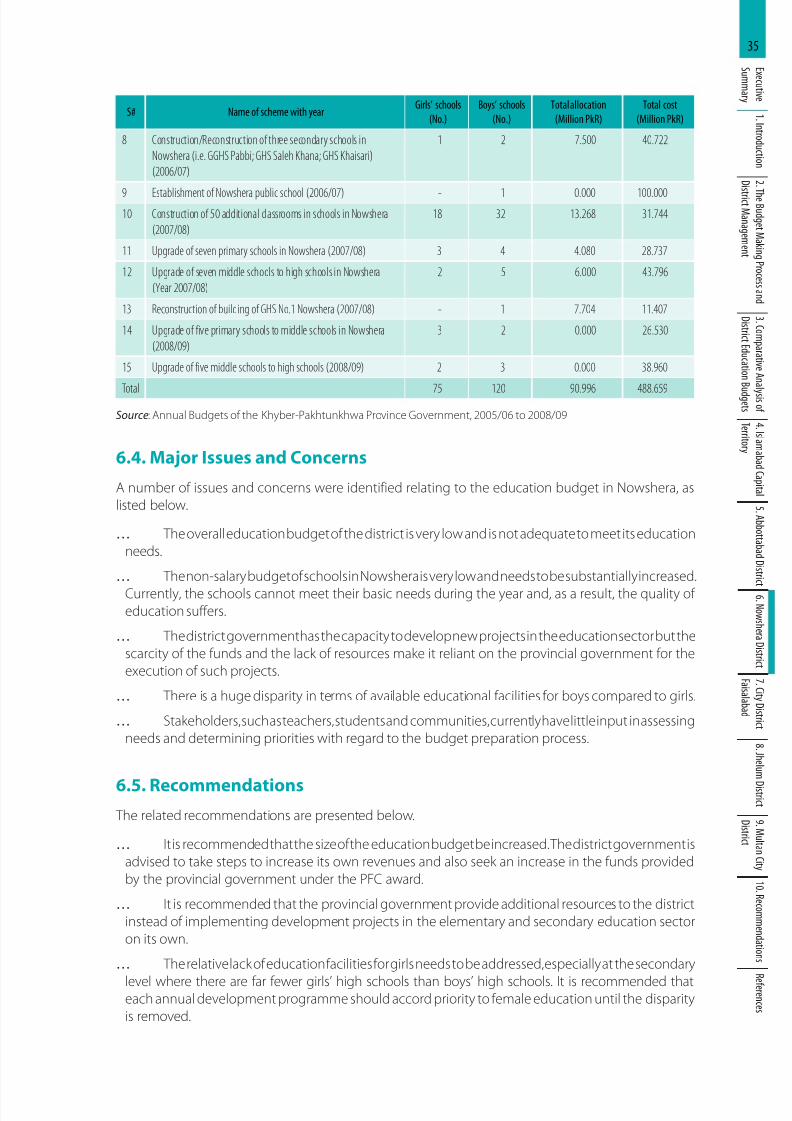
8/11/2019 Education Budgets
http://slidepdf.com/reader/full/education-budgets 44/71
35E x e c u t i v e
S u mm a r y
1 .I n t r o d u c t i o n
2 .T h e B u d g e t M a k i n
g P r o c e s s a n d
D i s
t r i c t M a n a g e m e n t
3 . C o m
p a r a t i v e A n a
l y s i s o f
D i s t r i c t E d u c a t i o n B
u d g e t s
4 .I s l a m a b a d C a p i t a l
T e r r i t o r y
5 .A b b o t t a b a d D i s t r i c
t 6 .N o w s h e r a D i s t r i c t
7 . C i t y D i s t r i c t
F a i s a l a b a d
8 . J h e l u m D i s t r i c t
9 .M u l t a n C i t y
D i s t r i c t
1 0 .R e c o mm e n d a t i o n s
R
e f e r e n c e s
S# Name of scheme with yearGirls’ schools
(No.)
Boys’ schools
(No.)
Total allocation
(Million PkR)
Total cost
(Million PkR)
8 Construction/Reconstruction of three secondary schools in
Nowshera (i.e. GGHS Pabbi; GHS Saleh Khana; GHS Khaisari)
(2006/07)
1 2 7.500 40.722
9 Establishment of Nowshera public school (2006/07) - 1 0.000 100.00010 Construction of 50 additional classrooms in schools in Nowshera
(2007/08)
18 32 13.268 31.744
11 Upgrade of seven primary schools in Nowshera (2007/08) 3 4 4.080 28.737
12 Upgrade of seven middle schools to high schools in Nowshera
(Year 2007/08)
2 5 6.000 43.796
13 Reconstruction of building of GHS No.1 Nowshera (2007/08) - 1 7.704 11.407
14 Upgrade of five primary schools to middle schools in Nowshera
(2008/09)
3 2 0.000 26.530
15 Upgrade of five middle schools to high schools (2008/09) 2 3 0.000 38.960
Total 75 120 90.996 488.659
Source: Annual Budgets of the Khyber-Pakhtunkhwa Province Government, 2005/06 to 2008/09
6.4. Major Issues and Concerns
A number of issues and concerns were identified relating to the education budget in Nowshera, as
listed below.
… The overall education budget of the district is very low and is not adequate to meet its education
needs.
… The non-salary budget of schools in Nowshera is very low and needs to be substantially increased.
Currently, the schools cannot meet their basic needs during the year and, as a result, the quality ofeducation suffers.
… The district government has the capacity to develop new projects in the education sector but the
scarcity of the funds and the lack of resources make it reliant on the provincial government for the
execution of such projects.
… There is a huge disparity in terms of available educational facilities for boys compared to girls.
… Stakeholders, such as teachers, students and communities, currently have little input in assessing
needs and determining priorities with regard to the budget preparation process.
6.5. Recommendations The related recommendations are presented below.
… It is recommended that the size of the education budget be increased. The district government is
advised to take steps to increase its own revenues and also seek an increase in the funds provided
by the provincial government under the PFC award.
… It is recommended that the provincial government provide additional resources to the district
instead of implementing development projects in the elementary and secondary education sector
on its own.
… The relative lack of education facilities for girls needs to be addressed, especially at the secondary
level where there are far fewer girls’ high schools than boys’ high schools. It is recommended thateach annual development programme should accord priority to female education until the disparity
is removed.
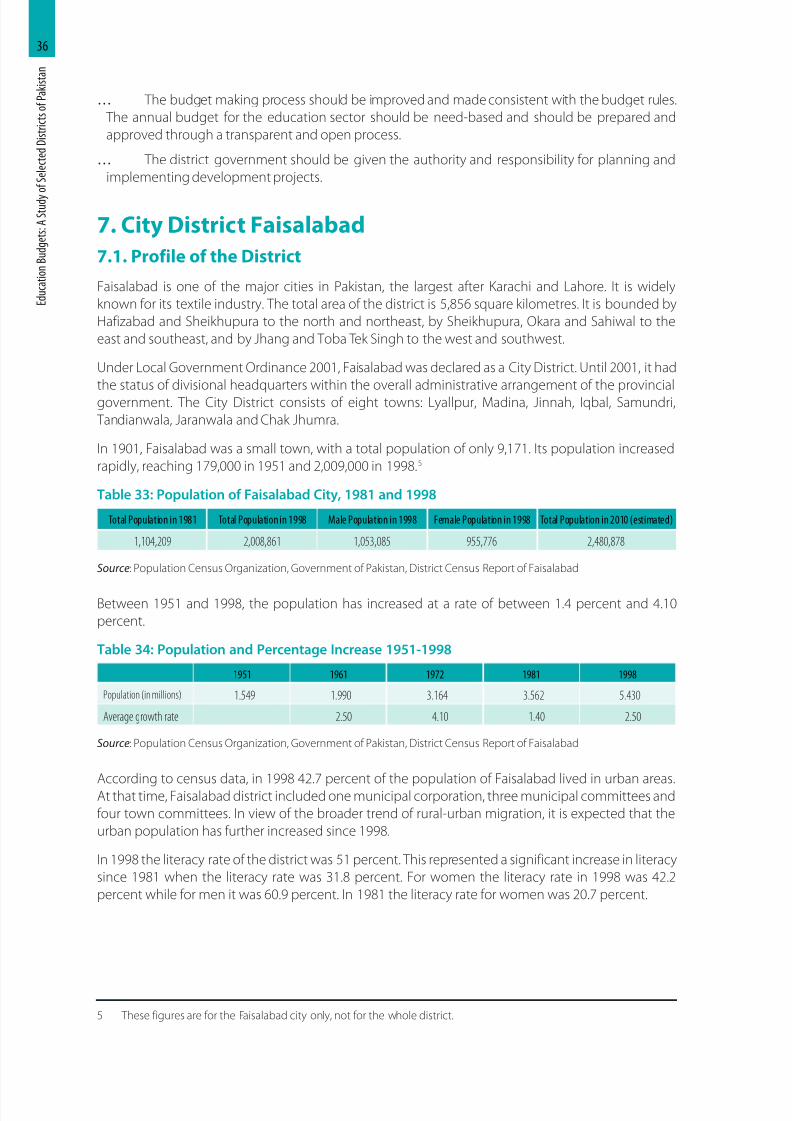
8/11/2019 Education Budgets
http://slidepdf.com/reader/full/education-budgets 45/71
E d u c a t i o n
B u d g e t s : A
S t u d y
o f S e l e c t e d
D i s t r i c t s o f P a k i s t a n
36
… The budget making process should be improved and made consistent with the budget rules.
The annual budget for the education sector should be need-based and should be prepared and
approved through a transparent and open process.
… The district government should be given the authority and responsibility for planning and
implementing development projects.
7. City District Faisalabad
7.1. Profile of the District
Faisalabad is one of the major cities in Pakistan, the largest after Karachi and Lahore. It is widely
known for its textile industry. The total area of the district is 5,856 square kilometres. It is bounded by
Hafizabad and Sheikhupura to the north and northeast, by Sheikhupura, Okara and Sahiwal to the
east and southeast, and by Jhang and Toba Tek Singh to the west and southwest.
Under Local Government Ordinance 2001, Faisalabad was declared as a City District. Until 2001, it had
the status of divisional headquarters within the overall administrative arrangement of the provincial
government. The City District consists of eight towns: Lyallpur, Madina, Jinnah, Iqbal, Samundri,
Tandianwala, Jaranwala and Chak Jhumra.
In 1901, Faisalabad was a small town, with a total population of only 9,171. Its population increased
rapidly, reaching 179,000 in 1951 and 2,009,000 in 1998.5
Table 33: Population of Faisalabad City, 1981 and 1998
Total Population in 1981 Total Population in 1998 Male Population in 1998 Female Population in 1998 Total Population in 2010 (estimated)
1,104,209 2,008,861 1,053,085 955,776 2,480,878
Source: Population Census Organization, Government of Pakistan, District Census Report of Faisalabad
Between 1951 and 1998, the population has increased at a rate of between 1.4 percent and 4.10
percent.
Table 34: Population and Percentage Increase 1951-1998
1951 1961 1972 1981 1998
Population (in millions) 1.549 1.990 3.164 3.562 5.430
Average growth rate 2.50 4.10 1.40 2.50
Source: Population Census Organization, Government of Pakistan, District Census Report of Faisalabad
According to census data, in 1998 42.7 percent of the population of Faisalabad lived in urban areas.At that time, Faisalabad district included one municipal corporation, three municipal committees and
four town committees. In view of the broader trend of rural-urban migration, it is expected that the
urban population has further increased since 1998.
In 1998 the literacy rate of the district was 51 percent. This represented a significant increase in literacy
since 1981 when the literacy rate was 31.8 percent. For women the literacy rate in 1998 was 42.2
percent while for men it was 60.9 percent. In 1981 the literacy rate for women was 20.7 percent.
5 These figures are for the Faisalabad city only, not for the whole district.
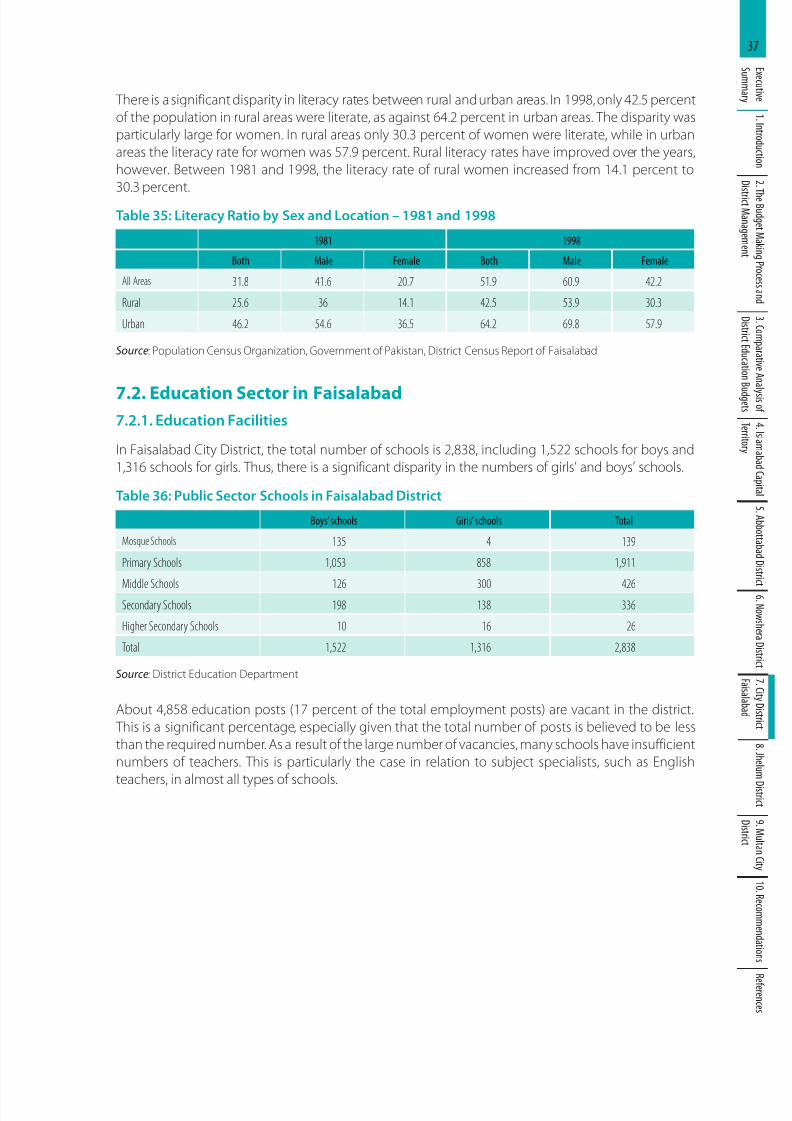
8/11/2019 Education Budgets
http://slidepdf.com/reader/full/education-budgets 46/71
37E x e c u t i v e
S u mm a r y
1 .I n t r o d u c t i o n
2 .T h e B u d g e t M a k i n
g P r o c e s s a n d
D i s
t r i c t M a n a g e m e n t
3 . C o m
p a r a t i v e A n a
l y s i s o f
D i s t r i c t E d u c a t i o n B
u d g e t s
4 .I s l a m a b a d C a p i t a l
T e r r i t o r y
5 .A b b o t t a b a d D i s t r i c
t 6 .N o w s h e r a D i s t r i c t
7 . C i t y D i s t r i c t
F a i s a l a b a d
8 . J h e l u m D i s t r i c t
9 .M u l t a n C i t y
D i s t r i c t
1 0 .R e c o mm e n d a t i o n s
R
e f e r e n c e s
There is a significant disparity in literacy rates between rural and urban areas. In 1998, only 42.5 percent
of the population in rural areas were literate, as against 64.2 percent in urban areas. The disparity was
particularly large for women. In rural areas only 30.3 percent of women were literate, while in urban
areas the literacy rate for women was 57.9 percent. Rural literacy rates have improved over the years,
however. Between 1981 and 1998, the literacy rate of rural women increased from 14.1 percent to
30.3 percent.
Table 35: Literacy Ratio by Sex and Location – 1981 and 1998
1981 1998
Both Male Female Both Male Female
All Areas 31.8 41.6 20.7 51.9 60.9 42.2
Rural 25.6 36 14.1 42.5 53.9 30.3
Urban 46.2 54.6 36.5 64.2 69.8 57.9
Source: Population Census Organization, Government of Pakistan, District Census Report of Faisalabad
7.2. Education Sector in Faisalabad7.2.1. Education Facilities
In Faisalabad City District, the total number of schools is 2,838, including 1,522 schools for boys and
1,316 schools for girls. Thus, there is a significant disparity in the numbers of girls’ and boys’ schools.
Table 36: Public Sector Schools in Faisalabad District
Boys’ schools Girls’ schools Total
Mosque Schools 135 4 139
Primary Schools 1,053 858 1,911
Middle Schools 126 300 426Secondary Schools 198 138 336
Higher Secondary Schools 10 16 26
Total 1,522 1,316 2,838
Source: District Education Department
About 4,858 education posts (17 percent of the total employment posts) are vacant in the district.
This is a significant percentage, especially given that the total number of posts is believed to be less
than the required number. As a result of the large number of vacancies, many schools have insufficient
numbers of teachers. This is particularly the case in relation to subject specialists, such as English
teachers, in almost all types of schools.
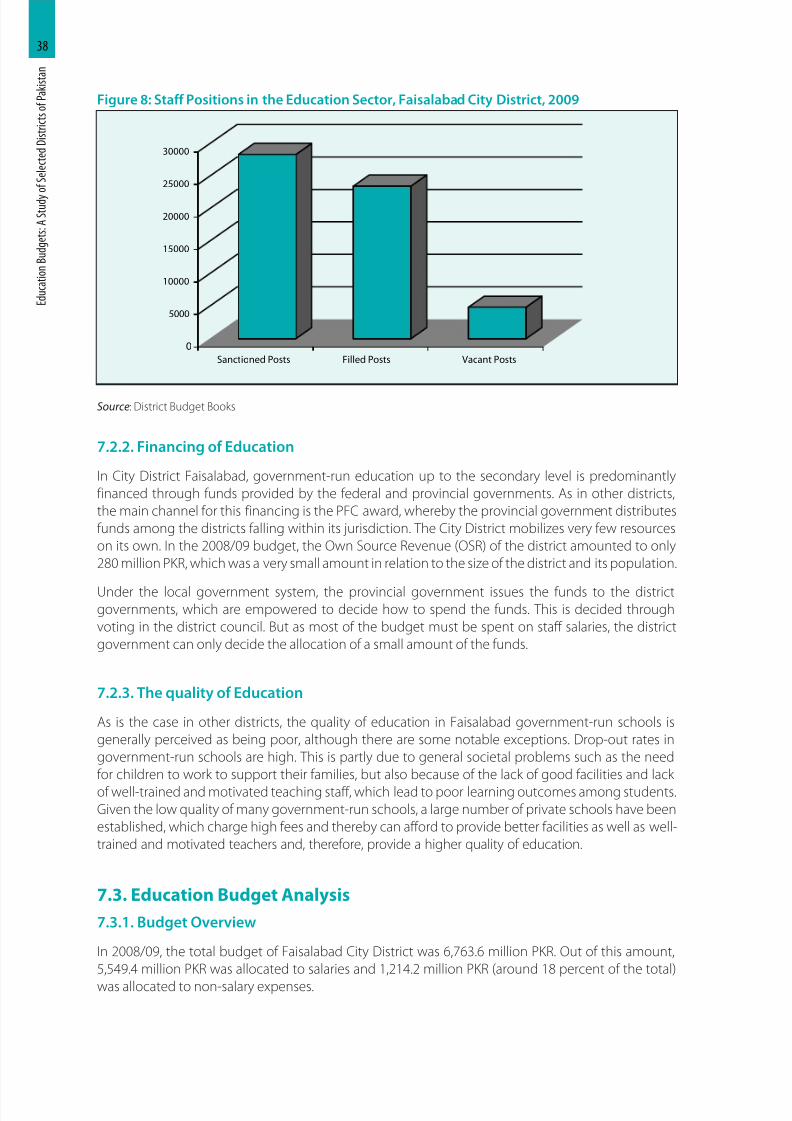
8/11/2019 Education Budgets
http://slidepdf.com/reader/full/education-budgets 47/71
E d u c a t i o n
B u d g e t s : A
S t u d y
o f S e l e c t e d
D i s t r i c t s o f P a k i s t a n
38
Figure 8: Staff Positions in the Education Sector, Faisalabad City District, 2009
0
5000
10000
15000
20000
25000
30000
Sanctioned Posts Filled Posts Vacant Posts
Source: District Budget Books
7.2.2. Financing of Education
In City District Faisalabad, government-run education up to the secondary level is predominantly
financed through funds provided by the federal and provincial governments. As in other districts,
the main channel for this financing is the PFC award, whereby the provincial government distributes
funds among the districts falling within its jurisdiction. The City District mobilizes very few resources
on its own. In the 2008/09 budget, the Own Source Revenue (OSR) of the district amounted to only
280 million PKR, which was a very small amount in relation to the size of the district and its population.
Under the local government system, the provincial government issues the funds to the districtgovernments, which are empowered to decide how to spend the funds. This is decided through
voting in the district council. But as most of the budget must be spent on staff salaries, the district
government can only decide the allocation of a small amount of the funds.
7.2.3. The quality of Education
As is the case in other districts, the quality of education in Faisalabad government-run schools is
generally perceived as being poor, although there are some notable exceptions. Drop-out rates in
government-run schools are high. This is partly due to general societal problems such as the need
for children to work to support their families, but also because of the lack of good facilities and lack
of well-trained and motivated teaching staff, which lead to poor learning outcomes among students.
Given the low quality of many government-run schools, a large number of private schools have been
established, which charge high fees and thereby can afford to provide better facilities as well as well-
trained and motivated teachers and, therefore, provide a higher quality of education.
7.3. Education Budget Analysis
7.3.1. Budget Overview
In 2008/09, the total budget of Faisalabad City District was 6,763.6 million PKR. Out of this amount,
5,549.4 million PKR was allocated to salaries and 1,214.2 million PKR (around 18 percent of the total)
was allocated to non-salary expenses.
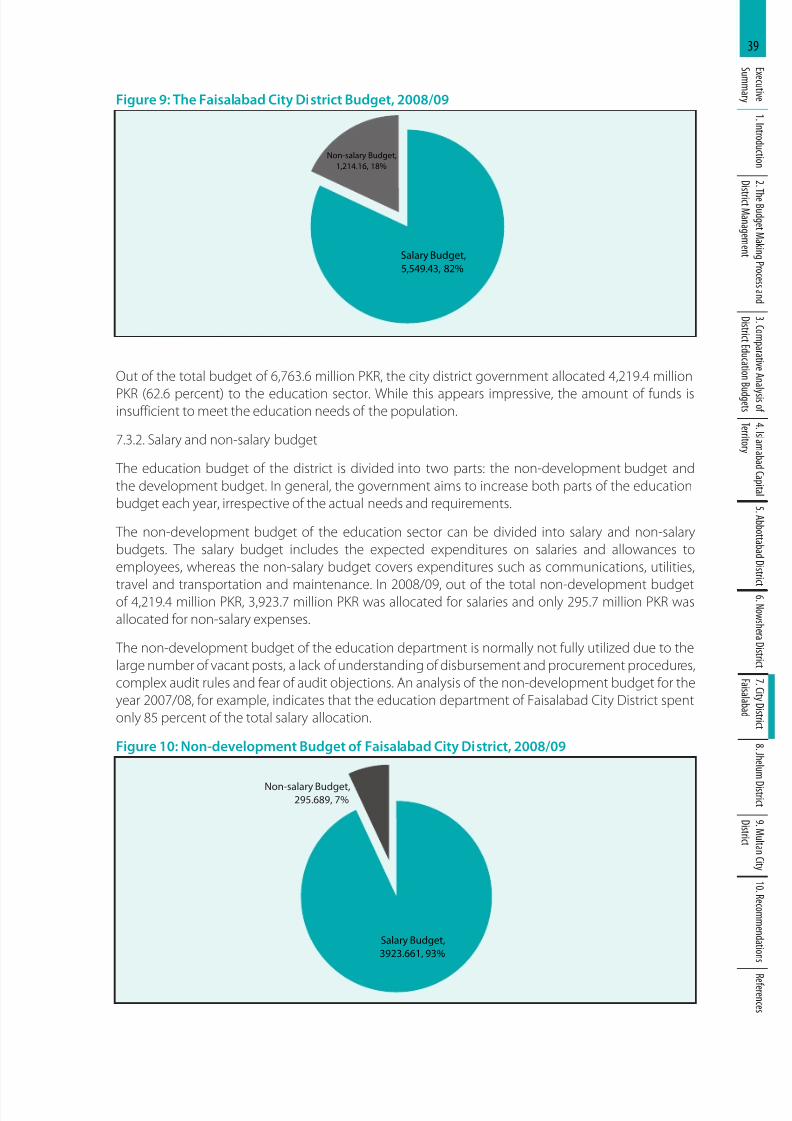
8/11/2019 Education Budgets
http://slidepdf.com/reader/full/education-budgets 48/71
39E x e c u t i v e
S u mm a r y
1 .I n t r o d u c t i o n
2 .T h e B u d g e t M a k i n
g P r o c e s s a n d
D i s
t r i c t M a n a g e m e n t
3 . C o m
p a r a t i v e A n a
l y s i s o f
D i s t r i c t E d u c a t i o n B
u d g e t s
4 .I s l a m a b a d C a p i t a l
T e r r i t o r y
5 .A b b o t t a b a d D i s t r i c
t 6 .N o w s h e r a D i s t r i c t
7 . C i t y D i s t r i c t
F a i s a l a b a d
8 . J h e l u m D i s t r i c t
9 .M u l t a n C i t y
D i s t r i c t
1 0 .R e c o mm e n d a t i o n s
R
e f e r e n c e s
Figure 9: The Faisalabad City District Budget, 2008/09
Non-salary Budget,
1,214.16, 18%
Salary Budget,
5,549.43, 82%
Out of the total budget of 6,763.6 million PKR, the city district government allocated 4,219.4 million
PKR (62.6 percent) to the education sector. While this appears impressive, the amount of funds isinsufficient to meet the education needs of the population.
7.3.2. Salary and non-salary budget
The education budget of the district is divided into two parts: the non-development budget and
the development budget. In general, the government aims to increase both parts of the education
budget each year, irrespective of the actual needs and requirements.
The non-development budget of the education sector can be divided into salary and non-salary
budgets. The salary budget includes the expected expenditures on salaries and allowances to
employees, whereas the non-salary budget covers expenditures such as communications, utilities,
travel and transportation and maintenance. In 2008/09, out of the total non-development budgetof 4,219.4 million PKR, 3,923.7 million PKR was allocated for salaries and only 295.7 million PKR was
allocated for non-salary expenses.
The non-development budget of the education department is normally not fully utilized due to the
large number of vacant posts, a lack of understanding of disbursement and procurement procedures,
complex audit rules and fear of audit objections. An analysis of the non-development budget for the
year 2007/08, for example, indicates that the education department of Faisalabad City District spent
only 85 percent of the total salary allocation.
Figure 10: Non-development Budget of Faisalabad City District, 2008/09
Salary Budget,
3923.661, 93%
Non-salary Budget,295.689, 7%
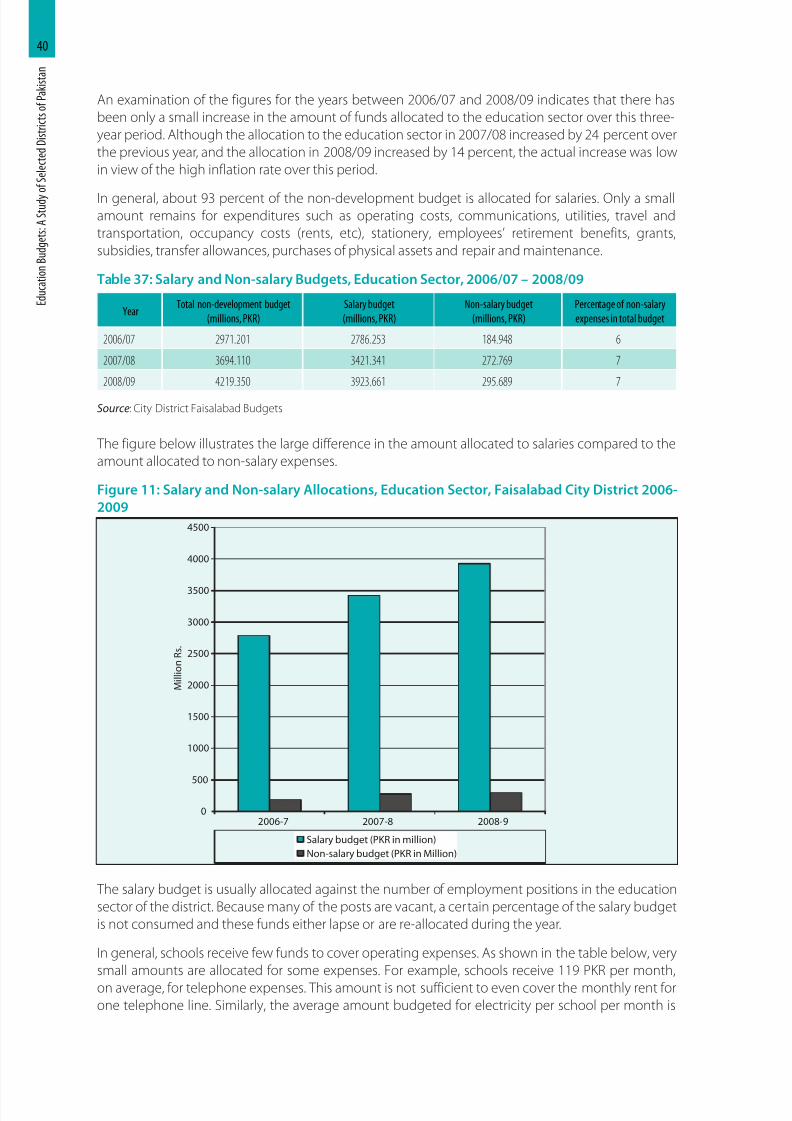
8/11/2019 Education Budgets
http://slidepdf.com/reader/full/education-budgets 49/71
E d u c a t i o n
B u d g e t s : A
S t u d y
o f S e l e c t e d
D i s t r i c t s o f P a k i s t a n
40
An examination of the figures for the years between 2006/07 and 2008/09 indicates that there has
been only a small increase in the amount of funds allocated to the education sector over this three-
year period. Although the allocation to the education sector in 2007/08 increased by 24 percent over
the previous year, and the allocation in 2008/09 increased by 14 percent, the actual increase was low
in view of the high inflation rate over this period.
In general, about 93 percent of the non-development budget is allocated for salaries. Only a smallamount remains for expenditures such as operating costs, communications, utilities, travel and
transportation, occupancy costs (rents, etc), stationery, employees’ retirement benefits, grants,
subsidies, transfer allowances, purchases of physical assets and repair and maintenance.
Table 37: Salary and Non-salary Budgets, Education Sector, 2006/07 – 2008/09
YearTotal non-development budget
(millions, PKR)
Salary budget
(millions, PKR)
Non-salary budget
(millions, PKR)
Percentage of non-salary
expenses in total budget
2006/07 2971.201 2786.253 184.948 6
2007/08 3694.110 3421.341 272.769 7
2008/09 4219.350 3923.661 295.689 7
Source: City District Faisalabad Budgets
The figure below illustrates the large difference in the amount allocated to salaries compared to the
amount allocated to non-salary expenses.
Figure 11: Salary and Non-salary Allocations, Education Sector, Faisalabad City District 2006-
2009
0
500
2006-7 2007-8 2008-9
1000
1500
2000
2500
3000
3500
4000
4500
M i l l i o n R s .
Salary budget (PKR in million)
Non-salary budget (PKR in Million)
The salary budget is usually allocated against the number of employment positions in the education
sector of the district. Because many of the posts are vacant, a certain percentage of the salary budget
is not consumed and these funds either lapse or are re-allocated during the year.
In general, schools receive few funds to cover operating expenses. As shown in the table below, very
small amounts are allocated for some expenses. For example, schools receive 119 PKR per month,
on average, for telephone expenses. This amount is not sufficient to even cover the monthly rent forone telephone line. Similarly, the average amount budgeted for electricity per school per month is
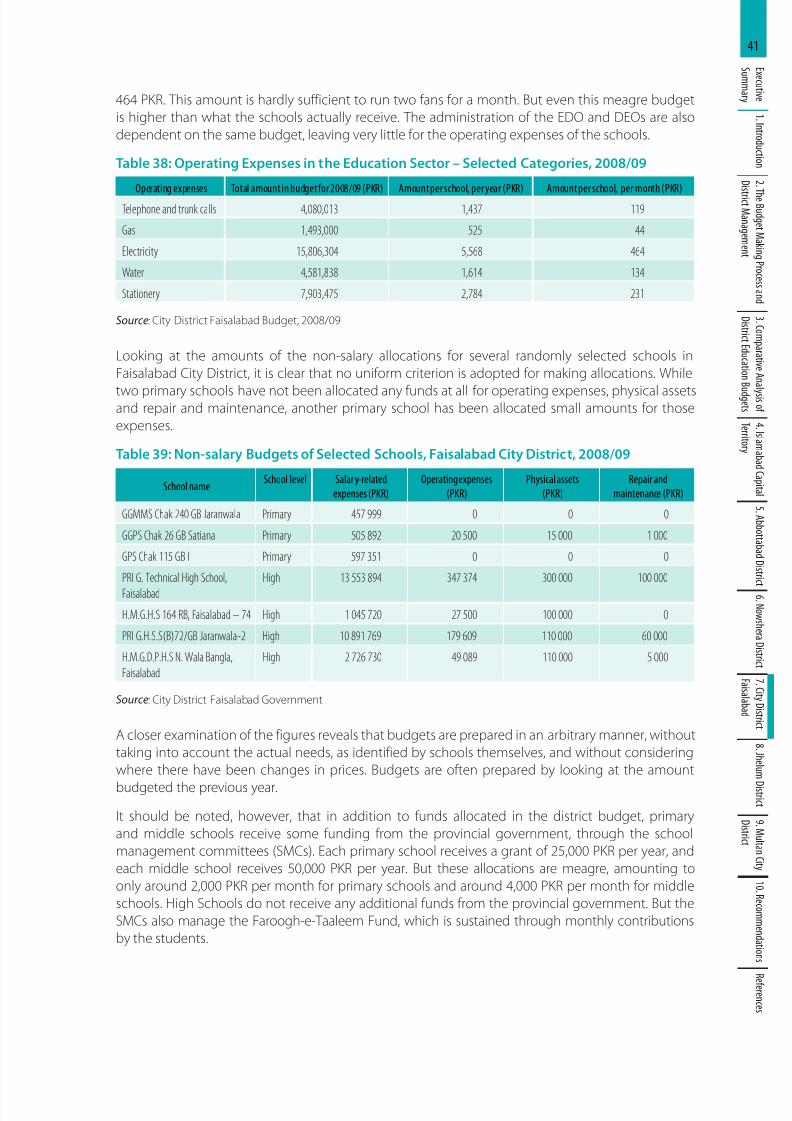
8/11/2019 Education Budgets
http://slidepdf.com/reader/full/education-budgets 50/71
41E x e c u t i v e
S u mm a r y
1 .I n t r o d u c t i o n
2 .T h e B u d g e t M a k i n
g P r o c e s s a n d
D i s
t r i c t M a n a g e m e n t
3 . C o m
p a r a t i v e A n a
l y s i s o f
D i s t r i c t E d u c a t i o n B
u d g e t s
4 .I s l a m a b a d C a p i t a l
T e r r i t o r y
5 .A b b o t t a b a d D i s t r i c
t 6 .N o w s h e r a D i s t r i c t
7 . C i t y D i s t r i c t
F a i s a l a b a d
8 . J h e l u m D i s t r i c t
9 .M u l t a n C i t y
D i s t r i c t
1 0 .R e c o mm e n d a t i o n s
R
e f e r e n c e s
464 PKR. This amount is hardly sufficient to run two fans for a month. But even this meagre budget
is higher than what the schools actually receive. The administration of the EDO and DEOs are also
dependent on the same budget, leaving very little for the operating expenses of the schools.
Table 38: Operating Expenses in the Education Sector – Selected Categories, 2008/09
Operating expenses Total amount in budget for 2008/09 (PKR) Amount per school, per year (PKR) Amount per school, per month (PKR)
Telephone and trunk calls 4,080,013 1,437 119
Gas 1,493,000 525 44
Electricity 15,806,304 5,568 464
Water 4,581,838 1,614 134
Stationery 7,903,475 2,784 231
Source: City District Faisalabad Budget, 2008/09
Looking at the amounts of the non-salary allocations for several randomly selected schools in
Faisalabad City District, it is clear that no uniform criterion is adopted for making allocations. While
two primary schools have not been allocated any funds at all for operating expenses, physical assetsand repair and maintenance, another primary school has been allocated small amounts for those
expenses.
Table 39: Non-salary Budgets of Selected Schools, Faisalabad City District, 2008/09
School nameSchool level Salar y-related
expenses (PKR)
Operating expenses
(PKR)
Physical assets
(PKR)
Repair and
maintenance (PKR)
GGMMS Chak 240 GB Jaranwala Primary 457 999 0 0 0
GGPS Chak 26 GB Satiana Primary 505 892 20 500 15 000 1 000
GPS Chak 115 GB I Primary 597 351 0 0 0
PRI G. Technical High School,
Faisalabad
High 13 553 894 347 374 300 000 100 000
H.M.G.H.S 164 RB, Faisalabad – 74 High 1 045 720 27 500 100 000 0
PRI G.H.S.S(B)72/GB Jaranwala-2 High 10 891 769 179 609 110 000 60 000
H.M.G.D.P.H.S N. Wala Bangla,
Faisalabad
High 2 726 730 49 089 110 000 5 000
Source: City District Faisalabad Government
A closer examination of the figures reveals that budgets are prepared in an arbitrary manner, without
taking into account the actual needs, as identified by schools themselves, and without considering
where there have been changes in prices. Budgets are often prepared by looking at the amount
budgeted the previous year.
It should be noted, however, that in addition to funds allocated in the district budget, primary
and middle schools receive some funding from the provincial government, through the school
management committees (SMCs). Each primary school receives a grant of 25,000 PKR per year, and
each middle school receives 50,000 PKR per year. But these allocations are meagre, amounting to
only around 2,000 PKR per month for primary schools and around 4,000 PKR per month for middle
schools. High Schools do not receive any additional funds from the provincial government. But the
SMCs also manage the Faroogh-e-Taaleem Fund, which is sustained through monthly contributions
by the students.
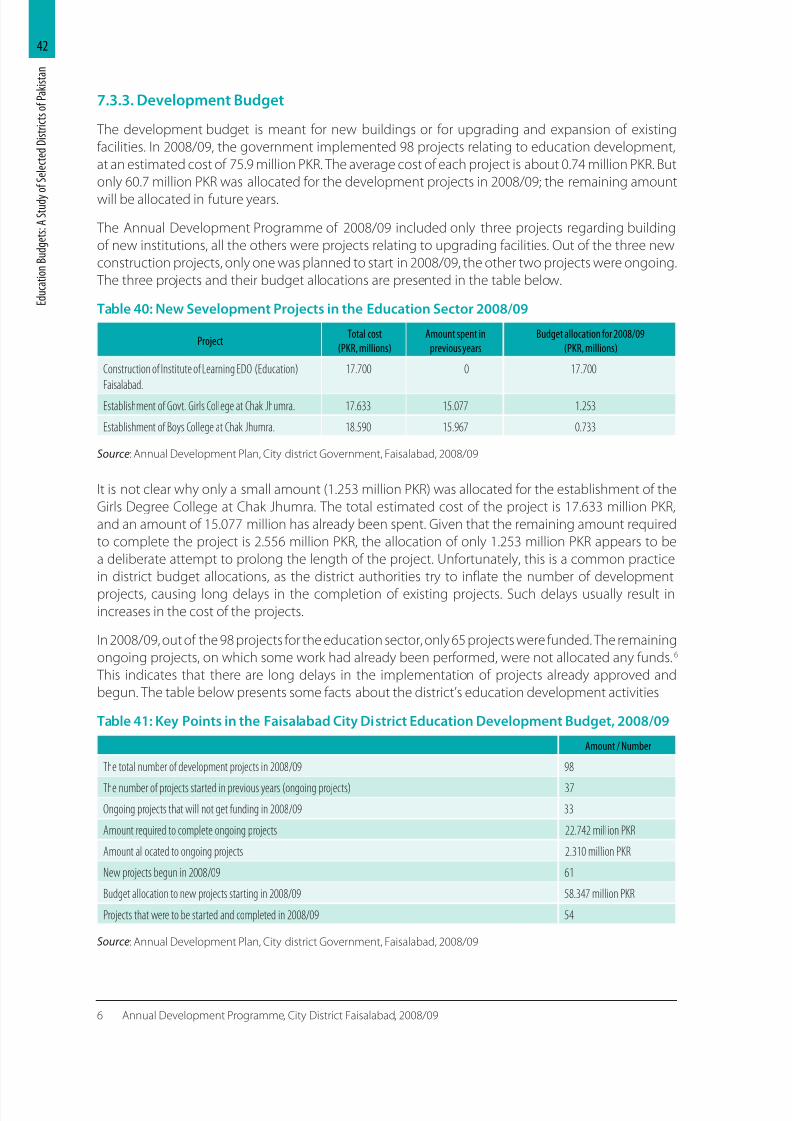
8/11/2019 Education Budgets
http://slidepdf.com/reader/full/education-budgets 51/71
E d u c a t i o n
B u d g e t s : A
S t u d y
o f S e l e c t e d
D i s t r i c t s o f P a k i s t a n
42
7.3.3. Development Budget
The development budget is meant for new buildings or for upgrading and expansion of existing
facilities. In 2008/09, the government implemented 98 projects relating to education development,
at an estimated cost of 75.9 million PKR. The average cost of each project is about 0.74 million PKR. But
only 60.7 million PKR was allocated for the development projects in 2008/09; the remaining amount
will be allocated in future years.
The Annual Development Programme of 2008/09 included only three projects regarding building
of new institutions, all the others were projects relating to upgrading facilities. Out of the three new
construction projects, only one was planned to start in 2008/09, the other two projects were ongoing.
The three projects and their budget allocations are presented in the table below.
Table 40: New Sevelopment Projects in the Education Sector 2008/09
ProjectTotal cost
(PKR, millions)
Amount spent in
previous years
Budget allocation for 2008/09
(PKR, millions)
Construction of Institute of Learning EDO (Education)
Faisalabad.
17.700 0 17.700
Establishment of Govt. Girls College at Chak Jhumra. 17.633 15.077 1.253
Establishment of Boys College at Chak Jhumra. 18.590 15.967 0.733
Source: Annual Development Plan, City district Government, Faisalabad, 2008/09
It is not clear why only a small amount (1.253 million PKR) was allocated for the establishment of the
Girls Degree College at Chak Jhumra. The total estimated cost of the project is 17.633 million PKR,
and an amount of 15.077 million has already been spent. Given that the remaining amount required
to complete the project is 2.556 million PKR, the allocation of only 1.253 million PKR appears to be
a deliberate attempt to prolong the length of the project. Unfortunately, this is a common practice
in district budget allocations, as the district authorities try to inflate the number of development
projects, causing long delays in the completion of existing projects. Such delays usually result inincreases in the cost of the projects.
In 2008/09, out of the 98 projects for the education sector, only 65 projects were funded. The remaining
ongoing projects, on which some work had already been performed, were not allocated any funds.6
This indicates that there are long delays in the implementation of projects already approved and
begun. The table below presents some facts about the district’s education development activities
Table 41: Key Points in the Faisalabad City District Education Development Budget, 2008/09
Amount / Number
The total number of development projects in 2008/09 98
The number of projects started in previous years (ongoing projects) 37
Ongoing projects that will not get funding in 2008/09 33
Amount required to complete ongoing projects 22.742 million PKR
Amount allocated to ongoing projects 2.310 million PKR
New projects begun in 2008/09 61
Budget allocation to new projects starting in 2008/09 58.347 million PKR
Projects that were to be started and completed in 2008/09 54
Source: Annual Development Plan, City district Government, Faisalabad, 2008/09
6 Annual Development Programme, City District Faisalabad, 2008/09
8/11/2019 Education Budgets
http://slidepdf.com/reader/full/education-budgets 52/71
43E x e c u t i v e
S u mm a r y
1 .I n t r o d u c t i o n
2 .T h e B u d g e t M a k i n
g P r o c e s s a n d
D i s
t r i c t M a n a g e m e n t
3 . C o m
p a r a t i v e A n a
l y s i s o f
D i s t r i c t E d u c a t i o n B
u d g e t s
4 .I s l a m a b a d C a p i t a l
T e r r i t o r y
5 .A b b o t t a b a d D i s t r i c
t 6 .N o w s h e r a D i s t r i c t
7 . C i t y D i s t r i c t
F a i s a l a b a d
8 . J h e l u m D i s t r i c t
9 .M u l t a n C i t y
D i s t r i c t
1 0 .R e c o mm e n d a t i o n s
R
e f e r e n c e s
7.4. Major Issues and Concerns
The issues and concerns identified in relation to the education budget of Faisalabad City District are
presented below.
… The total number of official posts in the education department of Faisalabad City District is 28,351.
This includes both teachers and support staff. Out of the total, 17 percent of the posts are vacant,including over 3,000 teaching staff positions.
… Even though the districts have responsibility for the education sector, the district authorities have
little autonomy over recruiting new staff or rationalizing staff requirements according to changing
needs.
… The district government does not undertake needs based budgeting in the education sector. The
budget for non-salary items is distributed on the basis of the number of classrooms. This approach
benefits only the schools that have proper buildings and not the schools without adequate buildings
(about 15 percent of the schools).
… The ad-hoc nature of education planning is particularly visible in the education development
budgets. There is a tendency to ignore ongoing development projects and initiate new projects. This wastes the money that has been spent on ongoing projects in previous years.
… The funds provided to SMCs by the provincial government are not in line with the needs of the
associated schools.
7.5. Recommendations
The related recommendations are presented below.
… Vacant posts should be filled immediately to ensure that schools have adequate staff numbers.
… District education authorities should be given more powers for local decision making, so that theycan perform their responsibilities more effectively and efficiently.
… The education department should initiate needs based budgeting at the school level, so that budget
allocations more realistic and responsive to actual needs.
… As few funds are available for development projects, careful plans should be made for spending
these funds and ongoing projects should be completed within a set timeframe.
… Non-salary allocations should be increased significantly so that schools can meet their operational
needs. At the same time, a mechanism should be devised to ensure that the procedure for receiving
the allocations is easy and transparent so that the schools can put their plans into practice effectively.
… The procedure of providing grants should be improved and made needs-based. There is also room
for improving the capacity of SMCs for utilizing transfers in a transparent and judicious manner.
… The budgetary allocations should be subject to the performance of the institutions. Such
performance based budgeting, with a well defined monitoring policy, would help improve the
quality of education.
… All stakeholders, including the students and communities, should be able to participate in the
process of identifying the budgetary needs of the schools. This should be made possible at the time
when schools must submit their requirements in response to the Budget Call Letter.
… Adequate provisions should be made for the existing girls’ schools and efforts should be made to
reduce the difference in the numbers of educational institutions for boys and girls in the district.
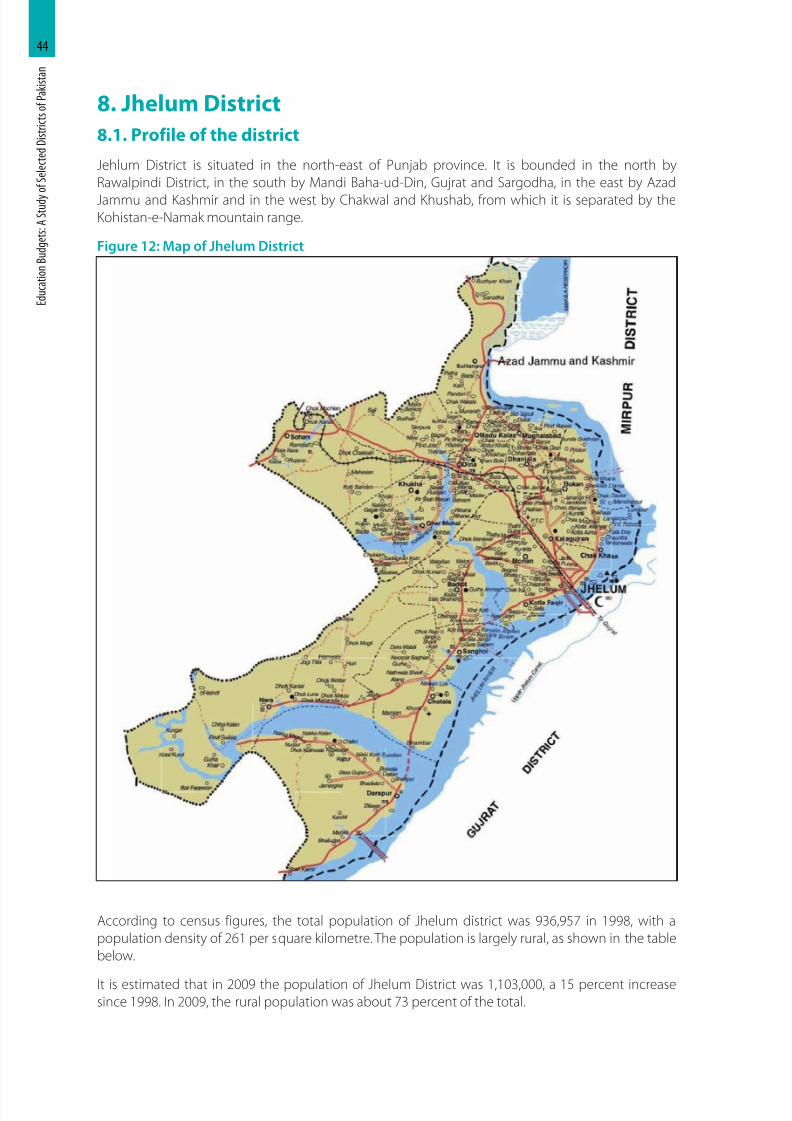
8/11/2019 Education Budgets
http://slidepdf.com/reader/full/education-budgets 53/71
E d u c a t i o n
B u d g e t s : A
S t u d y
o f S e l e c t e d
D i s t r i c t s o f P a k i s t a n
44
8. Jhelum District
8.1. Profile of the district
Jehlum District is situated in the north-east of Punjab province. It is bounded in the north by
Rawalpindi District, in the south by Mandi Baha-ud-Din, Gujrat and Sargodha, in the east by Azad
Jammu and Kashmir and in the west by Chakwal and Khushab, from which it is separated by theKohistan-e-Namak mountain range.
Figure 12: Map of Jhelum District
According to census figures, the total population of Jhelum district was 936,957 in 1998, with a
population density of 261 per square kilometre. The population is largely rural, as shown in the table
below.
It is estimated that in 2009 the population of Jhelum District was 1,103,000, a 15 percent increasesince 1998. In 2009, the rural population was about 73 percent of the total.
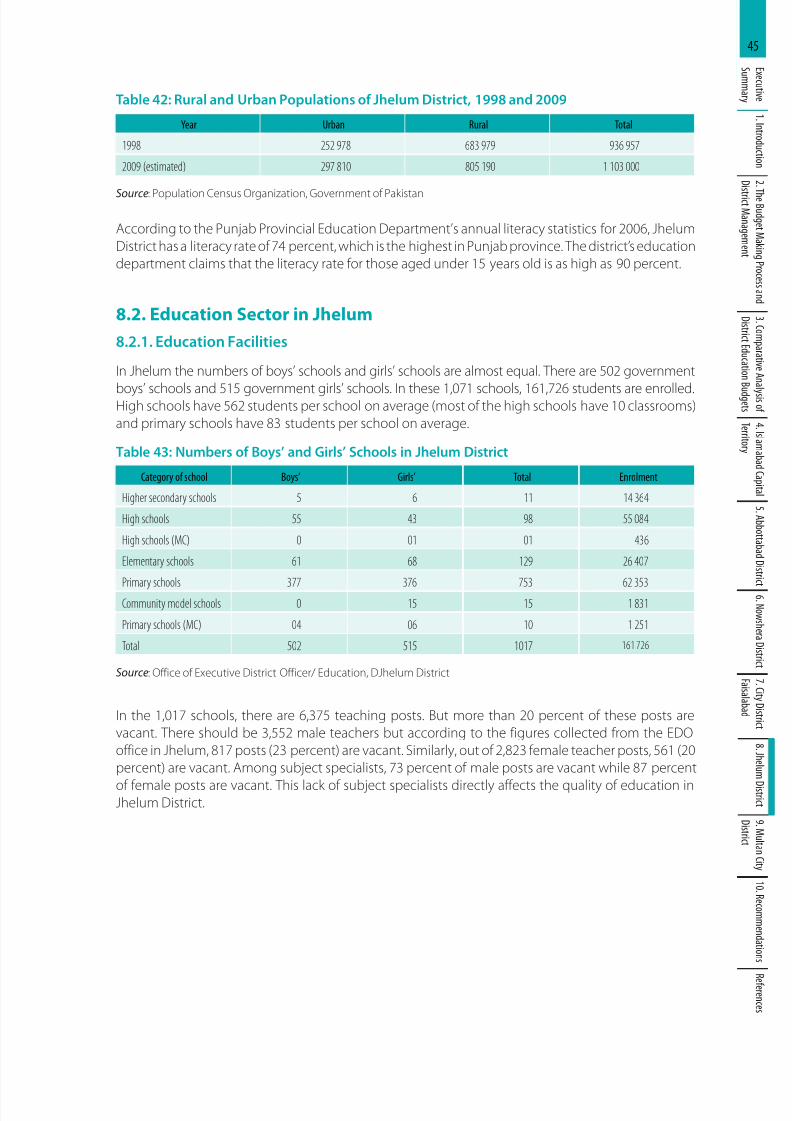
8/11/2019 Education Budgets
http://slidepdf.com/reader/full/education-budgets 54/71
45E x e c u t i v e
S u mm a r y
1 .I n t r o d u c t i o n
2 .T h e B u d g e t M a k i n
g P r o c e s s a n d
D i s
t r i c t M a n a g e m e n t
3 . C o m
p a r a t i v e A n a
l y s i s o f
D i s t r i c t E d u c a t i o n B
u d g e t s
4 .I s l a m a b a d C a p i t a l
T e r r i t o r y
5 .A b b o t t a b a d D i s t r i c
t 6 .N o w s h e r a D i s t r i c t
7 . C i t y D i s t r i c t
F a i s a l a b a d
8 . J h e l u m D i s t r i c t
9 .M u l t a n C i t y
D i s t r i c t
1 0 .R e c o mm e n d a t i o n s
R
e f e r e n c e s
Table 42: Rural and Urban Populations of Jhelum District, 1998 and 2009
Year Urban Rural Total
1998 252 978 683 979 936 957
2009 (estimated) 297 810 805 190 1 103 000
Source: Population Census Organization, Government of Pakistan
According to the Punjab Provincial Education Department’s annual literacy statistics for 2006, Jhelum
District has a literacy rate of 74 percent, which is the highest in Punjab province. The district’s education
department claims that the literacy rate for those aged under 15 years old is as high as 90 percent.
8.2. Education Sector in Jhelum
8.2.1. Education Facilities
In Jhelum the numbers of boys’ schools and girls’ schools are almost equal. There are 502 government
boys’ schools and 515 government girls’ schools. In these 1,071 schools, 161,726 students are enrolled.High schools have 562 students per school on average (most of the high schools have 10 classrooms)
and primary schools have 83 students per school on average.
Table 43: Numbers of Boys’ and Girls’ Schools in Jhelum District
Category of school Boys’ Girls’ Total Enrolment
Higher secondary schools 5 6 11 14 364
High schools 55 43 98 55 084
High schools (MC) 0 01 01 436
Elementary schools 61 68 129 26 407
Primary schools 377 376 753 62 353Community model schools 0 15 15 1 831
Primary schools (MC) 04 06 10 1 251
Total 502 515 1017 161 726
Source: Office of Executive District Officer/ Education, DJhelum District
In the 1,017 schools, there are 6,375 teaching posts. But more than 20 percent of these posts are
vacant. There should be 3,552 male teachers but according to the figures collected from the EDO
office in Jhelum, 817 posts (23 percent) are vacant. Similarly, out of 2,823 female teacher posts, 561 (20
percent) are vacant. Among subject specialists, 73 percent of male posts are vacant while 87 percent
of female posts are vacant. This lack of subject specialists directly affects the quality of education inJhelum District.
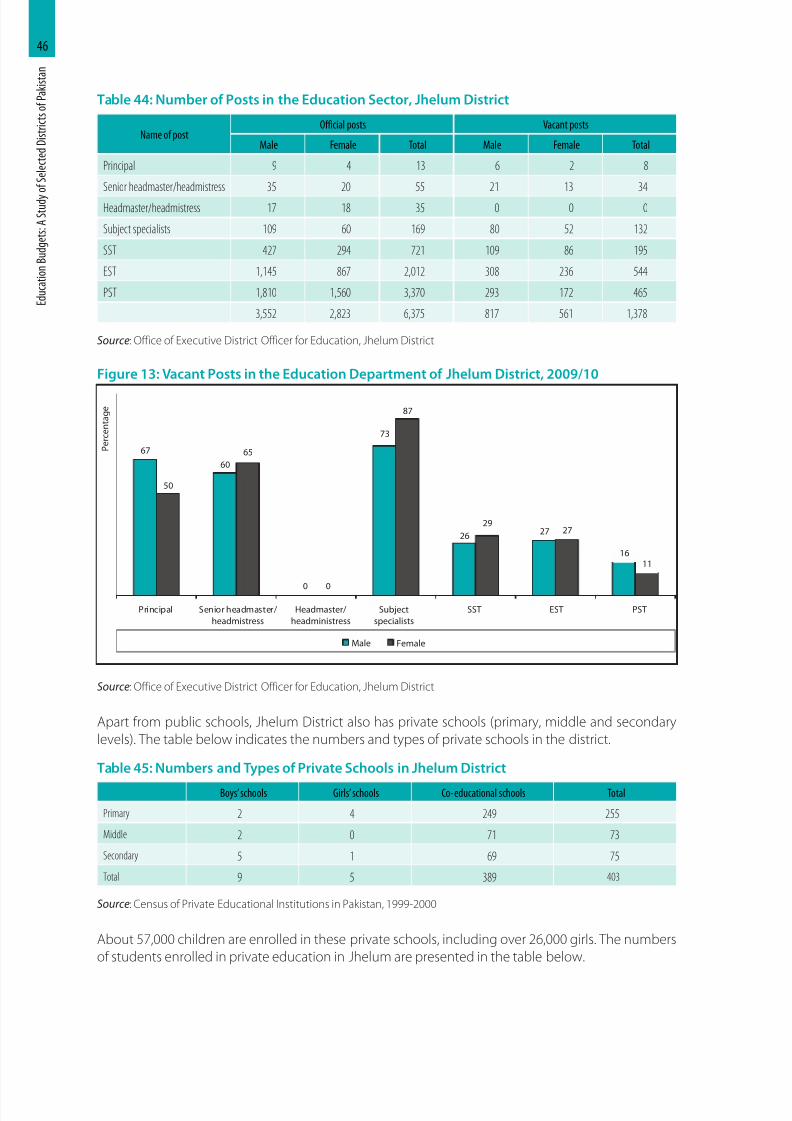
8/11/2019 Education Budgets
http://slidepdf.com/reader/full/education-budgets 55/71
E d u c a t i o n
B u d g e t s : A
S t u d y
o f S e l e c t e d
D i s t r i c t s o f P a k i s t a n
46
Table 44: Number of Posts in the Education Sector, Jhelum District
Name of postOfficial posts Vacant posts
Male Female Total Male Female Total
Principal 9 4 13 6 2 8
Senior headmaster/headmistress 35 20 55 21 13 34
Headmaster/headmistress 17 18 35 0 0 0
Subject specialists 109 60 169 80 52 132
SST 427 294 721 109 86 195
EST 1,145 867 2,012 308 236 544
PST 1,810 1,560 3,370 293 172 465
3,552 2,823 6,375 817 561 1,378
Source: Office of Executive District Officer for Education, Jhelum District
Figure 13: Vacant Posts in the Education Department of Jhelum District, 2009/10
67
60
0
73
26 27
16
50
65
0
87
2927
11
Principal Senior headmaster/
headmistress
Headmaster/
headministress
Subject
specialists
SST EST PST
P e r c e n t a g e
Male Female
Source: Office of Executive District Officer for Education, Jhelum District
Apart from public schools, Jhelum District also has private schools (primary, middle and secondary
levels). The table below indicates the numbers and types of private schools in the district.
Table 45: Numbers and Types of Private Schools in Jhelum District
Boys’ schools Girls’ schools Co-educational schools Total
Primary 2 4 249 255
Middle 2 0 71 73
Secondary 5 1 69 75
Total 9 5 389 403
Source: Census of Private Educational Institutions in Pakistan, 1999-2000
About 57,000 children are enrolled in these private schools, including over 26,000 girls. The numbers
of students enrolled in private education in Jhelum are presented in the table below.
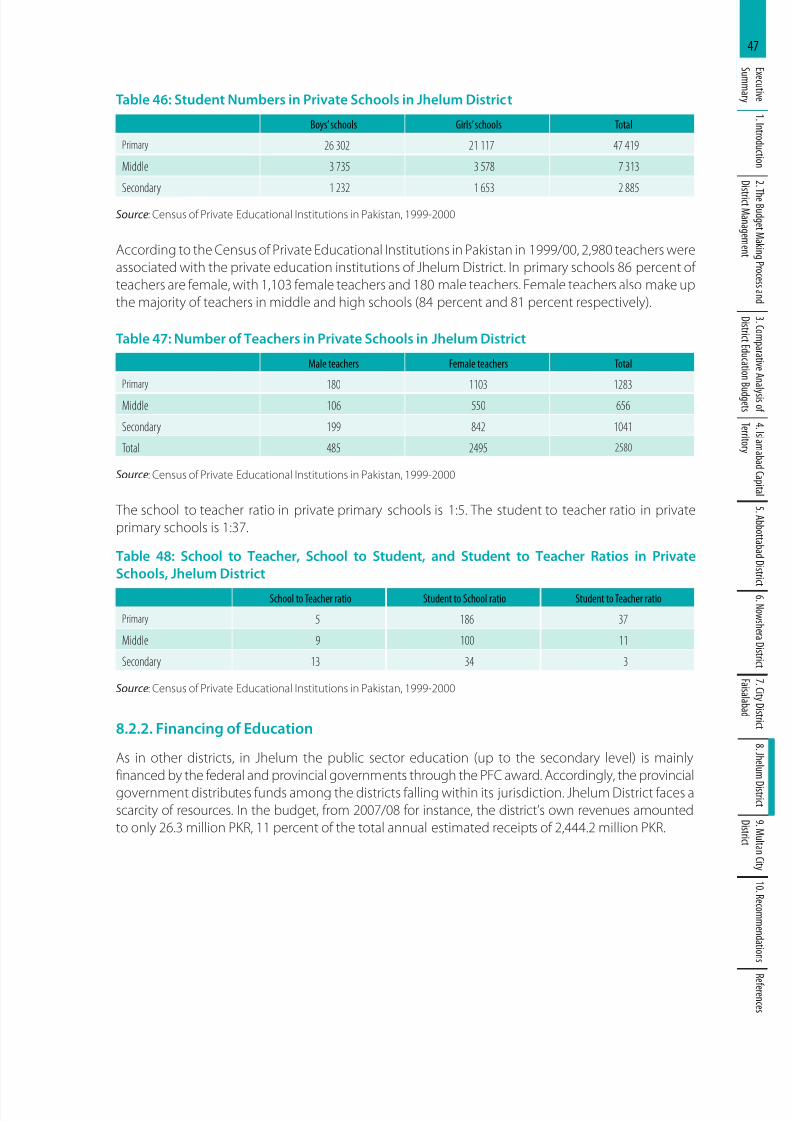
8/11/2019 Education Budgets
http://slidepdf.com/reader/full/education-budgets 56/71
47E x e c u t i v e
S u mm a r y
1 .I n t r o d u c t i o n
2 .T h e B u d g e t M a k i n
g P r o c e s s a n d
D i s
t r i c t M a n a g e m e n t
3 . C o m
p a r a t i v e A n a
l y s i s o f
D i s t r i c t E d u c a t i o n B
u d g e t s
4 .I s l a m a b a d C a p i t a l
T e r r i t o r y
5 .A b b o t t a b a d D i s t r i c
t 6 .N o w s h e r a D i s t r i c t
7 . C i t y D i s t r i c t
F a i s a l a b a d
8 . J h e l u m D i s t r i c t
9 .M u l t a n C i t y
D i s t r i c t
1 0 .R e c o mm e n d a t i o n s
R
e f e r e n c e s
Table 46: Student Numbers in Private Schools in Jhelum District
Boys’ schools Girls’ schools Total
Primary 26 302 21 117 47 419
Middle 3 735 3 578 7 313
Secondary 1 232 1 653 2 885
Source: Census of Private Educational Institutions in Pakistan, 1999-2000
According to the Census of Private Educational Institutions in Pakistan in 1999/00, 2,980 teachers were
associated with the private education institutions of Jhelum District. In primary schools 86 percent of
teachers are female, with 1,103 female teachers and 180 male teachers. Female teachers also make up
the majority of teachers in middle and high schools (84 percent and 81 percent respectively).
Table 47: Number of Teachers in Private Schools in Jhelum District
Male teachers Female teachers Total
Primary 180 1103 1283
Middle 106 550 656
Secondary 199 842 1041
Total 485 2495 2580
Source: Census of Private Educational Institutions in Pakistan, 1999-2000
The school to teacher ratio in private primary schools is 1:5. The student to teacher ratio in private
primary schools is 1:37.
Table 48: School to Teacher, School to Student, and Student to Teacher Ratios in Private
Schools, Jhelum District
School to Teacher ratio Student to School ratio Student to Teacher ratio
Primary 5 186 37
Middle 9 100 11
Secondary 13 34 3
Source: Census of Private Educational Institutions in Pakistan, 1999-2000
8.2.2. Financing of Education
As in other districts, in Jhelum the public sector education (up to the secondary level) is mainly
financed by the federal and provincial governments through the PFC award. Accordingly, the provincial
government distributes funds among the districts falling within its jurisdiction. Jhelum District faces a
scarcity of resources. In the budget, from 2007/08 for instance, the district’s own revenues amounted
to only 26.3 million PKR, 11 percent of the total annual estimated receipts of 2,444.2 million PKR.
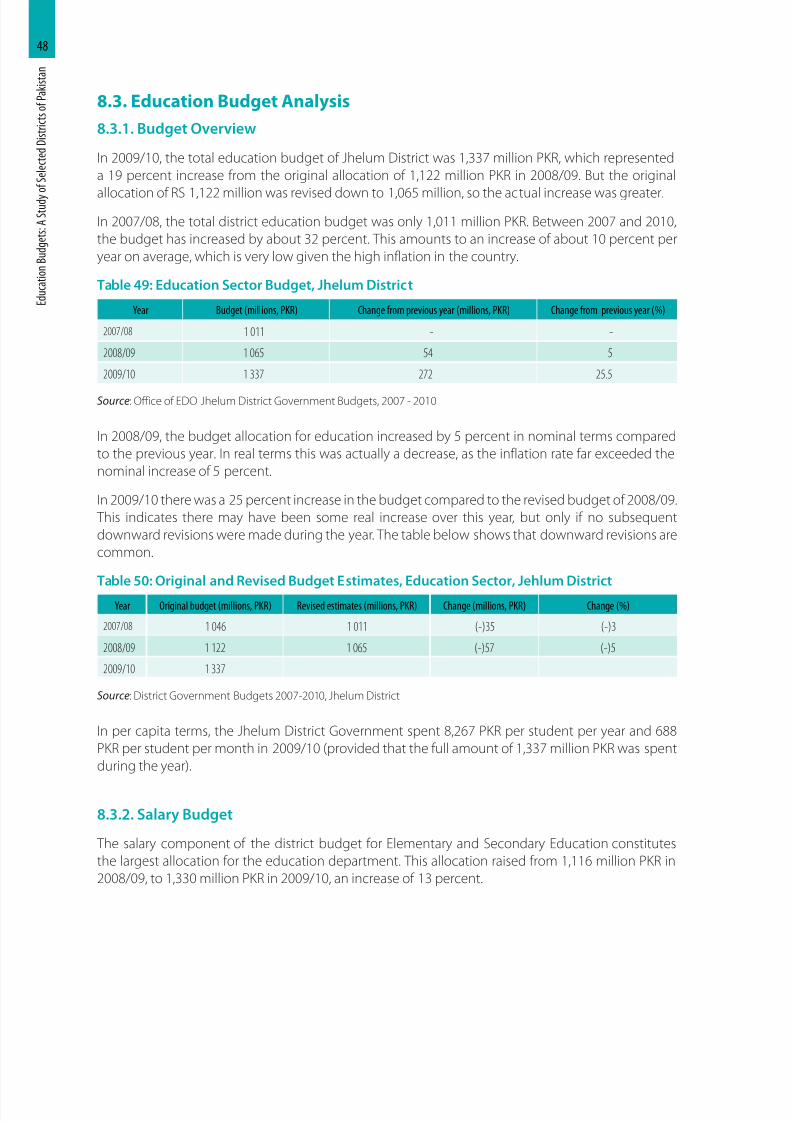
8/11/2019 Education Budgets
http://slidepdf.com/reader/full/education-budgets 57/71
E d u c a t i o n
B u d g e t s : A
S t u d y
o f S e l e c t e d
D i s t r i c t s o f P a k i s t a n
48
8.3. Education Budget Analysis
8.3.1. Budget Overview
In 2009/10, the total education budget of Jhelum District was 1,337 million PKR, which represented
a 19 percent increase from the original allocation of 1,122 million PKR in 2008/09. But the original
allocation of RS 1,122 million was revised down to 1,065 million, so the actual increase was greater.
In 2007/08, the total district education budget was only 1,011 million PKR. Between 2007 and 2010,
the budget has increased by about 32 percent. This amounts to an increase of about 10 percent per
year on average, which is very low given the high inflation in the country.
Table 49: Education Sector Budget, Jhelum District
Year Budget (millions, PKR) Change from previous year (millions, PKR) Change from previous year (%)
2007/08 1 011 - -
2008/09 1 065 54 5
2009/10 1 337 272 25.5
Source: Office of EDO Jhelum District Government Budgets, 2007 - 2010
In 2008/09, the budget allocation for education increased by 5 percent in nominal terms compared
to the previous year. In real terms this was actually a decrease, as the inflation rate far exceeded the
nominal increase of 5 percent.
In 2009/10 there was a 25 percent increase in the budget compared to the revised budget of 2008/09.
This indicates there may have been some real increase over this year, but only if no subsequent
downward revisions were made during the year. The table below shows that downward revisions are
common.
Table 50: Original and Revised Budget Estimates, Education Sector, Jehlum District
Year Original budget (millions, PKR) Revised estimates (millions, PKR) Change (millions, PKR) Change (%)
2007/08 1 046 1 011 (-)35 (-)3
2008/09 1 122 1 065 (-)57 (-)5
2009/10 1 337
Source: District Government Budgets 2007-2010, Jhelum District
In per capita terms, the Jhelum District Government spent 8,267 PKR per student per year and 688
PKR per student per month in 2009/10 (provided that the full amount of 1,337 million PKR was spent
during the year).
8.3.2. Salary Budget
The salary component of the district budget for Elementary and Secondary Education constitutes
the largest allocation for the education department. This allocation raised from 1,116 million PKR in
2008/09, to 1,330 million PKR in 2009/10, an increase of 13 percent.
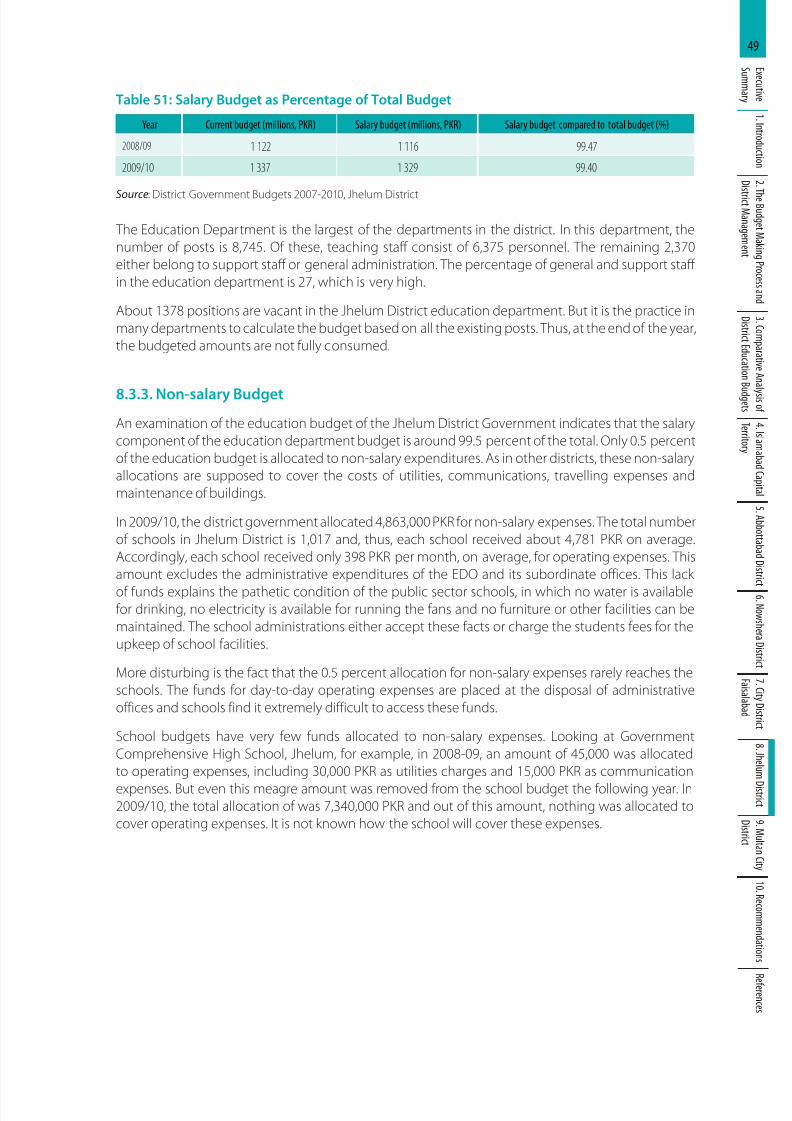
8/11/2019 Education Budgets
http://slidepdf.com/reader/full/education-budgets 58/71
49E x e c u t i v e
S u mm a r y
1 .I n t r o d u c t i o n
2 .T h e B u d g e t M a k i n
g P r o c e s s a n d
D i s
t r i c t M a n a g e m e n t
3 . C o m
p a r a t i v e A n a
l y s i s o f
D i s t r i c t E d u c a t i o n B
u d g e t s
4 .I s l a m a b a d C a p i t a l
T e r r i t o r y
5 .A b b o t t a b a d D i s t r i c
t 6 .N o w s h e r a D i s t r i c t
7 . C i t y D i s t r i c t
F a i s a l a b a d
8 . J h e l u m D i s t r i c t
9 .M u l t a n C i t y
D i s t r i c t
1 0 .R e c o mm e n d a t i o n s
R
e f e r e n c e s
Table 51: Salary Budget as Percentage of Total Budget
Year Current budget (millions, PKR) Salary budget (millions, PKR) Salary budget compared to total budget (%)
2008/09 1 122 1 116 99.47
2009/10 1 337 1 329 99.40
Source: District Government Budgets 2007-2010, Jhelum District
The Education Department is the largest of the departments in the district. In this department, the
number of posts is 8,745. Of these, teaching staff consist of 6,375 personnel. The remaining 2,370
either belong to support staff or general administration. The percentage of general and support staff
in the education department is 27, which is very high.
About 1378 positions are vacant in the Jhelum District education department. But it is the practice in
many departments to calculate the budget based on all the existing posts. Thus, at the end of the year,
the budgeted amounts are not fully consumed.
8.3.3. Non-salary Budget
An examination of the education budget of the Jhelum District Government indicates that the salary
component of the education department budget is around 99.5 percent of the total. Only 0.5 percent
of the education budget is allocated to non-salary expenditures. As in other districts, these non-salary
allocations are supposed to cover the costs of utilities, communications, travelling expenses and
maintenance of buildings.
In 2009/10, the district government allocated 4,863,000 PKR for non-salary expenses. The total number
of schools in Jhelum District is 1,017 and, thus, each school received about 4,781 PKR on average.
Accordingly, each school received only 398 PKR per month, on average, for operating expenses. This
amount excludes the administrative expenditures of the EDO and its subordinate offices. This lack
of funds explains the pathetic condition of the public sector schools, in which no water is availablefor drinking, no electricity is available for running the fans and no furniture or other facilities can be
maintained. The school administrations either accept these facts or charge the students fees for the
upkeep of school facilities.
More disturbing is the fact that the 0.5 percent allocation for non-salary expenses rarely reaches the
schools. The funds for day-to-day operating expenses are placed at the disposal of administrative
offices and schools find it extremely difficult to access these funds.
School budgets have very few funds allocated to non-salary expenses. Looking at Government
Comprehensive High School, Jhelum, for example, in 2008-09, an amount of 45,000 was allocated
to operating expenses, including 30,000 PKR as utilities charges and 15,000 PKR as communication
expenses. But even this meagre amount was removed from the school budget the following year. In2009/10, the total allocation of was 7,340,000 PKR and out of this amount, nothing was allocated to
cover operating expenses. It is not known how the school will cover these expenses.
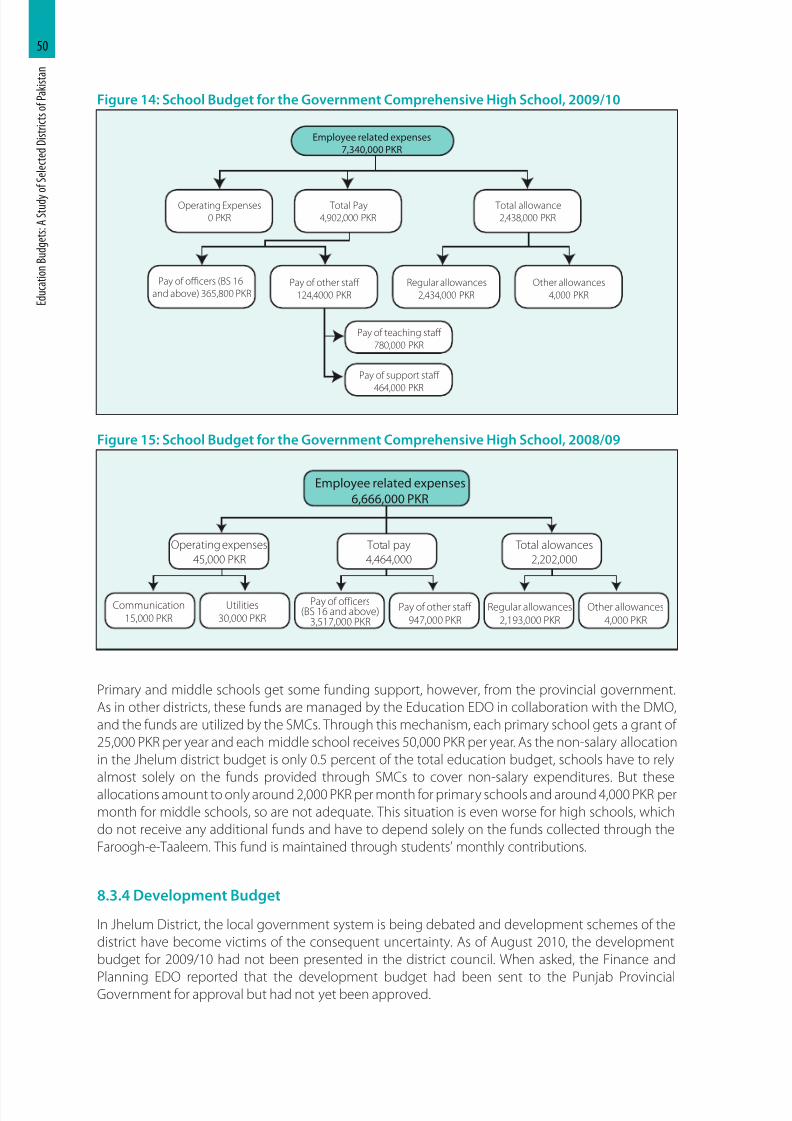
8/11/2019 Education Budgets
http://slidepdf.com/reader/full/education-budgets 59/71
E d u c a t i o n
B u d g e t s : A
S t u d y
o f S e l e c t e d
D i s t r i c t s o f P a k i s t a n
50
Figure 14: School Budget for the Government Comprehensive High School, 2009/10
Employee related expenses
7,340,000 PKR
Operating Expenses0 PKR
Pay of officers (BS 16and above) 365,800 PKR
Pay of other staff
124,4000 PKR
Pay of teaching staff
780,000 PKR
Pay of support staff
464,000 PKR
Regular allowances
2,434,000 PKR
Other allowances
4,000 PKR
Total Pay4,902,000 PKR
Total allowance2,438,000 PKR
Figure 15: School Budget for the Government Comprehensive High School, 2008/09
Employee related expenses
6,666,000 PKR
Operating expenses
45,000 PKR
Communication
15,000 PKR
Utilities
30,000 PKR
Total pay
4,464,000
Total alowances
2,202,000
Pay of officers(BS 16 and above)
3,517,000 PKR
Pay of other staff
947,000 PKR
Regular allowances
2,193,000 PKR
Other allowances
4,000 PKR
Primary and middle schools get some funding support, however, from the provincial government.
As in other districts, these funds are managed by the Education EDO in collaboration with the DMO,
and the funds are utilized by the SMCs. Through this mechanism, each primary school gets a grant of
25,000 PKR per year and each middle school receives 50,000 PKR per year. As the non-salary allocation
in the Jhelum district budget is only 0.5 percent of the total education budget, schools have to rely
almost solely on the funds provided through SMCs to cover non-salary expenditures. But these
allocations amount to only around 2,000 PKR per month for primary schools and around 4,000 PKR per
month for middle schools, so are not adequate. This situation is even worse for high schools, which
do not receive any additional funds and have to depend solely on the funds collected through the
Faroogh-e-Taaleem. This fund is maintained through students’ monthly contributions.
8.3.4 Development Budget
In Jhelum District, the local government system is being debated and development schemes of the
district have become victims of the consequent uncertainty. As of August 2010, the development
budget for 2009/10 had not been presented in the district council. When asked, the Finance and
Planning EDO reported that the development budget had been sent to the Punjab ProvincialGovernment for approval but had not yet been approved.
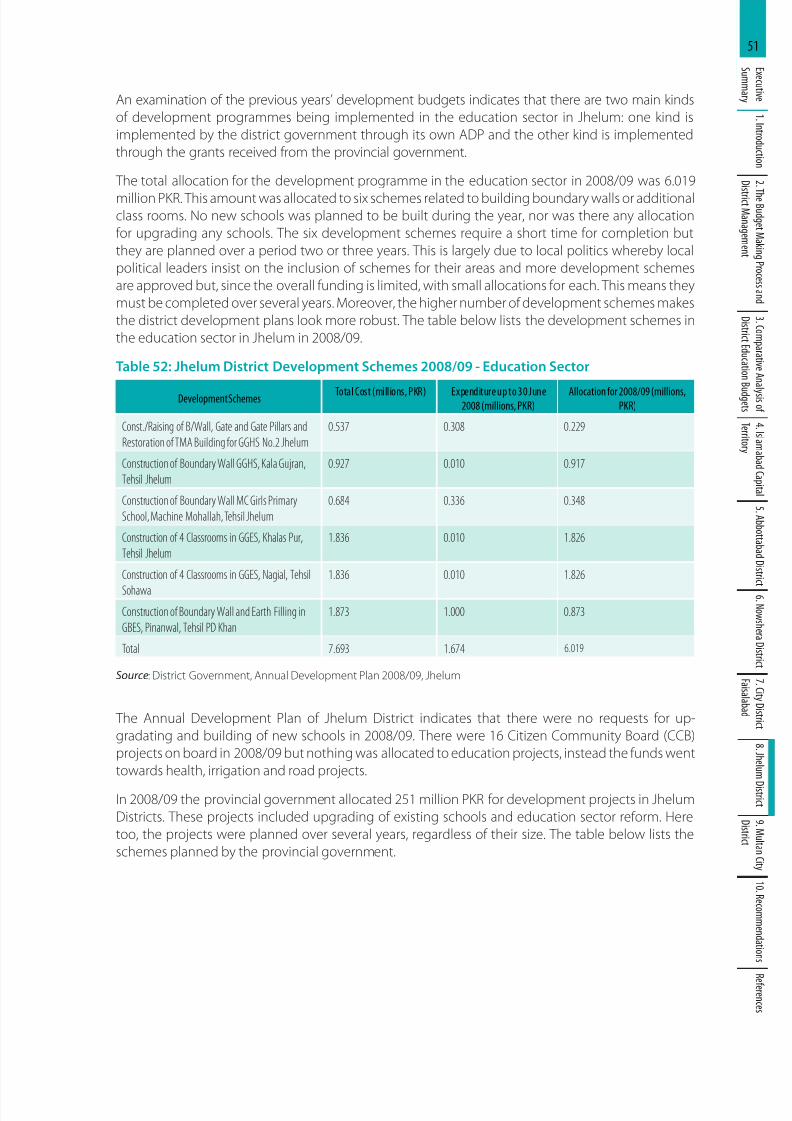
8/11/2019 Education Budgets
http://slidepdf.com/reader/full/education-budgets 60/71
51E x e c u t i v e
S u mm a r y
1 .I n t r o d u c t i o n
2 .T h e B u d g e t M a k i n
g P r o c e s s a n d
D i s
t r i c t M a n a g e m e n t
3 . C o m
p a r a t i v e A n a
l y s i s o f
D i s t r i c t E d u c a t i o n B
u d g e t s
4 .I s l a m a b a d C a p i t a l
T e r r i t o r y
5 .A b b o t t a b a d D i s t r i c
t 6 .N o w s h e r a D i s t r i c t
7 . C i t y D i s t r i c t
F a i s a l a b a d
8 . J h e l u m D i s t r i c t
9 .M u l t a n C i t y
D i s t r i c t
1 0 .R e c o mm e n d a t i o n s
R
e f e r e n c e s
An examination of the previous years’ development budgets indicates that there are two main kinds
of development programmes being implemented in the education sector in Jhelum: one kind is
implemented by the district government through its own ADP and the other kind is implemented
through the grants received from the provincial government.
The total allocation for the development programme in the education sector in 2008/09 was 6.019
million PKR. This amount was allocated to six schemes related to building boundary walls or additionalclass rooms. No new schools was planned to be built during the year, nor was there any allocation
for upgrading any schools. The six development schemes require a short time for completion but
they are planned over a period two or three years. This is largely due to local politics whereby local
political leaders insist on the inclusion of schemes for their areas and more development schemes
are approved but, since the overall funding is limited, with small allocations for each. This means they
must be completed over several years. Moreover, the higher number of development schemes makes
the district development plans look more robust. The table below lists the development schemes in
the education sector in Jhelum in 2008/09.
Table 52: Jhelum District Development Schemes 2008/09 - Education Sector
Development Schemes Total Cost (millions, PKR) Expenditure up to 30 June2008 (millions, PKR)
Allocation for 2008/09 (millions,PKR)
Const./Raising of B/Wall, Gate and Gate Pillars and
Restoration of TMA Building for GGHS No.2 Jhelum
0.537 0.308 0.229
Construction of Boundary Wall GGHS, Kala Gujran,
Tehsil Jhelum
0.927 0.010 0.917
Construction of Boundary Wall MC Girls Primary
School, Machine Mohallah, Tehsil Jhelum
0.684 0.336 0.348
Construction of 4 Classrooms in GGES, Khalas Pur,
Tehsil Jhelum
1.836 0.010 1.826
Construction of 4 Classrooms in GGES, Nagial, Tehsil
Sohawa
1.836 0.010 1.826
Construction of Boundary Wall and Earth Filling in
GBES, Pinanwal, Tehsil PD Khan
1.873 1.000 0.873
Total 7.693 1.674 6.019
Source: District Government, Annual Development Plan 2008/09, Jhelum
The Annual Development Plan of Jhelum District indicates that there were no requests for up-
gradating and building of new schools in 2008/09. There were 16 Citizen Community Board (CCB)
projects on board in 2008/09 but nothing was allocated to education projects, instead the funds went
towards health, irrigation and road projects.
In 2008/09 the provincial government allocated 251 million PKR for development projects in Jhelum
Districts. These projects included upgrading of existing schools and education sector reform. Here
too, the projects were planned over several years, regardless of their size. The table below lists the
schemes planned by the provincial government.
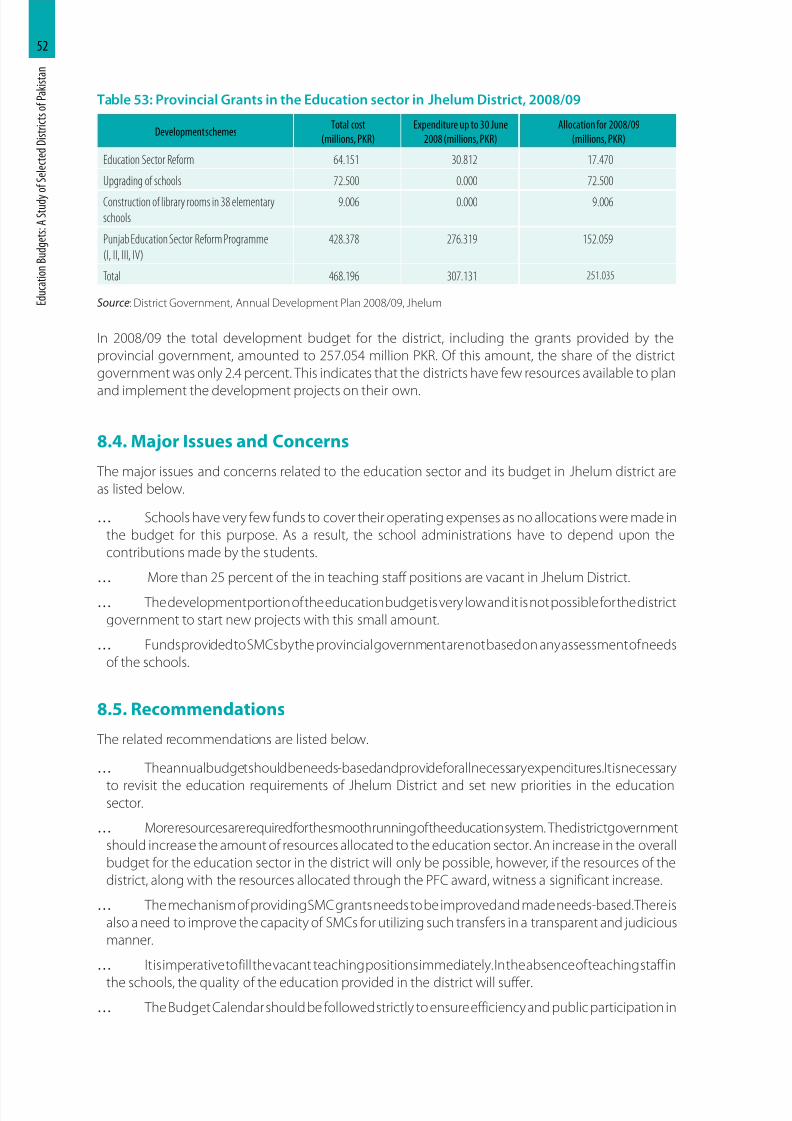
8/11/2019 Education Budgets
http://slidepdf.com/reader/full/education-budgets 61/71
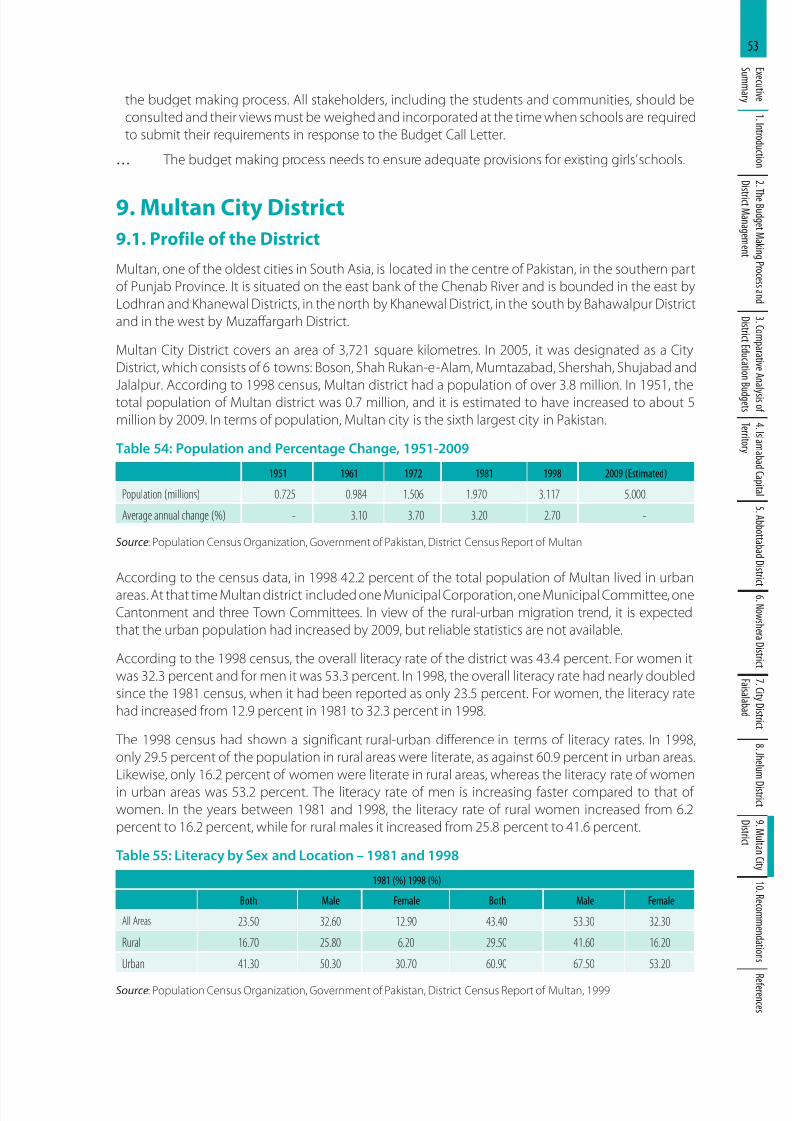
8/11/2019 Education Budgets
http://slidepdf.com/reader/full/education-budgets 62/71
53E x e c u t i v e
S u mm a r y
1 .I n t r o d u c t i o n
2 .T h e B u d g e t M a k i n
g P r o c e s s a n d
D i s
t r i c t M a n a g e m e n t
3 . C o m
p a r a t i v e A n a
l y s i s o f
D i s t r i c t E d u c a t i o n B
u d g e t s
4 .I s l a m a b a d C a p i t a l
T e r r i t o r y
5 .A b b o t t a b a d D i s t r i c
t 6 .N o w s h e r a D i s t r i c t
7 . C i t y D i s t r i c t
F a i s a l a b a d
8 . J h e l u m D i s t r i c t
9 .M u l t a n C i t y
D i s t r i c t
1 0 .R e c o mm e n d a t i o n s
R
e f e r e n c e s
the budget making process. All stakeholders, including the students and communities, should be
consulted and their views must be weighed and incorporated at the time when schools are required
to submit their requirements in response to the Budget Call Letter.
… The budget making process needs to ensure adequate provisions for existing girls’ schools.
9. Multan City District
9.1. Profile of the District
Multan, one of the oldest cities in South Asia, is located in the centre of Pakistan, in the southern part
of Punjab Province. It is situated on the east bank of the Chenab River and is bounded in the east by
Lodhran and Khanewal Districts, in the north by Khanewal District, in the south by Bahawalpur District
and in the west by Muzaffargarh District.
Multan City District covers an area of 3,721 square kilometres. In 2005, it was designated as a City
District, which consists of 6 towns: Boson, Shah Rukan-e-Alam, Mumtazabad, Shershah, Shujabad and
Jalalpur. According to 1998 census, Multan district had a population of over 3.8 million. In 1951, the
total population of Multan district was 0.7 million, and it is estimated to have increased to about 5
million by 2009. In terms of population, Multan city is the sixth largest city in Pakistan.
Table 54: Population and Percentage Change, 1951-2009
1951 1961 1972 1981 1998 2009 (Estimated)
Population (millions) 0.725 0.984 1.506 1.970 3.117 5.000
Average annual change (%) - 3.10 3.70 3.20 2.70 -
Source: Population Census Organization, Government of Pakistan, District Census Report of Multan
According to the census data, in 1998 42.2 percent of the total population of Multan lived in urban
areas. At that time Multan district included one Municipal Corporation, one Municipal Committee, one
Cantonment and three Town Committees. In view of the rural-urban migration trend, it is expected
that the urban population had increased by 2009, but reliable statistics are not available.
According to the 1998 census, the overall literacy rate of the district was 43.4 percent. For women it
was 32.3 percent and for men it was 53.3 percent. In 1998, the overall literacy rate had nearly doubled
since the 1981 census, when it had been reported as only 23.5 percent. For women, the literacy rate
had increased from 12.9 percent in 1981 to 32.3 percent in 1998.
The 1998 census had shown a significant rural-urban difference in terms of literacy rates. In 1998,
only 29.5 percent of the population in rural areas were literate, as against 60.9 percent in urban areas.
Likewise, only 16.2 percent of women were literate in rural areas, whereas the literacy rate of women
in urban areas was 53.2 percent. The literacy rate of men is increasing faster compared to that of
women. In the years between 1981 and 1998, the literacy rate of rural women increased from 6.2
percent to 16.2 percent, while for rural males it increased from 25.8 percent to 41.6 percent.
Table 55: Literacy by Sex and Location – 1981 and 1998
1981 (%) 1998 (%)
Both Male Female Both Male Female
All Areas 23.50 32.60 12.90 43.40 53.30 32.30
Rural 16.70 25.80 6.20 29.50 41.60 16.20
Urban 41.30 50.30 30.70 60.90 67.50 53.20
Source: Population Census Organization, Government of Pakistan, District Census Report of Multan, 1999
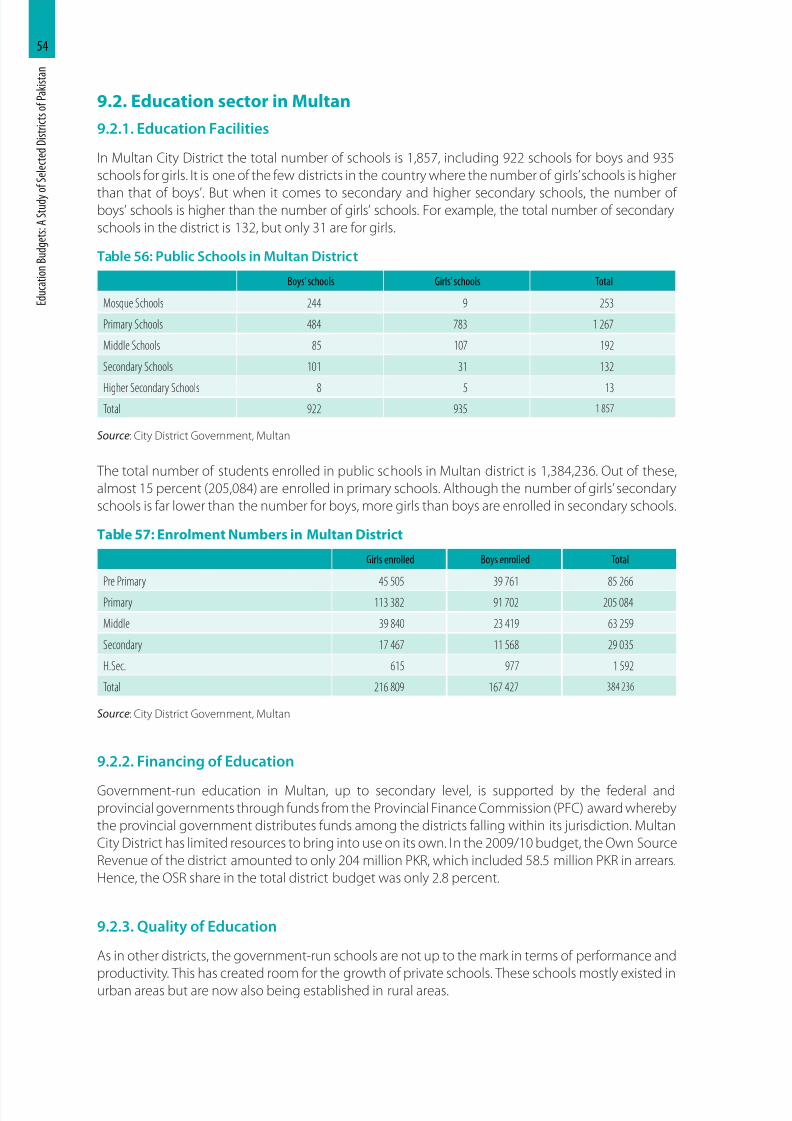
8/11/2019 Education Budgets
http://slidepdf.com/reader/full/education-budgets 63/71
E d u c a t i o n
B u d g e t s : A
S t u d y
o f S e l e c t e d
D i s t r i c t s o f P a k i s t a n
54
9.2. Education sector in Multan
9.2.1. Education Facilities
In Multan City District the total number of schools is 1,857, including 922 schools for boys and 935
schools for girls. It is one of the few districts in the country where the number of girls’ schools is higher
than that of boys’. But when it comes to secondary and higher secondary schools, the number ofboys’ schools is higher than the number of girls’ schools. For example, the total number of secondary
schools in the district is 132, but only 31 are for girls.
Table 56: Public Schools in Multan District
Boys’ schools Girls’ schools Total
Mosque Schools 244 9 253
Primary Schools 484 783 1 267
Middle Schools 85 107 192
Secondary Schools 101 31 132
Higher Secondary Schools 8 5 13Total 922 935 1 857
Source: City District Government, Multan
The total number of students enrolled in public schools in Multan district is 1,384,236. Out of these,
almost 15 percent (205,084) are enrolled in primary schools. Although the number of girls’ secondary
schools is far lower than the number for boys, more girls than boys are enrolled in secondary schools.
Table 57: Enrolment Numbers in Multan District
Girls enrolled Boys enrolled Total
Pre Primary 45 505 39 761 85 266
Primary 113 382 91 702 205 084
Middle 39 840 23 419 63 259
Secondary 17 467 11 568 29 035
H.Sec. 615 977 1 592
Total 216 809 167 427 384 236
Source: City District Government, Multan
9.2.2. Financing of Education
Government-run education in Multan, up to secondary level, is supported by the federal andprovincial governments through funds from the Provincial Finance Commission (PFC) award whereby
the provincial government distributes funds among the districts falling within its jurisdiction. Multan
City District has limited resources to bring into use on its own. In the 2009/10 budget, the Own Source
Revenue of the district amounted to only 204 million PKR, which included 58.5 million PKR in arrears.
Hence, the OSR share in the total district budget was only 2.8 percent.
9.2.3. Quality of Education
As in other districts, the government-run schools are not up to the mark in terms of performance and
productivity. This has created room for the growth of private schools. These schools mostly existed in
urban areas but are now also being established in rural areas.
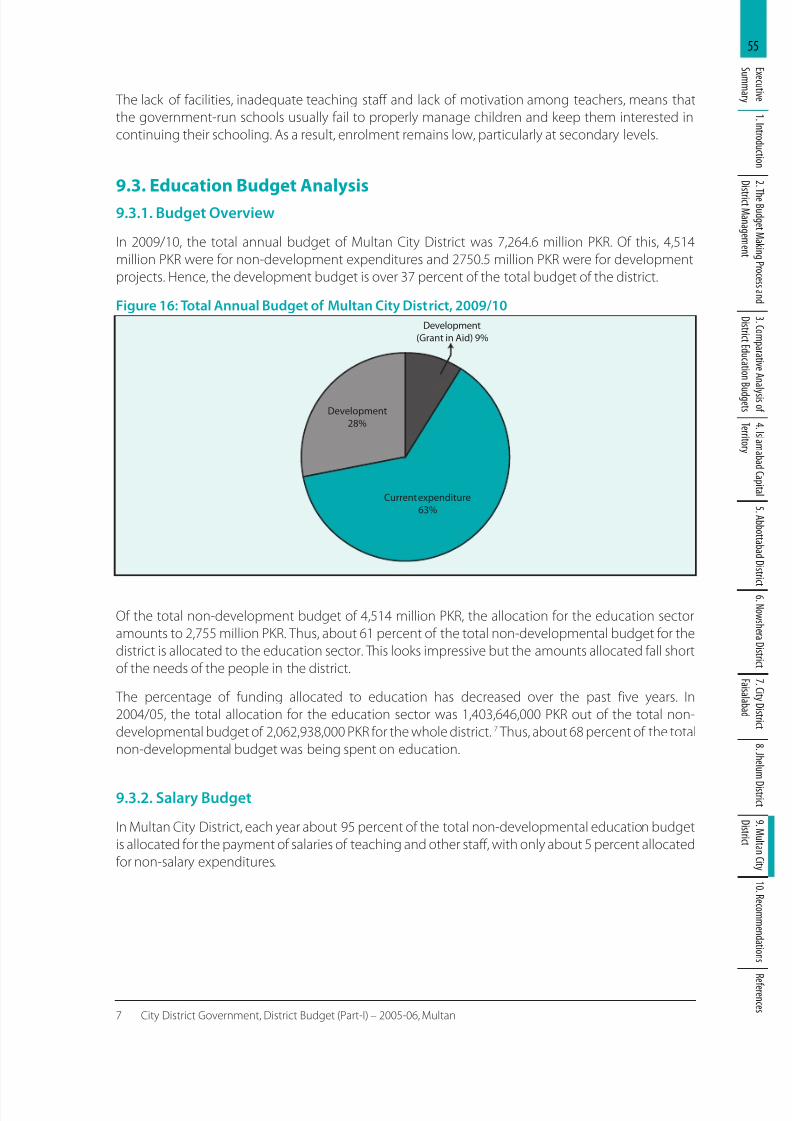
8/11/2019 Education Budgets
http://slidepdf.com/reader/full/education-budgets 64/71
55E x e c u t i v e
S u mm a r y
1 .I n t r o d u c t i o n
2 .T h e B u d g e t M a k i n
g P r o c e s s a n d
D i s
t r i c t M a n a g e m e n t
3 . C o m
p a r a t i v e A n a
l y s i s o f
D i s t r i c t E d u c a t i o n B
u d g e t s
4 .I s l a m a b a d C a p i t a l
T e r r i t o r y
5 .A b b o t t a b a d D i s t r i c
t 6 .N o w s h e r a D i s t r i c t
7 . C i t y D i s t r i c t
F a i s a l a b a d
8 . J h e l u m D i s t r i c t
9 .M u l t a n C i t y
D i s t r i c t
1 0 .R e c o mm e n d a t i o n s
R
e f e r e n c e s
The lack of facilities, inadequate teaching staff and lack of motivation among teachers, means that
the government-run schools usually fail to properly manage children and keep them interested in
continuing their schooling. As a result, enrolment remains low, particularly at secondary levels.
9.3. Education Budget Analysis
9.3.1. Budget Overview
In 2009/10, the total annual budget of Multan City District was 7,264.6 million PKR. Of this, 4,514
million PKR were for non-development expenditures and 2750.5 million PKR were for development
projects. Hence, the development budget is over 37 percent of the total budget of the district.
Figure 16: Total Annual Budget of Multan City District, 2009/10
Development
(Grant in Aid) 9%
Development
28%
Current expenditure
63%
Of the total non-development budget of 4,514 million PKR, the allocation for the education sector
amounts to 2,755 million PKR. Thus, about 61 percent of the total non-developmental budget for the
district is allocated to the education sector. This looks impressive but the amounts allocated fall short
of the needs of the people in the district.
The percentage of funding allocated to education has decreased over the past five years. In
2004/05, the total allocation for the education sector was 1,403,646,000 PKR out of the total non-
developmental budget of 2,062,938,000 PKR for the whole district.7 Thus, about 68 percent of the total
non-developmental budget was being spent on education.
9.3.2. Salary Budget
In Multan City District, each year about 95 percent of the total non-developmental education budget
is allocated for the payment of salaries of teaching and other staff, with only about 5 percent allocated
for non-salary expenditures.
7 City District Government, District Budget (Part-I) – 2005-06, Multan
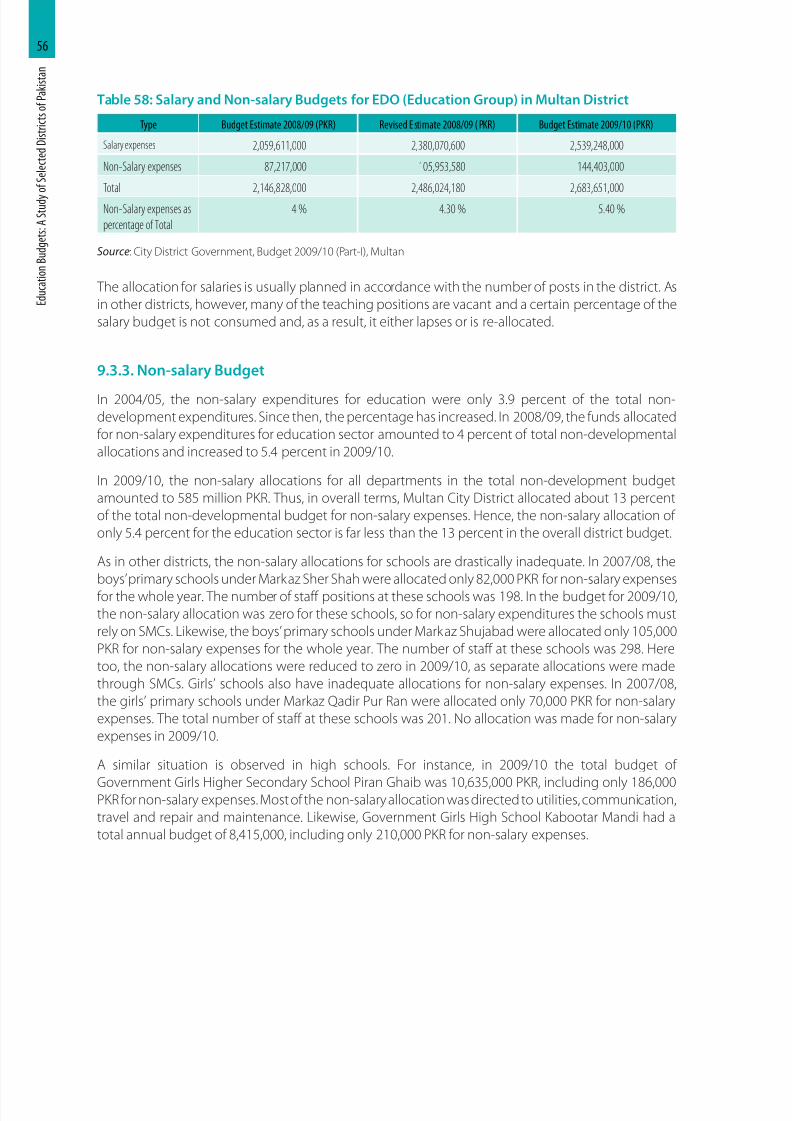
8/11/2019 Education Budgets
http://slidepdf.com/reader/full/education-budgets 65/71
E d u c a t i o n
B u d g e t s : A
S t u d y
o f S e l e c t e d
D i s t r i c t s o f P a k i s t a n
56
Table 58: Salary and Non-salary Budgets for EDO (Education Group) in Multan District
Type Budget Estimate 2008/09 (PKR) Revised E stimate 2008/09 ( PKR) Budget Estimate 2009/10 (PKR)
Salary expenses 2,059,611,000 2,380,070,600 2,539,248,000
Non-Salary expenses 87,217,000 105,953,580 144,403,000
Total 2,146,828,000 2,486,024,180 2,683,651,000
Non-Salary expenses as
percentage of Total
4 % 4.30 % 5.40 %
Source: City District Government, Budget 2009/10 (Part-I), Multan
The allocation for salaries is usually planned in accordance with the number of posts in the district. As
in other districts, however, many of the teaching positions are vacant and a certain percentage of the
salary budget is not consumed and, as a result, it either lapses or is re-allocated.
9.3.3. Non-salary Budget
In 2004/05, the non-salary expenditures for education were only 3.9 percent of the total non-
development expenditures. Since then, the percentage has increased. In 2008/09, the funds allocated
for non-salary expenditures for education sector amounted to 4 percent of total non-developmental
allocations and increased to 5.4 percent in 2009/10.
In 2009/10, the non-salary allocations for all departments in the total non-development budget
amounted to 585 million PKR. Thus, in overall terms, Multan City District allocated about 13 percent
of the total non-developmental budget for non-salary expenses. Hence, the non-salary allocation of
only 5.4 percent for the education sector is far less than the 13 percent in the overall district budget.
As in other districts, the non-salary allocations for schools are drastically inadequate. In 2007/08, the
boys’ primary schools under Markaz Sher Shah were allocated only 82,000 PKR for non-salary expenses
for the whole year. The number of staff positions at these schools was 198. In the budget for 2009/10,
the non-salary allocation was zero for these schools, so for non-salary expenditures the schools must
rely on SMCs. Likewise, the boys’ primary schools under Markaz Shujabad were allocated only 105,000
PKR for non-salary expenses for the whole year. The number of staff at these schools was 298. Here
too, the non-salary allocations were reduced to zero in 2009/10, as separate allocations were made
through SMCs. Girls’ schools also have inadequate allocations for non-salary expenses. In 2007/08,
the girls’ primary schools under Markaz Qadir Pur Ran were allocated only 70,000 PKR for non-salary
expenses. The total number of staff at these schools was 201. No allocation was made for non-salary
expenses in 2009/10.
A similar situation is observed in high schools. For instance, in 2009/10 the total budget of
Government Girls Higher Secondary School Piran Ghaib was 10,635,000 PKR, including only 186,000PKR for non-salary expenses. Most of the non-salary allocation was directed to utilities, communication,
travel and repair and maintenance. Likewise, Government Girls High School Kabootar Mandi had a
total annual budget of 8,415,000, including only 210,000 PKR for non-salary expenses.
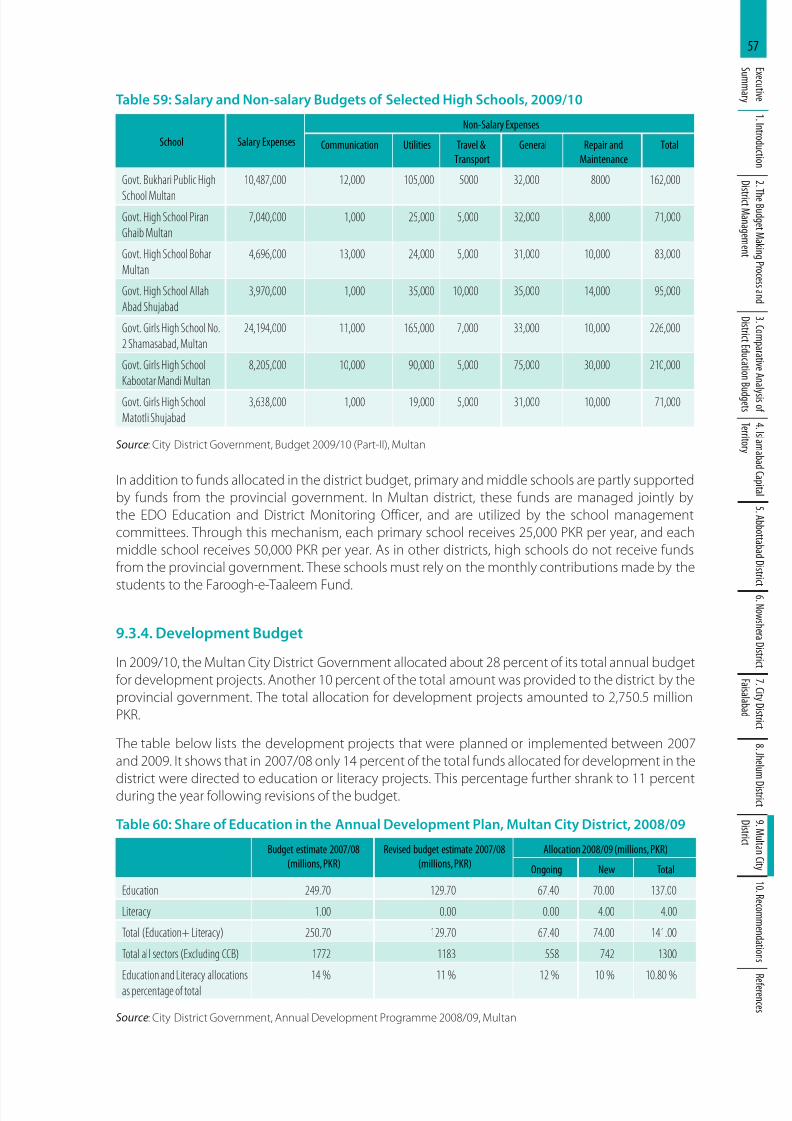
8/11/2019 Education Budgets
http://slidepdf.com/reader/full/education-budgets 66/71
57E x e c u t i v e
S u mm a r y
1 .I n t r o d u c t i o n
2 .T h e B u d g e t M a k i n
g P r o c e s s a n d
D i s
t r i c t M a n a g e m e n t
3 . C o m
p a r a t i v e A n a
l y s i s o f
D i s t r i c t E d u c a t i o n B
u d g e t s
4 .I s l a m a b a d C a p i t a l
T e r r i t o r y
5 .A b b o t t a b a d D i s t r i c
t 6 .N o w s h e r a D i s t r i c t
7 . C i t y D i s t r i c t
F a i s a l a b a d
8 . J h e l u m D i s t r i c t
9 .M u l t a n C i t y
D i s t r i c t
1 0 .R e c o mm e n d a t i o n s
R
e f e r e n c e s
Table 59: Salary and Non-salary Budgets of Selected High Schools, 2009/10
School Salary Expenses
Non-Salary Expenses
Communication Utilities Travel &
Transport
General Repair and
Maintenance
Total
Govt. Bukhari Public High
School Multan
10,487,000 12,000 105,000 5000 32,000 8000 162,000
Govt. High School Piran
Ghaib Multan
7,040,000 1,000 25,000 5,000 32,000 8,000 71,000
Govt. High School Bohar
Multan
4,696,000 13,000 24,000 5,000 31,000 10,000 83,000
Govt. High School Allah
Abad Shujabad
3,970,000 1,000 35,000 10,000 35,000 14,000 95,000
Govt. Girls High School No.
2 Shamasabad, Multan
24,194,000 11,000 165,000 7,000 33,000 10,000 226,000
Govt. Girls High School
Kabootar Mandi Multan
8,205,000 10,000 90,000 5,000 75,000 30,000 210,000
Govt. Girls High School
Matotli Shujabad
3,638,000 1,000 19,000 5,000 31,000 10,000 71,000
Source: City District Government, Budget 2009/10 (Part-II), Multan
In addition to funds allocated in the district budget, primary and middle schools are partly supported
by funds from the provincial government. In Multan district, these funds are managed jointly by
the EDO Education and District Monitoring Officer, and are utilized by the school management
committees. Through this mechanism, each primary school receives 25,000 PKR per year, and each
middle school receives 50,000 PKR per year. As in other districts, high schools do not receive funds
from the provincial government. These schools must rely on the monthly contributions made by the
students to the Faroogh-e-Taaleem Fund.
9.3.4. Development Budget
In 2009/10, the Multan City District Government allocated about 28 percent of its total annual budget
for development projects. Another 10 percent of the total amount was provided to the district by the
provincial government. The total allocation for development projects amounted to 2,750.5 million
PKR.
The table below lists the development projects that were planned or implemented between 2007
and 2009. It shows that in 2007/08 only 14 percent of the total funds allocated for development in the
district were directed to education or literacy projects. This percentage further shrank to 11 percentduring the year following revisions of the budget.
Table 60: Share of Education in the Annual Development Plan, Multan City District, 2008/09
Budget estimate 2007/08
(millions, PKR)
Revised budget estimate 2007/08
(millions, PKR)
Allocation 2008/09 (millions, PKR)
Ongoing New Total
Education 249.70 129.70 67.40 70.00 137.00
Literacy 1.00 0.00 0.00 4.00 4.00
Total (Education+ Literacy) 250.70 129.70 67.40 74.00 141.00
Total all sectors (Excluding CCB) 1772 1183 558 742 1300
Education and Literacy allocations
as percentage of total
14 % 11 % 12 % 10 % 10.80 %
Source: City District Government, Annual Development Programme 2008/09, Multan
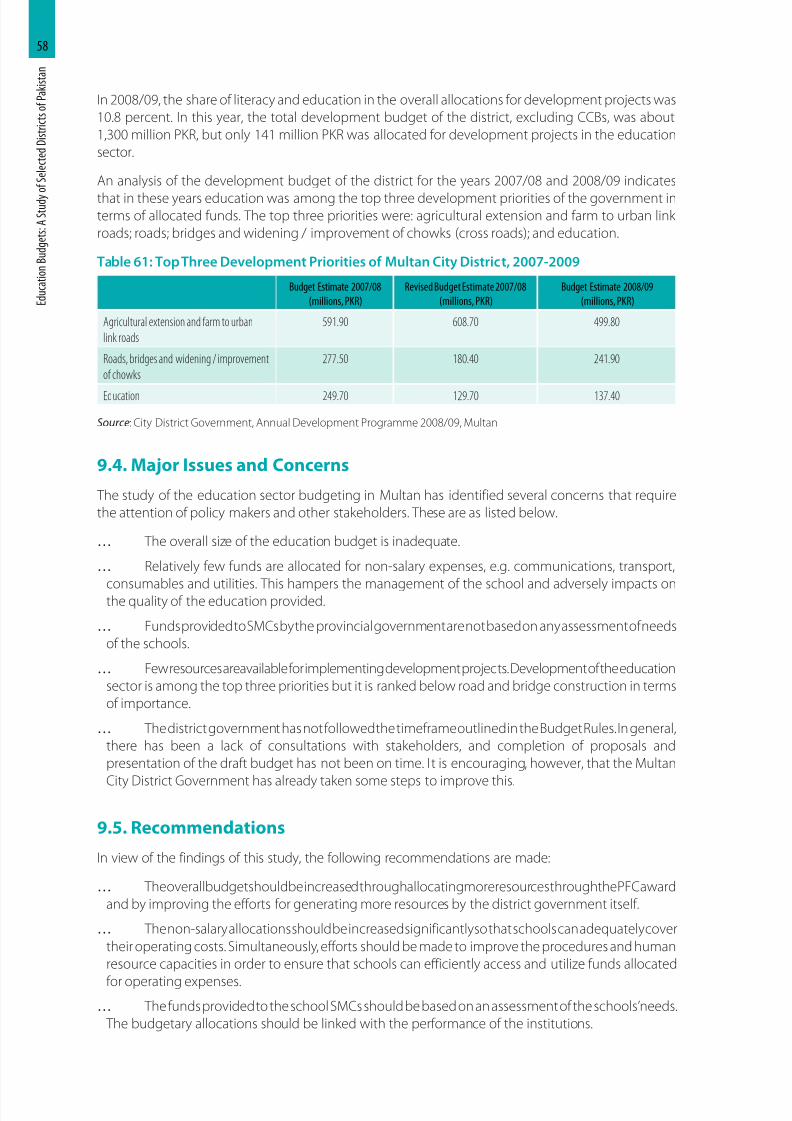
8/11/2019 Education Budgets
http://slidepdf.com/reader/full/education-budgets 67/71
E d u c a t i o n
B u d g e t s : A
S t u d y
o f S e l e c t e d
D i s t r i c t s o f P a k i s t a n
58
In 2008/09, the share of literacy and education in the overall allocations for development projects was
10.8 percent. In this year, the total development budget of the district, excluding CCBs, was about
1,300 million PKR, but only 141 million PKR was allocated for development projects in the education
sector.
An analysis of the development budget of the district for the years 2007/08 and 2008/09 indicates
that in these years education was among the top three development priorities of the government interms of allocated funds. The top three priorities were: agricultural extension and farm to urban link
roads; roads; bridges and widening / improvement of chowks (cross roads); and education.
Table 61: Top Three Development Priorities of Multan City District, 2007-2009
Budget Estimate 2007/08
(millions, PKR)
Revised Budget Estimate 2007/08
(millions, PKR)
Budget Estimate 2008/09
(millions, PKR)
Agricultural extension and farm to urban
link roads
591.90 608.70 499.80
Roads, bridges and widening / improvement
of chowks
277.50 180.40 241.90
Education 249.70 129.70 137.40
Source: City District Government, Annual Development Programme 2008/09, Multan
9.4. Major Issues and Concerns
The study of the education sector budgeting in Multan has identified several concerns that require
the attention of policy makers and other stakeholders. These are as listed below.
… The overall size of the education budget is inadequate.
… Relatively few funds are allocated for non-salary expenses, e.g. communications, transport,
consumables and utilities. This hampers the management of the school and adversely impacts onthe quality of the education provided.
… Funds provided to SMCs by the provincial government are not based on any assessment of needs
of the schools.
… Few resources are available for implementing development projects. Development of the education
sector is among the top three priorities but it is ranked below road and bridge construction in terms
of importance.
… The district government has not followed the timeframe outlined in the Budget Rules. In general,
there has been a lack of consultations with stakeholders, and completion of proposals and
presentation of the draft budget has not been on time. It is encouraging, however, that the Multan
City District Government has already taken some steps to improve this.
9.5. Recommendations
In view of the findings of this study, the following recommendations are made:
… The overall budget should be increased through allocating more resources through the PFC award
and by improving the efforts for generating more resources by the district government itself.
… The non-salary allocations should be increased significantly so that schools can adequately cover
their operating costs. Simultaneously, efforts should be made to improve the procedures and human
resource capacities in order to ensure that schools can efficiently access and utilize funds allocated
for operating expenses.
… The funds provided to the school SMCs should be based on an assessment of the schools’ needs.
The budgetary allocations should be linked with the performance of the institutions.
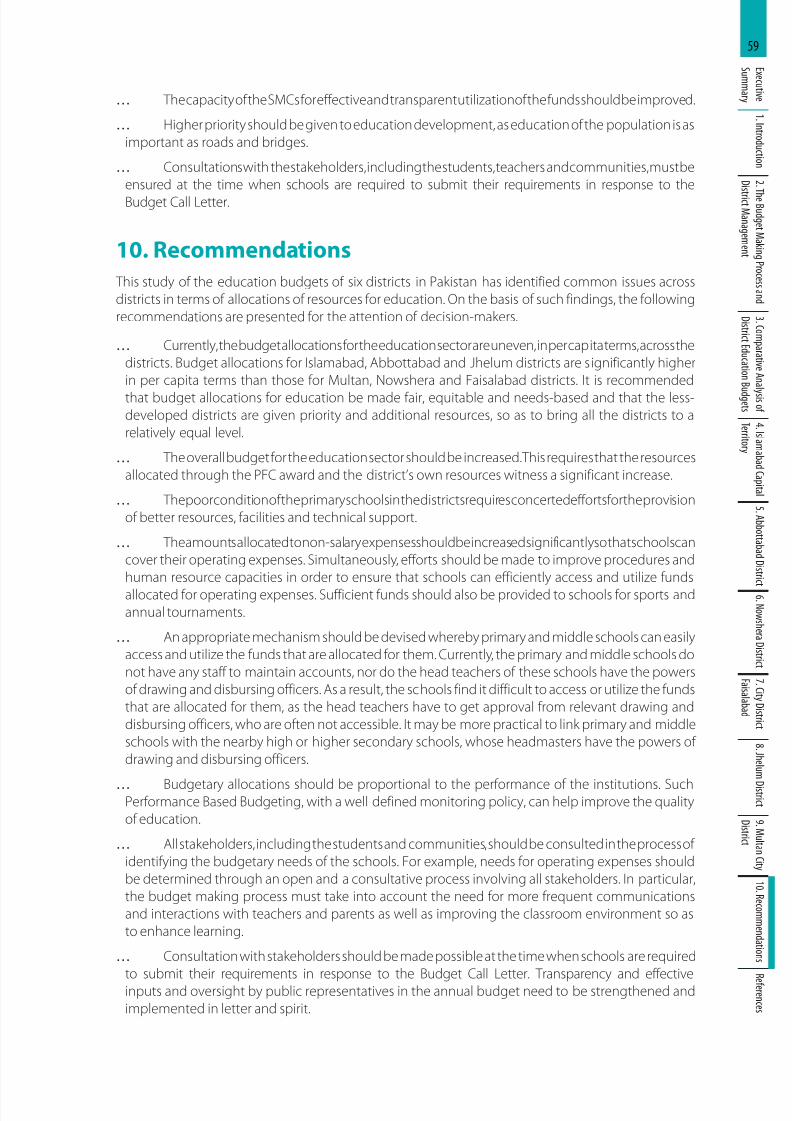
8/11/2019 Education Budgets
http://slidepdf.com/reader/full/education-budgets 68/71
59E x e c u t i v e
S u mm a r y
1 .I n t r o d u c t i o n
2 .T h e B u d g e t M a k i n
g P r o c e s s a n d
D i s
t r i c t M a n a g e m e n t
3 . C o m
p a r a t i v e A n a
l y s i s o f
D i s t r i c t E d u c a t i o n B
u d g e t s
4 .I s l a m a b a d C a p i t a l
T e r r i t o r y
5 .A b b o t t a b a d D i s t r i c
t 6 .N o w s h e r a D i s t r i c t
7 . C i t y D i s t r i c t
F a i s a l a b a d
8 . J h e l u m D i s t r i c t
9 .M u l t a n C i t y
D i s t r i c t
1 0 .R e c o mm e n d a t i o n s
R
e f e r e n c e s
… The capacity of the SMCs for effective and transparent utilization of the funds should be improved.
… Higher priority should be given to education development, as education of the population is as
important as roads and bridges.
… Consultations with the stakeholders, including the students, teachers and communities, must be
ensured at the time when schools are required to submit their requirements in response to the
Budget Call Letter.
10. Recommendations
This study of the education budgets of six districts in Pakistan has identified common issues across
districts in terms of allocations of resources for education. On the basis of such findings, the following
recommendations are presented for the attention of decision-makers.
… Currently, the budget allocations for the education sector are uneven, in per capita terms, across the
districts. Budget allocations for Islamabad, Abbottabad and Jhelum districts are significantly higher
in per capita terms than those for Multan, Nowshera and Faisalabad districts. It is recommended
that budget allocations for education be made fair, equitable and needs-based and that the less-developed districts are given priority and additional resources, so as to bring all the districts to a
relatively equal level.
… The overall budget for the education sector should be increased. This requires that the resources
allocated through the PFC award and the district’s own resources witness a significant increase.
… The poor condition of the primary schools in the districts requires concerted efforts for the provision
of better resources, facilities and technical support.
… The amounts allocated to non-salary expenses should be increased significantly so that schools can
cover their operating expenses. Simultaneously, efforts should be made to improve procedures and
human resource capacities in order to ensure that schools can efficiently access and utilize funds
allocated for operating expenses. Sufficient funds should also be provided to schools for sports andannual tournaments.
… An appropriate mechanism should be devised whereby primary and middle schools can easily
access and utilize the funds that are allocated for them. Currently, the primary and middle schools do
not have any staff to maintain accounts, nor do the head teachers of these schools have the powers
of drawing and disbursing officers. As a result, the schools find it difficult to access or utilize the funds
that are allocated for them, as the head teachers have to get approval from relevant drawing and
disbursing officers, who are often not accessible. It may be more practical to link primary and middle
schools with the nearby high or higher secondary schools, whose headmasters have the powers of
drawing and disbursing officers.
… Budgetary allocations should be proportional to the performance of the institutions. SuchPerformance Based Budgeting, with a well defined monitoring policy, can help improve the quality
of education.
… All stakeholders, including the students and communities, should be consulted in the process of
identifying the budgetary needs of the schools. For example, needs for operating expenses should
be determined through an open and a consultative process involving all stakeholders. In particular,
the budget making process must take into account the need for more frequent communications
and interactions with teachers and parents as well as improving the classroom environment so as
to enhance learning.
… Consultation with stakeholders should be made possible at the time when schools are required
to submit their requirements in response to the Budget Call Letter. Transparency and effective
inputs and oversight by public representatives in the annual budget need to be strengthened and
implemented in letter and spirit.
8/11/2019 Education Budgets
http://slidepdf.com/reader/full/education-budgets 69/71
E d u c a t i o n
B u d g e t s : A
S t u d y
o f S e l e c t e d
D i s t r i c t s o f P a k i s t a n
60
… In Islamabad Capital Territory, until the government decides to introduce the local government
system in Islamabad, the citizens should be able to convey their views and suggestions to the
government through a consultative forum. The elected members of the National Assembly from
Islamabad, eminent citizens, civil society representatives, heads of selected educational institutions
and representatives of Federal Directorate of Education and Ministry of Education could constitute
this forum.
… Education departments should make it a priority to reduce the disparity between the numbers of
educational institutions for boys and girls and make schools more accessible for girls.
… Annual budgets must make necessary provisions to meet the special needs of girls’ schools and
rural schools. For example, budgets should include provisions for transport, annual study tours or
additional allowances for teachers to keep them motivated to serve in these schools.
… It is recommended that urgent steps are taken to fill the vacant posts for both teaching and non-
teaching staff, so as to improve the quality of instruction.
… Though the districts have been assigned the responsibility for educational matters, they have
little authority to hire new staff or adjust positions according to their needs. It is recommended
that district authorities be given more powers for this kind of decision making, so that the districtgovernments can perform its tasks more efficiently.
… The funds available for development projects are usually inadequate. A few districts get a
disproportionately higher amount of funds, but it generally happens only when a senior political
leader uses his or her political influence. It is recommended that adequate development funds be
provided to all districts, and that these funds be provided on the basis of clear and fair criteria, thus
minimizing the chance of any influence on allocations in favour of, or against, some districts.
… As little money is available for development projects, it is recommended that development funds be
utilized rationally, based on proper planning. The current approach emphasizes the initiation of new
projects while ignoring ongoing ones. This can lead to wasting of the money that has been spent
on ongoing projects in previous years.
… The mechanism of providing grants to schools needs to be improved and made needs-based.
Currently, funds provided to SMCs by the provincial government are not based on an assessment of
the needs of the schools.
… It is recommended that steps be taken to improve the capacity of SMCs for utilizing funds in a
transparent and judicious manner.
8/11/2019 Education Budgets
http://slidepdf.com/reader/full/education-budgets 70/71
61E x e c u t i v e
S u mm a r y
1 .I n t r o d u c t i o n
2 .T h e B u d g e t M a k i n
g P r o c e s s a n d
D i s
t r i c t M a n a g e m e n t
3 . C o m
p a r a t i v e A n a
l y s i s o f
D i s t r i c t E d u c a t i o n B
u d g e t s
4 .I s l a m a b a d C a p i t a l
T e r r i t o r y
5 .A b b o t t a b a d D i s t r i c
t 6 .N o w s h e r a D i s t r i c t
7 . C i t y D i s t r i c t
F a i s a l a b a d
8 . J h e l u m D i s t r i c t
9 .M u l t a n C i t y
D i s t r i c t
1 0 .R e c o mm e n d a t i o n s
R
e f e r e n c e s
References
Abbottabad District Government, Budgets 2004/05 – 2009/10
Faisalabad City District Government, Annual Development Programme 2008/09
Faisalabad City District Government Website: www.faisalabad.gov.pk
Faisalabad City District Government, Budgets 2004/05 – 2009/10
Government of Khyber-Pakhtunkhwa. 2003. Budget Rules 2003, Local Government and Rural
Development Department, Peshawar
Government of Pakistan, Budgets 2000/01 – 2009/10
Government of Pakistan. Census of Private Educational Institutions in Pakistan. 1999-2000 http://www.
statpak.gov.pk/depts/fbs/publications/yearbook2008/yearbook2008.html
Government of Pakistan. Ministry of Education Website: www.moe.gov.pk
Government of Pakistan. Ministry of Finance Website: www.finance.gov.pk
Government of Pakistan. Population Census Organization, Website: http://www.statpak.gov.pk
Government of Punjab. 2003. District Government and TMA Budget Rules 2003, Lahore
Jhelum District Government, Budgets 2005/06 – 2009/10
Multan City District Government, Annual Development Programme 2008/09
Multan City District Government Website: www.multan.gov.pk
Multan City District Government, Budgets 2004/05 – 2009/10
National Institute of Population Studies (NIPS), Islamabad. Website: www.nips.org.pk
Nowshera District Government, Budgets 2004/05 – 2009/10

8/11/2019 Education Budgets
http://slidepdf.com/reader/full/education-budgets 71/71
Related Documents