CHAPTER 2 The Effects of Climate Change on Agriculture and Food Security in Africa Keith Wiebe, Timothy B. Sulser, Daniel Mason-D’Croz, and Mark W. Rosegrant 1 1 is chapter draws on work conducted as part of the Global Futures and Strategic Foresight project, a CGIAR initiative led by the International Food Policy Research Institute, with support from the CGIAR Research Program on Policies, Institutions, and Markets; the CGIAR Research Program on Climate Change, Agriculture and Food Security; the Bill & Melinda Gates Foundation; the United States Agency for International Development; and others.

Welcome message from author
This document is posted to help you gain knowledge. Please leave a comment to let me know what you think about it! Share it to your friends and learn new things together.
Transcript

2016 ReSAKSS Annual Trends and Outlook Report 5
CHAPTER 2
The Effects of Climate Change on Agriculture and Food Security in Africa
Keith Wiebe, Timothy B. Sulser, Daniel Mason-D’Croz, and Mark W. Rosegrant1
1 This chapter draws on work conducted as part of the Global Futures and Strategic Foresight project, a CGIAR initiative led by the International Food Policy Research Institute, with support from the CGIAR Research Program on Policies, Institutions, and Markets; the CGIAR Research Program on Climate Change, Agriculture and Food Security; the Bill & Melinda Gates Foundation; the United States Agency for International Development; and others.
6 resakss.org
Climate change will play an increasingly important role in Africa,
as elsewhere, during the course of the 21st century. Rising
temperatures and increased frequency of extremely dry and wet
years are expected to slow progress toward increased productivity of
crop and livestock systems and improved food security, particularly
in Africa south of the Sahara (FAO 2016). But other drivers of change
in agriculture and food security are also changing in significant ways.
In order to place the impacts of climate change in context, we look
first at changes that affect demand for food and other agricultural
commodities, and then at changes affecting supply.
Key Trends and Challenges for Agriculture and Food Security in Africa
Demand Side: Population, Income, Urbanization, and Globalization
On the demand side, a key factor that immediately distinguishes Africa from
other regions of the world is population (Figure 2.1, panel [a]). The popula-
tions of East Asia and South Asia are projected to peak and then begin
declining by the 2030s and 2050s, respectively, whereas the United Nations
FIGURE 2.1—CHANGES IN DEMOGRAPHICS WILL INFLUENCE THE LEVEL AND NATURE OF DEMAND FOR FOOD
Source: United Nations, Department of Economic and Social Affairs, Population Division (2014, 2017).
0.0
0.5
1.0
1.5
2.0
2.5
3.0
1960 1970 1980 1990 2000 2010 2020 2030 2040 2050
Africa south of Sahara
East Asia
South Asia
0
10
20
30
40
50
60
70
80
90
100
1960 1970 1980 1990 2000 2010 2020 2030 2040 2050
Rural
Urban
(a) Population (billions) (b) Location of population (percentages)

2016 ReSAKSS Annual Trends and Outlook Report 7
projects that population in Africa will continue to grow rapidly throughout
the 21st century. Africa’s population is projected to exceed that of East Asia
by the 2030s (at around 1.6 billion) and that of South Asia by midcentury (at
around 2.3 billion). This growth will have direct effects on the demand for
agricultural commodities, particularly staple food crops.
At the same time, Africa and other developing regions are projected to
experience a continuing increase in per capita incomes (see, for example,
Sulser et al. 2015) and a demographic shift from rural to urban areas, with
two-thirds of the world’s people living in urban areas by 2050 (Figure 2.1,
panel [b]). Changing employment patterns, along with growth in incomes
and increased globalization, have important implications for the nature of
demand. Demand for traditional staples (excluding rice) is likely to slow in
per capita terms as demand for purchased and processed foods increases.
These changing patterns of consumption affect food security and
nutrition in diverse ways. Cheaper calories have reduced the number of
undernourished people and of stunted children in much of the developing
world but have not kept pace with population growth in Africa (Figure 2.2,
panels [a] and [b]). At the same time, the number of overweight and obese
children has increased in all regions, including Africa (Figure 2.2, panel [c]).
Rising incomes improve access to higher-value foods such as fruits, veg-
etables, and animal-source foods for many, but these foods remain beyond
reach for the poorest.
FIGURE 2.2—UNDERNOURISHMENT REMAINS A CHALLENGE IN AFRICA, EVEN WHILE OVERCONSUMPTION INCREASES
Source: FAO (2017); de Onis, Blossner, and Borghi (2010, 2012).
0
200
400
600
800
1,000
1,200
1992 1998 2004 2010 2016
Africa south of Sahara East Asia
South Asia Developing
0
50
100
150
200
250
300
1990 1995 2000 2005 2010 2015 2020
Africa Asia Developing
0
10
20
30
40
50
60
1990 1995 2000 2005 2010 2015 2020
Africa Asia Developing
(a) Undernourished population (millions) (b) Stunted children (millions) (c) Overweight and obese children (millions)

8 resakss.org8 resakss.org
Supply Side: Land, Water, Infrastructure, and TechnologyWhereas the level and composition of demand changes with population,
income, and other factors, changes in natural resources and technology
present new challenges and opportunities in meeting that demand. Over the
past half century, growth in world agriculture has been driven increasingly
by increases in total factor productivity, or the efficiency with which inputs
such as land, water, and fertilizer are used (Figure 2.3, panel [a]). This is true
in all regions except Africa south of the Sahara, where growth continues to
be driven primarily by increases in agricultural inputs (Figure 2.3, panel [b]).
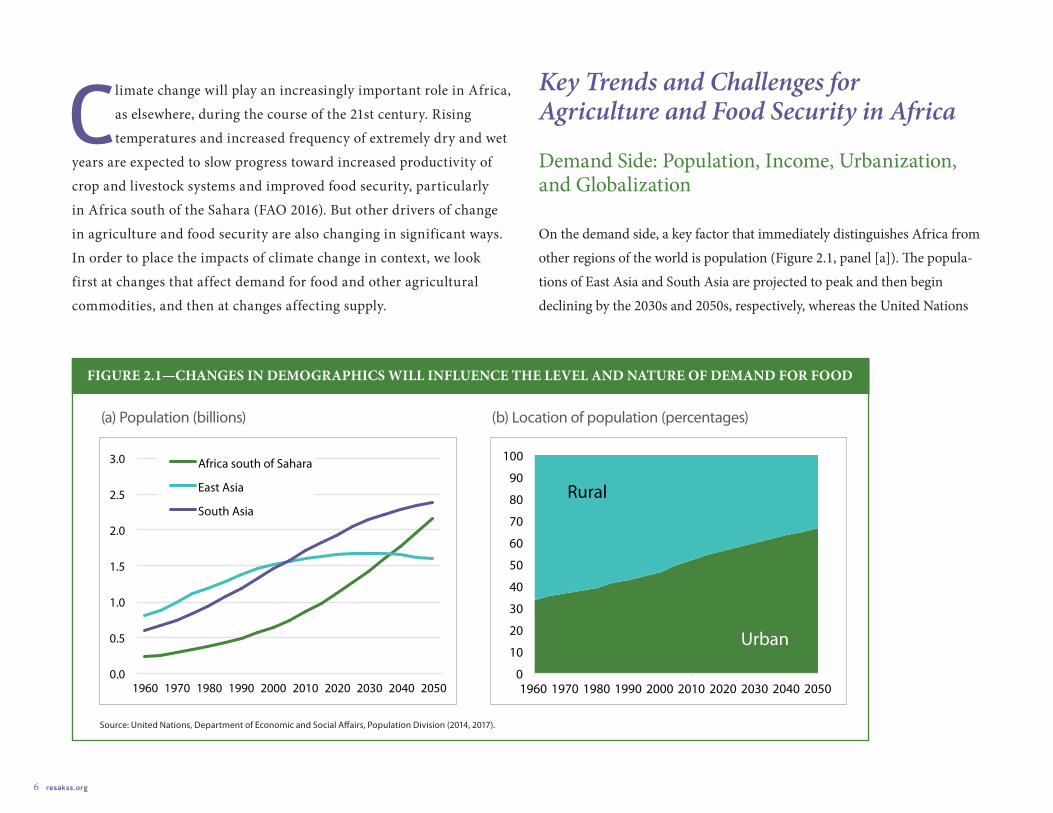
Because irrigation and commercial fertilizer use remain low in Africa
south of the Sahara, soil nutrients are being depleted in many areas and
crop yields also remain low. Cereal yields in Africa average about 1.5 tons2
per hectare—only half of those in South Asia and 20–25 percent of those
in East Asia and North America (Figure 2.4)—and maize yields represent
only 20–50 percent of potential yields in the region (van Ittersum et al.
2016). These figures illustrate the challenge faced by the region but also
the potential to be realized from improvements in productivity through
increased investment in agricultural research, resource use efficiency, and
infrastructure. We will return to these potential returns later.
2 Throughout the chapter, tons refers to metric tons.
FIGURE 2.3—AFRICA LAGS BEHIND OTHER REGIONS IN AGRICULTURAL PRODUCTIVITY GROWTH
Source: Fuglie and Wang (2012), Fuglie and Rada (2013).
0
1
2
3
4
1961-1970
1971-1980
1981-1990
1991-2000
2001-2009
Tota
l out
put
gro
wth
(per
cent
age/
year
)
-2
-1
0
1
2
3
4 To
tal o
utp
ut g
row
th (p
erce
ntag
e/ye
ar)
All inputs Total factor productivity
Developedcountries
East and South Asia
Latin America
West Asia and North
Africa
Africa south of
the Sahara
(a) Sources of world agricultural growth, 1961–2009 (b) Sources of regional growth, 2000–2010
2016 ReSAKSS Annual Trends and Outlook Report 9
The Special Challenge of Climate ChangeCompounding the effects of rising population and low productivity, climate
change will present new challenges to Africa’s farmers and consumers.
Projections of impacts depend on general circulation models of Earth’s
climate and assumptions about the rate of change in greenhouse gas emis-
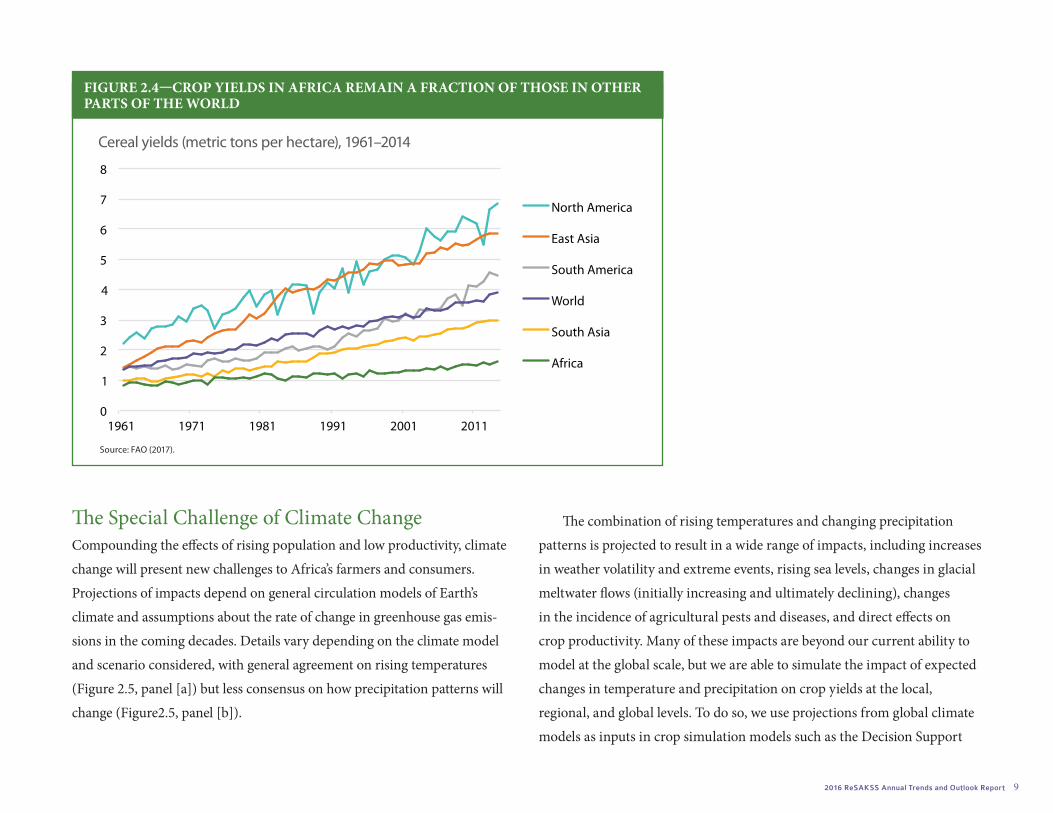
sions in the coming decades. Details vary depending on the climate model
and scenario considered, with general agreement on rising temperatures
(Figure 2.5, panel [a]) but less consensus on how precipitation patterns will
change (Figure2.5, panel [b]).
The combination of rising temperatures and changing precipitation
patterns is projected to result in a wide range of impacts, including increases
in weather volatility and extreme events, rising sea levels, changes in glacial
meltwater flows (initially increasing and ultimately declining), changes
in the incidence of agricultural pests and diseases, and direct effects on
crop productivity. Many of these impacts are beyond our current ability to
model at the global scale, but we are able to simulate the impact of expected
changes in temperature and precipitation on crop yields at the local,
regional, and global levels. To do so, we use projections from global climate
models as inputs in crop simulation models such as the Decision Support
FIGURE 2.4—CROP YIELDS IN AFRICA REMAIN A FRACTION OF THOSE IN OTHER PARTS OF THE WORLD
Source: FAO (2017).
0
1
2
3
4
5
6
7
8
1961 1971 1981 1991 2001 2011
North America
East Asia
South America
World
South Asia
Africa
Cereal yields (metric tons per hectare), 1961–2014
10 resakss.org
System for Agrotechnology Transfer (DSSAT) to simulate impacts on yields
under different climate scenarios. The results presented here are based on a
scenario using the United Kingdom’s Hadley Centre Global Environment
Model version 2—Earth System (HadGEM2-ES) general circulation model
(Jones et al. 2011) and assuming relatively rapid increases in greenhouse gas
emissions combined with middle-of-the-road assumptions about growth
in population and incomes.3 These results thus represent the impacts of
relatively large changes in temperature and precipitation, but they omit the
other dimensions of climate change noted above.
3 Specifically, these results assume climate change as represented by representative concentration pathway (RCP) 8.5 and shared socioeconomic pathway (SSP) 2. See Moss and others (2008) and O’Neill and others (2014) for more information.
Yields of rainfed maize, for example, are projected to decline by as
much as 25 percent or more in some regions under this scenario by 2050,
relative to 2000 levels (Figure 2.6). It is essential to note that this projection
is based on crop modeling that holds everything else constant—that is,
it assumes that farmers continue to grow the same varieties in the same
locations on the same planting calendar and using the same management
practices. But we know that farmers won’t continue to do everything the
same as before—not only because they will respond to changing climate
conditions but also because market conditions and technologies will also be
changing in the coming decades.
FIGURE 2.5—TEMPERATURES ARE PROJECTED TO RISE AND PRECIPITATION PATTERNS TO CHANGE
Source: Rosegrant and colleagues (2017), using the Hadley Centre Global Environment Model version 2—Earth System (HadGEM2-ES) general circulation model, assuming representative concentration pathway (RCP) 8.5.
Note: The color gradient in panel (a) shows increases in maximum temperature in 2050 relative to 2000, from < 0˚C (white) to > 6˚C (dark red). The color gradient in (b) shows changes in annual precipitation in 2050 relative to 2000, from < -400 mm (dark red) to > 400 mm (dark blue).
(a) Increase in temperature, 2050 relative to 2000 (b) Change in annual precipitation, 2050 relative to 2000

2016 ReSAKSS Annual Trends and Outlook Report 11
This chapter explores the future impacts of these various changes,
incorporating economic adjustments. The following sections present
baseline projections for agriculture and food in Africa to 2050 based on
changes in the driving factors described here, and then explore how these
projected outcomes can be changed by decisions we make today, specifically
in relation to investment in agricultural research, natural resource manage-
ment, and infrastructure.
Baseline Projections for Production, Area, Yield, Consumption, Prices, Trade, Hunger, and the Environment to 2050
The IMPACT System of Models
To explore how changes in population, income, technology, climate, invest-
ment, and policy will affect agriculture and food in Africa in the coming
decades, we use a system of models developed by the International Food
Policy Research Institute (IFPRI), called the International Model for Policy
FIGURE 2.6—MAIZE YIELDS WILL BE HARD HIT BY CLIMATE CHANGE (YIELDS EXPRESSED AS PERCENTAGE OF 2000 LEVELS)
Source: Robertson (2015).Note: Decision Support System for Agrotechnology Transfer (DSSAT) crop model results for rainfed maize based on the Hadley Centre Global Environment Model version 2—Earth System (HadGEM2-ES) model and representative concentration pathway (RCP) 8.5 for 2050, before economic adjustments.
2000 old area lost
yield loss >25% of 2000
yield loss 5–25%
yield change within 5%
yield gain 5–25%
yield gain >25%
2050 new area gained
12 resakss.org
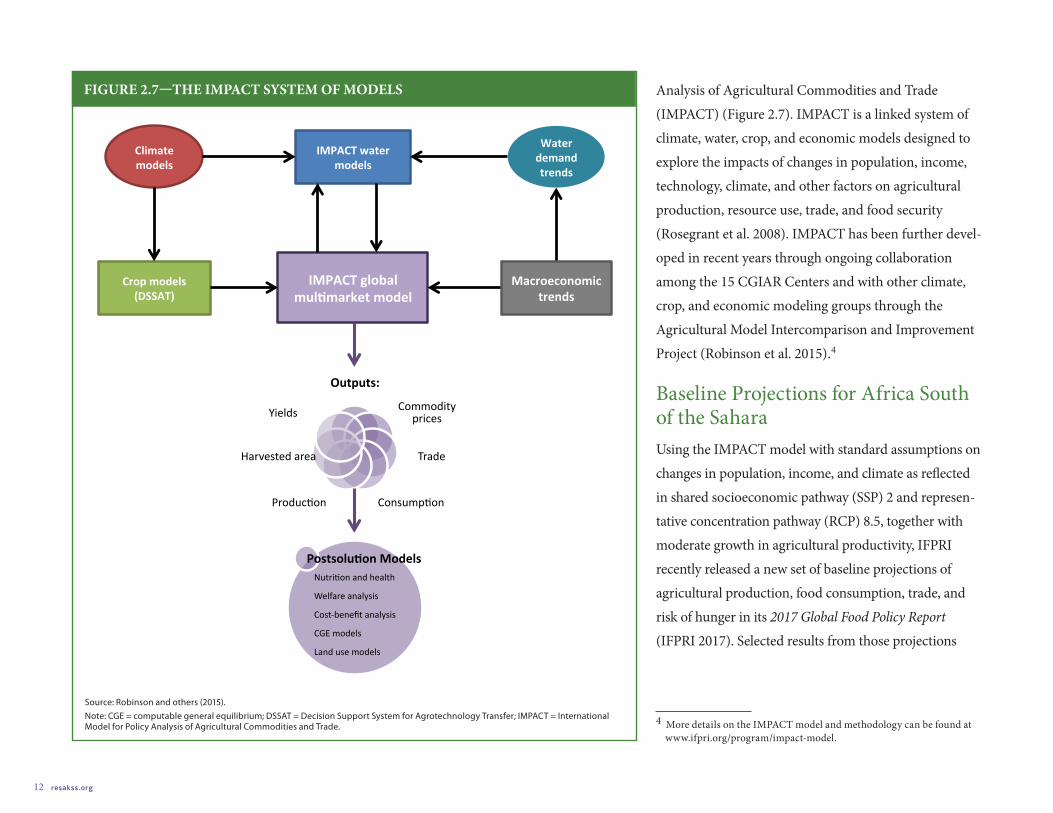
Analysis of Agricultural Commodities and Trade
(IMPACT) (Figure 2.7). IMPACT is a linked system of
climate, water, crop, and economic models designed to
explore the impacts of changes in population, income,
technology, climate, and other factors on agricultural
production, resource use, trade, and food security
(Rosegrant et al. 2008). IMPACT has been further devel-
oped in recent years through ongoing collaboration
among the 15 CGIAR Centers and with other climate,
crop, and economic modeling groups through the
Agricultural Model Intercomparison and Improvement
Project (Robinson et al. 2015).4
Baseline Projections for Africa South of the SaharaUsing the IMPACT model with standard assumptions on
changes in population, income, and climate as reflected
in shared socioeconomic pathway (SSP) 2 and represen-
tative concentration pathway (RCP) 8.5, together with
moderate growth in agricultural productivity, IFPRI
recently released a new set of baseline projections of
agricultural production, food consumption, trade, and
risk of hunger in its 2017 Global Food Policy Report
(IFPRI 2017). Selected results from those projections
4 More details on the IMPACT model and methodology can be found at www.ifpri.org/program/impact-model.
FIGURE 2.7—THE IMPACT SYSTEM OF MODELS
Source: Robinson and others (2015).Note: CGE = computable general equilibrium; DSSAT = Decision Support System for Agrotechnology Transfer; IMPACT = International Model for Policy Analysis of Agricultural Commodities and Trade.
Climatemodels
IMPACTglobalmul4marketmodel
IMPACTwatermodels
Cropmodels(DSSAT)
Waterdemandtrends
Outputs:
Commodityprices
Trade
Consump2onProduc2on
Harvestedarea
Yields
Macroeconomictrends
Postsolu4onModelsNutri2onandhealth
Welfareanalysis
Cost-benefitanalysis
CGEmodels
Landusemodels
2016 ReSAKSS Annual Trends and Outlook Report 13
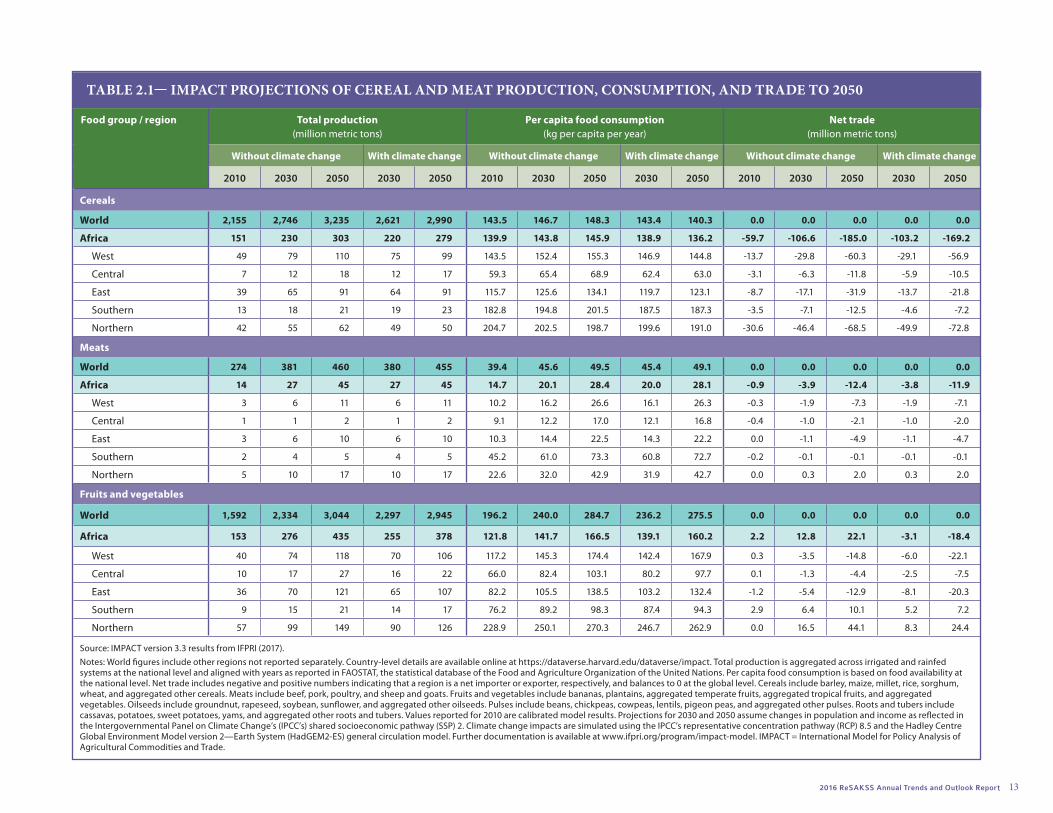
TABLE 2.1— IMPACT PROJECTIONS OF CEREAL AND MEAT PRODUCTION, CONSUMPTION, AND TRADE TO 2050
Food group / region Total production(million metric tons)
Per capita food consumption(kg per capita per year)
Net trade(million metric tons)
Without climate change With climate change Without climate change With climate change Without climate change With climate change
2010 2030 2050 2030 2050 2010 2030 2050 2030 2050 2010 2030 2050 2030 2050
Cereals
World 2,155 2,746 3,235 2,621 2,990 143.5 146.7 148.3 143.4 140.3 0.0 0.0 0.0 0.0 0.0
Africa 151 230 303 220 279 139.9 143.8 145.9 138.9 136.2 -59.7 -106.6 -185.0 -103.2 -169.2
West 49 79 110 75 99 143.5 152.4 155.3 146.9 144.8 -13.7 -29.8 -60.3 -29.1 -56.9
Central 7 12 18 12 17 59.3 65.4 68.9 62.4 63.0 -3.1 -6.3 -11.8 -5.9 -10.5
East 39 65 91 64 91 115.7 125.6 134.1 119.7 123.1 -8.7 -17.1 -31.9 -13.7 -21.8
Southern 13 18 21 19 23 182.8 194.8 201.5 187.5 187.3 -3.5 -7.1 -12.5 -4.6 -7.2
Northern 42 55 62 49 50 204.7 202.5 198.7 199.6 191.0 -30.6 -46.4 -68.5 -49.9 -72.8
Meats
World 274 381 460 380 455 39.4 45.6 49.5 45.4 49.1 0.0 0.0 0.0 0.0 0.0
Africa 14 27 45 27 45 14.7 20.1 28.4 20.0 28.1 -0.9 -3.9 -12.4 -3.8 -11.9
West 3 6 11 6 11 10.2 16.2 26.6 16.1 26.3 -0.3 -1.9 -7.3 -1.9 -7.1
Central 1 1 2 1 2 9.1 12.2 17.0 12.1 16.8 -0.4 -1.0 -2.1 -1.0 -2.0
East 3 6 10 6 10 10.3 14.4 22.5 14.3 22.2 0.0 -1.1 -4.9 -1.1 -4.7
Southern 2 4 5 4 5 45.2 61.0 73.3 60.8 72.7 -0.2 -0.1 -0.1 -0.1 -0.1
Northern 5 10 17 10 17 22.6 32.0 42.9 31.9 42.7 0.0 0.3 2.0 0.3 2.0
Fruits and vegetables
World 1,592 2,334 3,044 2,297 2,945 196.2 240.0 284.7 236.2 275.5 0.0 0.0 0.0 0.0 0.0
Africa 153 276 435 255 378 121.8 141.7 166.5 139.1 160.2 2.2 12.8 22.1 -3.1 -18.4
West 40 74 118 70 106 117.2 145.3 174.4 142.4 167.9 0.3 -3.5 -14.8 -6.0 -22.1
Central 10 17 27 16 22 66.0 82.4 103.1 80.2 97.7 0.1 -1.3 -4.4 -2.5 -7.5
East 36 70 121 65 107 82.2 105.5 138.5 103.2 132.4 -1.2 -5.4 -12.9 -8.1 -20.3
Southern 9 15 21 14 17 76.2 89.2 98.3 87.4 94.3 2.9 6.4 10.1 5.2 7.2
Northern 57 99 149 90 126 228.9 250.1 270.3 246.7 262.9 0.0 16.5 44.1 8.3 24.4
Source: IMPACT version 3.3 results from IFPRI (2017).Notes: World figures include other regions not reported separately. Country-level details are available online at https://dataverse.harvard.edu/dataverse/impact. Total production is aggregated across irrigated and rainfed systems at the national level and aligned with years as reported in FAOSTAT, the statistical database of the Food and Agriculture Organization of the United Nations. Per capita food consumption is based on food availability at the national level. Net trade includes negative and positive numbers indicating that a region is a net importer or exporter, respectively, and balances to 0 at the global level. Cereals include barley, maize, millet, rice, sorghum, wheat, and aggregated other cereals. Meats include beef, pork, poultry, and sheep and goats. Fruits and vegetables include bananas, plantains, aggregated temperate fruits, aggregated tropical fruits, and aggregated vegetables. Oilseeds include groundnut, rapeseed, soybean, sunflower, and aggregated other oilseeds. Pulses include beans, chickpeas, cowpeas, lentils, pigeon peas, and aggregated other pulses. Roots and tubers include cassavas, potatoes, sweet potatoes, yams, and aggregated other roots and tubers. Values reported for 2010 are calibrated model results. Projections for 2030 and 2050 assume changes in population and income as reflected in the Intergovernmental Panel on Climate Change’s (IPCC’s) shared socioeconomic pathway (SSP) 2. Climate change impacts are simulated using the IPCC’s representative concentration pathway (RCP) 8.5 and the Hadley Centre Global Environment Model version 2—Earth System (HadGEM2-ES) general circulation model. Further documentation is available at www.ifpri.org/program/impact-model. IMPACT = International Model for Policy Analysis of Agricultural Commodities and Trade.

14 resakss.org
TABLE 2.1— IMPACT PROJECTIONS OF CEREAL AND MEAT PRODUCTION, CONSUMPTION, AND TRADE TO 2050, continued
Food group / region Total production(million metric tons)
Per capita food consumption(kg per capita per year)
Net trade(million metric tons)
Without climate change With climate change Without climate change With climate change Without climate change With climate change
2010 2030 2050 2030 2050 2010 2030 2050 2030 2050 2010 2030 2050 2030 2050
Oilseeds
World 673 1,033 1,293 1,017 1,257 6.8 8.2 7.8 7.9 7.3 0.0 0.0 0.0 0.0 0.0
Africa 56 94 118 91 110 5.7 6.7 7.5 6.4 6.9 -1.2 -2.7 -6.3 -2.4 -5.4
West 43 74 94 72 88 8.1 9.3 10.1 8.8 9.2 0.3 -0.5 -2.7 -0.4 -2.5
Central 4 6 8 6 7 9.0 10.0 10.6 9.4 9.5 0.1 0.1 0.1 0.2 0.4
East 4 6 7 6 7 3.7 4.4 5.3 4.2 4.8 0.1 -0.3 -1.3 -0.2 -0.9
Southern 1 1 2 1 1 1.9 2.1 2.1 2.0 2.0 -0.2 -0.3 -0.3 -0.2 -0.2
Northern 4 6 7 5 6 4.6 5.3 5.7 5.1 5.3 -1.5 -1.8 -2.2 -1.7 -2.1
Pulses
World 66 94 121 92 118 6.2 7.5 8.9 7.5 8.8 0.0 0.0 0.0 0.0 0.0
Africa 13 20 30 20 28 10.0 12.0 14.3 11.8 14.0 -1.7 -5.2 -11.1 -5.4 -11.5
West 5 9 16 9 14 8.5 9.8 11.6 9.6 11.1 0.3 0.1 -0.3 0.0 -0.6
Central 1 2 2 2 2 6.7 7.4 8.7 7.3 8.4 -0.1 -0.2 -0.3 -0.2 -0.2
East 5 7 9 7 10 15.3 18.2 22.0 18.0 21.6 -0.7 -3.3 -7.9 -3.2 -7.5
Southern 0 0 0 0 0 3.8 4.2 4.5 4.1 4.4 -0.1 -0.1 0.0 -0.1 0.0
Northern 1 2 2 1 2 8.2 9.7 11.4 9.8 11.5 -1.1 -1.8 -2.6 -2.1 -3.2
Roots and tubers
World 780 1,006 1,185 963 1,103 65.0 70.5 73.4 67.8 69.0 0.0 0.0 0.0 0.0 0.0
Africa 232 362 506 346 469 129.0 138.0 143.7 134.4 137.0 -0.7 -10.2 -28.3 -15.1 -37.8
West 133 207 297 201 281 197.5 199.0 198.8 194.9 191.1 1.5 -4.3 -11.7 -4.2 -10.2
Central 37 59 80 56 72 172.5 170.6 166.7 167.1 159.9 1.0 2.6 -2.2 0.1 -8.2
East 50 78 107 71 91 129.6 138.5 142.0 134.6 134.4 -3.2 -9.4 -15.3 -13.9 -24.6
Southern 3 4 5 4 5 36.8 37.7 38.7 36.6 37.1 0.0 0.7 1.3 0.9 1.3
Northern 9 14 18 15 20 33.7 38.3 42.1 35.7 37.9 -0.1 0.2 -0.3 2.0 4.0
Source: IMPACT version 3.3 results from IFPRI (2017).Notes: World figures include other regions not reported separately. Country-level details are available online at https://dataverse.harvard.edu/dataverse/impact. Total production is aggregated across irrigated and rainfed systems at the national level and aligned with years as reported in FAOSTAT, the statistical database of the Food and Agriculture Organization of the United Nations. Per capita food consumption is based on food availability at the national level. Net trade includes negative and positive numbers indicating that a region is a net importer or exporter, respectively, and balances to 0 at the global level. Cereals include barley, maize, millet, rice, sorghum, wheat, and aggregated other cereals. Meats include beef, pork, poultry, and sheep and goats. Fruits and vegetables include bananas, plantains, aggregated temperate fruits, aggregated tropical fruits, and aggregated vegetables. Oilseeds include groundnut, rapeseed, soybean, sunflower, and aggregated other oilseeds. Pulses include beans, chickpeas, cowpeas, lentils, pigeon peas, and aggregated other pulses. Roots and tubers include cassavas, potatoes, sweet potatoes, yams, and aggregated other roots and tubers. Values reported for 2010 are calibrated model results. Projections for 2030 and 2050 assume changes in population and income as reflected in the Intergovernmental Panel on Climate Change’s (IPCC’s) shared socioeconomic pathway (SSP) 2. Climate change impacts are simulated using the IPCC’s representative concentration pathway (RCP) 8.5 and the Hadley Centre Global Environment Model version 2—Earth System (HadGEM2-ES) general circulation model. Further documentation is available at www.ifpri.org/program/impact-model. IMPACT = International Model for Policy Analysis of Agricultural Commodities and Trade.
2016 ReSAKSS Annual Trends and Outlook Report 15
are presented in Tables 2.1 and 2.2.5 Given the complexity and uncertainty
inherent in the underlying processes involved, it is important to note that pro-
jections vary depending on the specific models and assumptions used. Those
presented here represent current baselines with and without climate change,
but work is under way to analyze a wider range climate and socioeconomic
assumptions (Wiebe et al. 2015).
Cereal production is projected to double in Africa south of the Sahara
by midcentury, but production in 2050 will be about 5 percent less than it
would have been in the absence of climate change. (These results assume
moderate growth in agricultural productivity—an assumption that can be
adjusted according to decisions made regarding investment in agricultural
5 The full set of results can be found online at https://dataverse.harvard.edu/dataverse/impact.
research and development.) Net imports of cereals in the region are projected
to increase threefold relative to 2010 levels. Perhaps counterintuitively, net
cereal imports into the region are projected to be lower in 2050 with climate
change than they would have been in the absence of climate change. This
is because in this scenario, based on climate results from HadGEM2-ES,
temperature increases and changes in precipitation reduce growth in produc-
tion by the major cereal-producing and -exporting countries in the Americas
and Europe (Figure 2.6), thereby raising prices.6 Higher prices will in turn
reduce cereal imports by African and other developing countries. The
6 Increased levels of atmospheric carbon dioxide increase plant productivity under certain circumstances and may partially offset some adverse impacts of climate change, but their effects are sensitive to other factors and remain controversial (Nowak 2017; Obermeier and colleagues 2016), and therefore they are not included in the scenarios described here.
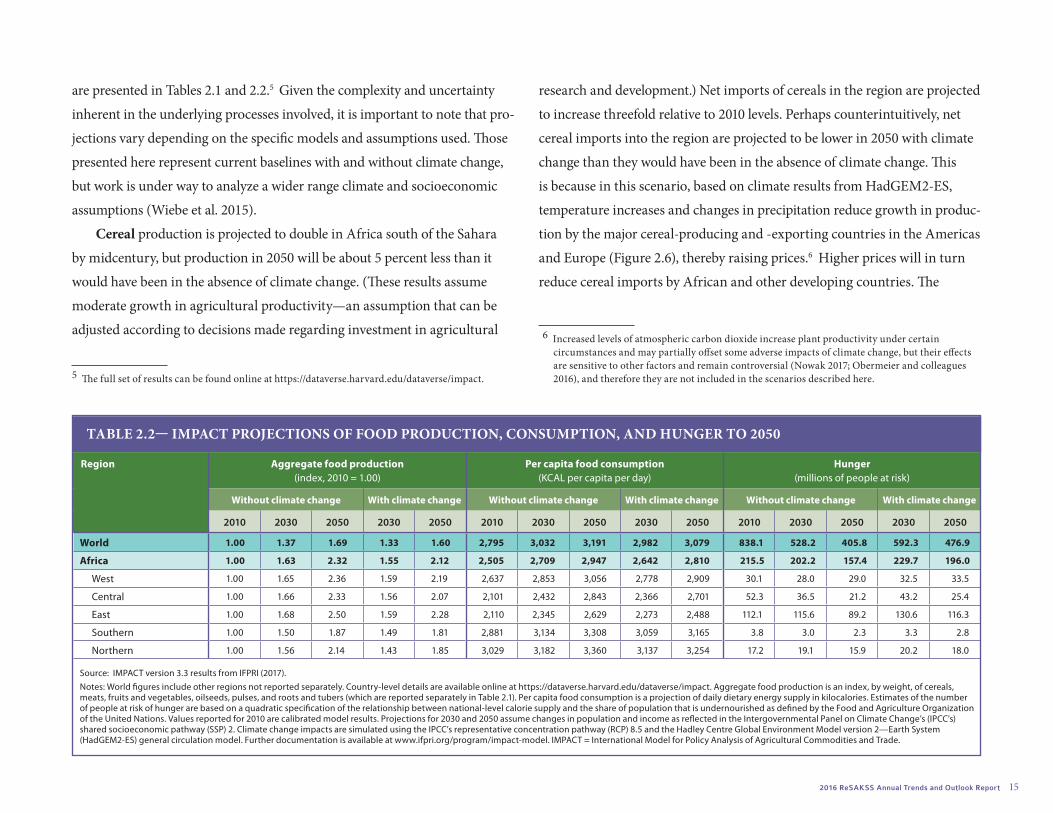
TABLE 2.2— IMPACT PROJECTIONS OF FOOD PRODUCTION, CONSUMPTION, AND HUNGER TO 2050
Region Aggregate food production(index, 2010 = 1.00)
Per capita food consumption(KCAL per capita per day)
Hunger(millions of people at risk)
Without climate change With climate change Without climate change With climate change Without climate change With climate change
2010 2030 2050 2030 2050 2010 2030 2050 2030 2050 2010 2030 2050 2030 2050
World 1.00 1.37 1.69 1.33 1.60 2,795 3,032 3,191 2,982 3,079 838.1 528.2 405.8 592.3 476.9
Africa 1.00 1.63 2.32 1.55 2.12 2,505 2,709 2,947 2,642 2,810 215.5 202.2 157.4 229.7 196.0
West 1.00 1.65 2.36 1.59 2.19 2,637 2,853 3,056 2,778 2,909 30.1 28.0 29.0 32.5 33.5
Central 1.00 1.66 2.33 1.56 2.07 2,101 2,432 2,843 2,366 2,701 52.3 36.5 21.2 43.2 25.4
East 1.00 1.68 2.50 1.59 2.28 2,110 2,345 2,629 2,273 2,488 112.1 115.6 89.2 130.6 116.3
Southern 1.00 1.50 1.87 1.49 1.81 2,881 3,134 3,308 3,059 3,165 3.8 3.0 2.3 3.3 2.8
Northern 1.00 1.56 2.14 1.43 1.85 3,029 3,182 3,360 3,137 3,254 17.2 19.1 15.9 20.2 18.0
Source: IMPACT version 3.3 results from IFPRI (2017).Notes: World figures include other regions not reported separately. Country-level details are available online at https://dataverse.harvard.edu/dataverse/impact. Aggregate food production is an index, by weight, of cereals, meats, fruits and vegetables, oilseeds, pulses, and roots and tubers (which are reported separately in Table 2.1). Per capita food consumption is a projection of daily dietary energy supply in kilocalories. Estimates of the number of people at risk of hunger are based on a quadratic specification of the relationship between national-level calorie supply and the share of population that is undernourished as defined by the Food and Agriculture Organization of the United Nations. Values reported for 2010 are calibrated model results. Projections for 2030 and 2050 assume changes in population and income as reflected in the Intergovernmental Panel on Climate Change’s (IPCC’s) shared socioeconomic pathway (SSP) 2. Climate change impacts are simulated using the IPCC’s representative concentration pathway (RCP) 8.5 and the Hadley Centre Global Environment Model version 2—Earth System (HadGEM2-ES) general circulation model. Further documentation is available at www.ifpri.org/program/impact-model. IMPACT = International Model for Policy Analysis of Agricultural Commodities and Trade.

16 resakss.org
combined impact of increased population, slower growth in production due
to climate change, and imports that are lower than they would have been in
the absence of climate change means that per capita consumption of cereals
will remain basically unchanged in the region in 2050 relative to 2010.
Meat production in Africa south of the Sahara is projected to grow by
around 24 million tons (a threefold increase) by 2050, and net imports are
projected to grow from less than 1 million tons to around 13 million tons,
resulting in a doubling of per capita meat consumption.
Pulse production in the region is projected to more than double, and
net imports are projected to grow from less than 1 million tons to around 9
million tons. Per capita consumption is projected to rise by about a third.
Root and tuber production in the region is projected to double, and
net imports are projected to grow from around 1 million tons to 43 million
tons by 2050. Per capita consumption will remain basically unchanged, at
around 150 kg per capita per year.
Oilseed production will also double, to 105 million tons, with a small
increase in net imports, to around 4 million tons, and relatively little change
in per capita consumption.
Fruit and vegetable production in the region is projected to increase
by 1.6 times by 2050, and per capita consumption by half. The region is
projected to become a net importer of fruits and vegetables, with about one-
quarter of total demand being met by imports.
Based on the combined effects of changes in population, income,
climate, and productivity, the number of people at risk of hunger in
Africa south of the Sahara is projected to decline from 209.5 million
in 2010 to 188.7 million in 2050 in this scenario (Table 2.2). Projected
improvements are greatest in central Africa, with slight increases in the
number at risk in eastern and western Africa. Climate change reduces
the improvement that would be projected in the absence of climate
change, leaving 38 million more people at risk of hunger in Africa south
of the Sahara in 2050 than would otherwise be the case, most of them in
eastern Africa. And the malnutrition rate for children younger than five
years (as measured by wasting) is projected to rise from 21.7 to 24.4 percent
by 2050—an increase of more than 4 million children (Waithaka et al. 2013;
Jalloh et al. 2013; Hachigonta et al. 2013; Thomas and Rosegrant 2015).
Gains from Improvements in Productivity, Resource Management, and Infrastructure
Adoption of Improved Agricultural Technologies for Sustainable IntensificationRosegrant and colleagues (2014) analyzed a wide range of agricultural
technologies selected for their potential to improve productivity while
reducing adverse environmental impacts. Approaches ranging from new
stress-tolerant crop varieties to no-till and precision agriculture were simu-
lated worldwide for maize, rice, and wheat crops, under a warmer and wetter
future climate scenario.
In Africa south of the Sahara, among the technologies considered,
no-till farming and nitrogen-efficient crop varieties show the greatest
promise under a warmer and wetter climate in 2050, compared with a
scenario without adoption of those technologies (Table 2.3). Overall, rice
yields in Africa south of the Sahara receive the largest boost through the use
2016 ReSAKSS Annual Trends and Outlook Report 17
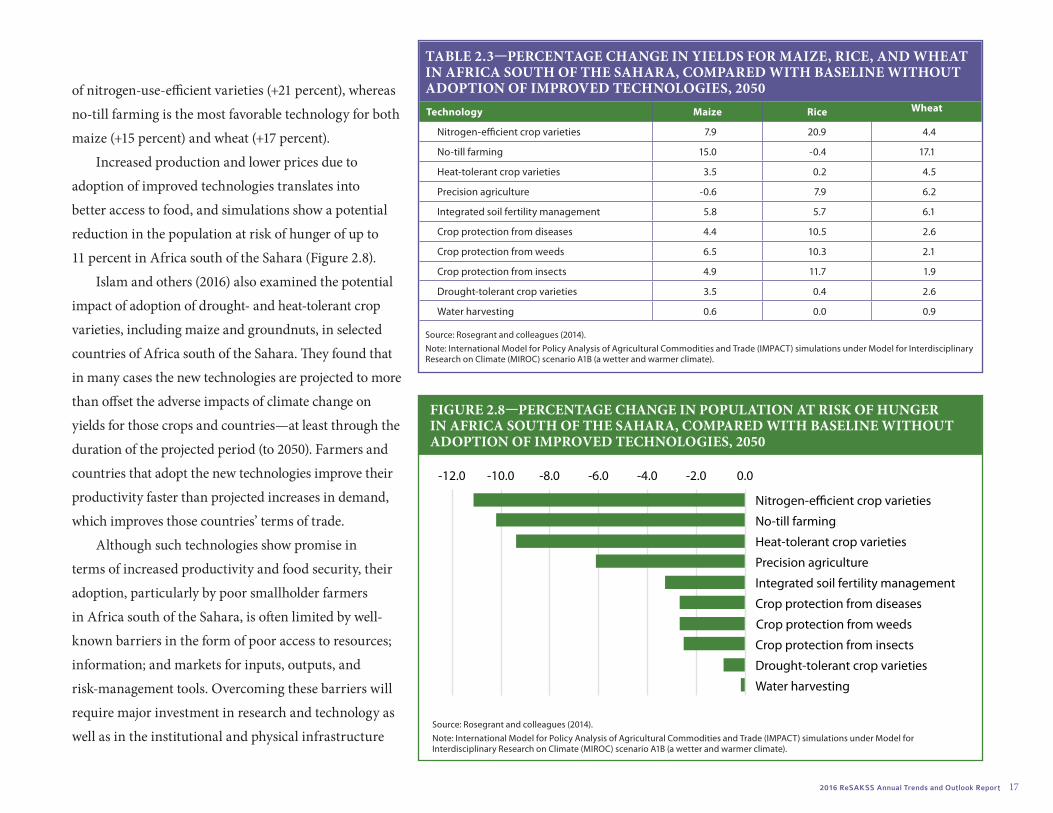
of nitrogen-use-efficient varieties (+21 percent), whereas
no-till farming is the most favorable technology for both
maize (+15 percent) and wheat (+17 percent).
Increased production and lower prices due to
adoption of improved technologies translates into
better access to food, and simulations show a potential
reduction in the population at risk of hunger of up to
11 percent in Africa south of the Sahara (Figure 2.8).
Islam and others (2016) also examined the potential
impact of adoption of drought- and heat-tolerant crop
varieties, including maize and groundnuts, in selected
countries of Africa south of the Sahara. They found that
in many cases the new technologies are projected to more
than offset the adverse impacts of climate change on
yields for those crops and countries—at least through the
duration of the projected period (to 2050). Farmers and
countries that adopt the new technologies improve their
productivity faster than projected increases in demand,
which improves those countries’ terms of trade.
Although such technologies show promise in
terms of increased productivity and food security, their
adoption, particularly by poor smallholder farmers
in Africa south of the Sahara, is often limited by well-
known barriers in the form of poor access to resources;
information; and markets for inputs, outputs, and
risk-management tools. Overcoming these barriers will
require major investment in research and technology as
well as in the institutional and physical infrastructure
FIGURE 2.8—PERCENTAGE CHANGE IN POPULATION AT RISK OF HUNGER IN AFRICA SOUTH OF THE SAHARA, COMPARED WITH BASELINE WITHOUT ADOPTION OF IMPROVED TECHNOLOGIES, 2050
Source: Rosegrant and colleagues (2014).Note: International Model for Policy Analysis of Agricultural Commodities and Trade (IMPACT) simulations under Model for Interdisciplinary Research on Climate (MIROC) scenario A1B (a wetter and warmer climate).
-12.0 -10.0 -8.0 -6.0 -4.0 -2.0 0.0
Nitrogen-efficient crop varieties
No-till farming
Heat-tolerant crop varieties
Precision agriculture
Integrated soil fertility management
Crop protection from diseases
Crop protection from weeds
Crop protection from insects
Drought-tolerant crop varieties
Water harvesting
TABLE 2.3—PERCENTAGE CHANGE IN YIELDS FOR MAIZE, RICE, AND WHEAT IN AFRICA SOUTH OF THE SAHARA, COMPARED WITH BASELINE WITHOUT ADOPTION OF IMPROVED TECHNOLOGIES, 2050Technology Maize Rice Wheat
Nitrogen-efficient crop varieties 7.9 20.9 4.4
No-till farming 15.0 -0.4 17.1
Heat-tolerant crop varieties 3.5 0.2 4.5
Precision agriculture -0.6 7.9 6.2
Integrated soil fertility management 5.8 5.7 6.1
Crop protection from diseases 4.4 10.5 2.6
Crop protection from weeds 6.5 10.3 2.1
Crop protection from insects 4.9 11.7 1.9
Drought-tolerant crop varieties 3.5 0.4 2.6
Water harvesting 0.6 0.0 0.9
Source: Rosegrant and colleagues (2014).Note: International Model for Policy Analysis of Agricultural Commodities and Trade (IMPACT) simulations under Model for Interdisciplinary Research on Climate (MIROC) scenario A1B (a wetter and warmer climate).
18 resakss.org
needed to improve access to new opportunities. Recent findings on the
impacts of such investments are described in the next section.
Investment in Productivity-Enhancing Research and Development, Water Management, and InfrastructureA recent analysis by Rosegrant and colleagues (2017) in collaboration
with the 15 CGIAR Centers examined three sets of alternative investment
scenarios for the developing world, each of which increases investment in
one of the areas described in the previous section. A fourth comprehensive
scenario combines elements from the first three:
1. Enhanced productivity through increased investments in agricul-
tural research and development (R&D). Five scenarios explore the
impacts of different levels of increased investment in research by
CGIAR and national agricultural research systems, with different
regional emphases, to help overcome the disparities in productivity
growth evident in Figure 2.4, particularly in Africa south of the
Sahara and South Asia.
2. Improved water resource management. Three scenarios explore the
impacts of increased investment to expand irrigated area, increase
water use efficiency, and increase the water-holding capacity of soil.
3. Improved marketing efficiency through increased investment in
infrastructure. One scenario explores the impact of increased
investment in transportation and marketing infrastructure to
reduce price margins between producers and consumers.
4. A comprehensive scenario combining selected elements of 1–3.
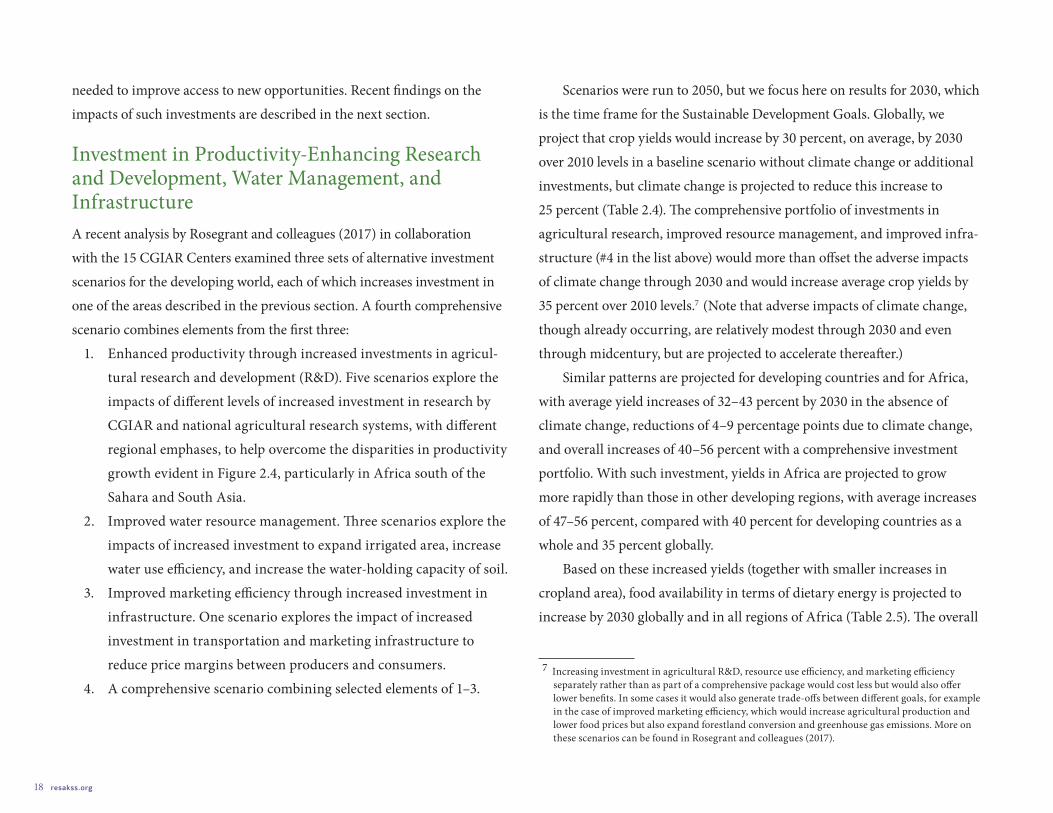
Scenarios were run to 2050, but we focus here on results for 2030, which
is the time frame for the Sustainable Development Goals. Globally, we
project that crop yields would increase by 30 percent, on average, by 2030
over 2010 levels in a baseline scenario without climate change or additional
investments, but climate change is projected to reduce this increase to
25 percent (Table 2.4). The comprehensive portfolio of investments in
agricultural research, improved resource management, and improved infra-
structure (#4 in the list above) would more than offset the adverse impacts
of climate change through 2030 and would increase average crop yields by
35 percent over 2010 levels.7 (Note that adverse impacts of climate change,
though already occurring, are relatively modest through 2030 and even
through midcentury, but are projected to accelerate thereafter.)
Similar patterns are projected for developing countries and for Africa,
with average yield increases of 32–43 percent by 2030 in the absence of
climate change, reductions of 4–9 percentage points due to climate change,
and overall increases of 40–56 percent with a comprehensive investment
portfolio. With such investment, yields in Africa are projected to grow
more rapidly than those in other developing regions, with average increases
of 47–56 percent, compared with 40 percent for developing countries as a
whole and 35 percent globally.
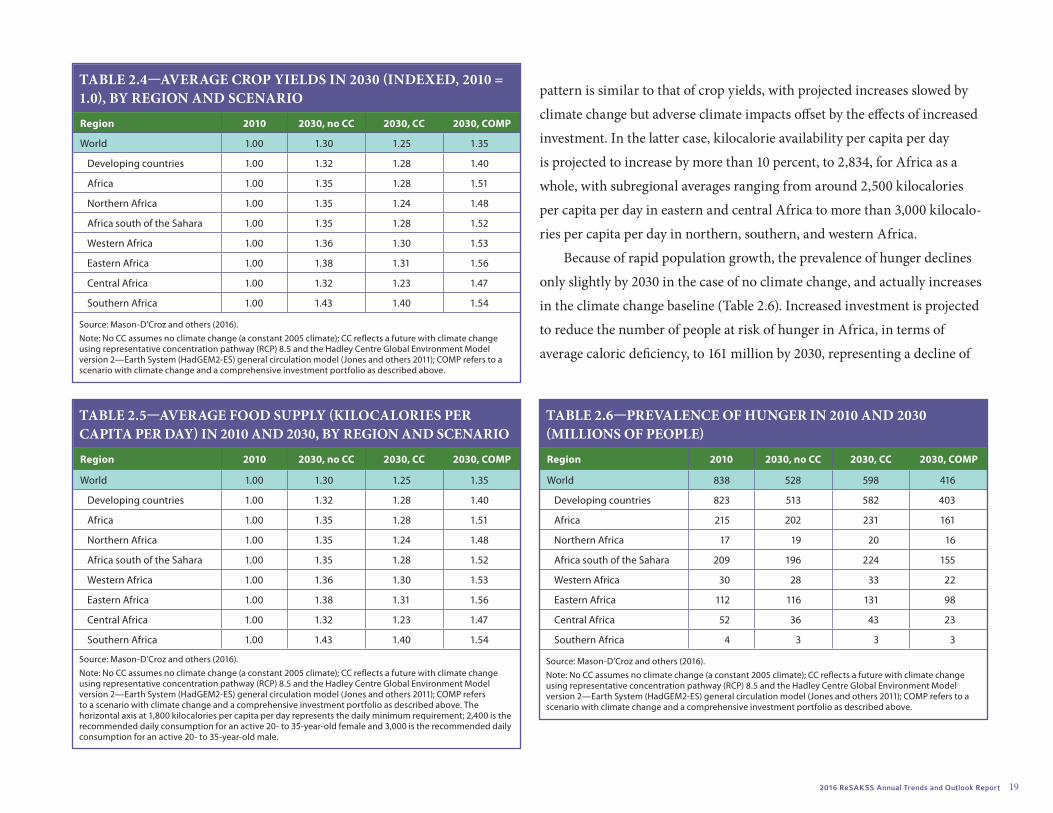
Based on these increased yields (together with smaller increases in
cropland area), food availability in terms of dietary energy is projected to
increase by 2030 globally and in all regions of Africa (Table 2.5). The overall
7 Increasing investment in agricultural R&D, resource use efficiency, and marketing efficiency separately rather than as part of a comprehensive package would cost less but would also offer lower benefits. In some cases it would also generate trade-offs between different goals, for example in the case of improved marketing efficiency, which would increase agricultural production and lower food prices but also expand forestland conversion and greenhouse gas emissions. More on these scenarios can be found in Rosegrant and colleagues (2017).
2016 ReSAKSS Annual Trends and Outlook Report 19
pattern is similar to that of crop yields, with projected increases slowed by
climate change but adverse climate impacts offset by the effects of increased
investment. In the latter case, kilocalorie availability per capita per day
is projected to increase by more than 10 percent, to 2,834, for Africa as a
whole, with subregional averages ranging from around 2,500 kilocalories
per capita per day in eastern and central Africa to more than 3,000 kilocalo-
ries per capita per day in northern, southern, and western Africa.
Because of rapid population growth, the prevalence of hunger declines
only slightly by 2030 in the case of no climate change, and actually increases
in the climate change baseline (Table 2.6). Increased investment is projected
to reduce the number of people at risk of hunger in Africa, in terms of
average caloric deficiency, to 161 million by 2030, representing a decline of
TABLE 2.4—AVERAGE CROP YIELDS IN 2030 (INDEXED, 2010 = 1.0), BY REGION AND SCENARIO
Region 2010 2030, no CC 2030, CC 2030, COMP
World 1.00 1.30 1.25 1.35
Developing countries 1.00 1.32 1.28 1.40
Africa 1.00 1.35 1.28 1.51
Northern Africa 1.00 1.35 1.24 1.48
Africa south of the Sahara 1.00 1.35 1.28 1.52
Western Africa 1.00 1.36 1.30 1.53
Eastern Africa 1.00 1.38 1.31 1.56
Central Africa 1.00 1.32 1.23 1.47
Southern Africa 1.00 1.43 1.40 1.54
Source: Mason-D’Croz and others (2016).Note: No CC assumes no climate change (a constant 2005 climate); CC reflects a future with climate change using representative concentration pathway (RCP) 8.5 and the Hadley Centre Global Environment Model version 2—Earth System (HadGEM2-ES) general circulation model (Jones and others 2011); COMP refers to a scenario with climate change and a comprehensive investment portfolio as described above.
TABLE 2.5—AVERAGE FOOD SUPPLY (KILOCALORIES PER CAPITA PER DAY) IN 2010 AND 2030, BY REGION AND SCENARIO
Region 2010 2030, no CC 2030, CC 2030, COMP
World 1.00 1.30 1.25 1.35
Developing countries 1.00 1.32 1.28 1.40
Africa 1.00 1.35 1.28 1.51
Northern Africa 1.00 1.35 1.24 1.48
Africa south of the Sahara 1.00 1.35 1.28 1.52
Western Africa 1.00 1.36 1.30 1.53
Eastern Africa 1.00 1.38 1.31 1.56
Central Africa 1.00 1.32 1.23 1.47
Southern Africa 1.00 1.43 1.40 1.54
Source: Mason-D’Croz and others (2016).Note: No CC assumes no climate change (a constant 2005 climate); CC reflects a future with climate change using representative concentration pathway (RCP) 8.5 and the Hadley Centre Global Environment Model version 2—Earth System (HadGEM2-ES) general circulation model (Jones and others 2011); COMP refers to a scenario with climate change and a comprehensive investment portfolio as described above. The horizontal axis at 1,800 kilocalories per capita per day represents the daily minimum requirement; 2,400 is the recommended daily consumption for an active 20- to 35-year-old female and 3,000 is the recommended daily consumption for an active 20- to 35-year-old male.
TABLE 2.6—PREVALENCE OF HUNGER IN 2010 AND 2030 (MILLIONS OF PEOPLE)
Region 2010 2030, no CC 2030, CC 2030, COMP
World 838 528 598 416
Developing countries 823 513 582 403
Africa 215 202 231 161
Northern Africa 17 19 20 16
Africa south of the Sahara 209 196 224 155
Western Africa 30 28 33 22
Eastern Africa 112 116 131 98
Central Africa 52 36 43 23
Southern Africa 4 3 3 3
Source: Mason-D’Croz and others (2016).Note: No CC assumes no climate change (a constant 2005 climate); CC reflects a future with climate change using representative concentration pathway (RCP) 8.5 and the Hadley Centre Global Environment Model version 2—Earth System (HadGEM2-ES) general circulation model (Jones and others 2011); COMP refers to a scenario with climate change and a comprehensive investment portfolio as described above.

20 resakss.org
30 percent relative to 2010 levels, with the largest numeric improvement (33
million) in eastern Africa and the largest percentage improvement (nearly
50 percent) in central Africa.
The share of the population at risk of chronic hunger is projected to
remain at more than 10 percent in Africa by 2030 in the absence of climate
change (Table 2.7). The share is lower in western and southern Africa and
higher in eastern Africa. Climate change reverses these gains in Africa, as in
other regions, but its effects can be offset by a comprehensive set of investments
in agricultural research, resource management, and infrastructure. It is impor-
tant to note that the assessments of population at risk of chronic hunger are
based on the average availability of food energy and do not take into account
other dimensions of food insecurity such as micronutrient deficiencies,
episodes of conflict, or other shocks that create localized vulnerability.
Discussion, Institutional and Political Challenges, and Conclusion
In the face of a growing threat to food security, policy makers are under
increasing pressure to devise policies that promote adaptation to climate
change while also reducing greenhouse gas emissions. These policies need
to address the local impacts of global change and must be feasible in the
short term and sustainable in the long term, designed to weather challenges
from forces that are both global and local, exogenous and endogenous to
a country (De Pinto, Wiebe, and Rosegrant 2016). Recent analyses offer
insights on alternative scenarios and inform the consideration of policy
options that can contribute to a country’s climate-change readiness. A
global-to-local approach also helps in identifying climate opportuni-
ties—that is, places where climate change will improve conditions for
agriculture—as well as which crops to invest in, given changes in compara-
tive advantage and commodity prices.
In the years ahead, up to 2050, African countries are projected to
continue the substantial growth observed in recent decades. Many will
enter middle-income status. Agriculture will grow absolutely and decline
as a share of national economies as services and manufacturing increase
more rapidly than primary agriculture. In order to engage constructively in
the process of structural transformation and growth, African agriculture
will need to become technologically more sophisticated and derive more
benefit from a strong foundation in agricultural science. A vibrant scientific
establishment will facilitate sectoral adaptation to changing conditions of
the climate and markets, and create jobs for young people seeking to share
in the national transition to middle-income status. This is all the more
important because climate change impacts will accelerate after midcentury,
TABLE 2.7—PREVALENCE OF HUNGER IN 2010 AND 2030 (AS A SHARE OF THE TOTAL POPULATION, PERCENTAGE)
Region 2010 2030, no CC 2030, CC 2030, COMP
World 12.2 6.4 7.2 5.0
Developing countries 14.3 7.4 8.3 5.7
Africa 20.9 13.2 15.0 10.5
Northern Africa 7.7 6.5 6.9 5.5
Africa south of the Sahara 24.3 14.8 16.9 11.7
Western Africa 9.9 5.8 6.9 4.6
Eastern Africa 34.9 23.2 26.4 19.7
Central Africa 41.3 18.2 21.6 11.5
Southern Africa 6.6 4.4 4.9 3.7
Source: Mason-D’Croz and others (2016).Note: No CC assumes no climate change (a constant 2005 climate); CC reflects a future with climate change using representative concentration pathway (RCP) 8.5 and the Hadley Centre Global Environment Model version 2—Earth System (HadGEM2-ES) general circulation model (Jones and others 2011); COMP refers to a scenario with climate change and a comprehensive investment portfolio as described above.
2016 ReSAKSS Annual Trends and Outlook Report 21
and—uniquely among world regions—population will continue to grow in
Africa south of the Sahara throughout the 21st century.
Many of the issues that African farmers will confront are regional
in nature, due to both increased integration of markets and regional
dimensions of shifts in agroecology. Thus, the scientific effort to facilitate
agriculture’s contribution to growth must be regional in design. Given
the weak foundation of agricultural science in the region at present, the
effort to rebuild will require focused and targeted training and investment.
Improvements are also needed in modeling tools to address the impacts
of increases in weather volatility and extreme events, rising sea levels, and
changes in the incidence of agricultural pests and diseases, as well as to
better account for uncertainty and the costs involved in addressing these
challenges. The foresight analysis presented above and subsequent refine-
ments of the work can serve as a platform for rigorous consideration of
investment alternatives. Foresight analysis can also provide early warning of
locally specific agricultural challenges, thereby facilitating planning to assist
affected populations, as well as highlight new opportunities.
Related Documents