Chapter 1 Section Main Menu Unit 1 Foundations of Economics Chapters 1 and 2

Welcome message from author
This document is posted to help you gain knowledge. Please leave a comment to let me know what you think about it! Share it to your friends and learn new things together.
Transcript

Chapter 1 Section Main Menu
Unit 1 Foundations of
EconomicsChapters 1 and 2

Chapter 1 Section Main Menu
Scarcity and the Factors of Production
• What is economics?
• How do economists define scarcity?
• What are the three factors of production?

Chapter 1 Section Main Menu
What Is Economics?
• Economics is the study of how people make choices to satisfy their wants
• For example:
– You must choose how to spend your time
– Businesses must choose how many people to hire
Chapter 1 Section Main Menu
Scarcity and Shortages
• Scarcity occurs when there are limited quantities of resources to meet unlimited needs or desires
• Shortages occur when producers will not or cannot offer goods or services at current prices

Chapter 1 Section Main Menu
The Factors of Production
• Land All natural resources that are used to produce goods and services.
• Labor Any effort a person devotes to a task for which that person is paid.
• Capital Any human-made resource that is used to create other goods and services.
Chapter 1 Section Main Menu
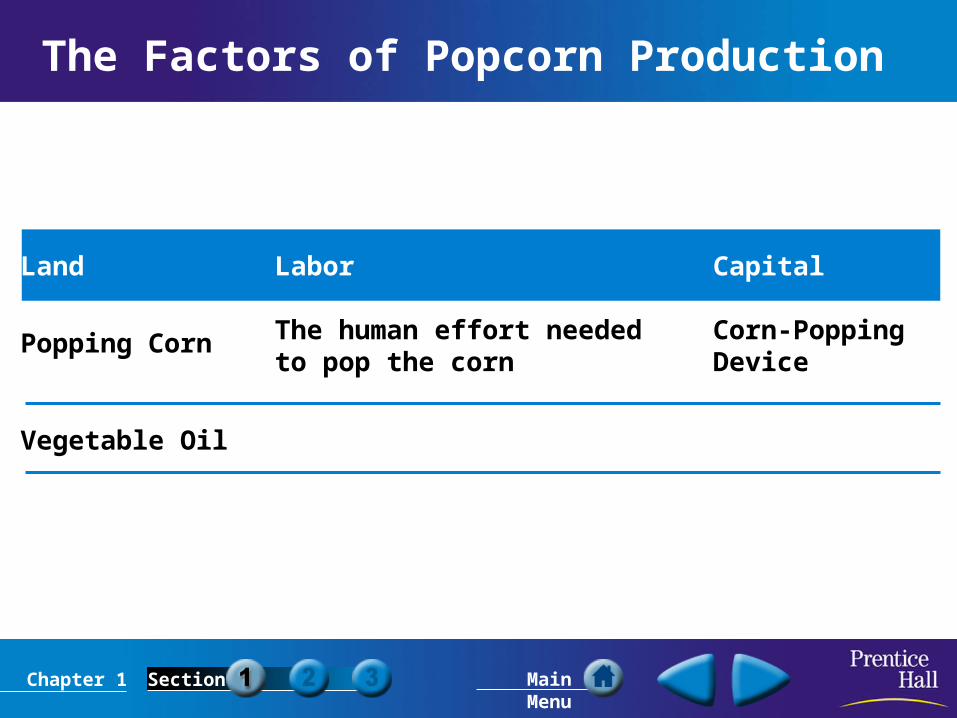
The Factors of Popcorn Production
Land
Popping Corn
Vegetable Oil
Labor
The human effort needed to pop the corn
Capital
Corn-PoppingDevice

Chapter 1 Section Main Menu
Want to connect to the PHSchool.com link for this section? Click Here!
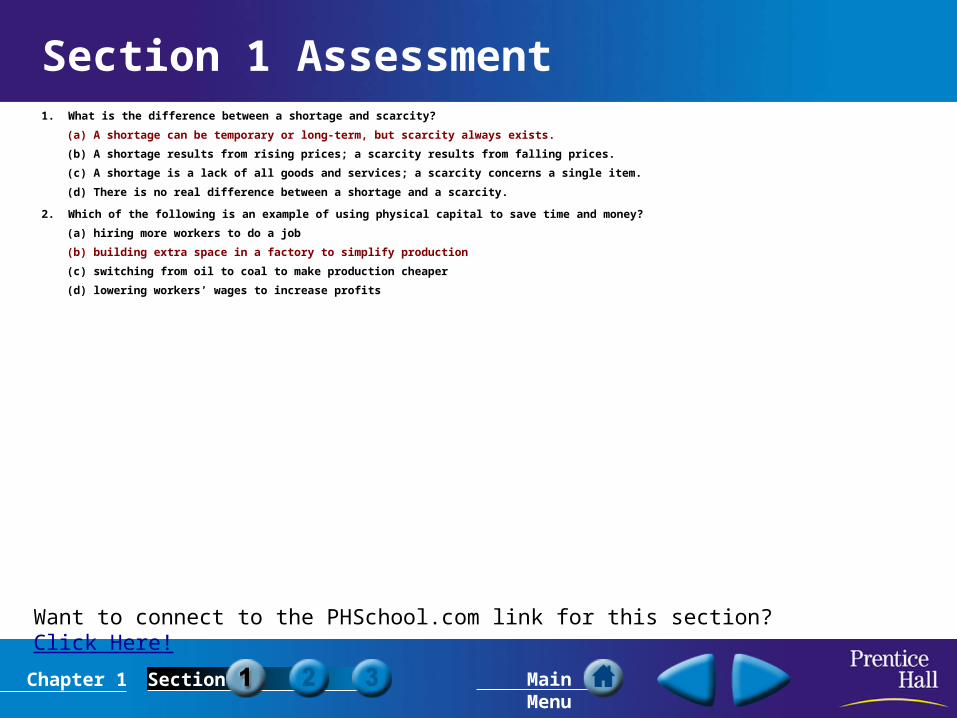
Section 1 Assessment1. What is the difference between a shortage and scarcity?
(a) A shortage can be temporary or long-term, but scarcity always exists.
(b) A shortage results from rising prices; a scarcity results from falling prices.
(c) A shortage is a lack of all goods and services; a scarcity concerns a single item.
(d) There is no real difference between a shortage and a scarcity.
2. Which of the following is an example of using physical capital to save time and money?
(a) hiring more workers to do a job
(b) building extra space in a factory to simplify production
(c) switching from oil to coal to make production cheaper
(d) lowering workers’ wages to increase profits
Chapter 1 Section Main Menu
Want to connect to the PHSchool.com link for this section? Click Here!
Section 1 Assessment1. What is the difference between a shortage and scarcity?
(a) A shortage can be temporary or long-term, but scarcity always exists.
(b) A shortage results from rising prices; a scarcity results from falling prices.
(c) A shortage is a lack of all goods and services; a scarcity concerns a single item.
(d) There is no real difference between a shortage and a scarcity.
2. Which of the following is an example of using physical capital to save time and money?
(a) hiring more workers to do a job
(b) building extra space in a factory to simplify production
(c) switching from oil to coal to make production cheaper
(d) lowering workers’ wages to increase profits
Chapter 1 Section Main Menu
Opportunity Cost
• Does every decision you make involve trade-offs?
• How can a decision-making grid help you identify the opportunity cost of a decision?
• How will thinking at the margin affect decisions you make?
Chapter 1 Section Main Menu
Trade-offs and Opportunity Cost
• Trade-offs are all the alternatives that we give up whenever we choose one course of action over others.
• The most desirable alternative given up as a result of a decision is known as opportunity cost.
All individuals and groups of people make decisions that involve trade-offs.
Chapter 1 Section Main Menu
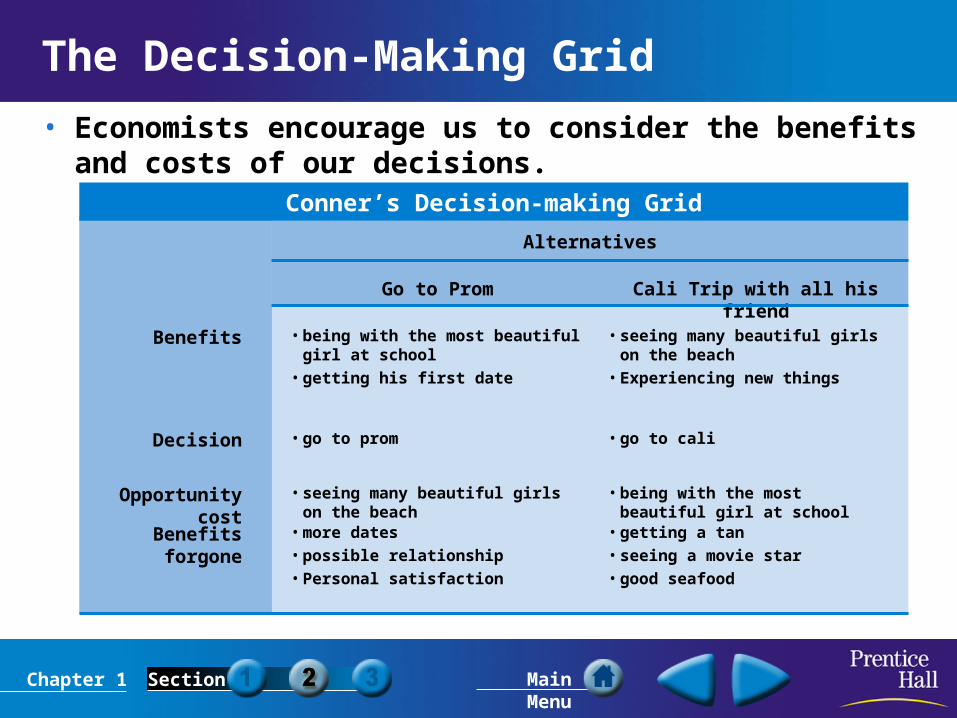
The Decision-Making Grid
• Economists encourage us to consider the benefits and costs of our decisions.
Benefits • being with the most beautiful girl at school
• getting his first date
• seeing many beautiful girls on the beach
• Experiencing new things
Decision • go to prom • go to cali
Opportunity cost • seeing many beautiful girls on the beach
• being with the most beautiful girl at school
Benefits forgone • more dates
• possible relationship
• Personal satisfaction
• getting a tan
• seeing a movie star
• good seafood
Go to Prom Cali Trip with all his friend
Alternatives
Conner’s Decision-making Grid
Chapter 1 Section Main Menu
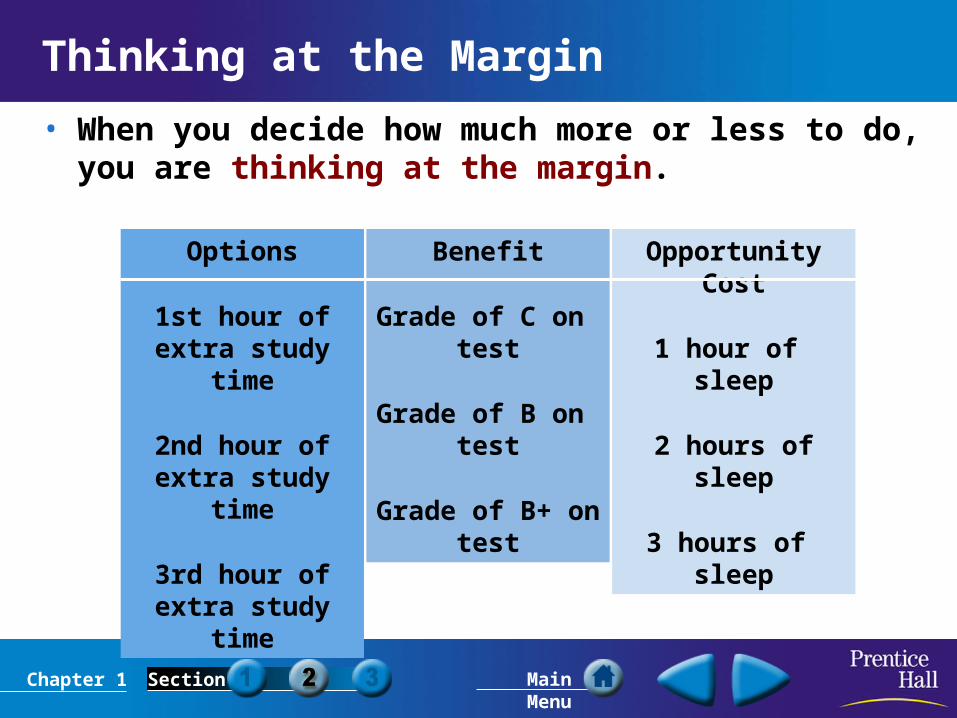
Thinking at the Margin
• When you decide how much more or less to do, you are thinking at the margin.
Options
1st hour of extra study time
2nd hour of extra study time
3rd hour of extra study time
Benefit
Grade of C on test
Grade of B on test
Grade of B+ on test
Opportunity Cost
1 hour of sleep
2 hours ofsleep
3 hours of sleep
Chapter 1 Section Main Menu
Want to connect to the PHSchool.com link for this section? Click Here!
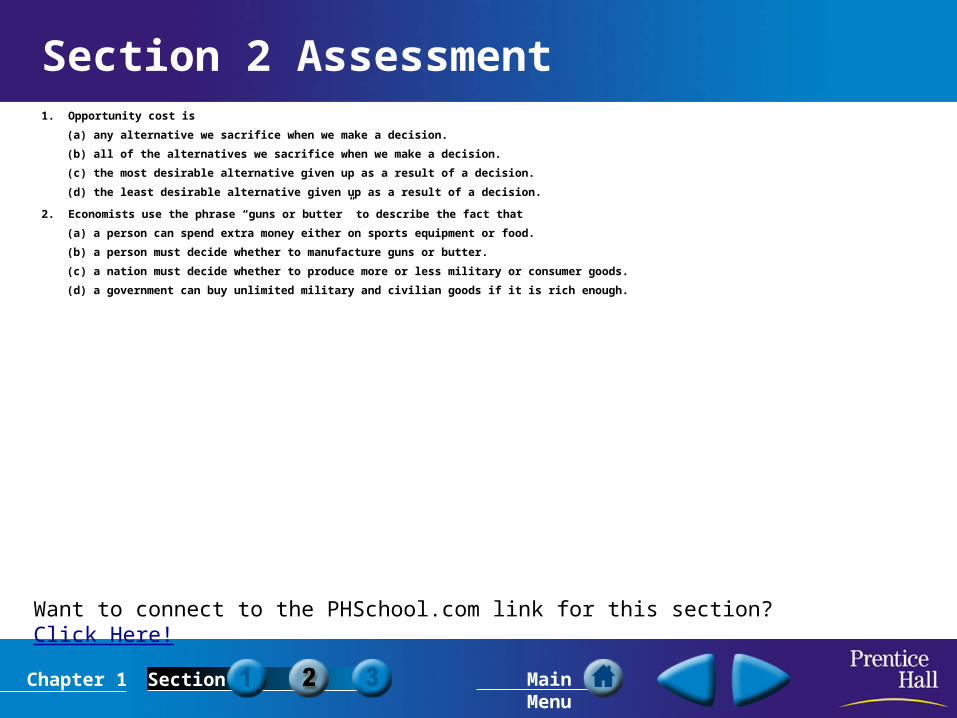
Section 2 Assessment1. Opportunity cost is
(a) any alternative we sacrifice when we make a decision.
(b) all of the alternatives we sacrifice when we make a decision.
(c) the most desirable alternative given up as a result of a decision.
(d) the least desirable alternative given up as a result of a decision.
2. Economists use the phrase “guns or butter” to describe the fact that
(a) a person can spend extra money either on sports equipment or food.
(b) a person must decide whether to manufacture guns or butter.
(c) a nation must decide whether to produce more or less military or consumer goods.
(d) a government can buy unlimited military and civilian goods if it is rich enough.

Chapter 1 Section Main Menu
Want to connect to the PHSchool.com link for this section? Click Here!
Section 2 Assessment1. Opportunity cost is
(a) any alternative we sacrifice when we make a decision.
(b) all of the alternatives we sacrifice when we make a decision.
(c) the most desirable alternative given up as a result of a decision.
(d) the least desirable alternative given up as a result of a decision.
2. Economists use the phrase “guns or butter” to describe the fact that
(a) a person can spend extra money either on sports equipment or food.
(b) a person must decide whether to manufacture guns or butter.
(c) a nation must decide whether to produce more or less military or consumer goods.
(d) a government can buy unlimited military and civilian goods if it is rich enough.
Chapter 1 Section Main Menu
Production Possibilities Graphs
• What is a production possibilities graph?
• How do production possibilities graphs show efficiency, growth, and cost?
• Why are production possibilities frontiers curved lines?

Chapter 1 Section Main Menu
Watermelons (millions of tons)
Shoes(millions of pairs)
Sh
oe
s (
mil
lio
ns
of
pa
irs
)
25
20
15
10
5
0 252015105
Production Possibilities Graph
Watermelons (millions of tons)
0
a (0,15)
15
8 14b (8,14)
14
18
20
21
12
9
5
0
A productionpossibilities frontier
c (14,12)
d (18,9)
e (20,5)
f (21,0)
Production Possibilities
• A production possibilities graph shows alternative ways that an economy can use its resources.
• The production possibilities frontier is the line that shows the maximum possible output for that economy.
Chapter 1 Section Main Menu
Sh
oe
s (
mil
lio
ns
of
pa
irs
)
25
20
15
10
5
0 252015105
Watermelons (millions of tons)
Production Possibilities Graph
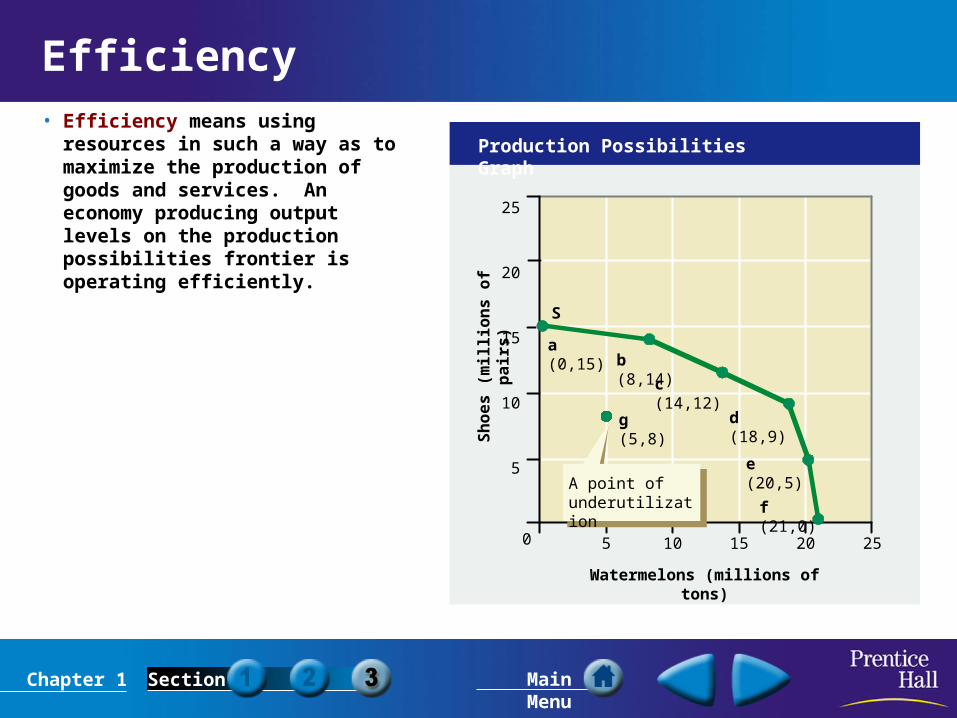
g (5,8)
A point of underutilization
c (14,12)
d (18,9)
e (20,5)
f (21,0)
a (0,15)b (8,14)
S
Efficiency• Efficiency means using
resources in such a way as to maximize the production of goods and services. An economy producing output levels on the production possibilities frontier is operating efficiently.
Chapter 1 Section Main Menu
Sh
oe
s (
mil
lio
ns
of
pa
irs
)
25
20
15
10
5
0 252015105
Watermelons (millions of tons)
Production Possibilities Graph
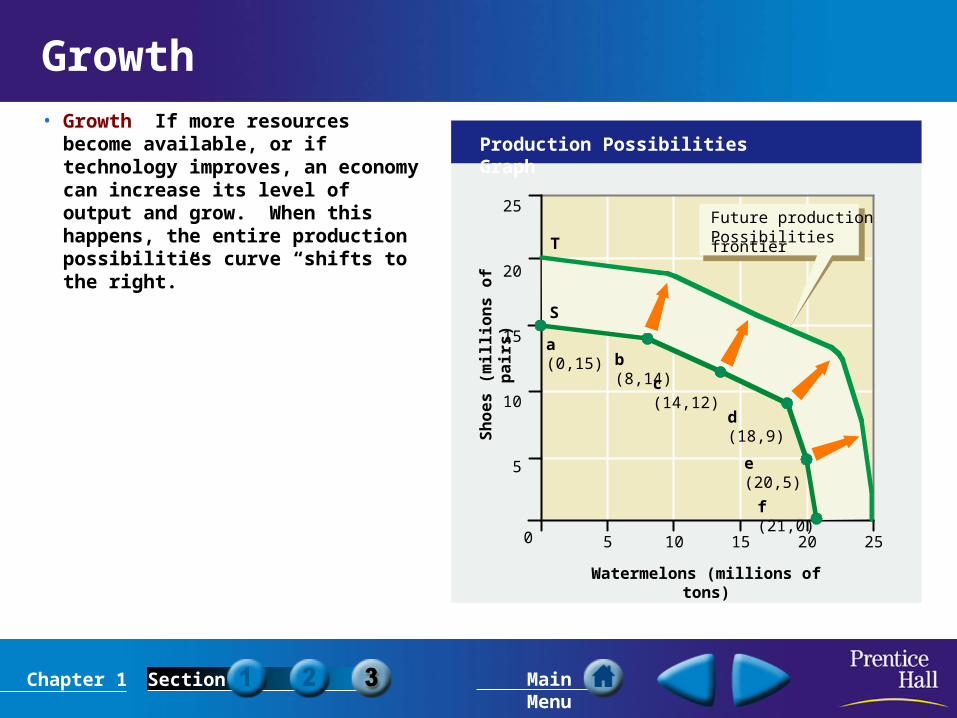
T
Future productionPossibilities frontier
c (14,12)
d (18,9)
e (20,5)
f (21,0)
a (0,15)b (8,14)
S
Growth• Growth If more resources
become available, or if technology improves, an economy can increase its level of output and grow. When this happens, the entire production possibilities curve “shifts to the right.”

Chapter 1 Section Main Menu
Watermelons (millions of tons)
Shoes(millions of pairs)
Sh
oe
s (
mil
lio
ns
of
pa
irs
)
25
20
15
10
5
0 252015105
Production Possibilities Graph
Watermelons (millions of tons)
14
18
20
21
12
9
5
0
0 15
8 14
c (14,12)
d (18,9)
Cost
• Cost A production possibilities graph shows the cost of producing more of one item. To move from point c to point d on this graph has a cost of 3 million pairs of shoes.

Chapter 1 Section Main Menu
1. A production possibilities frontier shows
(a) farm goods and factory goods produced by an economy.
(b) the maximum possible output of an economy.
(c) the minimum possible output of an economy.
(d) underutilization of resources.
2. An economy that is using its resources to produce the maximum number of goods and services is described as
(a) efficient.
(b) underutilized.
(c) growing.
(d) trading off.
Want to connect to the PHSchool.com link for this section? Click Here!
Section 3 Assessment

Chapter 1 Section Main Menu
Answering the Three Economic Questions
• What key economic questions must every society answer?
• What basic economic goals do societies have?
• What types of economic systems exist today?
Chapter 1 Section Main Menu
The Three Economic Questions
• Every society must answer three questions:
– What goods and services should be produced?
– How should these goods and services be produced?
– Who consumes these goods and services?

Chapter 1 Section Main Menu
Economic Goals
Making the most of resourcesEconomic efficiency
Freedom from government intervention in the production and distribution of goods and services
Economic freedom
Assurance that goods and services will be available, payments will be made on time, and a safety net will protect individuals in times of economic disaster
Economic security and predictability
Fair distribution of wealthEconomic equity
Innovation leads to economic growth, and economic growth leads to a higher standard of living.
Economic growth and innovation
Societies pursue additional goals, such as environmental protection.
Other goals
Economic Goals
• Societies answer the three economic questions based on their values.
Chapter 1 Section Main Menu
monetary flow
physical flow
monetary flow
physical flow
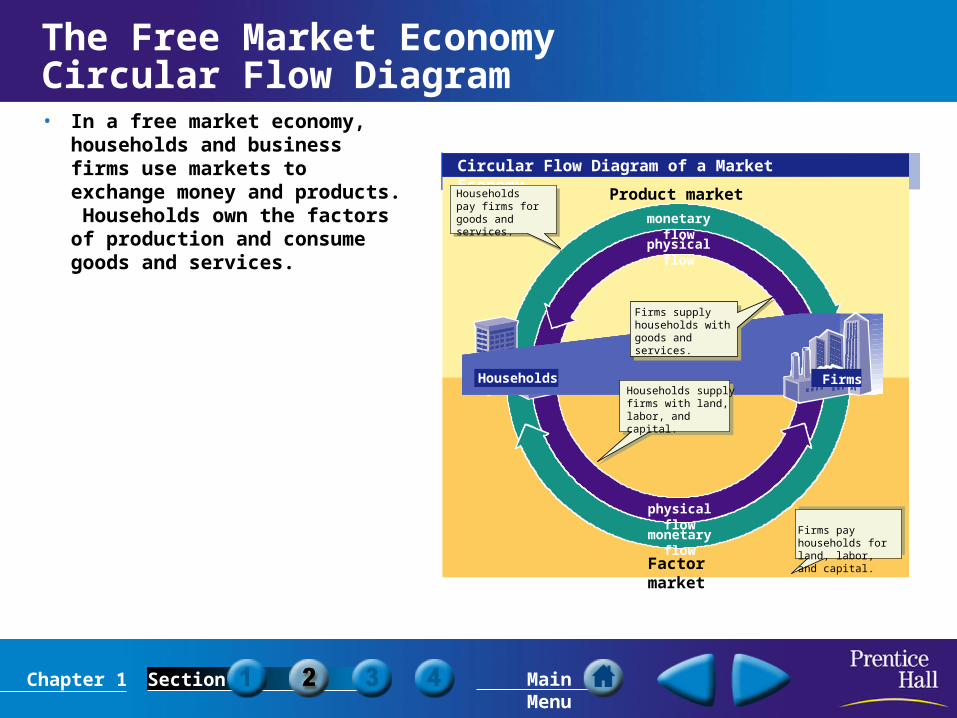
Circular Flow Diagram of a Market Economy
Households Firms
Product market
Factor market
Households pay firms for goods and services.
Firms supply households with goods and services.
Households supply firms with land, labor, and capital.
Firms pay households for land, labor, and capital.
The Free Market Economy Circular Flow Diagram• In a free market economy,
households and business firms use markets to exchange money and products. Households own the factors of production and consume goods and services.
Related Documents


