McGraw-Hill/Irwin McGraw-Hill/Irwin Copyright © 2008 by The McGraw-Hill Companies, Inc. All rights reserved. Copyright © 2008 by The McGraw-Hill Companies, Inc. All rights reserved. 17 17 Financial Leverage and Capital Structure Policy

Chapter 17; financial leverage and capital structure policy
Nov 18, 2014
Welcome message from author
This document is posted to help you gain knowledge. Please leave a comment to let me know what you think about it! Share it to your friends and learn new things together.
Transcript
McGraw-Hill/IrwinMcGraw-Hill/Irwin Copyright © 2008 by The McGraw-Hill Companies, Inc. All rights reserved.Copyright © 2008 by The McGraw-Hill Companies, Inc. All rights reserved.
1717Financial Leverage
and Capital Structure Policy
17-2
Key Concepts and SkillsKey Concepts and Skills
Understand the effect of financial leverage on cash flows and the cost of equity
Understand the impact of taxes and bankruptcy on capital structure choice
Understand the basic components of the bankruptcy process
17-3
Capital RestructuringCapital Restructuring
We are going to look at how changes in capital structure affect the value of the firm, all else equal
Capital restructuring involves changing the amount of leverage a firm has without changing the firm’s assets
The firm can increase leverage by issuing debt and repurchasing outstanding shares
The firm can decrease leverage by issuing new shares and retiring outstanding debt
17-4
Choosing a Capital StructureChoosing a Capital Structure
What is the primary goal of financial managers? Maximize stockholder wealth
We want to choose the capital structure that will maximize stockholder wealth
We can maximize stockholder wealth by maximizing the value of the firm or minimizing the WACC
17-5
The Effect of LeverageThe Effect of Leverage How does leverage affect the EPS and ROE of a
firm? When we increase the amount of debt financing, we
increase the fixed interest expense If we have a really good year, then we pay our fixed
cost and we have more left over for our stockholders
If we have a really bad year, we still have to pay our fixed costs and we have less left over for our stockholders
Leverage amplifies the variation in both EPS and ROE
17-6
Example: Financial Leverage, EPS Example: Financial Leverage, EPS and ROE – Part Iand ROE – Part I
We will ignore the effect of taxes at this stage
What happens to EPS and ROE when we issue debt and buy back shares of stock?
Financial Leverage Example
17-7
Example: Financial Leverage, EPS Example: Financial Leverage, EPS and ROE – Part IIand ROE – Part II
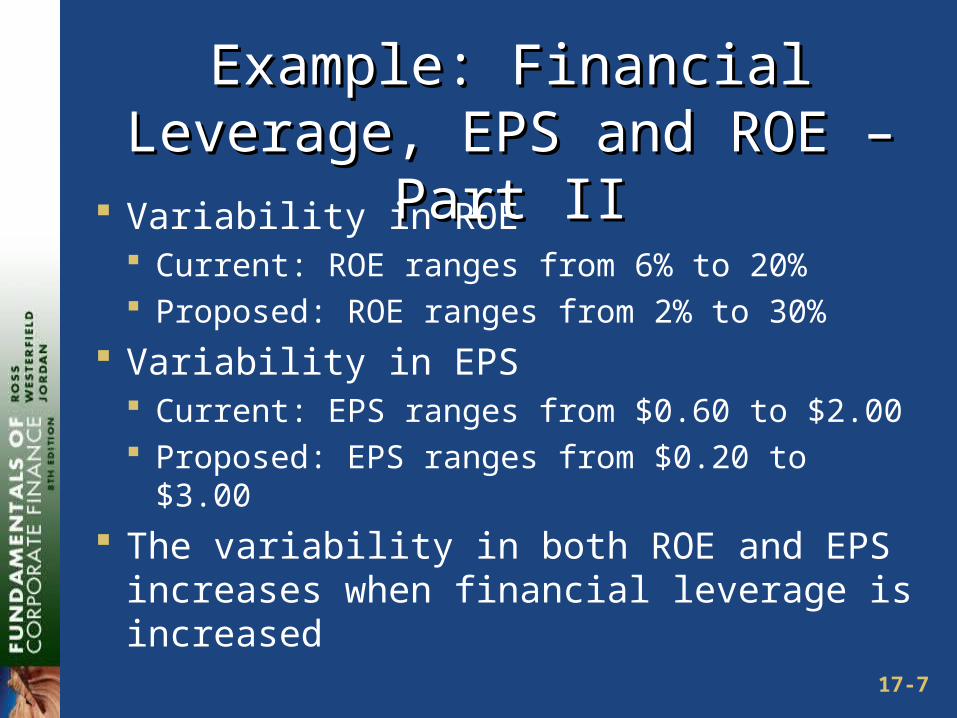
Variability in ROE Current: ROE ranges from 6% to 20% Proposed: ROE ranges from 2% to 30%
Variability in EPS Current: EPS ranges from $0.60 to $2.00 Proposed: EPS ranges from $0.20 to $3.00
The variability in both ROE and EPS increases when financial leverage is increased
17-8
Break-Even EBITBreak-Even EBIT
Find EBIT where EPS is the same under both the current and proposed capital structures
If we expect EBIT to be greater than the break-even point, then leverage is beneficial to our stockholders
If we expect EBIT to be less than the break-even point, then leverage is detrimental to our stockholders
17-9
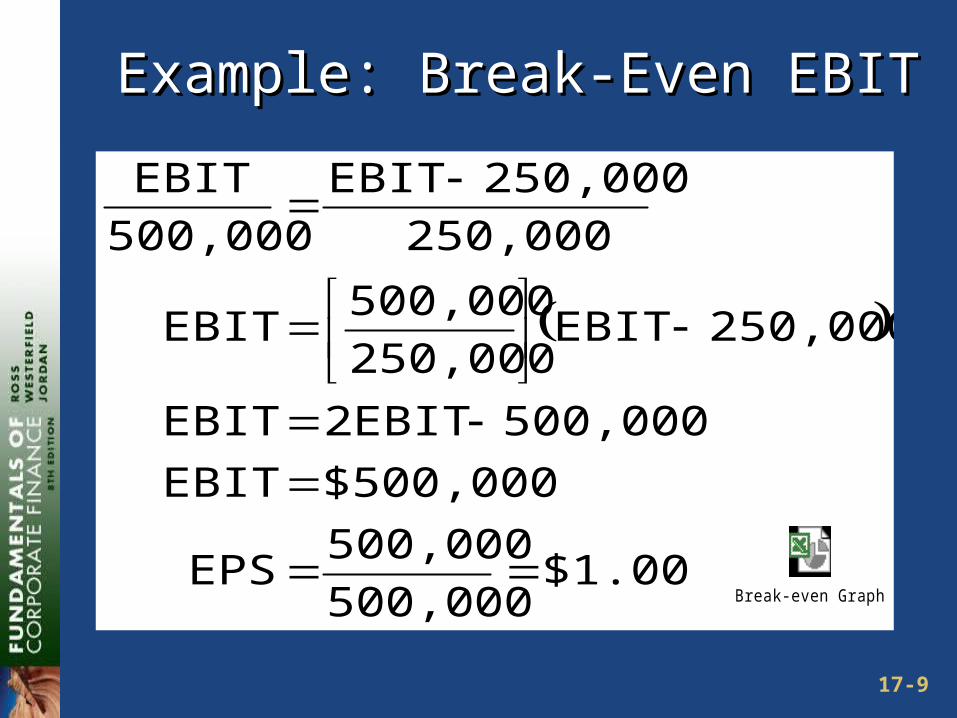
Example: Break-Even EBITExample: Break-Even EBIT
$1.00500,000
500,000EPS
$500,000EBIT
500,0002EBITEBIT
250,000EBIT250,000
500,000EBIT
250,000
250,000EBIT
500,000
EBIT
Break-even Graph
17-10
Example: Homemade Leverage and Example: Homemade Leverage and ROEROE
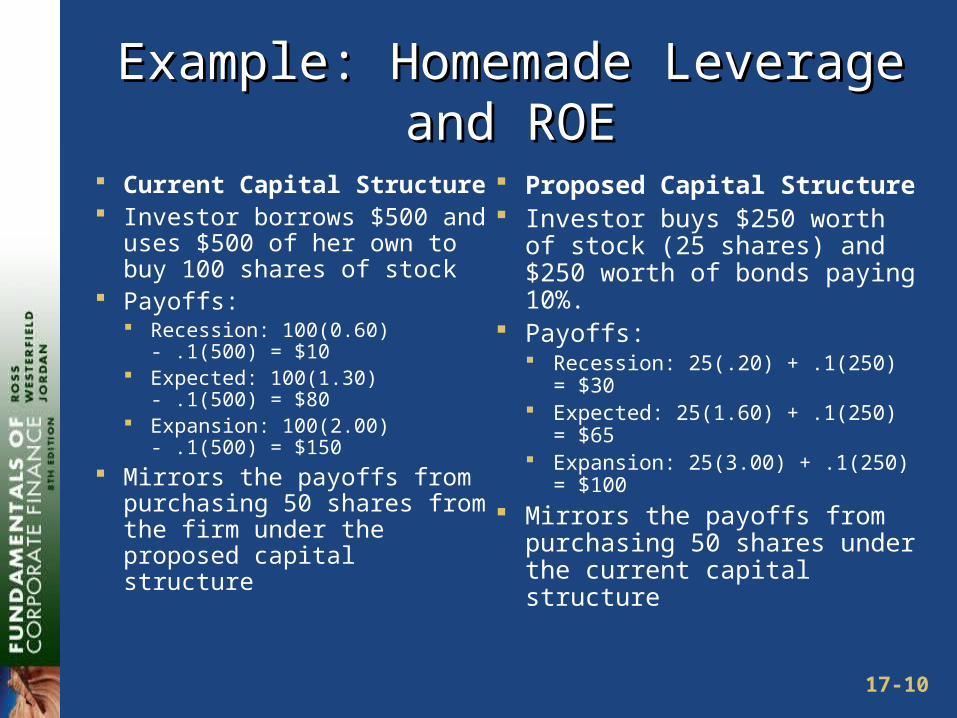
Current Capital Structure Investor borrows $500 and
uses $500 of her own to buy 100 shares of stock
Payoffs: Recession: 100(0.60) - .1(500)
= $10 Expected: 100(1.30) - .1(500) =
$80 Expansion: 100(2.00) - .1(500)
= $150 Mirrors the payoffs from
purchasing 50 shares from the firm under the proposed capital structure
Proposed Capital Structure Investor buys $250 worth of
stock (25 shares) and $250 worth of bonds paying 10%.
Payoffs: Recession: 25(.20) + .1(250) =
$30 Expected: 25(1.60) + .1(250) =
$65 Expansion: 25(3.00) + .1(250) =
$100 Mirrors the payoffs from
purchasing 50 shares under the current capital structure
17-11
Capital Structure TheoryCapital Structure Theory
Modigliani and Miller Theory of Capital Structure Proposition I – firm value Proposition II – WACC
The value of the firm is determined by the cash flows to the firm and the risk of the assets
Changing firm value Change the risk of the cash flows Change the cash flows
17-12
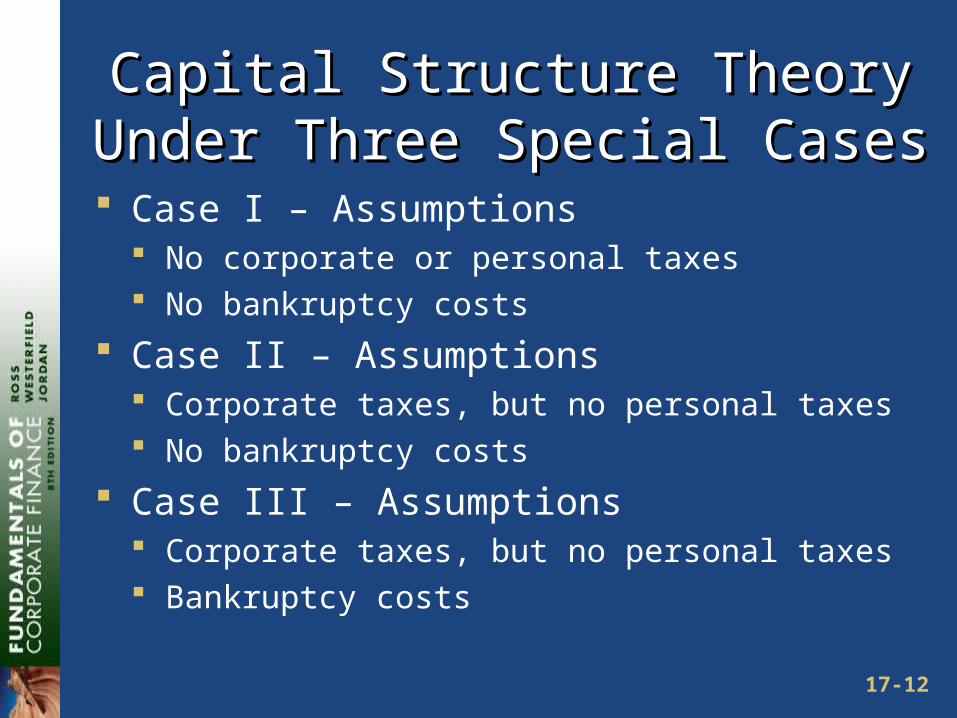
Capital Structure Theory Under Capital Structure Theory Under Three Special CasesThree Special Cases
Case I – Assumptions No corporate or personal taxes No bankruptcy costs
Case II – Assumptions Corporate taxes, but no personal taxes No bankruptcy costs
Case III – Assumptions Corporate taxes, but no personal taxes Bankruptcy costs
17-13
Case I – Propositions I and IICase I – Propositions I and II
Proposition I The value of the firm is NOT affected by
changes in the capital structure The cash flows of the firm do not
change; therefore, value doesn’t change
Proposition II The WACC of the firm is NOT affected
by capital structure

17-14
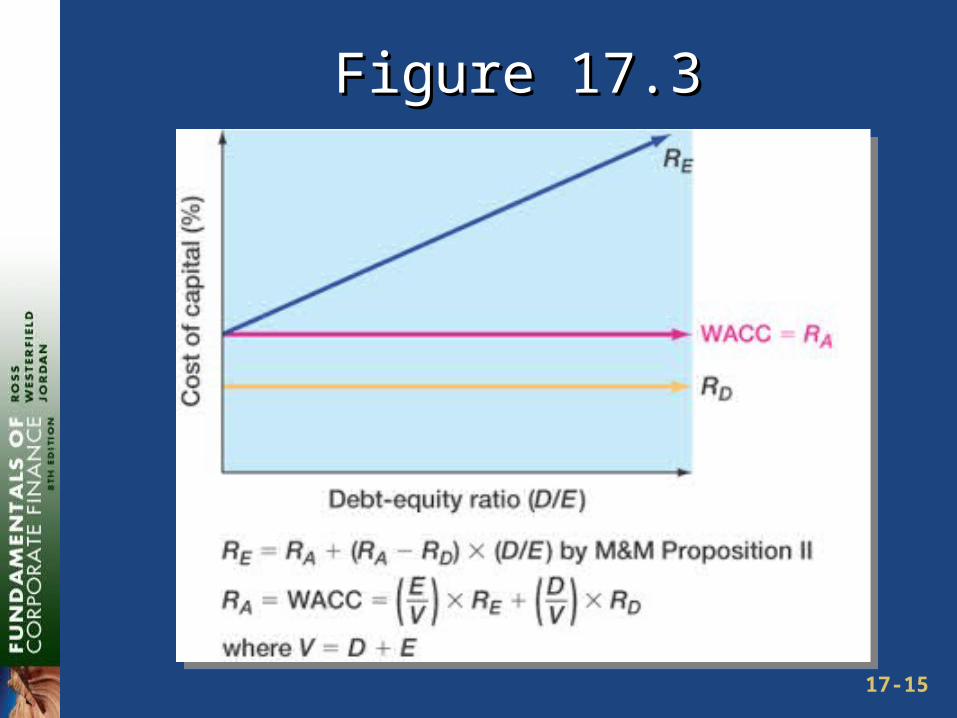
Case I - EquationsCase I - Equations
WACC = RA = (E/V)RE + (D/V)RD
RE = RA + (RA – RD)(D/E)
RA is the “cost” of the firm’s business risk, i.e., the risk of the firm’s assets
(RA – RD)(D/E) is the “cost” of the firm’s financial risk, i.e., the additional return required by stockholders to compensate for the risk of leverage
17-15
Figure 17.3Figure 17.3
17-16
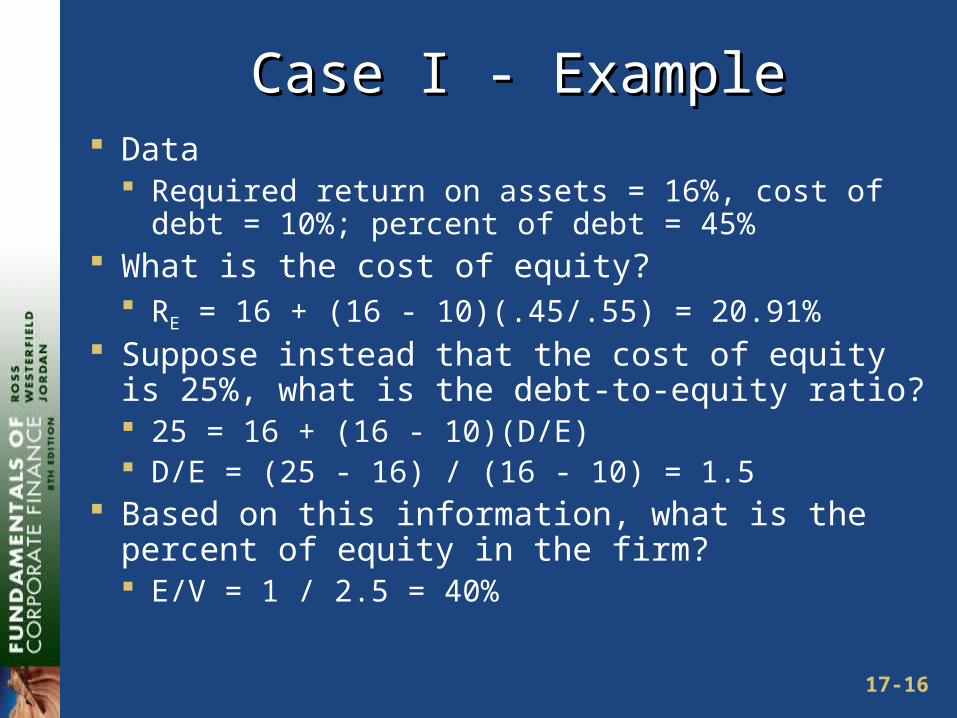
Case I - ExampleCase I - Example Data
Required return on assets = 16%, cost of debt = 10%; percent of debt = 45%
What is the cost of equity? RE = 16 + (16 - 10)(.45/.55) = 20.91%
Suppose instead that the cost of equity is 25%, what is the debt-to-equity ratio? 25 = 16 + (16 - 10)(D/E) D/E = (25 - 16) / (16 - 10) = 1.5
Based on this information, what is the percent of equity in the firm? E/V = 1 / 2.5 = 40%
17-17
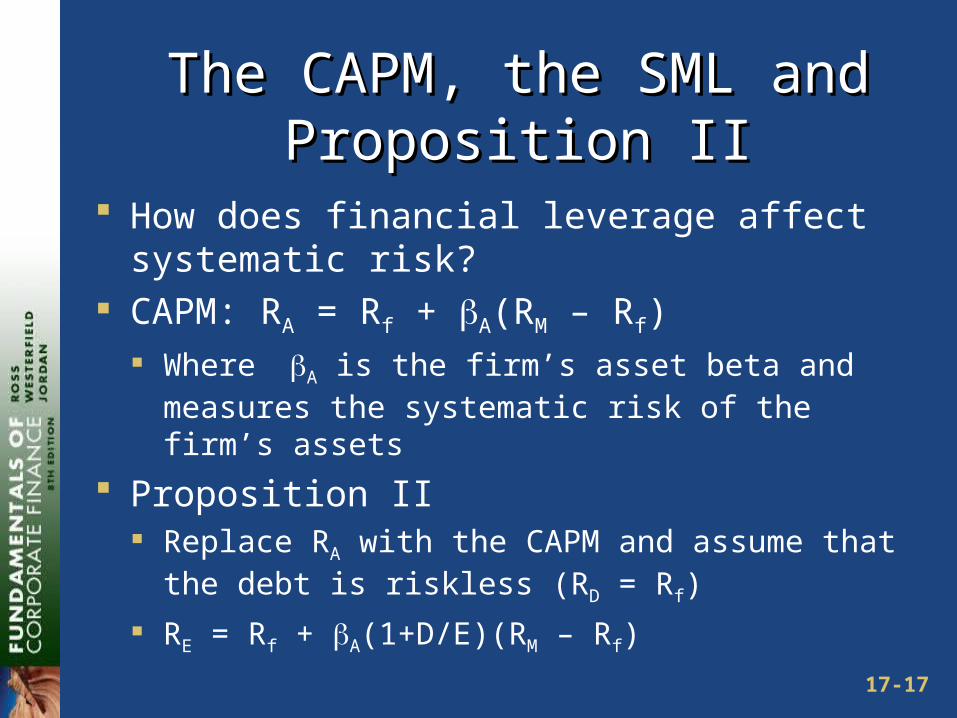
The CAPM, the SML and The CAPM, the SML and Proposition IIProposition II
How does financial leverage affect systematic risk?
CAPM: RA = Rf + A(RM – Rf) Where A is the firm’s asset beta and measures the
systematic risk of the firm’s assets
Proposition II Replace RA with the CAPM and assume that the debt
is riskless (RD = Rf)
RE = Rf + A(1+D/E)(RM – Rf)
17-18
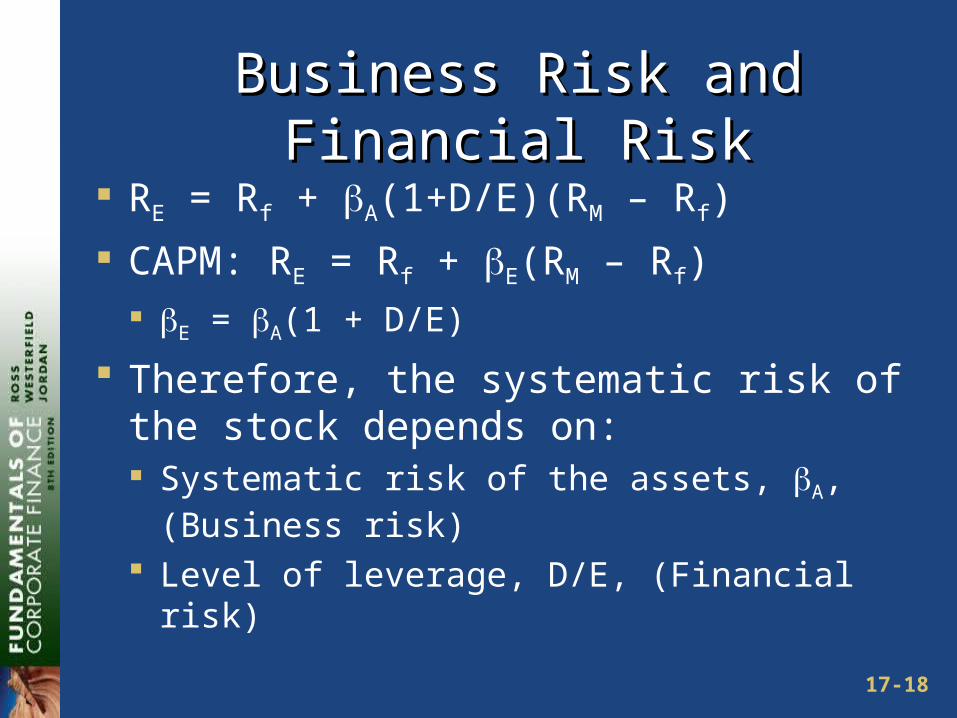
Business Risk and Financial RiskBusiness Risk and Financial Risk
RE = Rf + A(1+D/E)(RM – Rf)
CAPM: RE = Rf + E(RM – Rf) E = A(1 + D/E)
Therefore, the systematic risk of the stock depends on: Systematic risk of the assets, A, (Business
risk) Level of leverage, D/E, (Financial risk)
17-19
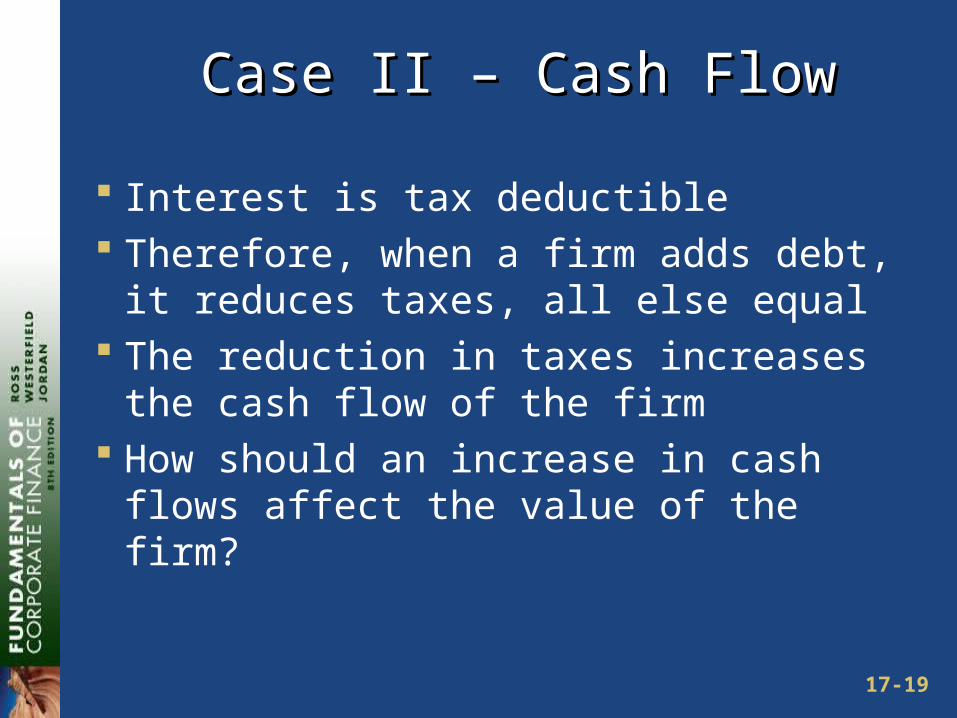
Case II – Cash FlowCase II – Cash Flow
Interest is tax deductible Therefore, when a firm adds debt, it
reduces taxes, all else equal The reduction in taxes increases the
cash flow of the firm How should an increase in cash
flows affect the value of the firm?
17-20
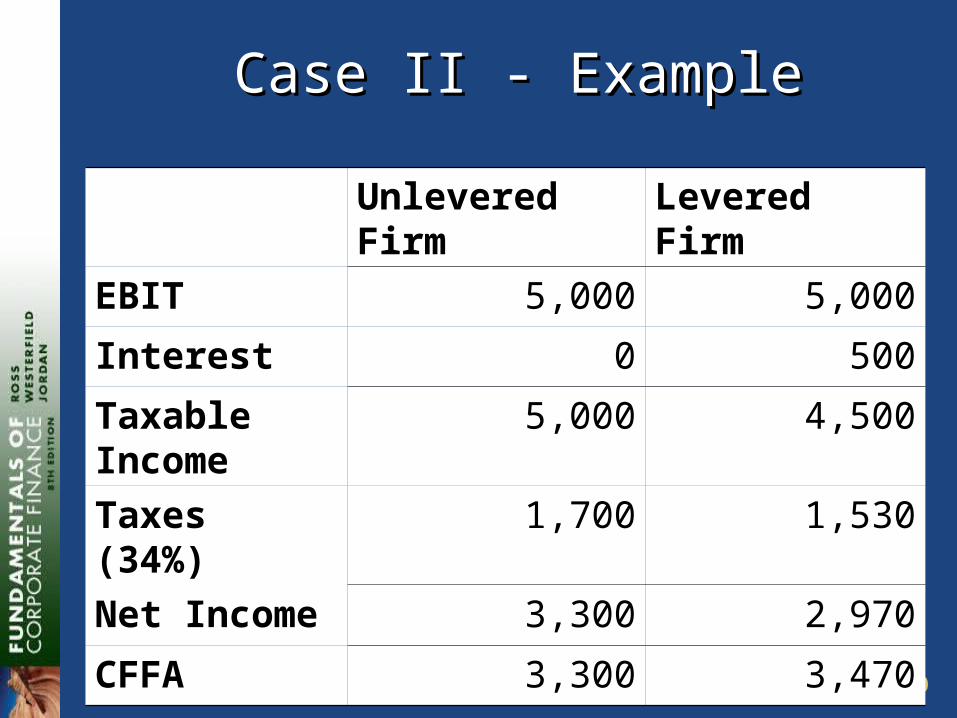
Case II - ExampleCase II - Example
Unlevered Firm Levered Firm
EBIT 5,000 5,000
Interest 0 500
Taxable Income
5,000 4,500
Taxes (34%) 1,700 1,530
Net Income 3,300 2,970
CFFA 3,300 3,470
17-21
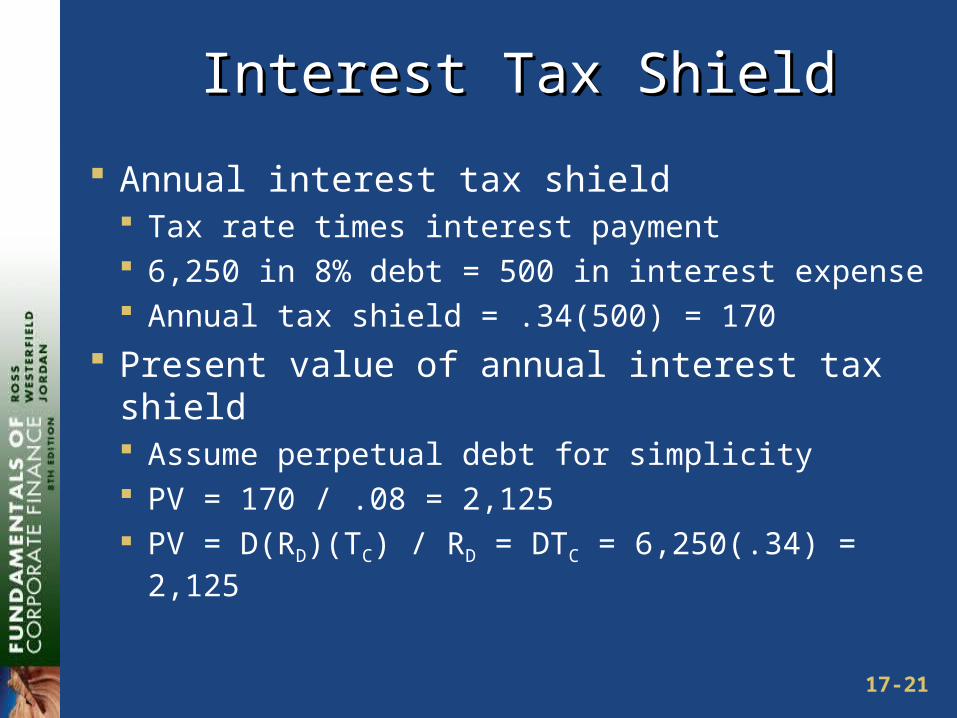
Interest Tax ShieldInterest Tax Shield
Annual interest tax shield Tax rate times interest payment 6,250 in 8% debt = 500 in interest expense Annual tax shield = .34(500) = 170
Present value of annual interest tax shield Assume perpetual debt for simplicity PV = 170 / .08 = 2,125 PV = D(RD)(TC) / RD = DTC = 6,250(.34) =
2,125
17-22
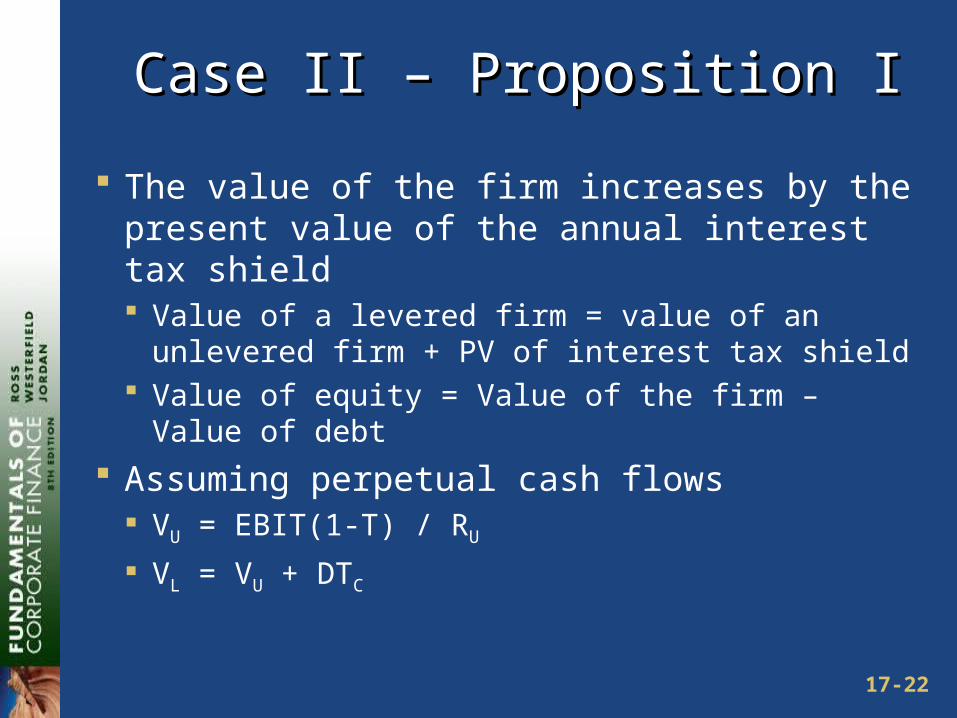
Case II – Proposition ICase II – Proposition I
The value of the firm increases by the present value of the annual interest tax shield Value of a levered firm = value of an unlevered
firm + PV of interest tax shield Value of equity = Value of the firm – Value of debt
Assuming perpetual cash flows VU = EBIT(1-T) / RU
VL = VU + DTC
17-23
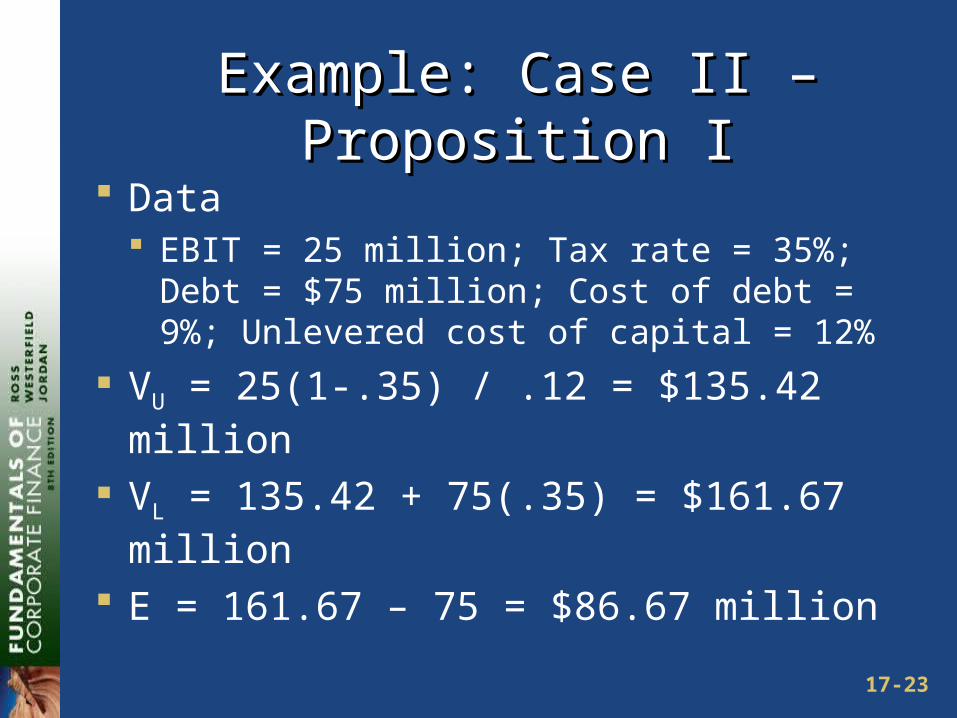
Example: Case II – Proposition IExample: Case II – Proposition I
Data EBIT = 25 million; Tax rate = 35%; Debt =
$75 million; Cost of debt = 9%; Unlevered cost of capital = 12%
VU = 25(1-.35) / .12 = $135.42 million
VL = 135.42 + 75(.35) = $161.67 million
E = 161.67 – 75 = $86.67 million
17-24
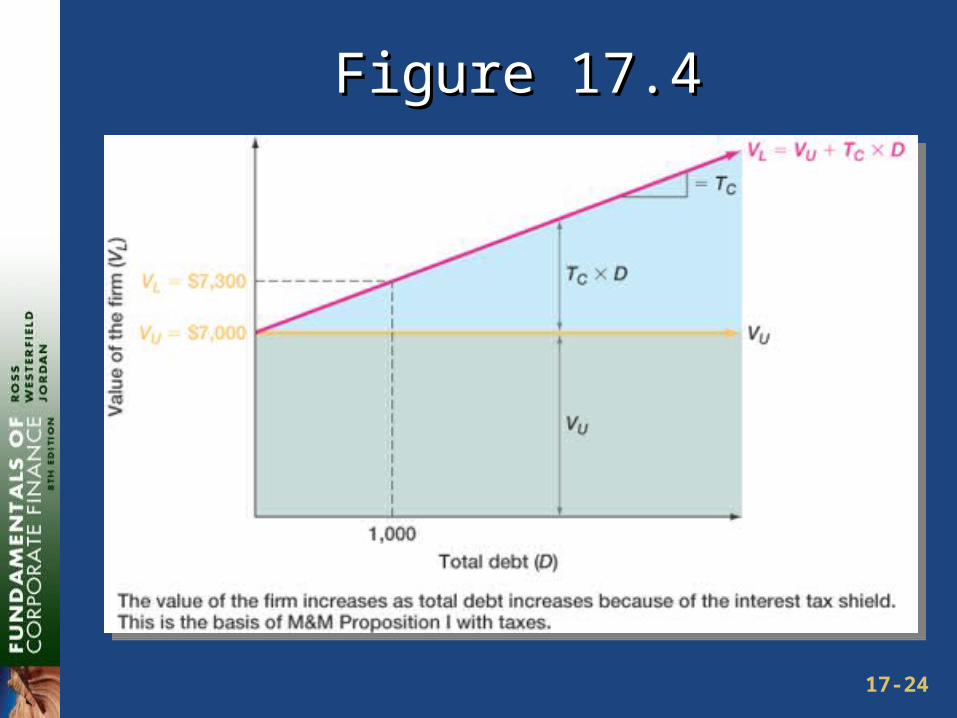
Figure 17.4Figure 17.4
17-25
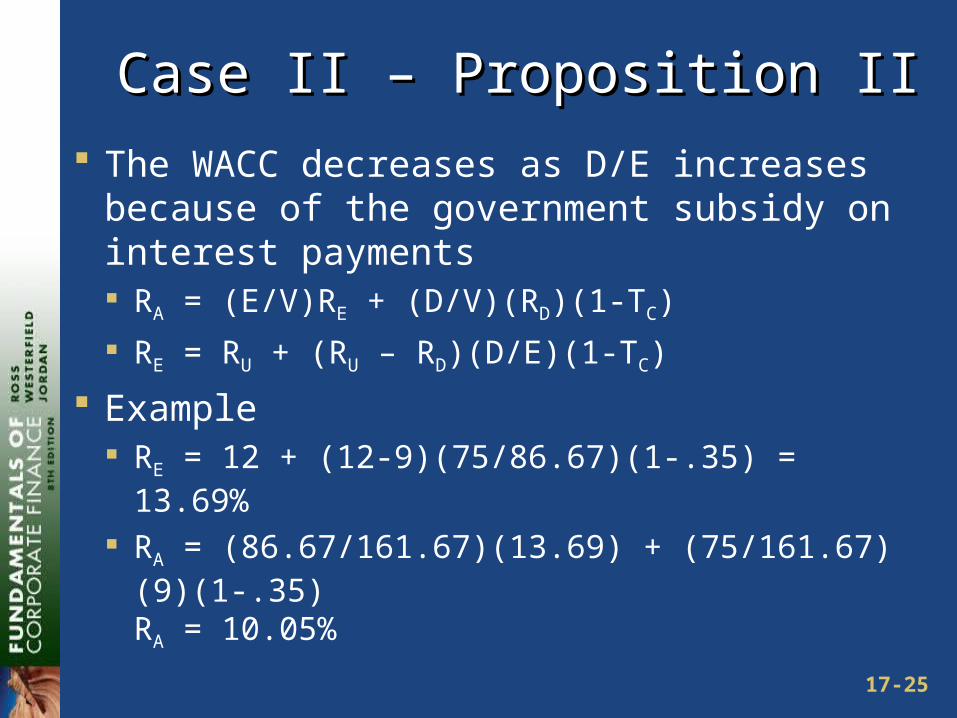
Case II – Proposition IICase II – Proposition II
The WACC decreases as D/E increases because of the government subsidy on interest payments RA = (E/V)RE + (D/V)(RD)(1-TC)
RE = RU + (RU – RD)(D/E)(1-TC)
Example RE = 12 + (12-9)(75/86.67)(1-.35) = 13.69%
RA = (86.67/161.67)(13.69) + (75/161.67)(9)(1-.35)RA = 10.05%
17-26
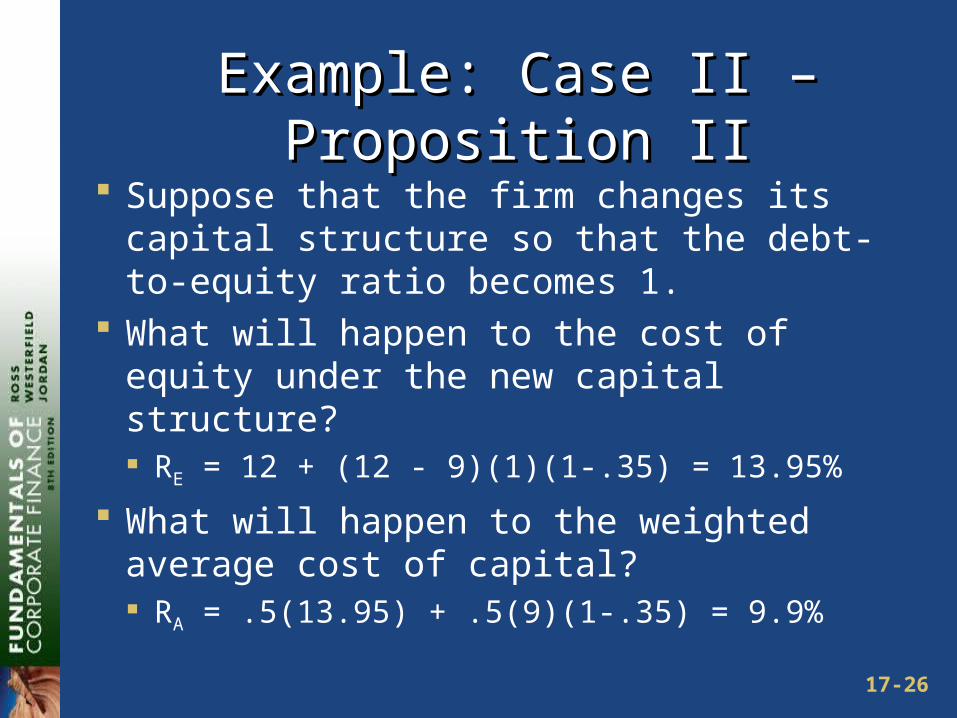
Example: Case II – Proposition IIExample: Case II – Proposition II
Suppose that the firm changes its capital structure so that the debt-to-equity ratio becomes 1.
What will happen to the cost of equity under the new capital structure? RE = 12 + (12 - 9)(1)(1-.35) = 13.95%
What will happen to the weighted average cost of capital? RA = .5(13.95) + .5(9)(1-.35) = 9.9%
17-27
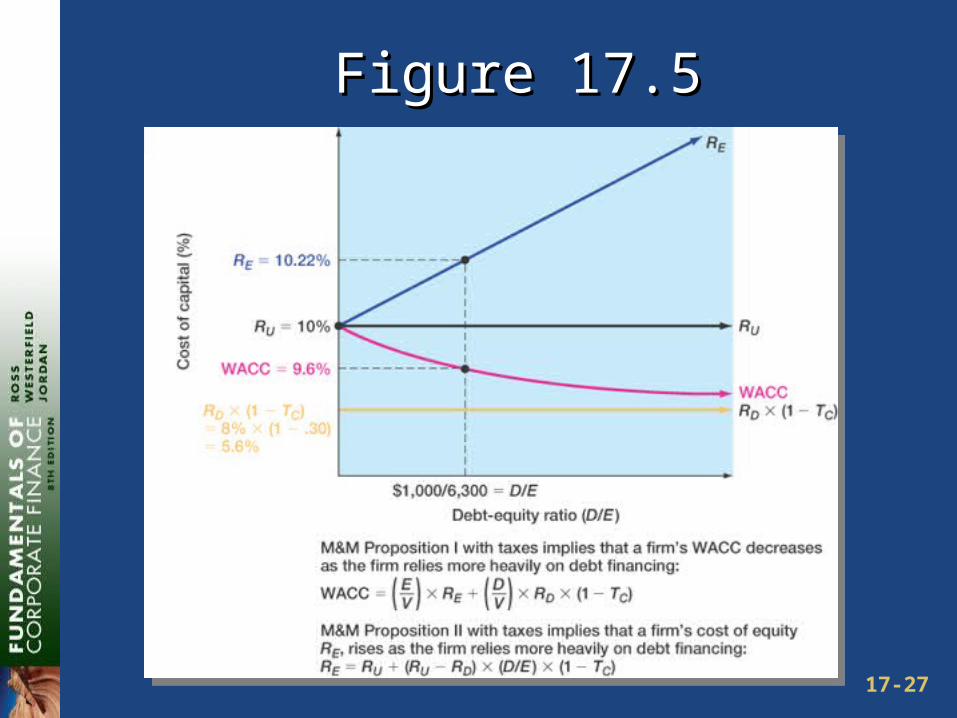
Figure 17.5Figure 17.5
17-28
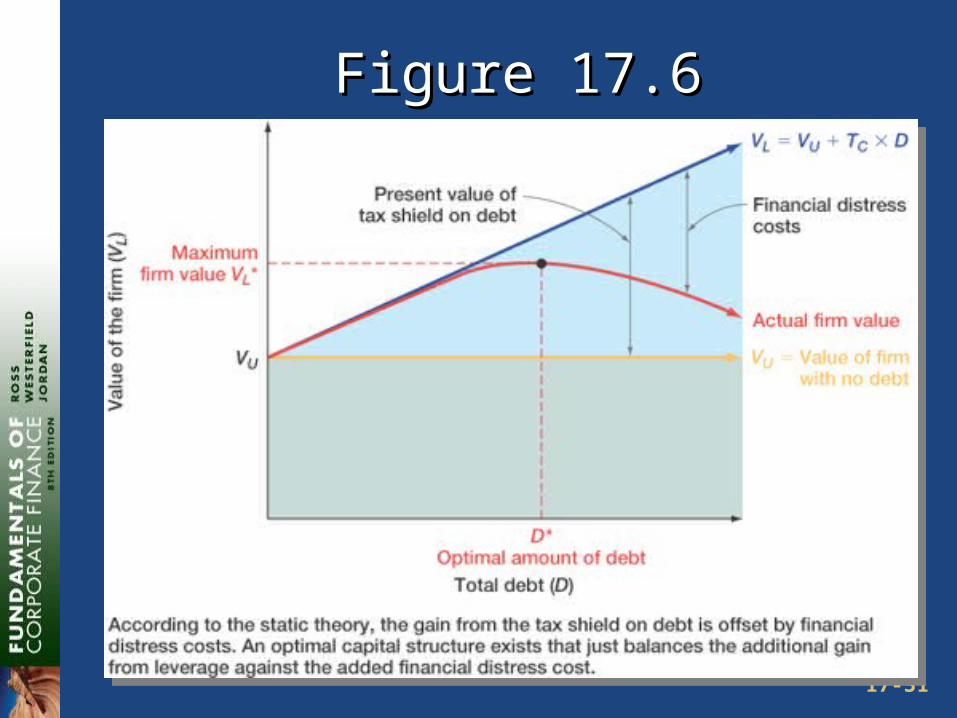
Case IIICase III
Now we add bankruptcy costs As the D/E ratio increases, the probability of
bankruptcy increases This increased probability will increase the
expected bankruptcy costs At some point, the additional value of the
interest tax shield will be offset by the increase in expected bankruptcy cost
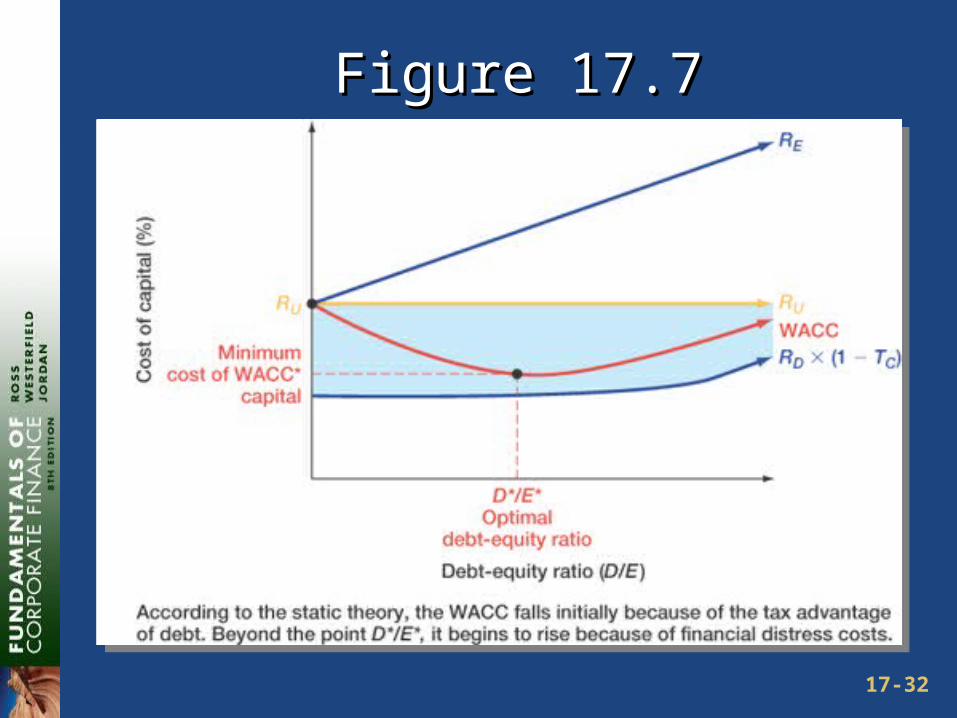
At this point, the value of the firm will start to decrease and the WACC will start to increase as more debt is added
17-29
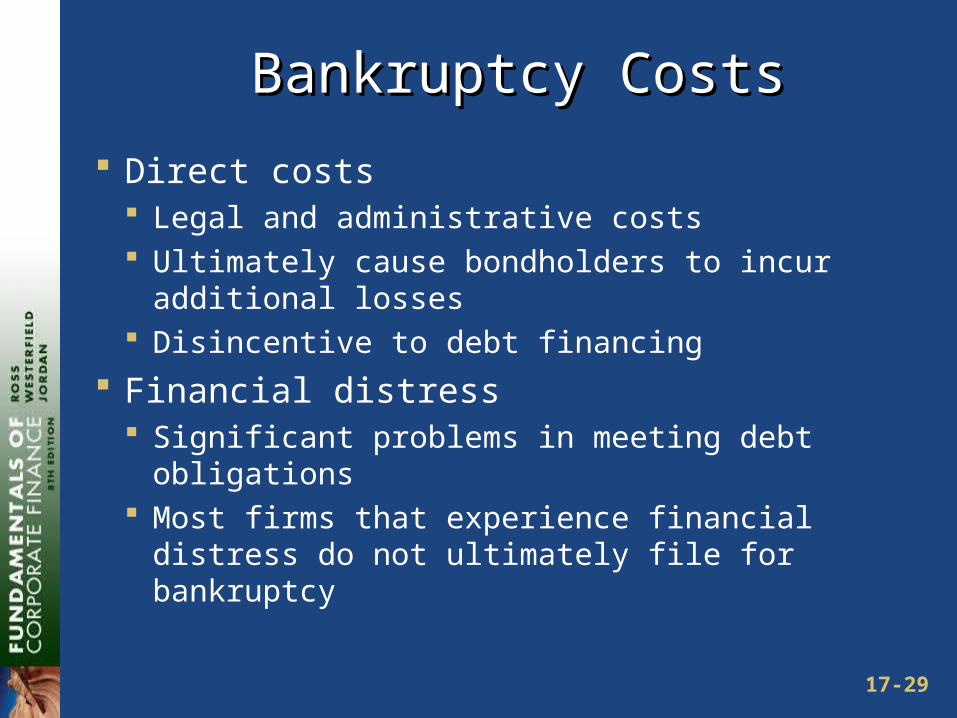
Bankruptcy CostsBankruptcy Costs
Direct costs Legal and administrative costs Ultimately cause bondholders to incur additional
losses Disincentive to debt financing
Financial distress Significant problems in meeting debt obligations Most firms that experience financial distress do
not ultimately file for bankruptcy
17-30
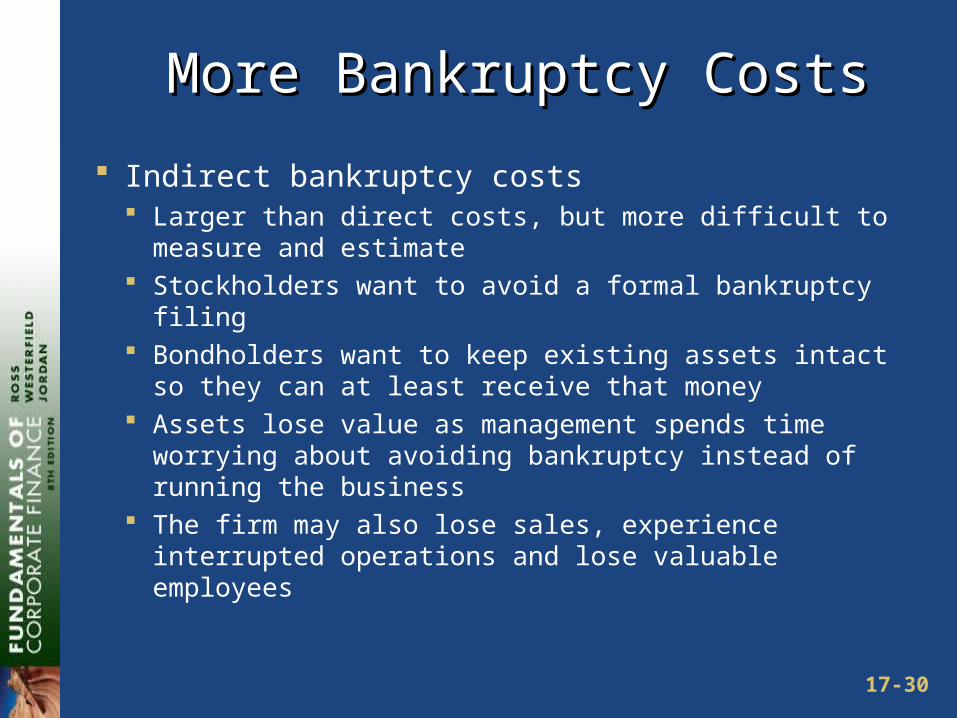
More Bankruptcy CostsMore Bankruptcy Costs
Indirect bankruptcy costs Larger than direct costs, but more difficult to
measure and estimate Stockholders want to avoid a formal bankruptcy filing Bondholders want to keep existing assets intact so
they can at least receive that money Assets lose value as management spends time
worrying about avoiding bankruptcy instead of running the business
The firm may also lose sales, experience interrupted operations and lose valuable employees
17-31
Figure 17.6Figure 17.6
17-32
Figure 17.7Figure 17.7
17-33
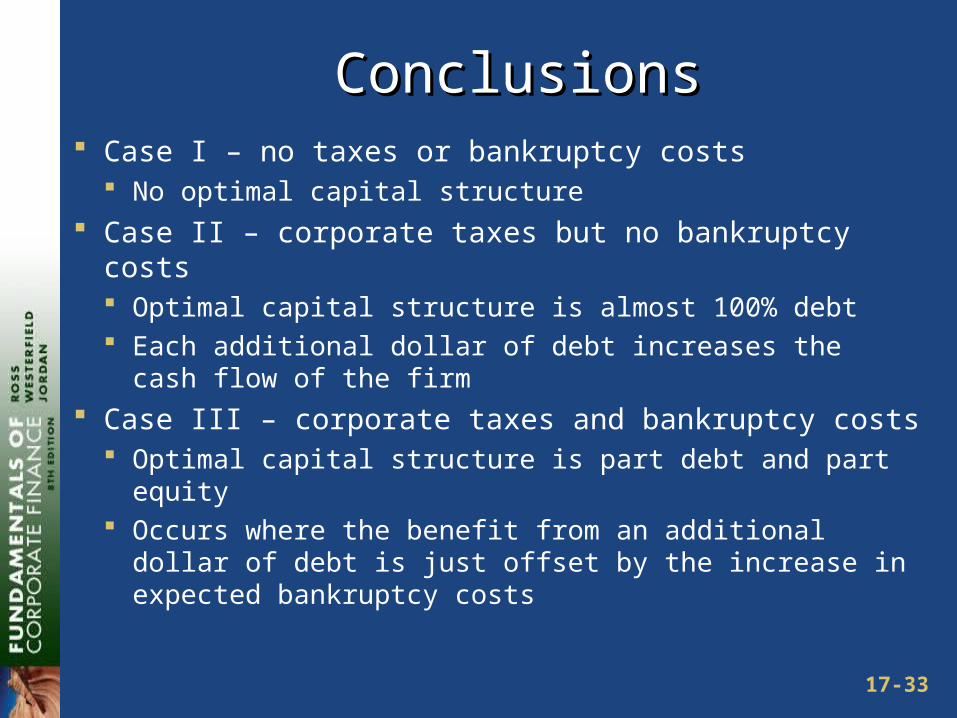
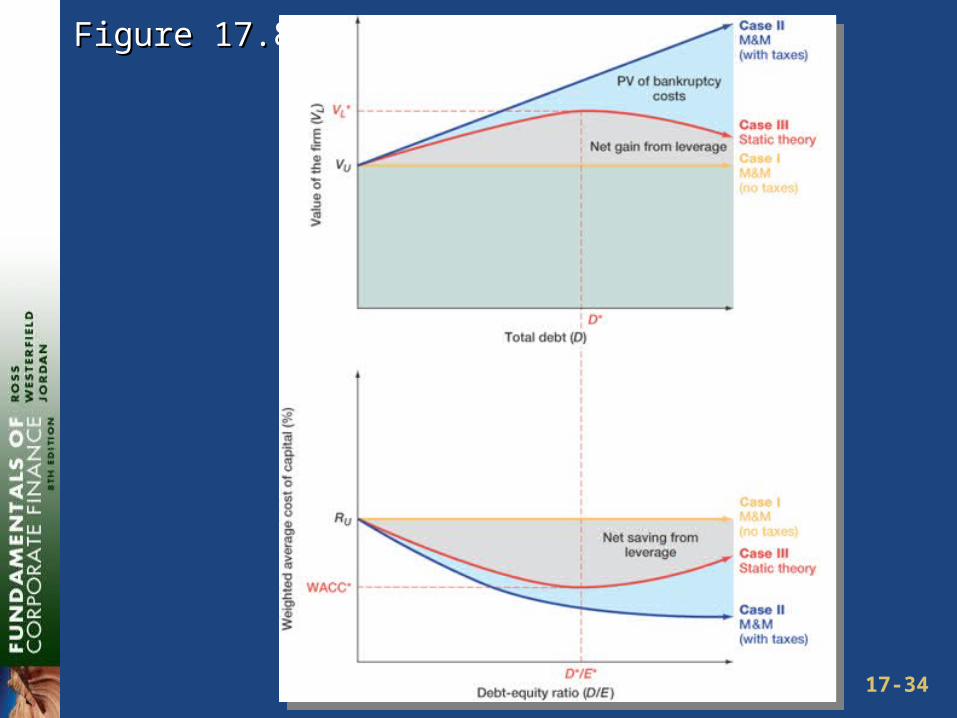
ConclusionsConclusions Case I – no taxes or bankruptcy costs
No optimal capital structure Case II – corporate taxes but no bankruptcy costs
Optimal capital structure is almost 100% debt Each additional dollar of debt increases the cash flow
of the firm Case III – corporate taxes and bankruptcy costs
Optimal capital structure is part debt and part equity Occurs where the benefit from an additional dollar of
debt is just offset by the increase in expected bankruptcy costs
17-34
Figure 17.8Figure 17.8
17-35
Managerial RecommendationsManagerial Recommendations
The tax benefit is only important if the firm has a large tax liability
Risk of financial distress The greater the risk of financial distress, the
less debt will be optimal for the firm The cost of financial distress varies across
firms and industries and as a manager you need to understand the cost for your industry
17-36
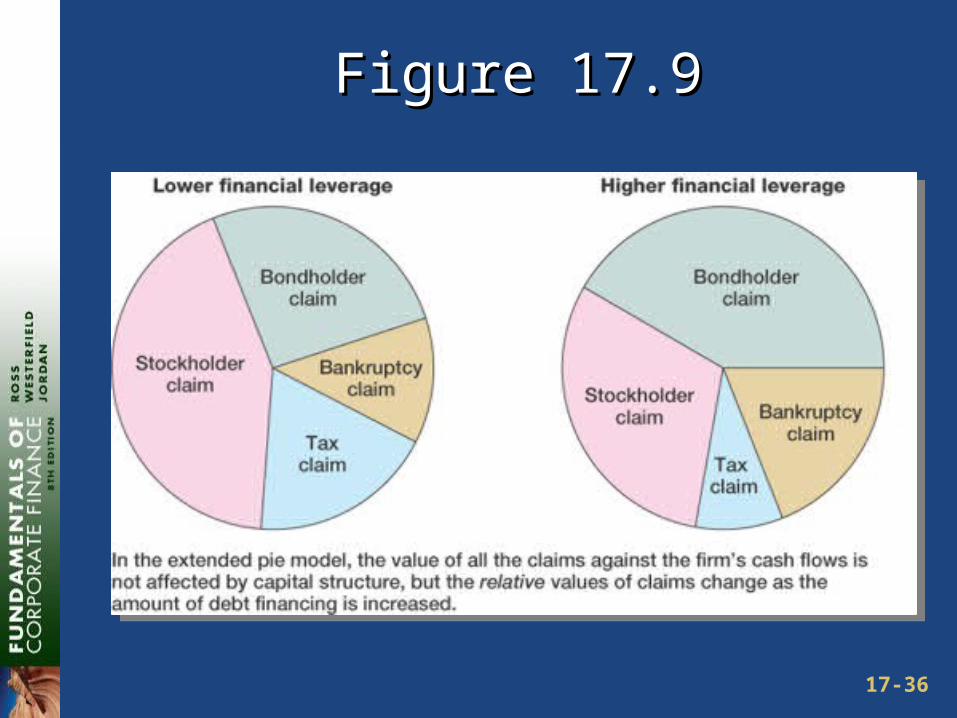
Figure 17.9Figure 17.9
17-37
The Value of the FirmThe Value of the Firm
Value of the firm = marketed claims + nonmarketed claims Marketed claims are the claims of stockholders and
bondholders Nonmarketed claims are the claims of the government
and other potential stakeholders
The overall value of the firm is unaffected by changes in capital structure
The division of value between marketed claims and nonmarketed claims may be impacted by capital structure decisions
17-38
Observed Capital StructureObserved Capital Structure
Capital structure does differ by industries Differences according to Cost of Capital
2004 Yearbook by Ibbotson Associates, Inc. Lowest levels of debt
Drugs with 6.38% debt Paper and computers with 10.24 – 10.68% debt
Highest levels of debt Airlines with 64.22% debt Electric utilities with 49.03% debt
17-39
Bankruptcy Process – Part IBankruptcy Process – Part I
Business failure – business has terminated with a loss to creditors
Legal bankruptcy – petition federal court for bankruptcy
Technical insolvency – firm is unable to meet debt obligations
Accounting insolvency – book value of equity is negative
17-40
Bankruptcy Process – Part IIBankruptcy Process – Part II
Liquidation Chapter 7 of the Federal Bankruptcy Reform
Act of 1978 Trustee takes over assets, sells them and
distributes the proceeds according to the absolute priority rule
Reorganization Chapter 11 of the Federal Bankruptcy Reform
Act of 1978 Restructure the corporation with a provision to
repay creditors
McGraw-Hill/IrwinMcGraw-Hill/Irwin Copyright © 2008 by The McGraw-Hill Companies, Inc. All rights reserved.Copyright © 2008 by The McGraw-Hill Companies, Inc. All rights reserved.
1717End of Chapter
Related Documents