[1] CHAPTER (1): METHODOLOGY AND AN INTRODUCTION 1-1 INTRODUCTION Owners, Board of directors, Consultants, Manager and engineers directing the efforts of an organization or a group have responsibility to know how, when and Where to institute a wide range of change and makes decision. These changes cannot be sensibly implemented without knowledge of the appropriate information upon which they based. Historically, organizations have always measured performance in some way through the financial performance, be this success by profit or failure through liquidation. The questioned whether it's possible to measure the success of an organisation. We can always find some really interesting indications. Financial and non-financial data need to be combined, as do retrospective and forward looking data, using comparison with others where possible. Any figures will not, of course, provide a magic answer. Judgements are inevitable and it is crucial to provide good commentary. Much of that information is provided by the organization's performance measurement and accountancy systems. This research introduces the field of performance measurement and how performance measure system and standard are designed. 1.1.1 Type of Research 1 :- The basic types of research are as follows: - (1) Descriptive versus Analytical: Descriptive research includes surveys and fact-finding enquiries. The major research is description purpose of the state of affairs as it exists at present.(Marketing and evaluation are example of applied research) 1 C R Kothari , Gaurav Garg - Research Methodology Methods and Techniques –Third Edition

Welcome message from author
This document is posted to help you gain knowledge. Please leave a comment to let me know what you think about it! Share it to your friends and learn new things together.
Transcript

[1]
CHAPTER (1): METHODOLOGY AND AN INTRODUCTION
1-1 INTRODUCTION
Owners, Board of directors, Consultants, Manager and engineers directing the efforts of an organization or a group have responsibility to know how, when and Where to institute a wide range of change and makes decision. These changes cannot be sensibly implemented without knowledge of the appropriate information upon which they based.
Historically, organizations have always measured performance in some way through the financial performance, be this success by profit or failure through liquidation.
The questioned whether it's possible to measure the success of an organisation.
We can always find some really interesting indications. Financial and non-financial data need to be combined, as do retrospective and forward looking data, using comparison with others where possible. Any figures will not, of course, provide a magic answer. Judgements are inevitable and it is crucial to provide good commentary.
Much of that information is provided by the organization's performance measurement and accountancy systems.
This research introduces the field of performance measurement and how performance measure system and standard are designed.
1.1.1 Type of Research1:-
The basic types of research are as follows: -
(1) Descriptive versus Analytical: Descriptive research includes surveys and fact-finding enquiries. The major research is description purpose of the state of affairs as it exists at present.(Marketing and evaluation are example of applied research)
1 C R Kothari , Gaurav Garg - Research Methodology Methods and Techniques –Third Edition
[2]
(2) Applied versus Fundamental: Applied research aims at finding a solution for an immediate problem facing a society or an industrial/business organization, where fundamental research is mainly concerned with generalisation and with formulation of a theory.
(3) Quantitative versus Qualitative: is based on the quantitative measurement of some characteristics. It applicable to phenomena that can expressed in term of quantities.
(4) Concept versus Empirical: Conceptual research is that related to some ideas or theory. It is generally used by philosophers and thinker, empirical research relies on experience or observation alone.
(5) Some other Types of Research: All other types of research are variations of above one or more of the above stated approaches. Based on either the purpose of research, or time required to accomplish research, on the environment in which research is done.
1.1.2 Significance of Research:
Research has its special significance in solving various operational and planning problems of business and industry.
(2) PROBLEM STATEMENT:-
1. What literature or theory review of performance measurement in quality management system (International Standards Organization (ISO)) and excellence model (European Foundation Quality Management (EFQM), Balance Scorecard(BLC)). (Standards). Needed for built system, improve and competence National and international. 2. What are believed of quality management system (ISO 9001:2008 which are selected by researcher) and Excellence Model (EFQM and Balance scorecard which are selected by researcher). 3. What significant and insignificant of quality management system (ISO 9001:2008) and Excellence Models (EFQM and Balance scorecard) are deployed (implement and structured systemic) and refined.
(3) AIM AND OBJECTIVE:-

[3]
(1) An overview of Performance measure organization and through quality management system (International Standard Organization (ISO 9001: 2008)) and Excellence Model (European Foundation for Quality Management (FQM) and Balance Scorecard (BSC)) (standard).
(2) Assurance selected standard are today performance measure standard by believe;
(3) Assurance selected standard are deployed (implemented and structured systematic) assessed and refined and which are significant.
(4) HYPOTHESIS:- (1) Organizations believe on Balance scorecard (BSC), European Foundation for Quality Management (FQM) and International Standard Organisation (ISO) as performance measurement standards.
(2) Hypothesis two divided into:-
(1) The organizations implement, deployment, assess and refine ISO 9001:2008.
(2) The organizations implement, deployment, assess and refine European Foundation for Quality Management.
(3) The organizations implement, deployment, assess and refine Balance scorecard.
(5) METHODOLOGY Research Method versus Methodology
Research methods can be put into the following three groups1:
(1) In the first group: include those methods which are concerned with the collection of data. These methods will be used where the data already available is not sufficient to arrive at the required solution;
Methods will use:-
(1) Library Research: Recording of notes, Reference. (2) Field Research: Personal interview 1 (Research Methodology Method and Techniques – Third Edition)

[4]
Techniques will use:
(1) Interviewer uses general and detailed table with open and closed questions for International Standard Organization (ISO 9001:2008), European Foundation for Quality Management (EFQM) and balance scorecard.
(2) The second group: consists of those statistical techniques which are used for establishing relationships between the data and the unknowns; (Frequency, means, Histogram, control chart...)
(3) The third group: consists of those methods which are used to evaluate the accuracy of the result obtained.
Here in this research used hypothesis test as one way anova, Chi Square test
5-1 Sample Design1:-
A sample design is a definite plan for obtaining from a given population. It refers to the technique or the procedure the researcher would adopt in selecting items for the sample. Sample design may as well lay down the number of items included in sample (size of sample).
Type of sample design2:-
(1) Non-probability Sampling.
(2) Probability Sampling.
(1) The Current Research Sample Design - Non-probability:
Non-probability is selected sample method or technique in this research. The sample design is seven organizations as well population, there are electrical corporation for generators and distributors, Sudanese for standards and specifications corporation, Sudatel Company, Khartoum Bank and Faisal Islamic Bank. (As cause study)
1 (Research Methodology Method and Techniques – Third Edition) 2 (Research Methodology Method and Techniques – Third Edition)
[5]
CHAPTER (2): LITERATURE ERVIEW
SECTION ONE: PERFORMANCE MEASURE
2-1PERFORMANCE MEASURE DEFINITION:
Performance measure is the Process of collecting, analyzing and/or reporting information regarding the performance of an individual, group, organization, system or component. It can involve studying processes and strategies within organizations, or studying engineering processes/parameters/phenomena, to see whether output are in line with what was intended or should have been achieved1.
Performance: can be defined as Effectiveness. Effectiveness can be defined broadly as "producing intended result"2.
Working definition of Performance: "Doing today what will lead to measured value outcomes tomorrow"3
Performance measurement: Performance measurement has been defined by Neely4 as “the process of quantifying the efficiency and effectiveness of past actions”,
while Moullin5 defines: Performance measure as "the process of evaluating how well organisations are managed and the value they deliver for customers and other stakeholders”.
Performance Standard: Both kinds of performance standard can be considered a measure of performance, in that each helps you evaluate the success of your efforts by comparing what actually happened against the standard.6
1 internet 2 (The Holistic Performance measurement and the Balanced Scorecard (Model 2) 3 (The Holistic Performance measurement and the Balanced Scorecard (Model 2) 4 Neely, A.D., Adams, C. and Kennerley, M. (2002), The Performance Prism: The
Scorecard for Measuring and Managing Stakeholder Relationships, Financial Times/Prentice Hall, London.
5 Moullin, M. (2002), Delivering Excellence in Health and Social Care, Open University Press, Buckingham.
6 Professor Shamboul Adlan (lecture)

[6]
A Performance Measure is the specific quantitative representation of a capacity, process, or outcome deemed relevant to the assessment of performance.
“Performance measurement is not something done to you by someone else but something done together in partnership, to improve our ability at every level – local, state, regional and national – to achieve our common goals.”1
2-2. LEADING AND LAGGING2:- "Leading" and "lagging" as terms to describe performance
information. A leading measurement relates to today's performance and can be used to make predictions about tomorrow's results. A lagging measurement contain information on actual results. The lagging measure can also be used to inform decisions about today's activities to improve tomorrow's results.
2-3 QUALITY MANAGEMENT SYSTEM
Definition Quality management system can be define as a set of interrelated or interacting elements that the organizations use to direct and control how quality policies are implement and quality objectives are achieved.
2-4 TQM DEFINITION
(1) "Total quality management is continuously satisfying customer requirements, at lowest cost, by harnessing the commitment of everyone in the organisation."3
(2) "Total quality management is an approach to improving the effectiveness and flexibility of business as a whole. It essentially a way 1 Philip R. Lee- Holistic Performance Measurement & Balance Scorecard 2 Holistic Performance Measurement & Balance Scorecard –Module 2-page 7 3 Dr David Cook PA Consultants, 1986

[7]
of organising . involving the whole company business or organisation, every department, every activity, every single person at every level.1
(3) "In general total quality management is defined as follows:
Quality: is to satisfy customers' requirements continually.
Total quality : is to achieve quality at low cost.
Total quality management: is to obtain total quality by involving everyone's daily commitment.2
(4) "TQM is corporate business management philosophy which recognises that customer needs and business goal are inseparable3.
(5) TQM is a manged process which involves people, systems and supporting tools and techniques. TQM is therefore a change agent which is aimed at providing a customer-driven organisation4.
(6) 'All thing that we must do to chieve quality leadership'5 Josph M Juran, USA. 1994
(7) 'TQM is an overall umbrella term which embraces customer service, quality assurance, quality circles, and quality tools. It is a change from an output organization to a process organization. It is total involvement to delight customers. "National Productivity Council of India, Delhi. 1995. S A Khader. Director (TQM) NPC. India."
(9) "TQM is a process which embraces the conscious striving for zero defects in all aspects of an organisation's activities. Or
(10) "TQM is management with the workforce co-operating in the processes , developing, producing and marketing quality goods and 1 (Professor J S Oakland, University Bradford, 1988, Proceeds of the International Conference on TQM, London) 2 (Professor Gopal K Kanji, Sheffield City Polytechnic, 1990) 3 (British Quality Association) 4 (John MacDonald, United Kingdom Institute of Management, 1993, Understand Total Quality Management) 5 (Josph M Juran, USA. 1994)

[8]
service which satisfy customers need and expectations first time and every subsequent time.1
(11) Total Quality Management (TQM):
TQM is a method by which management and employees can become involved in continuous improvement of the production of good and service2.
Good performance is the criterion whereby an organization determines its capability to prevail. Performance measurement estimates the parameters under which programs, investments, and acquisitions are reaching the targeted results
(12) ISO Definition for TQM3
The international Organization For Standardisation (ISO) has produced a definition of TQM in the standard ISO 8402:1994 Quality Management and quality Assurance Vocabulary As "3.7 Total Quality Management: Management approach of an organisation (1.7), centred on quality (2.1), based on the participation of all members and aiming at long-term success through customer (1.9) satisfaction, and benefits to all members of the organisation and to society
The expression "all its members" designates personnel in all departments and at all levels of organisation(1.8).
The strong and persistent leadership of top management and the education and training of all members of the organization are essential for the success of this approach.
In total quality management, the concept of Quality relates to the achievement of all managerial objectives.
The concept 'benefits to society' implies. As needed. Fulfilment of the achievement of all managerial objectives.
1 (University of Leicester. Master's Degree Administration, 1997" (TQM Model 5))
2 (Reference http://qualitygurus.com/cour) 3 (Total Quality Management-Module 5-page 24)
[9]
Total quality management1 (TQM) or parts of it, are sometimes called 'total quality; 'CWQC (company-wide quality control), 'TQC' (total quality control) and so on.
Requirement of society means:
Obligations resulting from legislation, regulations, rules, codes and statutes, the environment, health and safety, security considerations of energy and natural resources.
Organisations do not work in a vacuum and they have a responsibility to society as a whole.
All that lead us to now definition of Quality: Fitness for purpose or use2. Quality: Conformance to requirements3. Quality: Aimed at the needs of the consumer4.
2-5 CRITERION5: (noun (plural criteria)
A principle or standard by which something judged or decided.
2-5.1 What is Criterion-referenced Assessment?
When we look at the types of assessment instruments, we can generally classify them into two main groups: Criterion-referenced assessments and norm-referenced assessments. The two types of assessments defined as following6:
(1) "Norm-Referenced Assessment: -
A test or other type of assessment designed to provide a measure of performance that is interpretable in terms of an individual's relative standing in some known group.
(2) Criterion-Referenced Assessment: -
1 (Total quality Management – Module 5 –page 25) 2 (Juran) 3 (Crosby) 4 (Deming) 5 (Oxford dictionaries – languages matters) 6 (Linn and Gronlund (2000))
[10]
A test or other type of assessment designed to provide a measure of performance that is interpretable in terms of a clearly defined and delimited domain of learning tasks.
These authors provide the following additional information about criterion-referenced assessments:
(1) "...Criterion-referenced tests include items that are directly relevant to the learning outcomes to be measured, without regard to whether the items can be used to discriminate among students. No attempt is made to eliminate easy items or alter their difficulty. If the learning tasks are easy, then test items will be easy. The goal of the criterion-referenced test is to obtain a description of the specific knowledge and skills each student can demonstrate. This information is useful for planning both group and individual instruction." (2) "Criterion-referenced interpretations can be made in various ways. For example, we can (1) describe the specific learning tasks a student in able to perform (e.g., counts from 1 to 100), (2) indicate the percentage of tasks a student performs correctly (e.g., spells 65 percent of the words in the word list), or (3) compare the test performance to a set performance standard and decide whether the student meets a given standard (e.g., performed at the proficient level)".
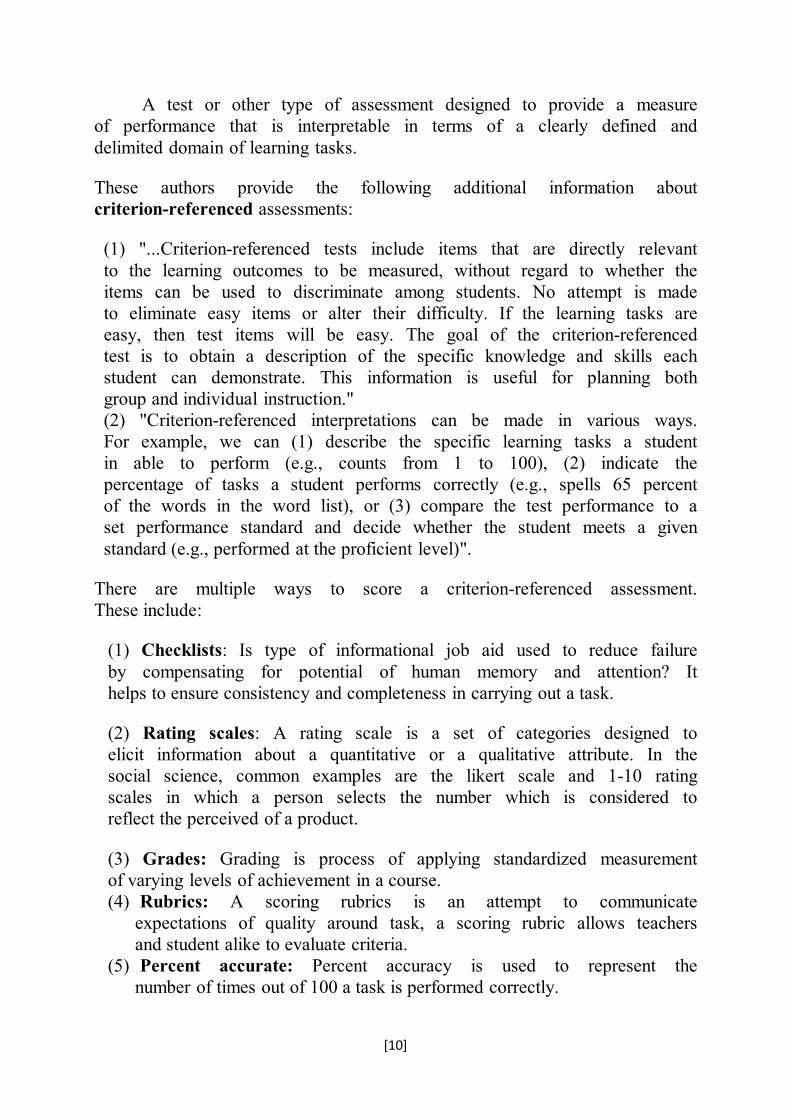
There are multiple ways to score a criterion-referenced assessment. These include:
(1) Checklists: Is type of informational job aid used to reduce failure by compensating for potential of human memory and attention? It helps to ensure consistency and completeness in carrying out a task.
(2) Rating scales: A rating scale is a set of categories designed to elicit information about a quantitative or a qualitative attribute. In the social science, common examples are the likert scale and 1-10 rating scales in which a person selects the number which is considered to reflect the perceived of a product.
(3) Grades: Grading is process of applying standardized measurement of varying levels of achievement in a course. (4) Rubrics: A scoring rubrics is an attempt to communicate
expectations of quality around task, a scoring rubric allows teachers and student alike to evaluate criteria.
(5) Percent accurate: Percent accuracy is used to represent the number of times out of 100 a task is performed correctly.

[11]
2-5.1.2 Parameter1 in its common meaning is a characteristic, feature, or measurable factor that can help in defining a particular system. A parameter is an important element to consider in evaluation or comprehension of an event, project, or situation. Parameter may have more specific interpretations in mathematics, logic, linguistics, environmental science, Engineering and or other discipline
2-5.1.3 Parametric Equations
In the special case of parametric equations, the independent variables are called the parameters.
Example:-
If asked to imagine the graph of the relationship y = ax2, one typically visualizes a range of values of x, but only one value of a. Of course a different value of a can be used, generating a different relation between x and y. Thus a is a parameter: it is less variable than the variable x or y, but it is not an explicit constant like the exponent 2. More precisely, changing the parameter a gives a different (though related) problem, whereas the variations of the variables x and y (and their interrelation) are part of the problem itself.
1 (internet)
[12]
2-6.1 FINANCIAL PERFORMANCE AND NON-FINANCIAL PERFORMANCE:- Financial performance is an aspect of performance and is often spoken of as ultimate indicator of a company's performance. So1:-
(1) Shareholders look at how their investment is increasing.
(2) Managers may look at sales and profit and.
(3) Customers may be concerned with costs.
By the end of 1990's financial performance information was indeed seen as too narrow to describe the performance of most organization. Quality awards as EFQM Model, Malcolm Baldrige and others Model led to an interest in non-financial measures of performance. Where as to:
(1) Reinforce new competitive strategies.
(2) Identified the fact that there a developing body of academic and practitioner knowledge.
A mixture of financial and non-financial indicators and outcomes can be used to infer how well the organization is performing in these areas as following2:-
(1) EFQM Results Area:-
(1) People Results.
(2) Customer Results.
(3) Society Results.
(4) Key Performance Results.
(2) Financial:-
(1) Salary.
(2) Average sale. 1 (Holistic Performance Measurement & Balance Scorecard –Module2) 2(Holistic Performance Measurement & Balance Scorecard –Module2-page 11-12)

[13]
(3) Compliance costs. (4) Return on Capital.
(3). Non-financial:-
(1) Staff satisfaction. (2) Customer satisfaction. (3) Waste reduction. (4) Reputation on Capital Employed.
The interested in performance Measurement Information1:
The stakeholders are interest in performance measurement information. Here identifies a number of areas for collecting performance information2, including:-
(1) To provide evidence of programme effectiveness.
(2) To improve public accountability;
(3) For setting goals and objectives. Planning program activities to accomplish these goal, allocating resources to these programs, monitoring and evaluating the results to determine if they are making progress in making progress in achieving the establish goals and objectives, and modifying program plans to enhance performance;
(4) To recognize good performance and to identify area for improvement;
(5) To solicit joint cooperation in improving future outcomes in respective communication, and
(6) For better informed resources allocations.
Also there are eight reasons or purpose that the managers of public sectors agencies use performance, as following3:-
(1) Evaluate.
(2) Control.
1 (Holistic Performance Measurement and & the balance Scorecard – Module 2- Page 16-line 1) 2 (Behn and Scholars) 3 (Holistic Performance Measurement and & the balance Scorecard – Module 2- Page 16- table 1.4)

[14]
(3) Budget.
(4) Motivate.
(5) Promote.
(6) Celebrate.
(7) Learn.
(8) Improve.
Also the question that manager may ask against above eight purpose as following:-
(1) How well is my public agency perform.
(2) How can I ensure that my subordinates are doing the right thing?
(3) How spend public money.
(4) How can motivate line staff, middle managers and stakeholders.
(5) How can Superiors and stakeholders that my agency is doing a good job.
(6) What accomplishments are worthy of important org. ritual of celebrating success?
(7) Why is what working or not working?
(8) What exactly should who differently to improve performance?1 (Source: adapted from Behn 2003)
Also seven reason for the current importance of performance measure (Source adapted from Neely, 1999) 2as:-
Reason
(1) The changing nature of work. (From manufacturing to services and knowledge based.) (2) Increasing competition. (Opening of markets and de-regulation.) 1 (Holistic performance (Source: adapted from Behn 2003))
2 (Holistic performance (Source adapted from Neely, 1999))
[15]
(3) Specific improvement initiatives. (Total Quality Management (TQM), Business Process, Re-engineering (BPR). (4) National and international awards. (Deming Award. Baldrige, EFQM).
(5) Changing organisational roles. (Accountants becoming performance measurement analysts.)
(6) Changing external demands. (Increasing consumer and regulatory accountability). (7) The power of information technology. (Enabling the capture and analysis of performance measurement information).
2-6.2 Profit Maximisations1
In 1995 the Royal Society of art and Commerce (RSA) a UK London-based membership organization, they produce influential reports. Tomorrow's Company, that stated:
"Those companies which will sustain competitive success in the future are those which focus less exclusively on shareholders and on financial measures of success and include all their stakeholder relationships, and a broader range of measurements, in the way they think and talk about their purpose and performance." We gain that focus on:
(1) Less exclusively on shareholders.
(2) And on financial measures of success.
(3) And include all their stakeholder relationships.
(4) And a broader range of measurements, in the way they think and talk about their purpose and performance.
The strategic performance measurement systems:-
The strategic performance measurement systems focus on attributes of performance that are thought to create success in achieving that the objectives that defined for the organisation. Two sets of objectives are envisioned:
1 (Holistic Performance Measurement & Balance Scorecard –Module 2-page 19))

[16]
(1) Primary objectives, which are the organisation's ends defined by the owners; and
(2) Secondary objectives, which are seen as mean to the desired ends. (Atkinson (1997))1
The performance measurements systems used a range of factors to give a good coverall picture of the shape of the businesses. The research showed that because most small businesses were often aiming to survive rather than grow, profit was not always the main concern because as a measurement it lagged too far behind, and that cash or orders taken were better leading indicators of performance. They found, not surprisingly, that cash flow was not more important than profit but that the way cash was measured differed from cash accounting to rough measures of how many invoices were sent out. They found that in their sample of owners a great deal of weight was given to qualitative measure and this reflects the same concern that the professional manager of large firms have with non-financial.2
2-6.2.2 Board Reporting3:-
The board of a private or public company normally either own the company or represent the shareholders. Their typical duties include:-
(1) Setting the company's direction.
(2) Monitoring progress and making strategic decisions on resource allocations.
So in order to do this duty they need to receive appropriate performance measurement information.
Manager presenting information to boards needs to make sure that the information presented is:-
(1) Complete. (2) Valid and reliable; and (3) Where there is doubt to highlight the location and possible cause of that doubt.
1 (Holistic Performance Measurement & Balance Scorecard –Module 2-page 19) 2 (Holistic Performance Measurement & Balance Scorecard –Module 2-page 19) 3 (Holistic Performance Measurement & Balance Scorecard –Module 2-page 20)

[17]
Boards themselves need to avoid getting too much or too little information.
The UK's Chartered Institute of Management Accounts (CIMA) guides present a practical checklist for presenting such information shown on following table appendix (2):
2-6.3 The Role of Accounting in Performance Measurement:
THE Role of Accounting in Performance Measurement1:-
(1) Understand the contribution of financial and management accountancy to contemporary measurement systems.
(2) Appreciate some of the limitations of financial information for measuring the performance of modern organizations in private.
(3) Be able to apply their knowledge to examine the financial performance measurement information produced by their own organizations or ones they now well, and use it to inform their own decision-making.
We want to give overview of the main discipline of accountancy that relate to performance.
There are a number of key points there are covered on the coming review of accountancy:-
(1) Accountancy provides performance information to many stakeholders in organization to help them make decision, and the information needs to be presented to satisfy each stakeholder's specific performance measurement information needs. In practice, this is not easy and so, accountants have to balance between individual needs and the practicality of presenting the information. Therefore each stakeholder has to interpret the information they are given before they can make decisions.
(2) There are two main standards of accounts:
(1) Financial.
1 (Holistic Performance Measurement & Balance Scorecard –Module 2-page 24)
[18]
(2) Management.
Who focus on different stakeholders and use different method of analysis, and provide satisfy statutory requirements.
(3) A major financial activity is the production of the financial plan (budget) that is used measure the performance of the organization in financial terms. The financial plan is based on forecast and estimates turn out to be.
(4) All accountancy information is based on convention and judgments by accounts. For instance the idea of profit is an accountancy invention and it not the same as cash in the bank. This means that it only shows one aspect of the organization's performance.
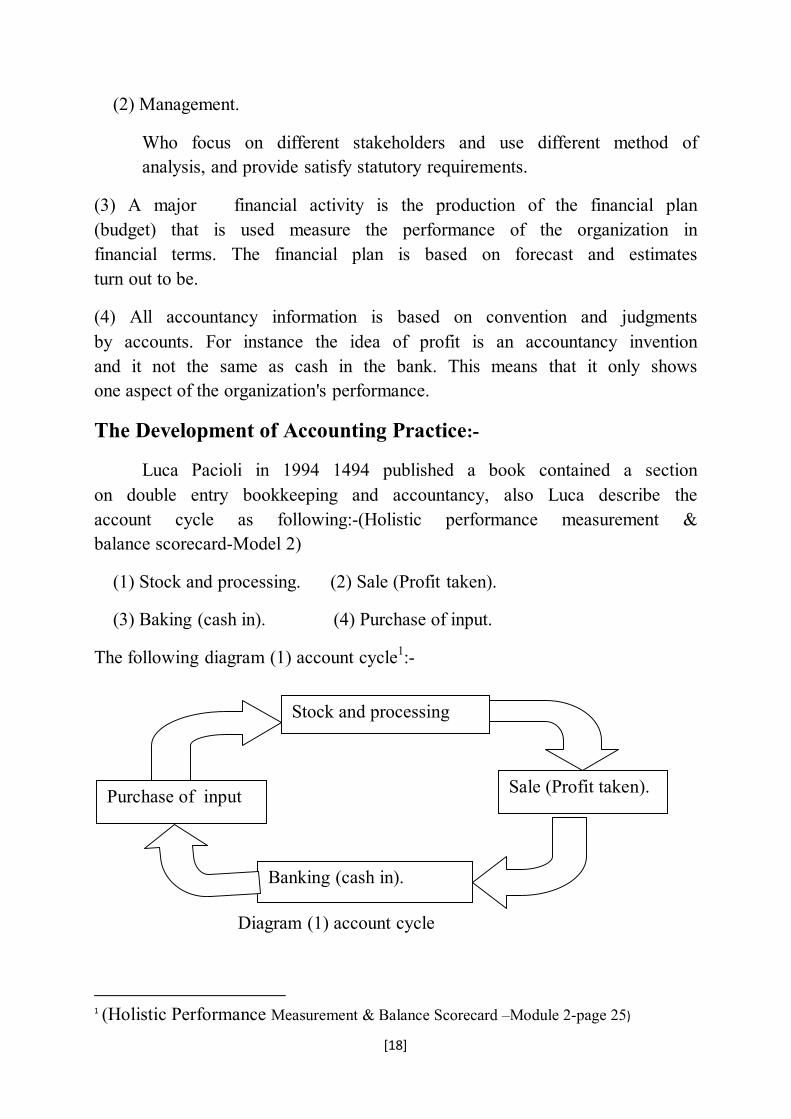
The Development of Accounting Practice:-
Luca Pacioli in 1994 1494 published a book contained a section on double entry bookkeeping and accountancy, also Luca describe the account cycle as following:-(Holistic performance measurement & balance scorecard-Model 2)
(1) Stock and processing. (2) Sale (Profit taken).
(3) Baking (cash in). (4) Purchase of input.
The following diagram (1) account cycle1:-
Diagram (1) account cycle
1 (Holistic Performance Measurement & Balance Scorecard –Module 2-page 25)
Purchase of input
Stock and processing
Banking (cash in).
Sale (Profit taken).

[19]
2-6.4 Financial Accountants:-
Control:-
(1) Maintain the original role of accounts.
(2) Manage the money in the organization.
(3) Responsible for stewardship of it asset.
(4) Prepare and must ensure the fair and true representation of the organization' situation.
(5) Transaction and recorded interpret them in monetary term. Trial balances which trying to ensuring that what is owed and owing balance out, as:-
(1) Recorded sales (money in). (2) Purchase account that Purchase made (money out). (3) Pay toll account that recorded salaries and wages. (Money out). (4) Balance sheet: it snapshot appear:
(1) Company' assets. (2) Liabilities it owes. (3) The profit. (4) Loss account.
2-6.5 Management Account:-
Response for accounting cost which use financial information to decision-makers on likely future performance.
2-6.6 Financial Reporting Information:-
May be conclusion on following equations:-
(1) Cost of goods sold equals the direct cost and sale. (2) The cross profit (or cross loss) equal the difference between sales
and cost good sold. (3) Net Profit equals the difference between all income and all costs.
2-6.7 Accounts and the Balance Sheet:-
[20]
The balance sheet is one of the statements that produced and can be represented as following equations:-
Assets – liabilities = Capital +profit – Drawings (The Net Assets of the business )
Which
Assets fixed: assets are the business acquired in order to earn profits. but not for resale as machinery.
Current Assets: are acquired by the business to convert into cash as part of its business activities as materials.
Liabilities: - Current liabilities are amount that owed by the businesses, payable in the short-term.
Other definitions
A liability is a debt, obligation or responsibility by an individual or company. Current liabilities are debts that are due within 12 months or the yearly portion of a long term debt.1
Example Current Liabilities for Companies2
(1) Accounts payable - This is money owed to suppliers.
(2) Accrued expenses - These are monies due to a third party but not yet payable; for example, wages payable.
(3) Accrued Interest - This includes all interest that has accrued since last paid.
(4) Bank account overdrafts - These are short term advances made by the bank for overdrafts.
(5) Bank loans or notes payable -This is the current principal portion of a long-term note.
(6) Current maturities of long-term debt - This is the part of a long term debt that is due in the upcoming 12 months.
1 (https://examples.yourdictionary.com/refence/examples/examples-of-current-liabilities.html) 2 (https://examples.yourdictionary.com/refence/examples/examples-of-current-liabilities.html)
[21]
(7) Customer deposits or unearned revenue - These are payments given by customers as an advance for future work that is expected to be completed by the end of the next 12 months.
(8) Dividends payable - These are the dividends declared by the company Board of Directors that have not yet been paid to the shareholders.
(9) Income taxes payable - These are taxes owed to the government that have not yet been paid.
(10) Interest payable - This is interest owed to lenders that has not been paid.
(11) Notes payable (other than bank notes) - This is the current principal portion of long-term notes.
(12) Payroll taxes payable - This is taxes withheld from employees or taxes related to employee compensation.
(13) Rental payments - These are paid for renting buildings, land, pastures, or other property or structures.
(14) Short-term notes payable - These loans are due upon demand or within the next year.
(15) Sales taxes payable - These are taxes collected from customers for the government that need to be paid to the government.
(16) Wages - These are owed to employees.
Capital:- the originally amount of money put into the business.
Profit: the net profit that comes from the profit and loss account is added to the balance sheet as an asset.
Drawings: represent amount of cash that the owners draw from the business.
2-6.8 Techniques of Financial Analysis1:-
In order to provide the information needed for financial control, financial analysis may comply a number of techniques including analysis of income, profit and costs and break-even point analysis as:-
(1) Income, Cost and profit Analysis: - This asks where source of income, cost or profit is and how they behave. (2) Break even analysis: - the break-even-point for a particular
product or service is reached when there are sufficient sales to begin 1 ( Holistic Performance Measurement & Balance Scorecard –Module 2-page 31-35)

[22]
to cover the organization's fixed cost. The financial analysis has to identify for product or service the following:-
(1) The level of variable costs associated with a single unit (variable cost are like raw materials and labor)
(2) Selling price of each unit. (3) Fixed cost associated with product or price (rent, power and light are
to be fixed and do not vary with volume. The break-even-point can then be calculated by the equation:- Breakeven point = fixed costs/(selling price – variable costs of
each unit). A variation on break even graph is sometimes used by analysis in
complex organizations where fixed and variable costs are difficult to gather. This is a best fit line which using information from company's profit and loss account to identify the levels of sales at which the company makes a profit. The sales and profit (loss) numbers are taken of periods and plotted on a graph where the best fit line cut the line. This analysis is most useful for sales forecast where it is necessary to
make judgments a about the likely volume of sales and accompany profits or (loss).
(3) Ratio Analysis:-
Ratios are way of analyzing performance information by comparison two numbers taken from the organization's financial management systems.
There are five main types of rations used in financial analysis as:-
(1) Profitability. (2) Liquidity. (3) Capital Ratios. (4) Activity Ratios. (5) Cost and Expenses Ratios. (1) Profitability:-
Used by people outside and manager to know how well manager performance and decision makes to manger. And it addresses number of questions as:-
(1) Is the organization profitable?

[23]
(2) How well does organization use its resources to generate profits?
(4) Are profits sufficient to attract and retain investment? (5) Which parts of the organization generates the greatest return? (6) What us the variation of the profits with price and volume? (7) Dos profit come from trading or other sources such as rentals and
disposals?
(2) Liquidity Ratios:-
Liquidity ratios asses the ability of an organization to pay its bills, enough cash, or assets that can be quickly turned into cash (so called short terms assets). Most business operates on the cusp of liquidity. Volatile market normally requires more liquidity than stable. Finally in some industries such as bank a certain level of liquidity is laid down by regulators to ensure the viability of businesses.
Analysts may be addressing the following questions:-
(1) Is the business viable in the short and longer term? (2) Are there sufficient resources to meet creditors' requirement?
(3) Capital Ratios:-
Capital ratios show how managers are using the capital in the business. Long term debt can be very useful because it releases fund and it can be used to reduce tax liabilities. Too much equity indicates that managers are not balancing the advantages using long term debt to generate profit.
Often used by investors reviewing worth of accompany and potential returns on their investments.
Question to addresses with:-
(1) What is the cost of capital in relation to interest or dividend?
(2) What sort of capital has the company issued and who owns it?
(3) How much further capital available if required?
(4) When does long term debt becomes due. If soon should it be treated as current liability?

[24]
(4) Activity Ratio:-
Activity ratios give measure of productivity and efficiency of organization. The main areas of productivity and efficiency that can be examined using financial performance measures are:-
(1) Utilization of assets. (2) Stock turnover.
The effectiveness of the "lean" concept can be examined using activity ratios, if an organization's lean effort are working, then stock turn over should increase because operations are performed more efficiently. Questions to address by analysts:-
(1) How efficiently are managers controlling costs? (2) How well assets utilized? (3) Are creditors paid within a reasonable of time? (4) How many times can the existing dividend be paid from the
available profit?
(5) Cost and Expense Ratios
Cost and expense ratios are mainly used by managers who need to understand and contain cost.
Question to address are:-
(1) Are costs in a particular area changing and if so, why? (2) Are costs in and expenses comparable across the business and with
other organization in similar situations?
(6) Budgeting:-
The main financial control tool is the budgeting process, as important source of finical performance information. The Chartered Institution and Wales, defines budgeting as:
"The establishment of budgets relating the responsibilities of executives to the requirements of a policy, and the continuous comparison of actual

[25]
with budgeted results, either to secure by individual action the objective of that policy, or to provide a basis for its revision"1
Budget is always best estimates of what may happen if the plan works as designed. All the budget information is then combined into a master budget that normally comprise of:
(1) A forecast and loss account profiled over the budget period showing the estimated sales and the costs of inputs and activities necessary to make the sales;
(2) A forecast balance sheet for the end of the budget period that provides an estimate of how much external financing is required to support the estimated sales, and;
(3) A detailed cash flow forecast profiled over the budget period showing how cash comes into the organization and flow out and when.
2-7.1 PERFORMANCE MEASURE PROCESS
Performance measurement system and performance measures process
Performance aims to integrate organizational activities across various managerial levels and functions (Sinciai &Zairai, 1995).
PMS can be examined at two different levels (Neely, Gregoy & Platts, 2005)
(1) The individual performance measures, (2) The set of performance measures- PMS as entity.
2-7.2 The Individual Performance Measures
Every performance measure system (PMS) consist of a number of individual performance /performance indicators. Performance measures are the vital signs of the organization which quantify how well the organization achieves a specified goal. I will show the multiple important measures like quality, time, cost, and flexibility on the standards method.
1 Holistic Performance Measurement & Balance Scorecard –Module 2-page

[26]
2-7.3 Performance Measure as Process
As a process, performance measurement is not simply concerned with collecting data associated with a predefined performance goal or standard. Performance measurement is better thought of as an overall management system involving prevention and detection aimed at achieving conformance of the work product or service to your customer's requirements. Additionally, it is concerned with process optimization through increased efficiency and effectiveness of the process or product. These actions occur in a continuous cycle, allowing options for expansion and improvement of the work process or product as better techniques are discovered and implemented.
Performance measure tells us:
(1) How well we are doing. (2) If we are meeting our goals. (3) If our customer are satisfied. (4) If our processes are in statistical control. (5) If and where improvements are necessary.
2-7.4 Performance Measure Categories1
Can be grouped into the following categories depending on the organization's mission:
(1) Effectiveness: A process characteristic indicating the degree to which the process output (work product) conforms to requirements. (Are we doing the right thing?).
(2) Efficiency: A process characteristic indicating the degree to which the process produce the required output at minimum resource cost. (Are we doing things right?)
(3) Quality: the degree to which a product or service meets customer requirement and expectations.
(4) Timelines: Measures whether a unit of work was done correctly and on time. Criteria must be established to define what constitutes timelines for a given unit of work. The criterion is usually based on customer requirement.
37(Source(SIMA website www.cima.org.uk) 1 (Article on the internet)

[27]
(5) Productivity: The value added by the process divided by the value of the labour and capital consumed.
(6) Safety: Measures the overall health of the organization and the work environment of its employees.
2-7.5 An Overview of Performance Measure Process Area: -
Organization are continually under competitive pressure and force to re-evaluate their business models and underline business processes1 . Defines process as an approach for converting inputs into outputs2.
It is away in which all the resource of organization are used in are reliable, repeatable and consistent way to achieve it goals. A performance processes is a coordinated chain of activities intended to produce performance measured result or repeating cycle that reach organization goal. Essentially, there are four key feature to any process. A process has to have3 : -
(1) Predictable and definable inputs, (2) A linear, logical sequence or flow, (3) A set of clearly definable tasks or activities, (4) A predictable and desired outcome or result.
2-7.6 Systems Thinking Systems Thinking has been defined as an approach to problem solving, by
viewing "problems" as parts of an overall system, rather than reacting to specific part, outcomes or events and potentially contributing to further development of unintended consequences. System thinking is not one thing but a set of habits or practices within a framework that is based on the belief that the component parts of a system can best be understood in the context of relationships with each other and with other systems, rather than in isolation. Systems thinking focus on cyclical rather than linear cause and effect.4
2-7.7 Function thinking 1 (Indihar & Hernaus, 2007). 2 . Zairi (1997). 3 (Zairi,1997) 4 ( Internet)

[28]
"Thinking in its simplest form tells you what a thing is. It gives a name to the thing. It adds concept." -Carl Jung.1
It may be possible to sum up the totality of the Thinking function with the question: What?
By this we mean that the Function's method of operation is to question: What? What is X? What is the mechanism by X operates? What can be achieved by the use of X? Insofar as we can use single-word summaries to any degree of accuracy in Analytical Psychology (even Thinking and Feeling are labels that are attached to much more complicated processes, for the purposes of conversation), this word may have some use.
In fact, managing performance measure processes through managing process thinking refer to a systematic, structured approach to analyze , improve, control and process with the aim of improving the quality of product and service with using quality tools, performance improve and problem tools and benchmark reference with the best . So we look performance measure process through the process thinking as follow:
2-7.8 The Concept of Improvement2:-
Better performance is can mean number of things from owner or shareholder :-
Improving bottom line – either financial performance in term of profit. Or non-financial performance in term achieving goal or objective.
Improved result may assess from a number of perspectives:-
(1) Customer's perspective: improved satisfaction with product or services, lead to customer loyalty and repeat business.
(2) The employee's perspective: more motivated, committed and efficient workforce and a better-trained.
1 (Internet) 2 (Process thinking and Quality –Module 4-page 1)
[29]
(3) The supplier's: improved collaboration, lead to a excellence overall service to the end customer
(3) Society's perspective: society interest. (an enhanced image with the public as whole) the commitment of the organization to the society .
2-7.9 Deming's Theory of Profound Knowledge1
Deming defies his System of profound Knowledge's as comprised of four elements.
(1) Appreciation for a system: -
This encourages considering the organisation as system , and how that whole system can be improved.
(2) Knowledge of variation:-
This involves understanding why parts of this system behave differently and inconsistently, and how to reduce effects of this.
(3) Theory of knowledge:-
This concern how individual and whole organization learn. And how this can be applied to help improvement.
(4) Psychology:-
This is about understanding what stimulates and motivates people, and hence how to lead their involvement in improvement. Effective use of these principles relies on being able to link the four elements together and apply an integrated approach to managing an organization.
2-7.10 Organisation and Systems:
Organization viewed in a number of ways:- (1) Hierarchical view (organogram):-
Which the organisation in term of how its employees are organized, and its levels of management control, also described as vertical view of an organization.
1 (Process thinking and Quality –Module 4-page 2)
[30]
(2) System:-
This approach is to view the organization in term of what it does.
The systems view of organization implies following:-
(1) The organization is oriented horizontally. In particular, communications are focused along the flow of the flow diagram, i.e. in the line with the work. In such an environment there is much concentration's on the organization's products and services.
(2) Interdependence and interaction between departments are acknowledged and directly considered in both planning and execution. Everyone in the organization is focused on the aims of the organization as a whole.
(3) These organization tend to place little emphasis on detailed job descriptions. There is instead much attention on the on the way 'why' of one's job. The emphasis is now on : "How does my work fit in and contribute to the aim of the organization as whole?"
2-7.11 Customer
Those who receive product that system produce, customers are keys to any type of improvement activity. They are the end user. They are different type or shape of product:-
(1) Good.
(2) Information.
(3) Result.
(4) Other impact.
2-7.11.2 Customer a Broader Definition:-
One which includes anyone affected by the system, the example:-
(1) Owners or shareholders.
(2) Employees.
(3) The community at large.
(4) Higher levels of the organization.

[31]
2-7.11.3 The concept of Supply Chain:-
Supply chain to describe such a sequence of supplier- customer relationships.
2-7.11.4 Customer Requirements: -
In order to improve organisational from the perspective of customer require, which customer requirements can be classified in various ways:
(1) Expected: - take for grand and unlikely to specify, including issue related to technical specification. (2) Wanted: - requirement customer may ask for. Can allow for some element of negation.
(3) Excitement: - requirement customer unlikely to ask for but would be delighted to find. This may related to involve innovate and imaginative.
2-7.11.5 Sources of Customer Information Feedback from customer can gather in a number of ways:-
(1) Questionnaires. (2) Telephone surveys. (3) Face-to-face interview or negations. (4) Focus groups. (5) Comment cards. (6) Complaints. (7) Internal indicators.
2-7.12 Principles for Improvement:-
Stated improvement can be viewed from a number perspective, but that all of these improvements come down to doing things better, from the perspective of particular customer or stakeholder. At the heart of this improvement principle lies the work or activities that organization actually carries out, known as its Processes.
In order to generate improvement, we have to look inside the systems view of an organization and ask what is actually happening inside that system. From this perspective organizations can be viewed as collection of activates that together generate the products or service.

[32]
2-7.13 The PDSA Cycle1:-
To improve any process, Proposed that an organization should:- (Dr Wallter A Shewhart)
(1) Plan:
(1) Confirm intentions.
(2) Develop theories.
(3) Encourage new ideas.
(4) Make predictions.
(2) Do:- (1) Implement plans.
(2) Pilot where possible.
(3) Collect information. (3) Study:-
(1) Analyses results.
(2) Compare with predictions.
(3) Identify causes.
(4) Act:- (1) Confirm the new process.
(2) Adopt on a larger scale.
(3) Adapt if necessary.
2-7.14 Processes A series of actions, changes, or functions bringing about a result. or A
sequence of activities that transforms inputs into required outputs.
The key elements of process are:
(1) Input. (2) Output. (3) Sequence of steps, or activities.
2-7.14.2 Linear flowcharts:- 1 (Process thinking.)

[33]
A flowchart is a diagram that uses graphic symbol to depict the nature and flow of the steps in a process. Also called flow diagrams or process maps.
The first step to process is to define its parameters and identify the basic activities with it:-
(1) Major steps with the process. (2) Who is involved? (3) Purpose of process. (4) Customer and supplier. (5) Inputs and outputs. (6) Start and end points.
2-7.14.3 Level of process:- (1) Macro level (2) Intermediate or mini:- (3) Micro.
2-7.14.4 Flowchart Symbols There are symbols that recognised activities and decisions.
2-7.14.5 Deployment Flowcharts:- Known as integrated or vertical column flow charts, define a
process in more detail, by identifying the role of various participants in the process. Typically activities are shown in a column under who undertakes them.
They must gather information on the process by:-
(1) Observation of the process. (2) Interviewing the participants. (3) Reviewing procedures manuals.
Process flowcharts can highlight improvement opportunities by identifying with:-
(1) Duplication. (2) Unnecessary. (3) Delays. (4) Incorrect sequencing. (5) Complexity: can part of process be shortcut.
[34]
(6) Unclear responsibilities: lack of clarity. (7) Levels of action or decision-making: could actions be carried out by other people, to reduce the number of transactions involved in the process.
2-7.14.6 Flowchart Advantages:- (1) Focus attention on process activity. (2) Provide a valuable training to tool to help people to think in terms of processes. (3) Provides a simple and clear definition of how the work is done. (4) Helps to create consistent work methods. (5) Delineates the scope of the work. (6) Shows customer and supplier relationships (internal and external). (7) Can identify problem areas and improvement opportunities (e.g. , gaps, bottlenecks, inconsistencies, inefficiencies).
2-7.14.7 Flowcharts Disadvantage:- (1) Difficult to incorporate all aspects of a process (e.g. , steps, responsibilities, inputs/outputs, standards) in single flowchart type. (2) May focus attention on minor improvements when in fact a more radical change is needed. (3) Can simply document a poor process, without improving it. (4) May oversimplify if the correct level of detail is not identified. (5) Open to different interpretation, again if the correct level of detail is not use. (6) Needs to be updated as improvements are made.
2-7.14.8 Using flow chart for Process Improvement:- When using flowcharts for to develop process improvements. It is
important to initially document the process as it is, rather than as you like it to be. Flowcharting the process enables it to studied and improved by modifying the various parts of the process. 2-7.15.0 Data and Variation:-
In data and variation, we getting:- (1) How both the outcomes and the inner working of process can be measured. (2) How the necessary data should be collected. (3) How it should be displayed in order to indentify variation.
2-7.15 Measuring Result and Processes
[35]
They give information on:- (1) Current performance and trends over time. (2) Extent to which objectives are achieved. (3) Comparative performance, as an aid to benchmark. (4) Impact of changes. (5) Identification of problem area (6) "What get measure get done" 2-7.15.2 Results: - These are what the process as whole, or the organization as a whole achieves. They are outcomes, viewed from the customer's perspective which demonstrate how well that customer's requirement 2-7.15.3.0 Process:-
These are internal measure which tracks what is going on within the processes themselves. But measure the 'how'. Overall performance can be measured by such thing as customer satisfaction, loyalty, profit, share value, market share and return on capital.
2-7.15.3.1 Process measured as follow aspects:- (1) Speed: how quickly (2) Accuracy: correctly recorded and transmitted to dispatch (3) Flexibility: proportion of special customer requirements that can be met. 2-7.15.3.2. Economy, Effectiveness, Efficiency and adaptability:-
Identifying suitable measures, results and processes, involves consideration of a number of component aspects of customer and other stakeholder requirements. (1) Economy:-
Economy is cost of a resource compared to the value of the resource or input. It can be expressed mathematically as: Amount of input Cost of input
(2) Efficiency:- Efficiency is the amount or value of resource needed to achieve a
specified amount of output. Expressed mathematically it is: Amount of output

[36]
Amount of input
(3) Effectiveness:- Effectiveness is the extent to which customer requirements are met or
exceeded by a given amount of output. Value of output Amount of output Cost of–effectiveness or value for the money (VFM):-
Are sometimes used to capture the '3Es' of Economy, Efficiency and effectiveness. Combining these gives us mathematical formula: Amount of input x Amount of output value of output Cost of input Amount of input Amount of output VFM= Value of output Cost of input
(4) Adaptability:- This fourth component looks at the process from another perspective, that
of its flexibility to meet a range of customer requirements. This relates to how it is to change or adapts the existing process to meet special situations or particular customer requirements.
2-7.15.4 The limitations of metrics:- When seeking to identify suitable metric, apply the following
general rules:- (1) Always keep the purpose of the process – customer requirements – in mind, and ensure that metrics truly reflect these objectives. (2) Relate the metrics to the four component of economy above. (3) Look for a balanced of indicator, rather than a single "perfect" measure. (4) Since every metric has potential flaws, consider all possibilities and select the best (least bad).
2-7.16 Data and its Collections:- The first rule of collecting data is 'never ask a question unless you know what you are going to do with the answer' Data collection must have a clear purpose. Agreed from the outset 2-7.16.1 Some initial definitions: (1) Data: consists of the raw figures, facts and feedback that come from measurement. (2) Information: is data interpreted to give some meaning.

[37]
(3) Knowledge: is information used for a practical purpose. 2-7.16.2 the purpose of collecting data:-
The purpose of collecting data is therefore to turn it into information and knowledge that can be used to generate improvement. Data type:- (1) Hard data. Consist of facts, figures and statics, can be collected one of the form:- (2) Attributes data (3) Variable data: consider the full spectrum of possible results, size, volume, length of time and so forth.
2. Soft Data: consist of perception, opinions and feelings.
2-7.17 Sampling Methods and Techniques:- A potential drawback of some measurement metrics is simply their cost. This cost could be purely financial, or could be represented by a disproportionate use of time or other resource. It may be better simply to check a sample.
When considering samples, we the terms:-
(1) Population: to describe the total number of unit from which we wish to draw a representative sample.
(2) Frame: to describe the proportion of this total that is available for selection.
(3) Sample: to describe those units actually selected for sampling.
2-7.18 Displaying Data: Displaying data is part of the information-knowledge link
highlighted earlier. By displaying the data in one more ways, we make it easier to interpret and to draw information from. Data set: used to describe any set of values that can be analysed by one or more of these methods.
There are examples of common displaying data set:-
(1) Run charts.
(2) Histograms.
(3) Pie/proportion chart
[38]
(1) Run charts: Display points of data over time or sequence.
Time or sequence on (=) x axis. Attribute measured on (=) y axis. Run chart can be used to:
(1) Indicate the spread of data. (2) Show upward and down ward trends. (3) Show unusual patterns, and may be give a clue as to their cause. (4) Monitor the effects of improvement.
(5) Communicate process performance.
(2) A histogram, or bar chart Is used to group data into defined classifications, and to show general features of the data:- A. Illustrate the shape, centre and spread of data. B. Show what the process is capable of producing. C. Help identify causes of variation. Grouped data (in defined classification) on (=) x axis. Frequency's of grouped data on y axis.
(3) Pie charts, proportion charts Grouped data into a number of classifications as same basis as histograms,
but they show these classifications as a proportion of whole picture. 2-7.19 Variation
The achievement is not constant of that target has been set, which shown by data set (displaying data).
The study of this variation, and how and why it occurs, it fundamental to process improvement. And it's one of Deming's System of Profound knowledge.
Deming's thinking on variation that from various causes:-
(1) Common causes. (2) Special causes.
(1) Common causes Common causes are inherently present in the process or system. They
arise from random variability and not attributable to specific incident or action. Variation from common cause can never be totally eliminated, but it can reduce.
Example of common cause might include:-

[39]
(1) Variation in temperature. (2) Variation between different operator performing the same task. (3) Speed of response of it or communications systems. (4) Limitation of the measurement metrics. (5) Differing customer request.
(2) Special causes
Special causes are created by specific changes that have occurred to the system, either temporary or permanent, Or to reduce its effects.
Special cause might include:-
(1) Machinery breakdown. (2) A person absent from work. (3) Failure of a supplier. (4) Misunderstood communication.
Stable process:-
A process from which all special causes of variation have been removed from it.
2-7.19.1 Analysing the variation from common and Special Causes (Control chart)1:-
Control charts were invented by Walter Shewhart they provide a method of analysing data in more detail than can be done simply from run charts and histograms. This help to distinguish between special cause and common causes, hence to identify the correct way to improve the process.
(1) Variable Control Charts(x and R charts):
X and R charts are used to monitor the variability of particular quality characteristic. They are often used together.(both are plotted from the same data) and apply when :
(1) The data are variables (e.g., time, cost, or weight) (2) Each measurement vale is independent of other measurement (e.g., the result of one observation does not influence the next.). (3) The output of the process falls naturally into sub-groups (e.g., sample can be taken over a defined time interval). 1 (Process thinking – Model)

[40]
(2) Individuals and Moving Range charts:-
Individual's charts are used:-
(1) The data consist of variables. (2) Values occur singly (e.g., daily, or annual figures) and do not naturally fall
into sub-groups.
(3) Attributes charts
Attributes charts are built from values based on count, where the data falls into one of two defined categories.
(1) P charts
P charts are used when each value in a sample can be classified as either conforming or not conforming to particular characteristic.
They apply when:-
(1) Each sub-group comprise distinct items (the number of items in each sub-group may vary). (2) Each item can be classified as either conforming or not conforming to specific requirement.
(3) The classification of each item is independent of other items in the sub-group.
(2) C and U charts: C and U charts are used to count the number of occurrence of a specified event
or nonconformity over specified area of opportunity.
This area of opportunity could be a defined amount of product, a specified period of time, or an area of space.
C chart will apply when:
(1) The number of occurrence is very large (potentially infinite)
(2) The area of opportunity is fixed and clearly defined. (1) The probability of an occurrence at any particular spot or point in time is very small. (2) Each area of opportunity is independent of other.
U charts are similar to c charts; expect that area of opportunity can vary. Each area of opportunity must still be clearly defined.

[41]
(4) Process Capability:- Process capability reinforces this link by drawing a relation between control limits and customers requirements. It compares the upper and lower control limits with what process is expected to deliver from a customer perspective.
The process capabilities mathematically are:-
Cp = USL-LSL/6s
Which
USL is the upper specification limit, LSL is the lower specification limit, and s is an estimate of the process standard deviation.
A process is said to be capable if it is in control, and its spread of individual values falls between the upper and lower specification limits. Process that are capable will have a Cp greater than or equal 1. Process that is not capable will have Cp value less than
(5) The spread
The spread of a data set is used to describe the magnitude of variation between the values of that data set. Analysing variation with reference to this magnitude is key to the principal of using control charts. There are two common definition of spread:-
(1) Range (R). (2) Standard deviation(s). (3)The Range (R):
The difference between the highest and lowest values in sample. (1) Standard deviation :
Average deviation of individual values from the overall mean.
(6) Control charts:-
There are various forms of control charts, but all share a similar
format and decision basis.
2-7-20 Process improvement techniques

[42]
In this terms we now examines how to identify the cause of variation, and how to apply these and other techniques to improving processes
Basic elements of process improvement:-
Analysis data and identify variation both from common causes can be applied to any process.
Ease improvement relates to:
(1) Amount of time (2) Effort.
Basic Improvement Tools Techniques:-
The main improvement techniques are:- (1) Flowcharts. (2) Data Display Methods (3) Control charts
Others point of improvement:-
(1) Cause and effect diagrams. (2) Brainstorming. (3) Segmentation (Stratification) (segmentation of data). (4) Pareto Analysis. (5) Scatter Diagrams. (6) Standardisation.
2-7.21 Leadership and Team Working
Leadership and team working looking for:- (1) The need to involve and motivate all employees in improvement. (2) The role of teams, and of leadership within teams. (3) How teams can be developed.
2-7.22 A framework for Improvement:-
An organization with a truly effective process management approach will have:-
(1) A clearly defined framework of processes for the organisation.

[43]
(2) A sound method of identifying customer requirements, both external and for the processes that will deliver those results.
(3) Leadership roles which include process ownership responsibilities. (4) A strategy for continuously improving processes at all levels.
[44]
PSYCHOLOGY AND THEORY OF KNOWLEDGE
2-8.0 MANAGING YOURSELF1: By managing yourself you will be able:-
(1) Determine your own learning preferences. (2) Discus the value of the concept of personality in understanding
yourself and others. (3) Understand the importance of the effective communication in
personal and organisational success. (4) Start to assess your own resources and future needs and wants in
gaining 'mastery'. (5) Begin to keep a learning Journal.
2-8.1 Determine Your Own Learning Preferences.
(1) Kolb' theories Kolb identified four different in the way we learn (Kolb's learning
theories is a process of whereby knowledge is created through the transformation of experience ):-
(1) Concrete Experience (CE) – learn by active involvement in doing new task, willing to try anything new.
(2) Reflective observation (RO) – learn by observing others then thinking about their observations in a considered way.
(3) Abstract Conceptualisation (AC)– learn through use of models, theories , and concept from which they derive meaning and structure out of seeming confusion.
(4) Active Experimentation (AE) – Enthusiastic in trying out new ideas and putting learning into practice.
These preferences are linked to the four phase of kolb's learning Cycle: -
(1) Have an Experience. (2) Think about. (3) Draw conclusions from it. (4) Plan to test conclusion. As following diagram (2):- 1 (Human factors In Quality Management – Module 1- page 11)

[45]
Diagram number (2)
(2) Honey and Mumford describe the following four styles
Learning styles were developed by Peter Honey and Alan Mumford, based upon the work of Kolb, and they identified four distinct learning styles or preferences
(1) Activist. (2) Theorist (3) Pragmatist (4) Reflector.
These are the learning approaches that individuals naturally prefer and they recommend that in order to maximize one's own personal learning each learner ought to:
(1) Understand their learning style. (2) Seek out opportunities to learn using that style.
To understand your particular learning style Honey and Mumford have developed a Learning Style Questionnaire and with this information you will be in a far better position to do three really useful things [quoting P. Honey]:
(1) "Become smarter at getting a better fit between learning opportunities and the way you learn best. This makes your learning easier, more effective and more enjoyable. It saves you tackling your learning on a hit-and-miss basis. Equipped with information about your learning preferences, you'll have many more hits and fewer misses."
Have an Experience
Think about
Draw conclusions from it
Plan to test conclusion
[46]
(2) "Expand the 'band width' of experiences from which you derive benefit. Becoming an all-round learner, increases your versatility and helps you learn from a wide variety of different experiences - some form
(3) al, some informal, some planned and some spontaneous." (4) "Improve your learning skills and processes. Increased awareness
of how you learn, opens up the whole process to self-scrutiny and improvement. Learning to learn is your most important capability since it provides the gateway to everything else you want to develop."
Characteristics
The characteristics of the four learning styles are summarized in the following .
(1) Activist : have attributes and activities as following:- (1) Attributes: Activists are those people who learn by doing. Activists need to get their hands dirty, to dive in with both feet first. Have an open-minded approach to learning, involving themselves fully and without bias in new experiences. (2) Activities: (1) Brainstorming. (2) Problem solving. (3) Group discussion. (4) Puzzles. (5) Competitions. (6) Role-play.
(2) Theorist: have attributes and activities:-
(1) Attributes:-
These learners like to understand the theory behind the actions. They need models, concepts and facts in order to engage in the learning process. Prefer to analyse and synthesise, drawing new information into a systematic and logical 'theory'.
(2) Activities:-
(1) Models.
(2) Statistics.
[47]
(3)Stories.
(4) Quotes. (5) Background information.
(6) Applying theories.
(3) Pragmatist:- have attributes and activities as following:-
(1) Attributes:
These people need to be able to see how to put the learning into practice in the real world. Abstract concepts and games are of limited use unless they can see a way to put the ideas into action in their lives. Experimenters, trying out new ideas, theories and techniques to see if they work.
(2) Activities:-
(1) Time to think about how to apply learning in reality. (2) Case studies.
(3) Problem solving. (4) Discussion.
(4). Reflector: also have attributes and activities:-
(1) Attributes:
These people learn by observing and thinking about what happened. They may avoid leaping in and prefer to watch from the sidelines. Prefer to stand back and view
(b) Activities:
(1) Paired discussions (2) Self analysis questionnaires (3) Personality questionnaires (4) time out (5) Observing activities (6) Feedback from others (7) Coaching (8) Discus the value of the concept of personality in understanding
yourself and others.
[48]
(9) Understand the importance of the effective communication in personal and organisational success.
(10) Start to assess your own resources and future needs and wants in gaining 'mastery'.
(11) Begin to keep a learning Journal.
2-8.2 Notions of Management1
(1) Notions of Management
'like architecture or aerodynamics, a body of well-defined principles applied by well-versed practitioners'2 (Heller 1995).
"set of ongoing human relationships utilising various technologies in which people co-operate to achieve tasks which would otherwise not possible, either at all or from an equivalent resource base.' (Watson, 1995)
The vital words on above definitions are:
(1) Human relationships. (2) People co-operate
Understand some radical review " it is now going to be even more important for companies to tell their employees why they are there. They need to feed they are contributing to something." (Kaplain,2001).
"an organization is only the people in it"1.
(2) Management and Management of Change2:-
It often appears that organisations reach out for the latest quick fix in management thinking as following:-
(1) Total Quality Management (TQM). (2) Quality Circle. (3) Business Process Re- engineering (BPR). (4) Team- building and Empowerment.
All have been and are touted as answer to the a line organisation's problems.
1 (Human Factors In Quality Management – Module 1) 2 (Heller 1995).

[49]
Business Process Engineering:- for example , was an approach to raising the efficiency and effectiveness of business through seeking cost saving and this was all too rapidly taken to mean cutting the number of employees.
(Programmes set out to create so-called) Total Quality cultures:-
All "thinking and little feeling (as scientific model). From which all non-vale added activity was to be eliminated. To do this they used systems-engineered processes, with systematic and logical steps, the initiatives attempted to drive: -
(1) Cost out of production. (2) Speed up lead time. (3) Enhance the customer-supplier interface. (4) Generally refresh cultures which had been too slowly reacting to
realities of tough trading conditions. (5) Maturity and saturation of markets.
Disadvantage:
(1) Inadequate planning and pre-emptive activity. (2) The recurring finding was that not enough time had been spent up
front considering people issues. (3) Precious little time given to thinking through a strategy of
communication the change.
"In appropriate circumstance, where inspired by a vision of the future and when properly used, BPR can represent a useful element of a corporate transformation programme or business excellence model.(Coulson-Thomas)
"Re-engineering promise fundamental change. It is therefore, of direct concern-personally, professionally and economically – to allthose working in that business. As BPR means rethinking the way in which is done, clearly those who do that work have a right and expectation to be consulted, informed and involved in that change '3.
1 (Wickens 1995). 2 (Human Factors In Quality Management – Module 1 – page 30) 3 (Evans 1994).

[50]
All organization survive and grow by changing :
(1) Constantly re-inventing themselves. (2) Improving quality to respond to the prevailing trends of politics. (3) Economics. (4) Technical. (5) Social factors. Those that don't, simply die.
(3) The Management and Leadership1
"Management is about the organisation and development of resources, where as leadership is about getting people to do what you want them to do because they want to do it for you"2 .
FALA attempts to prove that leaders can be:-
(1) Trained. (2) Some inborn quality nor situational.
The three interlocking circle model:
Has become an icon of modern management education. Again it reflects a systematic logical approach, long on thinking and short on feeling.
John Adair developed his three circles approach to leadership at the Royal Military Academy at Sandhurst during the 1970's. He observed what effective leaders did to gain the support and commitment of the followers. His model is important for two reasons: it's simple, so is easy to understand and apply, and he was one of the first to look at effective leadership from the point of view of those being led.
The Three circles
John Adair found that effective leaders pay attention to three areas of need for members of the team: those relating to the task, to the team itself, and to individual members of the team. At any time, the emphasis on each circle may vary, but all are interdependent and so the leader must watch all three:-
1 (Human Factors In Quality Management – Module 1 – page 33) 2 (Wickens , 1995)
[51]
(1) Task: - Task needs include setting a clear goal and objectives, and organization and management of the process.
(2) Team: - Team needs are things like effective interaction, support, shared work and communication within the team and with other teams.
(3) Individual: - Individual needs will of course vary from person to person, but the effective leader will pay attention to, and deal with, how each person is behaving and feeling.
The three circles model is nowadays seen as rather basic, especially by managers who want to be considered sophisticated and up-to-date. However it's a good approach to learn early in your leadership career, providing a solid foundation for more complex human relations.
'There are dozens of models of management but the truth is that, to be successful, managers must both manage and lead. Leaders, also, must be able to manage, or at least be surrounded by people who can. A manager who cannot lead is a waste of apace and money"
For Stephen Covey
In sum, the term 'leadership' in so far as it relates to 'management' lends another element to our understanding of how and why organisations survive and grow. That:-
(1) Understanding of how and why organisations survive and grow.
Covey,(1992)
'Management is a bottom line focus: How can I best accomplish certain thing? Leadership deals with the top line: What are the things I want to accomplish ? Management is efficiency in climbing the ladder is success; Leader determines whether the ladder is learning against the right wall' that :-
(1) 'Management is a bottom line focus: How can I best accomplish certain thing?
(2) Leadership deals with the top line: What are the things I want to accomplish?
(3) Management is efficiency in climbing the ladder is success.
[52]
(4) Leader determines whether the ladder is learning against the right wall'.
Covey,(1992:102)
'Efficient management without effective leadership is, as one individual has phrased it, "like straightening deckchairs on the Titanic." Gaining that:-
(1) Efficient Management must have effective leadership.
(4) Management and Communication1:-
The most effective communication never ignore the:-
(1) The feeling element.
2-8.3 Managing Others:-
Managing other consists of:-
(1) Concepts of individuals in groups, group dynamics, group structure, team and teams working.
(2) Compare and contrast models of motivation.
(3) Review conflict theory as an aid to understanding human aspects of quality management.
2-8.4 Team and Team Effectiveness
Critical Success Factors (CSF) & Characteristics of high Performing Teams:-
Simply put, a Critical Success Factors (CSF) is any factor that is vital to the success of something.
Team phase:-
The research and observers of team have all noted a 'life-cycle' of team development, when the team comes together or given task. Team theories suggest that teams appear to go through a series of phases before they become really productive or reach their goal. Researchers 1( Human Factors In Quality Management – Module 1)

[53]
have identified five key phases that have been described in a variety of ways, as follows:
(1) 1st Phase:
Team Getting started. Also called the 'initiation phase, the 'awareness' phase, the immature or 'forming' phase, these terms convey well what is happening in the team during this part of a team's work. The team comes together to define the task in broad terms and to identify the resources at its disposal. A sense of confusion may prevail at this stage.
(2) 2nd Phase:-
Team are going on circles. Also known as the 'ideation', 'fractional' or 'storming' phase, this stage of a team's work is typified by generation of ideas and approaches to tackle the task.
(3) 3rd Phase:-
Team are getting on Course. You'll recognise when this phase occurs in a team's work because at this stage: -
(1) Conflict are examined and resolved.
(2) Plan developed for achieving the goals.
(3) Also referred to as the ' elaboration', 'Co- operation', 'sharing' or 'norming' phase.
(4) 4th Phase:-
Team works with full speed ahead. By this stage in team's work cycle, plans have been evaluated, one has been selected, the work is performed and the task is seen through to completion. So you won't be surprised to learn this phase is called by some 'completion', 'productivity', performing', or 'effective'.
(5) 5th Phase:
This final phase is often paid the least attention. This is especially so in organisation where the matrix management of project team is common.
2.8.5 Leadership

[54]
The new view of leadership in learning organisation centres on subtler and more important tasks. In learning organisation, leader are designers, stewards, and teachers. They are responsible for building organisation where people continually expand their capabilities to understand complexity, clarify vision, and improve shared mental models that is, they are responsible for learning.
2-8.6 Learning about learning
Here we must look at:
(1) Outline key concepts in the learning.
(2) The features of organisational learning, the learning organisation and action learning.
2-8.7 Training and Development1
(1) Education
A formal (planned) and informal process of acquiring, knowledge, skills, and behaviours, moral values and understand which equip with the conditions essential, to live all aspects of their lives in their society. It is broad in scope and takes place over an extended period of time a variety of situations.
(2) Training
A mostly formal process of acquiring skills, knowledge and behaviours with the aim of achieving effective performance in a specific activity or range of activity, It is narrow in scope and takes place over a limited period of time in certain situations.
(4) Development:-
A formal (planned) or informal process of realising and growing the abilities and potential of individual adults groups not necessarily to a specific activity or range of activities, it is broad in scope and may take place over an extended period of time in a variety of situations.
The systematic Approach to Training:-
1 ( Human Factors In Quality Management-Module1-page81)
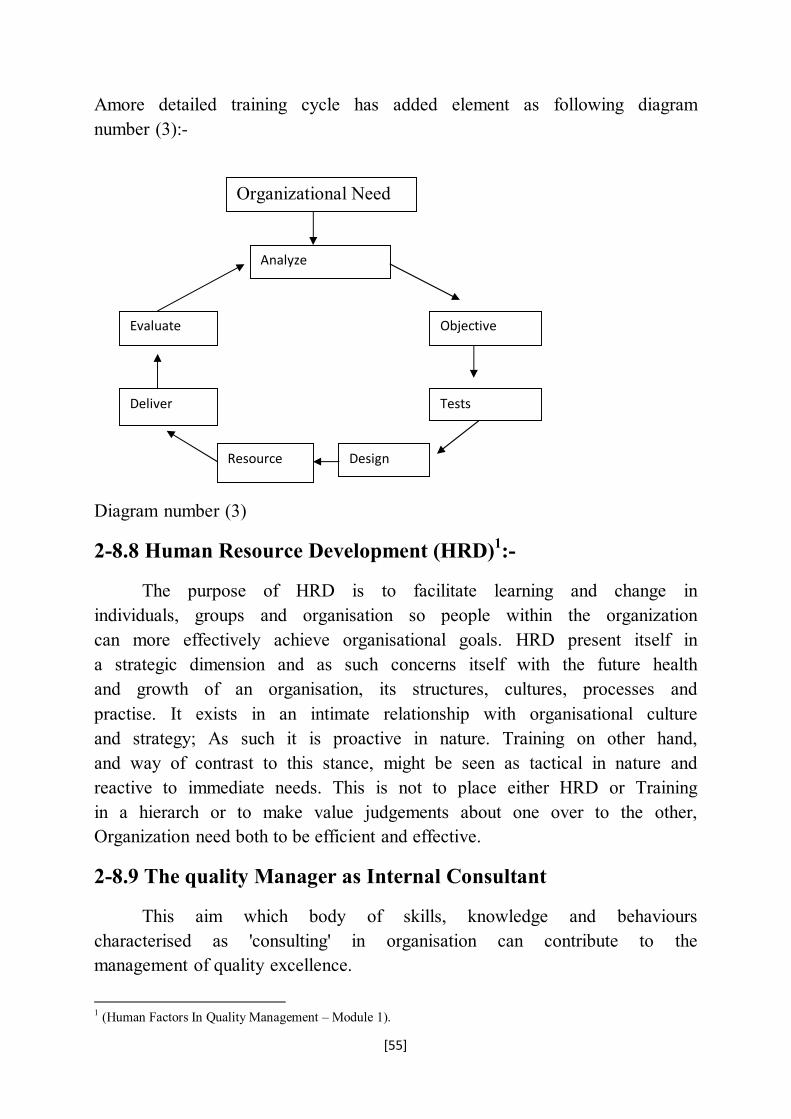
[55]
Amore detailed training cycle has added element as following diagram number (3):-
Diagram number (3)
2-8.8 Human Resource Development (HRD)1:-
The purpose of HRD is to facilitate learning and change in individuals, groups and organisation so people within the organization can more effectively achieve organisational goals. HRD present itself in a strategic dimension and as such concerns itself with the future health and growth of an organisation, its structures, cultures, processes and practise. It exists in an intimate relationship with organisational culture and strategy; As such it is proactive in nature. Training on other hand, and way of contrast to this stance, might be seen as tactical in nature and reactive to immediate needs. This is not to place either HRD or Training in a hierarch or to make value judgements about one over to the other, Organization need both to be efficient and effective.
2-8.9 The quality Manager as Internal Consultant
This aim which body of skills, knowledge and behaviours characterised as 'consulting' in organisation can contribute to the management of quality excellence.
1 (Human Factors In Quality Management – Module 1).
Organizational Need
Analyze
Objective Evaluate
Tests Deliver
Design Resource
[56]
2-8.10 Organizational Development and Change1
Here can focus in:-
(1) Discuss definitions of culture.
(2) Critically evaluate the value of cultural typologies.
(3) Review aspects of organisational structure.
(4) Analyse approaches to managing culture and managing change.
1 (Human Factors In Quality Management – Module1-page 97).

[57]
2-9.0 TOTAL QUALITY MANAGEMENT
At chapter two we now some definition on total quality management, and here some concept of total quality management as:-
Some of core aspects of TQM that you were asked to identify should include:1
(1) Satisfying the customer. (2) Top-level commitment. (3) Continuous improvement. (4) Everyone committed and involved. (5) Prevention of errors. (6) Best use of resources :
(1) Human. (2) Material.
(7) Minimising costs. (8) Measurable results. (9) Benefit to employees and society. (10) Supporting systems, tools and techniques.
2-9.1 Principles of TQM2:-
Seven Element of TQM:-
(1) Approach – management led.
(2) Scope – company – wide.
(3) Scale – everyone responsible.
(4) Philosophy – prevention not detection.
(5) Standard – right the first time.
(6) Control – cost of quality.
(7) Theme – Continuous improvement
1 (Total Quality Management, Model 5) 2 (Total quality Management – Modules 5-page 2)

[58]
2-9.2 Core Principles of TQM:-
(1) Customer satisfaction.
(2) Continuous improvement.
(3) Commitment of the entire workforce.
(1) Customer satisfaction.
It can be argued that any organization should seek:
(1) To satisfy customers.
(2) To achieve higher customer satisfaction than it competitors.
(3) To retain customers, even if they complain. See diagram number ( 4 ) Customer –Driven Quality Cycle1
Measurement and feedback
See diagram number ( 4) Customer –Driven Quality Cycle 1 ( Total quality Management – Modules 5- page32)
Identification of customers needs
Product/service specification
(Design quality)
Output
(Actual quality)
Customer perceptions
(Perceived quality)
[59]
(2) Continuous improvement
Continuous Improvement is a sustained effort to align the performance of an organization with its promises; the promise made to its customers, itself and its employees.
A key principle of TQM is that improvement should never end.
Some Tools and Techniques for Continuous Improvement:-
(1) Project management.
(2) New product life cycle.
(3) Process planning.
(4) Flowcharting.
(5) Benchmarking.
(6) Business process re-engineering.
(7) Problem solving.
(8) Design of experiments (Taguchi).
(9) Quality function deployment.
(10) Quality policy deployment (Hoshin Kanri)
(11) Quality circles.
(12) Reduction of variation.
(13) Pareto diagrams.
(14) Case and effect diagrams.
(15) Stratification.
(16) Histograms.
(17) Scatter diagram.
(18) Control charts.
(19) Failure mode and effects analysis.

[60]
(20) Brainstorming.
(21) Critical success factors.
(22) CAD and CAE.
2-9.3 Total quality management culture:-
(1) Profit comes after customer satisfaction.
(2) Emphasis on prevention.
(3) Values people.
(4) Cost containment by improving system.
(5) High investment in people.
(6) People lead systems.
(7) Clear and articulated corporate direction.
2-9.4 Key Elements of TQM
(1) Quality awareness.
(2) Management leadership.
(3) Organising for quality improvement.
(4) Creating participative environments.
(5) Training for quality improvement.
(6) Involvement of every function at all levels.
(7) Customer and supplier involvement.
(8) Problem prevention and solving.
(9) Statistical process control.
(10) Measurement of quality performance.
(11) Recognition for achievement.
(12) Continuous improvement.

[61]
2-9.5 Benefits of TQM:-
The benefits of TQM include:-
(1) Reduce costs.
(2) Quality match to the end customer's requirements.
(3) An empowered workforce.
(4) Shared responsibility for success.
(5) A marketing advantage.
(6) A customer-driven organisation.
(7) Meeting the competition.
2-9.6 The Quality Gurus
Take note of the unique message of all the quality gurus in considering introducing total quality management to any organization. There are contradictions between guru approaches. But many common features to purpose build a TQM programme for organizations.
2-9.7 Relationship OF TQM to Classical Management Theories1
Classical Management:-
Classical management is based on the concept that manger:-
(1) Plan.
(2) Organise.
(3) Co-ordinate.
(4) Command.
(5) Control.
(1) Plan:-
Here the managers produce a plan of action which focus a plan of action which focuses on the nature, priorities and current condition of 1 ( Total Quality Management –Module 5-page 166-167)

[62]
business. For effective planning, manager should know how to deal with people, be competent in the requirement of the business and be able to demonstrate business and be able to demonstrate business experience.
(2) Organize:-
Managers have the authority to use resources, both material and human, to meet the plan.
(3) Co-ordinate:-
Managers determine the timing and sequencing of activities so that they interact effectively. They allocate the appropriate of resources, determine priorities and adapt whatever has to be changed to meet the end objective.
(4) Command:-
The managers function through the formalized company hierarchical structure. They eliminate the incompetent.
(5) Control:-
The managers ensure that everything occurs according to the plan. They take appropriate corrective action when required. They check for weaknesses, errors and deviation from the plan.
2-9.7.1 Scientific Management
Taylorism 'his ideas were accumulation of his life's work , his main motivation was to increase productivity so that workers could earn a decent wage'1.
Toylor's four main principles were:-
(1) Each part of an individual's work is analysed scientifically, to obtain the most efficient way of doing the job.
(2) The most suitable person to undertake the job is chosen scientifically and taught to do the job in the exact way devised.
1 (Total Quality Management – Module 5 – page 167)

[63]
(3) Mangers must co-operate with workers to ensure that the job is done in the scientific way.
(4) There must be a clear division of work and responsibility between management and worker. Managers are planning and supervisor, workers are carrying it out.
[64]
SECTION (2): 2-1.0 PERFORMANCE MEASURE ORGANIZATION
Every organization should measure, monitor and analyze it performance. Performance is defined as an accomplishment of a given task measured against preset known standards of accuracy, completeness, cost and speed1.
Performance measure is a complex issue that normally incorporate at least four disciplines: (1) Economics. (2) Management. (3) Accounting. (4) Information technology.
The idea of using different measures as a way of getting a better apperception of performance is what organizations have tended to do. They adopted a range of measurement that give a commensurate range of indications of performance.
2-1.1 Performance Measure Organization from 'Integrated system for performance' perception:-
Integrated system for performance is a model incorporates key dimensions of performance of the institution, including helping to link the goals activities that are exercised in accordance with the standards of quantitative
The most important characteristics of it:-
(1) Comprehensive. (2) Integrated. 3. Balanced. (4) Objectivity. (5) Oriented goals. (6) Interconnected.
The critical elements of a good performance: - are Leadership and commitment, good planning and a sound implementation strategy, appropriate employee involvement, Simple measurement and evaluation and Control and improvement2
1 (Bierbusse & Siesfeld, 1997) 2 Professor Shamboul Adlan (lecture)

[65]
2-1.2 Performance Measure Phases1:-
It is possible to analysis performance measure to following stages:-
(1) Identify organization's goals:-
Performance measures regarding with compare organization performance and its goals, so organization purpose and goals, it is the basis to evaluate performance process as general, and select appropriate tools and methods for performance measure.
The organization purpose and goals most be clear and accurate (also smart).
(2) Select appropriate criteria for performance measure
(2.1) identify qualitative criteria:- Means, the selected criteria affect on decision output systems of economic unit or organizations that need to measure and evaluate.
(2.2) Identify Nature of criteria:- Indeed the criteria are different in its nature, as they are:-
(1) Qualitative criteria.
(2) Quantities criteria. (2.3) Extraction criteria:
Means that selection of appropriate criteria for performance measure of economical units or parts and organization, and that complete with sort criteria for performance measure, and identify scoring according to related identify goals.
(3) Measure and extraction performance's results:-
Through this stage, the performance measure is complete according reached through selected criteria otherwise it was quantities or qualitative.
Other opinion phases are2 Identify the process flow, Identify the critical activity to be measured, Establish performance goal or standards, الیهلول محمد صالح العیاط –مدى استخدام جهاز الرقابة الشعبیة لمؤشرات تقییم االداء في تقییم أداء الشركات العامة الصناعیة ) 1 ) 2 Internet (Trade)
[66]
Establish performance measurement, Identify responsible party, Collect data, Analyze/report actual performance, Compare actual performance to goal, Are corrective actions necessary?, Make changes to bring back in line with goal, Are new goals needed?
2-1.3 Measure Organization From 'Financial Analysis Perception':-
The financial analysis consists of four elements or criteria1:-
(1) Financial situation.
(2) Financial evaluation.
(3) Financial planning. (4) Financial Control.
(1) Financial situation:-
Financial analysis of organisation's current situation focuses on
(1) The effectiveness of current strategies.
(2) And looks at trends and comparative data from inside the business and external to the business.
(2) Financial evaluation:- Financial strategic evaluation involves analysis of the likely impact of:-
(1) Different strategies.
(2) Their costs.
(3) Benefits.
(4) Financial risks associated with them.
(3) Financial planning:-
Financial planning provides:-
(1) Budgeting information supporting implementation.
(4) Financial Control:- 1(Holistic Performance Measurement & Balance Scorecard –Module 2-page 31)
[67]
Financial control looks at:
(1) Compares actual and planned results in order to (2) Help managers maintain direction.
2-1.4 Performance Measurement and the Public Sector
In 1987 Moss and Summers observed that not-for-profit organisation:-
"have defined themselves not around their financial return, but around their mission, or the service offer. And service, of course, is notoriously intangible and difficult to measure. The clients receiving them and the professionals delivering them may make very different judgements about their quality, and donors may hold still another standard. And "doing good" is a matter of social values about which there may be little or no consensus. It is this factor, the centrality of social values over financial values, that complicates measurement for non-profit organizations"
Here we understand the purpose of performance measure in the public sector.
The Accenture (2005) study also identified what they called five roadblocks to progress on developing performance management systems in American states:-
(1) Executive have not found a clear, comprehensive way to measure value.
(2) The supporting measurement technologies are not in place for effective performance management.
(3) Gaining legislatives support is challenging.
(4) A fundamental lack of understanding of the concept of performance management and inadequate management skills impede progress.
(5) When they do develop performance information, political realities sometimes prevent executives from using it.

[68]
Bruijn (2002) identified a significant risk of performance systems harming public sector organizations effectiveness. He identified the risks of performance measurement:-
(1) Prompting game playing.
(2) Increasing bureaucracy.
(3) Blocking innovation and ambition.
(4) Focussing on the easy-to-measure over the important-to-measure.
(5) Killing system responsibility, by discouraging cooperation among organization, and
(6) Sometimes punishing good performance by taking resources from efficient producers to deal with inefficient producers.
2-1.5 The Balance Scorecard
The balanced scorecard is widely in public and not-for-profit sectors as a way of implementing strategy measuring performance suited to a multi-stakeholder environment, as we know public and not-for-profit organizations use many stakeholders.
Niven (2003) and Kaplan and Norton (2004) set many example for the US and UK public and not-for-profit sectors. There are five approach that summarise its application1:-
(1) The original Kaplan and Norton framework.
(2) Customer primacy.
(3) Strategic themes.
(4) Splitting themes.
(5) A mixture of the above.
(1) The original Kaplan and Norton framework:-
(See section 2 balance scorecard four perspectives)
(2) Customer Primacy 1 (Holistic Performance Measurement & Balance Scorecard –Module 72.)
[69]
The commonest approach appears to be placing the customer perspective as the ultimate result, and place the financial as an enabler and reflect the manager's and other stakeholder's believes that type of organization are special. The following are the structure and logic of public, or not-for profit sector, balance scorecard:-
(1) Setting out to acquire and maintain sufficient resources.(Measured in the...Financial perspective)
(2) Enables the achievement of, mainly intangible. (Targets measured in the ...Learning and Growth Perspective)
(3) Leading to the development of superior..Internal Processes)
(4) That delivers results for users and other stakeholders, (measured in the...Customer Perspective)
That are the ultimate reasons for the organization existing
The dangers here the critical role that strategic finance plays in generating long term and short term cash to run the organization and deliver its mission.
(3) Strategic themes
An approach sometimes adopted in public sector and not-for-profit organizations, places achievement of the organization's mission as the ultimate result and identifies the cause and effect links that lead to the mission via the four perspectives. This approach adopted by Kaplan and Norton (2004) as making strategic based on "strategic themes".
(4) Splitting the customer Perspective
This is to split customer perspective into direct customers/users and stakeholders. This reflects the situation in organizations which have stakeholders who judge the organisation's performance.
(5) Mixture
The mixtures of all the preceding ideas to create tailored scorecard by changing priorities of perspectives or joining perspectives is the fifth approach.
[70]
2-2.0 quality Management Systems and Excellence Models
On this part of section we are going to study the performance measure organizations through excellence model and quality management systems, and concentrate on balance scorecard as comprehensive performance measure method, and through think and link on other method or standard.
2-2.1 Excellence Models Each of the three main excellence models seek to define the
fundamental principle of excellence on which on which they are based. Systematic activities:- mean organised activities to achieve the company's mission (objective) that are lead by strong management leadership and guided by established clear mid- and long term vision and strategies as well as appropriate quality strategies and policies. Excellence1:- The principles and techniques that as parts of excellence and which traced through different stage as following:- (1) Inspection. (2) Quality control. (3) Process control. (4) Quality assurance. (5) Total quality management. (6) Business Excellence. In this parts of research we are going to concentrate two models, which provide the principles of Excellence that led to main standard criteria to performance measure of performance measures organizations, that:-
(1) The balanced scorecard.
(2) EFQM Excellence model.
Other models
Other model can be broadly be grouped into the following categories2:-
1 (Business Excellence -Model 8) 2 (Business Excellence-Module 8-page30-31)
[71]
(1) National or regional awards that encompass excellence principles. (E.g. the Deming Prize (Japan), the Malcolm Baldrige, the EFQM Excellence Model (Europe), the balanced scorecard)
(2) Other national or regional awards that promote particular aspects of quality. (E.g. ISO series)
(3) Internationally recognised quality standards (e.g. ISO standards).
(4) Generic improvement method, often used internationally, but not necessarily with any associated recognition scheme or standard.
A wide variety of methods could be cited in this last category, from simple quality improvement tools to advanced statistical methods. Example include:-
(1) Business process reengineering.
(2) Statistical process control.
(3) Benchmarking.
(4) Process mapping.
(5) Kaizen.
(6) Failure mode effects analysis.
(7) Supply chain management.
(8) Hoshin planning.
(9) Knowledge management.
(10) Quality costs.
2-3.0 . The Balanced Scorecard:-
The balanced scorecard developed by a professor of accountancy, Robert S. Kaplan and a management consultant, David Norton. It was envisaged a way of making managers consider performance from arrange of perspective. It has evolved into a tool for strategy implementation that is used by organizations to identify and exploit those things that help them achieve their goal outcome goals.

[72]
The idea of using different measures as a way of getting a better apperception of performance is what organizations have tended to do. They adopted a range of measurement that give a commensurate range of indications of performance.
Why the balanced scorecard a measurement framework:-
Because it offers:-
(1) A way aligning financial and non financial measures.
(2) A way for managers to understand what drive value in their business.
What balance meaning:-
The balance on 'balanced scorecard' refers to balance between:-
(1) Financial and nonfinancial measures. (2) External shareholder measures and internal operational measures. (3) Short and long term objective. (4) Leading measure of future performance and lagging outcomes of
performance, and (5) Quantitative objective measures and qualitative information on
processes that deliver outcomes.
2-3.1 The Balance Scorecard Perspectives1:-
The original balanced scorecard introduced four perspectives on performance measure as following:-
(1) Financial perspective.
(2) Customer perspective.
(3) Internal business process perspective.
(4) Learning and growth perspective.
(1) Financial Perspective2:-
It give primacy on scorecard because its ultimate results of organization and important as eyes of organization' strategies 1 (Holistic Performance Measurement & Balance Scorecard –Module 2-page 44) 2(Holistic Performance Measurement & Balance Scorecard –Module 2-page 45)

[73]
stakeholders, who focus on wealth creation. If the organization (strategy and implementation) delivering Financial result, then the measures used the above role accountancy and Financial analysis.
Financial objectives from overall strategies, what it depend on the overall objectives and its stage in business life-cycle as:
((1)Financial perspective (2) Internal business perspective (3)Innovate and learning perspective (4)ustomer perspective.(2 . 4.) ).
As the business matures and the different strategies pursued, three financial themes strategies drive the business strategies . (Kaplan and Norton) these themes are:-
(1) Revenue growth and mix:-
Expanding products and markets maximize the mix from low margin to higher margin and altering pricing policies to optimise revenues and profit.
(2) Productivity reduction and cost reductions:-
Reduce direct and indirect cost as well as sharing resources and therefore costs to improve cost base. (3) Asset utilisation and investment strategy:-
Reduce working capital, improve asset utilisation to increase returns on assets.
Also the risk to the business comes under the financial perspective, and may reduce overall risk by:-
(1) Altering the goal or;
(2) Substituting a new one.
(2) Customer Perspective1:-
The customer perspective care about performance through:-
(1) Company's customers what help managers to makes outside organization' values and inside only cost.
1(Holistic Performance Measurement & Balance Scorecard –Module 2-page 47)

[74]
(2) Market segments.
Also with some variation across range of organizations, Kaplan and Norton in 1996 identify two group of measures as:-
(1) 'Core measurement group'. (2) Customer value proposition.
(1) 'Core measurement group':-
Consist of five and to be measured in relation to the company's target customers:-
(1) Market Share. (2) Customer retention. (3) Customer satisfaction. (4) Customer acquisition. (5) Customer profitability.
The diagram number (5) represents the customer core measurement group and it relations by arrow:-
Diagram number (5) core measurement group and it relation
(2) The customer value proposition:-
The value that satisfies customers and win their loyal is keys to what companies create to delivers.(Kaplan and Norton).
Customer acquisition
Customer profitability
Customer retention
Market share
Customer satisfaction
[75]
Also on (1990b) they break down the value proposition to three parts as following:-
(1) Product and service attributes what appointed:-
(1) The functionally of the offering. (2) With its price. (3) Quality. (4) Timing.
(2) Relationship:-
Consist of or About:-
(1) How the offering is delivered to the customer.
(2) Response.
(3) Delivery times.
(4) How customer feel about the company.
(3) Imagine and Reputation:-
Reflect the intangible factors attracting customer loyalty, how that:-
(1) The imagine is encapsulated in the company' brand
(2) How it project its brand.
(3) Lead their customer by positing their brand (appeals their target customers)
(3) The Internal Business Perspective1
Internal business process model represent by Kaplan and Norton 1996b has three parts as following:-
(1) Innovation processes:-
Process or activity to identify:-
(1) Market. (2) Customer preference. (3) Design the product or services that deliver values.
1 (Holistic Performance Measurement & Balance Scorecard –Module 2-page 48)

[76]
(2) Operations processes: -
Sequences of activities from order receipt (or issues from production control or department) to production assembly workshop or plant to deliver existing customer's value to existing customer of that value and markets.
(3) Post sales services process:-
Post sales services processes are the payment, after sales service, warranties and repair activities of the business.
(4) Learning and Growth Perspective1:-
Cover how organization learn and grows to enable it to deliver on other three perspectives, it designed to focus the organization's managers and stakeholders on its investments in developing the capability of their staff and their systems. Kaplan and Norton identified some common factors that organization measured, these are:-
(1) Employee capabilities.
(2) Information system capabilities.
(3) Motivation, empowerment and alignment.
(1) Employee capabilities:
For staff participate and focus customer satisfaction, staff need the skills and knowledge to do more effectively, Kaplan and Norton identified a core measurement group of three outcomes measures as:
(1) Employee satisfactions, (2) Employee retention, and (3) Employee productivity.
The three above suggested are linked as shown in diagram (6)
1 ( Holistic Performance Measurement & Balance Scorecard –Module 2-page 50)

[77]
Core measurements
Enablers
Diagram (6) linked for core measurement 1
(2) Information system capabilities2:-
Information system capabilities about deriving competitive advantage from ensuring all staff have the appropriate, timely accurate information necessary to do their jobs. Include information to carry out a task and appropriate feedback. Information system capabilities can be measured at a variety level in the organization as short term and long term.
(3) Motivation, empower and alignment
The third core measurement focus on climate for action which based on theory that employees need more than good information to act in the organization's best interest.
(Feel able to make decisions and take actions).
Kaplan and Norton suggest that employee motivation, empowerment and alignment is measured in a number of ways as following3:-
(1) Suggest per employee;
(2) Measures of continuous process improvement rates.
(3) Measures individual and organization alignment, and
1 (Holistic Performance Measurement & Balance Scorecard –Module 2-page 50) 2 (Holistic Performance Measurement & Balance Scorecard –Module 2-page 50-51) 3 ( Holistic Performance Measurement & Balance Scorecard –Module 2-page 51)
Result
Employee productivity Employee retention
Employee satisfaction
Staff Competencies Technology infrastructure Climate for action

[78]
(4) Measures of team performance.
2-3.2 Balance Scorecards as Strategy Tool
Managers started to use the scorecard to help operational strategy (beyond just holistic performance framework) because they had found that the process of setting up balanced performance measurements gave them insight into how their organisation actually worked. So, by 1996 Kaplan and Norton were able to suggest that companies can use the measurement focus of the scorecard to1:
(1) Clarify and translate vision and strategy;
(2) Communicate and link strategic objectives and measures.
(3) Plan, set targets and align strategic initiatives, and
(4) Enhance strategic feedback and learning.
They believed that this can be delivered by understanding three principles, of which cause and effect is most profound:-
(1) Cause and effect:-
The chain of cause and effect that tell the story of how, in a specific organisation, organization learning and growth enables internal business process to be created that deliver value for customers that result in financial performance.
(2) Performance drivers:-
Similar to the EFQM model's enablers, these are those factors that will in future deliver results. Therefore, measuring performance drivers gives a leading indication of likely future results.
(3) Linkage to financials:-
Scorecards should always focus on outcomes and all cause and effect paths should ultimately lead to financial pay-off.
Cause and Effect and strategy Maps:-
1 (Holistic Performance Measurement & Balance Scorecard –Module 2)
[79]
Kaplan and Norton had already integrated cause and effect ideas into their scorecard in the 1996 book but they developed the idea further and gave it the snappy name "Strategy Maps" in their book of the same published in 2004.
Strategy maps are simply case and effect maps of intermediate objectives that help describe an organization's strategy. (how and organization creates value".
Principle for Using the Scorecard Approach Strategically
In Kaplan and Norton (2001) the developers of the balanced scorecard laid out how scorecard can used to help strategy develop in five area:-
(1) Translating strategies into operational terms.
(2) Organisational alignment to strategy;
(3) Making strategy everyone's responsibility;
(4) Making strategy a continuous process; and
(5) Mobilising change through executive leadership.

[80]
2-4.1 European Foundation for Quality Management Excellence Model
The European Foundation or (European Framework) For Quality Management (EFQM) has nine criteria, divided into two groups as following:-
(1) Enablers. (2) Results.
Which each groups consists of numbers of criteria which divided into sub-criteria that each one has a list of bullet points (sometimes known as the 'area to address'). The main criteria and its groups are1:-
(1) Enablers:-
(1) Leadership. (2) Policy and Strategy. (3) People. (4) Partnership and resources. (5) Processes
(2) Results:-
(1) Customer results. (2) People results. (3) Society results. (4) Key performance results.
The title EFQM Excellence model refers to the 1999 version, where the last major revision made as diagram2 (7)
1 (Business Excellence (Module 8-page 23,24-msc in MGE reference-TQEC)Page (64)) 2 (Business excellence –Module 8- page 23-24).

[81]
ENABLERS RESULTS
INNOVATION & LEARNING
Diagram (7) EFQM 1999. The Model is registered trade mark of EFQM
EFQM Principles1
Fundamental Concepts of 2010, which are continually adapted and improved, are:-
(1) Achieving Balanced Results
(2) Adding Value for Customers
(3) Leading with Vision, Inspiration & Integrity
(4) Managing by Processes
(5) Succeeding through People
(6) Nurturing Creativity & Innovation
(7) Building Partnerships
(8) Taking Responsibility for a Sustainable Future
Approach compatibility
(1) Proprietary approaches to quality as recommended by Deming, Juran, and Crosby, and others.
1 (Business Excellence lecture in year 2013-Presentation prepared by Abbas .I. Abdelghafour., Ph.D)
leadership
People
Policy & Strrategy
Partnerships &&Resources
Processes
Key Performance Results
People Results
Customer Results
Society Result
[82]
(2) Approaches such as TQM, Malcolm Baldrige (Award), Deming prize, Continuous improvement approaches and others.
(3) Compatible with ISO 9000 series of standard guidelines
Criteria Parts:-
As there are main criteria there are Sub-Criteria and Questions/ Areas to Address for the sub-criteria
EFQM Enablers
We manage EFQM enablers as:-
(1) Approaches are:-
(1) Sound. (2) Rationalised (3) Well-defined. (4) Integrated
(2) Deployed:-
a. Systematically to all staff. b. in every division across all sites c. through all activities
(3) Assessed and Reviewed through:-
a. Measurement learning and improvement.
EFQM Results:-
What we achieve
(1) Results are:
(1) Improving long-term. (2) Achieving appropriate targets. (3) Best in class d. linked to what you do
(2) Their scope is:
(1) Across all relevant areas (2) Through all potential measures. (3) Aligned to objectives
Radar:-
Radar method can be used to determine and assess EFQM
(1) Determine RESULTS required.

[83]
(2) Plan and develop APPROACHES.
(3) DEPLOY approaches
(4) ASSESS AND REVIEW approaches and their deployment.
Here are criteria with more details.
(1) Leadership:-
Excellent Leaders develop and facilitate the achievement of the mission and vision. They develop organisational values and systems required for sustainable success and implement these via their actions and behaviours. During periods of change they retain a constancy of purpose. Where required, such leaders are able to change the direction of the organisation and inspire others to follow.
The Sub-Criterion parts are:-
(1.1) Purpose, direction & culture of excellence. (What’s expected)
(1.2) Develop & implement management systems & organisation.( How we get there)
(1.3) Involvement with customers, partners & society.( Partnering externally).
(1.4) Communicate motivates, support & recognise.( Reinforce behaviour)
(1.5) Identify & champion organisational change.( Making change)
2. Policy and Strategy:-
Excellent Organisations implement their mission and vision by developing a stakeholder focused strategy that takes account of the market and sector in which it operates. Policies, plans, objectives, and processes are developed and deployed to deliver the strategy.
The Sub-Criterion parts are:-
(2.1) Present/future stakeholders’ needs.( Inputs)
(2.2) Performance, measurement, research & learning. ( Inputs)
[84]
(2.3) Develop, review & update.( Policy Development)
(2.4) Communicate & deploy through key processes.( Policy Deployment)
(3) People:-
Excellent organisations manage, develop and release the full potential of their people at an individual, team-based and organisational level. They promote fairness and equality and involve and empower their people. They care for, communicate, reward and recognise, in a way that motivates staff and builds commitment to using their skills and knowledge for the benefit of the organisation.
The Sub-Criterion parts are:-
(3.1) Planned, managed & improved resources.( Positive Environment )
(3.2) Knowledge & competencies.(Capability focused on objectives)
(3.3) Involvement & empowerment.(Action)
(3.4) Two Way Communication.(Positive Environment)
(3.5) Reward, recognition & care.( Positive Environment)
(4) Partnership and resources:-
Excellent organisations plan and manage external partnerships, suppliers and internal resources in order to support policy and strategy and the effective operation of processes. During planning and whilst managing partnerships and resources they balance the current and future needs of the organisation, the community and the environment.
The Sub-Criterion parts are:-
(4.1) External Partnerships. Alignment to Criterion 2 (Policy &Strategy)
(4.2) Finances. Alignment to Criterion 2(Policy &Strategy)
(4.3) Buildings, equipment and materials. Alignment to Criterion 2(Policy &Strategy)
(4.4) Technology. Alignment to Criterion 2(Policy &Strategy)
[85]
(4.5) Information & Knowledge. Alignment to Criterion 2(Policy &Strategy)
(5) Processes:-
Excellent organisations design, manage and improve processes in order to fully satisfy, and generate increasing value for, customers and other stakeholders.
The Sub-Criterion parts are:-
(5.1) Designed & managed(General Process Management).
(5.2) Process improvement(General Process Management).
(5.3) Design & development(Products & Services)
(5.4) Produced, delivered, serviced(Products & Services).
(5.5) Customer relationships.( Manage & Develop).
(6) Customer results:-
Excellent organisations comprehensively measure and achieve outstanding results with respect to their customers.
The Sub-Criterion parts are:-
(6.1) Perception Measures Customer views. (Feedback).
(6.2) Performance Indicators Internal measures.( Performance).
(7) People results:-
Excellent organisations comprehensively measure and achieve outstanding results with respect to their people.
The Sub-Criterion parts are:-
(7.1) Perception Measures Employee views. (Feedback)
(7.2) Performance Indicators Internal measures. (Performance).
(8) Society results:-

[86]
Excellent organisations comprehensively measure and achieve outstanding results with respect to the key elements of their policy and strategy.
Criterion 4 Partnerships & Resources
Criterion 5 Processes.
The Sub-Criterion parts are:-
(8.1) Perception Measures Society’s views.(Feedback).
(8.2) Performance Indicators Internal measures.(Performance).
(9) Key performance results.
(9.1) Key Performance Outcomes. (Outcome measures) Achievement to Plan.
(9.2) Key Performance Indicators. (Internal measures) Predictors(criteria 2,4,5).
2-5.0 2. Quality Management Systems
2-5.1 The ISO 9000 Series1:-
The ISO 9000 series of quality assurance standard has been in founded since 1987 (the earlier UK as BS5750).
The new ISO 9000:200 series, in 2000 which contain four primary standards as following:-
(1) ISO 9000: quality management systems – fundamentals and vocabulary.
(2) ISO 9001: quality management systems-requirements. (3) ISO 9004: quality management systems – guidance for
performance improvement. (4) ISO 19011: guidelines on quality and environmental auditing.
The new standard is consists of eight fundamental quality management principles, as:-
1 (Quality management system – Module 6)
[87]
(1) Customer focus. (2) Leadership. (3) Involvement of people. (4) Process approach. (5) System approach to management. (6) Continual improvement. (7) Factual approach to decision-making. (8) Mutually beneficial supplier relationships.
2-5.2 The ISO 9001:2008 Introduction ISO 9001:2008 Quality Management System certification enables you to demonstrate your commitment to quality and customer satisfaction, as well as continuously improving your company’s operations. The internationally recognized quality management system standard is the preferred solution for organizations worldwide.
In November 2008 the International Organization for Standardization (ISO) introduced a revised Quality Management standard based on the same process model as the 2000 revision, with an emphasis on measuring customer satisfaction. The current version continues to emphasize compatibility with ISO 14001 - Environmental Management Systems. The goal is for all organizations to seek continuous performance improvement. All requirements for quality management of the product or service are covered in ISO 9001:2008 which includes a quality planning requirement along with policies, objectives and quantifiable targets. Basic Requirements: ISO 9001:2008 requires organizations to have a quality manual which includes the documented procedures or references to them. The manual must include a description of the sequence and interaction of the processes that make up the quality management system specific to your business. In addition, the scope of the system has to be clearly defined. Overall, the effect of the requirements of the standard is to reduce the instances where documented procedures are mandatory (there are only six mandatory procedures) and to allow the organization the freedom to determine the type and extent of documentation needed to

[88]
support the operation of the processes that make up the quality management system. The six mandatory procedures are: - (1) Control of Document (4.2.3). (2) Control of Records (4.2.4). (3) Internal Audit (8.2.2). (4) Control of non-Conforming Products (8.3). 5. Corrective Action (8.5.2). (6) Preventive Action (8.5.3).1 Key Benefits of ISO 9001:2008: It does:
(1) Establishes and streamlines processes through complete documentation, (2)Improves and establishes training processes, (3) Defines roles and responsibilities, 4. Greatly increases operational efficiency, (5) Increases ability to troubleshoot, (6) Develops and builds relationships that help to retain existing customers, (7) Provides advantages over competitors that aren't certified ISO 9001:2008, (8) Builds opportunities for global commerce with international recognition, (9) Improves customer relations. (10) Improves relationships with suppliers due to clear, concise production standards· (11). Provides basis for consistent and fact-based decision making, (12). Carefully planned improvements, based on documentation and analysis, and (13). Provides for regular audits/reviews of performance
Benefits:
(1) Increases productivity· Maximizes quality (2) Increases revenue· Improves employee morale and satisfaction (3) Saves time and money (4) Enhances ability to attract new customers that have adopted
requirements for certification (5) Improves accountability of management (6) Increases employees' understanding of their roles in success of
their work and the company (7) Creates greater motivation and dedication
ISO members2: There are three member categories (1) Full members (or member bodies) influence ISO standards development and strategy by participating and voting in ISO technical and policy meetings ,(2) 1 Leaman.hubpages.com/hub/ISO-9001 2 (www.ISO.org)
[89]
Correspondent members (observe).(3) Subscriber members keep up to date on ISO’s work but cannot participate in it.
Characteristics of the year 2008 series1: (1) Applicable to all types and sizes of organization. (2) Assure customer that all the processes in the organization are being addressed. (3) Place more attention on the need to provide all necessary resources. (4) Greater compatibility with ISO 14000. (5) Evaluation of Customer Satisfaction. (6) Structure of ISO 9001 and ISO 9004 based on a process-oriented
model. (7) Provide core attributes of TQM, Baldridge. (8) Reduce the manufacturing-oriented requirement. (9) Organization will be required to demonstrate continual quality management system improvement. (10) Organization will have to implement data analysis processes to
determine: (11) Customer related performance. (ISO 9001) (12) Operational performance. (ISO 9001) (13) Competitive performance.(ISO 9004) (14) Economics of quality, financial, and market-related
performance.(ISO 9004)9004) Eight Quality Management Principles and Guidelines for Their Application (1) Customer-Focused Organization Organizations depend on their customers and therefore should understand current and future customer needs, meet customer requirements and strive to exceed customer expectations. (2) Leadership
Leaders establish unity of purpose and direction of the organization.
They should create and maintain the internal environment in which people can become fully involved in achieving the organization's objectives. (3) Involvement of People People at all levels are the essence of an organization and their full 1 Training course Broachers
[90]
Involvement enables their abilities to be used for the organization's benefit. (4) Process Approach A desired result is achieved more efficiently when related resources and activities are managed as a process. (5) Systems Approach to Management Identifying, understanding and managing a system of interrelated processes for a given objective improves the organization's effectiveness and efficiency. (6) A “Continual Improvement” Approach to Management Continual improvement should be a Permanent objective of the organization. (7) A Factual Approach to Decision making Effective decisions are based on the analysis of data and information. (8) Developing Mutually Beneficial Supplier Relationships An organization and its suppliers are interdependent, and a mutually beneficial relationship enhances the ability of both to create value. All ISO standards are reviewed every five years to establish if a revision is required to keep it current and relevant for the marketplace1. 2-6.0 Assessment and Scoring Type of assessment:-
(1) Self-Assessment.
(2) Committed to Excellence Assessment.
(3) Recognised for Excellence Assessment.
(4) Award Assessment
2-6.1 Assessment and Scoring Methods for European and Baldrige1
The method of assessment and scoring the European awards same as Baldrige. The first stage is an assessment of written submission document separately by each assessor /examiner. Within this first stage, the recommended method is as follows:-
(1) Read the whole of submission document to gain an overall picture of the organization. Make an initial note of any key themes:-
1 (www.ISO.org)

[91]
- Strong or weak points that relate to the submission as a whole.
(2) Work through the submission document one sub-criterion or criterion-part at a time to produce a list of strength, area for improvement, site visit issues for each.
(3) From this information determine a score, firstly for each element separately, and then for the sub-criteria and as a whole.
(4) Review and update the list of key themes in the light of his more detailed analysis of the criteria.
Hints:-
The EFQM Excellence Model, and scoring method, in particular the RADAR Matrix: (on page 35 and 36) '2
(1) Identify strengths and areas for improvement by linking them to the three elements of approach, deployment and assessment and review and result and scope.
(2) Decide on a score for each of these elements separately by starting at 50% and adjusting up or down as you feel appropriate.
(3) The overall score for that sub criterion will be an aggregate of the scores of the individual elements.
(4) Bear in mind that 100% represent perfection and even world-class organizations will fall well short of this.
2-6.2 Self-Assessment Methods3:
Formulating an assessment of your own organization for this purpose is known as self-assessment.
2-6.3 Principles of self- Assessment: -
Different principles are common to all method of self-assessment as following:-
1 (Business Excellence- page 71) 2 (Business Excellence page 73 and assessing for Excellence.) 3 ( Business Excellence –Module 8-page71)
[92]
(1) It is carried out internally by people within the organization itself (although it may be validated through an external perspective from someone outside the organization).
(2) It asks searching questions about how the organization works and the results it achieves.
(3) It uses a defined model structure to identify strengths and opportunities for further improvement, based on factual evidence rather than simply opinions.
(4) Whatever form of self-assessment is used, the elements (for the EFQM Excellence Model) of approach, deployment and assessment and review (enabler criteria) and results and scope (results criteria) should always be considered.
The self-assessment may also include a score.
The appendix three is three tables is Scoring Guidelines concern approach, Deployment and Results:-
2-6.4 Other Assessment and Scoring Methods1:-
There are other assessment and scoring methods as:-
(1) Award simulation approach.
(2) Pro forma approach.
(3) Workshop approach.
(4) Matrix approach.
(5) Questionnaire approach.
(6) Software approaches.
(7) Hybrid approach.
1 (Business Excellence –Module 8 – page 76-78.)
[93]
2-7.0 QUALITY SYSTEM AUDITING AND IMPROVEMENT
DEFINITIONS1
A full list of auditing and terms their definitions is given in ISO 9000:2000 and its predecessor , ISO 8402.the terms most referred to and misused for auditing are:-
Audit2:-
Systematic, independent process and documented process for obtaining evidence and evaluating a objectively to determine the extent to which audit criteria are fulfilled.
Quality evaluation (sometimes called assessment):-
Systematic examination of the extent to which an entity is capable of fulfilling specified requirements.
Quality surveillance:-
Continual monitoring and verification of the status of an entity and analysis of records to ensure that specified requirement are being fulfilled.
The basic different of above checking are:-
(1) Audit is about past practice (QMS, product or process)
(2) Evaluation is about a judgement of the future.
(3) Surveillance is normally associated with regular inspection checks or products until confidence is achieved
2-7.1 Reasons or Objectives of Auditing are:-
(1) Evaluate a supplier to establish a contractual relationship.
(2) To verify and surely an organization's own quality system continues to meet specified requirements and is being implemented. 1 (Quality Management systems- Module 6 – page 128) 2 (Quality Management systems- Module 6 – page 128.)
[94]
(3) To verify that supplier's quality system continues to meet specified requirements and is being implemented within the frame work of contractual relationship.
(4) To evaluate an organization's own quality system against system standard.
2-7.2 Audit Requirement of ISO 90011
The requirement of the two specified standards extract as following:-
(1) ISO 9001:1994 Clause 4.17 Internal Audits.
(2) ISO 9001:2000 Clause 8.2.2 Internal Audit.
(1) ISO 9001:1994 Clause 4.17 Internal Audits2:-
The supplier shall establish and maintain document procedures for planning and implementing internal quality audits to verify whether quality activities and related results comply with planned arrangements and to determine the effectiveness of quality system.
Internal quality audit shall be scheduled on the basis of the status and importance of the activity to be audited and shall be carried out by personal independent of those having direct responsibility for the activity being audited. The results of audits shall be recorded and brought to the attention of the personal having responsibilities in the area audited. The management personnel response for the area shall take timely corrective action on the deficiencies found during the audit.
Follow-up audit activities shall verify record the implementation and effectiveness of the corrective action taken.
(2). ISO 9001:2000 Clause 8.2.2 Internal Audit3:-
The organization shall conduct periodic internal audit to determine whether quality management system:-
1 (Quality management systems-module 6- page 126-128) 2 (Quality management systems-module 6- page 126) 3 (Quality management systems-module 6- page 127)

[95]
(1) Conforms to the requirements of international Standard.
(2) Has been effectively implemented and maintained.
The organization shall plan the audit programmes taking into consideration the status and importance of the activities and areas to audited as well as the results of previous audits. The audit scope, frequency and methodologies shall defined. Audits shall be conducted by personnel other than those who perform the activity being audited. A document shall include the responsibilities and requirement for conducting audits. Ensuring their independence, recording results and reporting to management. Management shall take timely corrective action on implementation of corrective action, and the reporting of verification results.
2-7.3 ISO 10011
The means to achieve auditing are defined in ISO 10011. 1995. Parts 1.2 and 3.
The contents sheet is shown as:-
(1) Auditing:
(2) Scope
(3) Normative reference.
(4) Definitions.
(5) Audit objectives and responsibilities.
(6) Auditing.
(7) Audit completion.
(8) Corrective action follow-up.
ANNEXES
A. Bibliography.
(2). Qualification criteria for auditors
(1) Scope.
[96]
(2) Normative reference.
(3) Definitions.
(4) Education.
(5) Training.
(6) Experience.
(7) Personal attributes.
(8) Management capabilities.
(9) Maintenance of competence.
(10) Language.
(11) Selection of lead auditor
ANNEXES
A. Evaluating auditor candidate.
B. National auditor certification.
(3) Managing an audit programme
(1) Scope.
(2) Normative reference.
(3) Definitions.
(4) Managing an audit programme.
(5) Code of ethics.
2-7.4 Fundamental of Auditing:-
The main principles being:-
(1) Independence: audit team members should be independence to the area/organization being audit. This forms a basis of understanding and reliability of report.
(2) Code of conduct: an ethical conduct by the team gives the foundation for integrity and professionalism.

[97]
(3) Fair presentation: the obligation to report truthfully and accurately, the audit findings.
(4) Objective evidence: a factual and rational basis to reach audit conclusions.
(5) Due care: - reasonable care in all matter of the audit and completeness in presentation of the audit report.
2-7.5 Audit Programme (Internal):
Its duration twelve month and covers all audits to be carried out by the organization. The audit programme is normally the responsibility of quality management reprehensive but may be delegated to an audit manager.
The programme may be consisting of:-
(1) Internal functional audit programmes.
(2) External supplier audit programmes.
function audit includes are1:-
(1) The internal auditing. (2) Non-conformance control. (3) Corrective action. (4) Preventive action. (5) Data analysis. (6) Management review.
Atypical audit programme are:-
Process to be audited:
(1) Sales/marketing.
(2) Contracting.
(3) Planning.
(4) Design.
(5) Purchasing.
1 (Quality management systems-module 6- page 130)

[98]
(6) Project Management.
(7) Production.
(8) Quality control.
(9) Document Control.
(10) Quality functions.
(11) Training / Personal.
Types of Audit1:
Audit can be classified into two types:-
(1) Audit of the QMS. (2) Audit of Products.
The first audit types (Audit of the QMS) will be approach taken on the most external audits.
Also audit of the QMS can be classified to:-
(1) Process audit. (2) Project audit. (3) Contract audit. (4) Service audit. (5) New product audit.
Also ISO 10011, the audit guide, suggests the following definition of types audit in addition to those given above:-
(1) System Audit:
This examines whether the management have documented their controls in accordance with a standard such as ISO 9001. (2) Compliance Audit: This concerned whether the management are implementing their document systems. (3) Full Audit: 1 (Quality management systems-module 6- page 130)
[99]
This examines all aspects of an organization's quality system: all element of ISO 9001: and all activities. (4) Partial or Mini Audit: This is where an element or small number of elements of a quality system is examined. (5) Follow-up Audit: This where an audit is specifically carried out to check that corrective action has been carried out effectively. (6) Trouble Audit: This is where an audit is performed to investigate weaknesses in quality management systems and/or structure. Which are the cause of the supply of unsatisfactory products or service.
2-7.6 Levels of Audit1:
Audit consist of four levels:
(1) Level 1:
External audits of the QMS carried out by the customer (2nd party) or the certification body (3rd party) they provide confidence that supplier has the ability to meet specification requirements.(once/twice per year)
(2) Level 2: Internal audits carried out by own staff (1st party). They provide management with quantification of the extent of compliance with specified requirements.(Six-monthly)
(3) Levels 3: Supervisory audits of system and practices. To give confidence that their area is under control.(Monthly)
(4) Level 4: Self-audits of work. Carried by operators on their own work. As a check of their own compliance to requirement. (Ongoing)
2-7.7 Phase of an Audit2:-
There are principles phases of audit, the totality of these audits constitutes the audit programme. 1 (Quality management systems-module 6- page 131) 2 (Quality management systems-module 6- page 132)
[100]
(1) Planning:
This is the research phase of the audit whereby audit preparation takes place. A well-planned audit has high probability of success, poorly carried out audits bring auditing into disrepute.
(2) Audit execution:
This phase is carried out on the audited as:
(1) The purpose of this phase is to gather objective evidence that the auditors operation;
(2) is either conforming;
(3) Or non-conforming to defined requirements.
(3) Audit reporting and completion:
This phase concern the reporting of:-
(1) what the audit found,
(2) the correction by the auditee of found deficiencies
(3) And the follow-up checks that corrections are implemented.
2-7.8 Roles and Responsibilities:
There are key players in auditing. Each has roles and responsibilities. Audits may carry out by individuals or teams.
Lead auditor:
This term applies to the person who is in overall charge of the audit and the team. The team may vary in number from one to several; as one, the lead auditor is also the auditor.
Lead auditor responsibilities briefly comprise:
(1) Preparing the plan for the audit. (2) Selecting or assisting in selecting other team members. (3) Communicating with the auditee. (4) Collecting all results from audit team members. (5) Responsibility for submission of audit report.
[101]
(6) Acting as auditor.
Auditor:
Auditor responsibilities comprise:
(1) Working in accordance with audit planned requirements. (2) Carrying out audit execution. (3) Documenting all observations made (findings). (4) Reporting audit results found. (5) Verifying corrective actions carried out by auditee.
Audit Team Members:
The audit team should be chosen to have the best combined expertise to conduct the audit. In brief the team's member responsibilities are:
(1) Acting as auditors. (2) Taking instructing from and working under lead auditors. (3) Co-operating with and complementing other team members. (4) Being the experts as required on specialist are.
Audit practice:-
Audit practice is usually designed around ISO 100011. An audit is usually one item on the audit Programme and will be allocated to an audit team leader who is then responsible for all phases of the audit.
Planning:
The audit purpose and scope will have been issued to the audit team who will then prepare for the audit, involving other team members as necessary.
Research
This is necessary in order to identify and determine:
(1) The boundaries of the audit. (2) The system and procedures applicable. (3) The scope of the work undertaken by the auditee. (4) What processes are in the place.
[102]
(5) Any regulatory requirement. (6) The size of the operation, i.e. facilities, number of staff, area of
the concern, products, problem being experienced.
Organization:
From the research the team leader will decide how the audit should be conducted and organize the following accordingly:
(1) The expertise necessary to carry out the audit, i.e. specialism. (2) The time required to carry out the audit: this must be in
conjunction with and agreed by the auditee. (3) The number of auditors: normally a comprise with time, i.e. the
audit requires 6 man days of time, the alternative are 2 auditors for 3 days or 3 auditors for 2 days: again agreement with auditee.
(4) The audit documentation required. (5) The amount of sampling to be carried out. (6) The audit plan. (7) The extent of audit checklists required.
Audit Plan:
The plan will be with the auditee prior to audit execution, to allow the auditee to execute his or her responsibilities. The plan is a schedule of the audit execution, clearly specifying the audit activities.
Audit Check lists:
There is a useful tool particularly for inexperienced auditors or for large significant audits, normally prepared by the auditor so they are familiar with applicable documentation when auditing the area concerned.
A check list is an aide memoire and briefly contains the following:
(1) Identifies the audit subject and area. (2) Identifies documents applicable. (3) A series of questions. (4) Each question identifies to a significant activity within the
document. (5) Provision for recording answers to the questions.
[103]
Notification:
The audit team leader will notify auditee, prior to the audit, in clear terms of purpose, scope and audit timing. A copy of the audit plan will be issued. The auditee will confirm agreement to the audit and audit plan.
Team Brief:
The audit team leader will brief the audit prior to the audit execution. The brief will consist explanation of scope audit and purpose, team duties, audit plan and any other arrangement. Queries should be cleared before the audit.
Audit Execution1:
This phase of the audit is conducted with the auditee, and conducted with extreme thoroughness. Once the audit team has left, the audit is considered over, there is no returning for a seconed look. Auditors make their decision on what they find during this phase. Audit execution can be broken down as follows:
(1) Opening Meeting:-
This sets the scene for audit execution. A formal meeting , the degree of formality dependent on external, internal, type, level and significance of the audit, for external audits should be a formal meeting with the supplier management. For internal audit it varies, for very large functions necessitating a
team of auditors, a formal meeting similar to external should be used, since most of the function's senior personnel may attend in addition to audit team. For small internal audits they often take the form of one-to-one, with lead auditor and auditee sitting around auditee's desk. The purpose of the meeting is to: (1) Introduce audit team members to the auditee's team. (2) Review audit objectives, scope and plan. (3) Explain methods of audit conduct. (4) Establish official communication between teams. (5) Confirm resources and facilities required. 1 Quality management systems-module 6- page 136

[104]
(6) Confirm closing meeting arrangements. (7) Clarify or resolve any queries. (8) Adjust the audit plan if necessary.
(1) Examination
The evidence of compliance or non-compliance is now collected. The prepared check lists should be used. Note: these are a guide and may be added to or slightly deviated from during the examination. But not going outside audit scope. The examination should be conducted through:
(3) Interviews, with personnel carrying out activities.
(4) By examination of documents concerning these activities, which may be work or the instructions.
(5) By observation of work activities or of conditions associated with this work or the process.
This examination should look for objective evidence either of compliance or non-compliance to the stated requirement.
(1) Recording the Evidence:-
The type of evidence may be:
(2) On document- issue status, dates, authorities, references.
(3) Product-identities, protection, conforming to the process.
(4) Activities – in accordance with procedure, work instructions and with identified authority.
(5) Practices – both good and bad.
Evidence collected by all auditors contributes to audit report.
(1) Audit Review:
It will be necessary for the auditor to review audit progress. On large audits team leader may requires periodic reviews to ensure audit plan adherence. It is also admissible for an audit team review prior to the closing meeting where all audit finding are collated and a decision made

[105]
on the outcome of the audit team members will be briefed on their responsibilities at the closing meeting.
(2) Closing Meeting
This is a formal meeting at the end of audit execution, when the audit team report their finding to auditee, the report is normally verbal, although copies of non-compliance reports are usually handed over. The closing meeting is chaired by the lead auditor and in attendance will be the audit team and auditees. The purpose of a closing meeting and its scope is:
(1) To restate the audit purpose and scope, that these have been met or made any qualification necessary.
(2) To confirm that the audit was a sampling activity and that not all problem would have been uncovered.
(3) To present the finding. (4) To give an overall conclusion of how effective the QMS or
requirement have been met. (5) To confirm that the auditee is responsible for correcting any non-
conformities and prevent their recurrence. (6) To give the auditee a chance to respond to this verbal report.
Audit Reporting
The audit report is the official document recoding the execution of the audit. The audit team leader is responsible its compilation, team member may assist, the report must be an accurate account of the audit execution and should contain identified factual evidence.
The report content should contain:-
(1) Unique audit reference taken from the master audit programme. (2) Dates of audit execution. (3) Organization or function/department audited. (4) Areas within the scope of the audit. (5) Identities of documents audited. (6) Purpose and scope of audit. (7) Audit team members by name. (8) Key auditee personal contacted during the audit. (9) Summary of audit findings. e.g. non-conformity reports.

[106]
(10) Reference to individual non-conformity reports. (11) Audit team's judgement of the auditee's compliance with stated
requirements. Audit reports are confidential documents and only disclosed to the
parties relevant to the audit , i.e. auditor, auditee and client, by strict distribution control.
Disclosure to another party may be given but after agreement of all party.
Audit Completion:
The auditor decides which activities are deficient. These are termed non-conformities. i.e. the activity found not to conform to requirements. There are two approaches to non-conformity:-
(1) Those believing non-conformities be graded. (2) Those believe a non conformity is just that grading is
unnecessary.
Where grading is the accepted practice the definitions are:-
(1) Major non-conformity:
(1) Representing a major breakdown of the system with respect tone ISO 9001 requirement.
(2) Or a significant number of minor non-conformities.
(2) Intermediary non-conformity represent:-
(1) A lack of addressing of sub-clauses of an ISO 9001 requirement both in documented system and in the operating practices –
(2) Or a significant number of minor non-conformities.
(3) Minor non-conformity typically representing an individual to comply with the system: for example: one measuring instrument out of six sampled was out of calibration.
Both approaches recognize another form of finding which is termed an "observation". This could be:-
(1) A deficiency in operating practice but without evidence to substantiate or.
(2) A situation which the auditors consider could be improved.

[107]
All grades of non-conformity and observation must be agreed with the auditee at the time of finding.
Non-conformities should be recorded on anon-conformity report form.
Documentation
After issue of the audit report, the audit is considered complete as far as team is concerned. Audit documents should be kept on record by the quality representative or audit manager. These document are:
(1) The initial check lists drawn up for the audit. (2) The findings, recorded on the checklist. (3) The audit report compete with attached non-conformity report.
In addition to these records, other records will be added:
(1) The corrective action statements from the auditee. (2) Evidence by follow-up audit that the corrective actions have been
implemented.
Corrective Action
Auditee Responsibilities1
When an audit has revealed deficiencies in the practice of the auditee, the auditee then has responsibility to take actions.
The auditee should review fully the non-conformities and the areas involved for wider implication than those reported. Against each non-conformance area the auditee should identify, define and take appropriate action to correct the non-conformity found and any and other similar problems they may find. Further actions should be taken to identify the cause of nonconformity and prevent recurrence.
Both of these actions should be recorded in the space provided on the non-conformity forms. The actions should be timely, not left unattended for a considerable time. This requires a timescale indicated alongside the corrective action, Major non-conformities should be addressed without delay, timescale should be realistic and achievable. Corrective actions 1 (Quality management systems-module 6- page 141)

[108]
may be best managed by auditee constructing a corrective action programme.
Auditor Responsibilities1:
The lead auditor should review the defined corrective actions and auditee's corrective action programme, this ensures that the action match the audit findings, and address the deficiencies found.
A follow-up audit is normally carried out to confirm that the corrective action programme has been implemented effectively.
This follow-up may be in the form of a mini audit, in the areas where non-conformities were found, and further samples taken.
O, if the non-conformities are minor and few in number, the follow-up may be left until the next audit in case of internal auditing: or as a check on a contract where it is an external audit on a supplier.
Definition and Terms Used for 'Non-Conformity'2
The following terms are used extensively in practice to denote a 'failure to comply with a requirements':
(1) Non-conformance. (2) Non-compliance. (3) Deficiency. (4) Finding (used to denote the negative). (5) Problem.
Some organization use the following definitions:
(1) Non-conformance = failure to meet ISO and company procedural requirements.
(2) Non-compliance = failure to meet legal requirement.
Other organizations differentiate as follows:
(1) Non-conformance = software/paperwork deficiency. (2) Non-compliance = hardware deficiency.
1 (Quality management systems-module 6- page 142) 2 ( Quality management systems-module 6- page 142)

[109]
2-7.9 Audit Cycle for Improvement
The improvement Cycle is summed up with Diagram 1(8)
Diagram (8) QMS Improvement Cycle
1 (Quality management systems-module 6- page 148)
QMS
Audit programme
Follow-up audit
Corrective and preventive actions
Audit report
Audit research
Audit documentation
Audit execution
Audit finding
Improvement team
Agree with auditee

[110]
2-8 QUALITY MANAGEMENT SYSTEM AUDIT, ASSESSMENT AND SCORNING
In recent years, two performance evaluation methodologies have received significant attention in managerial circles: quality audit and assessment, self-assessment. While the quality audit examines the compliance of a quality system with ISO 9000 standards and its suitability to achieve stated objectives, the self-assessment measures organizational performance against a selected business excellence model. In a continuous improvement effort, an organization can lay out the groundwork by establishing an ISO 9000 quality system, and subsequently use an excellence model to enhance performance, thereby effectively applying both evaluation methodologies. Numerous differences in the concepts, purpose, scope and methodology are illustrated, and self-assessments are found to be more advantageous in enabling continuous improvement. However, it is concluded that audits and self-assessments are compatible, and further research into the issues of enhancing both methodologies is suggested.1
2-9 OTHER RESEARCH FINDING
The finding research related to my research is (The Range of use for peoples' control for performance measure criteria in performance 1 (www.emeraldinsight.com/jourals.htm?articleid=868515)

[111]
evaluation of industrial public companies) for thinker and writer ELBahl oul Mohamed Slaiha ELAIAT. He use financial technique , productivities and appoint three phase performance measure as remember it above in his research.
And there are different research on different quality management and excellence model quality management systems.

[112]
CHAPTER (3): THE ANALYSIS DATA AND INFORMATION
3-1.0 ANALYSIS DATA AND INFORMATION
To collect the data I design questionnaire (see appendix number one) consist of six pages and four tables, each table contain ten questions, as tables one general, table two for ISO detail, table three for balance scorecard detail and table four for EFQM detail. These question governed by teachers. I make visit side and to seven organizations which I give them number code as Organization number One, Organization number Two, Organization number Three, Organization number Four, Organization number Five, Organization number Six and Organization number Seven. I fulfill these questionnaire with employees who response of quality management system and Excellence Models (quality manager and Quality management representative). Personal interview . But one organization I don’t meet his representative but I find the quality policy on the board and fill the questionnaire through it. Also I find the following system:-
(1) Internal audit according to 19011-2011. (2) Integrated management system (special with organization number
one). (3) ISO 14001 environment management system. (4) Safety and occupation health management system 18001 : 2007 ,
on organization number six. (5) Social responsibilities system ISO 26000 : 2009, on organization
number six. And the following figure are frequency, frequency table , histogram for frequency , oneway Anova and Chi square analysis test tables.
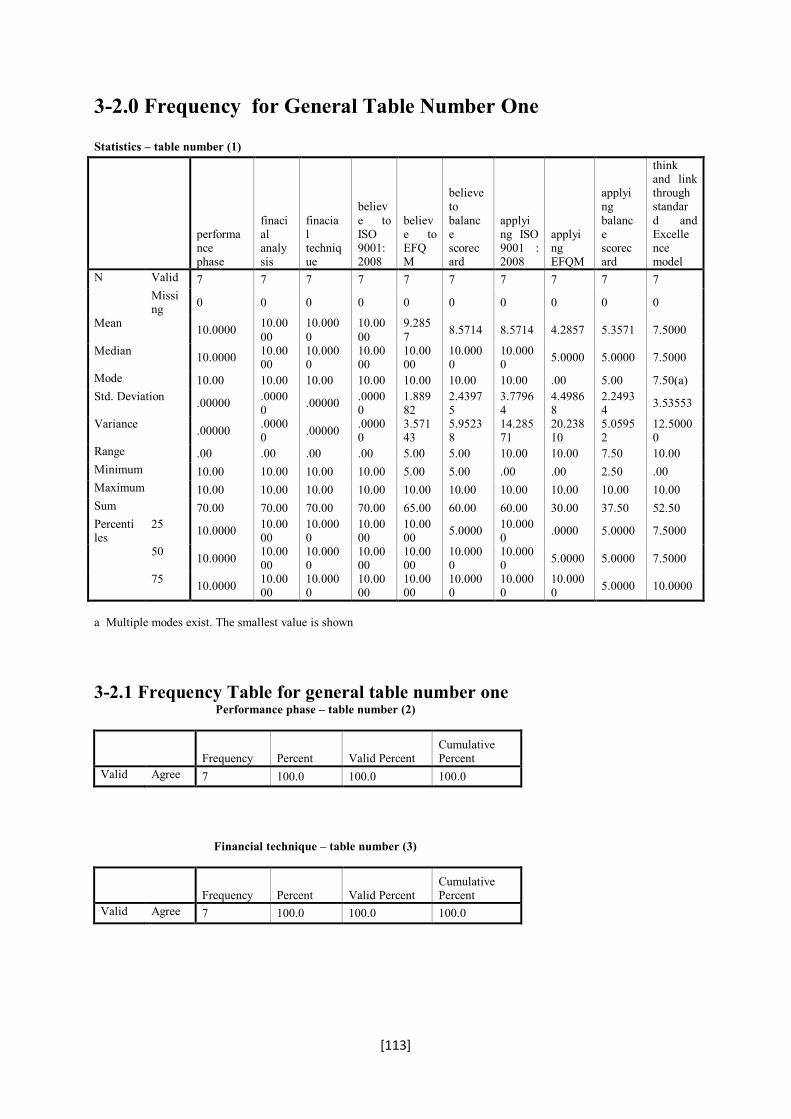
[113]
3-2.0 Frequency for General Table Number One Statistics – table number (1)
a Multiple modes exist. The smallest value is shown
3-2.1 Frequency Table for general table number one Performance phase – table number (2)
Frequency Percent Valid Percent Cumulative Percent
Valid Agree 7 100.0 100.0 100.0
Financial technique – table number (3)
Frequency Percent Valid Percent Cumulative Percent
Valid Agree 7 100.0 100.0 100.0
performance phase
finacial analysis
finacial technique
believe to ISO 9001: 2008
believe to EFQM
believe to balance scorecard
applying ISO 9001 : 2008
applying EFQM
applying balance scorecard
think and link through standard and Excellence model
N Valid 7 7 7 7 7 7 7 7 7 7 Missing 0 0 0 0 0 0 0 0 0 0
Mean 10.0000 10.0000
10.0000
10.0000
9.2857 8.5714 8.5714 4.2857 5.3571 7.5000
Median 10.0000 10.0000
10.0000
10.0000
10.0000
10.0000
10.0000 5.0000 5.0000 7.5000
Mode 10.00 10.00 10.00 10.00 10.00 10.00 10.00 .00 5.00 7.50(a) Std. Deviation .00000 .0000
0 .00000 .00000
1.88982
2.43975
3.77964
4.49868
2.24934 3.53553
Variance .00000 .00000 .00000 .0000
0 3.57143
5.95238
14.28571
20.23810
5.05952
12.50000
Range .00 .00 .00 .00 5.00 5.00 10.00 10.00 7.50 10.00 Minimum 10.00 10.00 10.00 10.00 5.00 5.00 .00 .00 2.50 .00 Maximum 10.00 10.00 10.00 10.00 10.00 10.00 10.00 10.00 10.00 10.00 Sum 70.00 70.00 70.00 70.00 65.00 60.00 60.00 30.00 37.50 52.50 Percentiles
25 10.0000 10.0000
10.0000
10.0000
10.0000 5.0000 10.000
0 .0000 5.0000 7.5000
50 10.0000 10.0000
10.0000
10.0000
10.0000
10.0000
10.0000 5.0000 5.0000 7.5000
75 10.0000 10.0000
10.0000
10.0000
10.0000
10.0000
10.0000
10.0000 5.0000 10.0000

[114]
Believe to ISO 9001: 2008 – table (4)
Frequency Percent Valid Percent Cumulative Percent
Valid Agree 7 100.0 100.0 100.0
Believe to EFQM – table (5)
Frequency Percent Valid Percent Cumulative Percent
Valid somewhat agree 1 14.3 14.3 14.3
Agree 6 85.7 85.7 100.0 Total 7 100.0 100.0
believe to balance scorecard- table (6)
Frequency Percent Valid Percent Cumulative Percent
Valid somewhat agree 2 28.6 28.6 28.6
Agree 5 71.4 71.4 100.0 Total 7 100.0 100.0
Applying ISO 9001: 2008 – table number (7)
Frequency Percent Valid Percent Cumulative Percent
Valid Disagree 1 14.3 14.3 14.3 Agree 6 85.7 85.7 100.0 Total 7 100.0 100.0
Applying EFQM – table (8)
Frequency Percent Valid Percent Cumulative Percent
Valid Disagree 3 42.9 42.9 42.9 somewhat agree 2 28.6 28.6 71.4
Agree 2 28.6 28.6 100.0 Total 7 100.0 100.0
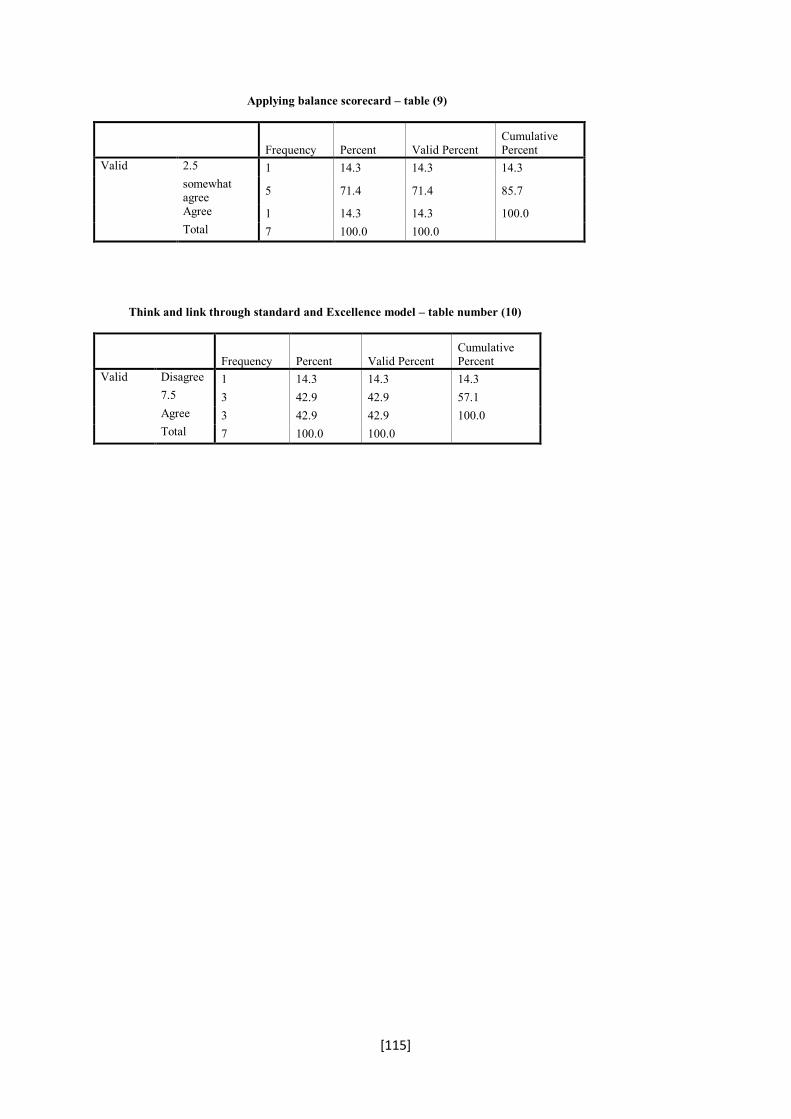
[115]
Applying balance scorecard – table (9)
Frequency Percent Valid Percent Cumulative Percent
Valid 2.5 1 14.3 14.3 14.3 somewhat agree 5 71.4 71.4 85.7
Agree 1 14.3 14.3 100.0 Total 7 100.0 100.0
Think and link through standard and Excellence model – table number (10)
Frequency Percent Valid Percent Cumulative Percent
Valid Disagree 1 14.3 14.3 14.3 7.5 3 42.9 42.9 57.1 Agree 3 42.9 42.9 100.0 Total 7 100.0 100.0

[116]
3-2.2 Histogram for general table number one Graph number (1)
performance phase
10.0
performance phase
Freq
uenc
y
8
6
4
2
0
Std. Dev = 0.00 Mean = 10.0
N = 7.00
Graph number (2)
finacial analysis
10.0
finacial analysis
Freq
uenc
y
8
6
4
2
0
Std. Dev = 0.00 Mean = 10.0
N = 7.00
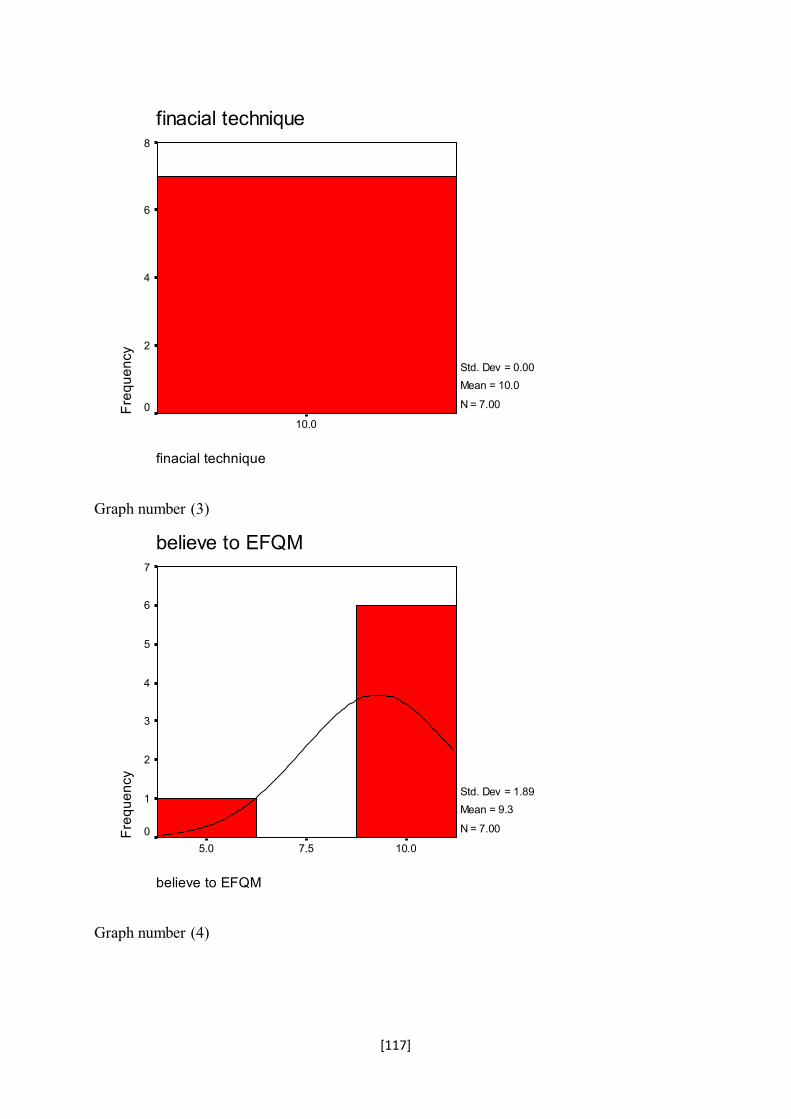
[117]
finacial technique
10.0
finacial techniqueFr
eque
ncy
8
6
4
2
0
Std. Dev = 0.00 Mean = 10.0
N = 7.00
Graph number (3)
believe to EFQM
10.07.55.0
believe to EFQM
Freq
uenc
y
7
6
5
4
3
2
1
0
Std. Dev = 1.89 Mean = 9.3
N = 7.00
Graph number (4)

[118]
believe to balance scorecard
10.07.55.0
believe to balance scorecardFr
eque
ncy
6
5
4
3
2
1
0
Std. Dev = 2.44 Mean = 8.6
N = 7.00
Graph number (5)
applying ISO 9001 : 2008
10.05.00.0
applying ISO 9001 : 2008
Freq
uenc
y
7
6
5
4
3
2
1
0
Std. Dev = 3.78 Mean = 8.6
N = 7.00
Graph number (6)

[119]
applying EFQM
10.07.55.02.50.0
applying EFQMFr
eque
ncy
3.5
3.0
2.5
2.0
1.5
1.0
.5
0.0
Std. Dev = 4.50 Mean = 4.3
N = 7.00
Graph number (7)
applying balance scorecard
10.07.55.02.5
applying balance scorecard
Freq
uenc
y
6
5
4
3
2
1
0
Std. Dev = 2.25 Mean = 5.4
N = 7.00
Graph number (8)

[120]
think and link through standard and Excellence model
10.07.55.02.50.0
think and link through standard and Excellence modelFr
eque
ncy
3.5
3.0
2.5
2.0
1.5
1.0
.5
0.0
Std. Dev = 3.54 Mean = 7.5
N = 7.00
Graph number (9)
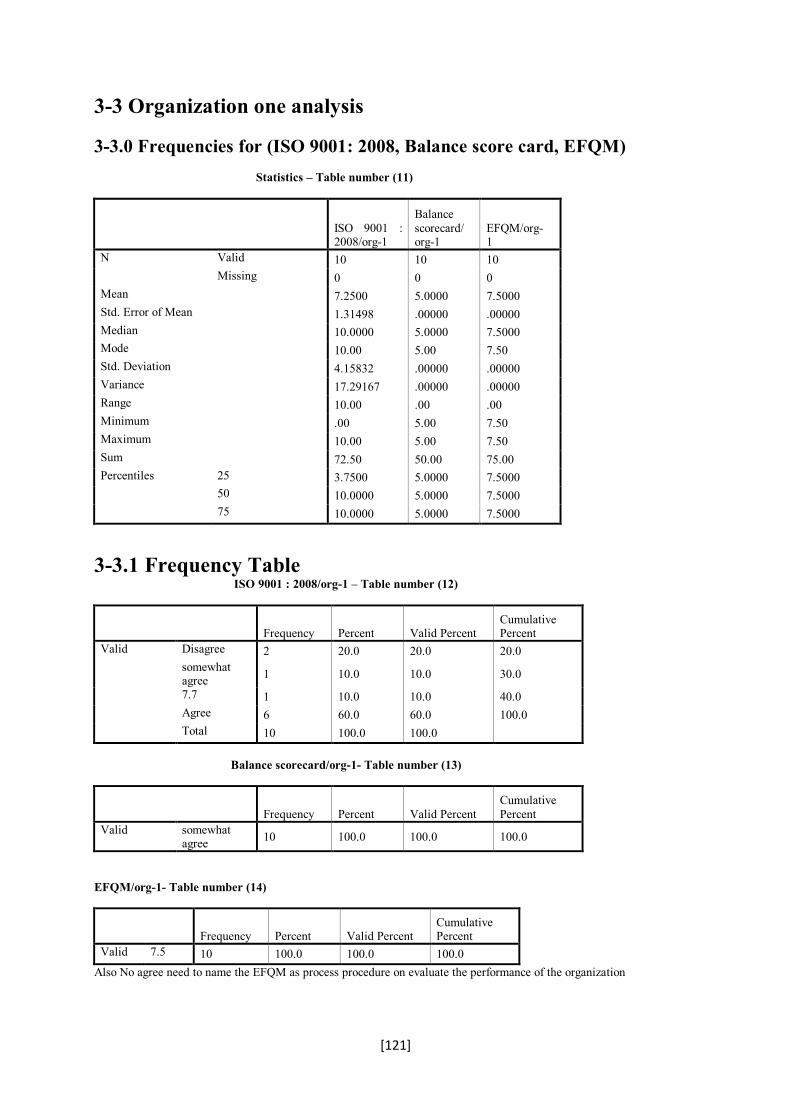
[121]
3-3 Organization one analysis
3-3.0 Frequencies for (ISO 9001: 2008, Balance score card, EFQM) Statistics – Table number (11)
ISO 9001 : 2008/org-1
Balance scorecard/org-1
EFQM/org-1
N Valid 10 10 10 Missing 0 0 0
Mean 7.2500 5.0000 7.5000 Std. Error of Mean 1.31498 .00000 .00000 Median 10.0000 5.0000 7.5000 Mode 10.00 5.00 7.50 Std. Deviation 4.15832 .00000 .00000 Variance 17.29167 .00000 .00000 Range 10.00 .00 .00 Minimum .00 5.00 7.50 Maximum 10.00 5.00 7.50 Sum 72.50 50.00 75.00 Percentiles 25 3.7500 5.0000 7.5000
50 10.0000 5.0000 7.5000 75 10.0000 5.0000 7.5000
3-3.1 Frequency Table ISO 9001 : 2008/org-1 – Table number (12)
Frequency Percent Valid Percent Cumulative Percent
Valid Disagree 2 20.0 20.0 20.0 somewhat agree 1 10.0 10.0 30.0
7.7 1 10.0 10.0 40.0 Agree 6 60.0 60.0 100.0 Total 10 100.0 100.0
Balance scorecard/org-1- Table number (13)
Frequency Percent Valid Percent Cumulative Percent
Valid somewhat agree 10 100.0 100.0 100.0
EFQM/org-1- Table number (14)
Frequency Percent Valid Percent Cumulative Percent
Valid 7.5 10 100.0 100.0 100.0 Also No agree need to name the EFQM as process procedure on evaluate the performance of the organization

[122]
ANOVA for org1- Table (15) iso/balance/efqm
Sig. Between Groups .053 Within Groups Total
Post Hoc Tests Multiple Comparisons – Table (16) Dependent Variable: iso/balance/efqm LSD
(I) CODE (J) CODE Sig. 1.00 2.00 .046 3.00 .818 2.00 1.00 .046 3.00 .028 3.00 1.00 .818 2.00 .028
* The mean difference is significant at the .05 level.
Chi-Square Test – Table (17) for org.1 Test Statistics
ISO 9001 : 2008/org-1
Chi-Square(a) 6.800
Df 3 Asymp. Sig. .079
There are significant between three standards in organization one
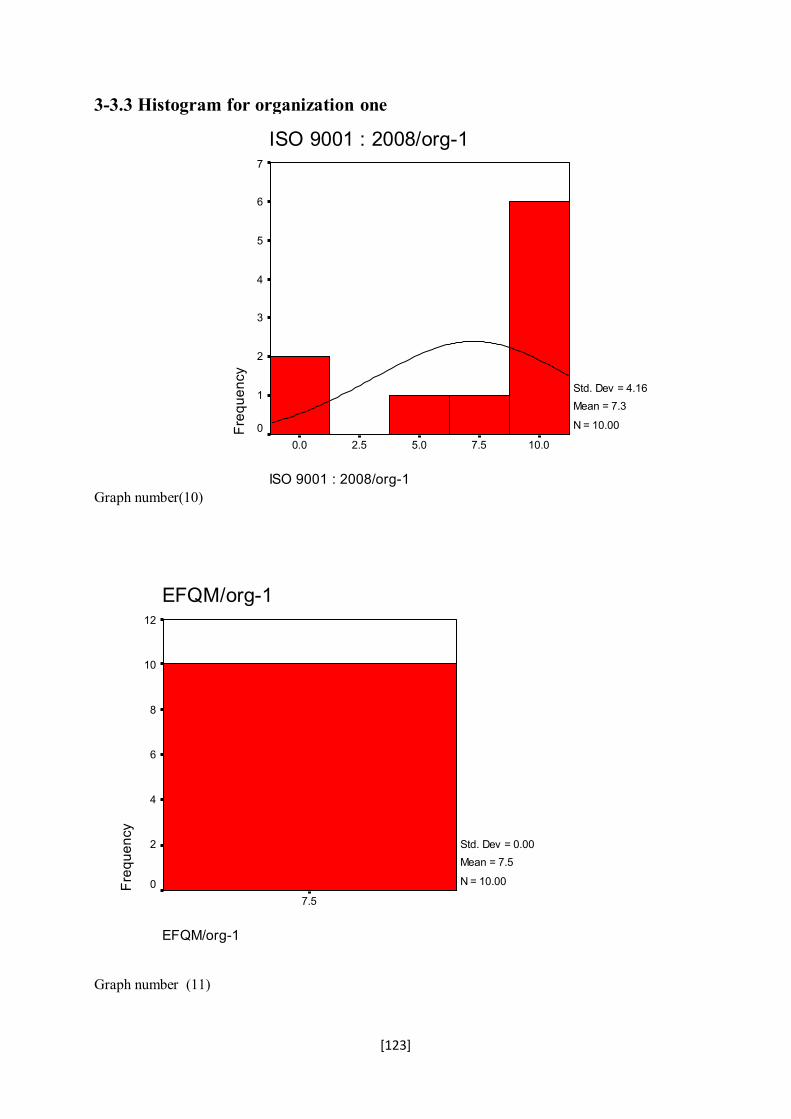
[123]
3-3.3 Histogram for organization one
Graph number(10) ISO 9001 : 2008/org-1
10.07.55.02.50.0
ISO 9001 : 2008/org-1
Freq
uenc
y
7
6
5
4
3
2
1
0
Std. Dev = 4.16 Mean = 7.3
N = 10.00
EFQM/org-1
7.5
EFQM/org-1
Freq
uenc
y
12
10
8
6
4
2
0
Std. Dev = 0.00 Mean = 7.5
N = 10.00
Graph number (11)
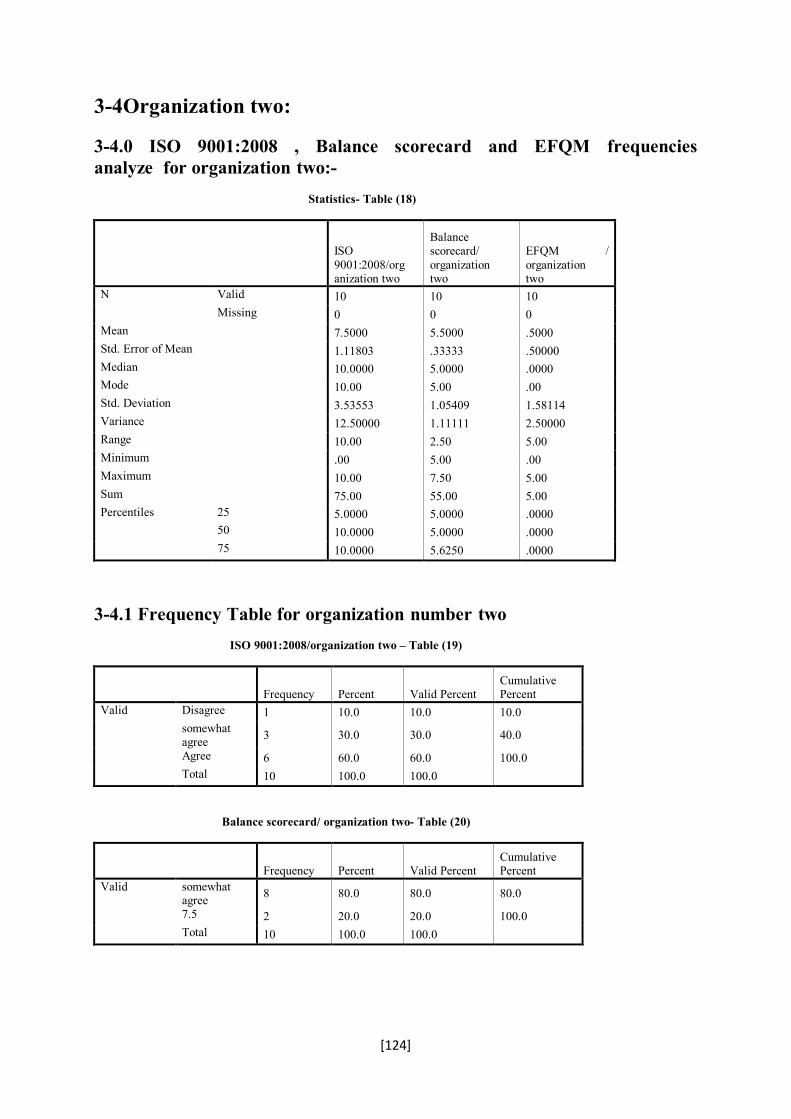
[124]
3-4Organization two:
3-4.0 ISO 9001:2008 , Balance scorecard and EFQM frequencies analyze for organization two:- Statistics- Table (18)
ISO 9001:2008/organization two
Balance scorecard/ organization two
EFQM / organization two
N Valid 10 10 10 Missing 0 0 0
Mean 7.5000 5.5000 .5000 Std. Error of Mean 1.11803 .33333 .50000 Median 10.0000 5.0000 .0000 Mode 10.00 5.00 .00 Std. Deviation 3.53553 1.05409 1.58114 Variance 12.50000 1.11111 2.50000 Range 10.00 2.50 5.00 Minimum .00 5.00 .00 Maximum 10.00 7.50 5.00 Sum 75.00 55.00 5.00 Percentiles 25 5.0000 5.0000 .0000
50 10.0000 5.0000 .0000 75 10.0000 5.6250 .0000
3-4.1 Frequency Table for organization number two ISO 9001:2008/organization two – Table (19)
Frequency Percent Valid Percent Cumulative Percent
Valid Disagree 1 10.0 10.0 10.0 somewhat agree 3 30.0 30.0 40.0
Agree 6 60.0 60.0 100.0 Total 10 100.0 100.0
Balance scorecard/ organization two- Table (20)
Frequency Percent Valid Percent Cumulative Percent
Valid somewhat agree 8 80.0 80.0 80.0
7.5 2 20.0 20.0 100.0 Total 10 100.0 100.0

[125]
EFQM / organization two-Table (21)
Frequency Percent Valid Percent Cumulative Percent
Valid Disagree 9 90.0 90.0 90.0 somewhat agree 1 10.0 10.0 100.0
Total 10 100.0 100.0
3-4.2 Histogram for organization two Graph number (12)
ISO 9001:2008/organization two
10.07.55.02.50.0
ISO 9001:2008/organization two
Freq
uenc
y
7
6
5
4
3
2
1
0
Std. Dev = 3.54 Mean = 7.5
N = 10.00

[126]
Graph number (13)
Balance scorecard/ organization two
8.07.06.05.0
Balance scorecard/ organization twoFr
eque
ncy
10
8
6
4
2
0
Std. Dev = 1.05 Mean = 5.5
N = 10.00
Graph number (14)
EFQM / organization two
5.02.50.0
EFQM / organization two
Freq
uenc
y
10
8
6
4
2
0
Std. Dev = 1.58 Mean = .5
N = 10.00

[127]
3-5 Organization Three
3-5.0 Frequencies analysis for ISO 9001:2008 , balance scorecard and EFQM for organization number 3 Statistics-Table ( 22 )
ISO 9001:2008/org-3
Balance scorecard/org-3
EFQM/org-3
N Valid 10 10 10 Missing 0 0 0
Mean .0000 5.0000 .0000 Std. Error of Mean .00000 .00000 .00000 Median .0000 5.0000 .0000 Mode .00 5.00 .00 Std. Deviation .00000 .00000 .00000 Variance .00000 .00000 .00000 Range .00 .00 .00 Minimum .00 5.00 .00 Maximum .00 5.00 .00 Sum .00 50.00 .00 Percentiles 25 .0000 5.0000 .0000
50 .0000 5.0000 .0000 75 .0000 5.0000 .0000
3-5.1 Frequency Table for Organization Number Three ISO 9001:2008/org-3 –Table (23)
Frequency Percent Valid Percent Cumulative Percent
Valid Disagree 10 100.0 100.0 100.0 Balance scorecard/org-3- Table (24)
Frequency Percent Valid Percent Cumulative Percent
Valid somewhat agree 10 100.0 100.0 100.0
EFQM/org-3- Table (25)
Frequency Percent Valid Percent Cumulative Percent
Valid Disagree 10 100.0 100.0 100.0
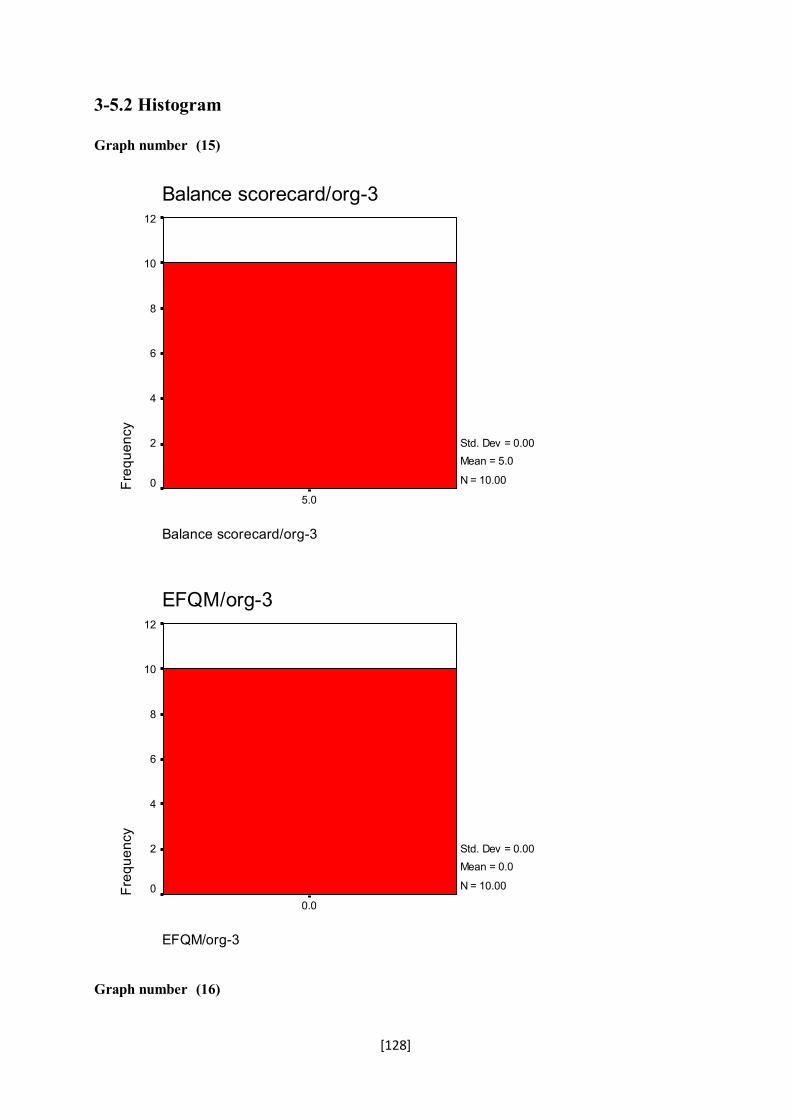
[128]
3-5.2 Histogram Graph number (15)
Balance scorecard/org-3
5.0
Balance scorecard/org-3
Freq
uenc
y
12
10
8
6
4
2
0
Std. Dev = 0.00 Mean = 5.0
N = 10.00
EFQM/org-3
0.0
EFQM/org-3
Freq
uenc
y
12
10
8
6
4
2
0
Std. Dev = 0.00 Mean = 0.0
N = 10.00
Graph number (16)

[129]
3-6 Organization Number Four
3-6.0 Frequencies Statistics-Table (26)
ISO 9001:2008/organization number four
Balance scorecard/ organization number four
EFQM/ Organization number four
N Valid 10 10 10 Missing 0 0 0
Mean 6.2500 5.0000 .5000 Std. Error of Mean 1.13346 .00000 .50000 Median 5.0000 5.0000 .0000 Mode 5.00(a) 5.00 .00 Std. Deviation 3.58430 .00000 1.58114 Variance 12.84722 .00000 2.50000 Range 10.00 .00 5.00 Minimum .00 5.00 .00 Maximum 10.00 5.00 5.00 Sum 62.50 50.00 5.00 Percentiles 25 4.3750 5.0000 .0000
50 5.0000 5.0000 .0000 75 10.0000 5.0000 .0000
a Multiple modes exist. The smallest value is shown
3-6.1 Frequency Table for organization number four ISO 9001:2008/organization number four- Table (27)
Frequency Percent Valid Percent Cumulative Percent
Valid Disagree 1 10.0 10.0 10.0 2.5 1 10.0 10.0 20.0 somewhat agree 4 40.0 40.0 60.0
Agree 4 40.0 40.0 100.0 Total 10 100.0 100.0
Balance scorecard/ organization number four – Table (28)
Frequency Percent Valid Percent Cumulative Percent
Valid somewhat agree 10 100.0 100.0 100.0
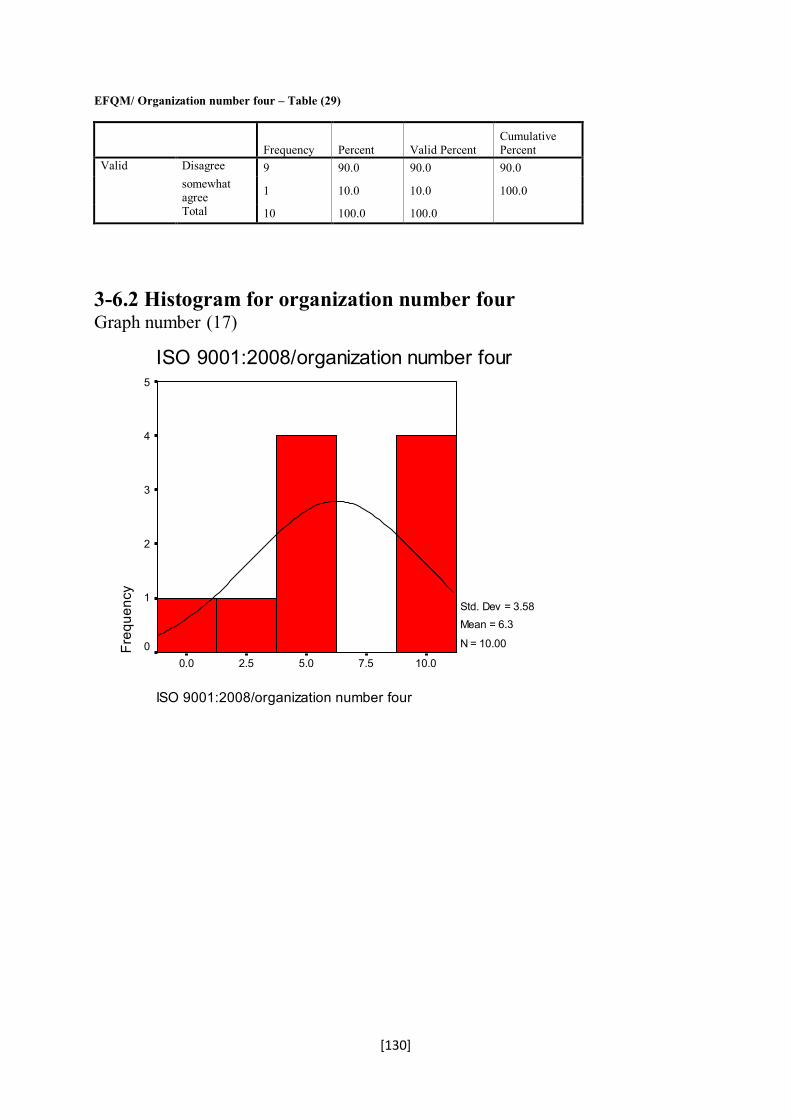
[130]
EFQM/ Organization number four – Table (29)
Frequency Percent Valid Percent Cumulative Percent
Valid Disagree 9 90.0 90.0 90.0 somewhat agree 1 10.0 10.0 100.0
Total 10 100.0 100.0
3-6.2 Histogram for organization number four Graph number (17)
ISO 9001:2008/organization number four
10.07.55.02.50.0
ISO 9001:2008/organization number four
Freq
uenc
y
5
4
3
2
1
0
Std. Dev = 3.58 Mean = 6.3
N = 10.00
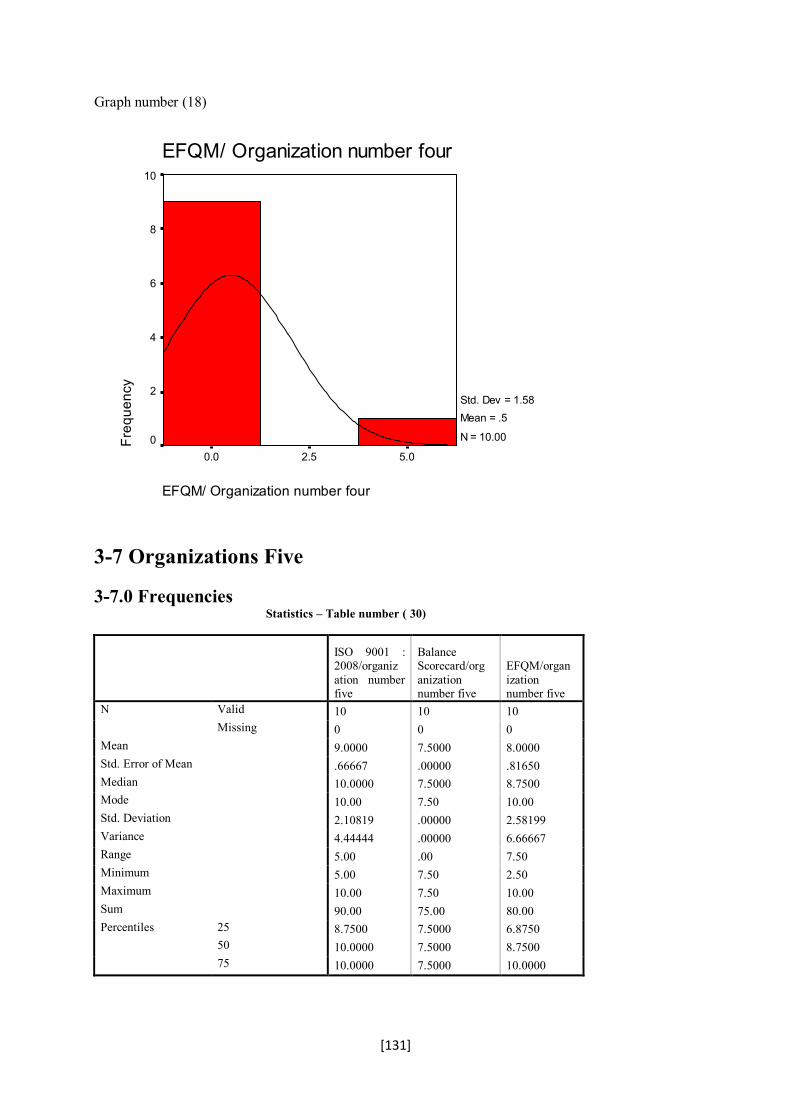
[131]
Graph number (18)
EFQM/ Organization number four
5.02.50.0
EFQM/ Organization number fourFr
eque
ncy
10
8
6
4
2
0
Std. Dev = 1.58 Mean = .5
N = 10.00
3-7 Organizations Five
3-7.0 Frequencies Statistics – Table number ( 30)
ISO 9001 : 2008/organization number five
Balance Scorecard/organization number five
EFQM/organization number five
N Valid 10 10 10 Missing 0 0 0
Mean 9.0000 7.5000 8.0000 Std. Error of Mean .66667 .00000 .81650 Median 10.0000 7.5000 8.7500 Mode 10.00 7.50 10.00 Std. Deviation 2.10819 .00000 2.58199 Variance 4.44444 .00000 6.66667 Range 5.00 .00 7.50 Minimum 5.00 7.50 2.50 Maximum 10.00 7.50 10.00 Sum 90.00 75.00 80.00 Percentiles 25 8.7500 7.5000 6.8750
50 10.0000 7.5000 8.7500 75 10.0000 7.5000 10.0000

[132]
3-7.1Frequency Table ISO 9001 : 2008/organization number five –Table (31)
Frequency Percent Valid Percent Cumulative Percent
Valid somewhat agree 2 20.0 20.0 20.0
Agree 8 80.0 80.0 100.0 Total 10 100.0 100.0
Balance Scorecard/organization number five – Table (32)
Frequency Percent Valid Percent Cumulative Percent
Valid 7.5 10 100.0 100.0 100.0 EFQM/organization number five – Table (33)
Frequency Percent Valid Percent Cumulative Percent
Valid 2.5 1 10.0 10.0 10.0 somewhat agree 1 10.0 10.0 20.0
7.5 3 30.0 30.0 50.0 Agree 5 50.0 50.0 100.0 Total 10 100.0 100.0
3-7.2 Histogram Graph number (19)
ISO 9001 : 2008/organization number five
10.07.55.0
ISO 9001 : 2008/organization number five
Freq
uenc
y
10
8
6
4
2
0
Std. Dev = 2.11 Mean = 9.0
N = 10.00

[133]
Balance Scorecard/organization number five
7.5
Balance Scorecard/organization number fiveFr
eque
ncy
12
10
8
6
4
2
0
Std. Dev = 0.00 Mean = 7.5
N = 10.00
Graph (20)
EFQM/organization number five
10.08.06.04.02.0
EFQM/organization number five
Freq
uenc
y
6
5
4
3
2
1
0
Std. Dev = 2.58 Mean = 8.0
N = 10.00
Graph number (21)

[134]
3-8 Organization Six 3-8.0 Frequencies analysis for ISO 9001:2008, Balance scorecard and EFQM for organization six Statistics – Table (34)
ISO 9001:2008/Organization six
Balance scorcard/organization number six
EFQM/organization number six
N Valid 10 10 10 Missing 0 0 0
Mean 10.0000 7.5000 10.0000 Std. Error of Mean .00000 .00000 .00000 Median 10.0000 7.5000 10.0000 Mode 10.00 7.50 10.00 Std. Deviation .00000 .00000 .00000 Variance .00000 .00000 .00000 Range .00 .00 .00 Minimum 10.00 7.50 10.00 Maximum 10.00 7.50 10.00 Sum 100.00 75.00 100.00 Percentiles 10 10.0000 7.5000 10.0000
20 10.0000 7.5000 10.0000 25 10.0000 7.5000 10.0000 30 10.0000 7.5000 10.0000 40 10.0000 7.5000 10.0000 50 10.0000 7.5000 10.0000 60 10.0000 7.5000 10.0000 70 10.0000 7.5000 10.0000 75 10.0000 7.5000 10.0000 80 10.0000 7.5000 10.0000 90 10.0000 7.5000 10.0000
3-8.1 Frequency Table for ISO 9001:2008, Balance scorecard and EFQM for organization six ISO 9001:2008/Organization six – Table number (35)
Frequency Percent Valid Percent Cumulative Percent
Valid Agree 10 100.0 100.0 100.0
Balance scorcard/organization number six – Table number (36)
Frequency Percent Valid Percent Cumulative Percent
Valid 7.5 10 100.0 100.0 100.0

[135]
EFQM/organization number six – Table number (37)
Frequency Percent Valid Percent Cumulative Percent
Valid Agree 10 100.0 100.0 100.0
3-8.2 Histogram for ISO 9001:2008, Balance scorecard and EFQM for organization six Graph number ( 22)
ISO 9001:2008/Organization six
10.0
ISO 9001:2008/Organization six
Freq
uenc
y
12
10
8
6
4
2
0
Std. Dev = 0.00 Mean = 10.0
N = 10.00
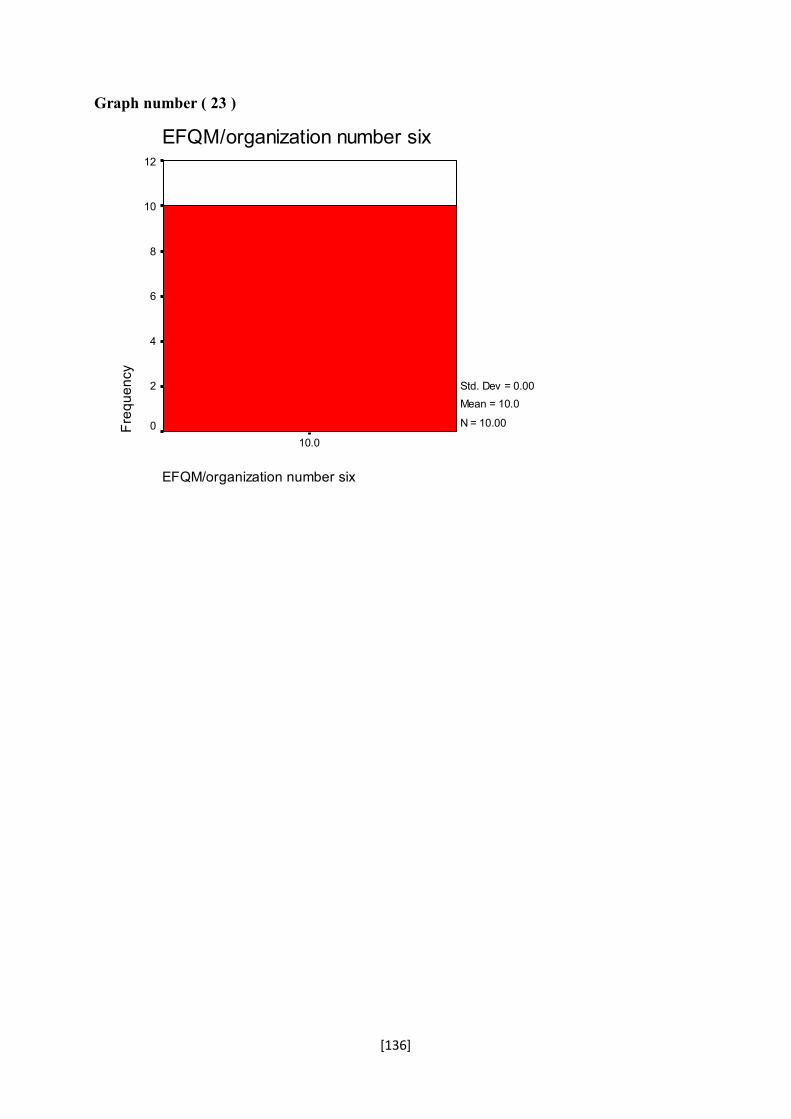
[136]
Graph number ( 23 )
EFQM/organization number six
10.0
EFQM/organization number sixFr
eque
ncy
12
10
8
6
4
2
0
Std. Dev = 0.00 Mean = 10.0
N = 10.00
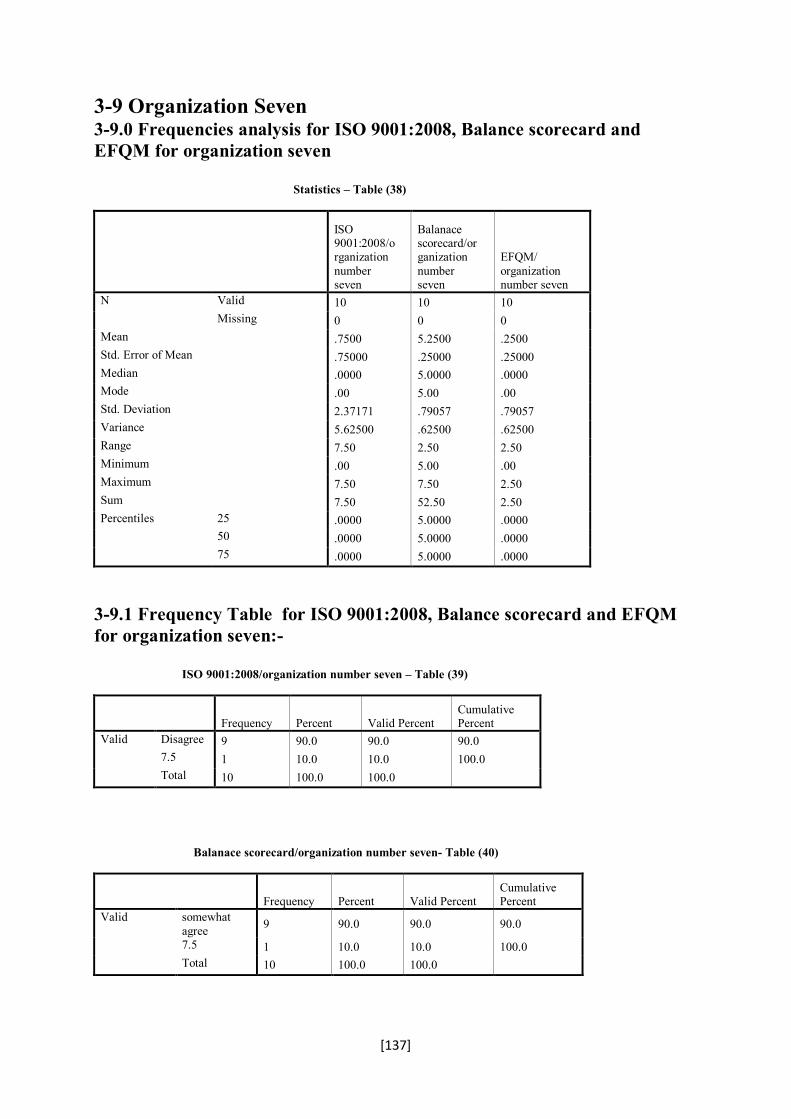
[137]
3-9 Organization Seven 3-9.0 Frequencies analysis for ISO 9001:2008, Balance scorecard and EFQM for organization seven Statistics – Table (38)
ISO 9001:2008/organization number seven
Balanace scorecard/organization number seven
EFQM/ organization number seven
N Valid 10 10 10 Missing 0 0 0
Mean .7500 5.2500 .2500 Std. Error of Mean .75000 .25000 .25000 Median .0000 5.0000 .0000 Mode .00 5.00 .00 Std. Deviation 2.37171 .79057 .79057 Variance 5.62500 .62500 .62500 Range 7.50 2.50 2.50 Minimum .00 5.00 .00 Maximum 7.50 7.50 2.50 Sum 7.50 52.50 2.50 Percentiles 25 .0000 5.0000 .0000
50 .0000 5.0000 .0000 75 .0000 5.0000 .0000
3-9.1 Frequency Table for ISO 9001:2008, Balance scorecard and EFQM for organization seven:- ISO 9001:2008/organization number seven – Table (39)
Frequency Percent Valid Percent Cumulative Percent
Valid Disagree 9 90.0 90.0 90.0 7.5 1 10.0 10.0 100.0 Total 10 100.0 100.0
Balanace scorecard/organization number seven- Table (40)
Frequency Percent Valid Percent Cumulative Percent
Valid somewhat agree 9 90.0 90.0 90.0
7.5 1 10.0 10.0 100.0 Total 10 100.0 100.0

[138]
EFQM/ organization number seven –Table number (41)
Frequency Percent Valid Percent Cumulative Percent
Valid Disagree 9 90.0 90.0 90.0 2.5 1 10.0 10.0 100.0 Total 10 100.0 100.0
3-9.2 Histogram for organization seven Graph number (24)
ISO 9001:2008/organization number seven
10.05.00.0
ISO 9001:2008/organization number seven
Freq
uenc
y
10
8
6
4
2
0
Std. Dev = 2.37 Mean = .8
N = 10.00
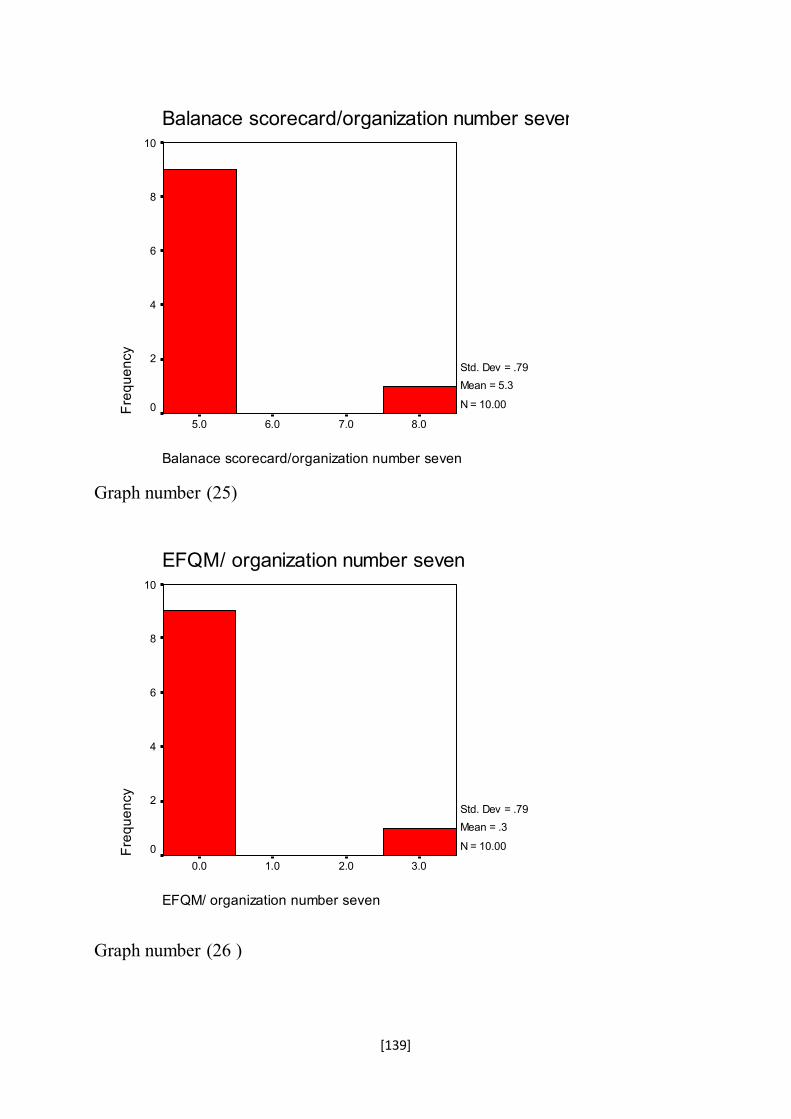
[139]
Balanace scorecard/organization number seven
8.07.06.05.0
Balanace scorecard/organization number sevenFr
eque
ncy
10
8
6
4
2
0
Std. Dev = .79 Mean = 5.3
N = 10.00
Graph number (25)
EFQM/ organization number seven
3.02.01.00.0
EFQM/ organization number seven
Freq
uenc
y
10
8
6
4
2
0
Std. Dev = .79 Mean = .3
N = 10.00
Graph number (26 )

[140]
3-10 HYPOTHESIS ONE TEST
Believe to ISO 9001: 2008, Balance scorecard and EFQM
3-10.0 NPar Tests Descriptive Statistics – Table number (42)
N Mean Minimum Maximum organization number one 3 9.1667 7.50 10.00 organization number two 3 9.1667 7.50 10.00 organization number three
3 9.1667 7.50 10.00
organization number four 3 9.1667 7.50 10.00 organization number five 3 9.1667 7.50 10.00 organization number six 3 9.1667 7.50 10.00 organization number seven
3 9.1667 7.50 10.00
The mean in all organizations are equal together that mean they all equal in believe
3-10.1 Chi-Square Test Frequencies organization number one – Table number (43)
Observed N 7.5 1 agree 2 Total 3
organization number three – Table number (44)
Observed N 7.5 1 agree 2 Total 3
organization number four – Table number (45)
Observed N 7.5 1 agree 2 Total 3
organization number five- Table number (46)
Observed N 7.5 1 agree 2 Total 3

[141]
organization number six – Table number (47)
Observed N 7.5 1 agree 2 Total 3
organization number seven – Table number (48)
Observed N 7.5 1 agree 2 Total 3
3-10.2 Test Statistics – Table number (49)
organization number one
organization number two
organization number three
organization number four
organization number five
organization number six
organization number seven
Chi-Square(a) .333 .333 .333 .333 .333 .333 .333
Df 1 1 1 1 1 1 1 Asymp. Sig. .564 .564 .564 .564 .564 .564 .564
3-11 HYPOTHESIS TWO TEST
3-11.0 Oneway for seven ISO 9001:2008 organizations Tests of Normality – Table number (50)
Kolmogorov-Smirnov(a) Shapiro-Wilk
Sig. Sig. GROUP .000 .000
Test of Homogeneity of Variances – Table number (51) GROUP
Levene Statistic df1 df2 Sig. 9.103 6 63 .000
No Homogeny ANOVA – Table number (52) GROUP
Sum of Squares Df Mean Square F Sig.
Between Groups 922.143 6 153.690 20.411 .000 Within Groups 474.375 63 7.530 Total 1396.518 69
No significant – Do Chi Square test.
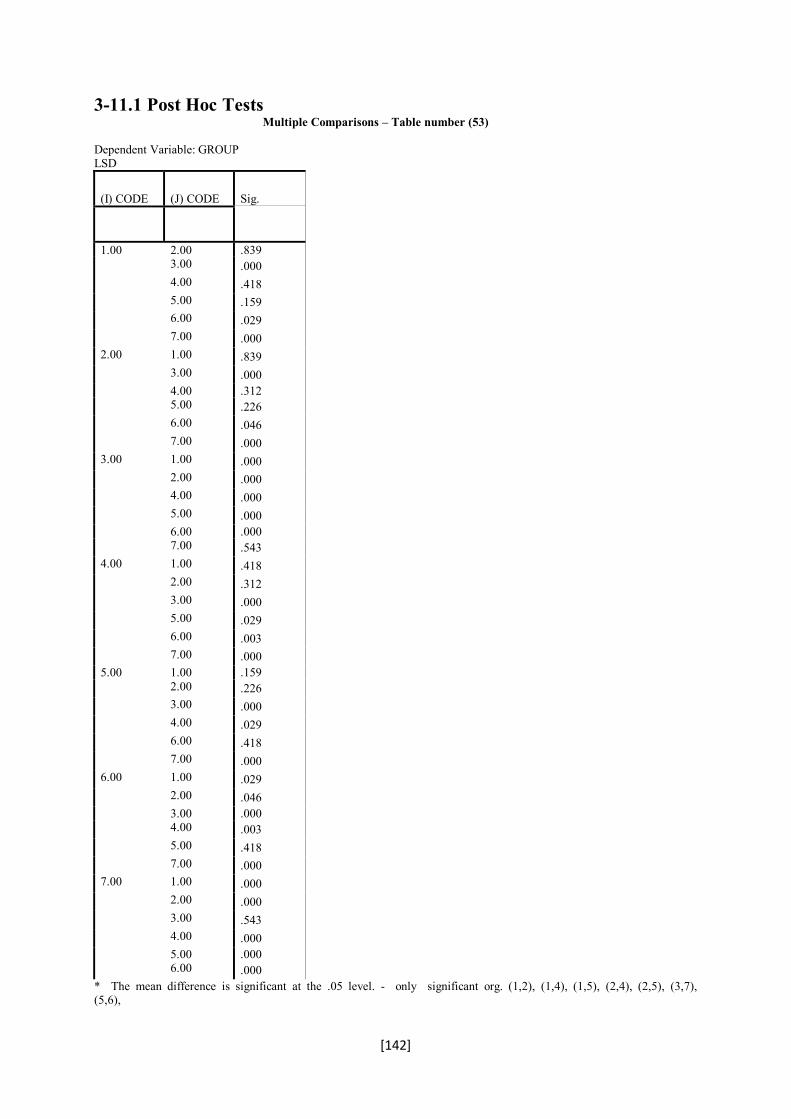
[142]
3-11.1 Post Hoc Tests Multiple Comparisons – Table number (53) Dependent Variable: GROUP LSD
(I) CODE (J) CODE Sig.
1.00 2.00 .839 3.00 .000 4.00 .418 5.00 .159 6.00 .029 7.00 .000 2.00 1.00 .839 3.00 .000 4.00 .312 5.00 .226 6.00 .046 7.00 .000 3.00 1.00 .000 2.00 .000 4.00 .000 5.00 .000 6.00 .000 7.00 .543 4.00 1.00 .418 2.00 .312 3.00 .000 5.00 .029 6.00 .003 7.00 .000 5.00 1.00 .159 2.00 .226 3.00 .000 4.00 .029 6.00 .418 7.00 .000 6.00 1.00 .029 2.00 .046 3.00 .000 4.00 .003 5.00 .418 7.00 .000 7.00 1.00 .000 2.00 .000 3.00 .543 4.00 .000 5.00 .000 6.00 .000
* The mean difference is significant at the .05 level. - only significant org. (1,2), (1,4), (1,5), (2,4), (2,5), (3,7), (5,6),

[143]
3-11.2 Oneway for five ISO 9001:2008 organizations Test of Homogeneity of Variances- Table (54) GROUP
Levene Statistic df1 df2 Sig. 6.572 4 45 .000
ANOVA – Table (55) GROUP
Sum of Squares Df Mean Square F Sig.
Between Groups 131.750 4 32.938 3.378 .017 Within Groups 438.750 45 9.750 Total 570.500 49
3-11.3 Post Hoc Tests Multiple Comparisons – Table (56) Dependent Variable: GROUP LSD
(I) CODE (J) CODE Sig.
1.00 2.00 .859 3.00 .159 4.00 .217 5.00 .055 2.00 1.00 .859 3.00 .114 4.00 .288 5.00 .080 3.00 1.00 .159 2.00 .114 4.00 .010 5.00 .001 4.00 1.00 .217 2.00 .288 3.00 .010 5.00 .478 5.00 1.00 .055 2.00 .080 3.00 .001 4.00 .478
* The mean difference is significant at the .05 level.
3-11.4 NPar Tests Descriptive Statistics- Table number (57)
N Mean Std. Deviation Minimum Maximum iso 9001:2008 organization 1 10 7.2500 4.15832 .00 10.00
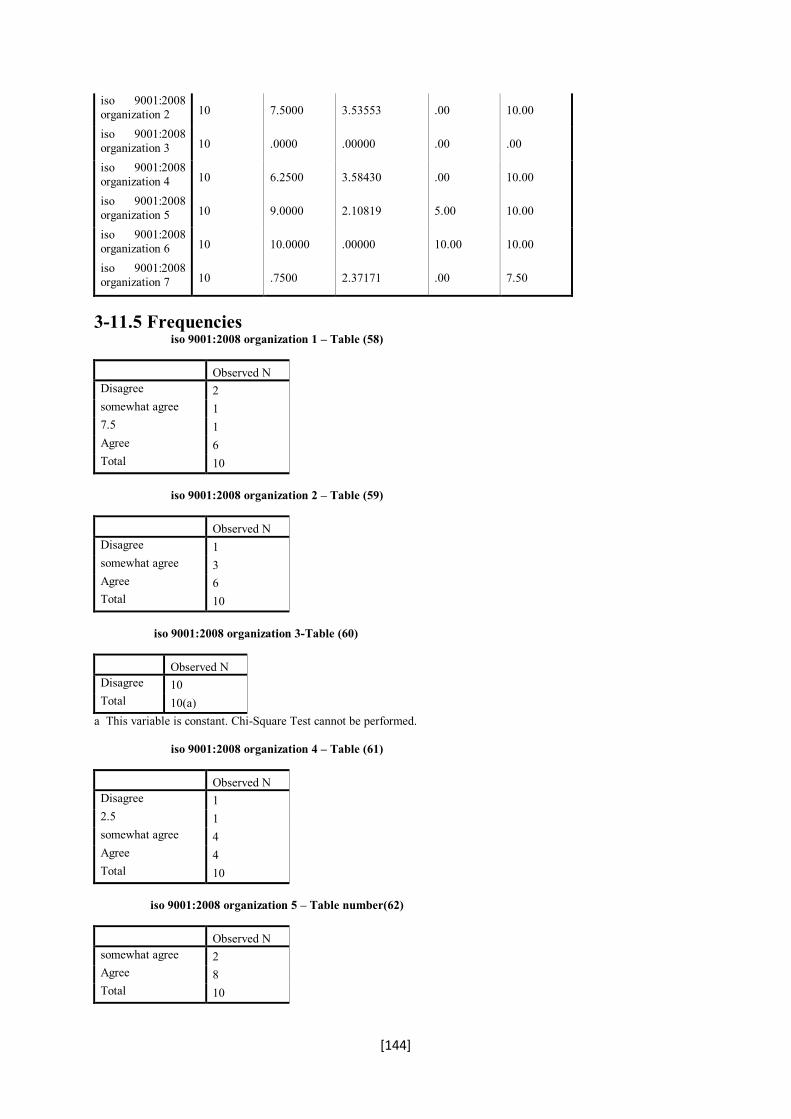
[144]
iso 9001:2008 organization 2 10 7.5000 3.53553 .00 10.00
iso 9001:2008 organization 3 10 .0000 .00000 .00 .00
iso 9001:2008 organization 4 10 6.2500 3.58430 .00 10.00
iso 9001:2008 organization 5 10 9.0000 2.10819 5.00 10.00
iso 9001:2008 organization 6 10 10.0000 .00000 10.00 10.00
iso 9001:2008 organization 7 10 .7500 2.37171 .00 7.50
3-11.5 Frequencies iso 9001:2008 organization 1 – Table (58)
Observed N Disagree 2 somewhat agree 1 7.5 1 Agree 6 Total 10
iso 9001:2008 organization 2 – Table (59)
Observed N Disagree 1 somewhat agree 3 Agree 6 Total 10
iso 9001:2008 organization 3-Table (60)
Observed N Disagree 10 Total 10(a)
a This variable is constant. Chi-Square Test cannot be performed. iso 9001:2008 organization 4 – Table (61)
Observed N Disagree 1 2.5 1 somewhat agree 4 Agree 4 Total 10
iso 9001:2008 organization 5 – Table number(62)
Observed N somewhat agree 2 Agree 8 Total 10
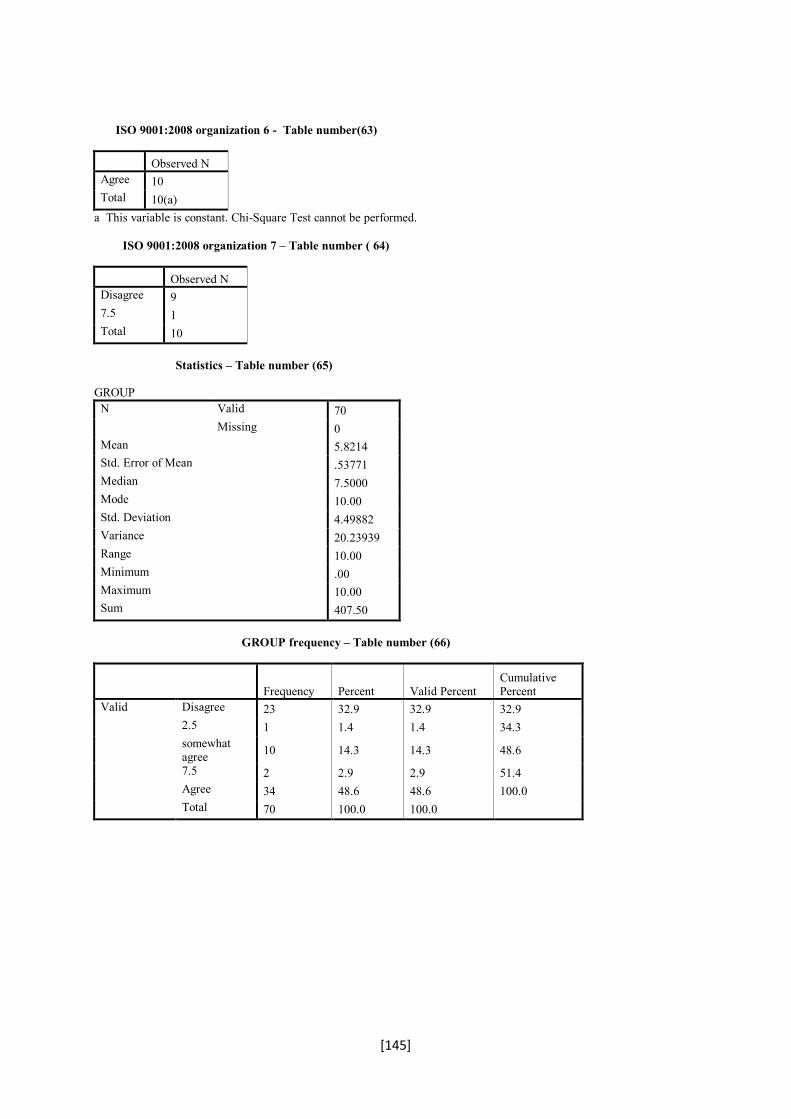
[145]
ISO 9001:2008 organization 6 - Table number(63)
Observed N Agree 10 Total 10(a)
a This variable is constant. Chi-Square Test cannot be performed. ISO 9001:2008 organization 7 – Table number ( 64)
Observed N Disagree 9 7.5 1 Total 10
Statistics – Table number (65) GROUP
N Valid 70 Missing 0
Mean 5.8214 Std. Error of Mean .53771 Median 7.5000 Mode 10.00 Std. Deviation 4.49882 Variance 20.23939 Range 10.00 Minimum .00 Maximum 10.00 Sum 407.50
GROUP frequency – Table number (66)
Frequency Percent Valid Percent Cumulative Percent
Valid Disagree 23 32.9 32.9 32.9 2.5 1 1.4 1.4 34.3 somewhat agree 10 14.3 14.3 48.6
7.5 2 2.9 2.9 51.4 Agree 34 48.6 48.6 100.0 Total 70 100.0 100.0
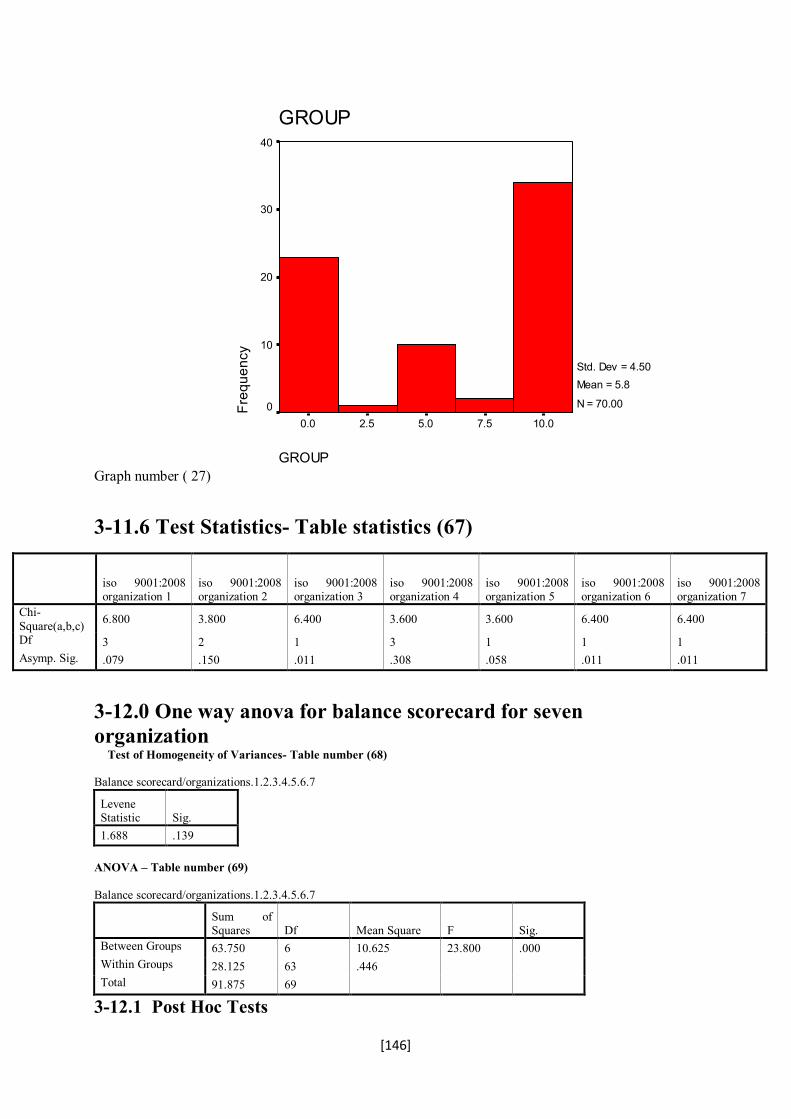
[146]
Graph number ( 27)GROUP
10.07.55.02.50.0
GROUP
Freq
uenc
y
40
30
20
10
0
Std. Dev = 4.50 Mean = 5.8
N = 70.00
3-11.6 Test Statistics- Table statistics (67)
iso 9001:2008 organization 1
iso 9001:2008 organization 2
iso 9001:2008 organization 3
iso 9001:2008 organization 4
iso 9001:2008 organization 5
iso 9001:2008 organization 6
iso 9001:2008 organization 7
Chi-Square(a,b,c) 6.800 3.800 6.400 3.600 3.600 6.400 6.400
Df 3 2 1 3 1 1 1 Asymp. Sig. .079 .150 .011 .308 .058 .011 .011
3-12.0 One way anova for balance scorecard for seven organization Test of Homogeneity of Variances- Table number (68) Balance scorecard/organizations.1.2.3.4.5.6.7
Levene Statistic Sig. 1.688 .139
ANOVA – Table number (69) Balance scorecard/organizations.1.2.3.4.5.6.7
Sum of Squares Df Mean Square F Sig.
Between Groups 63.750 6 10.625 23.800 .000 Within Groups 28.125 63 .446 Total 91.875 69
3-12.1 Post Hoc Tests

[147]
Multiple Comparisons- Table (70) Dependent Variable: Balance scorecard/organizations.1.2.3.4.5.6.7 LSD
(I) code of group (J) code of group Sig.
1 2 1.000 3 .406 4 .406 5 .000 6 .000 7 1.000 2 1 1.000 3 .406 4 .406 5 .000 6 .000 7 1.000 3 1 .406 2 .406 4 1.000 5 .000 6 .000 7 .406 4 1 .406 2 .406 3 1.000 5 .000 6 .000 7 .406 5 1 .000 2 .000 3 .000 4 .000 6 1.000 7 .000 6 1 .000 2 .000 3 .000 4 .000 5 1.000 7 .000 7 1 1.000 2 1.000 3 .406 4 .406 5 .000 6 .000
* The mean difference is significant at the .05 level.
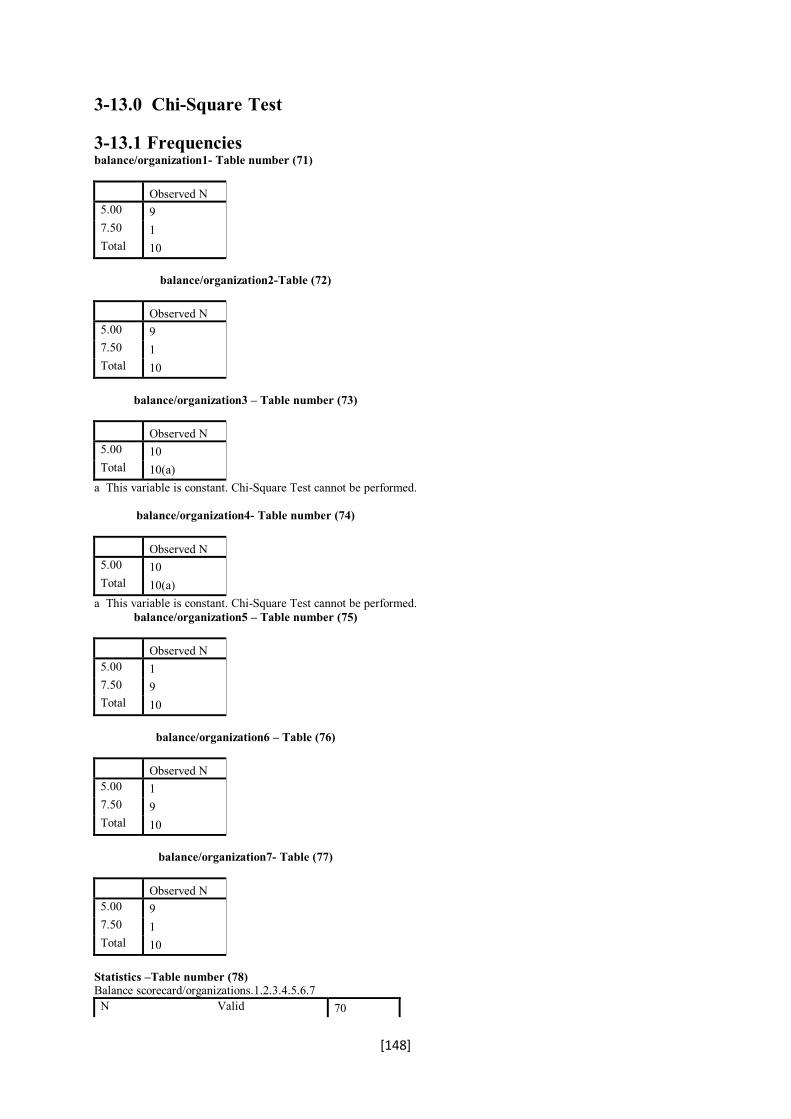
[148]
3-13.0 Chi-Square Test
3-13.1 Frequencies balance/organization1- Table number (71)
Observed N 5.00 9 7.50 1 Total 10
balance/organization2-Table (72)
Observed N 5.00 9 7.50 1 Total 10
balance/organization3 – Table number (73)
Observed N 5.00 10 Total 10(a)
a This variable is constant. Chi-Square Test cannot be performed. balance/organization4- Table number (74)
Observed N 5.00 10 Total 10(a)
a This variable is constant. Chi-Square Test cannot be performed. balance/organization5 – Table number (75)
Observed N 5.00 1 7.50 9 Total 10
balance/organization6 – Table (76)
Observed N 5.00 1 7.50 9 Total 10
balance/organization7- Table (77)
Observed N 5.00 9 7.50 1 Total 10
Statistics –Table number (78) Balance scorecard/organizations.1.2.3.4.5.6.7
N Valid 70
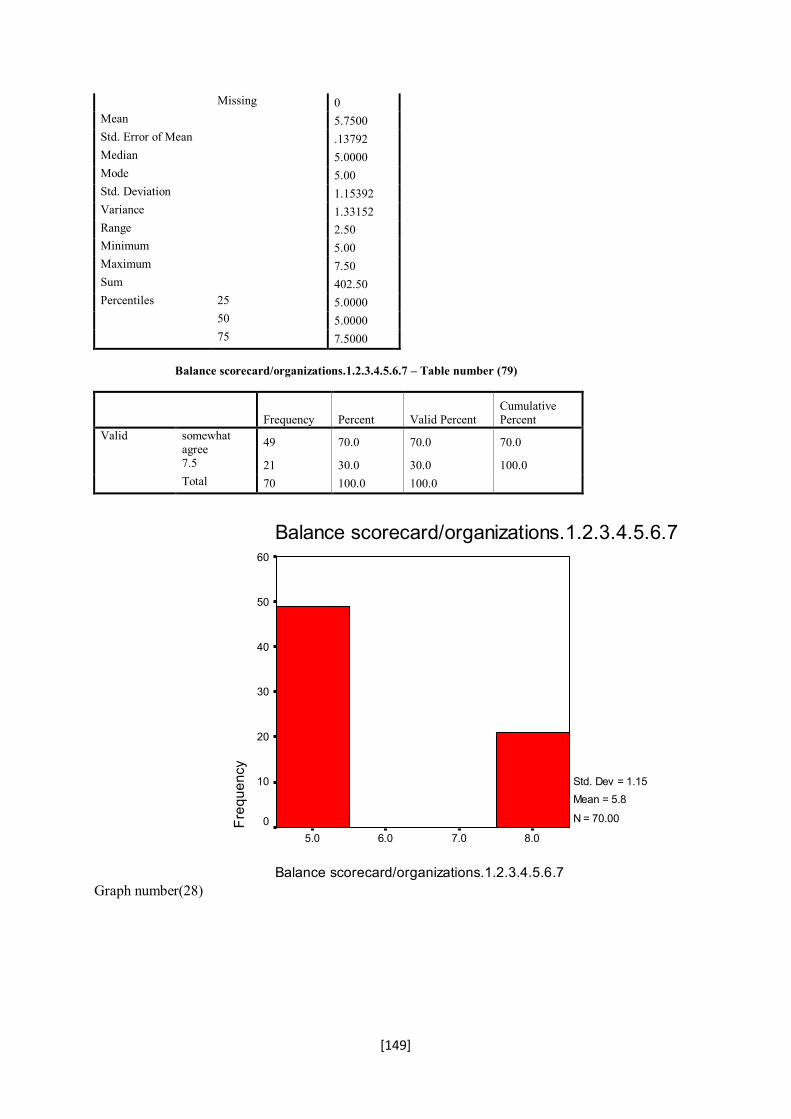
[149]
Missing 0 Mean 5.7500 Std. Error of Mean .13792 Median 5.0000 Mode 5.00 Std. Deviation 1.15392 Variance 1.33152 Range 2.50 Minimum 5.00 Maximum 7.50 Sum 402.50 Percentiles 25 5.0000
50 5.0000 75 7.5000
Balance scorecard/organizations.1.2.3.4.5.6.7 – Table number (79)
Frequency Percent Valid Percent Cumulative Percent
Valid somewhat agree 49 70.0 70.0 70.0
7.5 21 30.0 30.0 100.0 Total 70 100.0 100.0
Graph number(28) Balance scorecard/organizations.1.2.3.4.5.6.7
8.07.06.05.0
Balance scorecard/organizations.1.2.3.4.5.6.7
Freq
uenc
y
60
50
40
30
20
10
0
Std. Dev = 1.15 Mean = 5.8
N = 70.00

[150]
3-13. 2 Test Statistics – Table number (80)
balance/organization1
balance/organization2
balance/organization5
balance/organization6
balance/organization7
Chi-Square(a) 6.400 6.400 6.400 6.400 6.400
df 1 1 1 1 1 Asymp. Sig. .011 .011 .011 .011 .011
a 0 cells (.0%) have expected frequencies less than 5. The minimum expected cell frequency is 5.0.
3-14.0 One way anova for EFQM for seven organizations Test of Homogeneity of Variances – Table number (81) EFQM for organization 1,2,3,4,5,6 and 7
Levene Statistic Sig. 6.497 .000
ANOVA- Table number (82) EFQM for organization 1,2,3,4,5,6 and 7
Sig. Between Groups .000 Within Groups Total
3-14.1 Post Hoc Tests Multiple Comparisons – Table number (83) Dependent Variable: EFQM for organization 1,2,3,4,5,6 and 7 LSD
(I) code of group (J) code of group Sig.
1 2 .000 3 .000 4 .000 5 .402 6 .000 7 .000 2 1 .000 3 .402 4 1.000 5 .000 6 .000 7 .675 3 1 .000 2 .402 4 .402 5 .000 6 .000 7 .675
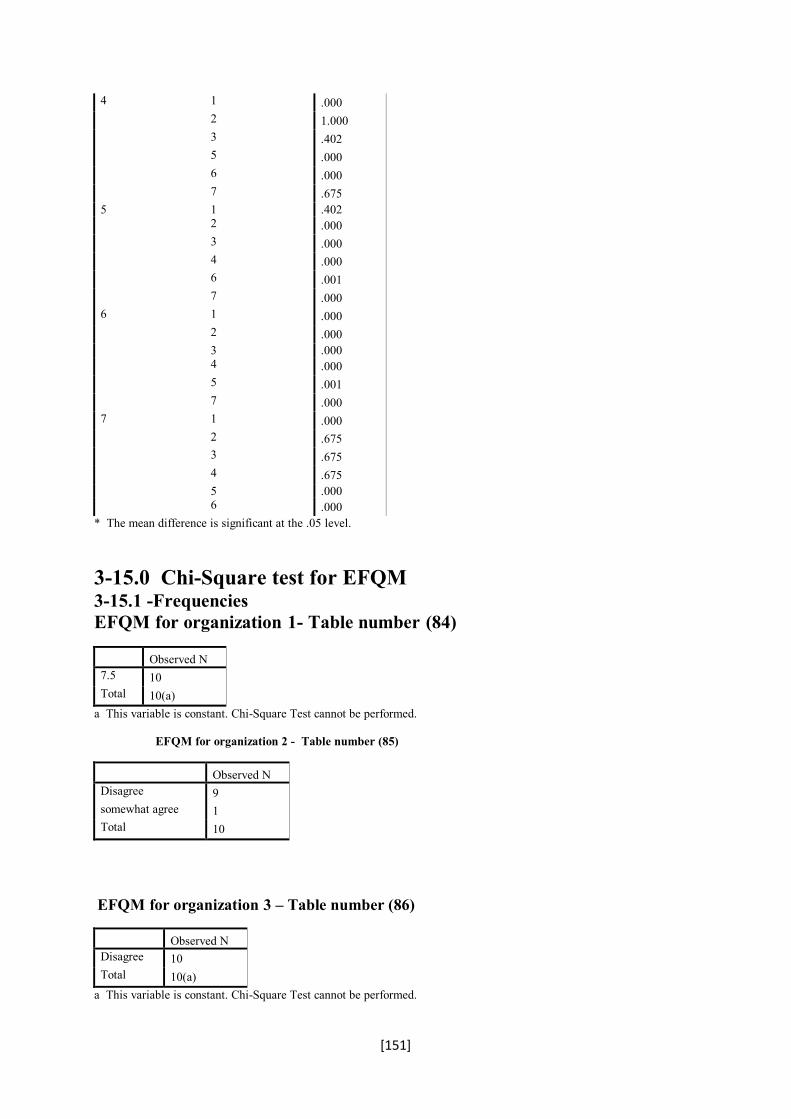
[151]
4 1 .000 2 1.000 3 .402 5 .000 6 .000 7 .675 5 1 .402 2 .000 3 .000 4 .000 6 .001 7 .000 6 1 .000 2 .000 3 .000 4 .000 5 .001 7 .000 7 1 .000 2 .675 3 .675 4 .675 5 .000 6 .000
* The mean difference is significant at the .05 level.
3-15.0 Chi-Square test for EFQM 3-15.1 -Frequencies EFQM for organization 1- Table number (84)
Observed N 7.5 10 Total 10(a)
a This variable is constant. Chi-Square Test cannot be performed. EFQM for organization 2 - Table number (85)
Observed N Disagree 9 somewhat agree 1 Total 10
EFQM for organization 3 – Table number (86)
Observed N Disagree 10 Total 10(a)
a This variable is constant. Chi-Square Test cannot be performed.
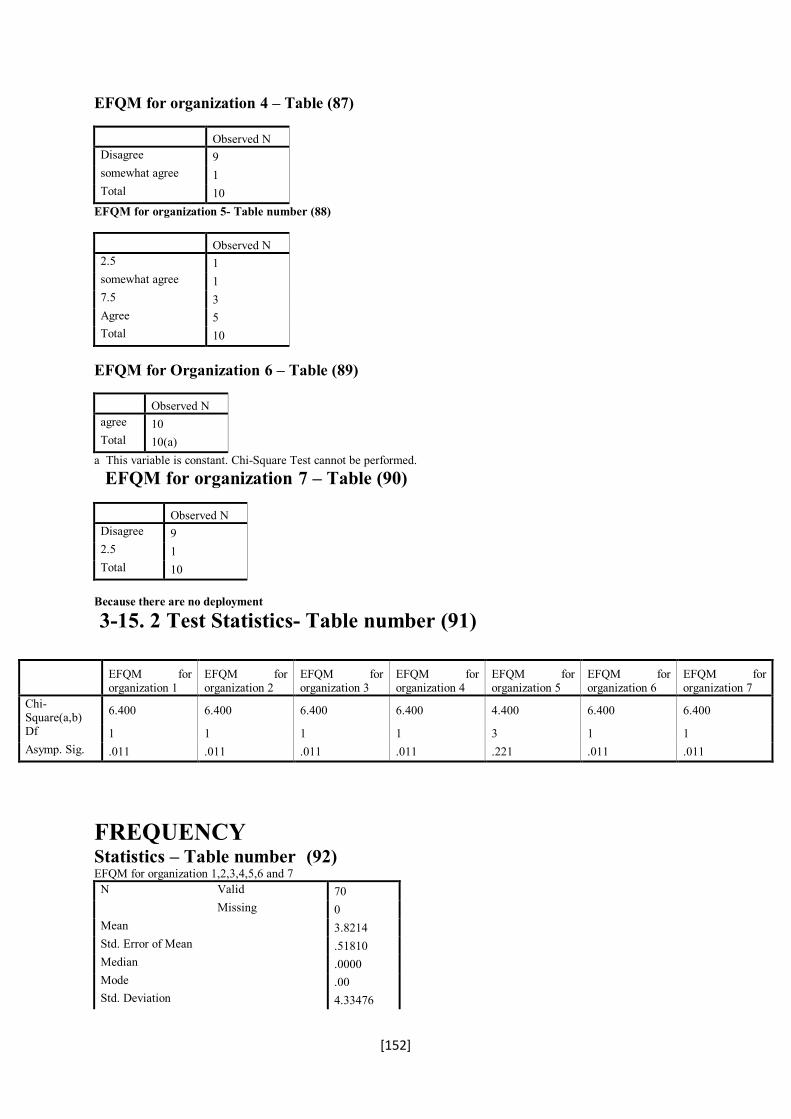
[152]
EFQM for organization 4 – Table (87)
Observed N Disagree 9 somewhat agree 1 Total 10
EFQM for organization 5- Table number (88)
Observed N 2.5 1 somewhat agree 1 7.5 3 Agree 5 Total 10
EFQM for Organization 6 – Table (89)
Observed N agree 10 Total 10(a)
a This variable is constant. Chi-Square Test cannot be performed.
EFQM for organization 7 – Table (90)
Observed N Disagree 9 2.5 1 Total 10
Because there are no deployment
3-15. 2 Test Statistics- Table number (91)
FREQUENCY Statistics – Table number (92) EFQM for organization 1,2,3,4,5,6 and 7
N Valid 70 Missing 0
Mean 3.8214 Std. Error of Mean .51810 Median .0000 Mode .00 Std. Deviation 4.33476
EFQM for organization 1
EFQM for organization 2
EFQM for organization 3
EFQM for organization 4
EFQM for organization 5
EFQM for organization 6
EFQM for organization 7
Chi-Square(a,b) 6.400 6.400 6.400 6.400 4.400 6.400 6.400
Df 1 1 1 1 3 1 1 Asymp. Sig. .011 .011 .011 .011 .221 .011 .011
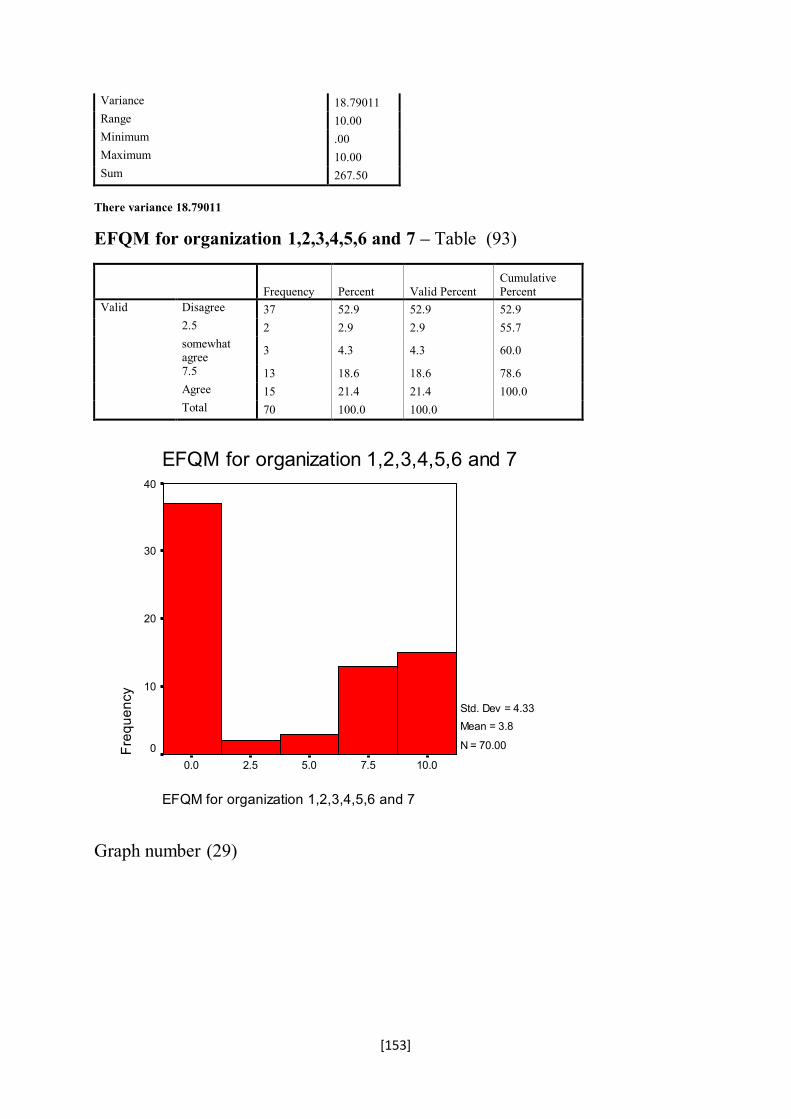
[153]
Variance 18.79011 Range 10.00 Minimum .00 Maximum 10.00 Sum 267.50
There variance 18.79011 EFQM for organization 1,2,3,4,5,6 and 7 – Table (93)
Frequency Percent Valid Percent Cumulative Percent
Valid Disagree 37 52.9 52.9 52.9 2.5 2 2.9 2.9 55.7 somewhat agree 3 4.3 4.3 60.0
7.5 13 18.6 18.6 78.6 Agree 15 21.4 21.4 100.0 Total 70 100.0 100.0
EFQM for organization 1,2,3,4,5,6 and 7
10.07.55.02.50.0
EFQM for organization 1,2,3,4,5,6 and 7
Freq
uenc
y
40
30
20
10
0
Std. Dev = 4.33 Mean = 3.8
N = 70.00
Graph number (29)
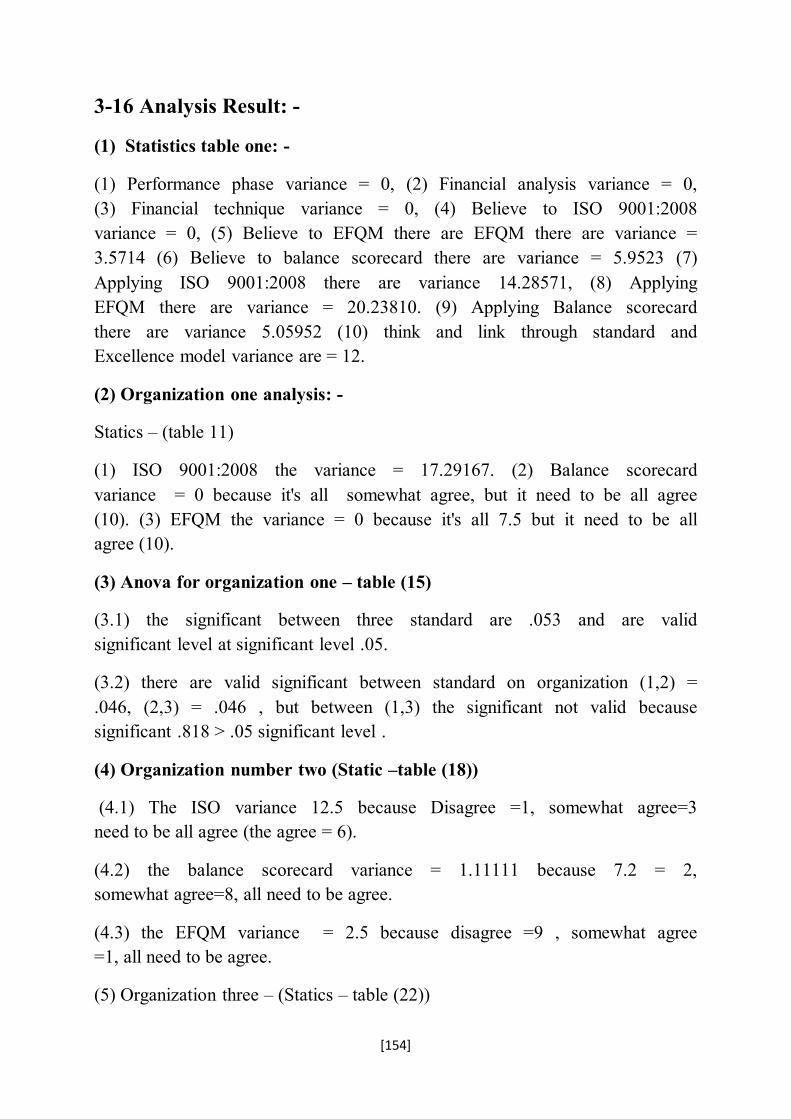
[154]
3-16 Analysis Result: -
(1) Statistics table one: -
(1) Performance phase variance = 0, (2) Financial analysis variance = 0, (3) Financial technique variance = 0, (4) Believe to ISO 9001:2008 variance = 0, (5) Believe to EFQM there are EFQM there are variance = 3.5714 (6) Believe to balance scorecard there are variance = 5.9523 (7) Applying ISO 9001:2008 there are variance 14.28571, (8) Applying EFQM there are variance = 20.23810. (9) Applying Balance scorecard there are variance 5.05952 (10) think and link through standard and Excellence model variance are = 12.
(2) Organization one analysis: -
Statics – (table 11)
(1) ISO 9001:2008 the variance = 17.29167. (2) Balance scorecard variance = 0 because it's all somewhat agree, but it need to be all agree (10). (3) EFQM the variance = 0 because it's all 7.5 but it need to be all agree (10).
(3) Anova for organization one – table (15)
(3.1) the significant between three standard are .053 and are valid significant level at significant level .05.
(3.2) there are valid significant between standard on organization (1,2) = .046, (2,3) = .046 , but between (1,3) the significant not valid because significant .818 > .05 significant level .
(4) Organization number two (Static –table (18))
(4.1) The ISO variance 12.5 because Disagree =1, somewhat agree=3 need to be all agree (the agree = 6).
(4.2) the balance scorecard variance = 1.11111 because 7.2 = 2, somewhat agree=8, all need to be agree.
(4.3) the EFQM variance = 2.5 because disagree =9 , somewhat agree =1, all need to be agree.
(5) Organization three – (Statics – table (22))
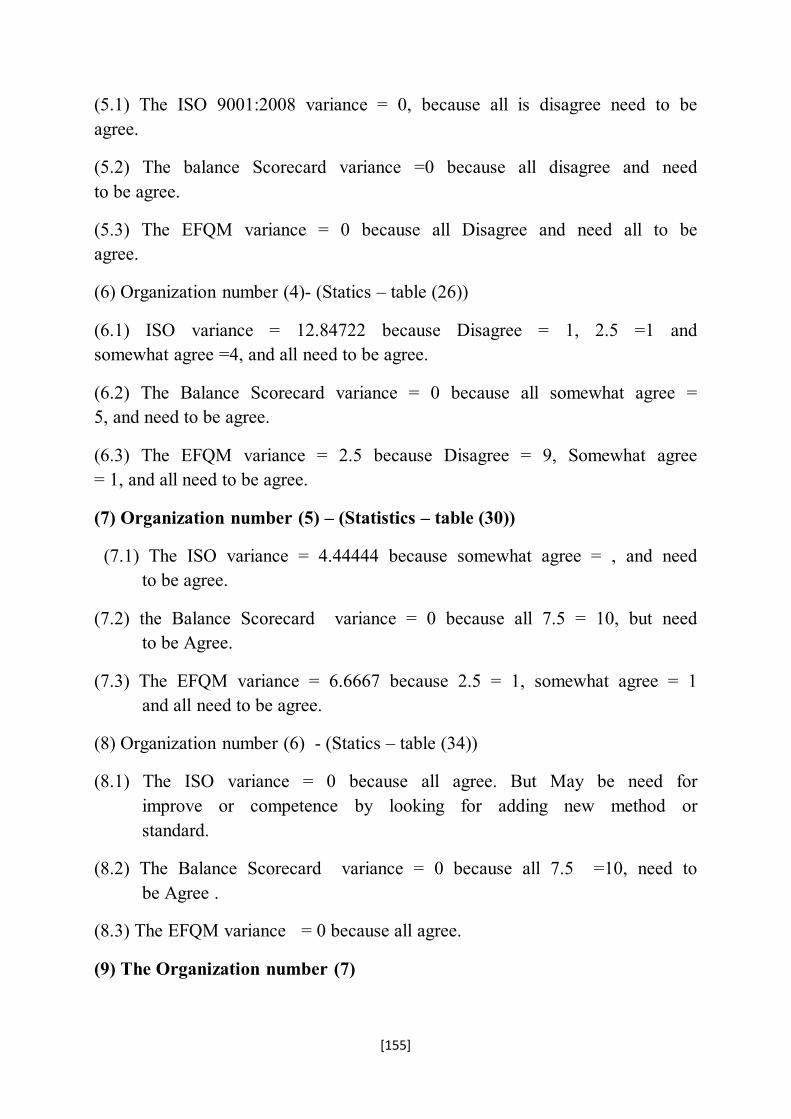
[155]
(5.1) The ISO 9001:2008 variance = 0, because all is disagree need to be agree.
(5.2) The balance Scorecard variance =0 because all disagree and need to be agree.
(5.3) The EFQM variance = 0 because all Disagree and need all to be agree.
(6) Organization number (4)- (Statics – table (26))
(6.1) ISO variance = 12.84722 because Disagree = 1, 2.5 =1 and somewhat agree =4, and all need to be agree.
(6.2) The Balance Scorecard variance = 0 because all somewhat agree = 5, and need to be agree.
(6.3) The EFQM variance = 2.5 because Disagree = 9, Somewhat agree = 1, and all need to be agree.
(7) Organization number (5) – (Statistics – table (30))
(7.1) The ISO variance = 4.44444 because somewhat agree = , and need to be agree.
(7.2) the Balance Scorecard variance = 0 because all 7.5 = 10, but need to be Agree.
(7.3) The EFQM variance = 6.6667 because 2.5 = 1, somewhat agree = 1 and all need to be agree.
(8) Organization number (6) - (Statics – table (34))
(8.1) The ISO variance = 0 because all agree. But May be need for improve or competence by looking for adding new method or standard.
(8.2) The Balance Scorecard variance = 0 because all 7.5 =10, need to be Agree .
(8.3) The EFQM variance = 0 because all agree.
(9) The Organization number (7)

[156]
(9.1) The ISO variance = 5.6, because Disagree =9 and 7.5 = 1, all need to be agree.
(9.2) The Balance Scorecard variance = .62500 because somewhat agree = 9 and 7.5 = 1, so all need to be agree.
(9.3) The EFQM variance .62500 because Disagree =9 and 2.5 = 1, and all need to be agree.
(10) Hypothesis one test
Believe to ISO 9001:2008, balance scorecard, and EFQM Descriptive statics – Table (42)
Organization number one mean = 9.1667, organization two mean = 9.1667, Organization number three = 9.1667, organization four = 9.1667, organization five mean = 9.1667, organization number six mean = 9.1667 and organization number seven mean = 9.1667, the means in all organization are equal together that mean the hypothesis believe are accepted or valid.
(11) Hypothesis two test
Anova – (table (52))
(11.1) Significant for seven 0.000, for five .017 < sig. Level .05 so there are valid significant for ISO 9001:2008 implement, deployment, assessment and refined for all the samples.
(11.2) Significant 0.000 < .05 sig. Level, there are valid significant, the hypothesis (2.2) balance Scorecard implement, deployment. Assessment and refined valid significant on all the samples.
(11.3) Significant 0.00 < .05 there are valid significant for hypothesis (2.3) EFQM implement, deployment, assessment and refined

[157]
CHAPTER (4): CONCLUSION, RESULT AND RECOMMENDATIONS
4-1 CONCLUSION
This Research explain some definition in performance measurement, type of performance, performance measure process, performance measure organization and on private and public organization, and performance measure phase and performance measure organization through Excellence Model and Quality management system (ISO).
So I seek the performance measure financial and non financial, financial through accounting roles and non financial through performance measure process thinking, performance measure organization and performance measure organization through standard (Excellence Model and Quality management system (ISO)).
The purpose let me start with performance measure process (Through process thinking) that to build up our abilities to improve through standard ((Excellence Model and Quality management system (ISO)) because it build on the quality gurus theories that we pass through it on performance measure process (process thinking).
And how we assessment through quality management system audit (for quality management system) and assessment and scoring (for Excellence Model and awarded).
4-2 HYPOTHESIS TEST RESULTS
Hypothesis one Believe to ISO 9001:2008, Balance Scorecard and EFQM means in all organization are equal together that mean the hypothesis believe are valid significant. Hypothesis two The hypothesis ISO 9001: 2008 implement, deployment, assessment and refine are valid significant. The hypothesis BLC implement, deployment, assessment and refine are valid significant

[158]
The hypothesis EFQM implement, deployment, assessment and refine are valid significant
4-3 RESULT (THEORY AND FIELD PERSPECTIVE)
These results and recommendations from side view of theory review in chapter two as following:-
(1) We use standard ((Excellence Model and Quality management system (ISO)) to do the right action or activity or procedures from first time that led us to reduce the cost to appropriate cost of quality management and production and quality cost and improve and measure performance measure.
(2) These standards focus on familiar criteria and different criteria. (3) So by different criteria on standard we use standard ((Excellence
Model and Quality management system (ISO)) in business excellence to think and link them together.
(4) As the theory of balance scorecard advise to use more than one theory for performance measure. As we hear performance measure is difficult to measure, so it's better to use different theory to measure performance (See balance and scorecard above).
(5) Be attention to the performance measurement not to be:- Increasing bureaucracy but decreasing it, Blocking innovation and ambition, focussing on the easy-to-measure over the important-to-measure unless lead to economic change, killing system responsibility, by discouraging cooperation among organization, and sometimes punishing good performance by taking resources from efficient producers to deal with inefficient producers unless there are economic reasons.
(6) work with the performance measurement phase that appoint organization goals, criteria for measurement and extraction the results.
(7) We compare with Islamic economic to not be there any different with Islamic's statutory and regulatory and Excellence Model's and Quality management system's statutory and regulatory.

[159]
(8) A process is improved by reducing the variance.1
From Visit side (To seven organization):- work more with complementary system for ISO 9001:2008, more identify for EFQM with ISO 9001:2008, and avoid Duplication, work with balance scorecard by named it on the procedure of work for manager, department and divisions, also for other theory of quality management, that mean balance scorecard are used but not named and prepared most of the organization with ISO by internal organization to decrease the cost of applying quality management.
(9) The seven organization are believe ISO 9001:2008, EFQM and Balance Scorecard.
(10) ISO 9001:2008, EFQM and balance scorecard are implemented, deployed and refined on five organization, one organization is on phase of implemented ISO and also one organization not implemented ISO but have special system for it, all seven organization considered partially implemented, deployed, assessed and refined Balance Scorecard and EFQM.
4-4 RECOMMENDATION AND ADVICE: -
These results and recommendations from side view of theory review in chapter two as following:-
(1) We use standard ((Excellence Model and Quality management system (ISO)) to do the right action or activity or procedures from first time that led us to reduce the cost to appropriate cost of quality management and production and quality cost and improve and measure performance measure.
(2) These standards focus on familiar criteria and different criteria.
(3) So by different criteria on standard we use standard ((Excellence Model and Quality management system (ISO)) in business excellence to think and link them together.
(4) As the theory of balance scorecard advise to use more than one theory for performance measure. As we hear performance measure is 1 (Research Methodology Methods and Techniques – page (161) line three. (Third Edi on) C R Kothari – Gaurav Garg)
[160]
difficult to measure, so it's better to use different theory to measure performance (See balance and scorecard above).
(5) Be attention to the performance measurement not to be:- Increasing bureaucracy but decreasing it, Blocking innovation and ambition, focussing on the easy-to-measure over the important-to-measure unless lead to economic change, killing system responsibility, by discouraging cooperation among organization, and sometimes punishing good performance by taking resources from efficient producers to deal with inefficient producers unless there are economic reasons.
(6) work with the performance measurement phase that appoint organization goals, criteria for measurement and extraction the results.
(7) We compare with Islamic economic to not be there any different with Islamic's statutory and regulatory and Excellence Model's and Quality management system's statutory and regulatory.
(8) A process is improved by reducing the variance.1
From Visit side (To seven organization):-
(1) Work more with complementary system for ISO 9001:2008,
(2) More identify for EFQM with ISO 9001:2008, and avoid Duplication,
(3) Work with balance scorecard by named it on the procedure of work for manager, Department and divisions, also for other theory of quality management, that mean balance scorecard are used but not named
(4) And prepared most of the organization with ISO by internal organization to decrease the cost of applying quality management.
1 (Research Methodology Methods and Techniques – page (161) line three. (Third Edi on) C R Kothari – Gaurav Garg)

[161]
REFERENCE
-: القران الكریم ).١٠٥(التوبة االیة سورة ) ١(
).٢(سورة الملك االیة ) ٢(
)١٥(سورة الملك االیة ) ٣(
)١٥(سورة الذاریات االیة ) ٤(
-: المراجع العربیة
-: الكتب) ١(
.الجودة الشاملة في االدارة التعلیمیة والمدرسیة: أحمد أحمد ابراھیم )١( .المعجم الوسیط : اللغة العربیةمجمع )٢(مدى استخدام جھاز الرقابة الشعبیة لمؤشرات تقییم االداء في تقییم أداء الشركات العامة الصناعیة )٣( .الیھلول محمد صالح – - : المجالت )٢(الدوحة ، قطر، العدد " مجلة التربیة" االدارة المدرسیة والقیادة مھارات : محمود عصام المیداني) ١( .٨٢، ص ) ٢٢(، السنة )١٠٤(
English Reference: -
(1) Book Reference: -
(1) Business Excellence (Module 8). (2) Delivering Excellence in Health and Social Care, Open University
Press, Buckingham. Moullin, M. (2002), (3) Holistic Performance measurement and the Balanced Scorecard
(Model
(4) Human Factors In Quality Management – (Module1).
(5) Indihar & Hernaus, 2007.
(6) Neely, Gregoy and Platts,2005
(7) Process thinking and Quality (Module 4).
(8) Quality management systems (module 6).

[162]
(9) Research Methodology Methods and Techniques. (Third Edition) C R Kothari – Gaurav Garg
(10) Scorecard for Measuring and Managing Stakeholder Relationships
A. D. Adams.
(11) Source adapted from Neely, 1999.
(12) Statistical test base & applications (Doctor Hassan Y. T.) Blue special university.
(13) The Performance Prism.
(14) Total Quality Management (Module 5)
(15) Zairi 1997
2. Journal: -
(1) BSI Broachers for ISO 9001: 2008. (2) Financial Times /Prentice Hall, London. 3. Lecture: -
(1) Business Excellence lecture in year 2013-Presentation prepared by 3. Website: - (1) https://examples.yourdictionary.com/refence/examples/examples-
of-current-liabilities.html
(2) Internet.
(3) Oxford dictionaries-languages matters.
(4) SIMA website www.cima.org.uk.
(5) www.authorstream.com/preentation/allanug-194060-ofqm-excelleance-model-operational-consulting.
(6) www.authorstream.com/preentation/allanug-194060-ofqm-excelleance-model-operational-consulting.

[163]
APPENDIX
APPENDIX (1):- QUESTIONNAIRE
QUESTIONNAIRE FOR PERFORMANCE MEASURE, QUALITY MANAGEMENT SYSTEM AND EXCELLENCE MODEL. (For Research purpose)
Organization Name: - The employee function name:-
Organization no.( )
General table no. (1) (Quality management system and Excellence Model) put mark to select score (√)
Question Disagree 0
2.5
Somewhat agree 5
7.5
Agree1 10
1. The three phase of performance measure are Identify organization's goals, select appropriate criteria for performance measure and Measure and extraction performance's results.
2. Financial analysis stage are financial situation, financial evaluation, Financial planning and Financial Control.
3. Financial technique are Income, Cost and profit Analysis, Break even analysis, ratio analysis and budget
4. Is your organization believe to ISO 9001 system
5. Is your organization believed to EFQM Model
6. Your organization believe to balance scorecard
7. Is your organization applying ISO system.
8. Is your organization applying EFQM system.
9. Is your organization apply balance 1 Total Quality Management – (Module 5)- page 14.
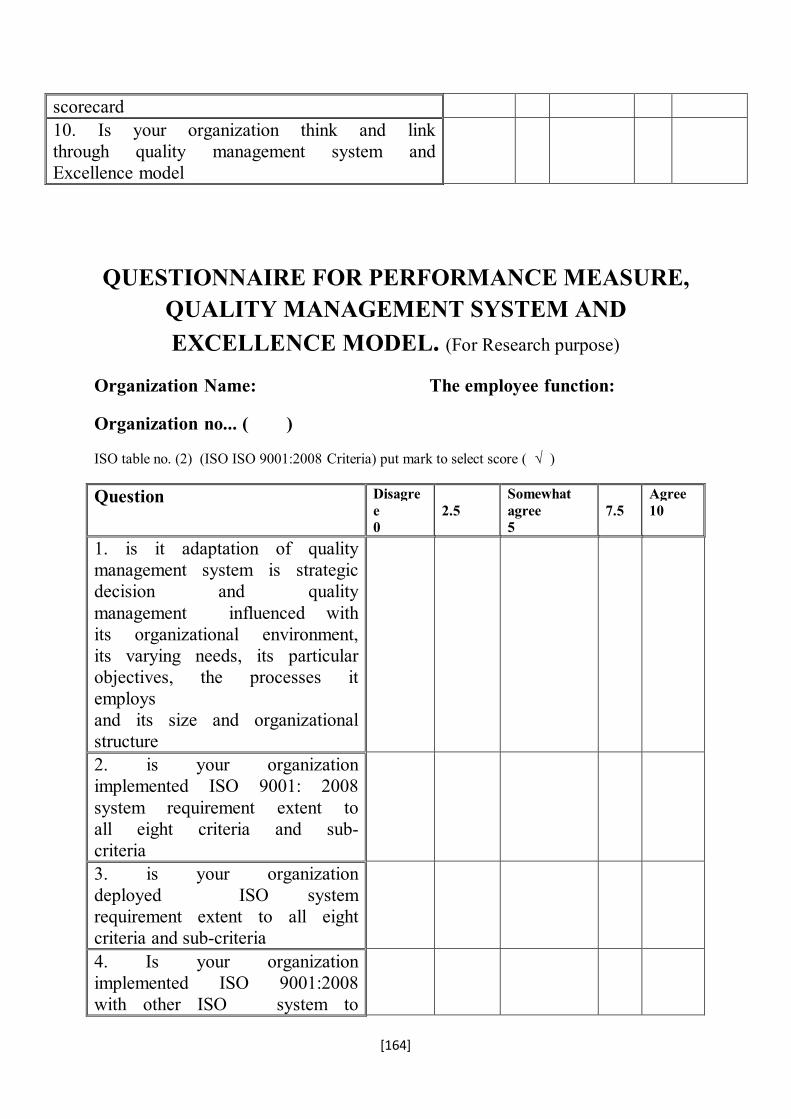
[164]
scorecard 10. Is your organization think and link through quality management system and Excellence model
QUESTIONNAIRE FOR PERFORMANCE MEASURE, QUALITY MANAGEMENT SYSTEM AND EXCELLENCE MODEL. (For Research purpose)
Organization Name: The employee function:
Organization no... ( )
ISO table no. (2) (ISO ISO 9001:2008 Criteria) put mark to select score ( √ )
Question Disagree 0
2.5
Somewhat agree 5
7.5
Agree 10
1. is it adaptation of quality management system is strategic decision and quality management influenced with its organizational environment, its varying needs, its particular objectives, the processes it employs and its size and organizational structure
2. is your organization implemented ISO 9001: 2008 system requirement extent to all eight criteria and sub-criteria
3. is your organization deployed ISO system requirement extent to all eight criteria and sub-criteria
4. Is your organization implemented ISO 9001:2008 with other ISO system to
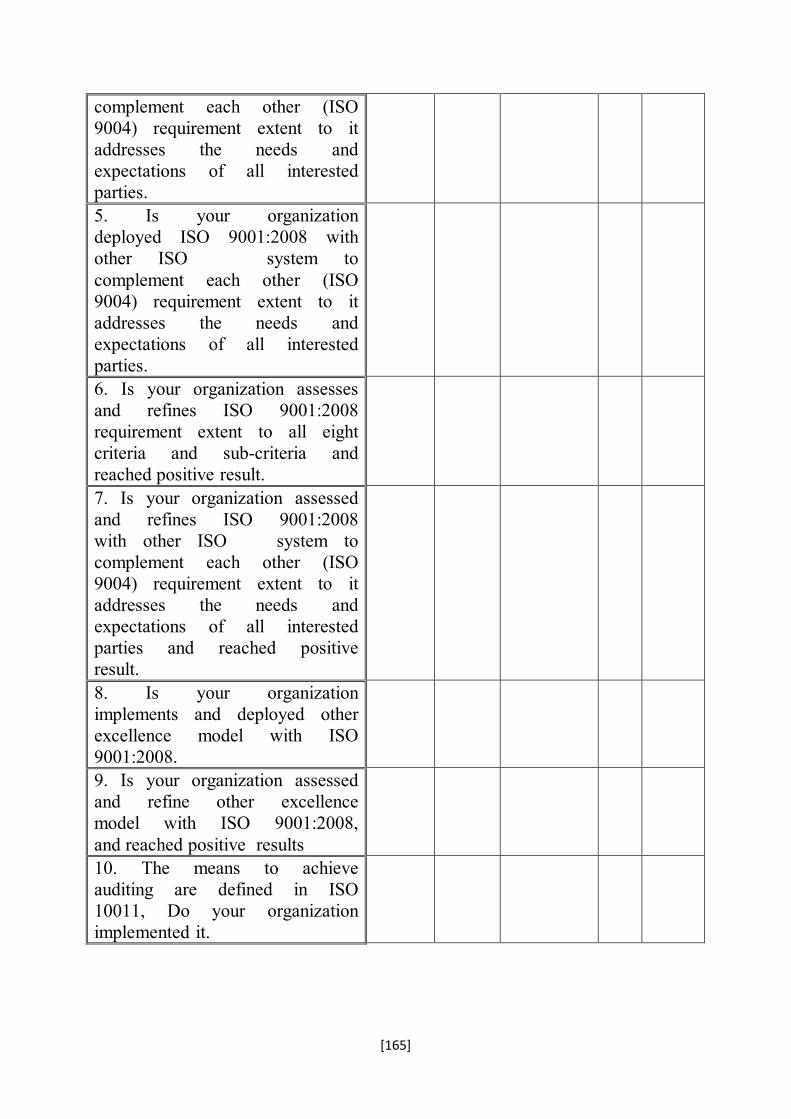
[165]
complement each other (ISO 9004) requirement extent to it addresses the needs and expectations of all interested parties. 5. Is your organization deployed ISO 9001:2008 with other ISO system to complement each other (ISO 9004) requirement extent to it addresses the needs and expectations of all interested parties.
6. Is your organization assesses and refines ISO 9001:2008 requirement extent to all eight criteria and sub-criteria and reached positive result.
7. Is your organization assessed and refines ISO 9001:2008 with other ISO system to complement each other (ISO 9004) requirement extent to it addresses the needs and expectations of all interested parties and reached positive result.
8. Is your organization implements and deployed other excellence model with ISO 9001:2008.
9. Is your organization assessed and refine other excellence model with ISO 9001:2008, and reached positive results
10. The means to achieve auditing are defined in ISO 10011, Do your organization implemented it.

[166]
QUESTIONNAIRE FOR PERFORMANCE MEASURE, QUALITY MANAGEMENT SYSTEM AND EXCELLENCE MODEL. (For Research purpose)
Organization Name: The employee function:
Organization no... ( )
Balance scorecard table no. (3) put mark to select score ( √ )
Question Disagree 0
2.5
Somewhat agree 5
7.5
Agree 10
1. Is your organization implement the four balance scorecard perspective, Financial perspective, Customer perspective, Internal business process and Learning and growth perspective and their sub perceptions.
2. Is your organization deployed the four balance scorecard perspective, Financial perspective, Customer perspective, Internal business process and Learning and growth perspective and their sub perceptions.
3. Is your organization assessed and refine the four balance scorecard perspective, Financial perspective, Customer perspective, Internal business process and Learning and growth perspective and their sub perceptions and reached excellence results.
4. if your organization is public or non –for- profit organization , do they implement the balance scorecard for public or non –for- one of five approaches, the original Kaplan and Norton framework, Customer primacy, Strategic themes, Splitting themes and a mixture of the above.
5. or if your organization is public or non –for- profit organization , do they implement the balance scorecard for public or non –for- two of approaches, the original Kaplan and Norton framework, Customer primacy, Strategic themes, Splitting themes and a mixture of the

[167]
above. 6. or If your organization is public or non –for- profit organization , do implement the balance scorecard for public or non –for- a mixture approaches, the original Kaplan and Norton framework, Customer primacy, Strategic themes, Splitting themes and a mixture of the above.
7. if your organization is public or non –for- profit organization , do deployed the balance scorecard for public or non –for- one five approaches, the original Kaplan and Norton framework, Customer primacy, Strategic themes, Splitting themes and a mixture of the above.
8. if your organization is public or non –for- profit organization , do assessed and refine the balance scorecard for public or non –for- one five approaches, the original Kaplan and Norton framework, Customer primacy, Strategic themes, Splitting themes and a mixture of the above and reached excellence results.
9. Do using the scorecard Approach Strategically, Translating strategies into operational terms, Organisational alignment to strategy, Making strategy everyone's responsibility, Making strategy a continuous process, and Mobilising change through executive leadership
10. Do using the scorecard Approach Strategically, Translating strategies into operational terms, Organisational alignment to strategy, Making strategy everyone's responsibility, Making strategy a continuous process, and Mobilising change through executive leadership, and deployed, assessed and refined and reached positive and excellence result.

[168]
QUESTIONNAIRE FOR PERFORMANCE MEASURE, QUALITY MANAGEMENT SYSTEM AND EXCELLENCE MODEL. (For Research purpose)
Organization Name: The employee function:
Organization no... ( )
EFQM table no. (4) (EFQM criteria and sub-criteria)(implemented) put mark to select score ( √ )
question disagree 0%
2.5
Somewhat agree 5
7.5
agree 10
1. Do your organization implement EFQM Model extent to all nine criteria and sub-criteria
2. Do your organization deployment EFQM Model extent to all nine criteria and sub-criteria
3. Do your organization assess and scoring EFQM Model extent to all nine criteria and sub-criteria
4. Do your organization assess and refine EFQM Model extent to all nine criteria and sub-criteria and reached excellence results
5. Do your organization assess and scoring EFQM Model with using Radar method.
6. Do you agree society interest is strategic decision
7. Society interest is legal responsibility of Organization's product to society, is that?
8. Is the approach is based on stakeholder and does it support the strategy?
9. Do you know the approaches that impact positively your results now and in the future?
10. Do you perform better than those results achieved by relevant organizations/competitors?

[169]
APPENDI (2): CIM A PRACTICAL CHECK LIST TABLE FOR BOARD REPORTING1:-
Characteristic and Explanation
Good Practise
1. Relevant –focussed on the organisation's priorities covering past, current and projected performance; sufficient detail to be useful but not to be obscure important detail.
Focused financial report of three to four pages in length. A good report will summarise the issues and highlight the overall position, making use of graphs and charts to replace lengthy tabular information where appropriate
2. Integrated – information should satisfy the needs of stakeholders that are both internal (e.g. the board's) and external (e.g. regulators) thereby avoiding the duplication of effort and reducing the risk of different decisions.
Activity data liked to financial performance. Variance calculated and explained. The report should integrate non-financial reporting.
3. In perspective should be presented to show performance of indicators over time highlighting variations and acting as internal benchmark of performance.
Abbreviated Profit and loss account shows period and cumulative positions with highlighted variances against budget. Major variance between forecast and actual result adequately explained. Trend analysis included. Full-year projections updated.
4. Timely - the information needs to be presented in good time for decision-making and necessary actions to follow, this means a balance must be
Report available within five working days of period end.
1 (Holistic Performance Measurement & The Balance Scorecard- Module 2- Page 20)

[170]
made between completeness and accuracy against the timeliness of the information.
5. Reliable – the board must have confidence in the quality of information presented, this is likely to be conveyed by presenting the information.
Every key issue identified with sufficient explanation
6. Comparable – comparisons of actual against planned and forecast performance help to focus decision-makers on the critical area of effectiveness as well as efficiency.
Consistent style across reports Performance indicators used to illustrate trends in liquidity, asset utilisation. etc. Comparison with budget previous year.
7. Clear – present needs to be understandable using graphs and charts to effectively communicate information on key indicators and trends.
Appropriate use of graphs, colour-coding and clear chapter headings.

[171]
THE APPENDIX (3) - THREE TABLES SCORING GUIDELINES CONCERN APPROACH, DEPLOYMENT AND RESULTS:-
SCORING GUIDELINES – APPROACH-TABLE ONE1
Attributes/scores
0% 25% 50% 75% 100%
Sound 1. Approaches has a clear rationale, there are well defined and developed process. 2. Approach focuses on stakeholder needs.
No evidence. Or Anecdotal
Some evidence
Evidence
Clear evidence
Comprehensive Evidence
Integrated: 1.Approach supports and strategy. 2.Approach is linked to other approach as appropriate
No evidence. Or Anecdotal
Some evidence
Evidence
Clear evidence
Comprehensive Evidence
0%-10% 15%-35%
40%-60%
65%-85%
90%-100%
SCORING GUIDELINES –DEPLOYMENT-TABLE (2)2
Attribute/scores
0% 25% 50% 75% 100%
Implement: 1.Approach
No evidenc
Implemented in
Implemented in
Implemented in
Implement in all
1 (www.authorstream.com/preentation/allanug-194060-ofqm-excelleance-model-operational-
consulting) 2 ( www.authorstream.com/preentation/allanug-194060-ofqm-excelleance-model-operational-
consulting)

[172]
is Implemented
e or anecdotal
about 1/4 of relevant areas
about 1/2 of relevant areas
about 3/4 of relevant areas
relevant areas
Systematic: 1. Approach is deployed in a structured way
No evidence. Or Anecdotal
Some evidence
Evidence
Clear evidence
Comprehensive Evidence
0%-10%
15%-35% 40%-60% 65%-85% 90%-100%
SCORING GUIDELINES – Results-TABLE (3)1
Attributes/Scoring
0% 25% 50% 75% 100%
Trends: Trends are positive and / or there is sustained goal performance
No results Or anecdotal
Positive trends or satisfactory Performance on some results
Positive trends and or satisfactory Performance on many results over the last 3 years
Strongly positive trends and or sustained excellent performance on most results over at least 3 years
Strongly positive trends and or sustained excellent performance in all areas over at least 5 years
Target: 1. Target are achieved 2.Target are appropriate
No evidence or anecdotal
Favorable and appropriate in some areas
Favorable and appropriate in many areas
Favorable and appropriate in most areas
Excellent and appropriate in all areas
0%-10%
15%-35% 40%-60% 65%-85% 90%-100%
1 (www.authorstream.com/preentation/allanug-194060-ofqm-excelleance-model-operational-
consulting)

[173]
APPENDIX (4) - CONTENT SHEET OF BS EN ISO 9001:1994 The following content sheet of BS EN ISO 9001:19941
1 scope
2 Normative reference
3 Definitions
4 Quality system requirement
4.1 Management responsibility
4.2 Quality system
4.3 contract review
4.4 Design control
4.5 Document and data control
4.6 Purchasing
4.7 Control of customer-supplied product
4.8 Product identification and traceability
4.9 Process control
4.10 Inspection and testing
4.11 Control of inspection, measuring and test equipment
4.12 Inspection and testing and test status
4.13 Control of non-conforming product
4.14 corrective and preventive actions
4.15 Handling, storage, packaging, preservation and delivery
4.16 Control of quality audits
4.17 Internal quality audits

[174]
4.18 Training
4.19 Servicing
4.20 Statistical techniques
Annex
A (informative) Bibliography
1 ( Quality Management system –Module 6 –page 12)

[175]
Appendix (5): ABBREVIATION
No. Abbreviation/symbol Address 1. QMS Quality management system 2. ISO International Organization
System 3. EFQM 1. European Foundation For
Quality Management System. 2. European Framework For Quality Management System.
4. BSC Balance scorecard 5. 1. TQM
2. CWQC 3. TQC
1.Total Quality management 2. Company-wide quality control. 3. Total quality Control.
6. Sig. Significant 7. Org. Organization

[176]
Appendix (6): ARABIC DEFINITIONS
-: الجودة لغة
ودة ودة ، وج اد ج ل ج ن فع ة م ي اللغ ودة ف اد : الج اع وج اد المت ال ج ، یق دا ار جی صل، ول أو عم ن ق د م ى بالجی ل أت اد الرج د ، وج اد و جیائ ھ جی د، وجمع و جی ل فھ العم
ا ة، ویق یغة المبالغ ى ص واد عل و مج ئ: ل فھ ود الش ، وتج دا یره جی ئ أي ص اد الش أي : أج .والجید نقیض الردئ ١تخیر وطلب أن یكون جیدا
-: اصطالحا
ددة ة ومتع اني مختلف ل مع ھ یحم ودة، وأن ح للج وم واض د مفھ ھ ال یوج ن أن الرغم م بت ذي طبق یاق ال تخدام والس ى االس ا عل أي منھ ذ ب ف األخ ودة یتوق وم الج ھ، وأن مفھ فی
ا ان إال إنن اختالف الزم ف ب وم یختل ھ مفھ یقة ، وأن رة ض ي دائ ره ف ن حص دد ال یمك متع .یمكن أن نتناول بعض ھذه المعاني
ودة ات -: الج دات والممارس تراتیجیات واالدوات والمعتق اھیم واالس ن المف ة م ي مجموع ھودة ین ج دف تحس ي تھ الیف الت ض التك ائر وخف ل الخس دمات وتقلی ات والخ ا ٢المنتج ، ویراھ
ا رون أنھ ة : آخ ض التكلف اة خف ع مراع ویره، م ك لتط ي االداء وذل تمر ف ن المس التحس ٣وتحسین االنتاجیة
المعجم الوسیط ، : مجمع اللغة العربیة ١ الجودة الشاملة في االدارة التعلیمیة والمدرسیة،: أحمد ابراھیم أحمد ٢ . ٨٢، ص ) ٢٢(، السنة )١٠٤(الدوحة ، قطر، العدد " مجلة التربیة" مھارات االدارة المدرسیة والقیادة : محمود عصام المیداني ٣
Related Documents