Harris: Quantitative Chemical Analysis, Eight Edition CHAPTER 05: QUALITY ASSURANCE AND CALIBRATION METHODS

Welcome message from author
This document is posted to help you gain knowledge. Please leave a comment to let me know what you think about it! Share it to your friends and learn new things together.
Transcript

Harris: Quantitative Chemical Analysis, Eight Edition
CHAPTER 05: QUALITY ASSURANCE
AND CALIBRATION METHODS

5-0. International Measurement Evaluation Program
Sample: Pb in river water (blind sample): Certified level = 62.3 ± 1.3nM
Panel a : 181 Laboratories.: 18 labs. à more than 50 % above the certified level
4 labs. à more than 50 % below the certified level
Panel b : 9 different National Measurement Institutes: all results were close to the certified range
___________________________________________________________

Certified range: 62.3 ± 1.3nM
Panel a: 181 Labs. using recognized analytical procedures18 labs. à more than 50 % above the certified level
4 labs. à more than 50 % below the certified level

Panal b: 9 different National Measurement Institutes
Certified range: 62.3 ± 1.3nM

5-0. International Measurement Evaluation Program
Sample : Pb in river water (blind sample): Certified level = 62.3 ± 1.3nM
Panel a : 181 laboratories: 18 labs. à more than 50 % above the certified level
4 labs. à more than 50 % below the certified level
Panel b : 9 different National Measurement Institutes: all results were close to the certified range
___________________________________________________________
Periodic blind check sample is required to demonstrate continuing reliability

5-2 Method validationDetection Limit ( = lower limit of detection)
- The smallest quantity of analyte that is “significantly different” from the blank.

Fig. 5-2 Curves show distribution of measurements expected for a blank and a sample whose concentration at the detection limit.

5-2 Method validationFrom Fig. 5-2- We assume that the standard deviation of the signal from
samples near the detection limit is similar to the standard deviation from blanks

Why is it ~1 % at 3s ?
* d.f. (n=6), t= 3.7
* d.f. (n= infinite), t =2.5
Curves in Fig 5-2 are student’s t distribution for 6 degrees of freedom.They are broader than the corresponding Gaussian distributions.


5-2 Method validationFrom Fig. 5-2
- A procedure that produces a detection limit with ~99 % chance of being greater than the blank. (= only ~1% of measurements for a blank are expected to exceed the detection limit.)
-

5-2 Method validationFrom Fig. 5-2
If a sample contains analyte at the detection limit, there is a 50 % chance of concluding that analyte is absent because its signal is below the detection limit (false negative).
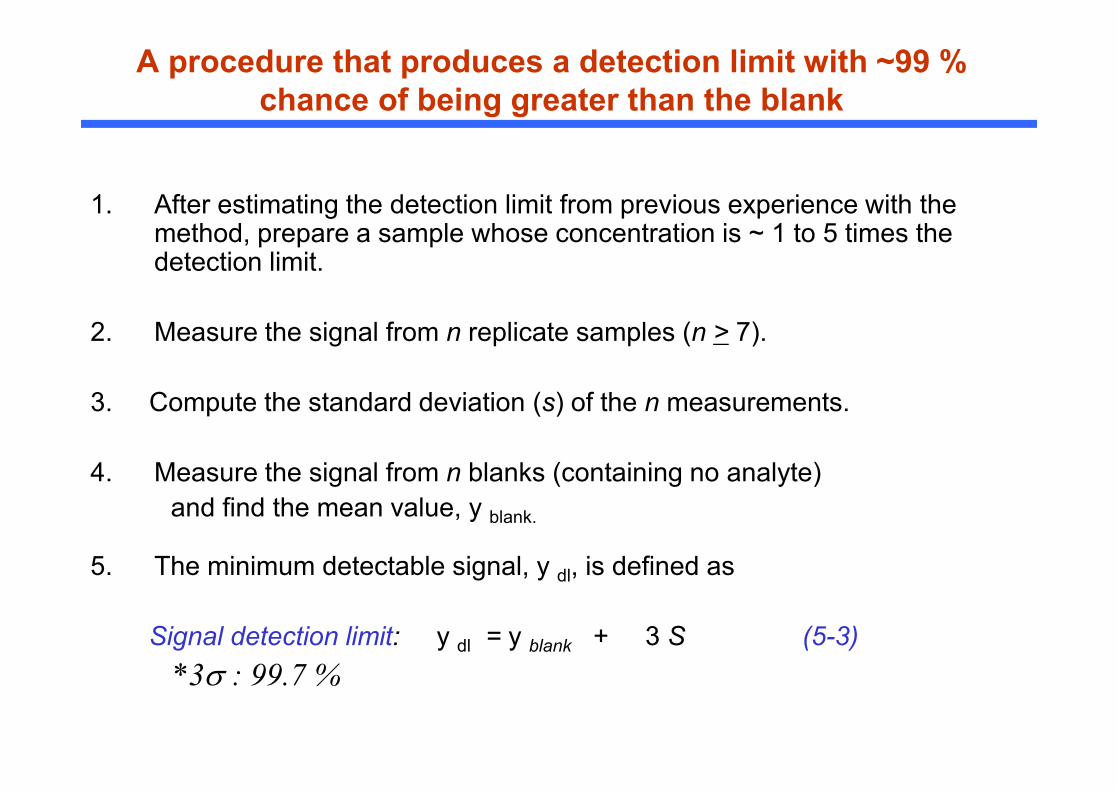
A procedure that produces a detection limit with ~99 % chance of being greater than the blank
1. After estimating the detection limit from previous experience with the method, prepare a sample whose concentration is ~ 1 to 5 times the detection limit.
2. Measure the signal from n replicate samples (n > 7).
3. Compute the standard deviation (s) of the n measurements.
4. Measure the signal from n blanks (containing no analyte) and find the mean value, y blank.
5. The minimum detectable signal, y dl, is defined as
Signal detection limit: y dl = y blank + 3 S (5-3)*3s : 99.7 %

A procedure that produces a detection limit with ~99 % chance of being greater than the blank
5. The minimum detectable signal, y dl, is defined as
Signal detection limit: y dl = y blank + 3 S (5-3)
6. The corrected signal, y sample - y blank = m x sample concentration (5-4)
y sample : signal observed for the samplem : slope of the linear calibration curve (à next slide)
7. The detection limit is obtained by substitute y dl in 5-3 for y sample in 5-4 . Because detection limit is the sample concentration which satisfies 5-3,
y dl - y blank = 3 S (5-3)y sample - y blank = m x sample concentration
Detection limit = 3 s / m

Signal vs. Concentration

5-3. Standard Addition
Matrix : everything in the unknown, other than analyte
Matrix effect : a change in the analytical signal caused by anything in the sample other than analyte. See next slide (Fig. 5-4)

Fig. 5-4 Calibration curves for perchlorate (ClO4- ) in pure water and in groundwater
- The matrix have unknown constituents that you could not incorporate into standard solutions to make a standard curve.
- Hence, the method of standard addition is required

5-3. Standard Addition
Standard Addition : Known quantities of analyte are added to the unknown.From the increase in signal, we can deduce how much analyte was in the original unknown.
Assumption for standard addition :
A linear response to analyte : “The matrix would have the same effect on added analyte as it has on the original analyte in the unknown. When we add a small volume of concentrated standard e.g., the same substance as analyte, we don’t change the concentration of matrix much.”

- When we add a small volume of concentrated standard to an existing unknown, we do not change the concentration of the matrix very much
- The standard (S) is the same substance as the analyte (X).
)75(]X[
)]X[]S([]X[
)]X[]S([
X
XS -+
=+
=+
i
ff
i
ff
kk
II
I : emission intensityS : standardX : unknown concentration (analyte)V : volumei : initialf : final
V = V0 (initial volume of unknown sample) + VS (volume of standard added)
[X]f = [X]i(V0/V), [S]f = [S]i(VS/V) (5-8)
5-3. Standard Addition
- From 5-7 & 5-8, we can solve [X]i because everything else in eq.5-7 is known.

- Every flask contains the same concentration of unknown and differing concentration of standard.
- It is useful when the chemical analysis consumes solution such as atomic or mass spectroscopy. So we need separate flasks.
2) Constant total volume
5-3. Standard Addition
- It is useful when we measure a property of the analyte without consuming solution such as an electrical measurement with Ion-Selective Electrode.
1) Variable total volume
Two methods for standard addition

5-3. Standard Addition
- It is useful when we measure a property of the analyte without consuming solution such as an electrical measurement with Ion-Selective Electrode.
- We add a small volumes of standard and measure the signal, We repeat this procedure several more times.
- Standard additon should increase the analytical signal to between 1.5 and 3 times its original value.
1) Variable total volume
)75(]X[
)]X[]S([]X[
)]X[]S([
X
XS -+
=+
=+
i
ff
i
ff
kk
II
[X]f = [X]i(V0/V), [S]f = [S]i(VS/V) (5-8)
From equation 5-7 and 5-8, (5-9)

Fig. 5-5 Data for standard addition experiment with variable total volume(Ascorbic acid in orange juice)

* Standard addition should increase the analytical signal to between 1.5 and 3times its original value. (e.g., B = 0.5A to 2A ).
A Graphic Procedure for Standard Addition :1) Variable total volume

5-3. The uncertainty in the x-intercept
å -+= 22
2
)(1intercept- xofdeviation Standard
xxmy
nms
i
y
Sy : Standard deviation of y (Eq. 4-20): the absolute value of the slope of the least squares line (Eq. 4-16)
n : the number of data points (= 9 for Fig. 5-6) : the mean value of y for the 9 points: the individual values of x for the 9 points: the mean value of x for the 9 points
Uncertainty in the x-intercept : mM (for Fig. 5-6 )
m
y
xix
809.0
Confidence interval = ± t (standard deviation of x-intercept)* degree of freedom = n - 2

- Every flask contains the same concentration of unknown and differing concentration of standard.
- It is useful when the chemical analysis consumes solution such as atomic or mass spectroscopy. So we need separate flasks.
2) Constant total volume
5-3. Standard Addition
Two methods for standard addition

2) graphical Procedure for multiple solutions with constant total volume

2) graphical Procedure for multiple solutions with constant total volume
)75(]X[
)]X[]S([
X
XS -+
=+
i
ff
II
fi
fi
i
ff
II
II
]X[]X[
]S[]X[
]X[)]X[]S([
XX
XXS
+=
+=+
å -+= 22
2
)(1
intercept- xofdeviation Standard
xxmy
nms
i
y

5-4. Internal Standards
Internal Standard : a known amount of compound, different from analyte, that is added to the unknown.
: signal from analyte is compared with a signal from the internal standard to find out how much analyte is present
- They are specially useful for analyses in which the quantity of sample analyzedor the instrument response varies slightly from run to run for reasons that are difficult to control.
i) When the small quantity (uL) of sample solution injected is not reproducible (chromatography).
ii) When sample loss occurs during sample preparation steps prior to any manipulations.
-

Fig. 5-7. Chromatographic separation of unknown (X) and internal stnadard (S)
Area of analyte signal (Ax) / concentration of analyte [X]= F (Area of standard signal (As) / concentration of standard [S])
F : response factor
* To calculate F, we prepare a known mixtureof standard and analyte to measure the relative response of the detector to the two species.
Related Documents