5-1 Introduction This chapter introduces information systems available in the advanced avionics cockpit. These systems support you in following flight progress, and in avoiding terrain, traffic, and weather hazards en route. A moving map continuously displays the aircraft’s position relative to the intended route of flight, and helps you maintain the “big picture” (situational awareness) as your flight progresses. A Terrain Awareness and Warning System (TAWS) color codes surrounding terrain to make it easily apparent when terrain poses a threat. Weather systems provide in-flight access to many of the same weather products available on the ground. A fuel management system makes predictions about fuel remaining at each waypoint along the route, and helps monitor actual fuel use as your flight progresses. Information Systems Chapter 5

Welcome message from author
This document is posted to help you gain knowledge. Please leave a comment to let me know what you think about it! Share it to your friends and learn new things together.
Transcript
5-1
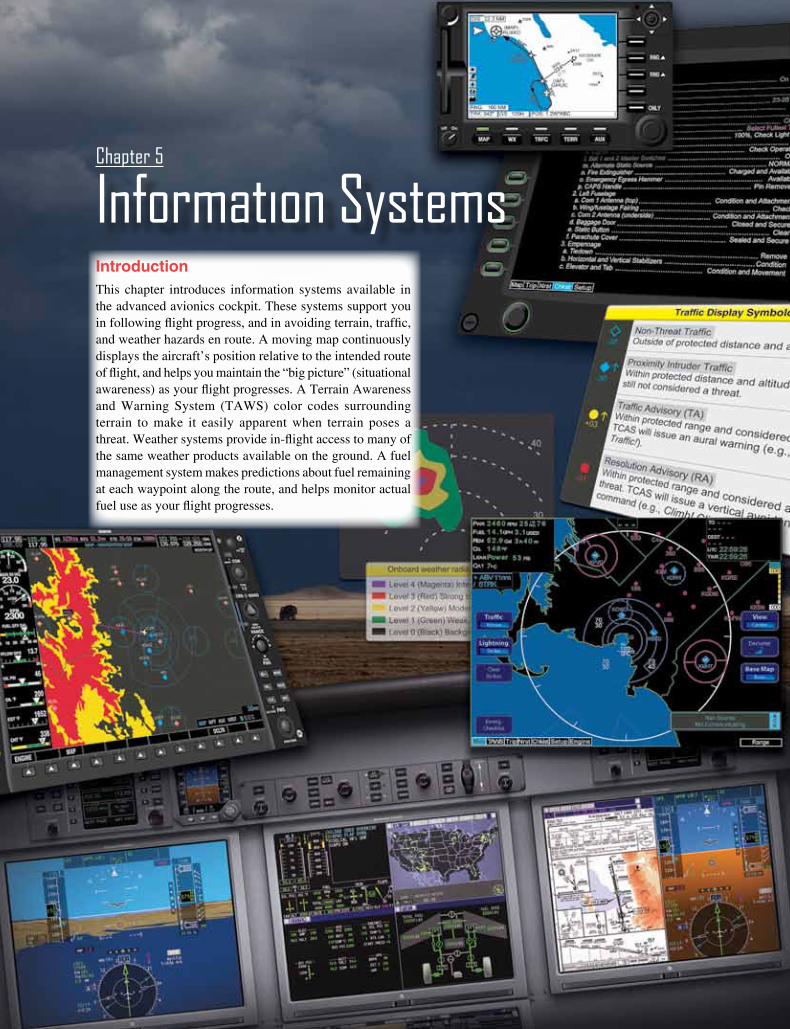
IntroductionThis chapter introduces information systems available in the advanced avionics cockpit. These systems support you in following flight progress, and in avoiding terrain, traffic, and weather hazards en route. A moving map continuously displays the aircraft’s position relative to the intended route of flight, and helps you maintain the “big picture” (situational awareness) as your flight progresses. A Terrain Awareness and Warning System (TAWS) color codes surrounding terrain to make it easily apparent when terrain poses a threat. Weather systems provide in-flight access to many of the same weather products available on the ground. A fuel management system makes predictions about fuel remaining at each waypoint along the route, and helps monitor actual fuel use as your flight progresses.
Information SystemsChapter 5
5-2
OAT 7°COOOAAATTT 7°C
TOPO TERRAIN STRMSCP NEXRAD XM LTNG BACK
MAP NRSTWPT AUX
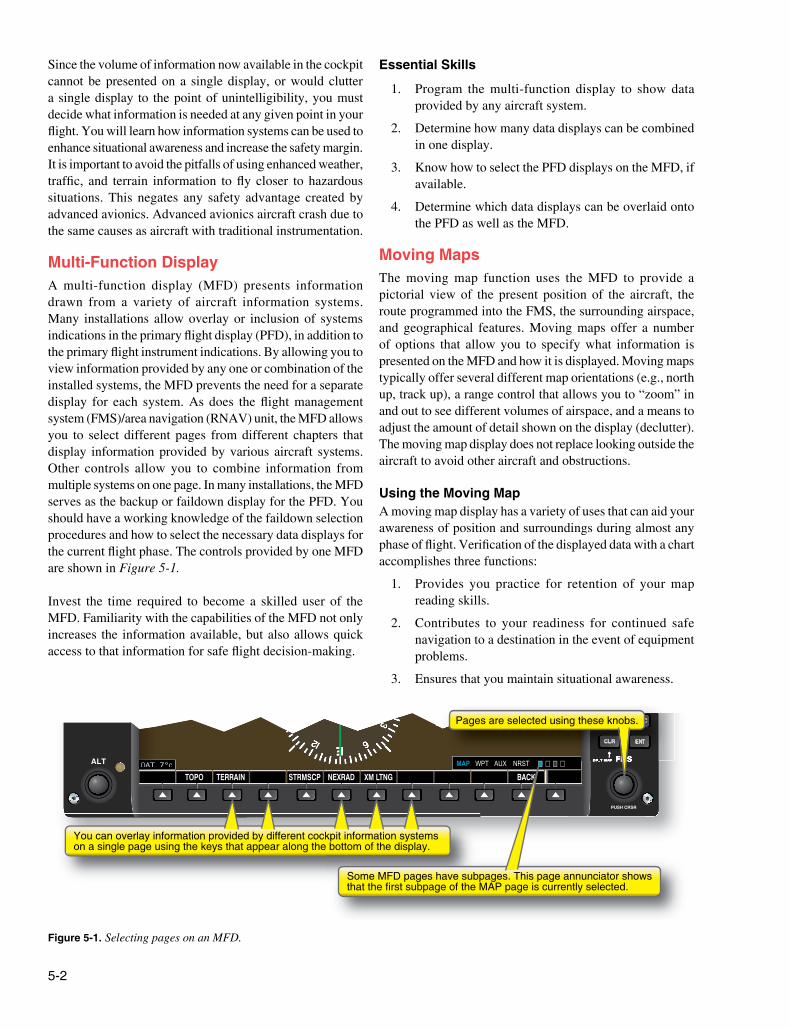
Pages are selected using these knobs.
You can overlay information provided by different cockpit information systems on a single page using the keys that appear along the bottom of the display.
Some MFD pages have subpages. This page annunciator showsthat the first subpage of the MAP page is currently selected.
Figure 5-1. Selecting pages on an MFD.
Since the volume of information now available in the cockpit cannot be presented on a single display, or would clutter a single display to the point of unintelligibility, you must decide what information is needed at any given point in your flight. You will learn how information systems can be used to enhance situational awareness and increase the safety margin. It is important to avoid the pitfalls of using enhanced weather, traffic, and terrain information to fly closer to hazardous situations. This negates any safety advantage created by advanced avionics. Advanced avionics aircraft crash due to the same causes as aircraft with traditional instrumentation.
Multi-Function DisplayA multi-function display (MFD) presents information drawn from a variety of aircraft information systems. Many installations allow overlay or inclusion of systems indications in the primary flight display (PFD), in addition to the primary flight instrument indications. By allowing you to view information provided by any one or combination of the installed systems, the MFD prevents the need for a separate display for each system. As does the flight management system (FMS)/area navigation (RNAV) unit, the MFD allows you to select different pages from different chapters that display information provided by various aircraft systems. Other controls allow you to combine information from multiple systems on one page. In many installations, the MFD serves as the backup or faildown display for the PFD. You should have a working knowledge of the faildown selection procedures and how to select the necessary data displays for the current flight phase. The controls provided by one MFD are shown in Figure 5-1.
Invest the time required to become a skilled user of the MFD. Familiarity with the capabilities of the MFD not only increases the information available, but also allows quick access to that information for safe flight decision-making.
Essential Skills
1. Program the multi-function display to show data provided by any aircraft system.
2. Determine how many data displays can be combined in one display.
3. Know how to select the PFD displays on the MFD, if available.
4. Determine which data displays can be overlaid onto the PFD as well as the MFD.
Moving MapsThe moving map function uses the MFD to provide a pictorial view of the present position of the aircraft, the route programmed into the FMS, the surrounding airspace, and geographical features. Moving maps offer a number of options that allow you to specify what information is presented on the MFD and how it is displayed. Moving maps typically offer several different map orientations (e.g., north up, track up), a range control that allows you to “zoom” in and out to see different volumes of airspace, and a means to adjust the amount of detail shown on the display (declutter). The moving map display does not replace looking outside the aircraft to avoid other aircraft and obstructions.
Using the Moving MapA moving map display has a variety of uses that can aid your awareness of position and surroundings during almost any phase of flight. Verification of the displayed data with a chart accomplishes three functions:
1. Provides you practice for retention of your map reading skills.
2. Contributes to your readiness for continued safe navigation to a destination in the event of equipment problems.
3. Ensures that you maintain situational awareness.
5-3
ECA
WAGER
5338
11652
200
46
13.7
2300
23.0
NAV1 116.00 114.00NAV2 113.90 114.80
125.900 121.600 COM1123.850 119.000 COM2
GS 156kts DIS 38.2NM ETE 00:15 ETA 04:10
ENGINE MAP DCLTR
MAP NRSTWPT AUX
MAP - NAVIGATION MAPTRACK UP
30NM
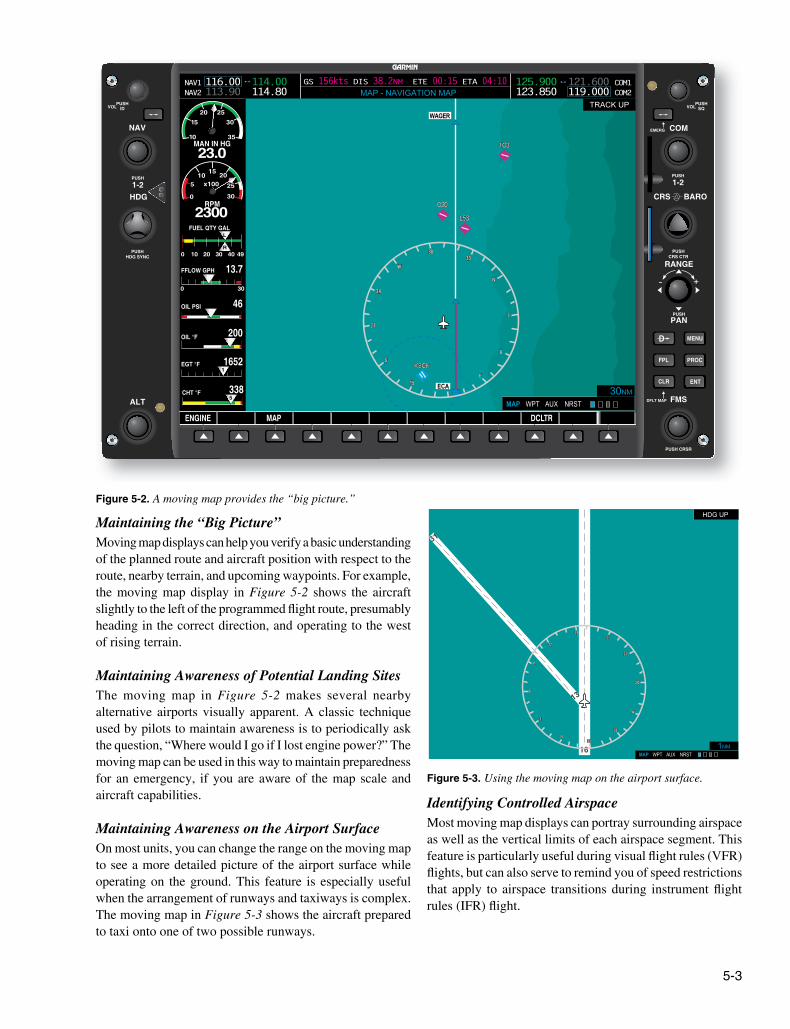
Figure 5-2. A moving map provides the “big picture.”HDG UP
1NM16
13
MAP NRSTWPT AUX
31
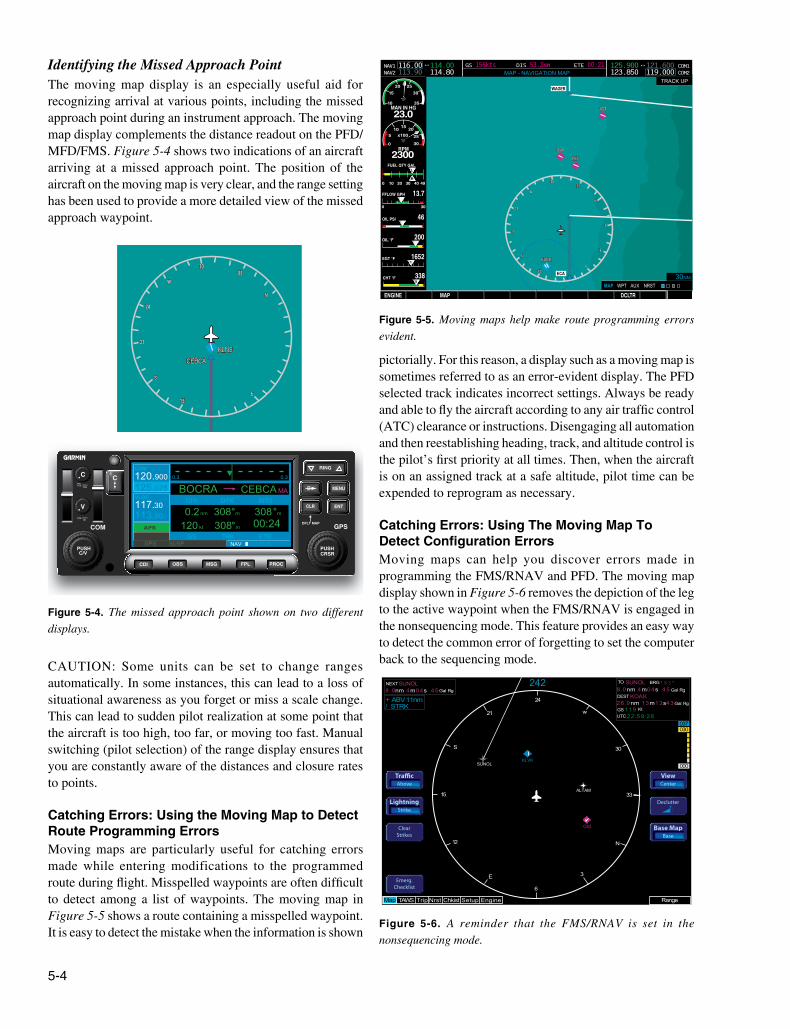
Figure 5-3. Using the moving map on the airport surface.
Maintaining the “Big Picture”Moving map displays can help you verify a basic understanding of the planned route and aircraft position with respect to the route, nearby terrain, and upcoming waypoints. For example, the moving map display in Figure 5-2 shows the aircraft slightly to the left of the programmed flight route, presumably heading in the correct direction, and operating to the west of rising terrain.
Maintaining Awareness of Potential Landing SitesThe moving map in Figure 5-2 makes several nearby alternative airports visually apparent. A classic technique used by pilots to maintain awareness is to periodically ask the question, “Where would I go if I lost engine power?” The moving map can be used in this way to maintain preparedness for an emergency, if you are aware of the map scale and aircraft capabilities.
Maintaining Awareness on the Airport SurfaceOn most units, you can change the range on the moving map to see a more detailed picture of the airport surface while operating on the ground. This feature is especially useful when the arrangement of runways and taxiways is complex. The moving map in Figure 5-3 shows the aircraft prepared to taxi onto one of two possible runways.
Identifying Controlled AirspaceMost moving map displays can portray surrounding airspace as well as the vertical limits of each airspace segment. This feature is particularly useful during visual flight rules (VFR) flights, but can also serve to remind you of speed restrictions that apply to airspace transitions during instrument flight rules (IFR) flight.
5-4
CRING
MSG FPL PROCCDI OBS
GPSCOM
C
V
PWRVOL/
SQPUSH
VOL/IDPUSH
VLOC
117.30113.90
COM
120.900125.675
NAV
CEBCADTKDIS BRG
TRKGS ETE
0.2 308 308nm m m
120 308kt m
0.3 0.3
BOCRA
00:24 APR
MA
Figure 5-4. The missed approach point shown on two different displays.
ECA
WAGER
5338
11652
200
46
13.7
2300
23.0
NAV1 116.00 114.00NAV2 113.90 114.80
125.900 121.600 COM1123.850 119.000 COM2
GS 156kts DIS 53.2NM ETE 00:21
ENGINE MAP DCLTR
MAP NRSTWPT AUX
MAP - NAVIGATION MAPTRACK UP
30NM
Figure 5-5. Moving maps help make route programming errors evident.
Range
242
TAWS Trip Nrst Chkist Setup EngineMap
SUNOLNEXT 8.0nm 4m04s 45 Gal Rg + ABV 11nm/ STRK
24
w
30
33
N
S
E
21
15
12
3
6
037 030
000
Gal Rg
SUNOL
KOAKDEST
TO BRG
GSUTC
8.0nm 4m04s 45
26.9nm 13m13s43
Gal Rg
11922:59:26
Kt
SUNOL
ALTAM
KLVK
C83
Emerg.Checklist
ClearStrikes
LightningStrike
Tra�cAbove
Declutter
Base MapBase
ViewCenter
Figure 5-6. A reminder that the FMS/RNAV is set in the nonsequencing mode.
Identifying the Missed Approach PointThe moving map display is an especially useful aid for recognizing arrival at various points, including the missed approach point during an instrument approach. The moving map display complements the distance readout on the PFD/MFD/FMS. Figure 5-4 shows two indications of an aircraft arriving at a missed approach point. The position of the aircraft on the moving map is very clear, and the range setting has been used to provide a more detailed view of the missed approach waypoint.
CAUTION: Some units can be set to change ranges automatically. In some instances, this can lead to a loss of situational awareness as you forget or miss a scale change. This can lead to sudden pilot realization at some point that the aircraft is too high, too far, or moving too fast. Manual switching (pilot selection) of the range display ensures that you are constantly aware of the distances and closure rates to points.
Catching Errors: Using the Moving Map to Detect Route Programming ErrorsMoving maps are particularly useful for catching errors made while entering modifications to the programmed route during flight. Misspelled waypoints are often difficult to detect among a list of waypoints. The moving map in Figure 5-5 shows a route containing a misspelled waypoint. It is easy to detect the mistake when the information is shown
pictorially. For this reason, a display such as a moving map is sometimes referred to as an error-evident display. The PFD selected track indicates incorrect settings. Always be ready and able to fly the aircraft according to any air traffic control (ATC) clearance or instructions. Disengaging all automation and then reestablishing heading, track, and altitude control is the pilot’s first priority at all times. Then, when the aircraft is on an assigned track at a safe altitude, pilot time can be expended to reprogram as necessary.
Catching Errors: Using The Moving Map To Detect Configuration ErrorsMoving maps can help you discover errors made in programming the FMS/RNAV and PFD. The moving map display shown in Figure 5-6 removes the depiction of the leg to the active waypoint when the FMS/RNAV is engaged in the nonsequencing mode. This feature provides an easy way to detect the common error of forgetting to set the computer back to the sequencing mode.
5-5
10NMMAP NRSTWPT AUX
FAFIX
IAFIX
VOR 1
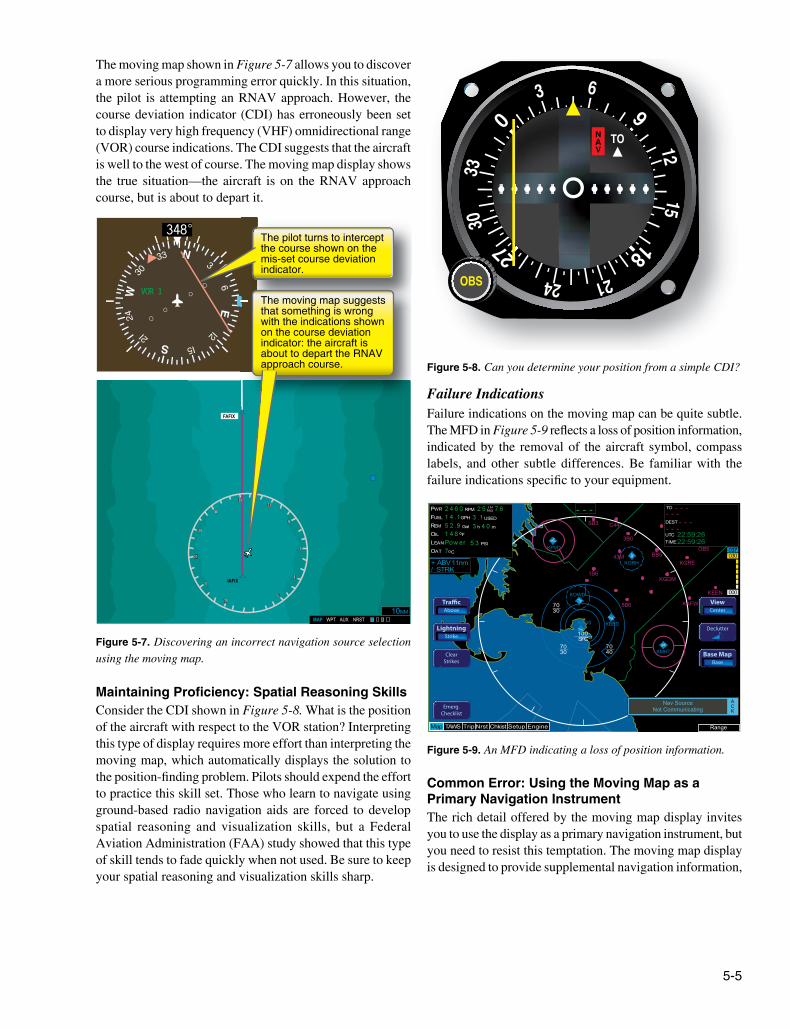
348°The pilot turns to interceptthe course shown on themis-set course deviationindicator.
The moving map suggests that something is wrongwith the indications shownon the course deviationindicator: the aircraft is about to depart the RNAV approach course.
Figure 5-7. Discovering an incorrect navigation source selection using the moving map.
OBS
0 91827
3
33
24 21
1512
30
6
TONAV
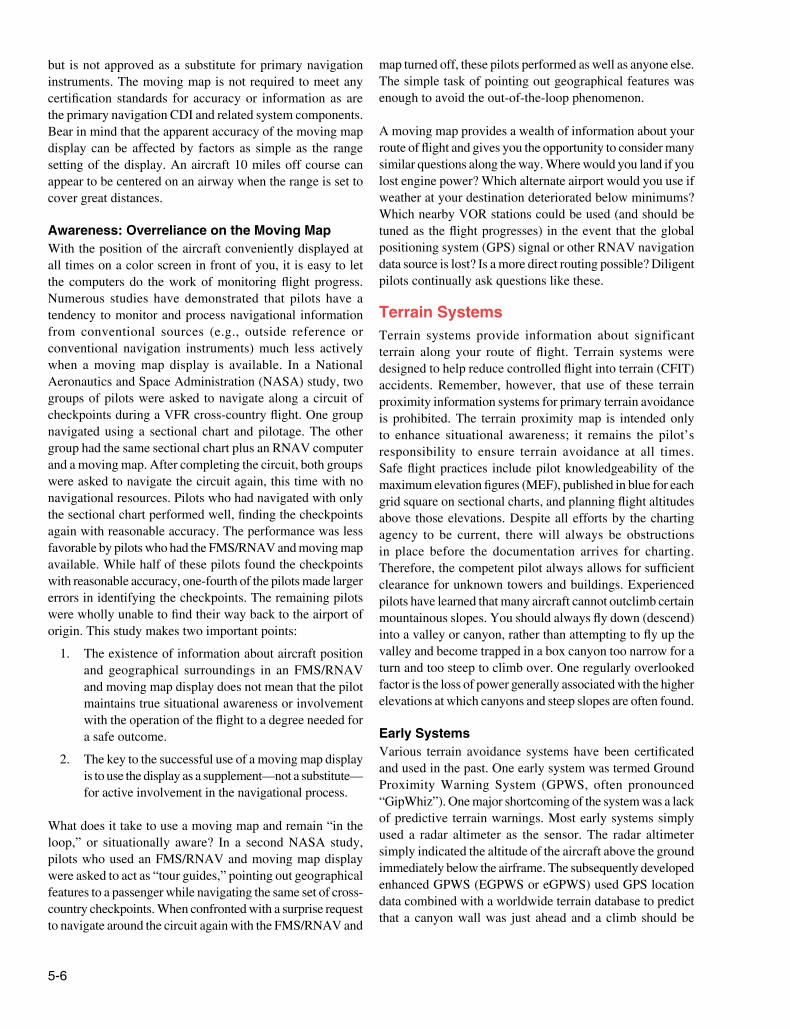
Figure 5-8. Can you determine your position from a simple CDI?
Range
KGDM
KGRE
KEEN
KAFW
SB3 C44
43MOB5
3B0
1B6
BB5
5B6
7040
100SFC
7030
7030
DEST
TO
TIME
- - -
22:59:26
- - -
- - -- - -UTC 22:59:26
KORH
KMHT
KOWD
KBED
KPVD
KBOS
Nav SourceNot Communicating
ACK
PWR RPM
FUEL
REM
OIL
LEAN
OAT
GPH
Gal
F
C
USED
h m
PSI
IN
HG
TAWS Trip Nrst Chkist Setup EngineMap
+ ABV 11nm/ STRK
037 030
000
Emerg.Checklist
ClearStrikes
LightningStrike
Tra�cAbove
Declutter
Base MapBase
ViewCenter
Figure 5-9. An MFD indicating a loss of position information.
The moving map shown in Figure 5-7 allows you to discover a more serious programming error quickly. In this situation, the pilot is attempting an RNAV approach. However, the course deviation indicator (CDI) has erroneously been set to display very high frequency (VHF) omnidirectional range (VOR) course indications. The CDI suggests that the aircraft is well to the west of course. The moving map display shows the true situation—the aircraft is on the RNAV approach course, but is about to depart it.
Maintaining Proficiency: Spatial Reasoning SkillsConsider the CDI shown in Figure 5-8. What is the position of the aircraft with respect to the VOR station? Interpreting this type of display requires more effort than interpreting the moving map, which automatically displays the solution to the position-finding problem. Pilots should expend the effort to practice this skill set. Those who learn to navigate using ground-based radio navigation aids are forced to develop spatial reasoning and visualization skills, but a Federal Aviation Administration (FAA) study showed that this type of skill tends to fade quickly when not used. Be sure to keep your spatial reasoning and visualization skills sharp.
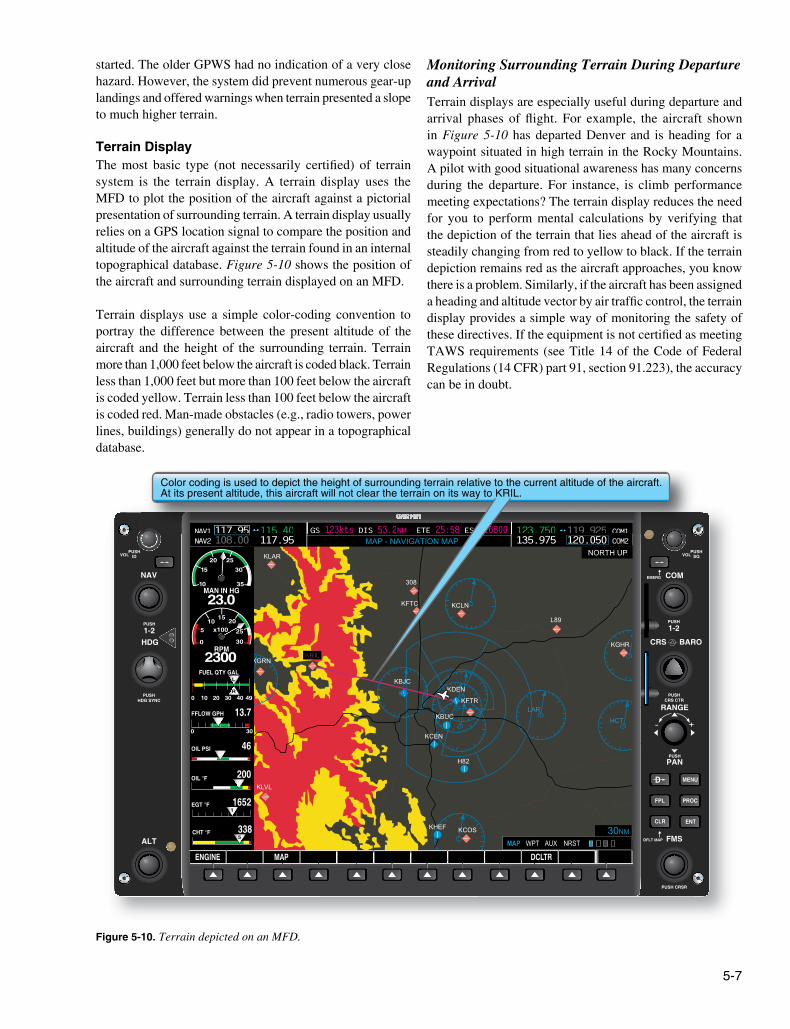
Failure IndicationsFailure indications on the moving map can be quite subtle. The MFD in Figure 5-9 reflects a loss of position information, indicated by the removal of the aircraft symbol, compass labels, and other subtle differences. Be familiar with the failure indications specific to your equipment.
Common Error: Using the Moving Map as a Primary Navigation InstrumentThe rich detail offered by the moving map display invites you to use the display as a primary navigation instrument, but you need to resist this temptation. The moving map display is designed to provide supplemental navigation information,
5-6
but is not approved as a substitute for primary navigation instruments. The moving map is not required to meet any certification standards for accuracy or information as are the primary navigation CDI and related system components. Bear in mind that the apparent accuracy of the moving map display can be affected by factors as simple as the range setting of the display. An aircraft 10 miles off course can appear to be centered on an airway when the range is set to cover great distances.
Awareness: Overreliance on the Moving MapWith the position of the aircraft conveniently displayed at all times on a color screen in front of you, it is easy to let the computers do the work of monitoring flight progress. Numerous studies have demonstrated that pilots have a tendency to monitor and process navigational information from conventional sources (e.g., outside reference or conventional navigation instruments) much less actively when a moving map display is available. In a National Aeronautics and Space Administration (NASA) study, two groups of pilots were asked to navigate along a circuit of checkpoints during a VFR cross-country flight. One group navigated using a sectional chart and pilotage. The other group had the same sectional chart plus an RNAV computer and a moving map. After completing the circuit, both groups were asked to navigate the circuit again, this time with no navigational resources. Pilots who had navigated with only the sectional chart performed well, finding the checkpoints again with reasonable accuracy. The performance was less favorable by pilots who had the FMS/RNAV and moving map available. While half of these pilots found the checkpoints with reasonable accuracy, one-fourth of the pilots made larger errors in identifying the checkpoints. The remaining pilots were wholly unable to find their way back to the airport of origin. This study makes two important points:
1. The existence of information about aircraft position and geographical surroundings in an FMS/RNAV and moving map display does not mean that the pilot maintains true situational awareness or involvement with the operation of the flight to a degree needed for a safe outcome.
2. The key to the successful use of a moving map display is to use the display as a supplement—not a substitute—for active involvement in the navigational process.
What does it take to use a moving map and remain “in the loop,” or situationally aware? In a second NASA study, pilots who used an FMS/RNAV and moving map display were asked to act as “tour guides,” pointing out geographical features to a passenger while navigating the same set of cross-country checkpoints. When confronted with a surprise request to navigate around the circuit again with the FMS/RNAV and
map turned off, these pilots performed as well as anyone else. The simple task of pointing out geographical features was enough to avoid the out-of-the-loop phenomenon.
A moving map provides a wealth of information about your route of flight and gives you the opportunity to consider many similar questions along the way. Where would you land if you lost engine power? Which alternate airport would you use if weather at your destination deteriorated below minimums? Which nearby VOR stations could be used (and should be tuned as the flight progresses) in the event that the global positioning system (GPS) signal or other RNAV navigation data source is lost? Is a more direct routing possible? Diligent pilots continually ask questions like these.
Terrain SystemsTerrain systems provide information about significant terrain along your route of flight. Terrain systems were designed to help reduce controlled flight into terrain (CFIT) accidents. Remember, however, that use of these terrain proximity information systems for primary terrain avoidance is prohibited. The terrain proximity map is intended only to enhance situational awareness; it remains the pilot’s responsibility to ensure terrain avoidance at all times. Safe flight practices include pilot knowledgeability of the maximum elevation figures (MEF), published in blue for each grid square on sectional charts, and planning flight altitudes above those elevations. Despite all efforts by the charting agency to be current, there will always be obstructions in place before the documentation arrives for charting. Therefore, the competent pilot always allows for sufficient clearance for unknown towers and buildings. Experienced pilots have learned that many aircraft cannot outclimb certain mountainous slopes. You should always fly down (descend) into a valley or canyon, rather than attempting to fly up the valley and become trapped in a box canyon too narrow for a turn and too steep to climb over. One regularly overlooked factor is the loss of power generally associated with the higher elevations at which canyons and steep slopes are often found.
Early SystemsVarious terrain avoidance systems have been certificated and used in the past. One early system was termed Ground Proximity Warning System (GPWS, often pronounced “GipWhiz”). One major shortcoming of the system was a lack of predictive terrain warnings. Most early systems simply used a radar altimeter as the sensor. The radar altimeter simply indicated the altitude of the aircraft above the ground immediately below the airframe. The subsequently developed enhanced GPWS (EGPWS or eGPWS) used GPS location data combined with a worldwide terrain database to predict that a canyon wall was just ahead and a climb should be
5-7
KDEN
KFTR
KBUC
KBJC
KCLN
L89
KGHR
308
KLAR
KGRN
KLVL
KHEF KCOS
KCEN
LAR
HCT
31
3000
W GPH
25
100
S
S
L
1
L
R
COM2
KFTC
H82
MAP NRSTWPT AUX5338
11652
200
46
13.7
2300
23.0
NAV1 117.95 115.40NAV2 108.00 117.95
123.750 119.925 COM1135.975 120.050 COM2
GS 123kts DIS 53.2NM ETE 25:58 ESA 16800
ENGINE MAP DCLTR
MAP NRSTWPT AUX
MAP - NAVIGATION MAPNORTH UP
30NM
NAV1 117.95 115.40 123.750 111199.929255 COM1GS 123kts DIS 53.2NM ETE 25:58 ESA 16800
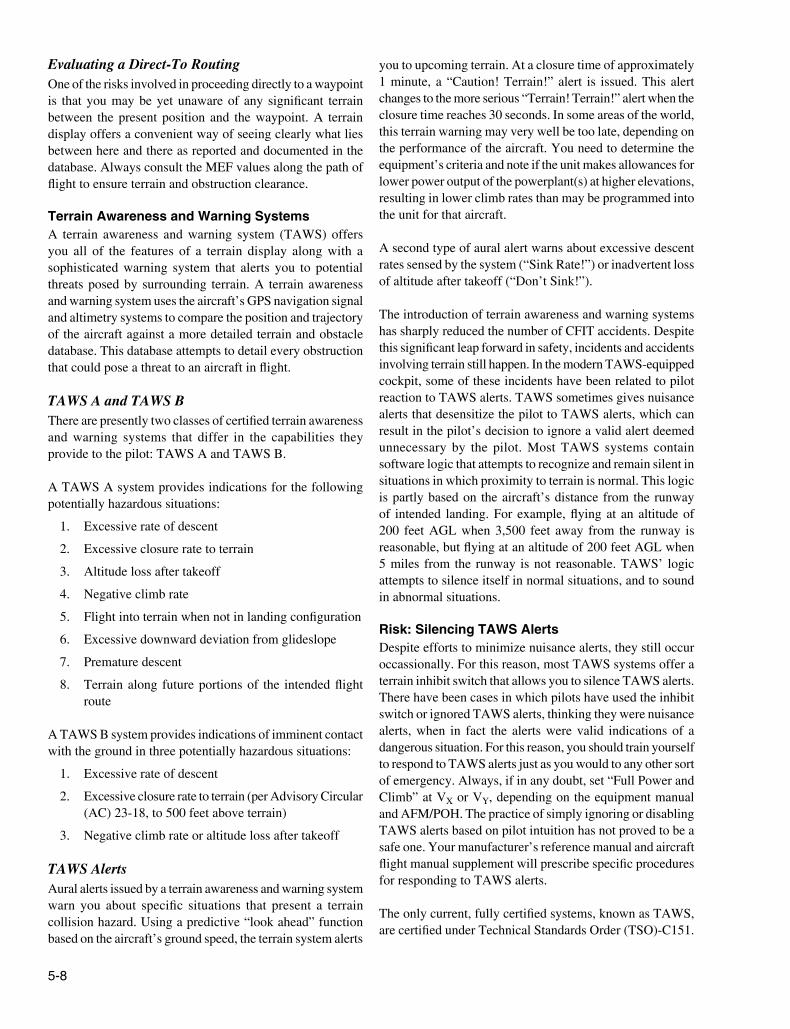
Color coding is used to depict the height of surrounding terrain relative to the current altitude of the aircraft. At its present altitude, this aircraft will not clear the terrain on its way to KRIL.
Figure 5-10. Terrain depicted on an MFD.
started. The older GPWS had no indication of a very close hazard. However, the system did prevent numerous gear-up landings and offered warnings when terrain presented a slope to much higher terrain.
Terrain DisplayThe most basic type (not necessarily certified) of terrain system is the terrain display. A terrain display uses the MFD to plot the position of the aircraft against a pictorial presentation of surrounding terrain. A terrain display usually relies on a GPS location signal to compare the position and altitude of the aircraft against the terrain found in an internal topographical database. Figure 5-10 shows the position of the aircraft and surrounding terrain displayed on an MFD.
Terrain displays use a simple color-coding convention to portray the difference between the present altitude of the aircraft and the height of the surrounding terrain. Terrain more than 1,000 feet below the aircraft is coded black. Terrain less than 1,000 feet but more than 100 feet below the aircraft is coded yellow. Terrain less than 100 feet below the aircraft is coded red. Man-made obstacles (e.g., radio towers, power lines, buildings) generally do not appear in a topographical database.
Monitoring Surrounding Terrain During Departure and ArrivalTerrain displays are especially useful during departure and arrival phases of flight. For example, the aircraft shown in Figure 5-10 has departed Denver and is heading for a waypoint situated in high terrain in the Rocky Mountains. A pilot with good situational awareness has many concerns during the departure. For instance, is climb performance meeting expectations? The terrain display reduces the need for you to perform mental calculations by verifying that the depiction of the terrain that lies ahead of the aircraft is steadily changing from red to yellow to black. If the terrain depiction remains red as the aircraft approaches, you know there is a problem. Similarly, if the aircraft has been assigned a heading and altitude vector by air traffic control, the terrain display provides a simple way of monitoring the safety of these directives. If the equipment is not certified as meeting TAWS requirements (see Title 14 of the Code of Federal Regulations (14 CFR) part 91, section 91.223), the accuracy can be in doubt.
5-8
Evaluating a Direct-To RoutingOne of the risks involved in proceeding directly to a waypoint is that you may be yet unaware of any significant terrain between the present position and the waypoint. A terrain display offers a convenient way of seeing clearly what lies between here and there as reported and documented in the database. Always consult the MEF values along the path of flight to ensure terrain and obstruction clearance.
Terrain Awareness and Warning SystemsA terrain awareness and warning system (TAWS) offers you all of the features of a terrain display along with a sophisticated warning system that alerts you to potential threats posed by surrounding terrain. A terrain awareness and warning system uses the aircraft’s GPS navigation signal and altimetry systems to compare the position and trajectory of the aircraft against a more detailed terrain and obstacle database. This database attempts to detail every obstruction that could pose a threat to an aircraft in flight.
TAWS A and TAWS BThere are presently two classes of certified terrain awareness and warning systems that differ in the capabilities they provide to the pilot: TAWS A and TAWS B.
A TAWS A system provides indications for the following potentially hazardous situations:
1. Excessive rate of descent
2. Excessive closure rate to terrain
3. Altitude loss after takeoff
4. Negative climb rate
5. Flight into terrain when not in landing configuration
6. Excessive downward deviation from glideslope
7. Premature descent
8. Terrain along future portions of the intended flight route
A TAWS B system provides indications of imminent contact with the ground in three potentially hazardous situations:
1. Excessive rate of descent
2. Excessive closure rate to terrain (per Advisory Circular (AC) 23-18, to 500 feet above terrain)
3. Negative climb rate or altitude loss after takeoff
TAWS AlertsAural alerts issued by a terrain awareness and warning system warn you about specific situations that present a terrain collision hazard. Using a predictive “look ahead” function based on the aircraft’s ground speed, the terrain system alerts
you to upcoming terrain. At a closure time of approximately 1 minute, a “Caution! Terrain!” alert is issued. This alert changes to the more serious “Terrain! Terrain!” alert when the closure time reaches 30 seconds. In some areas of the world, this terrain warning may very well be too late, depending on the performance of the aircraft. You need to determine the equipment’s criteria and note if the unit makes allowances for lower power output of the powerplant(s) at higher elevations, resulting in lower climb rates than may be programmed into the unit for that aircraft.
A second type of aural alert warns about excessive descent rates sensed by the system (“Sink Rate!”) or inadvertent loss of altitude after takeoff (“Don’t Sink!”).
The introduction of terrain awareness and warning systems has sharply reduced the number of CFIT accidents. Despite this significant leap forward in safety, incidents and accidents involving terrain still happen. In the modern TAWS-equipped cockpit, some of these incidents have been related to pilot reaction to TAWS alerts. TAWS sometimes gives nuisance alerts that desensitize the pilot to TAWS alerts, which can result in the pilot’s decision to ignore a valid alert deemed unnecessary by the pilot. Most TAWS systems contain software logic that attempts to recognize and remain silent in situations in which proximity to terrain is normal. This logic is partly based on the aircraft’s distance from the runway of intended landing. For example, flying at an altitude of 200 feet AGL when 3,500 feet away from the runway is reasonable, but flying at an altitude of 200 feet AGL when 5 miles from the runway is not reasonable. TAWS’ logic attempts to silence itself in normal situations, and to sound in abnormal situations.
Risk: Silencing TAWS AlertsDespite efforts to minimize nuisance alerts, they still occur occassionally. For this reason, most TAWS systems offer a terrain inhibit switch that allows you to silence TAWS alerts. There have been cases in which pilots have used the inhibit switch or ignored TAWS alerts, thinking they were nuisance alerts, when in fact the alerts were valid indications of a dangerous situation. For this reason, you should train yourself to respond to TAWS alerts just as you would to any other sort of emergency. Always, if in any doubt, set “Full Power and Climb” at VX or VY, depending on the equipment manual and AFM/POH. The practice of simply ignoring or disabling TAWS alerts based on pilot intuition has not proved to be a safe one. Your manufacturer’s reference manual and aircraft flight manual supplement will prescribe specific procedures for responding to TAWS alerts.
The only current, fully certified systems, known as TAWS, are certified under Technical Standards Order (TSO)-C151.
5-9
TAWS equipment is required for turbine-powered airplanes having six or more passenger seats and manufactured after certain dates (see 14 CFR part 91, section 91.223). TAWS is now an affordable option in many advanced avionics due to decreased cost and increased capabilities of computer circuits and components. All aircraft would be safer with TAWS and crews trained to use the technology.
Risk: Flying in Close Proximity to TerrainA display that plainly shows your position with respect to surrounding terrain is sometimes cited as the most reassuring system available in the advanced avionics cockpit. The same display can also invite the unwary pilot to attempt risky maneuvers. Suppose that, on a VFR flight to an airport located in hilly terrain, you encounter a layer of fog at 1,100 feet. In an aircraft with no terrain system, you would not consider proceeding to the airport because you have a personal minimum of 1,500 feet. With a ceiling of less than 1,500 feet, you deem the situation simply too risky. With the surrounding terrain neatly displayed in front of you, however, you may feel more confident and be tempted to give it a try. However, a wise pilot remembers that, unless the equipment is TAWS certified, accuracy is suspect. Even with TAWS certification, the information presented is no better than the database accuracy. Consult the equipment handbook or manual to determine the accuracy of the database in that area.
CFIT accidents are still occurring despite the advent of advanced avionics. What has happened here? Psychologist Gerald J. S. Wilde coined the phrase risk homeostasis to refer to a tendency for humans to seek target levels of risk. Our hill-flying scenario illustrates the concept. After pondering the perceived risks, you decide that having the terrain display gives you the same level of perceived risk with a 1,000-foot ceiling as you felt you had at 1,500 feet without the terrain display. You see no need to “give away” this new margin of perceived safety. Rather, you decide to use it to your advantage. Equipped with the terrain display, your new minimum ceiling becomes 1,000 feet, and you continue on your way to the airport.
Wilde does not support the idea of using technology to seek target levels of risk. Rather, he argues that safety measures such as seat belt laws and anti-lock brakes have not resulted in drastic reductions in highway fatalities in part because, in response to the added sense of safety provided by these measures, drivers have emboldened their driving behavior to maintain existing levels of risk.
Another issue is the lack of training in the new equipment and its uses. The functions of TAWS and basically how it works have been previously described, yet there is no training program outside the military that teaches anyone to
fly based on the TAWS display. It requires much precision flight training to learn the timing and skills to fly from a display depicting a myriad of data and converting that data into close and low terrain flight directions. All advanced avionics are designed to help the pilot avoid a hazard, not enable the pilot to get closer to it. TAWS is not a terrain flight following system.
Cockpit Weather SystemsAdvanced avionics cockpit weather systems provide many of the same weather products available on the ground and have a variety of uses that can enhance awareness of weather that may be encountered during almost any phase of flight. Radar images, satellite weather pictures, Aviation Routine Weather Reports (METARs), terminal weather forecasts (TAFs), significant meteorological information (SIGMETs), Airmen’s Meteorological Information (AIRMETs), and other products are now readily accessible at any time during flight. Weather products provided by cockpit weather systems are typically presented on an MFD. Some installations allow the overlay of this data in the PFD. You must learn the procedures required to show each kind of weather product on the MFD and/or PFD, and how to interpret each type of weather product. Know the limitations of each type of product, and the ways in which cockpit weather systems can be used to gather information and remain clear of weather hazards throughout the flight.
Thunderstorms and PrecipitationThunderstorms and general areas of precipitation are detected through the use of radar. In the advanced avionics cockpit, radar data can come from one of two sources: an onboard weather radar system or a ground weather surveillance radar system, such as the Next Generation Radar (NEXRAD) system. Ground weather surveillance system data is transmitted to the cockpit via a broadcast (or datalink) weather service. Onboard weather radar and ground weather surveillance radar systems each offer advantages and disadvantages to the pilot. Some aircraft use a combination of both systems.
While onboard radar is real time, many downloaded radar images and other reports are delayed for some time period for various reasons. Given the nature of thunderstorms and other weather hazards, this delay could prove hazardous. You must know the true quality and age of the data.
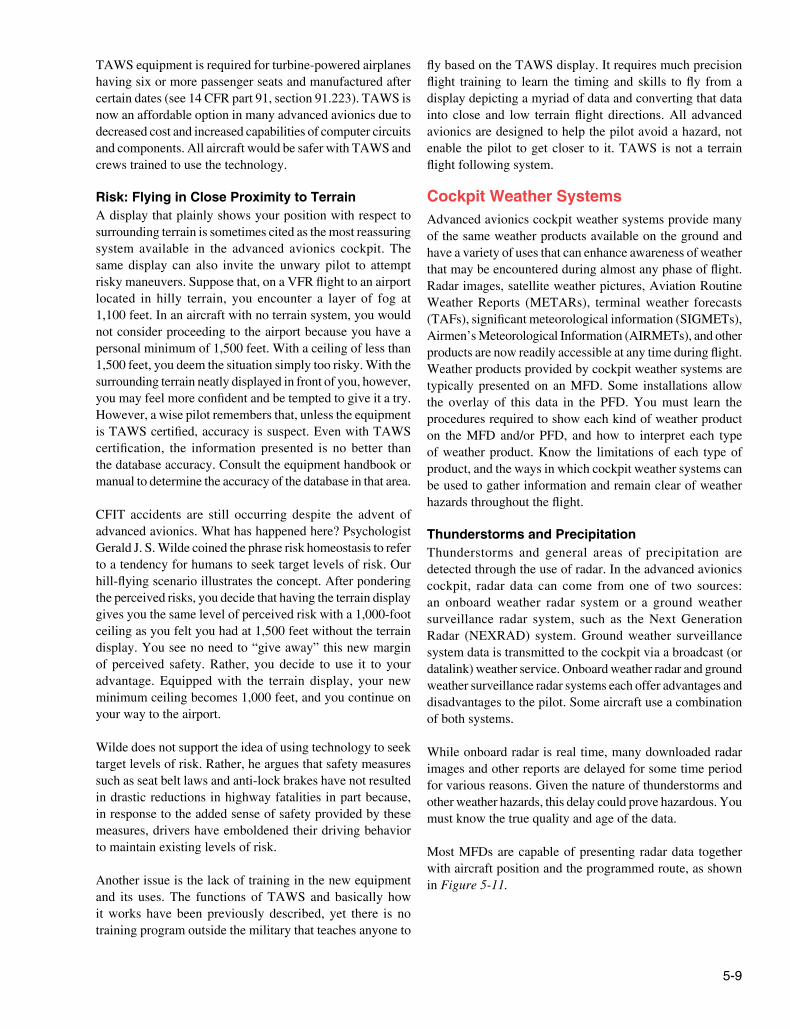
Most MFDs are capable of presenting radar data together with aircraft position and the programmed route, as shown in Figure 5-11.
5-10
KGRN
KBUC
KBJC
L89
308
KHEF KCOS
KCEN
NORTH UP
KFTC
H82
KBJC
KCLN
L89
KGHR
308
KLAR
KLVL
KHEF KCOS
LAR
HCT
KFTC
H82
KDEN
KFTR
KBUC
KCEN
W GPH
25
NORTH UP
V SIG / AIR
MAP NRSTWPT AUX
NEXRADAGE: 5min
RAIN
MIX
SNOW
L I G H T
H E A V Y
30NM5338
11652
200
46
13.7
2300
23.0
NAV1 117.95 115.40NAV2 108.00 117.95
123.750 119.925 COM1135.975 120.050 COM2
GS 123kts DIS 53.2NM ETE 25:58 ESA 16800
ENGINE ECHO TOP CLD TOP LTNG CELL MOV SIG / AIR METARNEXRAD LEGEND MORE WX
MAP NRSTWPT AUX
MAP - NAVIGATION MAPNORTH UP
30NM
Figure 5-11. Radar data shown on an MFD.
0
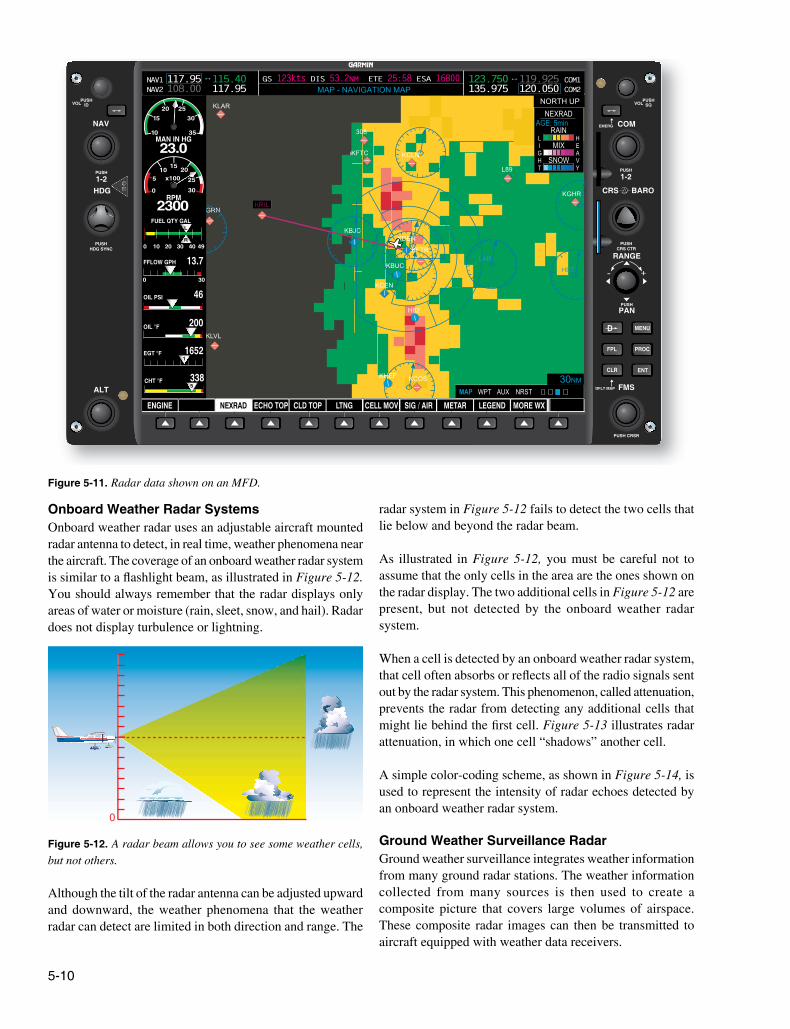
Figure 5-12. A radar beam allows you to see some weather cells, but not others.
Onboard Weather Radar SystemsOnboard weather radar uses an adjustable aircraft mounted radar antenna to detect, in real time, weather phenomena near the aircraft. The coverage of an onboard weather radar system is similar to a flashlight beam, as illustrated in Figure 5-12. You should always remember that the radar displays only areas of water or moisture (rain, sleet, snow, and hail). Radar does not display turbulence or lightning.
Although the tilt of the radar antenna can be adjusted upward and downward, the weather phenomena that the weather radar can detect are limited in both direction and range. The
radar system in Figure 5-12 fails to detect the two cells that lie below and beyond the radar beam.
As illustrated in Figure 5-12, you must be careful not to assume that the only cells in the area are the ones shown on the radar display. The two additional cells in Figure 5-12 are present, but not detected by the onboard weather radar system.
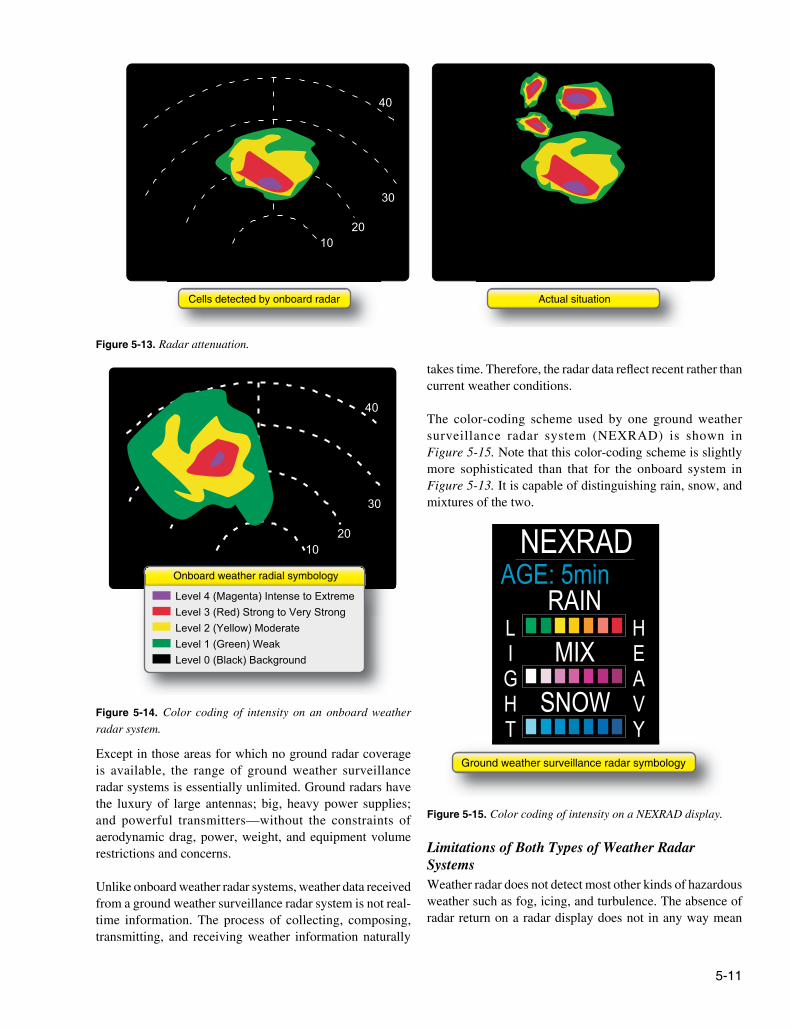
When a cell is detected by an onboard weather radar system, that cell often absorbs or reflects all of the radio signals sent out by the radar system. This phenomenon, called attenuation, prevents the radar from detecting any additional cells that might lie behind the first cell. Figure 5-13 illustrates radar attenuation, in which one cell “shadows” another cell.
A simple color-coding scheme, as shown in Figure 5-14, is used to represent the intensity of radar echoes detected by an onboard weather radar system.
Ground Weather Surveillance RadarGround weather surveillance integrates weather information from many ground radar stations. The weather information collected from many sources is then used to create a composite picture that covers large volumes of airspace. These composite radar images can then be transmitted to aircraft equipped with weather data receivers.
5-11
1020
30
40
Cells detected by onboard radar Actual situation
Figure 5-13. Radar attenuation.
1020
30
40
Onboard weather radial symbology
Level 4 (Magenta) Intense to ExtremeLevel 3 (Red) Strong to Very StrongLevel 2 (Yellow) ModerateLevel 1 (Green) WeakLevel 0 (Black) Background
Figure 5-14. Color coding of intensity on an onboard weather radar system.
NEXRADAGE: 5min
RAIN
MIX
SNOW
L I G H T
H E A V Y
Ground weather surveillance radar symbology
Figure 5-15. Color coding of intensity on a NEXRAD display.
Except in those areas for which no ground radar coverage is available, the range of ground weather surveillance radar systems is essentially unlimited. Ground radars have the luxury of large antennas; big, heavy power supplies; and powerful transmitters—without the constraints of aerodynamic drag, power, weight, and equipment volume restrictions and concerns.
Unlike onboard weather radar systems, weather data received from a ground weather surveillance radar system is not real-time information. The process of collecting, composing, transmitting, and receiving weather information naturally
takes time. Therefore, the radar data reflect recent rather than current weather conditions.
The color-coding scheme used by one ground weather surveillance radar system (NEXRAD) is shown in Figure 5-15. Note that this color-coding scheme is slightly more sophisticated than that for the onboard system in Figure 5-13. It is capable of distinguishing rain, snow, and mixtures of the two.
Limitations of Both Types of Weather Radar SystemsWeather radar does not detect most other kinds of hazardous weather such as fog, icing, and turbulence. The absence of radar return on a radar display does not in any way mean
5-12
LIGHTNING MODECELL
STRIKE RATE0
HH
H
H
H
H
H
H
H
H
HH
H
H
HH
H
H
H25n
m
50n m
Figure 5-16. Lightning strikes shown on an MFD.
CLD TOPAGE: 18min
MAP NRSTWPT AUX
BAKERSFIELD
VISALIA
FRESNO
30NM5338
11652
200
46
13.7
2300
23.0
NAV1 116.00 114.80NAV2 113.90 114.60
123.850 125.100 COM1118.600 120.600 COM2
GS 123kts DIS 53.2NM ETE 25:58 ESA 16800
ENGINE ECHO TOP CLD TOP LTNG CELL MOV SIG / AIR METARNEXRAD LEGEND MORE WX
MAP NRSTWPT AUX
MAP - NAVIGATION MAPNORTH UP
30NM
Figure 5-17. Cloud cover and cloud tops shown on an MFD.
“clear skies.” Skillful users of weather radar are able to recover clues of other weather phenomena, such as hail and turbulence, from radar data.
A second limitation of weather radar is that the earliest (cumulus) stage of a thunderstorm is usually free of precipitation and may not be detected by radar. Convective wind shear, severe turbulence, and icing are characteristic of thunderstorms during the cumulus stage.
The pilot must beware of areas that offer no radar coverage. In many cases, these areas appear blank on a weather display. The absence of weather hazards as shown on a screen does not imply the actual absence of weather hazards.
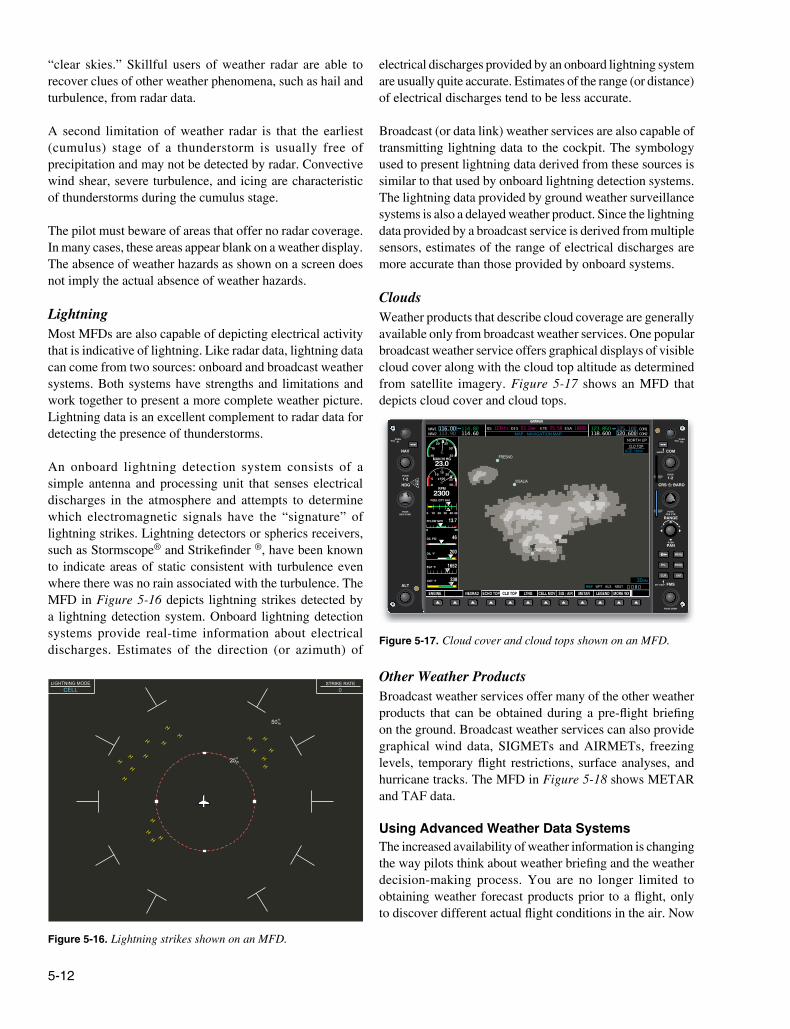
LightningMost MFDs are also capable of depicting electrical activity that is indicative of lightning. Like radar data, lightning data can come from two sources: onboard and broadcast weather systems. Both systems have strengths and limitations and work together to present a more complete weather picture. Lightning data is an excellent complement to radar data for detecting the presence of thunderstorms.
An onboard lightning detection system consists of a simple antenna and processing unit that senses electrical discharges in the atmosphere and attempts to determine which electromagnetic signals have the “signature” of lightning strikes. Lightning detectors or spherics receivers, such as Stormscope® and Strikefinder ®, have been known to indicate areas of static consistent with turbulence even where there was no rain associated with the turbulence. The MFD in Figure 5-16 depicts lightning strikes detected by a lightning detection system. Onboard lightning detection systems provide real-time information about electrical discharges. Estimates of the direction (or azimuth) of
electrical discharges provided by an onboard lightning system are usually quite accurate. Estimates of the range (or distance) of electrical discharges tend to be less accurate.
Broadcast (or data link) weather services are also capable of transmitting lightning data to the cockpit. The symbology used to present lightning data derived from these sources is similar to that used by onboard lightning detection systems. The lightning data provided by ground weather surveillance systems is also a delayed weather product. Since the lightning data provided by a broadcast service is derived from multiple sensors, estimates of the range of electrical discharges are more accurate than those provided by onboard systems.
CloudsWeather products that describe cloud coverage are generally available only from broadcast weather services. One popular broadcast weather service offers graphical displays of visible cloud cover along with the cloud top altitude as determined from satellite imagery. Figure 5-17 shows an MFD that depicts cloud cover and cloud tops.
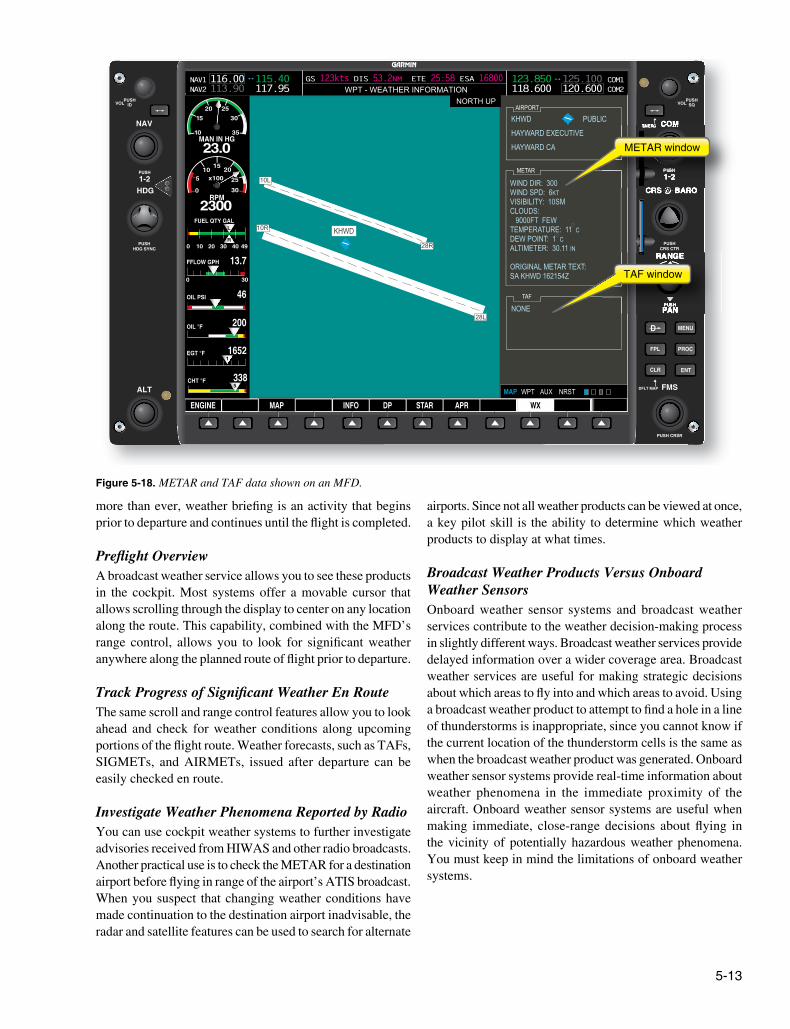
Other Weather ProductsBroadcast weather services offer many of the other weather products that can be obtained during a pre-flight briefing on the ground. Broadcast weather services can also provide graphical wind data, SIGMETs and AIRMETs, freezing levels, temporary flight restrictions, surface analyses, and hurricane tracks. The MFD in Figure 5-18 shows METAR and TAF data.
Using Advanced Weather Data SystemsThe increased availability of weather information is changing the way pilots think about weather briefing and the weather decision-making process. You are no longer limited to obtaining weather forecast products prior to a flight, only to discover different actual flight conditions in the air. Now
5-13
MAP NRSTWPT AUX
AIRPORT
METAR
TAF
HAYWARD EXECUTIVE
HAYWARD CA
PUBLICKHWD
WIND DIR: 300 WIND SPD: 6KT VISIBILITY: 10SM CLOUDS: 9000FT FEW TEMPERATURE: 11 C DEW POINT: 1 C ALTIMETER: 30.11 IN
ORIGINAL METAR TEXT: SA KHWD 162154Z
NONE
10L
10R
28R
28L
KHWD
5338
11652
200
46
13.7
2300
23.0
NAV1 116.00 115.40NAV2 113.90 117.95
123.850 125.100 COM1118.600 120.600 COM2
GS 123kts DIS 53.2NM ETE 25:58 ESA 16800
ENGINE INFO DP STAR APRMAP WX
MAP NRSTWPT AUX
WPT - WEATHER INFORMATIONNORTH UP
METAR window
TAF window
Figure 5-18. METAR and TAF data shown on an MFD.
more than ever, weather briefing is an activity that begins prior to departure and continues until the flight is completed.
Preflight OverviewA broadcast weather service allows you to see these products in the cockpit. Most systems offer a movable cursor that allows scrolling through the display to center on any location along the route. This capability, combined with the MFD’s range control, allows you to look for significant weather anywhere along the planned route of flight prior to departure.
Track Progress of Significant Weather En RouteThe same scroll and range control features allow you to look ahead and check for weather conditions along upcoming portions of the flight route. Weather forecasts, such as TAFs, SIGMETs, and AIRMETs, issued after departure can be easily checked en route.
Investigate Weather Phenomena Reported by RadioYou can use cockpit weather systems to further investigate advisories received from HIWAS and other radio broadcasts. Another practical use is to check the METAR for a destination airport before flying in range of the airport’s ATIS broadcast. When you suspect that changing weather conditions have made continuation to the destination airport inadvisable, the radar and satellite features can be used to search for alternate
airports. Since not all weather products can be viewed at once, a key pilot skill is the ability to determine which weather products to display at what times.
Broadcast Weather Products Versus Onboard Weather SensorsOnboard weather sensor systems and broadcast weather services contribute to the weather decision-making process in slightly different ways. Broadcast weather services provide delayed information over a wider coverage area. Broadcast weather services are useful for making strategic decisions about which areas to fly into and which areas to avoid. Using a broadcast weather product to attempt to find a hole in a line of thunderstorms is inappropriate, since you cannot know if the current location of the thunderstorm cells is the same as when the broadcast weather product was generated. Onboard weather sensor systems provide real-time information about weather phenomena in the immediate proximity of the aircraft. Onboard weather sensor systems are useful when making immediate, close-range decisions about flying in the vicinity of potentially hazardous weather phenomena. You must keep in mind the limitations of onboard weather systems.
5-14
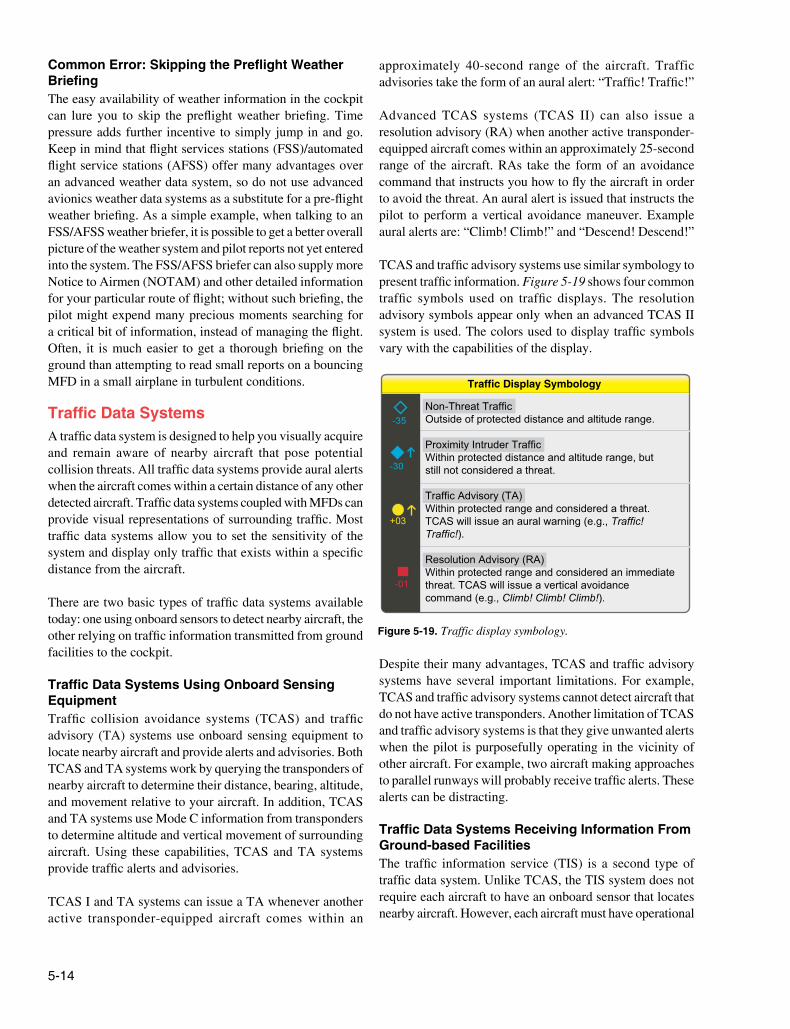
Traffic Display Symbology
+03
Non-Threat TrafficOutside of protected distance and altitude range.
Proximity Intruder TrafficWithin protected distance and altitude range, but still not considered a threat.
Traffic Advisory (TA)Within protected range and considered a threat. TCAS will issue an aural warning (e.g., Traffic! Traffic!).
Resolution Advisory (RA)Within protected range and considered an immediate threat. TCAS will issue a vertical avoidance command (e.g., Climb! Climb! Climb!).
Figure 5-19. Traffic display symbology.
Common Error: Skipping the Preflight Weather BriefingThe easy availability of weather information in the cockpit can lure you to skip the preflight weather briefing. Time pressure adds further incentive to simply jump in and go. Keep in mind that flight services stations (FSS)/automated flight service stations (AFSS) offer many advantages over an advanced weather data system, so do not use advanced avionics weather data systems as a substitute for a pre-flight weather briefing. As a simple example, when talking to an FSS/AFSS weather briefer, it is possible to get a better overall picture of the weather system and pilot reports not yet entered into the system. The FSS/AFSS briefer can also supply more Notice to Airmen (NOTAM) and other detailed information for your particular route of flight; without such briefing, the pilot might expend many precious moments searching for a critical bit of information, instead of managing the flight. Often, it is much easier to get a thorough briefing on the ground than attempting to read small reports on a bouncing MFD in a small airplane in turbulent conditions.
Traffic Data SystemsA traffic data system is designed to help you visually acquire and remain aware of nearby aircraft that pose potential collision threats. All traffic data systems provide aural alerts when the aircraft comes within a certain distance of any other detected aircraft. Traffic data systems coupled with MFDs can provide visual representations of surrounding traffic. Most traffic data systems allow you to set the sensitivity of the system and display only traffic that exists within a specific distance from the aircraft.
There are two basic types of traffic data systems available today: one using onboard sensors to detect nearby aircraft, the other relying on traffic information transmitted from ground facilities to the cockpit.
Traffic Data Systems Using Onboard Sensing EquipmentTraffic collision avoidance systems (TCAS) and traffic advisory (TA) systems use onboard sensing equipment to locate nearby aircraft and provide alerts and advisories. Both TCAS and TA systems work by querying the transponders of nearby aircraft to determine their distance, bearing, altitude, and movement relative to your aircraft. In addition, TCAS and TA systems use Mode C information from transponders to determine altitude and vertical movement of surrounding aircraft. Using these capabilities, TCAS and TA systems provide traffic alerts and advisories.
TCAS I and TA systems can issue a TA whenever another active transponder-equipped aircraft comes within an
approximately 40-second range of the aircraft. Traffic advisories take the form of an aural alert: “Traffic! Traffic!”
Advanced TCAS systems (TCAS II) can also issue a resolution advisory (RA) when another active transponder- equipped aircraft comes within an approximately 25-second range of the aircraft. RAs take the form of an avoidance command that instructs you how to fly the aircraft in order to avoid the threat. An aural alert is issued that instructs the pilot to perform a vertical avoidance maneuver. Example aural alerts are: “Climb! Climb!” and “Descend! Descend!”
TCAS and traffic advisory systems use similar symbology to present traffic information. Figure 5-19 shows four common traffic symbols used on traffic displays. The resolution advisory symbols appear only when an advanced TCAS II system is used. The colors used to display traffic symbols vary with the capabilities of the display.
Despite their many advantages, TCAS and traffic advisory systems have several important limitations. For example, TCAS and traffic advisory systems cannot detect aircraft that do not have active transponders. Another limitation of TCAS and traffic advisory systems is that they give unwanted alerts when the pilot is purposefully operating in the vicinity of other aircraft. For example, two aircraft making approaches to parallel runways will probably receive traffic alerts. These alerts can be distracting.
Traffic Data Systems Receiving Information From Ground-based FacilitiesThe traffic information service (TIS) is a second type of traffic data system. Unlike TCAS, the TIS system does not require each aircraft to have an onboard sensor that locates nearby aircraft. However, each aircraft must have operational
5-15
and active transponders to be indicated on the ATC system. Rather, TIS captures traffic information that appears on radar scopes at nearby air traffic control facilities and broadcasts that information to appropriately equipped aircraft. In order to use TIS, aircraft must be equipped with a transponder capable of receiving TIS broadcasts. When TIS is operational, TIS-capable aircraft can observe traffic information in the cockpit and receive traffic advisories for proximate aircraft.
There is an important limitation of TIS. TIS data is only transmitted from approach radar facilities. No information is broadcast from en route (air route traffic control center (ARTCC)) facilities, so the effective coverage of TIS is limited to larger metropolitan areas. Some approach radar facilities are not equipped to send TIS information. Note that the aircraft must be within range (approximately 50 NM) and within line of site of the TIS station to receive broadcasts.
Advanced Traffic Data Systems Based on ADS-BFuture traffic avoidance systems will probably be able to determine position and digitally exchange information with airborne and ground-based facilities. Using the automatic dependent surveillance—broadcast (ADS-B) system, participating aircraft will continuously broadcast their own position, altitude, airspeed, trajectory, and identification to air traffic control facilities. ADS-B aircraft continuously receive the same information from like equipped aircraft in the area (line of sight), which allows onboard displays for surrounding traffic. ADS-B has been used with much success in Alaskan trials and requires less infrastructure to be usable. ADS-B equipment is demonstrating promise for better traffic separation on transoceanic routes well out of range of land-based systems. ADS-B signals are transmitted on the 978 MHz channel. The information gathered from all participating aircraft can then be transmitted back to each TIS aircraft to provide a detailed picture of the traffic situation, even if those aircraft do not have ADS-B onboard.
Using a Traffic Data SystemSetting Sensitivity on a Traffic Data SystemMost traffic data systems allow you to adjust sensitivity and configure the system to track targets occurring only within a specified distance and altitude. More sophisticated traffic data systems automatically adjust sensitivity throughout different phases of flight. It is important to become familiar with the use of these controls and features.
Responding to Traffic AlertsYou must develop skill in the task of visually acquiring aircraft identified by an advanced avionics traffic data system. This task requires you to use angles and distances displayed on a traffic display to help guide your visual search out the window. Since both the directions and altitudes of intruding
aircraft provided to the aircraft’s traffic data receiver are subject to error, you must widen your scan to all areas around the location presented on the traffic display.
When responding to air traffic control requests to acquire and maintain visual separation from nearby targets, be careful not to acknowledge contact with targets that have been observed only on a traffic display. Do not report having the traffic “in sight” before visual acquisition of a target.
Error: Overreliance on Traffic Data System/Failure To ScanKeep in mind that a traffic data system is designed to enhance “see and avoid” capabilities. You must avoid any tendency to rely too much on traffic data systems, or to use traffic data systems as a substitute for visual scanning and acquisition of surrounding traffic. Because of the limitations of advanced traffic data systems, think of them as supplemental to your traffic awareness while you continue to assume primary responsibility to see and avoid other aircraft. Remember, too, that systems can and do fail. Traffic data systems are quite complex and any failure from the other aircraft’s transponder/GPS/encoder to your receiver/decoder/GPS/ traffic computer and display encoder will reduce data on your display. Power spikes, weather (lightning), and other onboard aircraft disturbances are all unknown and changing. As experience is gained with the system, better designs will eliminate problems yet to be discovered.
Using a Traffic Data System on the GroundMost traffic data systems automatically switch to a standby mode when the aircraft is on the ground or operating below a minimum speed. The same systems typically allow you to override this feature and manually activate the traffic data system at any time. There are a number of ways to exploit this capability. When departing from an uncontrolled airport, the traffic data system can help you learn of other traffic in the vicinity of the airport. When operating in low-visibility conditions, the same feature can help inform of other aircraft operating on the airport surface. One potential future application of ADS-B is allowing controllers and pilots to monitor aircraft better on taxiways and runways. You must check equipment documentation to determine when the transponder actually transmits, where the selection controls are located, and how to use those controls.
Fuel Management SystemsA fuel management system can help you make the fuel calculations needed for in-flight decisions about potential routing, fuel stops, and diversions. A fuel management system offers the advantage of precise fuel calculations based on time, distance, winds, and fuel flow measured by
5-16
INTIAL USABLE FUELAdjust level with right knob
Fuel Added = 30 Gallons
- 81 Gal (Full)
- 60 Gal
- 40 Gal
- 20 Gal
FUEL ADDED
BRT
DIM
Fuel UnitsU.S. Gallons
Fuel Full
Fuel toTabs
Fuel Done
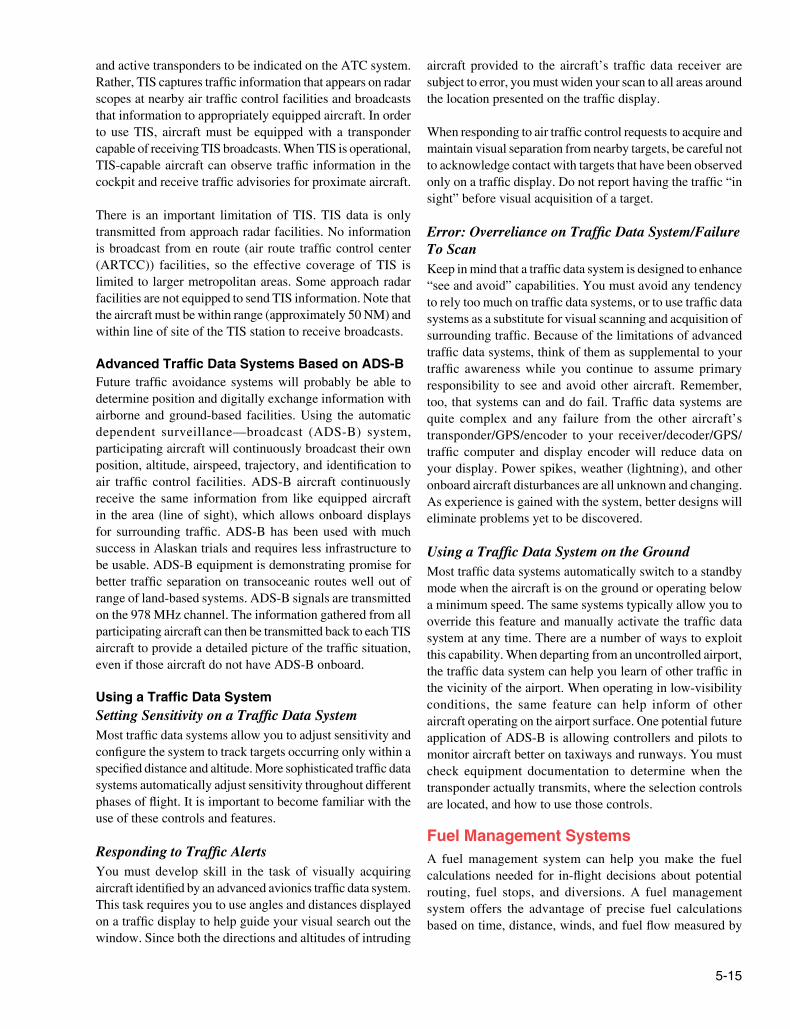
You can dial any initial fuel quantity or choose one of two preselected quantities (Tabs or Full).
Figure 5-20. Making an initial fuel estimate.
242PWR
24
w21
SUNOL
WRAPSDEST
TO BRG
UTC
1m27s Gal.RMNG
22:59:26
RPM
FUEL
REM
OIL
L EAN
OAT
GPH
Gal
F
C
USED
h m
PSI
%IHNG
3 .5 52NM
0h32m Gal.RMNG75.9 44NM
TIME22:59:26
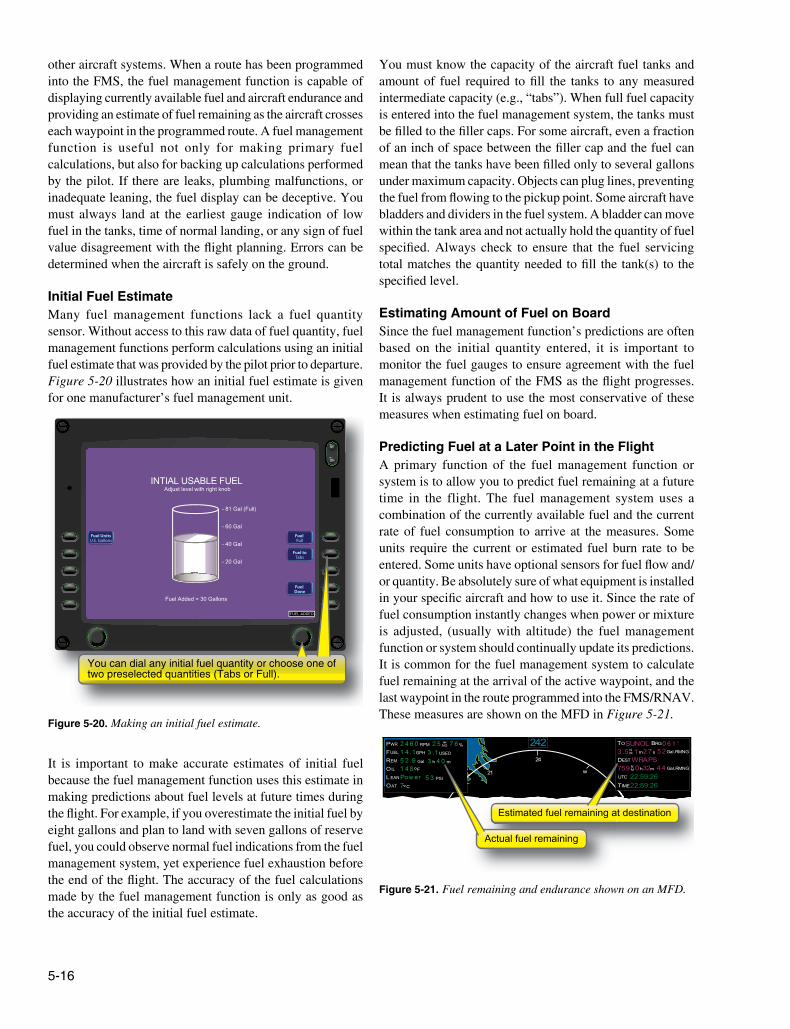
Estimated fuel remaining at destinationg
Actual fuel remaining
Figure 5-21. Fuel remaining and endurance shown on an MFD.
other aircraft systems. When a route has been programmed into the FMS, the fuel management function is capable of displaying currently available fuel and aircraft endurance and providing an estimate of fuel remaining as the aircraft crosses each waypoint in the programmed route. A fuel management function is useful not only for making primary fuel calculations, but also for backing up calculations performed by the pilot. If there are leaks, plumbing malfunctions, or inadequate leaning, the fuel display can be deceptive. You must always land at the earliest gauge indication of low fuel in the tanks, time of normal landing, or any sign of fuel value disagreement with the flight planning. Errors can be determined when the aircraft is safely on the ground.
Initial Fuel EstimateMany fuel management functions lack a fuel quantity sensor. Without access to this raw data of fuel quantity, fuel management functions perform calculations using an initial fuel estimate that was provided by the pilot prior to departure. Figure 5-20 illustrates how an initial fuel estimate is given for one manufacturer’s fuel management unit.
It is important to make accurate estimates of initial fuel because the fuel management function uses this estimate in making predictions about fuel levels at future times during the flight. For example, if you overestimate the initial fuel by eight gallons and plan to land with seven gallons of reserve fuel, you could observe normal fuel indications from the fuel management system, yet experience fuel exhaustion before the end of the flight. The accuracy of the fuel calculations made by the fuel management function is only as good as the accuracy of the initial fuel estimate.
You must know the capacity of the aircraft fuel tanks and amount of fuel required to fill the tanks to any measured intermediate capacity (e.g., “tabs”). When full fuel capacity is entered into the fuel management system, the tanks must be filled to the filler caps. For some aircraft, even a fraction of an inch of space between the filler cap and the fuel can mean that the tanks have been filled only to several gallons under maximum capacity. Objects can plug lines, preventing the fuel from flowing to the pickup point. Some aircraft have bladders and dividers in the fuel system. A bladder can move within the tank area and not actually hold the quantity of fuel specified. Always check to ensure that the fuel servicing total matches the quantity needed to fill the tank(s) to the specified level.
Estimating Amount of Fuel on BoardSince the fuel management function’s predictions are often based on the initial quantity entered, it is important to monitor the fuel gauges to ensure agreement with the fuel management function of the FMS as the flight progresses. It is always prudent to use the most conservative of these measures when estimating fuel on board.
Predicting Fuel at a Later Point in the FlightA primary function of the fuel management function or system is to allow you to predict fuel remaining at a future time in the flight. The fuel management system uses a combination of the currently available fuel and the current rate of fuel consumption to arrive at the measures. Some units require the current or estimated fuel burn rate to be entered. Some units have optional sensors for fuel flow and/or quantity. Be absolutely sure of what equipment is installed in your specific aircraft and how to use it. Since the rate of fuel consumption instantly changes when power or mixture is adjusted, (usually with altitude) the fuel management function or system should continually update its predictions. It is common for the fuel management system to calculate fuel remaining at the arrival of the active waypoint, and the last waypoint in the route programmed into the FMS/RNAV. These measures are shown on the MFD in Figure 5-21.
5-17
KCMI
KTIP
K96
2KO
C16
KDEC
DEC
30NM
MAP NRSTWPT AUX5338
11652
200
46
13.7
2300
23.0
NAV1 116.00 115.40ECANAV2 113.90 117.95
123.850 125.100 COM1118.600 120.600 COM2
GS 123kts DIS 53.2NM ETE 25:58 ESA 16800
ENGINE MAP OCLTR
MAP NRSTWPT AUX
MAP - NAVIGATION MAPNORTH UP
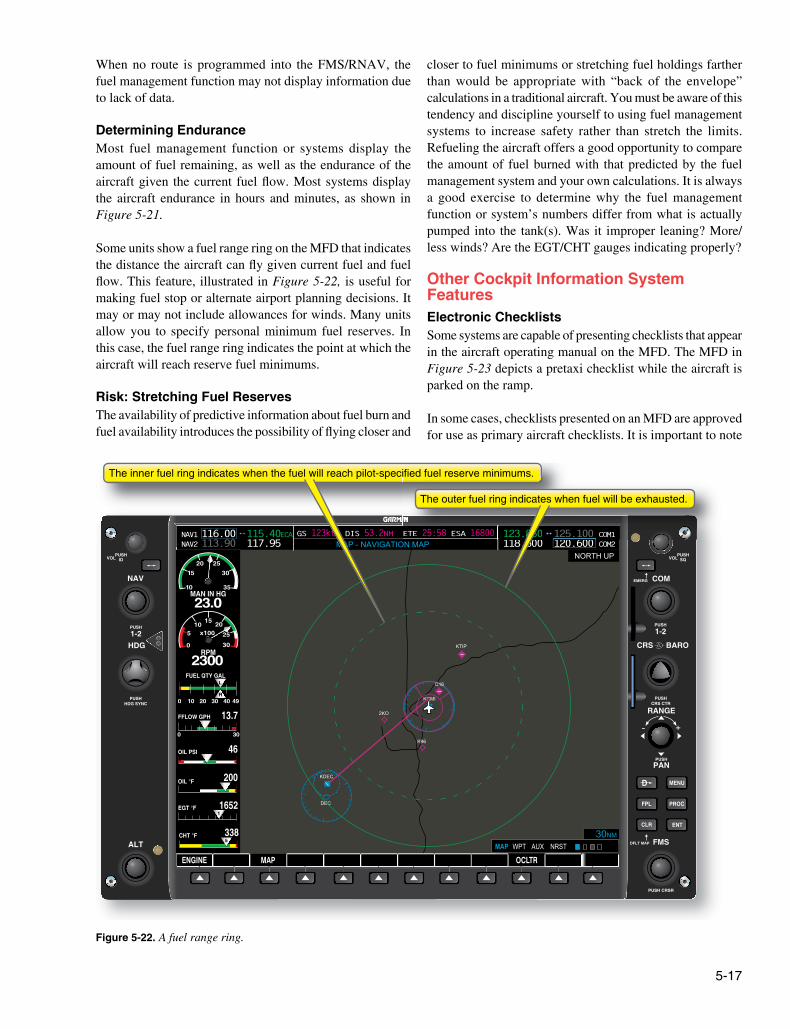
The inner fuel ring indicates when the fuel will reach pilot-specified fuel reserve minimums.
123.850 121255.101000 COM1118 600 120 600
ETE 25:58 ESA 16800
The outer fuel ring indicates when fuel will be exhausted.
Figure 5-22. A fuel range ring.
When no route is programmed into the FMS/RNAV, the fuel management function may not display information due to lack of data.
Determining EnduranceMost fuel management function or systems display the amount of fuel remaining, as well as the endurance of the aircraft given the current fuel flow. Most systems display the aircraft endurance in hours and minutes, as shown in Figure 5-21.
Some units show a fuel range ring on the MFD that indicates the distance the aircraft can fly given current fuel and fuel flow. This feature, illustrated in Figure 5-22, is useful for making fuel stop or alternate airport planning decisions. It may or may not include allowances for winds. Many units allow you to specify personal minimum fuel reserves. In this case, the fuel range ring indicates the point at which the aircraft will reach reserve fuel minimums.
Risk: Stretching Fuel ReservesThe availability of predictive information about fuel burn and fuel availability introduces the possibility of flying closer and
closer to fuel minimums or stretching fuel holdings farther than would be appropriate with “back of the envelope” calculations in a traditional aircraft. You must be aware of this tendency and discipline yourself to using fuel management systems to increase safety rather than stretch the limits. Refueling the aircraft offers a good opportunity to compare the amount of fuel burned with that predicted by the fuel management system and your own calculations. It is always a good exercise to determine why the fuel management function or system’s numbers differ from what is actually pumped into the tank(s). Was it improper leaning? More/less winds? Are the EGT/CHT gauges indicating properly?
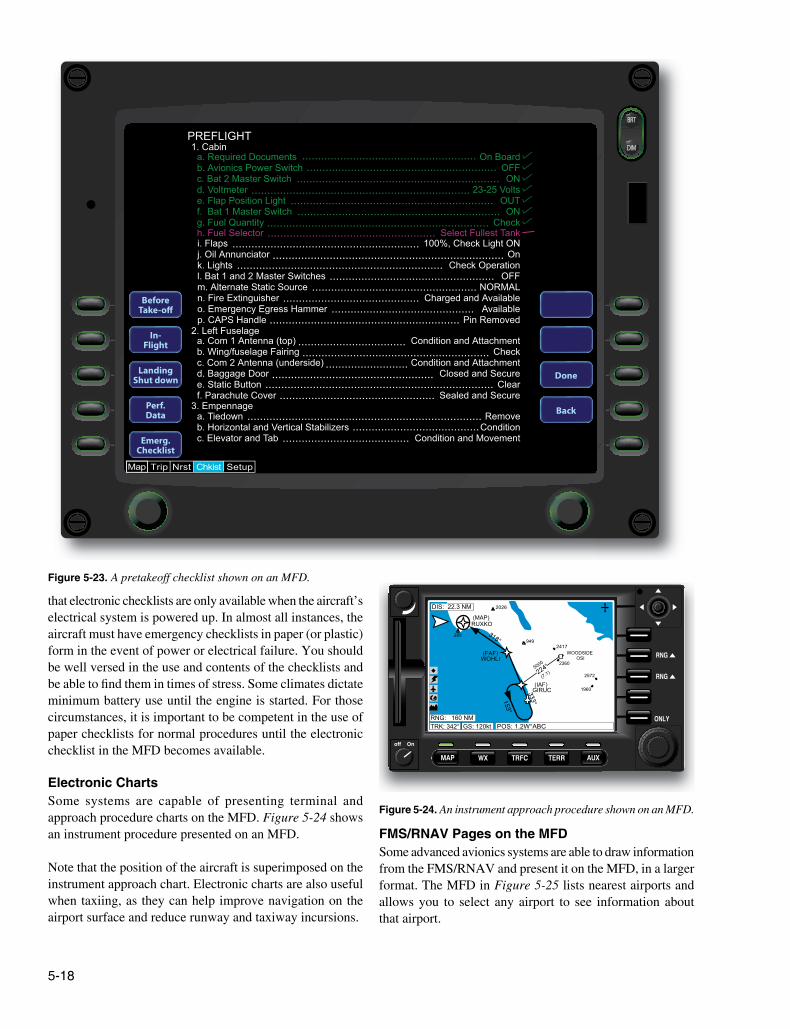
Other Cockpit Information System FeaturesElectronic ChecklistsSome systems are capable of presenting checklists that appear in the aircraft operating manual on the MFD. The MFD in Figure 5-23 depicts a pretaxi checklist while the aircraft is parked on the ramp.
In some cases, checklists presented on an MFD are approved for use as primary aircraft checklists. It is important to note
5-18
PREFLIGHT1. Cabin
h. Fuel Selectori. Flaps j. Oil Annunciator k. Lights l. Bat 1 and 2 Master Switches m. Alternate Static Source n. Fire Extinguisher o. Emergency Egress Hammer p. CAPS Handle
2. Left Fuselagea. Com 1 Antenna (top) b. Wing/fuselage Fairing c. Com 2 Antenna (underside) d. Baggage Door e. Static Button f. Parachute Cover
3. Empennagea. Tiedown b. Horizontal and Vertical Stabilizers c. Elevator and Tab
a. Required Documents b. Avionics Power Switch c. Bat 2 Master Switch d. Voltmeter e. Flap Position Light f. Bat 1 Master Switch g. Fuel Quantity
Select Fullest Tank100%, Check Light ON
On Check Operation
OFF NORMAL
Charged and Available Available
Pin Removed
Condition and Attachment Check
Condition and Attachment Closed and Secure
Clear Sealed and Secure
Remove Condition
Condition and Movement
On Board OFF ON
23-25 Volts OUT
ON Check
...................................................................................................................
.....................................................................................................................................
................................................................................................................................
......................................................................
................................................................................................................
..........................................................................................................................................
........................................................................................................
........................................................................................
............................................................
..........................................................................
...........................................................................................................................
.............................................................................................
.................................................
..........................
................................................................................
Trip Nrst Chkist SetupMap
BRT
DIM
BeforeTake-o�
In-Flight
LandingShut down
Perf.Data
Emerg.Checklist
Done
Back
Figure 5-23. A pretakeoff checklist shown on an MFD.
off On
MAP AUXTRFCWX TERR
RNG
RNG
ONLY
DIS: 22.3 NM
WOHLI(FAF)
GIRUC(IAF)
(7.1)5000
2026
949
(MAP)RUXKO
289
TRK: 342° GS: 120kt POS: 1.2W°ABCRNG: 160 NM
2417
2360
WOODSIDEOSI
2572
1960
Figure 5-24. An instrument approach procedure shown on an MFD.
that electronic checklists are only available when the aircraft’s electrical system is powered up. In almost all instances, the aircraft must have emergency checklists in paper (or plastic) form in the event of power or electrical failure. You should be well versed in the use and contents of the checklists and be able to find them in times of stress. Some climates dictate minimum battery use until the engine is started. For those circumstances, it is important to be competent in the use of paper checklists for normal procedures until the electronic checklist in the MFD becomes available.
Electronic ChartsSome systems are capable of presenting terminal and approach procedure charts on the MFD. Figure 5-24 shows an instrument procedure presented on an MFD.
Note that the position of the aircraft is superimposed on the instrument approach chart. Electronic charts are also useful when taxiing, as they can help improve navigation on the airport surface and reduce runway and taxiway incursions.
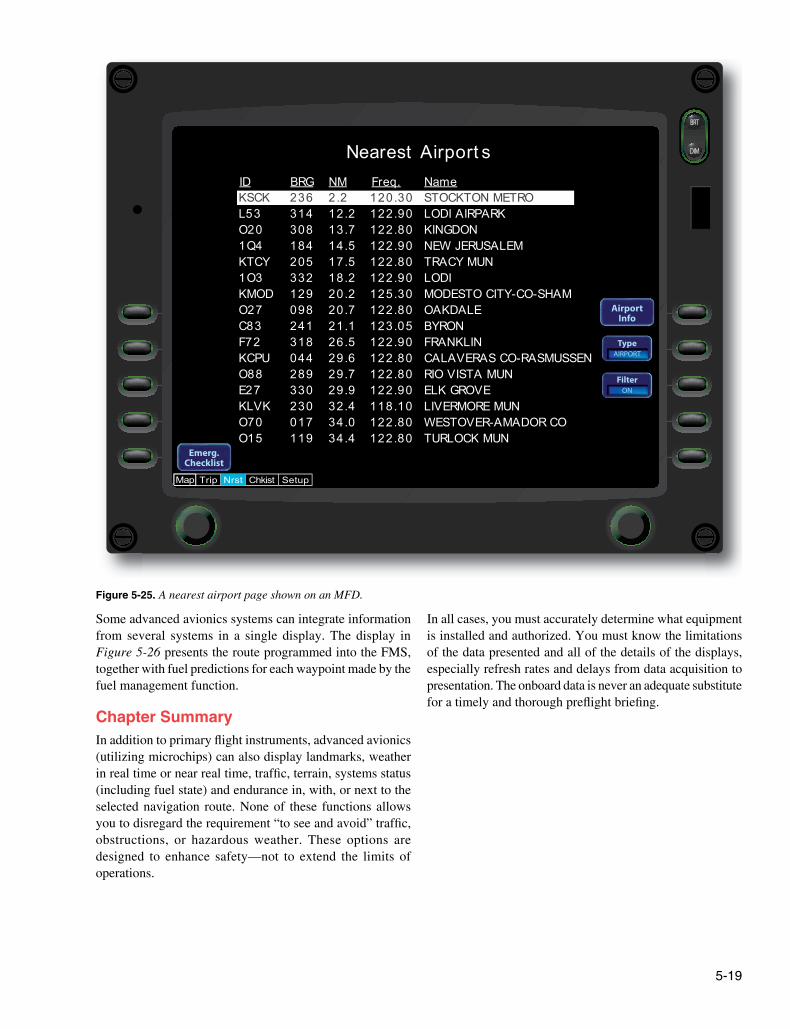
FMS/RNAV Pages on the MFDSome advanced avionics systems are able to draw information from the FMS/RNAV and present it on the MFD, in a larger format. The MFD in Figure 5-25 lists nearest airports and allows you to select any airport to see information about that airport.
5-19
ID BRG NM Freq. Name
Nearest Airport s
KSCK L53 O20 1Q4 KTCY 1O3 KMOD O27 C83 F72 KCPU O88 E27 KLVK O70 O15
236 314 308 184 205 332 129 098 241 318 044 289 330 230 017 119
2.2 12.2 13.7 14.5 17.5 18.2 20.2 20.7 21.1 26.5 29.6 29.7 29.9 32.4 34.0 34.4
120.30 122.90 122.80 122.90 122.80 122.90 125.30 122.80 123.05 122.90 122.80 122.80 122.90 118.10 122.80 122.80
STOCKTON METRO LODI AIRPARK KINGDON NEW JERUSALEM TRACY MUN LODI MODESTO CITY-CO-SHAM OAKDALE BYRON FRANKLIN CALAVERAS CO-RASMUSSEN RIO VISTA MUN ELK GROVE LIVERMORE MUN WESTOVER-AMADOR CO TURLOCK MUN
Trip Nrst Chkist SetupMap
BRT
DIM
Emerg.Checklist
AirportInfo
TypeAIRPORT
FilterON
Figure 5-25. A nearest airport page shown on an MFD.
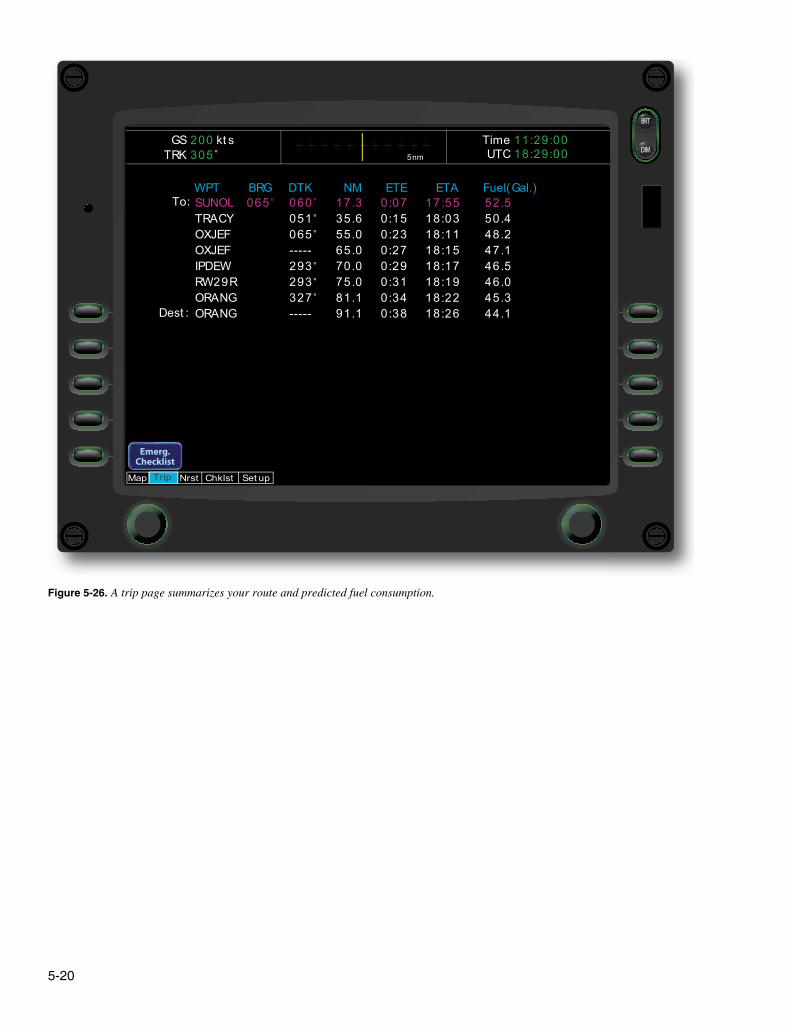
Some advanced avionics systems can integrate information from several systems in a single display. The display in Figure 5-26 presents the route programmed into the FMS, together with fuel predictions for each waypoint made by the fuel management function.
Chapter SummaryIn addition to primary flight instruments, advanced avionics (utilizing microchips) can also display landmarks, weather in real time or near real time, traffic, terrain, systems status (including fuel state) and endurance in, with, or next to the selected navigation route. None of these functions allows you to disregard the requirement “to see and avoid” traffic, obstructions, or hazardous weather. These options are designed to enhance safety—not to extend the limits of operations.
In all cases, you must accurately determine what equipment is installed and authorized. You must know the limitations of the data presented and all of the details of the displays, especially refresh rates and delays from data acquisition to presentation. The onboard data is never an adequate substitute for a timely and thorough preflight briefing.
5-20
Trip Nrst Chkist SetupMapMap Trip Nrst Chklst Set up
TimeUTC
GSTRK
kt s5nm
11:29:0018:29:00
200305
WPT BRG DTK NM ETE ETASUNOL TRACY OXJEF OXJEF IPDEW RW29R ORANG ORANG
060 051 065 ----- 293 293 327 -----
17.3 35.6 55.0 65.0 70.0 75.0 81.1 91.1
0:07 0:15 0:23 0:27 0:29 0:31 0:34 0:38
17:55 18:03 18:11 18:15 18:17 18:19 18:22 18:26
065Fuel(Gal.)
To:
Dest :
52.5 50.4 48.2 47.1 46.5 46.0 45.3 44.1
BRT
DIM
Emerg.Checklist
Figure 5-26. A trip page summarizes your route and predicted fuel consumption.
Related Documents