Changes in leaf phenology of three European oak species in response to experimental climate change Xavier Morin 1,2 , Jacques Roy 1 , Laurette Sonie ´ 1 and Isabelle Chuine 1 1 Centre d’Ecologie Fonctionnelle et Evolutive, Equipe BIOFLUX, CNRS, 1919, route de Mende, F–34293 Montpellier Cedex 5, France; 2 Present address: Forest Ecology, Institute of Terrestrial Ecosystems, Department of Environmental Sciences, Swiss Federal Institute of Technology ETH, Universita ¨tstrasse 22, CH–8092 Zu ¨rich, Switzerland Author for correspondence: Xavier Morin Tel: +41 4 46320765 Email: [email protected] Received: 25 January 2010 Accepted: 18 February 2010 New Phytologist (2010) doi: 10.1111/j.1469-8137.2010.03252.x Key words: climate change, FATI (Free Air Temperature Increase), leaf senescence, leaf unfolding, phenology, temperate oaks, trees. Summary • Because the phenology of trees is strongly driven by environmental factors such as temperature, climate change has already altered the vegetative and repro- ductive phenology of many species, especially in the temperate zone. Here, we aimed to determine whether projected levels of warming for the upcoming decades will lead to linear changes in the phenology of trees or to more complex responses. • We report the results of a 3-yr common garden experiment designed to study the phenological response to artificial climate change, obtained through experimental warming and reduced precipitation, of several populations of three European oaks, two deciduous species (Quercus robur, Quercus pubescens) and one evergreen species (Quercus ilex), in a Mediterranean site. • Experimental warming advanced the seedlings’ vegetative phenology, causing a longer growing season and higher mortality. However, the rate of advancement of leaf unfolding date was decreased with increasing temperature. Conversely, soil water content did not affect the phenology of the seedlings or their survival. • Our results show that the phenological response of trees to climate change may be nonlinear, and suggest that predictions of phenological changes in the future should not be built on extrapolations of current observed trends. Introduction Temperature is widely considered to be a major factor con- trolling the phenology of boreal and temperate tree species (Sarvas, 1972, 1974; Schwartz, 2003). Several studies have documented changes in the phenology of trees such as advancement of leaf unfolding and flowering of 2–3 d per decade on average during the last 50 yr (Keeling et al., 1996; Menzel, 2000; Penuelas et al., 2002; Walther et al., 2002; and see the meta-analysis of Root et al., 2003; Gordo & Sanz, 2005; Menzel et al., 2006; Richardson et al., 2006), and delay of leaf senescence of 1 or 2 d during the same period (Myneni et al., 1997; Menzel & Fabian, 1999; Menzel et al., 2001). These changes have been attributed to the temperature increase that many regions have experienced in the last decades because of global warming (Menzel et al., 2006). Such changes in the growing period of trees have important consequences on carbon cycling (Chapin et al., 2002) and on the Earth’s climate system because of the feedback between vegetation and atmosphere (Betts et al., 1997; de Noblet, 2000). Changes in the plant reproductive period also have important consequences on the reproduc- tive success of populations, and thus on their dynamics (Sherry et al., 2007). Moreover, changes in growth or repro- ductive phenology have major consequences on species interactions, either positive or negative which affect the dynamics of communities (Edwards & Richardson, 2004; Cattadori et al., 2005; Sherry et al., 2007). Therefore, it is imperative to precisely assess the impact of the on-going and future climate change on species phenology. However, to achieve this task one crucial question arises: Can we use the trends observed in the last decades as a predictive tool to forecast phenological changes for the future? (Primack et al., 2009). So far, these trends appear linear with an average global warming of 0.6ŶC, but will they be conserved with a mean global warming of 3ŶC as projected for the middle of this century in some climate scenarios? (IPCC, 2007). To answer this question we need to consider the response of New Phytologist Research ȑ The Authors (2010) Journal compilation ȑ New Phytologist Trust (2010) New Phytologist (2010) 1 www.newphytologist.com

Welcome message from author
This document is posted to help you gain knowledge. Please leave a comment to let me know what you think about it! Share it to your friends and learn new things together.
Transcript
Changes in leaf phenology of three European oakspecies in response to experimental climate change
Xavier Morin1,2, Jacques Roy1, Laurette Sonie1 and Isabelle Chuine1
1Centre d’Ecologie Fonctionnelle et Evolutive, Equipe BIOFLUX, CNRS, 1919, route de Mende, F–34293 Montpellier Cedex 5, France; 2Present address:
Forest Ecology, Institute of Terrestrial Ecosystems, Department of Environmental Sciences, Swiss Federal Institute of Technology ETH, Universitatstrasse
22, CH–8092 Zurich, Switzerland
Author for correspondence:Xavier Morin
Tel: +41 4 46320765
Email: [email protected]
Received: 25 January 2010Accepted: 18 February 2010
New Phytologist (2010)doi: 10.1111/j.1469-8137.2010.03252.x
Key words: climate change, FATI (Free AirTemperature Increase), leaf senescence, leafunfolding, phenology, temperate oaks, trees.
Summary
• Because the phenology of trees is strongly driven by environmental factors such
as temperature, climate change has already altered the vegetative and repro-
ductive phenology of many species, especially in the temperate zone. Here, we
aimed to determine whether projected levels of warming for the upcoming
decades will lead to linear changes in the phenology of trees or to more complex
responses.
• We report the results of a 3-yr common garden experiment designed to study
the phenological response to artificial climate change, obtained through
experimental warming and reduced precipitation, of several populations of three
European oaks, two deciduous species (Quercus robur, Quercus pubescens) and
one evergreen species (Quercus ilex), in a Mediterranean site.
• Experimental warming advanced the seedlings’ vegetative phenology, causing a
longer growing season and higher mortality. However, the rate of advancement of
leaf unfolding date was decreased with increasing temperature. Conversely, soil
water content did not affect the phenology of the seedlings or their survival.
• Our results show that the phenological response of trees to climate change may
be nonlinear, and suggest that predictions of phenological changes in the future
should not be built on extrapolations of current observed trends.
Introduction
Temperature is widely considered to be a major factor con-trolling the phenology of boreal and temperate tree species(Sarvas, 1972, 1974; Schwartz, 2003). Several studies havedocumented changes in the phenology of trees such asadvancement of leaf unfolding and flowering of 2–3 d perdecade on average during the last 50 yr (Keeling et al.,1996; Menzel, 2000; Penuelas et al., 2002; Walther et al.,2002; and see the meta-analysis of Root et al., 2003; Gordo& Sanz, 2005; Menzel et al., 2006; Richardson et al.,2006), and delay of leaf senescence of 1 or 2 d during thesame period (Myneni et al., 1997; Menzel & Fabian, 1999;Menzel et al., 2001). These changes have been attributed tothe temperature increase that many regions have experiencedin the last decades because of global warming (Menzel et al.,2006). Such changes in the growing period of trees haveimportant consequences on carbon cycling (Chapin et al.,2002) and on the Earth’s climate system because of the
feedback between vegetation and atmosphere (Betts et al.,1997; de Noblet, 2000). Changes in the plant reproductiveperiod also have important consequences on the reproduc-tive success of populations, and thus on their dynamics(Sherry et al., 2007). Moreover, changes in growth or repro-ductive phenology have major consequences on speciesinteractions, either positive or negative which affect thedynamics of communities (Edwards & Richardson, 2004;Cattadori et al., 2005; Sherry et al., 2007). Therefore, it isimperative to precisely assess the impact of the on-going andfuture climate change on species phenology. However, toachieve this task one crucial question arises: Can we use thetrends observed in the last decades as a predictive tool toforecast phenological changes for the future? (Primack et al.,2009). So far, these trends appear linear with an averageglobal warming of 0.6�C, but will they be conserved witha mean global warming of 3�C as projected for the middleof this century in some climate scenarios? (IPCC, 2007). Toanswer this question we need to consider the response of
NewPhytologist Research
� The Authors (2010)
Journal compilation � New Phytologist Trust (2010)
New Phytologist (2010) 1www.newphytologist.com
individuals to warming through an experimental approach,using various levels of warming to explore how their pheno-logy will respond in the long term.
Pioneer studies have consisted of transfer experiments,showing that phenology – and especially leaf bud burst –will be affected by future climate change (Beuker, 1994).However, the temperature increase in these experiments wasoften not realistic regarding the climate predictions for thefuture. During the last decade, several experimental workshave been conducted to study the impact of global climatechange on species phenology. Most of these studies havebeen conducted on herbaceous species (Sherry et al., 2007)and the intraspecific variability of response has rarely beenstudied (Franks et al., 2007; Doi et al., 2010). Some otherexperiments tested the effect of an increasing CO2 concen-tration or an increasing temperature, or both, on treespecies phenology. In most cases, phenology was notaffected by increasing CO2 concentration (Guak et al.,1998; Norby et al., 2003; Korner et al., 2005; Asshoffet al., 2006; Kilpelainen et al., 2006), but it was affected byincreasing temperature. Leaf unfolding date was oftenadvanced by increasing temperature (Repo et al., 1996;Guak et al., 1998; Arft et al., 1999; Hollister et al., 2005;Kilpelainen et al., 2006), but some studies showed contrast-ing effects (Norby et al., 2003) or no effect (Jones et al.,1997). However, the response of leaf senescence was highlyvariable, from strong delay (Norby et al., 2003) to advance-ment (Kilpelainen et al., 2006), or absence of response(Jones et al., 1997; Arft et al., 1999). Recently, someauthors have also tested the effect of increasing rainfall onherbaceous plant reproductive phenology (Sherry et al.,2007) and found no significant effect.
Field studies that experimentally simulated warming havemainly used open-top chambers, either closed (Kennedy,1995b; Kilpelainen et al., 2006; Walker et al., 2006), ornot (Repo et al., 1996; Jones et al., 1997; Arft et al., 1999;Hollister et al., 2005), and night screens (Van Wijk et al.,2003; Prieto et al., 2009). In open-top chambers warmingis achieved through high transmittance of solar radiationinto the chamber. In night-screen systems, temperature isincreased only during the night by reflectance of the infra-red radiation emitted by the surface. However, in suchpassive temperature-enhancing systems, unwanted con-founding ecological effects may occur, such as strongchanges in moisture, nonconstant warming, different diur-nal and night warming, site disturbance, wind exclusionand downregulation of photosynthesis (Kennedy, 1995a;Marion et al., 1997; Ainsworth & Long, 2005; Kimball,2005). Much fewer studies have used free-air temperatureincrease (FATI) systems, to overcome these problems(Price & Waser, 1998; Saavedra et al., 2003; Loveys et al.,2005). Such experimental efforts remain scarce, havefocused only on temperature increase (except Sherry et al.,2007), and were not designed to study vegetative pheno-
logy. Furthermore, these experiments usually concern annualplants, and thus do not explore the long-term impact ofchanging climatic conditions on plants.
In this study we aimed to determine whether projectedlevels of warming for the coming decades will lead to linearchanges in the phenology of tree species or if more complexresponses can emerge. To this end, we focused on threeEuropean oak species: common oak (Quercus robur), pubes-cent oak (Quercus pubescens) and holm oak (Quercus ilex).These species were chosen because they have contrastinggeographical ranges: common oak is a temperate–borealspecies, holm oak is a Mediterranean species and pubescentoak has an intermediate distribution (see the SupportingInformation, Fig. S1). They have different leaf habit (com-mon oak and pubescent oak are deciduous while holm oak isevergreen) and different tolerance to drought stress (Rameauet al., 1989, 2008), are congeneric and they have a high eco-nomic importance in Europe. To our knowledge, of thesethree species, long-term phenological records are only avail-able for common oak (Cannell et al., 1999; Menzel et al.,2001; Ahas et al., 2002), which showed a mean advance-ment of 3.3 d per decade in leaf unfolding date.
We monitored the phenology (leaf unfolding and leafcolouring dates) of individuals from different populationsof each species in a nonintrusive climate change field experi-ment using FATI systems and precipitation reduction sys-tems. We sought to answer the following questions: Are themeasured changes in phenology linear with temperatureincrease and consistent with those currently recorded in nat-ural populations? Do the changes in phenology vary amongspecies and populations (i.e. at both interspecific and intra-specific levels)? Is the survival of individuals affected bychanges in temperature and precipitation?
Materials and Methods
Material sampling
C. 200–300 acorns from three populations of Q. robur L.and Q. ilex L., and two populations of Q. pubescens Willd.were sampled in October 2002 (Table 1, Fig. S1). Thepopulations were chosen so as to sample contrasted climaticconditions within the species’ range. The latitudinal ampli-tude of the sampled populations ranged from 2� to 22�depending on the species and the longitudinal amplituderanged from 4� to 10�. Acorns were stored for a few days inmoist sand at 5�C before sowing. In November, acornswere sown directly in the experimental field.
Experimental setup
The seedlings were cultivated in an experimental field site inMontpellier, France (43�64¢N, 3�86¢E, 57 m above sea level(a.s.l.)) for 3 yr (2003–2005), in a 50-cm deep clay-loam soil
2 Research
NewPhytologist
� The Authors (2010)
Journal compilation � New Phytologist Trust (2010)
New Phytologist (2010)
www.newphytologist.com
and with a mean pH of 8. The experimental field was dividedinto 30 1.25 · 1.25 m plots grouped into five blocks. Ineach block, six plots received either ambient temperatureconditions or increased temperature treatment of +1.5�C or+3�C compared with ambient temperature, and either ambi-ent precipitation or reduced precipitation by 30% comparedwith ambient precipitation during spring and summer. Sixdifferent treatments (three temperature levels · two precipi-tation levels) were thus obtained. Treatments’ levels werechosen according to climate predictions for the FrenchMediterranean region for 2100 (IPCC, 2001). The experi-mental design was a factorial split plot on a randomizedcomplete block design. The treatments with a warming of+1.5�C and +3�C compared with ambient will be referred as‘T+’ and ‘T++’ respectively in the following text.
Elevated temperature treatments were achieved by twoinfrared heaters (80 cm, 800 W, Vulcanic; Paris, France)equipped with reflectors that were installed at 1 m heightlaterally at the eastern and western border of the plot toavoid shading. It has been rigorously shown that the infra-red heaters do not generate any visible light to influencephenology (Kimball, 2005). Moreover, such a design allowswarming of plots during night and day. At each plot airtemperature was monitored by infrared sensors (Raytek;Thermalert MID MIC, Berlin, Germany) at a height of1 m, which were protected within a plastic cap. As thesesensors were revealed to be poorly robust in outdoor condi-tions, supplementary thermocouples and PT100 sensorswere installed in two of the five repetitions, and periodicmeasurements with an infrared manual sensor (Raytek;Thermalert MID MIC, Berlin, Germany) were made.
The plots of the reduced water supply treatment wereequipped with an automatic, extensible shelter system com-posed of six plastic gutters. The shelter was activated by arain sensor 12V (Kemo, Langen, Germany) and reducedincoming rainwater by c. 30% during spring and summer.During the summer 2003, which was particularly hot anddry, all plots were occasionally watered with 15 l and 10 lof water for normal and reduced water supply treatments,respectively, in order to attenuate drought stress, but in
respect to summer precipitation norms usually recordedin Montpellier. Soil water content (volumetric watercontent in % of soil volume) of each plot was measuredby Time Domain Reflectrometry (Trase Model 6050X1,Soilmoisture; Santa Barbara, VA, USA) at 0–15 cm and0–30 cm depth. The waveguides (15 cm and 30 cm) werepermanently installed.
All instruments were piloted by Datascans V4.52E 1998,which were themselves piloted by a DasyLab 6.0 2001program (MeasXGmbH & Co. KG; Moenchengladbach,Germany) running on a delocalized computer.
Each plot was sown with a community of local annualand perennial herbaceous plant species and the threeQuercus species. Oak seedlings were thus cultivated in com-petition with the local herbaceous community. Each plotwas composed of a central plot of 0.75 m · 0.75 m withinwhich the individuals were recorded, surrounded by a bor-der of 0.25 m planted with individuals of the same species.Acorns were sown directly on the plots with a homogeneousdensity, each individual separated from its oak neighboursby 31.5 cm and from its herbaceous neighbours by10.5 cm, and each individual surrounded by one individualof each of the other species in order to have homogeneouscompetition conditions within each plot. The sowingdesign was identical on each plot, within which three indi-vidual acorns of each provenance of each oak species weresown, but only one individual was selected to be monitored.Thus, nine oak individuals were present on each centralplot, with the third Q. pubescens individual, not measured,being one individual of either the two provenances sampled.Thus, 240 seedlings were monitored during the experiment.
Measurements
The phenology of each individual was monitored for 3 yr.We recorded the date of first leaf unfolding (i.e. date whenthe first leaf of the terminal shoot was unfolded) and thedate of leaf colouring of the two deciduous species, Q. roburand Q. pubescens (i.e. the date when half of the leaves of theindividual had changed colour – turned from green to yel-low). We then obtained the length of the growing season bycalculating the difference between the date of leaf unfoldingand the date of leaf colouring for each individual (note thatthis was only possible for the two deciduous species).Survival was also monitored all along the experiment. Wealso recorded the total leaf area and the total specific leafarea (SLA) of the seedlings of the two deciduous species.Leaf area was measured on senescent leaves each year with aleaf area meter.
Statistical analyses
We tested for a differentiation among species, amongprovenances within species and among treatments of the
Table 1 Location of the populations sampled for each oak species
SpeciesPopulationnumber Site Country Location
Quercus
robur
1 Tartu Estonia 58.4�N; 26.7�E2 Ceske
BudejoviceCzechRepublic
48.6�N; 14.3�E
3 Lille France 50.6�N; 3.1�E.Quercus
pubescens
1 Menars France 47.4�N; 1.2�E2 Montpellier France 43.6�N; 3.9�E
Quercus
ilex
1 Montpellier France 43.6�N; 3.9�E2 Mitra Portugal 38.4�N; 8.5�W3 Oleron Island France 45.8�N; 1.3�W
NewPhytologist Research 3
� The Authors (2010)
Journal compilation � New Phytologist Trust (2010)
New Phytologist (2010)
www.newphytologist.com
different traits measured. We analysed the variance of leafunfolding and senescence dates, and length of the growingseason as well as the total leaf area and SLA with a linearmixed-effects model using the lme procedure of the R 2.42006 statistical software (Ihaka & Gentleman, 1996). Thephenological variables satisfied the homoscedasticityrequirement for the analysis. Both total leaf area and SLAwere log-transformed to satisfy the homoscedasticityrequirement. Because both temperature increase and pre-cipitation reduction affected soil water content, we usedthe annual mean soil water content at 30 cm depth ofeach plot as a covariable in the model instead of using theprecipitation reduction treatment as a fixed factor. Thischoice was made because the soil water content of theplots with reduced precipitation was significantly lowerthan that of the controls at 30 cm depth. The repetitionsand the plots nested within the repetitions were declaredas random effects. As soil depth varied linearly along therepetitions from 64 cm to 80 cm, a covariable ‘soil depth’was added into the model. The variable ‘year’ wasdeclared as a random effect in the model to take interan-nual variability into account. All other factors weredeclared as fixed factors. The normality of the residualswas checked by the use of Q–Q plots and the homogeneityof variances by a nonparametric Fligner’s test. We alsoperformed post hoc Tukey HSD tests to test pairwise com-parisons. For each dependent variable, the best model wasselected according to AIC (Aikaike’s Information Criterion)comparisons.
We also tested the effect of species, provenances withinspecies and treatments on the survival of the 240 individualsat the end of the experiment with a generalized linearmixed-model (lmer procedure in R 2.4 2006) with a bino-mial distribution of errors and a logit link function. Effectswere tested with v2 statistics, by comparing the ratio of theresidual log-likelihood of the model to a v2 statistic with anumber of degrees of freedom corresponding to the differ-ence of parameters between models. The best model wasselected according to AIC comparisons.
Results
Effect of treatments on plots temperature and soilwater content
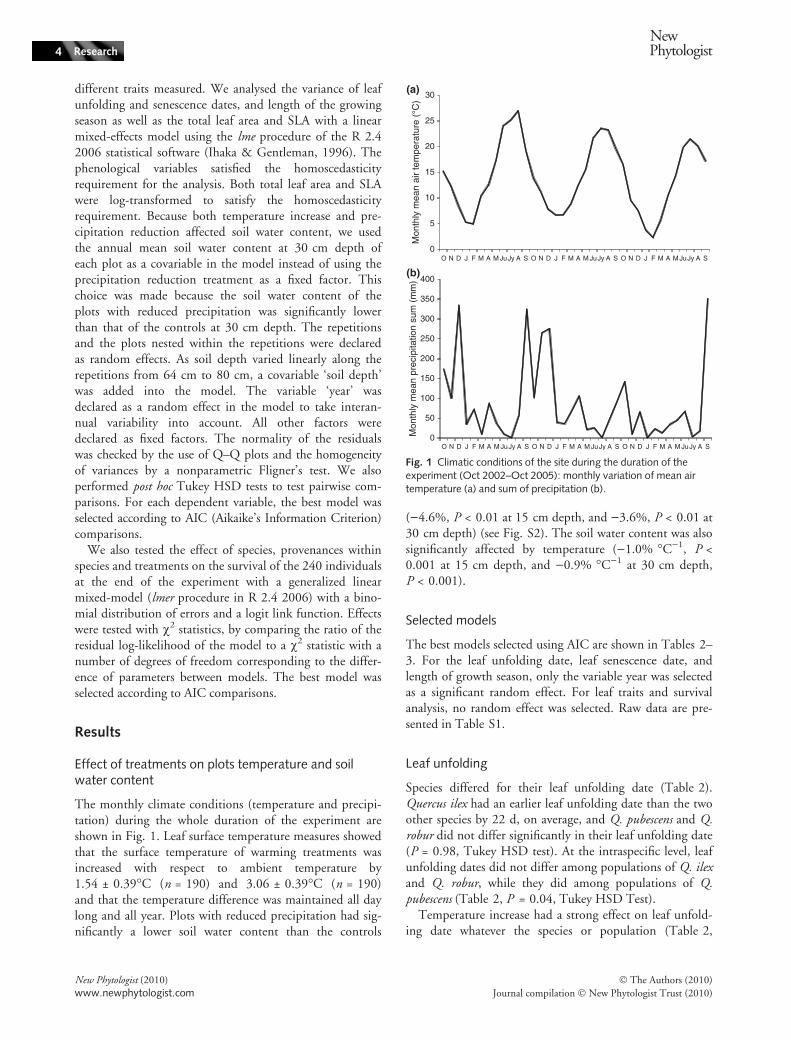
The monthly climate conditions (temperature and precipi-tation) during the whole duration of the experiment areshown in Fig. 1. Leaf surface temperature measures showedthat the surface temperature of warming treatments wasincreased with respect to ambient temperature by1.54 ± 0.39�C (n = 190) and 3.06 ± 0.39�C (n = 190)and that the temperature difference was maintained all daylong and all year. Plots with reduced precipitation had sig-nificantly a lower soil water content than the controls
()4.6%, P < 0.01 at 15 cm depth, and )3.6%, P < 0.01 at30 cm depth) (see Fig. S2). The soil water content was alsosignificantly affected by temperature ()1.0% �C)1, P <0.001 at 15 cm depth, and )0.9% �C)1 at 30 cm depth,P < 0.001).
Selected models
The best models selected using AIC are shown in Tables 2–3. For the leaf unfolding date, leaf senescence date, andlength of growth season, only the variable year was selectedas a significant random effect. For leaf traits and survivalanalysis, no random effect was selected. Raw data are pre-sented in Table S1.
Leaf unfolding
Species differed for their leaf unfolding date (Table 2).Quercus ilex had an earlier leaf unfolding date than the twoother species by 22 d, on average, and Q. pubescens and Q.robur did not differ significantly in their leaf unfolding date(P = 0.98, Tukey HSD test). At the intraspecific level, leafunfolding dates did not differ among populations of Q. ilexand Q. robur, while they did among populations of Q.pubescens (Table 2, P = 0.04, Tukey HSD Test).
Temperature increase had a strong effect on leaf unfold-ing date whatever the species or population (Table 2,
0
5
10
15
20
25
30
O N D J F M A M JuJy A S O N D J F M A M JuJy A S O N D J F M A M JuJy A S
Mon
thly
mea
n ai
r te
mpe
ratu
re (
°C)
0
50
100
150
200
250
300
350
400
O N D J F M A M JuJy A S O N D J F M A M JuJy A S O N D J F M A M JuJy A S
Mon
thly
mea
n pr
ecip
itatio
n su
m (
mm
)
(a)
(b)
Fig. 1 Climatic conditions of the site during the duration of theexperiment (Oct 2002–Oct 2005): monthly variation of mean airtemperature (a) and sum of precipitation (b).
4 Research
NewPhytologist
� The Authors (2010)
Journal compilation � New Phytologist Trust (2010)
New Phytologist (2010)
www.newphytologist.com
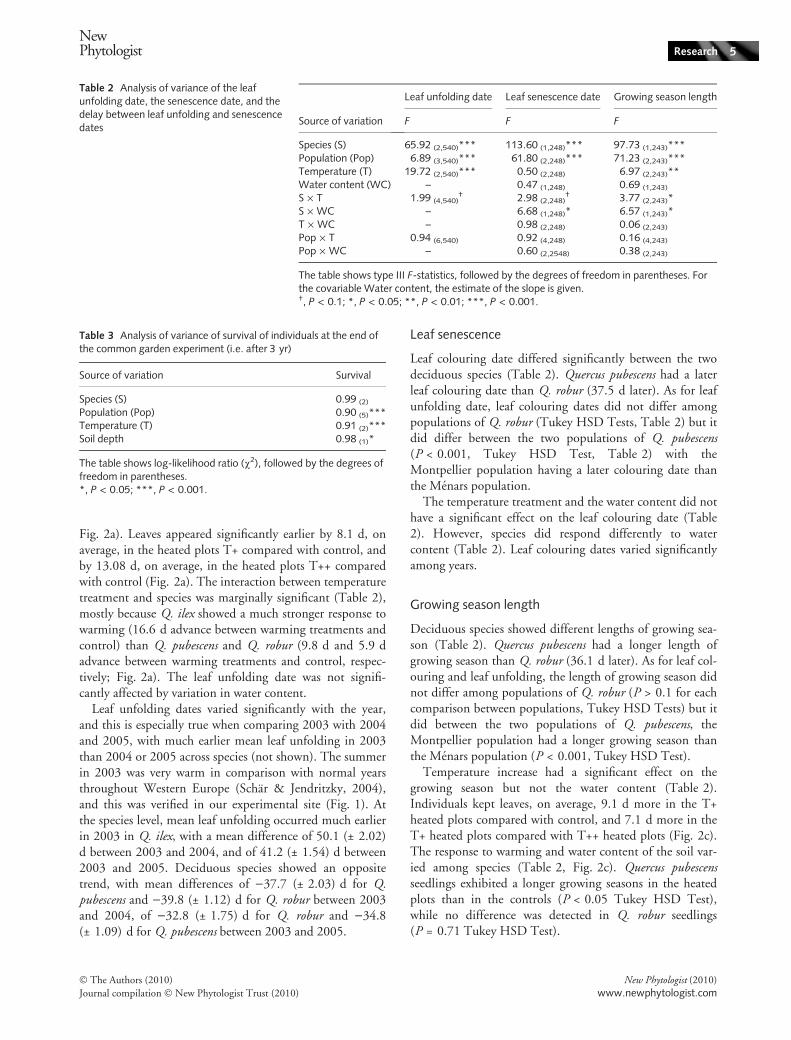
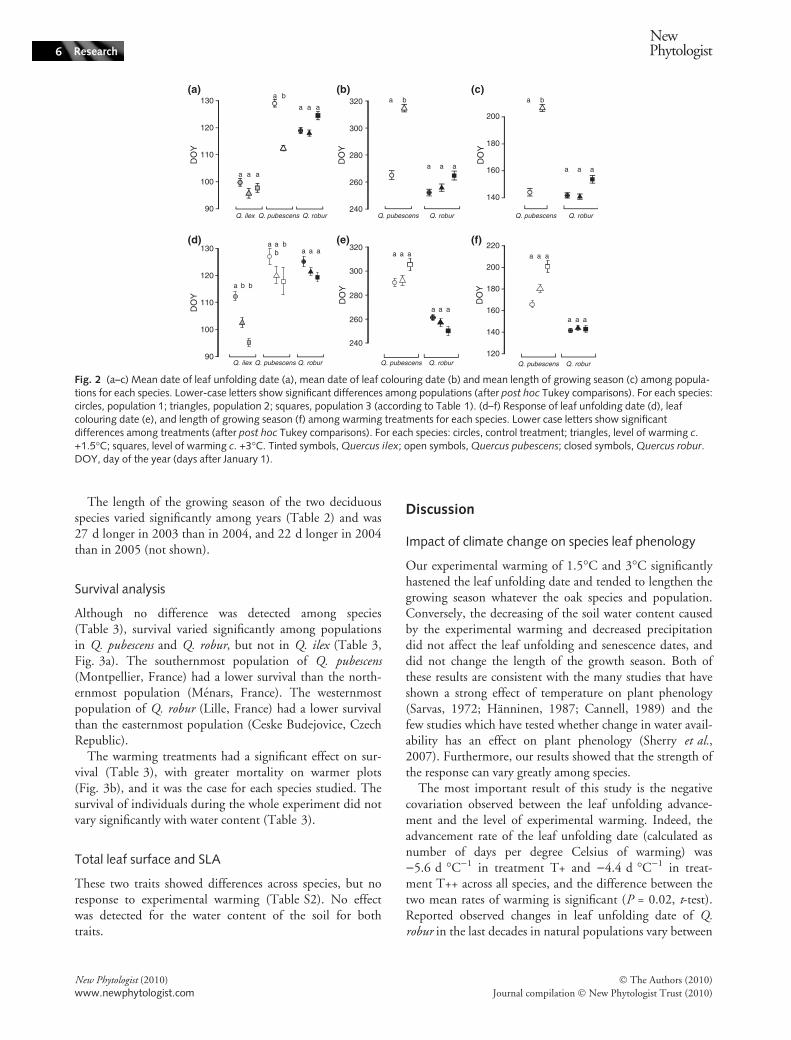
Fig. 2a). Leaves appeared significantly earlier by 8.1 d, onaverage, in the heated plots T+ compared with control, andby 13.08 d, on average, in the heated plots T++ comparedwith control (Fig. 2a). The interaction between temperaturetreatment and species was marginally significant (Table 2),mostly because Q. ilex showed a much stronger response towarming (16.6 d advance between warming treatments andcontrol) than Q. pubescens and Q. robur (9.8 d and 5.9 dadvance between warming treatments and control, respec-tively; Fig. 2a). The leaf unfolding date was not signifi-cantly affected by variation in water content.
Leaf unfolding dates varied significantly with the year,and this is especially true when comparing 2003 with 2004and 2005, with much earlier mean leaf unfolding in 2003than 2004 or 2005 across species (not shown). The summerin 2003 was very warm in comparison with normal yearsthroughout Western Europe (Schar & Jendritzky, 2004),and this was verified in our experimental site (Fig. 1). Atthe species level, mean leaf unfolding occurred much earlierin 2003 in Q. ilex, with a mean difference of 50.1 (± 2.02)d between 2003 and 2004, and of 41.2 (± 1.54) d between2003 and 2005. Deciduous species showed an oppositetrend, with mean differences of )37.7 (± 2.03) d for Q.pubescens and )39.8 (± 1.12) d for Q. robur between 2003and 2004, of )32.8 (± 1.75) d for Q. robur and )34.8(± 1.09) d for Q. pubescens between 2003 and 2005.
Leaf senescence
Leaf colouring date differed significantly between the twodeciduous species (Table 2). Quercus pubescens had a laterleaf colouring date than Q. robur (37.5 d later). As for leafunfolding date, leaf colouring dates did not differ amongpopulations of Q. robur (Tukey HSD Tests, Table 2) but itdid differ between the two populations of Q. pubescens(P < 0.001, Tukey HSD Test, Table 2) with theMontpellier population having a later colouring date thanthe Menars population.
The temperature treatment and the water content did nothave a significant effect on the leaf colouring date (Table2). However, species did respond differently to watercontent (Table 2). Leaf colouring dates varied significantlyamong years.
Growing season length
Deciduous species showed different lengths of growing sea-son (Table 2). Quercus pubescens had a longer length ofgrowing season than Q. robur (36.1 d later). As for leaf col-ouring and leaf unfolding, the length of growing season didnot differ among populations of Q. robur (P > 0.1 for eachcomparison between populations, Tukey HSD Tests) but itdid between the two populations of Q. pubescens, theMontpellier population had a longer growing season thanthe Menars population (P < 0.001, Tukey HSD Test).
Temperature increase had a significant effect on thegrowing season but not the water content (Table 2).Individuals kept leaves, on average, 9.1 d more in the T+heated plots compared with control, and 7.1 d more in theT+ heated plots compared with T++ heated plots (Fig. 2c).The response to warming and water content of the soil var-ied among species (Table 2, Fig. 2c). Quercus pubescensseedlings exhibited a longer growing seasons in the heatedplots than in the controls (P < 0.05 Tukey HSD Test),while no difference was detected in Q. robur seedlings(P = 0.71 Tukey HSD Test).
Table 2 Analysis of variance of the leafunfolding date, the senescence date, and thedelay between leaf unfolding and senescencedates
Source of variation
Leaf unfolding date Leaf senescence date Growing season length
F F F
Species (S) 65.92 (2,540)*** 113.60 (1,248)*** 97.73 (1,243)***Population (Pop) 6.89 (3,540)*** 61.80 (2,248)*** 71.23 (2,243)***Temperature (T) 19.72 (2,540)*** 0.50 (2,248) 6.97 (2,243)**Water content (WC) – 0.47 (1,248) 0.69 (1,243)
S · T 1.99 (4,540)† 2.98 (2,248)
† 3.77 (2,243)*S · WC – 6.68 (1,248)* 6.57 (1,243)*T · WC – 0.98 (2,248) 0.06 (2,243)
Pop · T 0.94 (6,540) 0.92 (4,248) 0.16 (4,243)
Pop · WC – 0.60 (2,2548) 0.38 (2,243)
The table shows type III F-statistics, followed by the degrees of freedom in parentheses. Forthe covariable Water content, the estimate of the slope is given.†, P < 0.1; *, P < 0.05; **, P < 0.01; ***, P < 0.001.
Table 3 Analysis of variance of survival of individuals at the end ofthe common garden experiment (i.e. after 3 yr)
Source of variation Survival
Species (S) 0.99 (2)
Population (Pop) 0.90 (5)***Temperature (T) 0.91 (2)***Soil depth 0.98 (1)*
The table shows log-likelihood ratio (v2), followed by the degrees offreedom in parentheses.*, P < 0.05; ***, P < 0.001.
NewPhytologist Research 5
� The Authors (2010)
Journal compilation � New Phytologist Trust (2010)
New Phytologist (2010)
www.newphytologist.com
The length of the growing season of the two deciduousspecies varied significantly among years (Table 2) and was27 d longer in 2003 than in 2004, and 22 d longer in 2004than in 2005 (not shown).
Survival analysis
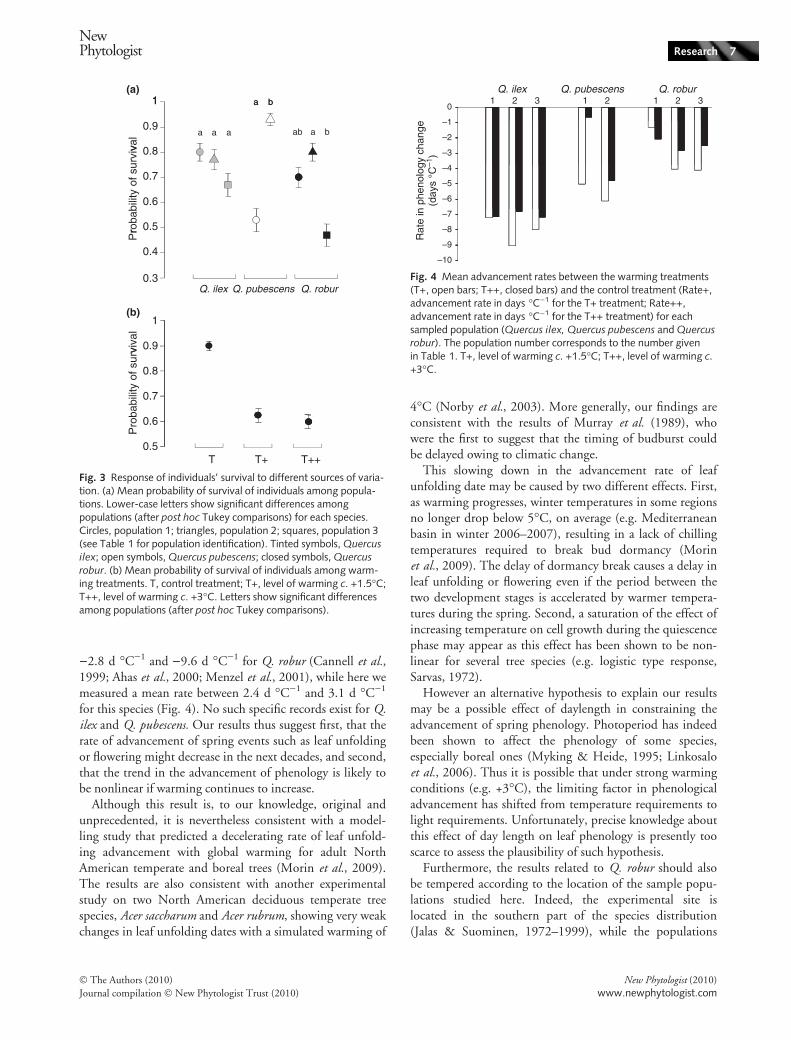
Although no difference was detected among species(Table 3), survival varied significantly among populationsin Q. pubescens and Q. robur, but not in Q. ilex (Table 3,Fig. 3a). The southernmost population of Q. pubescens(Montpellier, France) had a lower survival than the north-ernmost population (Menars, France). The westernmostpopulation of Q. robur (Lille, France) had a lower survivalthan the easternmost population (Ceske Budejovice, CzechRepublic).
The warming treatments had a significant effect on sur-vival (Table 3), with greater mortality on warmer plots(Fig. 3b), and it was the case for each species studied. Thesurvival of individuals during the whole experiment did notvary significantly with water content (Table 3).
Total leaf surface and SLA
These two traits showed differences across species, but noresponse to experimental warming (Table S2). No effectwas detected for the water content of the soil for bothtraits.
Discussion
Impact of climate change on species leaf phenology
Our experimental warming of 1.5�C and 3�C significantlyhastened the leaf unfolding date and tended to lengthen thegrowing season whatever the oak species and population.Conversely, the decreasing of the soil water content causedby the experimental warming and decreased precipitationdid not affect the leaf unfolding and senescence dates, anddid not change the length of the growth season. Both ofthese results are consistent with the many studies that haveshown a strong effect of temperature on plant phenology(Sarvas, 1972; Hanninen, 1987; Cannell, 1989) and thefew studies which have tested whether change in water avail-ability has an effect on plant phenology (Sherry et al.,2007). Furthermore, our results showed that the strength ofthe response can vary greatly among species.
The most important result of this study is the negativecovariation observed between the leaf unfolding advance-ment and the level of experimental warming. Indeed, theadvancement rate of the leaf unfolding date (calculated asnumber of days per degree Celsius of warming) was)5.6 d �C)1 in treatment T+ and )4.4 d �C)1 in treat-ment T++ across all species, and the difference between thetwo mean rates of warming is significant (P = 0.02, t-test).Reported observed changes in leaf unfolding date of Q.robur in the last decades in natural populations vary between
120
130a a a
a b
300
320 a b
180
200
a b
100
110
a a a260
280a a a
140
160 a a a
DO
Y
DO
Y
DO
Y
Q. ilex Q. pubescens Q. robur Q. pubescens Q. robur Q. pubescens Q. robur
Q. pubescens Q. robur Q. pubescens Q. roburQ. ilex Q. pubescens Q. robur
90 240
a a aa a
bb
130a a a
320
200
220a a a
a b b
110
120
a a a
260
280
300
160
180
a a a
DO
Y
DO
Y
DO
Y
90
100
240120
140
(d)
(a)
(e)
(b)
(f)
(c)
Fig. 2 (a–c) Mean date of leaf unfolding date (a), mean date of leaf colouring date (b) and mean length of growing season (c) among popula-tions for each species. Lower-case letters show significant differences among populations (after post hoc Tukey comparisons). For each species:circles, population 1; triangles, population 2; squares, population 3 (according to Table 1). (d–f) Response of leaf unfolding date (d), leafcolouring date (e), and length of growing season (f) among warming treatments for each species. Lower case letters show significantdifferences among treatments (after post hoc Tukey comparisons). For each species: circles, control treatment; triangles, level of warming c.+1.5�C; squares, level of warming c. +3�C. Tinted symbols, Quercus ilex; open symbols, Quercus pubescens; closed symbols, Quercus robur.DOY, day of the year (days after January 1).
6 Research
NewPhytologist
� The Authors (2010)
Journal compilation � New Phytologist Trust (2010)
New Phytologist (2010)
www.newphytologist.com
)2.8 d �C)1 and )9.6 d �C)1 for Q. robur (Cannell et al.,1999; Ahas et al., 2000; Menzel et al., 2001), while here wemeasured a mean rate between 2.4 d �C)1 and 3.1 d �C)1
for this species (Fig. 4). No such specific records exist for Q.ilex and Q. pubescens. Our results thus suggest first, that therate of advancement of spring events such as leaf unfoldingor flowering might decrease in the next decades, and second,that the trend in the advancement of phenology is likely tobe nonlinear if warming continues to increase.
Although this result is, to our knowledge, original andunprecedented, it is nevertheless consistent with a model-ling study that predicted a decelerating rate of leaf unfold-ing advancement with global warming for adult NorthAmerican temperate and boreal trees (Morin et al., 2009).The results are also consistent with another experimentalstudy on two North American deciduous temperate treespecies, Acer saccharum and Acer rubrum, showing very weakchanges in leaf unfolding dates with a simulated warming of
4�C (Norby et al., 2003). More generally, our findings areconsistent with the results of Murray et al. (1989), whowere the first to suggest that the timing of budburst couldbe delayed owing to climatic change.
This slowing down in the advancement rate of leafunfolding date may be caused by two different effects. First,as warming progresses, winter temperatures in some regionsno longer drop below 5�C, on average (e.g. Mediterraneanbasin in winter 2006–2007), resulting in a lack of chillingtemperatures required to break bud dormancy (Morinet al., 2009). The delay of dormancy break causes a delay inleaf unfolding or flowering even if the period between thetwo development stages is accelerated by warmer tempera-tures during the spring. Second, a saturation of the effect ofincreasing temperature on cell growth during the quiescencephase may appear as this effect has been shown to be non-linear for several tree species (e.g. logistic type response,Sarvas, 1972).
However an alternative hypothesis to explain our resultsmay be a possible effect of daylength in constraining theadvancement of spring phenology. Photoperiod has indeedbeen shown to affect the phenology of some species,especially boreal ones (Myking & Heide, 1995; Linkosaloet al., 2006). Thus it is possible that under strong warmingconditions (e.g. +3�C), the limiting factor in phenologicaladvancement has shifted from temperature requirements tolight requirements. Unfortunately, precise knowledge aboutthis effect of day length on leaf phenology is presently tooscarce to assess the plausibility of such hypothesis.
Furthermore, the results related to Q. robur should alsobe tempered according to the location of the sample popu-lations studied here. Indeed, the experimental site islocated in the southern part of the species distribution(Jalas & Suominen, 1972–1999), while the populations
1 a b
0.9
1
val a a a ab a b
a b
0.7
0.8
of s
urvi
v
0.5
0.6
roba
bilit
y
0.4
0.3
Pr
Q. ilex Q. pubescens Q. robur
0.9
1
viva
l
0.8
ty o
f sur
v
0.6
0.7
roba
bili
T0.5
T+ T++
P
(a)
(b)
Fig. 3 Response of individuals’ survival to different sources of varia-tion. (a) Mean probability of survival of individuals among popula-tions. Lower-case letters show significant differences amongpopulations (after post hoc Tukey comparisons) for each species.Circles, population 1; triangles, population 2; squares, population 3(see Table 1 for population identification). Tinted symbols, Quercusilex; open symbols, Quercus pubescens; closed symbols, Quercus
robur. (b) Mean probability of survival of individuals among warm-ing treatments. T, control treatment; T+, level of warming c. +1.5�C;T++, level of warming c. +3�C. Letters show significant differencesamong populations (after post hoc Tukey comparisons).
–1
0
Q. ilex Q. pubescens Q. robur321321 1 2
–3
–2
–6
–5
–4
–9
–8
–7
Rat
e in
phe
nolo
gy c
hang
e(d
ays
°C–1
)
–10
Fig. 4 Mean advancement rates between the warming treatments(T+, open bars; T++, closed bars) and the control treatment (Rate+,advancement rate in days �C)1 for the T+ treatment; Rate++,advancement rate in days �C)1 for the T++ treatment) for eachsampled population (Quercus ilex, Quercus pubescens and Quercusrobur). The population number corresponds to the number givenin Table 1. T+, level of warming c. +1.5�C; T++, level of warming c.+3�C.
NewPhytologist Research 7
� The Authors (2010)
Journal compilation � New Phytologist Trust (2010)
New Phytologist (2010)
www.newphytologist.com
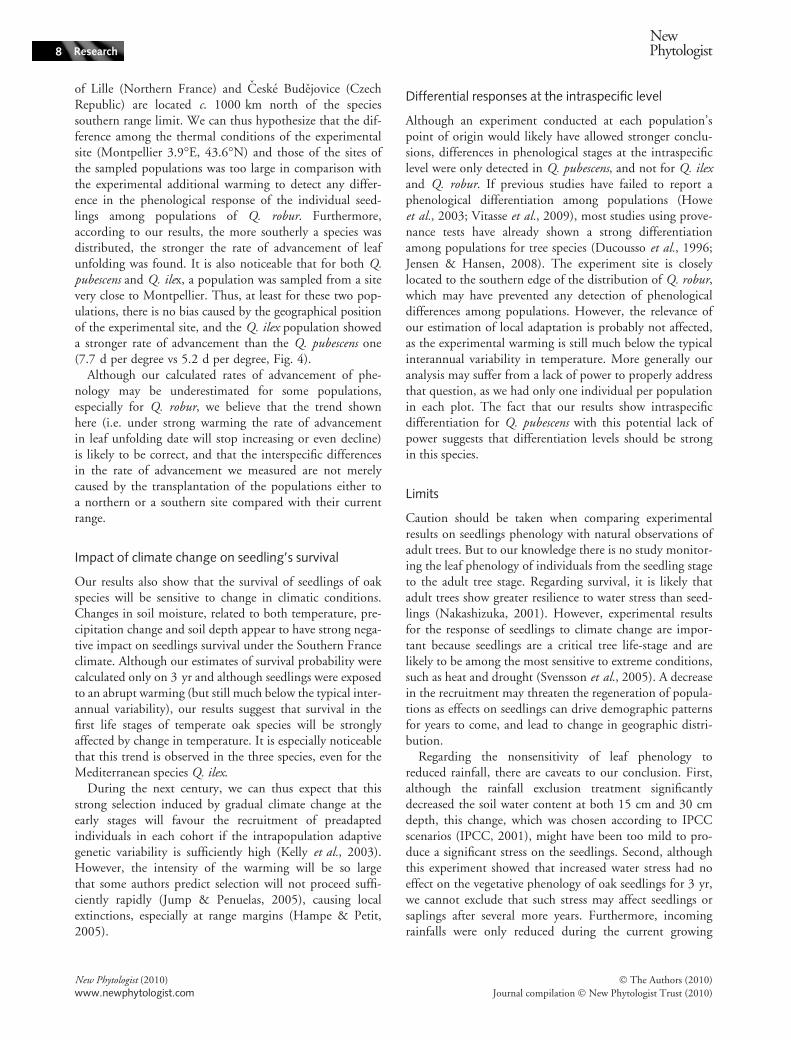
of Lille (Northern France) and Ceske Budejovice (CzechRepublic) are located c. 1000 km north of the speciessouthern range limit. We can thus hypothesize that the dif-ference among the thermal conditions of the experimentalsite (Montpellier 3.9�E, 43.6�N) and those of the sites ofthe sampled populations was too large in comparison withthe experimental additional warming to detect any differ-ence in the phenological response of the individual seed-lings among populations of Q. robur. Furthermore,according to our results, the more southerly a species wasdistributed, the stronger the rate of advancement of leafunfolding was found. It is also noticeable that for both Q.pubescens and Q. ilex, a population was sampled from a sitevery close to Montpellier. Thus, at least for these two pop-ulations, there is no bias caused by the geographical positionof the experimental site, and the Q. ilex population showeda stronger rate of advancement than the Q. pubescens one(7.7 d per degree vs 5.2 d per degree, Fig. 4).
Although our calculated rates of advancement of phe-nology may be underestimated for some populations,especially for Q. robur, we believe that the trend shownhere (i.e. under strong warming the rate of advancementin leaf unfolding date will stop increasing or even decline)is likely to be correct, and that the interspecific differencesin the rate of advancement we measured are not merelycaused by the transplantation of the populations either toa northern or a southern site compared with their currentrange.
Impact of climate change on seedling’s survival
Our results also show that the survival of seedlings of oakspecies will be sensitive to change in climatic conditions.Changes in soil moisture, related to both temperature, pre-cipitation change and soil depth appear to have strong nega-tive impact on seedlings survival under the Southern Franceclimate. Although our estimates of survival probability werecalculated only on 3 yr and although seedlings were exposedto an abrupt warming (but still much below the typical inter-annual variability), our results suggest that survival in thefirst life stages of temperate oak species will be stronglyaffected by change in temperature. It is especially noticeablethat this trend is observed in the three species, even for theMediterranean species Q. ilex.
During the next century, we can thus expect that thisstrong selection induced by gradual climate change at theearly stages will favour the recruitment of preadaptedindividuals in each cohort if the intrapopulation adaptivegenetic variability is sufficiently high (Kelly et al., 2003).However, the intensity of the warming will be so largethat some authors predict selection will not proceed suffi-ciently rapidly (Jump & Penuelas, 2005), causing localextinctions, especially at range margins (Hampe & Petit,2005).
Differential responses at the intraspecific level
Although an experiment conducted at each population’spoint of origin would likely have allowed stronger conclu-sions, differences in phenological stages at the intraspecificlevel were only detected in Q. pubescens, and not for Q. ilexand Q. robur. If previous studies have failed to report aphenological differentiation among populations (Howeet al., 2003; Vitasse et al., 2009), most studies using prove-nance tests have already shown a strong differentiationamong populations for tree species (Ducousso et al., 1996;Jensen & Hansen, 2008). The experiment site is closelylocated to the southern edge of the distribution of Q. robur,which may have prevented any detection of phenologicaldifferences among populations. However, the relevance ofour estimation of local adaptation is probably not affected,as the experimental warming is still much below the typicalinterannual variability in temperature. More generally ouranalysis may suffer from a lack of power to properly addressthat question, as we had only one individual per populationin each plot. The fact that our results show intraspecificdifferentiation for Q. pubescens with this potential lack ofpower suggests that differentiation levels should be strongin this species.
Limits
Caution should be taken when comparing experimentalresults on seedlings phenology with natural observations ofadult trees. But to our knowledge there is no study monitor-ing the leaf phenology of individuals from the seedling stageto the adult tree stage. Regarding survival, it is likely thatadult trees show greater resilience to water stress than seed-lings (Nakashizuka, 2001). However, experimental resultsfor the response of seedlings to climate change are impor-tant because seedlings are a critical tree life-stage and arelikely to be among the most sensitive to extreme conditions,such as heat and drought (Svensson et al., 2005). A decreasein the recruitment may threaten the regeneration of popula-tions as effects on seedlings can drive demographic patternsfor years to come, and lead to change in geographic distri-bution.
Regarding the nonsensitivity of leaf phenology toreduced rainfall, there are caveats to our conclusion. First,although the rainfall exclusion treatment significantlydecreased the soil water content at both 15 cm and 30 cmdepth, this change, which was chosen according to IPCCscenarios (IPCC, 2001), might have been too mild to pro-duce a significant stress on the seedlings. Second, althoughthis experiment showed that increased water stress had noeffect on the vegetative phenology of oak seedlings for 3 yr,we cannot exclude that such stress may affect seedlings orsaplings after several more years. Furthermore, incomingrainfalls were only reduced during the current growing
8 Research
NewPhytologist
� The Authors (2010)
Journal compilation � New Phytologist Trust (2010)
New Phytologist (2010)
www.newphytologist.com
season in this experiment following IPCC’s scenarios forthe Mediterranean Basin (IPCC, 2001). Increased droughtduring the previous winter may induce a downward changein phenological stages the following year, through after-effects.
Consequences of our findings
Using experimental results, we showed here that futurewarming should continue to advance tree species leafunfolding as it is currently observed in natural populations(Menzel, 2000; Parmesan & Yohe, 2003; Root et al., 2003;Menzel et al., 2006), but our results also suggest that thephenological response of species to increasing temperatureshould be nonlinear, and can vary strongly across species.Our results are for seedlings, which necessarily restricts theextrapolation of this experimental work to other tree life-stages. However, the fact that tree species respond differ-ently can affect the competitive relationships between spe-cies in the long term (Post et al., 2001). For example,numerous ecophysiological studies show that sessile oak (Q.petraea) is more drought-resistant than common oak. Thus,in the context of global warming, many researchers estimatethat sessile oaks should be relatively less affected than com-mon oaks. Differential change in species phenology maythus affect the composition of forest communities and thegeographical ranges of species (Morin et al., 2008). Moregenerally, these findings highlight the necessity to monitorand follow several species to better assess the effect of cli-mate change on phenology, and suggest that predictions ofphenological changes in the future should not be built onextrapolations of current observed trends.
Acknowledgements
We are very grateful to Amelie Bonnerat, Marie Guillot,Noppol Kobmoo, Damien Landais and Chloe Monta forfield assistance. We thank Claude Dauge for collectingacorns of the Charente-Maritime population. We are alsograteful to three anonymous referees for constructivecomments that greatly improved this manuscript. Thisproject was funded by the GICC Program of the Ministerefrancais de l’Ecologie et du Developpement Durable.Support was provided to XM by a Bourse de DocteurIngenieur du Centre National de la Recherche Scientifiqueand by a Marie-Curie Outgoing International Fellowship(European Commission’s FP6, PHENO-RANGE-EDGEproject, No. 39473).
References
Ahas R, Aasa A, Menzel A, Fedotova VG, Scheifinger H. 2002. Changes
in European spring phenology. International Journal of Climatology 22:
1727–1738.
Ahas R, Jaagus J, Aasa A. 2000. The phenological calendar of Estonia and
its correlation with mean air temperature. International Journal ofBiometeorology 44: 159–166.
Ainsworth EA, Long SP. 2005. What have we learned from 15 years of
free-air CO2 enrichment (face)? A meta-analytic review of the responses
of photosynthesis, canopy. New Phytologist 165: 351–371.
Arft AM, Walker MD, Gurevitch J, Alatalo JM, Bret-Harte MS, Dale M,
Diemer M, Gugerli F, Henry GHR, Jones MH et al. 1999. Responses
of tundra plants to experimental warming: meta-analysis of the
international tundra experiment. Ecological Monographs 69: 491–511.
Asshoff R, Zotz G, Korner C. 2006. Growth and phenology of mature
temperate forest trees in elevated CO2. Global Change Biology 12: 848–
861.
Betts RA, Cox PM, Lee SE, Woodward FI. 1997. Contrasting
physiological and structural vegetation feedbacks in climate change
simulations. Nature 387: 796–799.
Beuker E. 1994. Adaptation to climatic changes of the timing of bud burst
in populations of Pinus sylvestris (L.) and Picea abies (L.) karst. TreePhysiology 14: 961–970.
Cannell MGR. 1989. Chilling, thermal time and the dates of flowering of
trees. In: Wright CJ, ed. Manipulation of fruiting. London, UK:
Butterworth & Co, 99–113.
Cannell MGR, Palutikof JP, Sparks T. 1999. Indicators of climate changein the UK. London, UK: DETR.
Cattadori IM, Haydon DT, Hudson PJ. 2005. Parasites and climate
synchronize red grouse populations. Nature 433: 737–741.
Chapin FS III, Matson PA, Mooney HA. 2002. Principles of terrestrialecosystem ecology. New York, NY, USA: Springer.
Doi H, Takahashi M, Katano I. 2010. Genetic diversity increases regional
variation in phenological dates in response to climate change. GlobalChange Biology 16: 373–379.
Ducousso A, Guyon J, Kremer A. 1996. Latitudinal and altitudinal
variation of bud burst in western populations of sessile oak (Quercuspetraea (matt) liebl). Annals of Forest Science 53: 775–782.
Edwards M, Richardson AJ. 2004. Impact of climate change on marine
pelagic phenology and trophic mismatch. Nature 430: 881–884.
Franks SJ, Sim S, Weis AE. 2007. Rapid evolution of flowering time by an
annual plant in response to a climate fluctuation. Proceedings of theNational Academy of Sciences, USA 104: 1278–1282.
Gordo O, Sanz JJ. 2005. Phenology and climate change: a long-term study
in a Mediterranean locality. Oecologia 146: 484–495.
Guak S, Olsyzk DM, Fuchigami LH, Tingey DT. 1998. Effects of
elevated CO2 and temperature on cold hardiness and spring bud burst
and growth in Douglas-fir (Pseudotsuga menziessi). Tree Physiology 18:
671–679.
Hampe A, Petit RJ. 2005. Conserving biodiversity under climate change:
the rear edge matters. Ecology Letters 8: 461–467.
Hanninen H. 1987. Effects of temperature on dormancy release in
woody plants: implications of prevailing models. Silva Fennica 21:
279–299.
Hollister RD, Webber PJ, Bay C. 2005. Plant response to temperature in
northern Alaska: implications for predicting vegetation change. Ecology86: 1562–1570.
Howe GT, Aitken SN, Neale DB, Jermstad KD, Wheeler NC, Chen
THH. 2003. From genotype to phenotype: unraveling the complexities
of cold adaptation in forest trees. Canadian Journal of Botany 81: 1247–
1266.
Ihaka R, Gentleman R. 1996. R: a language for data analysis and graphics.
Journal of Computational and Graphical Statistics 5: 299–314.
IPCC. 2001. Climate change 2001: impacts, adaptation and vulnerability.Contribution of the working group II to the third assessment report of IPCC.
Cambridge, UK ⁄ New York, USA: Cambridge University Press.
IPCC. 2007. Climate change 2007: the physical science basis. Contribution ofworking group I to the fourth assessment report of the intergovernmental
NewPhytologist Research 9
� The Authors (2010)
Journal compilation � New Phytologist Trust (2010)
New Phytologist (2010)
www.newphytologist.com
panel on climate change. Cambridge, UK ⁄ New York, USA: Cambridge
University Press.
Jalas J, Suominen J. 1972–1999. Atlas florae europaeae. Distribution ofvascular plants in Europe. Vols 1–12. Helsinki, Finland: The
Committee for Mapping the Flora of Europe & Societas Biologica
Fennica Vanamo.
Jensen JS, Hansen JK. 2008. Geographical variation in phenology
of Quercus petraea (matt.) Liebl and Quercus robur L. Oak grown
in a greenhouse. Scandinavian Journal of Forest Research 23: 179–
188.
Jones MH, Bay C, Nordenhall U. 1997. Effects of experimental warming
on arctic willows (Salix spp.): a comparison of responses from the
Canadian High Arctic, Alaskan Arctic, and Swedish Subarctic. GlobalChange Biology 3: 55–60.
Jump AS, Penuelas J. 2005. Running to stand still: adaptation and the
response of plants to rapid climate change. Ecology Letters 8: 1010–1020.
Keeling CD, Chin JFS, Whorf TP. 1996. Increased activity of northern
vegetation inferred from atmospheric CO2 measurements. Nature 382:
146–149.
Kelly CK, Chase MW, de Bruijn A, Fay MF, Woodward FI. 2003.
Temperature-based population segregation in birch. Ecology Letters 6:
87–89.
Kennedy AD. 1995a. Simulated climate-change – are passive greenhouses
a valid microcosm for testing the biological effects of environmental
perturbations. Global Change Biology 1: 29–42.
Kennedy AD. 1995b. Temperature effects of passive greenhouse
apparatus in high-latitude change experiments. Functional Ecology 9:
340–350.
Kilpelainen A, Peltola H, Rouvinen I, Kellomaki S. 2006. Dynamics of
daily height growth in Scots pine trees at elevated temperature and CO2.
Trees – Structure and Function 20: 16–27.
Kimball BA. 2005. Theory and performance of an infrared heater for
ecosystem warming. Global Change Biology 11: 2041–2056.
Korner C, Asshoff R, Bignucolo O, Hattenschwiler S, Keel SG, Pelaez-
Riedl S, Pepin S, Siegwolf RTW, Zotz G. 2005. Carbon flux and
growth in mature deciduous forest trees exposed to elevated CO2.
Science 309: 1360–1362.
Linkosalo T, Hakkinen R, Hanninen H. 2006. Models of the spring
phenology of boreal and temperate trees: is there something missing?
Tree Physiology 26: 1165–1172.
Loveys BR, Egerton JJG, Ball MC. 2005. Higher daytime leaf
temperatures contribute to lower freeze tolerance under elevated CO2.
Plant, Cell & Environment 29: 1077–1086.
Marion GM, Henry GHR, Freckman DW, Johnstone J, Jones G, Jones
MH, Levesque E, Molau U, Molgaard P, Parsons AN et al. 1997.
Open-top designs for manipulating field temperature in high-latitude
ecosystems. Global Change Biology 3: 20–32.
Menzel A. 2000. Trends in phenological phases in Europe between 1951
and 1996. International Journal of Biometeorology 44: 76–81.
Menzel A, Estrella N, Fabian P. 2001. Spatial and temporal variability of
the phenological seasons in Germany from 1951 to 1996. Global ChangeBiology 7: 657–666.
Menzel A, Fabian P. 1999. Growing season extended in Europe. Nature397: 659.
Menzel A, Sparks TH, Estrella N, Koch E, Aasa A, Aha R, Alm-Kubler K,
Bissolli P, Braslavska O, Briede A et al. 2006. European phenological
response to climate change matches the warming pattern. Global ChangeBiology 12: 1969–1976.
Morin X, Lechowicz MJ, Augspurger C, O’Keefe J, Viner D, Chuine I.
2009. Leaf phenology changes in 22 North American tree species during
the 21st century. Global Change Biology 15: 961–975.
Morin X, Viner D, Chuine I. 2008. Tree species range shifts at a
continental scale: new predictive insights from a process-based model.
Journal of Ecology 96: 784–794.
Murray MB, Cannell MGR, Smith RI. 1989. Date of budburst of fifteen
tree species in Britain following climatic warming. Journal of AppliedEcology 26: 693–700.
Myking T, Heide OM. 1995. Dormancy release and chilling requirements
of buds of latitudinal ecotypes of Betula pendula and B. pubescens. TreePhysiology 15: 697–704.
Myneni RB, Keeling CD, Tucker CJ, Asrar G, Nemani RR. 1997.
Increasing plant growth in the northern high latitudes from 1981 to
1991. Nature 386: 698–702.
Nakashizuka T. 2001. Species coexistence in temperate, mixed deciduous
forests. Trends in Ecology & Evolution 16: 205–210.
de Noblet N. 2000. Mid-holocene greening of the Sahara: first results
of the Gaim 6000 year BP experiment with two asynchronously
coupled atmosphere ⁄ biome models. Climate Dynamics 16: 643–
659.
Norby RJ, Hartz-Rubin JS, Verbrugge MJ. 2003. Phenological responses
in maple to experimental atmospheric warming and CO2 enrichment.
Global Change Biology 9: 1792–1801.
Parmesan C, Yohe G. 2003. A globally coherent fingerprint of climate
change impacts across natural systems. Nature 421: 37–42.
Penuelas J, Filella I, Comas P. 2002. Changed plant and animal life cycles
from 1952 to 2000 in the Mediterranean region. Global Change Biology8: 531–544.
Post E, Forchhammer MC, Stenseth NC, Callaghan TV. 2001. The
timing of life history events in a changing climate. Proceedings of theRoyal Society of London B 268: 15–23.
Price MV, Waser NM. 1998. Effects of experimental warming on
plant reproductive phenology in a subalpine meadow. Ecology 79:
1261–1271.
Prieto P, Penuelas J, Niinemets U, Ogaya R, Schmidt I, Beier C,
Tietema A, Sowerby A, Emmett B, Lang EK et al. 2009. Changes in
the onset of shrubland species spring growth in response to an
experimental warming along a north-south gradient in Europe. GlobalEcology and Biogeography 18: 473–484.
Primack RB, Ibanez I, Higuchi H, Lee SD, Miller-Rushing AJ, Wilson
AM, Silander JA Jr. 2009. Spatial and interspecific variability in
phenological responses to warming temperatures. Biological Conservation142: 2569–2577.
Rameau J-C, Mansion D, Dume G. 1989. Flore forestiere francaise.Guide ecologique illustre. 1. Plaines et collines. Paris, France: Institut
pour la Developpement Forestier, Ministere de l’Agriculture et de
la foret.
Rameau J-C, Mansion D, Dume G, Gauberville C. 2008. Flore forestierefrancaise. Guide ecologique illustre. 3. Region mediterraneenne. Paris:
Institut pour la Developpement Forestier.
Repo T, Hanninen H, Kellomaki S. 1996. The effects of long-term
elevation of air temperature and CO2 on the frost hardiness of Scots
pine. Plant, Cell & Environment 19: 209–216.
Richardson AD, Bailey AS, Denny EG, Martin CW, O’Keefe J. 2006.
Phenology of a northern hardwood forest canopy. Global Change Biology12: 1174–1188.
Root TL, Price JT, Hall KR, Schneider SH, Rosenzweig C, Pounds JA.
2003. Fingerprints of global warming on wild animals and plants.
Nature 421: 57–60.
Saavedra F, Inouye DW, Price MV, Harte J. 2003. Changes in flowering
and abundance of Delphinium nuttallianum (Ranunculaceae) in
response to a subalpine climate warming experiment. Global ChangeBiology 9: 885–894.
Sarvas R. 1972. Investigations on the annual cycle of development on
forest trees active period. Communicationes Instituti Forestalis Fenniae 76:
110.
Sarvas R. 1974. Investigations on the annual cycle of development of forest
trees. Autumn dormancy and winter dormancy. CommunicationesInstituti Forestalis Fenniae 84: 1–101.
10 Research
NewPhytologist
� The Authors (2010)
Journal compilation � New Phytologist Trust (2010)
New Phytologist (2010)
www.newphytologist.com

Schar C, Jendritzky G. 2004. Hot news from summer 2003. Nature 432:
559–560.
Schwartz MD. 2003. Phenology: an integrative environmental science.Dordrecht, the Netherlands: Kluwer Academic.
Sherry RA, Zhou XH, Gu SL, Arnone JA, Schimel DS, Verburg PS,
Wallace LL, Luo YQ. 2007. Divergence of reproductive phenology
under climate warming. Proceedings of the National Academy of Sciences,USA 104: 198–202.
Svensson CJ, Jenkins SR, Hawkins SJ, Aberg P. 2005. Population
resistance to climate change: modelling the effects of low
recruitment in open populations. Global Change Biology 142:
117–126.
Van Wijk MT, Clemmensen KE, Shaver GR, Williams M, Callaghans
TV, Chapin III SF, Cornelissen JHC, Gough L, Richardson SJ, Rueth
H. 2003. Long-term ecosystem level experiments at Toolik Lake,
Alaska, and at Abisko, Northern Sweden: generalizations and differences
in ecosystem and plant responses to global change. Global ChangeBiology 10: 105–123.
Vitasse Y, Delzon S, Dufrene E, Pontailler JY, Louvet JM, Kremer A,
Michalet R. 2009. Leaf phenology sensitivity to temperature in
European trees: do within-species populations exhibit similar responses?
Agricultural and Forest Meteorology 149: 735–744.
Walker MD, Wahren CH, Hollister RD, Henry GHR, Ahlquist LE,
Alatalo JM, Bret-Harte MS, Calef MP, Callaghan TV, Carroll AB
et al. 2006. Plant community responses to experimental warming across
the tundra biome. Proceedings of the National Academy of Sciences, USA103: 1342–1346.
Walther G-R, Post E, Convey P, Menzel A, Parmesan C, Beebee TJC,
Fromentin J-M, Hoegh-Guldberg O, Bairlein F. 2002. Ecological
responses to recent climate change. Nature 416: 389–395.
Supporting Information
Additional supporting information may be found in theonline version of this article.
Fig. S1 Geographical distribution of Quercus robur,Quercus pubescens and Quercus ilex, and the locations of thepopulations sampled.
Fig. S2 Variation of soil water content at 15 cm and30 cm depth in the plots in 2002–2004, according to rain-fall exclusion and warming treatments.
Table S1 Mean date of leafing and leaf senescence for eachyear and species, according to populations, rainfall treat-ment and warming treatment.
Table S2 Analysis of variance of the total leaf area and ofthe specific leaf area.
Please note: Wiley-Blackwell are not responsible for thecontent or functionality of any supporting information sup-plied by the authors. Any queries (other than missing mate-rial) should be directed to the New Phytologist CentralOffice.
NewPhytologist Research 11
� The Authors (2010)
Journal compilation � New Phytologist Trust (2010)
New Phytologist (2010)
www.newphytologist.com
Related Documents