Cerebral vascular mean transit time in healthy humans: a comparative study with PET and dynamic susceptibility contrast-enhanced MRI Masanobu Ibaraki 1 , Hiroshi Ito 1,2 , Eku Shimosegawa 1 , Hideto Toyoshima 1 , Keiichi Ishigame 1,3 , Kazuhiro Takahashi 1 , Iwao Kanno 1 and Shuichi Miura 1 1 Department of Radiology and Nuclear Medicine, Akita Research Institute of Brain and Blood Vessels, Akita, Japan; 2 Brain Imaging Project, National Institute of Radiological Sciences, Chiba, Japan; 3 PET Center, Kofu Neurosurgical Hospital, Kofu, Japan Cerebral vascular mean transit time (MTT), defined as the ratio of cerebral blood volume to cerebral blood flow (CBV/CBF), is a valuable indicator of the cerebral circulation. Positron emission tomography (PET) and dynamic susceptibility contrast-enhanced magnetic resonance imaging (DSC-MRI) are useful for the quantitative determination of MTT in the clinical setting. The aim of this study was to establish a normal value set of MTT as determined by PET and by DSC-MRI and to identify differences between these methods. Seven healthy volunteers were studied with 15 O-PET (H 2 15 O and C 15 O) and gradient-echo echo-planar DSC-MRI at 1.5 T. In the DSC-MRI study with bolus injection of contrast agent, deconvolution analysis was performed. Comparison of gray-to-white matter ratios showed fairly good agreement between PET and DSC-MRI for all parameters (relative CBV, relative CBF, and relative MTT), confirming the validity of relative measurements with DSC- MRI. However, quantitative MTT measured by DSC-MRI was significantly shorter than that measured by PET in cerebral cortical regions (2.8 to 3.0 secs for DSC-MRI versus 3.9 to 4.3 secs for PET) and the centrum semiovale (3.5 secs for DSC-MRI versus 4.8 secs for PET). These discrepancies may be because of the differences in the intrinsic sensitivity of each imaging modality to vascular components; whereas PET measurement of CBV is equally sensitive to all vascular components, measurement with DSC-MRI originates from the microvasculature in the vicinity of the brain parenchyma. This underlying difference may influence interpretation of MTT determined by PET or by DSC-MRI for patients with cerebrovascular disease. Journal of Cerebral Blood Flow & Metabolism (2007) 27, 404–413. doi:10.1038/sj.jcbfm.9600337; published online 17 May 2006 Keywords: cerebral perfusion; dynamic susceptibility contrast-enhanced MRI (DSC-MRI); mean transit time (MTT); PET Introduction Measurement of cerebral circulation by positron emission tomography (PET) has been applied to investigate the pathophysiology of cerebrovascular disease in humans (Gibbs et al, 1984; Powers et al, 1984; Sette et al, 1989). Cerebral vascular mean transit time (MTT) relates to cerebral blood flow (CBF) and cerebral blood volume (CBV) according to the following: MTT = CBV/CBF (Meier and Zierler, 1954) and is a sensitive index of decline in perfusion pressure (Gibbs et al, 1984; Sette et al, 1989). By PET, CBF can be measured with 15 O-labeled water (H 2 15 O) as a diffusible tracer, which is regarded as the gold standard (Raichle et al, 1983; Kanno et al, 1987; Iida et al, 1989), and CBV can be measured with 15 O-labeled or 11 C-labeled carbon monoxide (C 15 O or 11 CO) (Martin et al, 1987; Grubb et al, 1978; Phelps et al, 1979). Recently, dynamic susceptibility contrast- enhanced magnetic resonance imaging (DSC-MRI) with a Gd-based contrast agent has been increasingly applied in cerebral perfusion studies (Calamante et al, 1999). DSC-MRI combined with diffusion MR is frequently used in acute stroke patients to assess the extent and severity of ischemia (Baird and Warach, 1998). When an arterial input function (AIF) is determined, CBF, CBV, and MTT can be calculated by deconvolution analysis (Rempp et al, 1994; Østergaard et al, 1996a, b). However, absolute Received 20 December 2005; revised 16 March 2006; accepted 16 April 2006; published online 17 May 2006 Correspondence: Dr M Ibaraki, Department of Radiology and Nuclear Medicine, Akita Research Institute of Brain and Blood Vessels, 6-10 Senshu-Kubota Machi, Akita 010-0874, Japan. E-mail: [email protected] Presented in part at Brain’05 & BrainPET’05, Amsterdam, 2005. Journal of Cerebral Blood Flow & Metabolism (2007) 27, 404–413 & 2007 ISCBFM All rights reserved 0271-678X/07 $30.00 www.jcbfm.com

Welcome message from author
This document is posted to help you gain knowledge. Please leave a comment to let me know what you think about it! Share it to your friends and learn new things together.
Transcript

Cerebral vascular mean transit time in healthyhumans: a comparative study with PET anddynamic susceptibility contrast-enhanced MRI
Masanobu Ibaraki1, Hiroshi Ito1,2, Eku Shimosegawa1, Hideto Toyoshima1,Keiichi Ishigame1,3, Kazuhiro Takahashi1, Iwao Kanno1 and Shuichi Miura1
1Department of Radiology and Nuclear Medicine, Akita Research Institute of Brain and Blood Vessels,Akita, Japan; 2Brain Imaging Project, National Institute of Radiological Sciences, Chiba, Japan; 3PET Center,Kofu Neurosurgical Hospital, Kofu, Japan
Cerebral vascular mean transit time (MTT), defined as the ratio of cerebral blood volume to cerebralblood flow (CBV/CBF), is a valuable indicator of the cerebral circulation. Positron emissiontomography (PET) and dynamic susceptibility contrast-enhanced magnetic resonance imaging(DSC-MRI) are useful for the quantitative determination of MTT in the clinical setting. The aim of thisstudy was to establish a normal value set of MTT as determined by PET and by DSC-MRI and toidentify differences between these methods. Seven healthy volunteers were studied with 15O-PET(H2
15O and C15O) and gradient-echo echo-planar DSC-MRI at 1.5 T. In the DSC-MRI study with bolusinjection of contrast agent, deconvolution analysis was performed. Comparison of gray-to-whitematter ratios showed fairly good agreement between PET and DSC-MRI for all parameters (relativeCBV, relative CBF, and relative MTT), confirming the validity of relative measurements with DSC-MRI. However, quantitative MTT measured by DSC-MRI was significantly shorter than that measuredby PET in cerebral cortical regions (2.8 to 3.0 secs for DSC-MRI versus 3.9 to 4.3 secs for PET) andthe centrum semiovale (3.5 secs for DSC-MRI versus 4.8 secs for PET). These discrepancies may bebecause of the differences in the intrinsic sensitivity of each imaging modality to vascularcomponents; whereas PET measurement of CBV is equally sensitive to all vascular components,measurement with DSC-MRI originates from the microvasculature in the vicinity of the brainparenchyma. This underlying difference may influence interpretation of MTT determined by PET orby DSC-MRI for patients with cerebrovascular disease.Journal of Cerebral Blood Flow & Metabolism (2007) 27, 404–413. doi:10.1038/sj.jcbfm.9600337; published online17 May 2006
Keywords: cerebral perfusion; dynamic susceptibility contrast-enhanced MRI (DSC-MRI); mean transit time(MTT); PET
Introduction
Measurement of cerebral circulation by positronemission tomography (PET) has been applied toinvestigate the pathophysiology of cerebrovasculardisease in humans (Gibbs et al, 1984; Powers et al,1984; Sette et al, 1989). Cerebral vascular meantransit time (MTT) relates to cerebral blood flow(CBF) and cerebral blood volume (CBV) according tothe following: MTT = CBV/CBF (Meier and Zierler,1954) and is a sensitive index of decline in perfusion
pressure (Gibbs et al, 1984; Sette et al, 1989). ByPET, CBF can be measured with 15O-labeled water(H2
15O) as a diffusible tracer, which is regarded asthe gold standard (Raichle et al, 1983; Kanno et al,1987; Iida et al, 1989), and CBV can be measuredwith 15O-labeled or 11C-labeled carbon monoxide(C15O or 11CO) (Martin et al, 1987; Grubb et al, 1978;Phelps et al, 1979).
Recently, dynamic susceptibility contrast-enhanced magnetic resonance imaging (DSC-MRI)with a Gd-based contrast agent has been increasinglyapplied in cerebral perfusion studies (Calamanteet al, 1999). DSC-MRI combined with diffusion MRis frequently used in acute stroke patients to assessthe extent and severity of ischemia (Baird andWarach, 1998). When an arterial input function(AIF) is determined, CBF, CBV, and MTT can becalculated by deconvolution analysis (Rempp et al,1994; Østergaard et al, 1996a, b). However, absolute
Received 20 December 2005; revised 16 March 2006; accepted 16April 2006; published online 17 May 2006
Correspondence: Dr M Ibaraki, Department of Radiology andNuclear Medicine, Akita Research Institute of Brain and BloodVessels, 6-10 Senshu-Kubota Machi, Akita 010-0874, Japan.E-mail: [email protected]
Presented in part at Brain’05 & BrainPET’05, Amsterdam, 2005.
Journal of Cerebral Blood Flow & Metabolism (2007) 27, 404–413& 2007 ISCBFM All rights reserved 0271-678X/07 $30.00
www.jcbfm.com
quantification of CBF and CBV is not straight-forward because of difficulties in absolute scalingof AIF and tissue concentration curves; normal-ization procedures are required to determineabsolute CBF and CBV values (Calamante et al,2002). Use of empirical scaling factors, which areconstant within a study population, have beenproposed (Østergaard et al, 1998a, b). However,normalization for each patient is necessary to obtainreliable CBF and CBV estimates (Lin et al, 2001;Sakaie et al, 2005).
In contrast to CBF and CBV, MTT, calculatedas CBV/CBF, is free of scaling problems and canbe determined with absolute units (secs) even byDSC-MRI. The usefulness of quantitative MTT(absolute value) in DSC-MRI has been reported inpatients with acute ischemic stroke as a thresholdfor hypoperfusion (Thijs et al, 2001) and in patientswith chronic occlusive cerebrovascular diseaseas an indicator of perfusion reserve impairment(Kikuchi et al, 2002). Although normal MTT valueshave been reported by DSC-MRI (e.g., Østergaardet al, 1996a; Schreiber et al, 1998; Vonken et al,1999; Helenius et al, 2003), there is a large dis-crepancy among reports, and MTT values measuredby PET differ (e.g., Ito et al, 2003; Sette et al, 1989).
The aim of this study was to establish a normalvalue set of MTT as determined by PET and by DSC-MRI and to investigate differences between thesemethods. By PET, CBF, and CBV were obtainedwith H2
15O and C15O, respectively. By DSC-MRIwith injection of a Gd-based contrast agent, CBF wasdetermined with the use of singular value decom-position (SVD) deconvolution with correction forthe effect of tracer delay (delay-corrected SVDmethod) (Ibaraki et al, 2005b, c). For both studies,MTT was calculated as CBV/CBF. Differences inMTT between DSC-MRI and PET were analyzed.
Materials and methods
Subjects
Seven healthy men aged 20 to 21 years were recruited andprovided written informed consent. Dynamic susceptibil-ity contrast-enhanced magnetic resonance imaging andPET were performed within the same day for each subjectat rest with eyes closed. All volunteers were determined tobe healthy based on medical history, blood screening tests,anatomic MR imaging of the brain, and MR angiography ofthe brain. The study protocol was approved by the EthicsCommittee of the Akita Research Institute of Brain andBlood Vessels. For these volunteers, the effects of regionaltracer delay on DSC-MRI CBF estimates were reportedpreviously (Ibaraki et al, 2005c).
Magnetic Resonance Imaging Procedures
Magnetic resonance imaging was performed with a 1.5-Twhole-body scanner (Magnetom Vision; Siemens Medical
Systems, Iselin, NJ, USA). Axial fast spin-echo T2-weighted images (TR, 3600 ms; TE, 96 ms; slice thickness,5 mm; slice gap, 1 mm; 19 slices) were obtained parallel tothe anterior commissure–posterior commissure (AC–PC)line. Perfusion data were obtained by single-shot gradient-echo echo-planar imaging (TR, 1000 ms; TE, 66 ms; flipangle, 901; matrix size, 128� 128; field of view, 230 mm;slice thickness, 5 mm). At 20 secs after initiating scanning,10 mL gadodiamide (Omniscan) was injected intothe antecubital vein over a period of 3 secs, followed byinjection of 10 mL saline. One hundred twenty brainimages were obtained with 1-sec repetition time, and 60sequential frames were extracted (keeping an adequatenumber of baseline frames before the contrast agentarrived) and were further processed to generate CBV andCBF maps. Each brain image contained five slices thatwere identical in position to the five slices of the T2-weighted image; one slice covered the cerebellum (1stslice), and the other four slices were of the cerebrum at 0,12, 24, and 36 mm (2nd to 5th slice) above and parallel tothe AC–PC line.
Dynamic Susceptibility Contrast-Enhanced MagneticResonance Imaging Data Analysis
Dynamic susceptibility contrast-enhanced magnetic reso-nance imaging data analysis was performed as describedpreviously (Ibaraki et al, 2005b, c). Magnetic Resonancesignal intensity was converted to tracer concentrationby assuming a linear relation between changes in thetransverse relaxation rate and tracer concentration.Arterial input function was measured in the brain regioncovering the insular segment of the middle cerebralartery (MCA) territory by means of a previously reportedsemiautomatic method (Ibaraki et al, 2005a, b). Cerebralblood volume was calculated as the ratio of the area underthe tissue concentration curve to the area of the AIF. CBFwas determined with the use of a delay-corrected SVDmethod (Ibaraki et al, 2005b, c). In brief, CBF wasdetermined by standard SVD deconvolution (Østergaardet al, 1996b) after time shifting of the tissue curve. Valuesfor regional tracer delay were calculated by pixel-by-pixelleast-squares estimation and then used for time shifting.We have shown that delay-corrected SVD provides gray-to-white CBF ratios with less interindividual variationthat are close to those measured by PET (Ibaraki et al,2005c).
Quantitative MTT was determined as CBV/CBF withabsolute units (secs) in the region-of-interest (ROI)analysis described below. In the DSC-MRI study, absoluteCBF and CBV values could not be determined becauseof difficulties in absolute scaling of AIF. Therefore,only relative CBF and CBV (ratio to white matter values)are presented.
Positron Emission Tomography Procedures
Positron emission tomography was performed with aHeadtome V scanner (Shimadzu Corp., Kyoto, Japan)(Iida et al, 1996), which provides 47 sections with a
Cerebral vascular MTT by PET and DSC-MRIM Ibaraki et al
405
Journal of Cerebral Blood Flow & Metabolism (2007) 27, 404–413

center-to-center distance of 3.1 mm. The intrinsic spatialresolution was 4.0 mm full width at half maximum(FWHM) in-plane and 4.3 mm FWHM axially. Reconstruc-tion with a Butterworth filter resulted in a final in-planeresolution of approximately 10 mm FWHM. After trans-mission scanning for attenuation correction, H2
15O andC15O PET studies were performed.
H215O Positron Emission Tomography Study
H215O PET studies were performed to measure CBF.
Dynamic scanning (180 secs) was performed after anintravenous bolus injection of H2
15O (1.5 GBq). The scansequence consisted of twelve 5-secs frames and eight15-secs frames. Arterial input function was obtained witha beta detector system that continuously measured radio-activity in arterial whole blood taken from the radialartery. Delay and dispersion occurring in the beta detectorsystem and the internal arterial line were corrected asdescribed previously (Iida et al, 1986, 1988). According tothe one-tissue compartment model, H2
15O radioactivity inthe brain is expressed as follows:
CðtÞ ¼ K1CaðtÞ � expð�k2tÞwhere C(t) and Ca(t) are the radioactivity concentrations inthe brain and in arterial whole blood, respectively. K1 isthe influx rate constant (mL/min/mL) corresponding toCBF, k2 is the efflux rate constant (1/min), and # denotesconvolution. K1 and k2 were determined by pixel-by-pixelleast-squares estimation (Iida et al, 1989).
C15O Positron Emission Tomography Study
C15O PET studies were performed to measure CBV (Martinet al, 1987). Static PET scanning was initiated 3 minsafter 1 min of continuous inhalation of C15O gas (5 GBq).Scanning was performed for 4 mins. Three arterialblood samples were taken during PET scanning to measurewhole-blood radioactivity. The cerebral-to-large vesselhematocrit ratio was assumed to be 0.85 (Phelps et al,1979).
Region-of-Interest Analysis
Positron emission tomography parametric maps (CBFand CBV) were registered with individual anatomicMR images (T2-weighted images) with the use of SPM(Ashburner and Friston, 1997). Magnetic resonanceimaging parametric maps (CBF and CBV) were processedwith a Gaussian filter with 10-mm FWHM to match thespatial resolution of DSC-MRI with that of PET. With theuse of T2-weighted images and segmented gray matterimages (Ashburner and Friston, 1997) as anatomicreferences, we defined circular ROIs 10 mm in diameterbilaterally for seven brain regions: cerebellum, putamen,thalamus, cerebral cortices in different arterial territories(MCA, posterior cerebral artery (PCA), and anteriorcerebral artery (ACA)) (Tatu et al, 1998), and white matterof the centrum semiovale (Figure 1).
For DSC-MRI and PET data analyses, MTTs were calcu-lated for each subject on an ROI basis as MTT = CBV/CBF.Comparison of quantitative MTT between PET and DSC-MRI was made with the paired t-test. Relative measures of
T2-weighted
Graymatter
CBF CBV
PET
CBFDelay CBV
DSC-MRI
No SmoothingCBF CBV
Figure 1 Anatomic MR images and parametric maps obtained with PET and DSC-MRI. Left to right: T2-weighted image, segmentedgray matter image generated by partitioning the T2-weighted image, tracer delay measured with DSC-MRI, MRI-CBF, MRI-CBV, MRI-CBF with smoothing, MRI-CBV with smoothing, PET-CBF, and PET-CBV. Circular regions-of-interest were identified in thecerebellum, putamen, thalamus, cerebral cortex, and centrum semiovale. All images were obtained parallel to the anteriorcommissure–posterior commissure (AC–PC) line. Slice positions are cerebellar level (1st), 0 mm (2nd), 12 mm (3rd), 24 mm (4th),and 36 mm (5th) from the AC–PC line.
Cerebral vascular MTT by PET and DSC-MRIM Ibaraki et al
406
Journal of Cerebral Blood Flow & Metabolism (2007) 27, 404–413
CBF, CBV, and MTT, which were calculated as the ratio towhite matter value, were also examined. In addition,regional differences in the absolute measures of PET andDSC-MRI were determined by the paired t-test withBonferroni correction for multiple comparisons. Signifi-cance was accepted at P < 0.05.
Results
Comparisons between Positron Emission Tomographyand DSC-Magnetic Resonance Imaging
Positron emission tomography and DSC-MRI resultsare shown in Tables 1 and 2, respectively. Althoughcomparisons were made with the smoothing of DSC-MRI maps, DSC-MRI parameters without smoothingare also shown in Table 2. Quantitative MTT measuredby DSC-MRI was shorter than that measured byPET, with the exception of the thalamus. In all of the
cerebral cortical regions analyzed and the centrumsemiovale, MTT values were significantly lower forDSC-MRI than for PET (Figure 2).
In contrast to quantitative MTT, significant differ-ences in the relative measures between PET andDSC-MRI were identified in only one or two brainregions. Relative CBF in the cerebral cortex ofthe PCA territory was significantly greater forDSC-MRI than for PET (Figure 3A). Relative CBVin the thalamus and cerebral cortex of the MCAterritory was significantly greater for DSC-MRI thanfor PET (Figure 3B). Relative MTT in the thalamuswas significantly greater for DSC-MRI than for PET(Figure 3C).
Regional Differences
Mean transit time measured by PET was signifi-cantly longer in the centrum semiovale than in the
Table 1 Results of PET study
Cerebellum Putamen Thalamus Cerebral cortex Centrum semiovale
MCA PCA ACA
CBV (mL/100 mL) 3.670.8 3.070.6 2.570.7 3.570.4 3.770.43 3.470.3 1.770.21,2,4–6
CBF (mL/100 mL/min) 62.377.3 55.374.6 52.878.41 55.376.7 52.075.01 50.476.74 22.273.61–6
MTT (secs) 3.570.8 3.370.6 2.870.8 3.970.33 4.370.83 4.170.63 4.871.02
Vd (mL/mL)a 1.0070.09 0.9970.05 0.8570.112 0.8370.041,2 0.8770.072 0.7970.071,2,5 0.8070.22
Relative CBV 2.170.5 1.770.4 1.470.4 2.070.3 2.270.4 2.070.3 1.0Relative CBF 2.970.6 2.670.5 2.470.6 2.570.5 2.470.4 2.370.4 1.0Relative MTT 0.7870.28 0.6970.12 0.6170.18 0.8370.21 0.9570.33 0.8870.24 1.0
ACA, anterior cerebral artery; CBF, cerebral blood flow; CBV, cerebral blood volume; MCA, middle cerebral artery; MTT, mean transit time; PCA, posteriorcerebral artery; Vd, distribution volume of water.Values are shown as mean7s.d. Regional differences in absolute values (CBV, CBF, MTT, and Vd) were determined. Significant differences between1cerebellum, 2putamen, 3thalamus, 4MCA, 5PCA, 6ACA were determined with P < 0.05 adjusted for multiple comparisons. Relative values were normalized towhite matter (centrum semiovale) values.aDistribution volume of water calculated by K1/k2 in H2
15O study.
Table 2 Results of DSC-MRI study
Cerebellum Putamen Thalamus Cerebral cortex Centrum semiovale
MCA PCA ACA
Delay (secs) 1.170.4 0.270.5 0.770.4 0.670.32 1.370.42,4 0.770.35 1.470.62
MTT (secs) 3.370.6 2.670.4 3.370.8 3.070.4 3.070.5 2.870.3 3.570.62
(3.370.7) (2.670.4) (3.070.8) (3.070.4) (3.170.5) (2.970.4) (3.670.6)2,4
Relative CBV 2.370.3 2.270.3 2.470.2 2.470.1 2.370.2 2.070.4 1.0(2.770.6) (2.670.4) (2.470.3) (2.970.2) (2.870.4) (2.370.7) (1.0)
Relative CBF 2.570.3 2.970.3 2.670.3 2.870.3 2.770.2 2.470.3 1.0(2.970.5) (3.770.5) (2.970.4) (3.570.3) (3.370.2) (2.870.6) (1.0)
Relative MTT 0.9570.15 0.7670.09 0.9570.12 0.8670.06 0.8770.08 0.8370.12 1.0(0.9070.17) (0.7170.08) (0.8170.14) (0.8370.07) (0.8570.11) (0.8070.13) (1.0)
ACA, anterior cerebral artery; CBV, cerebral blood volume; CBF, cerebral blood flow; MCA, middle cerebral artery; MTT, mean transit time; PCA, posteriorcerebral artery.Values are shown as mean7s.d. Values in parentheses represent results without spatial smoothing. Regional differences in absolute values (MTT and tracerdelay) were determined. Significant differences between 1cerebellum, 2putamen, 3thalamus, 4MCA, 5PCA, 6ACA were determined with P < 0.05 adjusted formultiple comparisons. Relative values were normalized to white matter (centrum semiovale) values.
Cerebral vascular MTT by PET and DSC-MRIM Ibaraki et al
407
Journal of Cerebral Blood Flow & Metabolism (2007) 27, 404–413
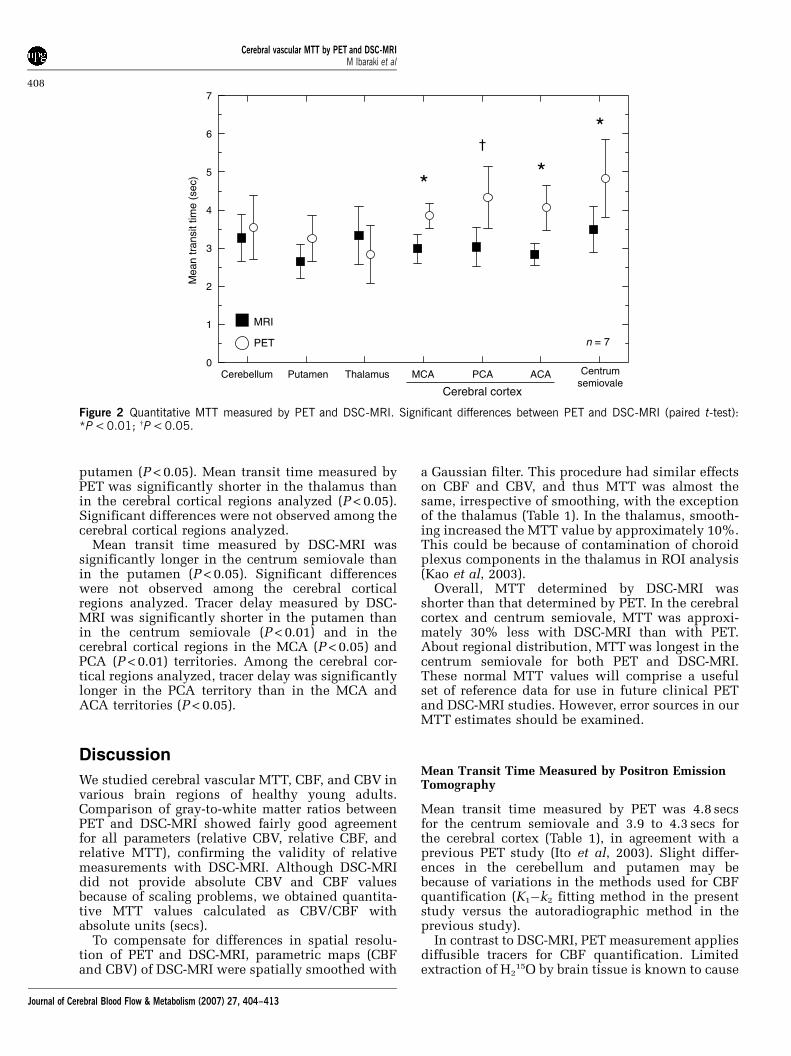
putamen (P < 0.05). Mean transit time measured byPET was significantly shorter in the thalamus thanin the cerebral cortical regions analyzed (P < 0.05).Significant differences were not observed among thecerebral cortical regions analyzed.
Mean transit time measured by DSC-MRI wassignificantly longer in the centrum semiovale thanin the putamen (P < 0.05). Significant differenceswere not observed among the cerebral corticalregions analyzed. Tracer delay measured by DSC-MRI was significantly shorter in the putamen thanin the centrum semiovale (P < 0.01) and in thecerebral cortical regions in the MCA (P < 0.05) andPCA (P < 0.01) territories. Among the cerebral cor-tical regions analyzed, tracer delay was significantlylonger in the PCA territory than in the MCA andACA territories (P < 0.05).
Discussion
We studied cerebral vascular MTT, CBF, and CBV invarious brain regions of healthy young adults.Comparison of gray-to-white matter ratios betweenPET and DSC-MRI showed fairly good agreementfor all parameters (relative CBV, relative CBF, andrelative MTT), confirming the validity of relativemeasurements with DSC-MRI. Although DSC-MRIdid not provide absolute CBV and CBF valuesbecause of scaling problems, we obtained quantita-tive MTT values calculated as CBV/CBF withabsolute units (secs).
To compensate for differences in spatial resolu-tion of PET and DSC-MRI, parametric maps (CBFand CBV) of DSC-MRI were spatially smoothed with
a Gaussian filter. This procedure had similar effectson CBF and CBV, and thus MTT was almost thesame, irrespective of smoothing, with the exceptionof the thalamus (Table 1). In the thalamus, smooth-ing increased the MTT value by approximately 10%.This could be because of contamination of choroidplexus components in the thalamus in ROI analysis(Kao et al, 2003).
Overall, MTT determined by DSC-MRI wasshorter than that determined by PET. In the cerebralcortex and centrum semiovale, MTT was approxi-mately 30% less with DSC-MRI than with PET.About regional distribution, MTT was longest in thecentrum semiovale for both PET and DSC-MRI.These normal MTT values will comprise a usefulset of reference data for use in future clinical PETand DSC-MRI studies. However, error sources in ourMTT estimates should be examined.
Mean Transit Time Measured by Positron EmissionTomography
Mean transit time measured by PET was 4.8 secsfor the centrum semiovale and 3.9 to 4.3 secs forthe cerebral cortex (Table 1), in agreement with aprevious PET study (Ito et al, 2003). Slight differ-ences in the cerebellum and putamen may bebecause of variations in the methods used for CBFquantification (K1�k2 fitting method in the presentstudy versus the autoradiographic method in theprevious study).
In contrast to DSC-MRI, PET measurement appliesdiffusible tracers for CBF quantification. Limitedextraction of H2
15O by brain tissue is known to cause
Mea
n tr
ansi
t tim
e (s
ec)
Putamen Thalamus
Cerebral cortex
Cerebellum MCA PCA ACA
MRI
PET
0
1
2
3
4
5
6
7
*
†
*
*
Centrumsemiovale
n = 7
Figure 2 Quantitative MTT measured by PET and DSC-MRI. Significant differences between PET and DSC-MRI (paired t-test):*P < 0.01; wP < 0.05.
Cerebral vascular MTT by PET and DSC-MRIM Ibaraki et al
408
Journal of Cerebral Blood Flow & Metabolism (2007) 27, 404–413

Rel
ativ
e C
BF
Putamen ThalamusCerebellum MCA PCA ACA0
1
2
3
4
5
MR I
PET
†
Cerebral cortex
Centrumsemiovale
Rel
ativ
e C
BV
Putamen ThalamusCerebellum MCA PCA ACA0
1
2
3
4
5
MRI
PET
*†
Cerebral cortex
Centrumsemiovale
n = 7
n = 7
n = 7
Rel
ativ
e M
TT
Putamen ThalamusCerebellum MCA PCA ACA0
0.5
1
1.5
MRI
PET
*
Cerebral cortex
Centrumsemiovale
A
B
C
Figure 3 Comparisons of relative measures between PET and DSC-MRI: (A) relative CBF, (B) relative CBV, and (C) relative MTT.Relative values are normalized to those of the white matter (centrum semiovale). Significant differences between PET and DSC-MRI(paired t-test): *P < 0.01; wP < 0.05.
Cerebral vascular MTT by PET and DSC-MRIM Ibaraki et al
409
Journal of Cerebral Blood Flow & Metabolism (2007) 27, 404–413

underestimation of CBF (Eichling et al, 1974;Herscovitch et al, 1987). The extraction fraction ofH2
15O in humans is reported to be 0.84, with slightregional variation (Herscovitch et al, 1987), there-fore causing a potential 16% underestimation ofCBF and a potential 19% overestimation of MTT.However, this effect does not fully account for thedifferences in MTT between PET and DSC-MRIobserved in the present study.
Mean Transit Time Measured by DynamicSusceptibility Contrast-Enhanced MagneticResonance Imaging
Mean transit time measured by DSC-MRI was 2.6 to3.3 secs for gray matter and 3.5 secs for white matter(Table 2). These results are in accordance withthose of other studies that used SVD deconvolution(Table 3). However, there are differences betweenthe SVD method and other deconvolution methods.Deconvolution by Fourier transformation (FT)(Rempp et al, 1994; Østergaard et al, 1996b), whichis an intrinsically delay-insensitive method, pro-vides longer MTTs than does the SVD method(Table 3). This is consistent with a simulation studythat showed that the FT method results in a largeunderestimation (approximately 50%) of CBF in thenormal flow range (Østergaard et al, 1996b).
The reliability of quantitative perfusion MR isopen to debate. The reproducibility of absoluteCBF and CBV is reported to be worse by DSC-MRIthan PET (Carroll et al, 2002; Grandin et al, 2005).The main cause of deterioration is variation of AIFamplitude because of a partial volume effect (Linet al, 2001; Sakaie et al, 2005). Mean transit timecalculated by CBV/CBF is not affected by thepartial volume effect and thus may be a more
reliable parameter than absolute CBF or CBV. Infact, interindividual variation of MTT determinedby DSC-MRI was smaller than that determinedby PET (Tables 1 and 2). However, this does notprovide direct evidence for the reproducibilityof MTT by DSC-MRI, which is essential forclinical application and should be investigated infuture studies.
Effect of Hematocrit
Cerebral hematocrit is one of the factors that affectMTT determined by PET and DSC-MRI. In the PETstudy, CBV was calculated with an assumption of asmall (brain)-to-large (radial artery) vessel hemato-crit ratio of 0.85 (Phelps et al, 1979). Hematocritratios measured in normal brain regions range from0.69 to 0.88 (Okazawa et al, 1996; Lammertsma et al,1984; Sakai et al, 1985), suggesting a possibleunderestimation of CBV and MTT in the presentPET study by 20% at most. Therefore, errors inhematocrit ratio do not explain the differencesin MTT observed in the present study.
In DSC-MRI studies, MTT measured with a Gd-based contrast agent should be interpreted as plasmaMTT rather than blood MTT (Meier and Zierler,1954). The velocity of plasma is slower than thatof RBCs within capillaries (Pries et al, 1986),corresponding to a longer plasma MTT than bloodMTT. When a 40% large vessel hematocrit and 0.85small-to-large hematocrit ratio are assumed, plasmaMTT is 10% longer than blood MTT (Pries et al,1986; Yamauchi et al, 1998). Therefore, to compareMTT obtained by PET and DSC-MRI, it should beconverted to blood MTT. However, this conversionincreases the differences in MTT between PET andDSC-MRI observed in the present study.
Table 3 Published MTT values measured by DSC-MRI
Reference Age (yr) Normal MTT with DSC-MRI (secs) Deconvolution Scansequence
Repetition time(secs)
Gray matter White matter
Present study 20–21 2.6–3.3 3.5 SVDa GE-EPI 1.0Østergaard et al (1996b) 2974 2.6 3.2 SVD SE-EPI 1.0Marstrand et al (2001) 23–67 2.2 2.7 SVD GE-EPI 1.0
1.2 1.5 SVD SE-EPI 1.0Helenius et al (2003) 22–85 2.6–3.2 4.2–4.5 SVD SE-EPI 1.5Sakaie et al (2005) 3178 3.8b 4.5b SVD GE-EPI 1.5Rempp et al (1994) 20–64 6.9b 7.5b FT SD-FLASH 1.9Koshimoto et al (1999) 25–73 6.8 7.8 FT HASTE 3.0Kaneko et al (2004) 25–35 5.9 8.3 FT GE-EPI 1.0Grandin et al (2005) 2475 5.5–6.4b 8.0b FT GE-EPI 2.3Vonken et al (1999) 40–86 6.4 6.9 MLEM GE-EPI 1.1Schreiber et al (1998) 42713 4.7 5.4 DOP SD-FLASH 2.2
DOP, deconvolution with orthogonal polynomials; FT, Fourier transformation; GE-EPI, gradient-echo EPI; HASTE, half Fourier single-shot turbo spin echo;MLEM, maximum likelihood expectation maximization; MTT, mean transit time; SD-FLASH, simultaneous dual fast low-angle shot; SE-EPI, spin-echo EPI;SVD, singular value decomposition.aThe present study used the delay-corrected SVD (Ibaraki et al, 2005b, c).bMTTs were not explicitly shown in the literature. Values were calculated from CBF and CBV values presented.
Cerebral vascular MTT by PET and DSC-MRIM Ibaraki et al
410
Journal of Cerebral Blood Flow & Metabolism (2007) 27, 404–413

Regional cerebral hematocrit may change withpathologic condition. For example, in patientswith occlusive cerebrovascular disease, regionaldecreases in cerebral hematocrit, which may beassociated with greater decreases in plasma velocitythan in RBC velocity, has been reported (Yamauchiet al, 1998, 1999). In PET studies, the assumption ofconstant hematocrit ratio will cause underestima-tion of CBV and MTT in such brain regions.Dynamic susceptibility contrast-enhanced magneticresonance imaging with a plasma tracer will providelonger MTT values than true blood MTT values.Therefore, changes in cerebral hematocrit haveopposing effects on MTTs as determined by PETand DSC-MRI and may complicate interpretation ofMTT in cerebrovascular disease.
Sensitivity to Vascular Components
Positron emission tomography and DSC-MRIhave different sensitivities to vascular components.Whereas C15O PET measurement of CBV is equallysensitive to all vascular components (arteries,capillaries, and veins), measurement with DSC-MRI originates from the microvasculature in thevicinity of the brain parenchyma, where the contrastagent induces magnetic-field inhomogeneity result-ing in decreased MR signal. This is represented inCBV and CBF maps for each modality (Figure 1).Cerebral blood flow and CBV maps obtainedwith DSC-MRI are similar to each other, but in thePET study the CBV map is quite different fromthe CBF map. Cerebral blood volume measured withC15O PET shows larger values on the outside of thecortical surface than in the brain parenchyma.About sensitivity to vascular components, MTTobtained with DSC-MRI may be shorter than MTTobtained with PET.
The extent to which MTT measured by DSC-MRIis shorter than that measured by PET may reflect theproportion of the vascular volume that is detectedby DSC-MRI depending on scan sequence (Boxer-man et al, 1995; Kiselev, 2001). A DSC-MRI study inpigs showed that when absolute scaling wasintroduced to match CBF values between PET andDSC-MRI, absolute CBV obtained with spin-echo-type sequence was 40% to 50% of that obtainedwith PET, indicating that MTT measured by spin-echo DSC-MRI is 40% to 50% of that measured byPET (Østergaard et al, 1998b). These authorsspeculated that spin-echo DSC-MRI is sensitive tovessels smaller than 30 to 40 mm in diameter thatoccupy B50% of the total vascular volume. Ourpresent study showed that MTT measured bygradient-echo DSC-MRI is approximately 70% ofthat measured by PET, or approximately 60% if thesmall-to-large hematocrit ratio is assumed to be 0.69as in the study of Østergaard et al (1998b), indicatingthat gradient-echo DSC-MRI detects a larger propor-tion of the vascular volume and is more sensitive to
vessels of larger diameter than spin-echo DSC-MRI.This finding is consistent with theoretic calculations(Boxerman et al, 1995; Kiselev, 2001) and results ofhuman study and animal experiment (Simonsenet al, 2000; Marstrand et al, 2001). This property ofDSC-MRI suggests that MTT determined by DSC-MRIchanges with alterations of cerebral vessels evenwhen the CBV/CBF ratio remains constant, compli-cating interpretation of MTT in cerebrovasculardisease involving vasodilatation, vasoconstriction,or alteration of vascular components.
In conclusion, we showed that normal MTTmeasured with DSC-MRI is shorter than thatmeasured with PET. The difference may be attrib-uted to differences in intrinsic sensitivity of eachimaging modality to vascular components. Positronemission tomography and DSC-MRI may measuredifferent types of vascular transit time, dependingon their intrinsic sensitivities. This underlyingdifference may influence interpretation of MTTdetermined by PET or by DSC-MRI for patients withcerebrovascular disease.
Acknowledgements
We thank the technical staff of Akita ResearchInstitute of Brain and Blood Vessels, particularlyShigeki Sugawara, for performing the PET experi-ments. This research was supported in part by aGrant-in-Aid for Young Scientists (16790751) fromthe Ministry of Education, Culture, Sports, Scienceand Technology of Japan.
References
Ashburner J, Friston K (1997) Multimodal image coregis-tration and partitioning—a unified framework. Neuro-image 6:209–17
Baird AE, Warach S (1998) Magnetic resonance imaging ofacute stroke. J Cereb Blood Flow Metab 18:583–609
Boxerman JL, Hamberg LM, Rosen BR, Weisskoff RM(1995) MR contrast due tointravascular magneticsusceptibility perturbations. Magn Reson Med 34:555–66
Calamante F, Gadian DG, Connelly A (2002) Quantifica-tion of perfusion using bolus tracking magneticresonance imaging in stroke: assumptions, limitations,and potentials for clinical use. Stroke 33:1146–51
Calamante F, Thomas DL, Pell GS, Wiersma J, Turner R(1999) Measuring cerebral blood flow using magneticresonance imaging techniques. J Cereb Blood FlowMetab 19:701–35
Carroll TJ, Teneggi V, Jobin M, Squassante L, Treyer V,Hany TF, Burger C, Wang L, Bye A, Von Schulthess GK,Buck A (2002) Absolute quantification of cerebral bloodflow with magnetic resonance, reproducibility of themethod, and comparison with H2
15O positron emissiontomography. J Cereb Blood Flow Metab 22:1149–56
Eichling JO, Raichle ME, Grubb RL, Jr, Ter-Pogossian MM(1974) Evidence of the limitations of water asa freely
Cerebral vascular MTT by PET and DSC-MRIM Ibaraki et al
411
Journal of Cerebral Blood Flow & Metabolism (2007) 27, 404–413
diffusible tracer in brain of the rhesus monkey. Circ Res35:358–64
Gibbs JM, Wise RJ, Leenders KL, Jones T (1984) Evaluationof cerebral perfusion reserve in patients with carotid-artery occlusion. Lancet 1:310–4
Grandin CB, Bol A, Smith AM, Michel C, Cosnard G(2005) Absolute CBF and CBV measurements by MRIbolus tracking before and after acetazolamide chal-lenge: repeatability and comparison with PET inhumans. Neuroimage 26:525–35
Grubb RL, Jr, Raichle ME, Higgins CS, Eichling JO (1978)Measurement of regional cerebral blood volume byemission tomography. Ann Neurol 4:322–8
Helenius J, Perkio J, Soinne L, Østergaard L, Carano RA,Salonen O, Savolainen S, Kaste M, Aronen HJ,Tatlisumak T (2003) Cerebral hemodynamics in ahealthy population measured by dynamic susceptibil-ity contrast MR imaging. Acta Radiol 44:538–46
Herscovitch P, Raichle ME, Kilbourn MR, Welch MJ (1987)Positron emission tomographic measurement of cere-bral blood flow and permeability-surface area productof water using [15O]water and [11C]butanol. J CerebBlood Flow Metab 7:527–42
Ibaraki M, Shimosegawa E, Toyoshima H, Ishigame K, ItoH, Takahashi K, Miura S, Kanno I (2005b) Effect ofregional tracer delay on CBF in healthy subjectsmeasured with dynamic susceptibility contrast-en-hanced MRI: comparison with 15O-PET. Magn ResonMed Sci 4:27–34
Ibaraki M, Shimosegawa E, Toyoshima H, Ishigame K,Sugawara S, Takahashi K, Miura S, Kanno I (2005c)Evaluation of arterial input function for perfusion MRI:comparison with thatof PET study. Proceedings of theInternational Society for Magnetic Resonance in Med-icine. ISMRM Thirteenth Scientific Meeting, p. 1125
Ibaraki M, Shimosegawa E, Toyoshima H, Takahashi K,Miura S, Kanno I (2005a) Tracer delay correctionof cerebral blood flow with dynamic susceptibilitycontrast-enhanced MRI. J Cereb Blood Flow Metab25:378–90
Iida H, Higano S, Tomura N, Shishido F, Kanno I, Miura S,Murakami M, Takahashi K, Sasaki H, Uemura K (1988)Evaluation of regional differences of tracer appearancetime in cerebral tissues using [15O] water and dynamicpositron emission tomography. J Cereb Blood FlowMetab 8:285–8
Iida H, Kanno I, Miura S, Murakami M, Takahashi K,Uemura K (1986) Error analysis of a quantitativecerebral blood flow measurement using H2
15O auto-radiography and positron emission tomography, withrespect to the dispersion of the input function. J CerebBlood Flow Metab 6:536–45
Iida H, Kanno I, Miura S, Murakami M, Takahashi K,Uemura K (1989) A determination of the regional brain/blood partition coefficient of water using dynamicpositron emission tomography. J Cereb Blood FlowMetab 9:874–85
Iida H, Miura S, Kanno I, Ogawa T, Uemura K (1996) Anew PET camera for noninvasive quantitation ofphysiological functional parametric images: Head-tome-V-dual. In: Quantification of brain function usingPET (Myers R, Cunningham V, Bailey D, Jones T, eds),San Diego: Academic Press, 57–61
Ito H, Kanno I, Takahashi K, Ibaraki M, Miura S (2003)Regional distribution of human cerebral vascular meantransit time measured by positron emission tomogra-phy. Neuroimage 19:1163–9
Kaneko K, Kuwabara Y, Mihara F, Yoshiura T, NakagawaM, Tanaka A, Sasaki M, Koga H, Hayashi K, Honda H(2004) Validation of the CBF, CBV, and MTT values byperfusion MRI in chronicocclusive cerebrovasculardisease: a comparison with 15O-PET. Acad Radiol11:489–97
Kanno I, Iida H, Miura S, Murakami M, Takahashi K,Sasaki H, Inugami A, Shishido F, Uemura K (1987) Asystem for cerebral blood flow measurement using anH2
15O autoradiographic method and positron emissiontomography. J Cereb Blood Flow Metab 7:143–53
Kao YH, Guo WY, Wu YT, Liu KC, Chai WY, Lin CY,Hwang YS, Jy-Kang Liou A, Wu HM, Cheng HC, YehTC, Hsieh JC, Mu Huo Teng M (2003) Hemodynamicsegmentation of MR brain perfusion images usingindependent component analysis, thresholding, andBayesian estimation. Magn Reson Med 49:885–94
Kikuchi K, Murase K, Miki H, Yasuhara Y, Sugawara Y,Mochizuki T, Ikezoe J, Ohue S (2002) Quantitativeevaluation of mean transit times obtained with dy-namic susceptibility contrast-enhanced MR imagingand with 133Xe SPECT in occlusive cerebrovasculardisease. AJR Am J Roentgenol 179:229–35
Kiselev VG (2001) On the theoretical basis of perfusionmeasurements by dynamic susceptibility contrast MRI.Magn Reson Med 46:1113–22
Koshimoto Y, Yamada H, Kimura H, Maeda M, Tsuchida C,Kawamura Y, Ishii Y (1999) Quantitative analysisof cerebral microvascular hemodynamics with T2-weighted dynamic MR imaging. J Magn Reson Imaging9:462–7
Lammertsma AA, Brooks DJ, Beaney RP, Turton DR,Kensett MJ, Heather JD, Marshall J, Jones T (1984) Invivo measurement of regional cerebral haematocritusing positron emission tomography. J Cereb BloodFlow Metab 4:317–22
Lin W, Celik A, Derdeyn C, An H, Lee Y, Videen T,Østergaard L, Powers WJ (2001) Quantitative measure-ments of cerebral blood flow in patients with unilateralcarotid artery occlusion: a PET and MR study. J MagnReson Imaging 14:659–67
Marstrand JR, Rostrup E, Rosenbaum S, Garde E, LarssonHB (2001) Cerebral hemodynamic changes measured bygradient-echo or spin-echo bolus tracking and itscorrelation to changes in ICA blood flow measured byphase-mapping MRI. J Magn Reson Imaging 14:391–400
Martin WR, Powers WJ, Raichle ME (1987) Cerebralblood volume measured with inhaled C15O andpositron emission tomography. J Cereb Blood FlowMetab 7:421–6
Meier P, Zierler KL (1954) On the theoryof the indicator-dilution method for measurement of blood flow andvolume. J Appl Physiol 6:731–44
Okazawa H, Yonekura Y, Fujibayashi Y, Yamauchi H,Ishizu K, Nishizawa S, Magata Y, Tamaki N, FukuyamaH, Yokoyama A, Konishi J (1996) Measurement ofregional cerebral plasma pool and hematocrit withcopper-62-labeled HSA-DTS. J Nucl Med 37:1080–5
Østergaard L, Johannsen P, Host-Poulsen P, Vestergaard-Poulsen P, Asboe H, Gee AD, Hansen SB, Cold GE,Gjedde A, Gyldensted C (1998b) Cerebral blood flowmeasurements by magnetic resonance imaging bolustracking: comparison with [15O]H2O positron emissiontomography in humans. J Cereb Blood Flow Metab18:935–40
Østergaard L, Smith DF, Vestergaard-Poulsen P, HansenSB, Gee AD, Gjedde A, Gyldensted C (1998a) Absolute
Cerebral vascular MTT by PET and DSC-MRIM Ibaraki et al
412
Journal of Cerebral Blood Flow & Metabolism (2007) 27, 404–413
cerebral blood flow and blood volume measured bymagnetic resonance imaging bolus tracking: compar-ison with positron emission tomography values. J CerebBlood Flow Metab 18:425–32
Østergaard L, Sorensen AG, Kwong KK, Weisskoff RM,Gyldensted C, Rosen BR (1996b) High resolutionmeasurement of cerebral blood flow using intra-vascular tracer bolus passages. Part II: Experimentalcomparison and preliminary results. Magn Reson Med36:726–36
Østergaard L, Weisskoff RM, Chesler DA, Gyldensted C,Rosen BR (1996a) High resolution measurement ofcerebral blood flow using intravascular tracer boluspassages. Part I: Mathematical approach and statisticalanalysis. Magn Reson Med 36:715–25
Phelps ME, Huang SC, Hoffman EJ, Kuhl DE (1979)Validation of tomographic measurement of cerebralblood volume with C-11-labeled carboxyhemoglobin.J Nucl Med 20:328–34
Powers WJ, Grubb RL, Jr, Raichle ME (1984) Physiologicalresponses to focal cerebral ischemia in humans. AnnNeurol 16:546–52
Pries AR, Ley K, Gaehtgens P (1986) Generalization of theFahraeus principle for microvessel networks. Am JPhysiol 251:H1324–32
Raichle ME, Martin WR, Herscovitch P, Mintun MA,Markham J (1983) Brain blood flow measured withintravenous H2
15O. II. Implementation and validation.J Nucl Med 24:790–8
Rempp KA, Brix G, Wenz F, Becker CR, Guckel F, LorenzWJ (1994) Quantification of regional cerebral bloodflow and volume with dynamic susceptibility contrast-enhanced MR imaging. Radiology 193:637–41
Sakai F, Nakazawa K, Tazaki Y, Ishii K, Hino H, Igarashi H,Kanda T (1985) Regional cerebral blood volume andhematocrit measured in normalhuman volunteers bysingle-photon emission computed tomography. J CerebBlood Flow Metab 5:207–13
Sakaie KE, Shin W, Curtin KR, McCarthy RM, Cashen TA,Carroll TJ (2005) Method for improving the accuracy ofquantitative cerebral perfusion imaging. J Magn ResonImaging 21:512–9
Schreiber WG, Guckel F, Stritzke P, Schmiedek P,Schwartz A, Brix G (1998) Cerebral blood flowand cerebrovascular reserve capacity: estimation bydynamic magnetic resonance imaging. J Cereb BloodFlow Metab 18:1143–56
Sette G, Baron JC, Mazoyer B, Levasseur M, Pappata S,Crouzel C (1989) Local brain haemodynamics andoxygen metabolism in cerebrovascular disease. Posi-tron emission tomography. Brain 112:931–51
Simonsen CZ, Østergaard L, Smith DF, Vestergaard-Poulsen P, Gyldensted C (2000) Comparison of gradi-ent- and spin-echo imaging: CBF, CBV, and MTTmeasurements by bolus tracking. J Magn Reson Imaging12:411–6
Tatu L, Moulin T, Bogousslavsky J, Duvernoy H (1998)Arterial territories of the human brain: cerebral hemi-spheres. Neurology 50:1699–708
Thijs VN, Adami A, Neumann-Haefelin T, Moseley ME,Marks MP, Albers GW (2001) Relationship betweenseverity of MR perfusion deficit and DWI lesionevolution. Neurology 57:1205–11
Vonken EJ, van Osch MJ, Bakker CJ, Viergever MA (1999)Measurement of cerebral perfusion with dual-echomulti-slice quantitative dynamic susceptibility contrastMRI. J Magn Reson Imaging 10:109–17
Yamauchi H, Fukuyama H, Nagahama Y, Katsumi Y,Hayashi T, Okazawa H, Yonekura Y (1999) Selectivecerebral hematocrit decrease in the centrum semiovaleafter carotid artery occlusion: a PET study. J CerebBlood Flow Metab 19:109–14
Yamauchi H, Fukuyama H, Nagahama Y, Katsumi Y,Okazawa H (1998) Cerebral hematocrit decreases withhemodynamic compromise in carotid artery occlusion:a PET study. Stroke 29:98–103
Cerebral vascular MTT by PET and DSC-MRIM Ibaraki et al
413
Journal of Cerebral Blood Flow & Metabolism (2007) 27, 404–413
Related Documents