Dissertation ETH Zurich No. 24037 Cerebral oxygenation monitoring in neonates: improving and validating instrumentation A thesis submitted to attain the degree of DOCTOR OF SCIENCES of ETH Zurich (Dr. sc. ETH Zurich) presented by STEFAN KLEISER Dipl.-Ing., Albert-Ludwigs Universität Freiburg, Germany born on 03.03.1984 citizen of Germany accepted on the recommendation of Prof. Dr. Markus Rudin, examiner Prof. Dr. Martin Wolf, co-examiner Prof. Dr. Roger Gassert, co-examiner 2017

Welcome message from author
This document is posted to help you gain knowledge. Please leave a comment to let me know what you think about it! Share it to your friends and learn new things together.
Transcript

Dissertation ETH Zurich No. 24037
Cerebral oxygenation monitoring inneonates: improving and validating
instrumentation
A thesis submitted to attain the degree ofDOCTOR OF SCIENCES of ETH Zurich
(Dr. sc. ETH Zurich)
presented by
STEFAN KLEISER
Dipl.-Ing., Albert-Ludwigs Universität Freiburg, Germanyborn on 03.03.1984citizen of Germany
accepted on the recommendation of
Prof. Dr. Markus Rudin, examinerProf. Dr. Martin Wolf, co-examiner
Prof. Dr. Roger Gassert, co-examiner
2017


Contents
Contents i
List of Figures iii
List of Tables v
List of Abbreviations vii
Summary ix
Zusammenfassung xi
1 Introduction 11.1 Why should the oxygenation state in the brain be monitored? . . . . . . . . 11.2 Methods . . . . . . . . . . . . . . . . . . . . . . . . . . . . . . . . . . . . 2
1.2.1 Near-infrared spectroscopy . . . . . . . . . . . . . . . . . . . . . . 21.2.2 Haemoglobin . . . . . . . . . . . . . . . . . . . . . . . . . . . . . 41.2.3 Precision of NIRS oximeters . . . . . . . . . . . . . . . . . . . . . . 51.2.4 NIRS oximeter validation and comparison . . . . . . . . . . . . . . 6
1.3 Objectives and outline . . . . . . . . . . . . . . . . . . . . . . . . . . . . 9
2 OxyPrem v1.2 132.1 Introduction to OxyPrem v1.2 . . . . . . . . . . . . . . . . . . . . . . . . 132.2 First OxyPrem v1.2 liquid phantom study
[Hyttel-Sorensen et al., 2013b] . . . . . . . . . . . . . . . . . . . . . . . . 162.2.1 Motivation . . . . . . . . . . . . . . . . . . . . . . . . . . . . . . . 162.2.2 Introduction . . . . . . . . . . . . . . . . . . . . . . . . . . . . . . 172.2.3 Methods . . . . . . . . . . . . . . . . . . . . . . . . . . . . . . . . 182.2.4 Results . . . . . . . . . . . . . . . . . . . . . . . . . . . . . . . . 222.2.5 Discussion . . . . . . . . . . . . . . . . . . . . . . . . . . . . . . . 24
2.3 Phantom experiment varying optical properties[Kleiser et al., 2016a] . . . . . . . . . . . . . . . . . . . . . . . . . . . . . 282.3.1 Motivation . . . . . . . . . . . . . . . . . . . . . . . . . . . . . . . 282.3.2 Introduction . . . . . . . . . . . . . . . . . . . . . . . . . . . . . . 292.3.3 Methods . . . . . . . . . . . . . . . . . . . . . . . . . . . . . . . . 302.3.4 Results . . . . . . . . . . . . . . . . . . . . . . . . . . . . . . . . 312.3.5 Discussion and Conclusion . . . . . . . . . . . . . . . . . . . . . . 31
2.4 OxyPrem v1.2 in vivo evaluation . . . . . . . . . . . . . . . . . . . . . . . 352.4.1 Performance in adults . . . . . . . . . . . . . . . . . . . . . . . . . 352.4.2 Performance in neonates . . . . . . . . . . . . . . . . . . . . . . . . 362.4.3 Agreement of in vivo and phantom experiments . . . . . . . . . . . . 38
2.5 Summary on OxyPrem v1.2 . . . . . . . . . . . . . . . . . . . . . . . . . . 39
3 OxyPrem v1.3 413.1 Introduction . . . . . . . . . . . . . . . . . . . . . . . . . . . . . . . . . . 413.2 In vivo validation in neonates . . . . . . . . . . . . . . . . . . . . . . . . . 44
3.2.1 Introduction and methods . . . . . . . . . . . . . . . . . . . . . . . 443.2.2 Results . . . . . . . . . . . . . . . . . . . . . . . . . . . . . . . . 44
i

CONTENTS
3.2.3 Discussion . . . . . . . . . . . . . . . . . . . . . . . . . . . . . . . 513.2.4 Conclusion . . . . . . . . . . . . . . . . . . . . . . . . . . . . . . . 53
3.3 Summary on OxyPrem v1.3 . . . . . . . . . . . . . . . . . . . . . . . . . . 53
4 Phantom set-up for quantitative oximeter comparison 554.1 Improved liquid phantom set-up . . . . . . . . . . . . . . . . . . . . . . . 55
4.1.1 Introduction . . . . . . . . . . . . . . . . . . . . . . . . . . . . . . 554.1.2 Set-up description . . . . . . . . . . . . . . . . . . . . . . . . . . . 554.1.3 Homogeneity test . . . . . . . . . . . . . . . . . . . . . . . . . . . 594.1.4 Effect of yeast on device readings . . . . . . . . . . . . . . . . . . . 59
4.2 Application of the set-up . . . . . . . . . . . . . . . . . . . . . . . . . . . 634.3 Quantitative comparison of oximeters
[Kleiser et al., 2016b] . . . . . . . . . . . . . . . . . . . . . . . . . . . . . 634.3.1 Introduction . . . . . . . . . . . . . . . . . . . . . . . . . . . . . . 644.3.2 Methods and Materials . . . . . . . . . . . . . . . . . . . . . . . . 664.3.3 Results . . . . . . . . . . . . . . . . . . . . . . . . . . . . . . . . 744.3.4 Discussion . . . . . . . . . . . . . . . . . . . . . . . . . . . . . . . 784.3.5 Conclusion . . . . . . . . . . . . . . . . . . . . . . . . . . . . . . . 82
4.4 Extended oximeter comparison . . . . . . . . . . . . . . . . . . . . . . . . 844.4.1 Methods . . . . . . . . . . . . . . . . . . . . . . . . . . . . . . . . 844.4.2 Results . . . . . . . . . . . . . . . . . . . . . . . . . . . . . . . . 864.4.3 Discussion . . . . . . . . . . . . . . . . . . . . . . . . . . . . . . . 934.4.4 Conclusion . . . . . . . . . . . . . . . . . . . . . . . . . . . . . . . 97
4.5 Effect of superficial layer thickness[Nasseri et al., 2016a] . . . . . . . . . . . . . . . . . . . . . . . . . . . . . 984.5.1 Introduction . . . . . . . . . . . . . . . . . . . . . . . . . . . . . . 994.5.2 Materials and methods . . . . . . . . . . . . . . . . . . . . . . . . 1014.5.3 Results . . . . . . . . . . . . . . . . . . . . . . . . . . . . . . . . 1064.5.4 Discussion . . . . . . . . . . . . . . . . . . . . . . . . . . . . . . . 1114.5.5 Conclusion . . . . . . . . . . . . . . . . . . . . . . . . . . . . . . . 114
4.6 Investigation of superficial effects[Stachel, 2016] . . . . . . . . . . . . . . . . . . . . . . . . . . . . . . . . . 1154.6.1 Introduction . . . . . . . . . . . . . . . . . . . . . . . . . . . . . . 1164.6.2 Methods . . . . . . . . . . . . . . . . . . . . . . . . . . . . . . . . 1184.6.3 Results . . . . . . . . . . . . . . . . . . . . . . . . . . . . . . . . 1284.6.4 Discussion . . . . . . . . . . . . . . . . . . . . . . . . . . . . . . . 1314.6.5 Conclusion . . . . . . . . . . . . . . . . . . . . . . . . . . . . . . . 1394.6.6 Outlook . . . . . . . . . . . . . . . . . . . . . . . . . . . . . . . . 139
4.7 Summary on phantom experiments . . . . . . . . . . . . . . . . . . . . . . 140
5 Conclusions and outlook 1435.1 Conclusions . . . . . . . . . . . . . . . . . . . . . . . . . . . . . . . . . . 1435.2 Outlook . . . . . . . . . . . . . . . . . . . . . . . . . . . . . . . . . . . . 144
Bibliography 147
Acknowledgements 163
ii

List of Figures
2.1 Picture of OxyPrem v1.2 . . . . . . . . . . . . . . . . . . . . . . . . . . . . . 142.2 Picture of the phantom setup . . . . . . . . . . . . . . . . . . . . . . . . . . . 192.3 Schematic representation of the phantom setup . . . . . . . . . . . . . . . . . 202.4 INVOS adult vs. transformed OxyPrem . . . . . . . . . . . . . . . . . . . . . 222.5 Time series . . . . . . . . . . . . . . . . . . . . . . . . . . . . . . . . . . . . . 232.6 INVOS adult vs. INVOS Pediatric and INVOS adult vs. NIRO-300 . . . . . 242.7 Picture of the phantom setup . . . . . . . . . . . . . . . . . . . . . . . . . . . 322.8 All oximeters vs. OxiplexTS . . . . . . . . . . . . . . . . . . . . . . . . . . . . 322.9 Time series experiment 1 . . . . . . . . . . . . . . . . . . . . . . . . . . . . . 322.10 Time series experiment 2 . . . . . . . . . . . . . . . . . . . . . . . . . . . . . 322.11 NIRO-300 vs. OxiplexTS with 98 % water assumption . . . . . . . . . . . . . 332.12 OxiplexTS without vs. OxiplexTS with 98 % water assumption . . . . . . . . 33
3.1 Picture of OxyPrem v1.3 . . . . . . . . . . . . . . . . . . . . . . . . . . . . . 413.2 Arrangement of OxyPrem v1.3 sources and detectors . . . . . . . . . . . . . . 423.3 Boxplot of R1 data (temporal sensor) . . . . . . . . . . . . . . . . . . . . . . . 483.4 Boxplot of R2 data (temporal sensor) . . . . . . . . . . . . . . . . . . . . . . . 483.5 Boxplot of Rave data (temporal sensor) . . . . . . . . . . . . . . . . . . . . . . 483.6 Boxplot of SpO2 data . . . . . . . . . . . . . . . . . . . . . . . . . . . . . . . 483.7 Boxplot of Rave data (occipital sensor) . . . . . . . . . . . . . . . . . . . . . . 493.8 Plot of std(SpO2) . . . . . . . . . . . . . . . . . . . . . . . . . . . . . . . . . 493.9 Typical aligned time series of StO2 and SpO2 . . . . . . . . . . . . . . . . . . 503.10 Typical Z-score of StO2 and SpO2 . . . . . . . . . . . . . . . . . . . . . . . . 503.11 Typical StO2 time series of R1 and R2 (temporal sensor) . . . . . . . . . . . . 51
4.1 Picture of the complete phantom set-up . . . . . . . . . . . . . . . . . . . . . 564.2 Picture of the phantom set-up with NIRS sensors mounted . . . . . . . . . . 564.3 Picture of reference sensors inside the phantom container . . . . . . . . . . . 564.4 Picture showing cable entry directions . . . . . . . . . . . . . . . . . . . . . . 574.5 Picture of window and sensor . . . . . . . . . . . . . . . . . . . . . . . . . . . 574.6 Picture of the phantom container with widow mounted . . . . . . . . . . . . . 584.7 Picture of reference sensors with gaskets . . . . . . . . . . . . . . . . . . . . . 584.8 Stability of pO2 without yeast . . . . . . . . . . . . . . . . . . . . . . . . . . . 584.9 Picture of the phantom container with reference sensors at lowest position . . 594.10 Picture of the phantom container with reference sensors at highest position . 594.11 Gradient measurement . . . . . . . . . . . . . . . . . . . . . . . . . . . . . . . 604.12 StO2 bubbling N2 vs. yeast . . . . . . . . . . . . . . . . . . . . . . . . . . . . 614.13 Scattering bubbling N2 vs. yeast . . . . . . . . . . . . . . . . . . . . . . . . . 624.14 NIRO 200 small vs. OxiplexTS for bubbling N2 vs. yeast . . . . . . . . . . . 624.15 FORE-SIGHT small vs. OxiplexTS for bubbling N2 vs. yeast . . . . . . . . . 624.16 INVOS neonatal vs. OxiplexTS for bubbling N2 vs. yeast . . . . . . . . . . . 624.17 Spectrum of oxy-haemoglobin (O2Hb) in the range 520 nm ≤ λ ≤ 600 nm. . . 694.18 Interval signal of O2Hb. . . . . . . . . . . . . . . . . . . . . . . . . . . . . . . 694.19 Phantom container side view . . . . . . . . . . . . . . . . . . . . . . . . . . . 704.20 Phantom container cross section . . . . . . . . . . . . . . . . . . . . . . . . . 704.21 Time series phantom 1 . . . . . . . . . . . . . . . . . . . . . . . . . . . . . . . 754.22 Time series phantom 2 . . . . . . . . . . . . . . . . . . . . . . . . . . . . . . . 754.23 OxyVLS vs. OxiplexTS . . . . . . . . . . . . . . . . . . . . . . . . . . . . . . 764.24 OxyPrem v1.3 vs. OxiplexTS . . . . . . . . . . . . . . . . . . . . . . . . . . . 76
iii

LIST OF FIGURES
4.25 INVOS adult vs. OxiplexTS . . . . . . . . . . . . . . . . . . . . . . . . . . . . 774.26 INVOS neonatal vs. OxiplexTS . . . . . . . . . . . . . . . . . . . . . . . . . . 774.27 Nonin neonatal vs. OxiplexTS . . . . . . . . . . . . . . . . . . . . . . . . . . 774.28 All oximeters vs. OxiplexTS for ctHb = 45 µM . . . . . . . . . . . . . . . . . . 774.29 FORE-SIGHT small with fixation band vs. OxiplexTS . . . . . . . . . . . . . 874.30 FORE-SIGHT small vs. OxiplexTS . . . . . . . . . . . . . . . . . . . . . . . . 874.31 FORE-SIGHT adult vs. OxiplexTS . . . . . . . . . . . . . . . . . . . . . . . . 884.32 Nonin adult vs. OxiplexTS . . . . . . . . . . . . . . . . . . . . . . . . . . . . 884.33 NIRO-200NX small reusable vs. OxiplexTS . . . . . . . . . . . . . . . . . . . 894.34 NIRO-200NX small single-use vs. OxiplexTS . . . . . . . . . . . . . . . . . . 894.35 NIRO-200NX large reusable vs. OxiplexTS . . . . . . . . . . . . . . . . . . . 894.36 NIRO-200NX large single-use vs. OxiplexTS . . . . . . . . . . . . . . . . . . 894.37 INVOS adult vs. OxiplexTS . . . . . . . . . . . . . . . . . . . . . . . . . . . . 904.38 Oxyprem v1.3 vs. OxiplexTS . . . . . . . . . . . . . . . . . . . . . . . . . . . 904.39 In vivo data from Hessel et al. compared to in vitro results . . . . . . . . . . 924.40 Histogram of in vivo data from Hessel et al. . . . . . . . . . . . . . . . . . . . 934.41 Schematic representation of the phantom setup . . . . . . . . . . . . . . . . . 1024.42 Absorption spectrum of HHb . . . . . . . . . . . . . . . . . . . . . . . . . . . 1054.43 Time series . . . . . . . . . . . . . . . . . . . . . . . . . . . . . . . . . . . . . 1074.44 All individual oximeters vs. OxyVLS . . . . . . . . . . . . . . . . . . . . . . . 1084.45 Sensitivity trend of all individual oximeters . . . . . . . . . . . . . . . . . . . 1094.46 Sensitivity trend of CW vs. FD oximeters . . . . . . . . . . . . . . . . . . . . 1094.47 Time series of in vivo measurement . . . . . . . . . . . . . . . . . . . . . . . . 1104.48 Optical properties of fresh yeast. . . . . . . . . . . . . . . . . . . . . . . . . . 1214.49 Basic measurement setup . . . . . . . . . . . . . . . . . . . . . . . . . . . . . 1224.50 Clear layer measurement setup. . . . . . . . . . . . . . . . . . . . . . . . . . . 1244.51 Melanin experiment setup . . . . . . . . . . . . . . . . . . . . . . . . . . . . . 1254.52 Melanin compared to foil (Lee, 113 magenta) . . . . . . . . . . . . . . . . . . 1264.53 113 magenta transmittance . . . . . . . . . . . . . . . . . . . . . . . . . . . . 1264.54 Illustration of brain shape and cerebro spinal fluid . . . . . . . . . . . . . . . 1274.55 cerebro spinal fluid (CSF) phantom construction. . . . . . . . . . . . . . . . . 1294.56 CSF experiment setup . . . . . . . . . . . . . . . . . . . . . . . . . . . . . . . 1304.57 Time series of the CSF experiment . . . . . . . . . . . . . . . . . . . . . . . . 1314.58 Baseline measurements . . . . . . . . . . . . . . . . . . . . . . . . . . . . . . . 1344.59 Foresight results . . . . . . . . . . . . . . . . . . . . . . . . . . . . . . . . . . 1354.60 NIRO-200NX results . . . . . . . . . . . . . . . . . . . . . . . . . . . . . . . . 1364.61 INVOS results . . . . . . . . . . . . . . . . . . . . . . . . . . . . . . . . . . . 137
iv

List of Tables
2.1 Co-oximetry and blood gas analysis results . . . . . . . . . . . . . . . . . . . 232.2 Study population . . . . . . . . . . . . . . . . . . . . . . . . . . . . . . . . . . 362.3 Precision data for OxyPrem v1.2 . . . . . . . . . . . . . . . . . . . . . . . . . 372.4 Precision results for OxyPrem v1.2 in neonates . . . . . . . . . . . . . . . . . 37
3.1 Study population . . . . . . . . . . . . . . . . . . . . . . . . . . . . . . . . . . 453.2 Precision data for OxyPrem v1.3 R1 . . . . . . . . . . . . . . . . . . . . . . . 463.3 Precision data for OxyPrem v1.3 Rave . . . . . . . . . . . . . . . . . . . . . . 473.4 Precision results for OxyPrem v1.3 in neonates . . . . . . . . . . . . . . . . . 49
4.1 Sensor overview . . . . . . . . . . . . . . . . . . . . . . . . . . . . . . . . . . . 684.2 Phantom ingredients . . . . . . . . . . . . . . . . . . . . . . . . . . . . . . . . 724.3 Experimental procedure . . . . . . . . . . . . . . . . . . . . . . . . . . . . . . 734.4 Range of pCO2, pH, and T . . . . . . . . . . . . . . . . . . . . . . . . . . . . 734.5 Conversion table . . . . . . . . . . . . . . . . . . . . . . . . . . . . . . . . . . 784.6 Intervention thresholds and their dependence on ctHb . . . . . . . . . . . . . . 784.7 Phantom ingredients . . . . . . . . . . . . . . . . . . . . . . . . . . . . . . . . 864.8 Table of conversion to OxiplexTS . . . . . . . . . . . . . . . . . . . . . . . . . 874.9 Intervention thresholds and their dependence on ctHb . . . . . . . . . . . . . . 884.10 Conversion table part 1 . . . . . . . . . . . . . . . . . . . . . . . . . . . . . . 904.11 Conversion table part 2 . . . . . . . . . . . . . . . . . . . . . . . . . . . . . . 914.12 Conversion table part 3 . . . . . . . . . . . . . . . . . . . . . . . . . . . . . . 914.13 Optical properties of phantom and windows . . . . . . . . . . . . . . . . . . . 1024.14 Range of pH, T , and pCO2 . . . . . . . . . . . . . . . . . . . . . . . . . . . . 1034.15 NIRS oximeter overview . . . . . . . . . . . . . . . . . . . . . . . . . . . . . . 1044.16 Sensor placement overview . . . . . . . . . . . . . . . . . . . . . . . . . . . . . 1044.17 Subject adipose tissue thickness . . . . . . . . . . . . . . . . . . . . . . . . . . 1064.18 Window StO2 . . . . . . . . . . . . . . . . . . . . . . . . . . . . . . . . . . . . 1104.19 In vitro error before and after calibration . . . . . . . . . . . . . . . . . . . . 1114.20 Window recipes . . . . . . . . . . . . . . . . . . . . . . . . . . . . . . . . . . . 1184.21 Blood bags . . . . . . . . . . . . . . . . . . . . . . . . . . . . . . . . . . . . . 1194.22 Liquid phantom recipe . . . . . . . . . . . . . . . . . . . . . . . . . . . . . . . 1204.23 Fit to baseline measurements . . . . . . . . . . . . . . . . . . . . . . . . . . . 1324.24 Fit to all measurements . . . . . . . . . . . . . . . . . . . . . . . . . . . . . . 1334.25 Acceptable and unacceptable measurement conditions . . . . . . . . . . . . . 134
v


List of Abbreviations
λ wavelengthµa absorption coefficient
µ′
s reduced scattering coefficientT temperaturecDPG 2,3-diphosphoglycerate concentrationcHHb deoxy-haemoglobin concentrationcO2Hb oxy-haemoglobin concentrationctHb total haemoglobin concentrationAPD average penetration depthATT adipose tissue thicknessave averageBMI body mass indexBORL Biomedical Optics Research LaboratoryCBV cerebral blood volumeCO2 carbon dioxideCSF cerebro spinal fluidCW continuous-waveDPG 2,3-diphosphoglycerateEMI electro-magnetic interferenceFD frequency domainFiO2 fraction of inspired oxygenFTOE fractional tissue oxygen extractionFWHM full width at half maximumGA gestational ageH2O waterHb haemoglobinHC head circumfereHHb deoxy-haemoglobinhtc haematocritICU intensive care unitIL intralipidIVH intraventricular hemorrhageLED light-emitting diodelme linear mixed effects modelMAD median absolute deviationN2 nitrogenNICU neonatal intensive care unitNIR near-infraredNIRS near-infrared spectroscopyO2 oxygenO2Hb oxy-haemoglobin
vii

List of Abbreviations
p50 pO2 at which SO2 = 50 %PBS phosphate buffered salinePCB printed circuit boardpCO2 carbon dioxide partial pressurePDA persistent ductus arteriosuspH pH-valuePMA post-menstrual agepO2 oxygen partial pressurePVL periventricular leucomalaciaRBC red blood cellRCT randomised clinical trialRMS root-mean-squareRS relative sensitivityrStO2 regional tissue oxygen haemoglobin saturationSb between-subject standard deviationSw within-subject standard deviationSafeBoosC safeguarding the brains of our smallest childrenSaO2 arterial oxygen haemoglobin saturationSBB sodium bicarbonate bufferSD standard deviationSDS source-detector separationSNR signal-to-noise ratioSO2 oxygen haemoglobin saturationSpO2 peripheral arterial oxygen haemoglobin saturationStO2 tissue oxygen haemoglobin saturationSvO2 venous oxygen haemoglobin saturationTD time domainTiO2 titanium dioxideUSZ University Hospital ZurichVLS visible-light spectroscopy
viii

Summary
The brain is a very vulnerable organ and damage to it is often followed by severeimplications such as long-term disabilities and it may even lead to death. Cerebraloximetry by near-infrared spectroscopy (NIRS) has repeatedly been cited as promis-ing technology, potentially enabling clinicians to prevent these outcomes. Pretermneonates are likely to suffer from complications leading to brain damage and maythus benefit strongly from NIRS monitoring. Although a number of commercial NIRSoximeters are clinically approved, the method has not yet been widely established.Two of the major reasons for this are poor precision of instruments and that tissueoxygen haemoglobin saturation (StO2) obtained from different oximeters and sensorsare incomparable. This thesis addresses these two problems and provides solutions.
OxyPrem was developed with the objective to provide an instrument with increasedprecision to clinicians. Two versions, OxyPrem v1.2 and v1.3, are introduced in thisthesis and their performance is validated in vivo and in vitro. Both sensors are basedon symmetric arrangement of light sources and detectors and employ a self-calibratingalgorithm.
OxyPrem v1.2 performed excellently in vivo in a precision assessment on the forearmof adults (repeatability = within-subject standard deviation (Sw) = 1.7 %). Repeata-bility in preterm neonates was Sw = 3.3% which is still good, taking into account thatSw in neonates is typically higher than in adults.
An improved version of the instrument, OxyPrem v1.3, was assessed in vivo inneonates as well. The study demonstrated Sw as good as 2.8 %. Simultaneous mea-surements with another OxyPrem v1.3 sensor and a pulse oximeter revealed unstablephysiology in some neonates. In a second analysis without these confounding sub-jects, Sw improved drastically to 1.9 % which is amongst the best precision values everachieved for NIRS oximeters.
To overcome the lack of comparability of different oximeters and sensors, we haveperformed several studies with liquid phantoms simulating optical properties of neona-tal brain tissue. We first conducted experiments with a simple, homogeneous phantomand then refined the set-up to model a more realistic two-layer geometry resemblingskull and brain. Our studies showed substantially different StO2 readings provided bydifferent oximeters which, however, were mostly linearly related. With the improvedset-up, we characterized a large number of commercially available oximeters and sen-sors and provided coefficients for their pairwise linear relation. The method showedgood repeatability and helps establishing comparability.
As neonates are a very heterogeneous group, we investigated the effect that a varia-tion in total haemoglobin concentration (ctHb) has on StO2 readings by NIRS oxime-ters. We found strong influence of ctHb on StO2 while only OxyPrem v1.3 proved tobe largely immune to this effect, which causes substantial uncertainty to readings ofother instruments.
ix

Summary
As the presented phantom set-up is very versatile, we additionally investigated sev-eral other effects with slight adaptations. These showed that StO2 readings were un-affected by a thin superficial layer, while sensitivity decreased substantially for a layerwith 16 mm thickness. In another experiment, we did not observe a change in StO2
readings for very thin clear layers such as oil on the skin of neonates, whereas thickerlayers must be avoided. Partial placement of sensors on top of hair and birth marksmay seriously flaw StO2 of sensors without symmetric source-detector arrangementand self-calibrating algorithm.
In summary, this thesis provides solutions to two of the problems mentioned mostoften in association with cerebral oxygenation monitoring by NIRS. We have intro-duced OxyPrem v1.2 and v1.3 and demonstrated superior precision of the instrumentsin vivo. OxyPrem v1.3 proved to be largely immune to variation in ctHb, which reducesthis considerable uncertainty in StO2 readings to a minimum. By a series of in vitroexperiments with liquid phantoms we were able to establish comparability of differentinstruments and systematically assessed several types of influences to StO2 readings.
x
Zusammenfassung
Das Gehirn ist ein sehr verwundbares Organ und Hirnschäden ziehen häufig schwer-wiegende Folgen wie dauerhafte Behinderungen nach sich oder führen sogar zum Tod.Zerebrales Sauerstoffmonitoring mittels Nahinfrarotspektroskopie (NIRS) wurde bere-its oft als vielversprechende Technologie bezeichnet, die helfen könnte, diese Folgenzu vermeiden. Frühgeborene leiden in vielen Fällen unter Komplikationen, die Hirn-schädigungen mit sich bringen können und können daher in besonderem Masse vonSauerstoffmonitoring durch NIRS profitieren. Obwohl es eine Reihe für den medizinis-chen Einsatz zugelassenener Geräte gibt, hat sich die Methode bisher nicht flächen-deckend durchgesetzt. Zwei der wesentlichen Gründe hierfür sind eine ungenügendePräzision (Wiederholgenauigkeit) und fehlende Vergleichbarkeit der Messewerte, dieverschiedene Geräte und Sensoren liefern. Diese Doktorarbeit liefert Lösungsansätzefür die beiden eben genannten Probleme.
OxyPrem wurde mit der Zielsetzung entwickelt, Ärzten ein präzise messendes Gerätan die Hand zu geben. Zwei Versionen des Geräts, OxyPrem v1.2 und OxyPrem v1.3,werden in dieser Doktorarbeit vorgestellt. Ihre Leistungsfähigkeit wird in vivo undin vitro validiert. Beide Sensoren basieren auf einer symmetrischen Anordnung vonLichtquellen und -detektoren und verwenden einen selbstkalibrierenden Algorithmus.
OxyPrem v1.2 lieferte eine hervorragende Präzision in vivo mit einer Wiederholge-nauigkeit im selben Probanden von Sw = 1.7 % am Unterarm von Erwachsenen. DieWiederholgenauigkeit bei Frühgeborenen betrug Sw = 3.3 %, was immer noch gut ist,wenn berücksichtigt wird, dass Sw bei Neugeborenen üblicherweise höher ist als beiErwachsenen.
Eine verbesserte Version des Geräts, OxyPrem v1.3, wurde ebenfalls in vivo un-tersucht. Die Studie ergab eine Sw von 2.8 %. Gleichzeitige Messungen mit einemweiteren OxyPrem v1.3 Sensor und einem Pulsoximeter zeigten jedoch, dass einigeder Probanden starke physiologische Schwankungen aufzeigten. Eine zweite Analyseohne die Daten dieser die Messung verfälschenden Probanden ergab eine wesentlichbessere Sw von 1.9 %, was einen der besten jemals erzielten Präzisionswerte bei NIRSOximetern darstellt.
Um diese fehlenden Vergleichbarkeit verschiedener Geräte und Sensoren zuüberwinden, haben wir mehrere Studien mit Flüssigphantomen durchgeführt, diedas Hirngewebe von Neugeborenen simulieren. Ausgehend von ersten Experimentenmit einem einfachen, homogenen Phantom, haben wir den Messaufbau erweitertzu einem realistischeren zweischichtigen Aufbau, der den Schädel und das Hirnnachbildete. Unsere Studien zeigten erhebliche Unterschiede zwischen den StO2
Werten verschiedener Geräte, die jedoch zumeist lineare Beziehungen aufwiesen. Mitdiesem verbesserten Messaufbau haben wir eine grosse Anzahl kommerzieller Geräteund Sensoren charakterisiert und die Koeffizienten der paarweisen Beziehungenberechnet. Die Methode zeigte eine gute Wiederholgenauigkeit und leistet einen
xi

Zusammenfassung
Beitrag zur Herstellung von Vergleichbarkeit zwischen verschiedenen Geräten undSensoren.
Da Neugeborene eine sehr heterogene Gruppe darstellen, haben wir den Effekt einerVariation des Hämoglobingehalts (ctHb) im Flüssigphantom auf die StO2 Werte vonNIRS Geräten untersucht. Wir fanden heraus, dass dies einen grossen Einfluss hatund nur OxyPrem v1.3 weitestgehend unbeeinflusst war von diesem Effekt, der eineerhebliche Unsicherheit in die Interpretation der Messwerte bringt.
Da der Messaufbau sehr vielseitig verwendbar und leicht veränderbar ist, habenwir weitere Effekte untersucht. StO2 Messungen waren von dünnen, oberflächlichenSchichten nicht beeinflusst, aber die Empfindlichkeit war erheblich niedriger für eineSchicht von 16 mm Dicke. Ferner zeigten wir, dass sehr dünne, durchsichtige Schichtendie NIRS Messung nicht beeinflussen, während dickere, klare Schichten unbedingt ver-mieden werden müssen. Die Platzierung eines Teils des Sensors auf Haaren oder Leber-flecken ist hochproblematisch ist für Sensoren, die keine symmetrische Anordnung vonLichtquellen und -detetektoren und keine selbstkalibrierenden Algorithmus aufweisen.
Diese Doktorarbeit bietet Lösungen für zwei der im Zusammenhang mit zerebralemSauersfoffmonitoring durch NIRS meistgenannten Probleme. OxyPrem v1.2 und v1.3wurden vorgestellt und deren herausragende Präzision in vivo gezeigt. Es konntegezeigt werden, dass OxyPrem v1.3 weitestgehend unbeeinflusst ist von Änderungendes Hämoglobingehalts im Gewebe, was diese bedeutsame Quelle für Messfehler inStO2 auf ein Minimum reduziert. Durch eine in vitro Messreihe konnten wir Vergle-ichbarkeit zwischen verschiedenen Geräten schaffen und verschiedene Einflüsse auf dieStO2 Bestimmung systematisch untersuchen.
xii

1 Introduction
1.1 Why should the oxygenation state in the brain bemonitored?
The brain is one of the most fascinating organs. With our brain we can performcomplex actions and solve non-trivial problems. The brain also ultimately defineswho we are. It controls many of our body functions and its correct functioning isessential for living what we consider a normal life. However, the brain is also a veryvulnerable organ. Therefore, nature decided to protect it by a layer of bone, the skull,and stores it floating in liquid to prevent damage through mechanical shocks in fightsand accidents.
The brain consumes a major part of energy and is therefore one of the best-suppliedorgans [McBryde et al., 2016] with blood delivering this energy. The brain needsa steady supply with oxygen to metabolize nutrients to provide its function[Steinback and Poulin, 2016]. In contrast to other tissues such as muscle, thebrain takes damage already when it is under-supplied with oxygen for a fewminutes. Brain damage may happen locally and impair specific functions likespeech or motor function for example after a stroke. Severe brain damage mayeven lead to death. Although the brain shows some plasticity and some parts ofthe brain are able to take over functions from damaged parts to a certain degree[Werner and Stevens, 2015], this is a slow process requiring a lot of training by theaffected person [Pin-Barre and Laurin, 2015].
In critical clinical situations or high risk patients, monitoring of the oxygenationstate of the brain may therefore help to prevent possible brain damage, which isoften associated with poor outcomes such as disabilities or death. Currently, brainmonitoring is being performed increasingly in intensive care, surgery, and anesthesia[Scheeren et al., 2012].
Preterm neonates are a high-risk group. Preterm birth complications are nowadaysthe most common cause of death before 5 years of age [Liu et al., 2014]. Pretermneonates are born before all their organs have had the time to develop to a state wherethey are fully functioning. Many systems like the circulatory system are therefore notworking as stably as in term-borns or adults. The lungs are immature and maydevelop conditions requiring respiratory support. Right after birth there is still ashunt (ductus arteriosus) which reduces blood flow through the lung. If there is adelay in closing, then this persistent ductus arteriosus (PDA) can lead to reducedarterial oxygen haemoglobin saturation (SaO2) and impairs oxygen delivery to thebody by the circulatory system [Wolf et al., 2012]. Several stress factors may causelow blood pressure (hypotension), worsening the situation.
Unfortunately, unstable systemic oxygen supply is not the only danger to the neona-
1

1 Introduction
tal brain. The vessel system in the brain of preterm neonates often cannot regulateits blood supply well. When changes in blood pressure occur, a condition whichis called impaired auto-regulation, this can cause both over-perfusion and under-perfusion (ischemia). The result is either too little (hypoxia) ot too much oxygen (hy-peroxia) being delivered to the tissue which is in both cases undesirable [Volpe, 2009,Greisen et al., 2011].
Especially to the young brain of preterm neonates which is still under development,phases of hypoxia and ischemia may increase the likeliness of incidence for several seri-ous pathologies like intraventricular hemorrhage (IVH) and periventricular leucomala-cia (PVL) [Volpe, 2009]. These are linked with poor health conditions such as impairedcognitive development, long term disabilities and death. In Europe for example, everyyear 25000 children are born below gestational age (GA) of 28 weeks. 5000 of these die[Greisen et al., 2016] and about 25 % of the remaining 20000 ’survivors grow up witheither cerebral palsy or low intelligence quotient’ [Greisen et al., 2011]. Generally, theyounger the preterm neonate, the worse the expected outcome. For example the riskof cerebral palsy increases from 1/1000 in term-borns to 1/100 in preterm-borns at 34weeks GA and 1/10 in preterm-borns at 26 weeks GA [Greisen et al., 2016]. There-fore, for these youngest children, monitoring of the oxygenation state of the brainmay help to prevent brain damage and thus possibly has a very positive impact onthese patients [Greisen et al., 2011]. Unfortunately, such monitoring is currently notpart of standard clinical care because clear evidence of clinical benefit is still lacking[Greisen et al., 2016].
A group of European neonatologists who are convinced that monitoring of the oxy-genation state of the brain could help improve the long-term outcome of their tinypatients formed the safeguarding the brains of our smallest children (SafeBoosC)-consortium several years ago [Greisen et al., 2011]. They elaborated a treatmentguideline [Pellicer et al., 2013] which attempts to maintain tissue oxygen haemoglobinsaturation (StO2) in the brain within certain bounds and provides further crite-ria to assist clinicians in decision-making. Applicability of the protocol in clinicalpractice has been shown in a small phase 1 trial in Copenhagen with 10 pretermneonates [Hyttel-Sorensen et al., 2013a]. The phase 2 trial already included 166 in-fants in several neonatal intensive care units (NICUs) throughout Europe. It wasshown that cerebral oxygenation monitoring in combination with the treatment guide-line can significantly lower the time and magnitude outside the StO2 target range[Hyttel-Sorensen et al., 2015]. The study was not powered to show statistically sig-nificant reductions in severe brain damage and mortality [Plomgaard et al., 2016b,Plomgaard et al., 2016a] which is why an even larger phase 3 trial is currently beingprepared.
1.2 Methods
1.2.1 Near-infrared spectroscopy
Near-infrared spectroscopy (NIRS) is a method which uses near-infrared (NIR) lightto investigate a tissue of interest. The tissue is illuminated with light at different
2
1.2 Methods
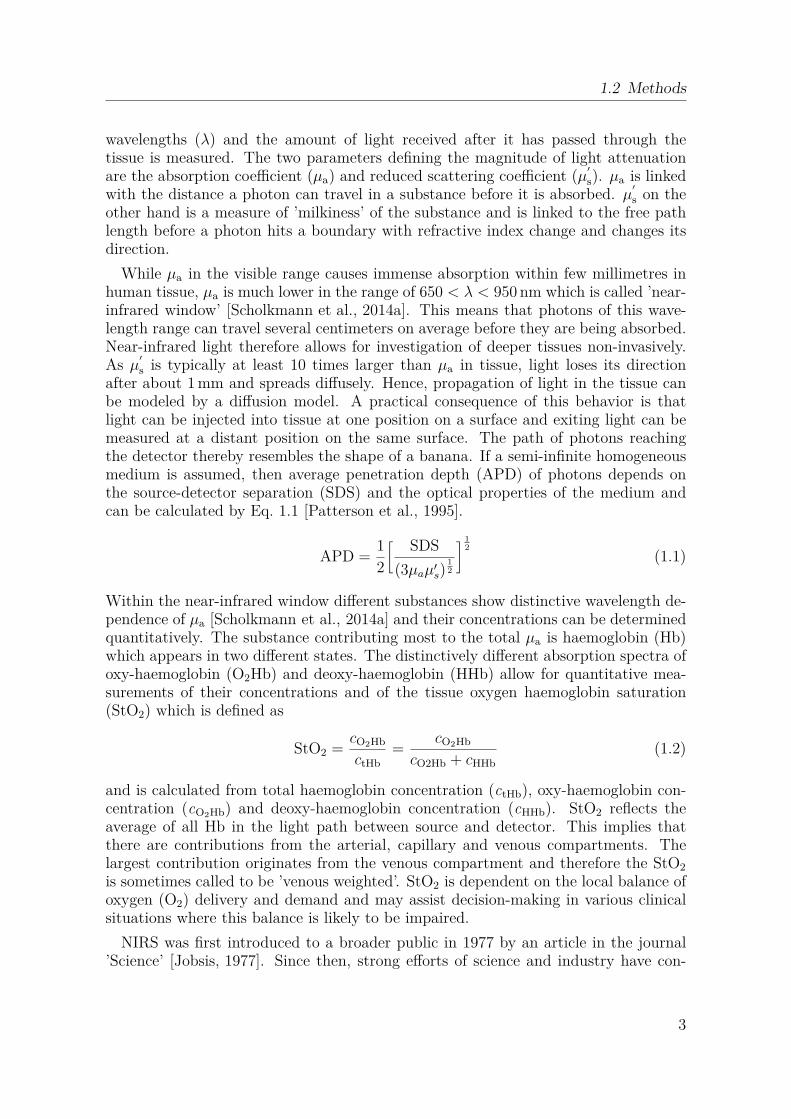
wavelengths (λ) and the amount of light received after it has passed through thetissue is measured. The two parameters defining the magnitude of light attenuationare the absorption coefficient (µa) and reduced scattering coefficient (µ
′
s). µa is linkedwith the distance a photon can travel in a substance before it is absorbed. µ
′
s on theother hand is a measure of ’milkiness’ of the substance and is linked to the free pathlength before a photon hits a boundary with refractive index change and changes itsdirection.
While µa in the visible range causes immense absorption within few millimetres inhuman tissue, µa is much lower in the range of 650 < λ < 950 nm which is called ’near-infrared window’ [Scholkmann et al., 2014a]. This means that photons of this wave-length range can travel several centimeters on average before they are being absorbed.Near-infrared light therefore allows for investigation of deeper tissues non-invasively.As µ
′
s is typically at least 10 times larger than µa in tissue, light loses its directionafter about 1 mm and spreads diffusely. Hence, propagation of light in the tissue canbe modeled by a diffusion model. A practical consequence of this behavior is thatlight can be injected into tissue at one position on a surface and exiting light can bemeasured at a distant position on the same surface. The path of photons reachingthe detector thereby resembles the shape of a banana. If a semi-infinite homogeneousmedium is assumed, then average penetration depth (APD) of photons depends onthe source-detector separation (SDS) and the optical properties of the medium andcan be calculated by Eq. 1.1 [Patterson et al., 1995].
APD =12
[ SDS
(3µaµ′s)
1
2
]1
2
(1.1)
Within the near-infrared window different substances show distinctive wavelength de-pendence of µa [Scholkmann et al., 2014a] and their concentrations can be determinedquantitatively. The substance contributing most to the total µa is haemoglobin (Hb)which appears in two different states. The distinctively different absorption spectra ofoxy-haemoglobin (O2Hb) and deoxy-haemoglobin (HHb) allow for quantitative mea-surements of their concentrations and of the tissue oxygen haemoglobin saturation(StO2) which is defined as
StO2 =cO2Hb
ctHb
=cO2Hb
cO2Hb + cHHb
(1.2)
and is calculated from total haemoglobin concentration (ctHb), oxy-haemoglobin con-centration (cO2Hb) and deoxy-haemoglobin concentration (cHHb). StO2 reflects theaverage of all Hb in the light path between source and detector. This implies thatthere are contributions from the arterial, capillary and venous compartments. Thelargest contribution originates from the venous compartment and therefore the StO2
is sometimes called to be ’venous weighted’. StO2 is dependent on the local balance ofoxygen (O2) delivery and demand and may assist decision-making in various clinicalsituations where this balance is likely to be impaired.
NIRS was first introduced to a broader public in 1977 by an article in the journal’Science’ [Jobsis, 1977]. Since then, strong efforts of science and industry have con-
3

1 Introduction
tinuously been improving instrumentation. Common to most NIRS oximeters withability to measure StO2 is that they send light of two or more specific wavelengthsinto tissue and that they make use of absorption measurements at several differentdistances. Such multi-distance measurements allow for algorithms which reduce theinfluence of superficial layers of tissue and cancel some instrumental as well as opticalcoupling factors which would otherwise require calibration. If symmetry is introduced,a self-calibrating algorithm may be created. The consequence of all instrumental andoptical coupling factors canceling out [Hueber et al., 1999] is a reduction in artifacts[Scholkmann et al., 2014b].
Continuous-wave (CW) NIRS oximeters represent the simplest and most affordabletype of NIRS oximeters. CW means that emitted light is either un-modulated ormodulated at frequencies in the low kHz range. CW instruments cannot differentiatebetween light attenuation by µa and µ
′
s. Therefore absolute chromophore estimationdepends on correct assumption of µ
′
s and these instruments usually only report relativechanges from baseline. StO2 can be determined on a absolute (0 % ≤ StO2 ≤ 100 %)scale because µ
′
s is a scaling factor to both cO2Hb and cHHb and cancels.Frequency domain (FD) and time domain (TD) instruments inject light modulated
at high frequency (e.g. 110 MHz) or short light pulses at high repetition rate and candetermine time of flight of photons. This allows for calculation of µ
′
s which enablesmeasurement of absolute chromophore concentrations.
Several CW NIRS oximeters are approved for clinical application [Wolf et al., 2012]and there is a rapidly increasing number of studies published applying NIRSoximeters. There are various reviews about current NIRS instrumentationwhich provide also an overview of strengths and weaknesses of the technol-ogy and discuss their clinical use in both neonatal and adult intensive caresettings [Wolf and Greisen, 2009, Wolf et al., 2012, Liem and Greisen, 2010,Kasman and Brady, 2011, Pellicer and Bravo, 2011].
1.2.2 Haemoglobin
Haemoglobin (Hb) is the molecule which causes blood to appear red. It is a proteinwhich is present in red blood cells (RBCs) in high concentrations and has four bindingsites for O2, called haem groups. This renders RBCs and the blood containing thema very efficient transport medium for O2. In capillaries inside the lung, Hb is exposedto high oxygen partial pressure (pO2) and binds O2 at almost all its haem groups inan equilibrium reaction. The high O2 load is additionally supported by low carbondioxide partial pressure (pCO2) and consequently high pH and lower temperature (T ).Consequently, an arterial oxygen haemoglobin saturation (SaO2) > 90 % is typical forhealthy adults. When blood has reached a tissue demanding O2, then Hb faces lowpO2, high pCO2, low pH and higher T , which shift the equilibrium of the Hb-O2
reaction and cause a release of O2. From there, O2 passively diffuses to the locationswhere it is required for metabolism.
This fundamental mechanism has been studied by generations of scientists.Experiments by Bohr et al. in 1904 [Bohr et al., 1904] already revealed an ’s-shape’of the binding curve with pO2 on the x-axis and oxygen haemoglobin saturation(SO2) on the y-axis. Bohr et al. also showed that addition of pCO2, which lowers
4
1.2 Methods
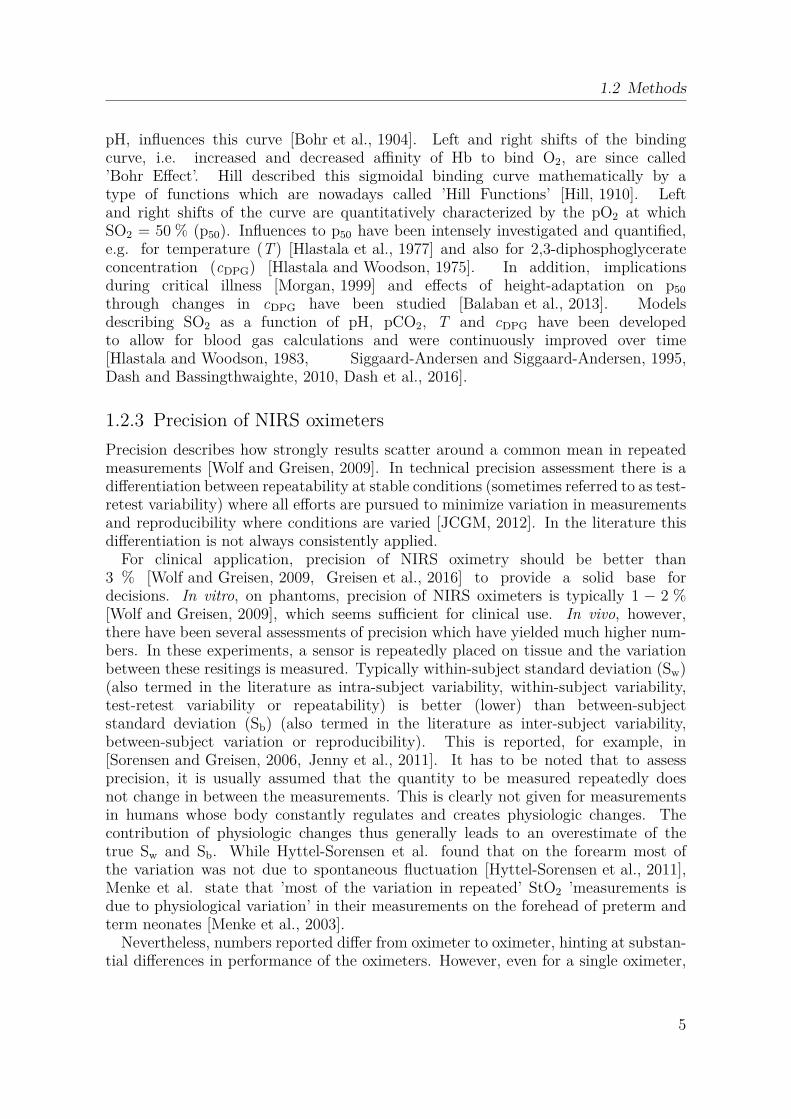
pH, influences this curve [Bohr et al., 1904]. Left and right shifts of the bindingcurve, i.e. increased and decreased affinity of Hb to bind O2, are since called’Bohr Effect’. Hill described this sigmoidal binding curve mathematically by atype of functions which are nowadays called ’Hill Functions’ [Hill, 1910]. Leftand right shifts of the curve are quantitatively characterized by the pO2 at whichSO2 = 50 % (p50). Influences to p50 have been intensely investigated and quantified,e.g. for temperature (T ) [Hlastala et al., 1977] and also for 2,3-diphosphoglycerateconcentration (cDPG) [Hlastala and Woodson, 1975]. In addition, implicationsduring critical illness [Morgan, 1999] and effects of height-adaptation on p50
through changes in cDPG have been studied [Balaban et al., 2013]. Modelsdescribing SO2 as a function of pH, pCO2, T and cDPG have been developedto allow for blood gas calculations and were continuously improved over time[Hlastala and Woodson, 1983, Siggaard-Andersen and Siggaard-Andersen, 1995,Dash and Bassingthwaighte, 2010, Dash et al., 2016].
1.2.3 Precision of NIRS oximeters
Precision describes how strongly results scatter around a common mean in repeatedmeasurements [Wolf and Greisen, 2009]. In technical precision assessment there is adifferentiation between repeatability at stable conditions (sometimes referred to as test-retest variability) where all efforts are pursued to minimize variation in measurementsand reproducibility where conditions are varied [JCGM, 2012]. In the literature thisdifferentiation is not always consistently applied.
For clinical application, precision of NIRS oximetry should be better than3 % [Wolf and Greisen, 2009, Greisen et al., 2016] to provide a solid base fordecisions. In vitro, on phantoms, precision of NIRS oximeters is typically 1 − 2 %[Wolf and Greisen, 2009], which seems sufficient for clinical use. In vivo, however,there have been several assessments of precision which have yielded much higher num-bers. In these experiments, a sensor is repeatedly placed on tissue and the variationbetween these resitings is measured. Typically within-subject standard deviation (Sw)(also termed in the literature as intra-subject variability, within-subject variability,test-retest variability or repeatability) is better (lower) than between-subjectstandard deviation (Sb) (also termed in the literature as inter-subject variability,between-subject variation or reproducibility). This is reported, for example, in[Sorensen and Greisen, 2006, Jenny et al., 2011]. It has to be noted that to assessprecision, it is usually assumed that the quantity to be measured repeatedly doesnot change in between the measurements. This is clearly not given for measurementsin humans whose body constantly regulates and creates physiologic changes. Thecontribution of physiologic changes thus generally leads to an overestimate of thetrue Sw and Sb. While Hyttel-Sorensen et al. found that on the forearm most ofthe variation was not due to spontaneous fluctuation [Hyttel-Sorensen et al., 2011],Menke et al. state that ’most of the variation in repeated’ StO2 ’measurements isdue to physiological variation’ in their measurements on the forehead of preterm andterm neonates [Menke et al., 2003].
Nevertheless, numbers reported differ from oximeter to oximeter, hinting at substan-tial differences in performance of the oximeters. However, even for a single oximeter,
5

1 Introduction
the values published for precision vary from study to study, depending on the subjectsincluded: Reported precision estimates for the NIRO-300 (Hamamatsu) are for exam-ple Sw = 5.2 % and Sb = 6.9 % in neonates [Sorensen and Greisen, 2006], Sw = 6.1 %in anesthetized children [Dullenkopf et al., 2003] and Sw = 4.1 % on the adult forearm[Hyttel-Sorensen et al., 2011]. For the INVOS 5100C adult SomaSensor (Medtronic),precision has been quantified to 6.7 % in neonates [Hyttel-Sorensen et al., 2014b]and Sw = 7.1 % in anesthetized children [Dullenkopf et al., 2003], whereas onthe adult forearm Sw = 5.4 % [Hyttel-Sorensen et al., 2011] and Sw = 3.6 %[Hyttel-Sorensen et al., 2014a] have been reported when varying the location slightlyand Sw = 2.9 % [Hyttel-Sorensen et al., 2014a] when limiting spatial variation.
This shows that besides differences in oximeter performance there are several otherfactors influencing results of this kind of experiments. Some of these are the typeof subjects, i.e adults or neonates, the exact tissue where the sensor is placed, thehomogeneity of the tissue [Arri et al., 2011], the spatial variation in placement, thephysiological condition of the subjects and their level of rest, e.g. whether they aresitting or lying. The numbers presented above show, for example, that precisiondetermined on the head of neonates is worse than on the adult forearm with the sameoximeter and sensor.
However, there is hope that repeatability below 3 % is possible. For example,repeatability in neonates has been reported as good as Sw = 1.7% [Menke et al., 2003]with a device that was showing little sensitivity to oxygenation changes[Wolf et al., 1998]. Sw = 2.76 % and Sb = 4.2 % were achieved with a prototypeemploying a self-calibrating algorithm [Jenny et al., 2011, Hueber et al., 1999]. Thissuggests that instrumentation can be improved and clinically acceptable repeatabilityand reproducibility can be achieved.
1.2.4 NIRS oximeter validation and comparison
Unsatisfactory reproducibility is not the only problem hampering wider clinical use ofNIRS oximetry. Another problem is that in vivo data published for the same groupsof patients is very heterogeneous and seems to be not only dependent on the oximeterbut also on the type of sensor [Dullenkopf et al., 2003] and even the individual sensorused [Sorensen et al., 2008]. Therefore, comparison of data in the literature is difficultand findings cannot be directly transferred to measurements performed with a differentinstrument. This lack of comparability is a major factor preventing StO2 readings byNIRS from being well understood by clinicians and the technology being more widelyused in hospitals. There is currently no binding international standard for NIRSoximeters, but there is one being prepared which may in the future help to resolve thisissue. Although there is no agreement yet on how comparability can be achieved, thereare several possibilities to validate NIRS oximeters and to compare their performance.
1.2.4.1 In vivo
For example, there are attempts to determine accuracy in NIRS oximeters in vivo[Benni et al., 2005, Rais-Bahrami et al., 2006], similarly to what is done for calibra-tion of pulse oximeters as described in the standard ISO 80601-2-61. For this purpose,
6
1.2 Methods
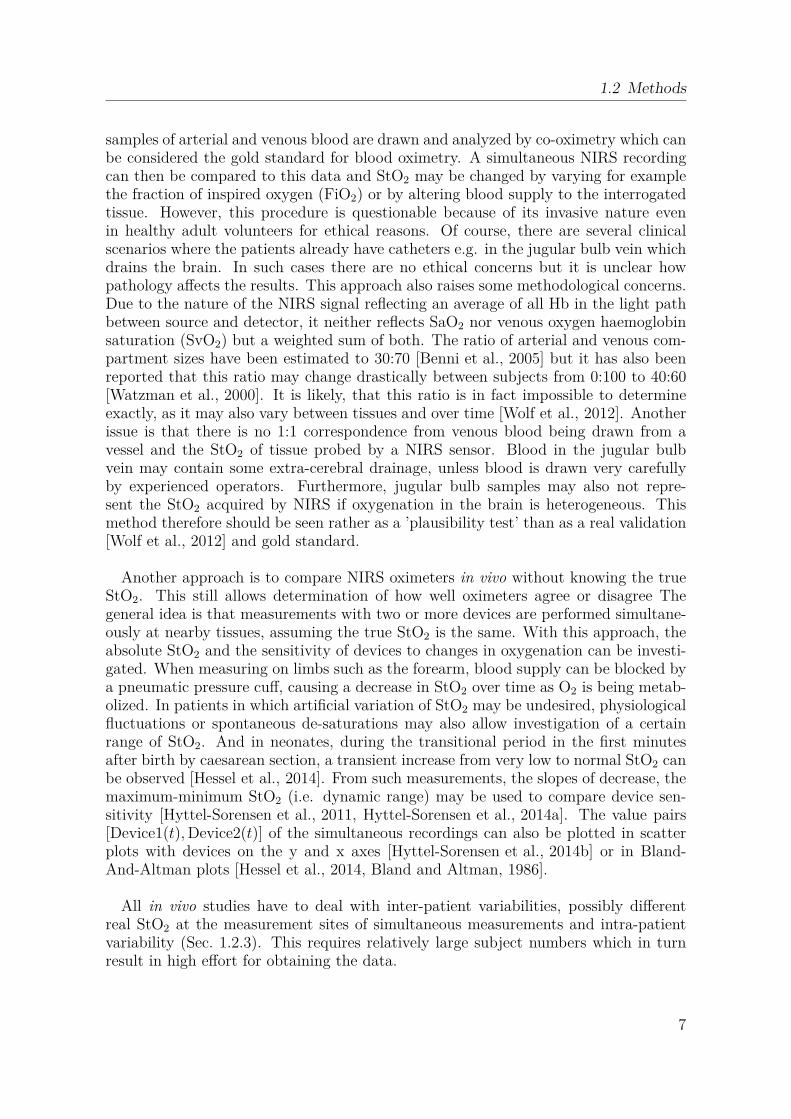
samples of arterial and venous blood are drawn and analyzed by co-oximetry which canbe considered the gold standard for blood oximetry. A simultaneous NIRS recordingcan then be compared to this data and StO2 may be changed by varying for examplethe fraction of inspired oxygen (FiO2) or by altering blood supply to the interrogatedtissue. However, this procedure is questionable because of its invasive nature evenin healthy adult volunteers for ethical reasons. Of course, there are several clinicalscenarios where the patients already have catheters e.g. in the jugular bulb vein whichdrains the brain. In such cases there are no ethical concerns but it is unclear howpathology affects the results. This approach also raises some methodological concerns.Due to the nature of the NIRS signal reflecting an average of all Hb in the light pathbetween source and detector, it neither reflects SaO2 nor venous oxygen haemoglobinsaturation (SvO2) but a weighted sum of both. The ratio of arterial and venous com-partment sizes have been estimated to 30:70 [Benni et al., 2005] but it has also beenreported that this ratio may change drastically between subjects from 0:100 to 40:60[Watzman et al., 2000]. It is likely, that this ratio is in fact impossible to determineexactly, as it may also vary between tissues and over time [Wolf et al., 2012]. Anotherissue is that there is no 1:1 correspondence from venous blood being drawn from avessel and the StO2 of tissue probed by a NIRS sensor. Blood in the jugular bulbvein may contain some extra-cerebral drainage, unless blood is drawn very carefullyby experienced operators. Furthermore, jugular bulb samples may also not repre-sent the StO2 acquired by NIRS if oxygenation in the brain is heterogeneous. Thismethod therefore should be seen rather as a ’plausibility test’ than as a real validation[Wolf et al., 2012] and gold standard.
Another approach is to compare NIRS oximeters in vivo without knowing the trueStO2. This still allows determination of how well oximeters agree or disagree Thegeneral idea is that measurements with two or more devices are performed simultane-ously at nearby tissues, assuming the true StO2 is the same. With this approach, theabsolute StO2 and the sensitivity of devices to changes in oxygenation can be investi-gated. When measuring on limbs such as the forearm, blood supply can be blocked bya pneumatic pressure cuff, causing a decrease in StO2 over time as O2 is being metab-olized. In patients in which artificial variation of StO2 may be undesired, physiologicalfluctuations or spontaneous de-saturations may also allow investigation of a certainrange of StO2. And in neonates, during the transitional period in the first minutesafter birth by caesarean section, a transient increase from very low to normal StO2 canbe observed [Hessel et al., 2014]. From such measurements, the slopes of decrease, themaximum-minimum StO2 (i.e. dynamic range) may be used to compare device sen-sitivity [Hyttel-Sorensen et al., 2011, Hyttel-Sorensen et al., 2014a]. The value pairs[Device1(t), Device2(t)] of the simultaneous recordings can also be plotted in scatterplots with devices on the y and x axes [Hyttel-Sorensen et al., 2014b] or in Bland-And-Altman plots [Hessel et al., 2014, Bland and Altman, 1986].
All in vivo studies have to deal with inter-patient variabilities, possibly differentreal StO2 at the measurement sites of simultaneous measurements and intra-patientvariability (Sec. 1.2.3). This requires relatively large subject numbers which in turnresult in high effort for obtaining the data.
7
1 Introduction
1.2.4.2 In vitro
With in vitro experiments, performance of NIRS oximeters can be assessed in a sys-tematic way in a controlled environment. Thus, many of the aforementioned effectscausing variability are eliminated, which results in less ’noisy’ datasets and allowsdetermining more subtle differences. Phantoms can be clustered into several groups.There are static and dynamic phantoms and they can either provide known opticalproperties or mimic real optical properties of tissue.
There are phantoms which are only designed for providing defined opticalproperties (µa and µ
′
s at certain λ). They are intended either for calibration as neededfor some FD devices or to check if a device provides stable results in calibrationchecks [Hueber et al., 1999]. These phantoms are usually made to last for prolongedperiods which can be 10 years or longer. They have in common that a typicallytransparent matrix material which can be e.g. agar [Cubeddu et al., 1997], silicone[Ayers et al., 2008], polyester [Firbank and Delpy, 1993], or other materials is filledwith at least two types of particles. One agent is needed to define scatteringproperties with titanium dioxide (TiO2) [Firbank and Delpy, 1993], intralipid (IL)[Cubeddu et al., 1997] or polymer micro-spheres [Hull et al., 1998] being the mostcommonly used substances. The other agent is a dye which adds absorption tothe phantom. This is often carbon black [Firbank and Delpy, 1993] or india ink[Ayers et al., 2008] but in principle can be any substance which absorbs in the NIRrange.
Hb has also been utilized as dye in solid phantoms [De Grand et al., 2006]. Oxy-genation was adjusted by addition of defined amounts of cyanide which blocks O2
binding sites of Hb. This is probably as close to real tissue optical properties as it getsfor static phantoms, but Hb is only stable for short time periods which severely limitsphantom lifetime.
In liquid phantoms the matrix material is a liquid such as saline (water(H2O) with 0.9 % NaCl). Typically, IL or some other kind of fat suspensionis used to adjust µ
′
s. The properties of IL have been investigated thoroughly[Driver et al., 1989, Hernandez et al., 2009, Ninni et al., 2011] and have proven to bestable over different batches and storage time and are comparable throughput brands[Di Ninni et al., 2012]. Absorption is usually added by india ink [Ko et al., 2006]or human blood [Suzuki et al., 1999, Wolf et al., 1999, Kim and Liu, 2007,Hull et al., 1998, Bozkurt et al., 2005]. Adding human blood is advantageous forcomparison and possibly calibration of NIRS oximeters because StO2 readingscan be compared. This is not possible with other dyes because commercial NIRSoximeters typically do not allow insight to the optical properties they measure priorto calculating StO2.
In a typical liquid phantom set-up using IL and human blood, the mixtureis stirred to avoid gradients from top to bottom caused by different densityof ingredients or gas diffusion. SO2 can be altered by adding or removingO2. Removal can be accomplished by adding substances which bind O2, bybubbling with pure nitrogen (N2), by gas exchange in membrane oxygenators[Myers et al., 2009, Hyttel-Sorensen et al., 2013b, Kraitl et al., 2013] or by addingyeast [Suzuki et al., 1999, Wolf et al., 1999, Bozkurt et al., 2005] which uses up O2
8

1.3 Objectives and outline
in a metabolic process. Reoxygenation can be acheived by exposing the phantom toadditional oxygen, e.g. by bubbling room air or pure O2. The mechanism chosen toalter oxygenation strongly affects set-up complexity. As gas exchange by bubbling N2
or membrane oxygenator are quite ineffective for large volume phantoms, the set-upneeds to be sealed to prevent entrance of O2 contained in room air. Possible gradientsof oxygenation or particle concentrations have to be minimized or sensors have to beplaced in a way that they are not affected in case such a gradient exists.
Determining true oxygenation of the phantom is not as easy as it seems. AlthoughSuzuki et al. [Suzuki et al., 1999] have measured SO2 of their phantom with co-oximetry, we failed to do so (Sec. 2.2) because of too much turbidity and too little ctHb.Yet, this approach seems feasible for phantoms containing undiluted blood in chan-nels within a solid matrix [Kurth et al., 1995]. However, as NIRS is mostly sensitiveto very small vessels such as capillaries, such phantom set-up would need to containmicro-fluidic channels to be a realistic model, making this approach very sophisti-cated. A second option, which works with diluted blood, is to derive SO2 from pO2
and use the Hb binding curve (Sec. 1.2.2 and 4.3). This approach requires recordingsof 4 parameters (pO2, pH, pCO2 and T ) and an assumption for cDPG. Consequently,the error of measurement is relatively high and also continuous measurement of pHin the solution is not straight forward because of proteins clogging the sensor mem-brane over time. A third option is to use another optical technique called visible-lightspectroscopy (VLS) [Nasseri et al., 2016b](Sec. 4.3 and 4.5). This technique allowsto determine StO2 based on the distinctive shapes of O2Hb (2 peaks) and HHb (1peak) absorption spectra in the range 500 < λ < 600 nm. The VLS method allows todetermine StO2 independently of scattering, but there are not many oximeters usingthis technique available commercially. A last option is to use a commercially availableNIRS oximeter which allows to take known phantom properties into account and mea-sures StO2 independent of µ
′
s in the phantom. This is not optimal because it cannot beconsidered an independent technique. Nevertheless, the range of StO2 obtained fromphantoms is plausible and agrees well with VLS and over short time with SO2 derivedfrom pO2 (Sec. 4.3).
1.3 Objectives and outline
This thesis deals with two of the main weaknesses of near-infrared spectroscopy (NIRS)oximetry: poor precision and lack of comparability between different oximeters andsensors. The first point is addressed by an in-house built oximeter OxyPrem v1.2(Chap. 2) and its successor OxyPrem v1.3 (Chap. 3). The two devices are validatedboth in vitro and in vivo for comparability to existing NIRS oximeters and improvedreproducibility. The second point is addressed by an in vitro model which allows tocompare and possibly validate accuracy of NIRS oximeters in the future. In Chap. 4,using this in vitro model, a comparison between numerous commercial NIRS oximetersis provided (Sec. 4.3 and 4.4) and the influence of several effects on readings of NIRSoximeters are quantified (Sec. 4.6).
In Chap. 2, after an introduction to OxyPrem v1.2, in vitro data of two liquid phan-tom experiments is presented (Sec. 2.2 and 2.3). The data show that the readings of
9

1 Introduction
OxyPrem v1.2 are similar to those of other oximeters. Sec. 2.3 further shows thatchanges in reduced scattering coefficient (µ
′
s) of the phantom marginally affect sen-sitivity of oximeters to oxygenation changes, whereas a change in total haemoglobinconcentration (ctHb) has strong influence. Next, in vivo data for precision are pre-sented (within-subject standard deviation (Sw) = 3.31 % for Rave)and compared todata acquired by another group (Sec. 2.4). Finally, in a summary these findings andsome practical problems with OxyPrem v1.2 are discussed (Sec. 2.5).
Chap. 3 starts with an introduction to the new device OxyPrem v1.3 and the majorimprovements. In Sec. 3.2 preliminary results of a precision study in neonates are pre-sented. These data show that precision assessments in neonates are severely hamperedby unstable subject physiology. By using simultaneous recordings of peripheral arterialoxygen haemoglobin saturation (SpO2) and a second OxyPrem v1.3 sensor, which waskept in place, subjects with strong variation in their physiology were identified. Afterapplying quality criteria and removing data from the physiologically most unstablesubjects, we obtained a much better precision for OxyPrem v1.3: While Sw for R1 was2.8 % based on all available data, this number reduced to Sw 1.9 % after applicationof the quality criteria. Sw for R1 is amongst the best ever reported in neonates. Thechapter is concluded by a summary highlighting the experience gathered with the de-vice. It is also shown that the changes made in OxyPrem v1.3 improved the devicesubstantially, such that it is now ready for translation into the clinics.
In Chap. 4 results obtained with a novel phantom set-up are presented. Based onexperience collected in the experiments in Sec. 2.2 and 2.3, we improved many detailsand extended the phantom to a second, superficial layer which resembles the skull.Sec. 4.1 introduces and characterizes this strongly improved phantom set-up whichwas used in several experiments and allows comparison of oximeters on an absolutescale.
In Sec. 4.3, OxyPrem v1.3 is compared to other oximeters in the liquid phantom set-up simulating the neonatal head. A table for translation of readings of one oximeterand sensor to another is provided as well as device specific intervention thresholds forsafeguarding the brains of our smallest children (SafeBoosC). In this experiment,OxyPrem v1.3 was the only continuous-wave (CW) NIRS oximeter whose readingswere not strongly influenced by changes in ctHb in the range to be expected for neonates(Sec. 4.3).
In Sec. 4.4 the experiment presented in Sec. 4.3 is extended by additional devices.Based on the presented results, it is possible for the first time to compare all of themost widely used oximeters by linear relations provided tabularly. This solves thecomparability issue of NIRS oximetry in neonates.
Influence of adipose tissue thickness (ATT) on readings of OxyPrem v1.3 and otheroximeters is compared in vitro on a phantom mimicking the situation in muscle mea-surements with a superficial fat layer (Sec. 4.5). Although source-detector separation(SDS) in OxyPrem v1.3 are shorter than in the other CW oximeters employed inthis study, it performed equally well. Major finding of this experiment was that atATT = 9 mm all oximeters had lost approximately half their initial sensitivity tooxygenation changes and were only minimally sensitive at ATT = 16 mm.
The experiment presented in Sec. 4.6 quantifies the errors introduced to the readingsof three commercial NIRS oximeters by typical application faults. The topics discussed
10

1.3 Objectives and outline
are influence of a clear layer, partial placement of the sensor on pigmented skin or hair,and placement of the sensor centrally on the forehead on top if the central fissure.These are all recommended to avoid if possible in NIRS usage guides, but it is unclearto which extent readings are negatively affected. Results are that thin layers of clearsubstances on the skin are acceptable, whereas larger amounts can create false results.Placement of the sensor on top of birth marks or partially on hair is problematic withthe sensors investigated and introduces large errors. Placement on top of or acrossthe central fissure seems to change absolute readings and sensitivity and should beavoided.
In summary, this thesis tackles two of the major drawbacks of NIRS oximetry:poor precision and lack of comparability tissue oxygen haemoglobin saturation (StO2)oximeters and sensors. The developed oximeters, OxyPrem v1.2 and its successorOxyPrem v1.3, are presented and assessed in vivo and in vitro in liquid phantoms.As a major result of this thesis, it is shown that precision assessments in neonatescan be severely confounded by unstable subject physiology which demands for qual-ity criteria to be applied when analyzing the data. Doing so, we have determinedan exceptionally good precision for OxyPrem v1.3. Furthermore, in our comparisonexperiments, OxyPrem v1.3 has been the only CW device whose StO2 readings wererobust to changes in ctHb. A liquid phantom set-up mimicking optical properties of theneonatal head has been established. Using this set-up, a tabular comparison of severalNIRS oximeters and sensors for cerebral measurements in neonates has been com-piled. The data obtained in these measurements provide a substantial improvementin comparability between different NIRS oximeters.
11


2 OxyPrem v1.2
2.1 Introduction to OxyPrem v1.2
As already introduced in Sec. 1.1, within the safeguarding the brains of our smallestchildren (SafeBoosC) consortium, clinicians were not satisfied with performance ofexisting near-infrared spectroscopy (NIRS) instrumentation. Especially the precisionwas criticized which was in the order of ≈ 5 % in [Sorensen and Greisen, 2006] andother studies. If treatment decisions are based on fixed thresholds for tissue oxygenhaemoglobin saturation (StO2), then such high standard deviation is not acceptableas the following example illustrates: assume the threshold of StO2 is set to 55 % anda measurement delivers an StO2 of 60 %. In this case, a clinician may think that thereis no reason for concern, as the measured value is well above the threshold. However,there is actually a 16% chance that the real StO2 is below the threshold and treatmentof the patient should have been adjusted.
Triggered by the request of clinicians, we at Biomedical Optics Research Labora-tory (BORL), Division of Neonatology, University Hospital Zurich (USZ) started thedevelopment of OxyPrem to overcome this problem. At BORL there have previouslybeen sensors developed with which a good repeatability of Sw = 2.76% in neonates hasbeen achieved [Jenny et al., 2011]. Like these previous sensors, the OxyPrem sensorwas designed to employ a self-calibrating principle [Hueber et al., 1999] which greatlyincreases robustness to superficial effects as well as inhomogeneities and has shown toreduce artifacts [Scholkmann et al., 2014b].
In an introductory paper about the SafeBoosC trial [Greisen et al., 2011], someof OxyPrem v1.2 features have been explained. As a first important feature of theOxyPrem sensor, two independent groups of sources with shared detectors (called re-gions) are incorporated. This reduces variability by
√2 when both values are averaged
for a normal distribution of the measurement error. A second important feature is thehexagonal placement of light sources and detectors. This way, the regions probe differ-ent tissues. The second feature was intended to further improve precision by averagingout local differences of StO2 in the tissue when resiting the sensor. The source-detectorseparations (SDSs) were chosen to 15 mm and 25 mm based on simulations with a 2-layer monte-carlo model [Greisen et al., 2011]. This simulation suggested that SDScould be shorter and sensors thus made smaller than what was common at the timeof development.
The OxyPrem v1.2 system is shown in Fig. 2.1. A laptop is used for data acquisitionand user interaction. A battery board contains a battery lasting for approximately 6hours of measurement and offers the possibility to connect an external power supplyfor longer episodes of measurement. The battery board also contains a bluetoothmodule for wireless communication of data between sensor and host PC. The sensor
13
2 OxyPrem v1.2
dS
dL
Sensor
Battery Board
Power Supply
Laptop with
Bluetooth
Antenna
Sensor Cable
Source DetectorBluetooth
Module
µC
ADC
Battery
R 1
R 2
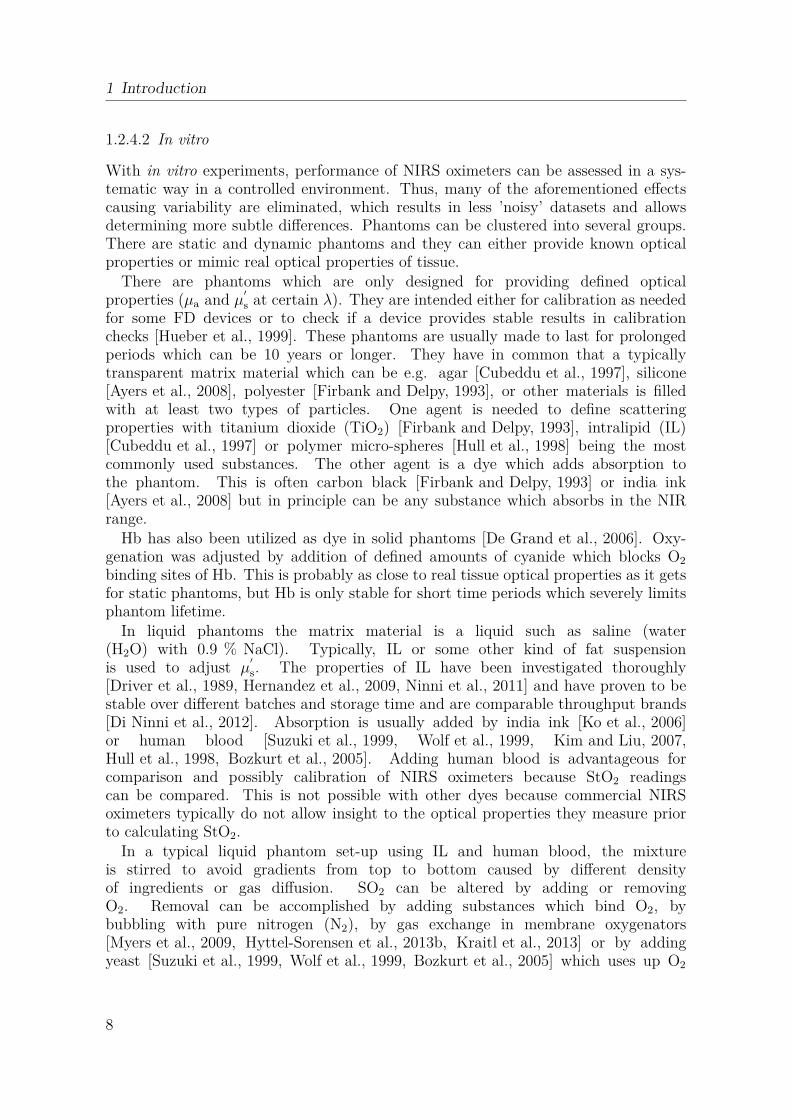
Figure 2.1:OxyPrem v1.2 system with sensor, battery board, external power supply and laptop. Theenlarged inset on the left shows a symmetric sensor design, offering two independent self-calibrating regions R1 and R2. Each light source consists of three LEDs with differentwavelengths (λ). Two of the eight light paths in total are illustrated with white areas,indicating an SDS of 15 mm and 25 mm.
14

2.1 Introduction to OxyPrem v1.2
is connected to the battery board by cable and consists of a rigid-flex printed circuitboard (PCB) which is completely encapsuled in soft, bio-compatible silicone.
The sensor acquires data at a sampling rate of 35 Hz and incorporates three wave-lengths (λ1 = 760 nm, λ2 = 805 nm, and λ3 = 870 nm) per light source. A 3-axisaccelerometer detects movements for easy identification of artifacts by the user. StO2,∆ctHb , ∆cO2Hb and ∆cHHb are provided to the user on a graphical user interface.
The OxyPrem development process produced several versions of the instrument.The first version brought to the field was v1.1 which unfortunately was notrugged enough and was only used in one publication [Hyttel-Sorensen et al., 2011].The lessons learned led to the follow-up version OxyPrem v1.2, which wasmore robust, but required device-specific calibration to account for imprecisionsof manufacture. OxyPrem v1.2 was used in several studies, for exam-ple in [Hyttel-Sorensen et al., 2013b, Metz et al., 2013b, Metz et al., 2014,Nasseri et al., 2014, Hyttel-Sorensen et al., 2014b, Kleiser et al., 2016a,Kleiser et al., 2016c, Hapuarachchi et al., 2016]. In these studies, the deviceshowed robustness and applicability in overnight measurements in newborns as wellas adolescents. Experience gathered in these studies led to an improved successorOxyPrem v1.3 which is presented in chapter 3.
The tasks performed by the author with respect to OxyPrem v1.2 included debug-ging of former device versions, hardware and firmware improvements to minimize sys-tematic errors, manufacturing and testing of devices and coordination thereof withco-workers, device calibration (in part), extension of software functionality and imple-mentation of a signal quality analysis, to name a few. Besides, the author performedpart of the measurements in neonates himself, which were conducted in the studies’NeoSense’ and ’OxyPrem Validation’.
15

2 OxyPrem v1.2
2.2 First OxyPrem v1.2 liquid phantom study[Hyttel-Sorensen et al., 2013b]
2.2.1 Motivation
Phantom experiments with human blood and intralipid (IL) have previously beenperformed (Sec. 1.2.4.2), for example to validate the NIRO-300 (Hamamatsu)[Suzuki et al., 1999]. This is a relatively simple approach to compare and validatereadings of an oximeter. Suzuki et al. compared NIRO-300 oximeter readings toco-oximetry results of liquid samples they took from the phantom. Such comparisonwith values obtained by a different, well-accepted method allows to estimate the ’real’StO2.
In the experiment described in the following paper [Hyttel-Sorensen et al., 2013b],we therefore tried to reproduce the procedure described by Suzuki et al. We usedan membrane oxygenator instead of yeast to change oxygenation of the phantomand extended the experiment by placing several NIRS oximeters in the phantomat the same time. A previous study by Dullenkopf et al. in anesthetized chil-dren [Dullenkopf et al., 2003] revealed significant differences between the commercialoximeters we investigated in this study: INVOS 5100 (with adult and neonatal sen-sor, Medtronic) and NIRO-300. Our intention was to directly compare NIRS oxime-ters with one another over a wide range of StO2 and to investigate if this methodcould potentially replace in vivo comparisons such as the one by Hyttel-Sorensen etal. [Hyttel-Sorensen et al., 2011] which performed repeated arterial occlusions on theadult forearm. Another aim was to validate OxyPrem v1.2 over a wide StO2 range andinvestigate if OxyPrem v1.2 readings could potentially be transformed to match thoseobtained by the INVOS adult sensor which was wishful in context of the SafeBoosCstudy.
In this study, the author’s tasks comprised analysis of OxyPrem v1.2 data and in-vestigation if agreement between OxyPrem v1.2 and INVOS adult could be achievedby varying assumptions for scattering and water content. The actual experiment wasshared work.
The following reproduction of the paper ’Calibration of a prototype NIRSoximeter against two commercial devices on a blood-lipid phantom’[Hyttel-Sorensen et al., 2013b] published in Biomedical Optics Express has beenslightly adapted in terms of nomenclature and formatting.
16
2.2 First OxyPrem v1.2 liquid phantom study [Hyttel-Sorensen et al., 2013b]
Calibration of a prototype NIRSoximeter against two commercialdevices on a blood-lipid phantomSimon Hyttel-Sorensen,1,∗ Stefan Kleiser,2 Martin Wolf,2 and Gorm
Greisen1
1Department of Neonatology, National University Hospital, Rigshospitalet,Blegdamsvej 9, Copenhagen, DK-2100, Denmark
2 Biomedical Optics Research Laboratory, Division of Neonatology, UniversityHospital of Zürich 8091 Zürich, Switzerland
published 14 Aug 2013Vol. 4, No. 9
DOI:10.1364/BOE.4.001662
BIOMEDICAL OPTICS EXPRESS 1666https://doi.org/10.1364/BOE.4.001662
OCIS codes: (170.1470) Blood or tissue constituent monitoring; (300.6190)Spectrometers.
Abstract: In a blood-lipid liquid phantom the prototype near-infrared spectroscopy(NIRS) oximeter OxyPrem was calibrated against the INVOS 5100c adult sensor inrespect to values of regional tissue oxygen haemoglobin saturation (rStO2) for possibleinclusion in the randomised clinical trial - SafeBoosC. In addition, different commercialNIRS oximeters were compared on changing haemoglobin (Hb) oxygen saturation andcompared against co-oximetry. The best calibration was achieved with a simple offsetand a linear scaling of the OxyPrem rStO2 values. The INVOS adult and pediatricsensor gave systematically different values, while the difference between the NIRO-300 and the two INVOS sensors were magnitude dependent. The co-oximetry provedunreliable on such low Hb and high intralipid (IL) levels.
2.2.2 Introduction
Near-infrared spectroscopy (NIRS) enables non-invasive measurement of the regionaltissue oxygen haemoglobin saturation (rStO2). rStO2 is correlated to both arterialoxygen haemoglobin saturation (SaO2) and venous oxygen haemoglobin saturation(SvO2) [Watzman et al., 2000] and is an estimate of the local oxygen balance, i.e.theoxygen delivery - oxygen consumption difference. The randomised clinical trial (RCT)safeguarding the brains of our smallest children (SafeBoosC) hypothesises that cere-bral NIRS oximetry monitoring during the first three days of life of the extremelypreterm infants can improve outcome [Greisen et al., 2011]. The normal range of rStO2
in preterm infants is 55-85 % as determined by the commercial device INVOS 5100cusing the adult sensor [Hyttel-Sorensen et al., 2013a]. As a part of the SafeBoosC
17
2 OxyPrem v1.2
project, a prototype NIRS device ’OxyPrem’ dedicated to the preterm infant headhas been developed with the aim of combining reusable sensor technology with higherprecision [Greisen et al., 2011].
Validation of NIRS oximetry is difficult, as no reference standard exists. Invivo it is usually validated by comparison of rStO2 with a weighted mean of SaO2
and SvO2 [Knirsch et al., 2008, Rais-Bahrami et al., 2006, Nagdyman et al., 2005,Yoshitani et al., 2005, Shimizu et al., 2005, Benni et al., 2005, Daubeney et al., 1996].This method has limitations as it includes the imprecision of NIRS re-siting, theerrors of measurement on SaO2 and SvO2, as well as extra-cerebral contribution tojugular venous blood. Furthermore, the arterial to venous volume ratios may bechanging dependent on the level of oxygenation. In vitro testing on solid state orliquid phantoms has the advantage of controllable optical properties and less variation[Kusaka et al., 2002, Suzuki et al., 1999].
The present study had three objectives: 1) to calibrate the prototype OxyPremagainst the INVOS 5100c adult sensor for possible inclusion in the SafeBoosC trial;2) to compare different commercial NIRS oximeters on changing haemoglobin (Hb)oxygen saturation on a blood-lipid liquid phantom; 3) to compare the oximeters againstco-oximetry.
2.2.3 Methods
2.2.3.1 Phantom
The blood-lipid phantom consisted of a mixture of isotonic saline, erythrocytesuspension and intralipid (IL) 200 mg/ml. The erythrocyte suspension is madefrom human blood drawn into a citrate phosphate dextrose solutution that iscentrifuged. The erythrocytes are finally suspended in a saline, adenine, glucose,and mannitol solution (SAG-M) to a hematocrit of about 64 %. The mixturewas 0.5 % (5 mg fat/ml) IL and a haematocrit (htc) of 1.5. It was contained ina five-litre bucket with a diameter of 17.5 cm. The NIRS sensors were equallydistributed along the wall (Fig. 2.2) ensuring a distance of at least 8 cm fromlight sources and light detectors of different devices. The bucket was coveredwith a plastic film. The reduced scattering coefficient (µ
′
s) of 0.5 % IL is about0.5 mm−1 [Ninni et al., 2011, van Staveren et al., 1991, Dimofte et al., 2005,Johns et al., 2005]. This is similar to scattering properties of the neonatal head[Wolf et al., 1999, Ijichi et al., 2005]. Estimates of cerebral blood volume (CBV) inneonates vary considerably between studies ranging from 1.7 to 3.7 ml/100 g in pri-marily preterm populations [Pellicer et al., 2001, Roche-Labarbe et al., 2010,Wyatt et al., 1986, Franceschini et al., 2007, Roche-Labarbe et al., 2012,Leung et al., 2004, Brun and Greisen, 1994], this corresponds to a ’tissue htc’about 1.0 to 1.5 % if blood htc is 45 % [Jopling et al., 2009] and the specific gravityof brain tissue is 1.05 g/ml.The solution was pumped through an extracorporeal membrane oxygenator(STÖKERT SIII) with a servo-controlled heater maintaining a temperature of37.5 ◦C. The flow on the pump was 1 litre per minute, and the fluid in the bucketwas additionally circulated by a magnet stirrer (KEBO-Lab MR 2000). The gas flow
18

2.2 First OxyPrem v1.2 liquid phantom study [Hyttel-Sorensen et al., 2013b]
to the membrane oxygenator consisted of a variable mixture of oxygen (O2), nitrogen(N2), and carbon dioxide (CO2) (Fig. 2.3). pH-value (pH) was kept about 7.4 bytitration of sodium bicarbonate buffer (SBB) 1 mmol/ml.
Figure 2.2:The blood-lipid phantom seen from above before the fluid level was increased to well abovethe sensor level. The sensors are from the top and clock-wise: OxyPrem 1, OxyPrem 2,INVOS adult, NIRO, and INVOS pediatric. Only OxyPrem 2 was used for data collection.The tubings to and from the oxygenator were placed on both sides of the OxyPrem 1.
19

2 OxyPrem v1.2
Figure 2.3:A schematic presentation of the phantom setup. White tubes contain blood. Gray tubescontain gas. The NIRS sensors and the heat exchanger are not presented in the diagram.
2.2.3.2 NIRS devices
INVOS 5100c uses one LED light source with wavelengths 730 and 810 nm and twolight detectors, three and four centimeters from the source, respectively. This geometryis identical for the adult, the pediatric, and the neonatal sensor.
NIRO-300 employs spatially resolved spectroscopy with lasers with wavelengths of775, 810, 847, and 919 nm. The light absorption coefficient (µa) is estimated by thedecrease in reflected light as a function of distance from light source. By assuminga semi-infinite medium, knowing the wavelength dependence of µ
′
s, then the spectralshape of the µa can be calculated and the rStO2 estimated. In contrast to the INVOS,this algorithm was published [Suzuki et al., 1999, Matcher et al., 1995a]. Two lightdetectors are placed respectively 3.6 and 4.4 cm from the source.
OxyPrem is designed and manufactured by the Biomedical Optics Research Labora-tory (BORL) of the Division of Neonatology at the University Hospital Zurich (USZ),Switzerland. It applies four light sources with three light emitting diodes with nom-inal wavelengths of 760, 805, and 870 nm, and two detectors. The pair-wise source-detector separation (SDS) is 1.5 and 2.5 cm. It employs a self-calibrating principle[Hueber et al., 1999] using multiple light paths, which has proven to be advantageous[Jenny et al., 2011].
In present study the INVOS adult sensor (SAFB-SM), the INVOS pediatric sensor(SPFB), the NIRO-300 sensor with detector at 3.6 and 4.4 cm from the source, andthe OxyPrem sensor were used (Fig. 2.2).
20

2.2 First OxyPrem v1.2 liquid phantom study [Hyttel-Sorensen et al., 2013b]
2.2.3.3 Blood sampling
Blood for reference oxygen haemoglobin saturation (SO2) was drawn from the circuitbefore the oxygenator and analysed on an ABL-800 by co-oximetry. Part of eachblood sample was immediately analysed for pH, oxygen partial pressure (pO2) andcarbon dioxide partial pressure (pCO2), while the remains were spun. The precipitatecontaining the erythrocytes was then analysed for SO2. Differences in partial pressuresof the two analyses served as quality control. This method was developed, as the ABL-800 cannot measure SO2 in a solution with an extremely low Hb concentration andextremely high turbidity due to IL.
2.2.3.4 Experimental procedure
Initially the phantom was oxygenated by flow of pure oxygen through the membraneoxygenator. This ensured theoretical baseline Hb saturation very close to 100%. Nextthe oxygen was turned off and replaced by pure nitrogen flow to the oxygenator. Thisshould lower the phantom oxygen content depending on the oxygen consumption ofthe blood and the oxygen contamination from outside the circuit. Lastly gas flow tothe oxygenator was shifted back to pure oxygen, while the blood pump was stoppedintermittently.
2.2.3.5 Statistical analysis
The blood sample pO2-SO2 pairs were fitted to the Hill’s equation[Goutelle et al., 2008] by the Nelder-Mead simplex algorithm with an initialestimate of coefficients of K = 1 and α = 1. Pre-spin SO2 were calculated from thederived dissociation curve. Pairwise device comparisons with simple linear regressionand all instruments were compared with the reference blood samples. All datahandling was done in Matlab R2012b (Mathworks, Inc, Mass., USA).
2.2.3.6 Calibration of OxyPrem
For the SafeBoosC trial it is beneficial to have as little variability as possible caused bydifferent measurement characteristics of different NIRS devices. Therefore we used thepresent experiment to determine a transformation of rStO2 values to make OxyPremmeasure as similarly to the INVOS 5100c Adult SomaSensor as possible.
If it is assumed that the present phantom constitutes a homogenous, semi-infinitemedium differences between devices could derive from different basic assumptions ofwater (H2O) content and scattering properties [Metz et al., 2013a]. It is not publicallyknown what is assumed in the INVOS algorithm.
The ’pre-calibration’ SO2 values are based on the assumptions of 0 % H2O andµ
′
s of 0.5 % IL while using absorption coefficients measured by Matcher et al.[Matcher et al., 1995a] and weighted with known LED spectra.
In order to achieve OxyPrem SO2 values comparable to the INVOS Adult SomaSen-sor the assumptions of H2O content and scattering properties were systematically var-ied. For this, 21 values from different saturations distributed approximately equally
21

2 OxyPrem v1.2
throughout the 16-94 % range of the INVOS adult sensor were chosen. Then a resid-ual R was calculated as a squared sum of differences for several criteria m: OxyPremSO2 - INVOS values, tHb - actual Hb content and deviation from linear wavelengthdependence of µ
′
s.
R =i=21∑
i=1
m=3∑
m=1
wcriterionm(∆criterionm[i])2
Then R was minimized in a bounded minimum search using the ’Nelder-Mead sim-plex direct search’ algorithm with µ
′
s for 760, 805, and 870 nm (all between 2 and30 cm−1) and percentage of H2O (between 0 and 120 %) as variables. Weightingfactors wcriterion of the different criteria in the sum were each varied over several mag-nitudes to cover the range of one criterion only to all criteria having equal weightsin the residual function. The result was in all cases either very unrealistic values forµ
′
s with multiple variables in the bounds or resulting fits much worse compared to asimple linear scaling (Fig. 2.4).
2.2.4 Results
The calibration of the OxyPrem SO2 using a simple linear scaling (y = 1.47x − 33.1)resulted in a good fit (R2 = 0.97; p < 0.0001) (Fig.2.4). All three commercial de-vice/sensor combinations gave systematically different values of SO2 (Fig. 2.5). TheINVOS sensors showed limits of 15 % and 95 %.
Figure 2.4:Linear regression on INVOS adult SomaSensor vs. the transformed OxyPrem tissue oxygenhaemoglobin saturation (StO2).
22

2.2 First OxyPrem v1.2 liquid phantom study [Hyttel-Sorensen et al., 2013b]
Figure 2.5:Time series of SO2 for each of the commercial NIRS devices and the blood samples. Impor-tant aspects: SO2 values differ in the low range between NIRO and INVOS; INVOS adultsensor has lower values than the neonatal sensor; and INVOS is clipping the values at 15 %and 95 %.
The INVOS adult and pediatric SomaSensors were also linearly correlated with thepediatric sensor reading systematically higher than the adult sensor (y = 0.96x+17.91;R2 = 0.99). The INVOS adult SomaSensor was also linearly correlated with the NIRO,but with a different slope (y = 0.53x + 30.45; R2 = 0.98) (Fig. 2.6).
The co-oximetry SO2 was higher than any of the NIRS derived SO2 values (Fig.4). pO2 in the blood samples decreased during spinning when the pO2 was low beforespinning, while at higher pre-spinning pO2 the oxygen tension increased (Table 2.1).
Table 2.1:Co-oximetry Pre- and Post-spinning pO2 and SO2
*Estimated from the dissociation curve from the post-spin pO2 - SO2 data.
Post-spin Pre-spin Difference Post-spin Estim. pre-spinpO2 (kPa) pO2 (kPa) pO2 (kPa) SO2 (%) SO2 (%)*
10.4 8.5 2.0 99 953.1 3.4 -0.3 60 652.2 2.4 -0.2 38 451.8 2.1 -0.2 32 395.0 5.3 -0.3 84 866.9 7.0 -0.1 93 9314.9 7.5 7.4 97 9223.2 19.2 4.0 100 100
23

2 OxyPrem v1.2
Figure 2.6:Linear regression on INVOS adult SomaSensor vs. INVOS Pediatric SomaSensor (upperplot) and NIRO-300 (lower plot) SO2, respectively.
2.2.5 Discussion
It was possible to do a simple linear calibration of the prototype oxymeter to thecommercial reference in a lipid phantom of 0.5 % IL, a htc of 1.5 %, and SO2 rangingfrom 30 % to 100 %. The INVOS 5100c Adult SomaSensor, the Pediatric SomaSensor,and the NIRO-300 gave systematically different values of SO2. The pair-wise relationsbetween the commercial NIRS devices were, however, also all linear. The strength ofthe approach is that an estimate of the difference in absolute values are achieved on amaximum of oxygenation range, without the variation induced by different patients,sensor positions, and possibly depth of measurement. Moreover the co-oximetry isa potential reference standard not possible in in vivo measurements. The presentphantom had optical properties simulating the neonatal head, but in future studiesthe effect of different µ
′
s can be examined by changing the concentration of IL.It is a weakness that we do not now exactly how the sensors behaved when immersed
in the flowing fluid. The sensors were fixated, but some movement cannot be excluded.However the impact of a slightly curving sensor on the rStO2 has been shown to be mi-nor [Wallace et al., 2000]. Furthermore, the design relies on homogeneous oxygenationin the bucket. The in- and outlet from the bucket could theoretically induce hetero-geneity. However moving a sensor around the rim of the bucket during mid-rangesteady state oxygenation gave no apparent indication of inhomogeneity. Another as-pect is the violation of the semi-infinite geometry that is assumed in reflectance spec-troscopy. In the present phantom the light boundaries are in essence the black rubbersurrounding the detectors by more than 1 cm in the commercial devices. This material
24

2.2 First OxyPrem v1.2 liquid phantom study [Hyttel-Sorensen et al., 2013b]
absorbs light and in that conforms to a semi-infinite boundary condition. Beyond thatthe light will hit the curved plastic surface of the bucket. It has been shown that thecurvature has no effect, when the sensors are placed perpendicular to the curvature[Cerussi et al., 1996]. Although some will be reflected, this situation is not differentfrom normal clinical use in newborns, where a bandage may be used to fix the sensor.Furthermore, it is unlikely that it will impact the rStO2 estimates substantially, asthe impact on light intensities at the two detectors are likely to be proportionate thuspotential wavelength dependent factors levels out. At last regarding the calibrationfor use in neonates the lack of Hb F in the phantom should be noted. The differencesbetween the optical spectra of Hb F and Hb A in the near infrared range are, however,modest and that the impact on the rStO2 is minor [Zijlstra et al., 1991].
It would have been preferable to make direct measurements of µ′
s on the phantom.However, a recent study by Di Ninni found that that the optical properties of differentsamples from the same batch are almost identical, inter-batch variations are small,and the optical properties remains stable over time [Ninni et al., 2011]. This impliesthat the optical characteristics deduced from previous studies are likely to be close tothe actual properties.
The validation procedure, i.e. comparing the NIRS values with co-oximetry gaveseveral problems. It was not possible to use the co-oximeter directly on samples fromthe phantom. The procedure of spinning the samples after a direct pO2 measurementintroduced possible oxygen contamination of the sample. The repeatability of the co-oximetry measurements were good at saturations above 95 %, but due to the shapeof the oxygen-hemoglobin dissocation curve it is evident that oxygen contaminationimpacts the saturation most at the steep part of the curve around a saturation of 50%.The fact the blood sample analysis took more than fives minutes and that the phantomcould not be held steady at midrange saturations made quantification of repeatabilityof the co-oximetry impossible. When the directly measured pO2 was low there wasa small decrease in pO2 during spinning while pO2 increased when the prespin pO2
was higher. Simple diffusion of oxygen through the plastic tube would result in theopposite effect. Therefore it must be due to a left shift of the dissociation curve duringcentrifugation, but neither systematic changes in pH nor pCO2 were evident. Thatspinning in itself changes the dissociation curve is unlikely. As intracellular pH arewell buffered [Swietach et al., 2010] and changes in erythrocyte volume and/or shapeare immediately reversed post-spinning [Hoffman and Inoue, 2006] we are left with noevident explanation of our findings. Myers et al. by-passed these problems by creatinga dual-layer phantom separating µ
′
s and µa into two layers [Myers et al., 2005]. Thisapproach has not been validated. It violates the assumption of tissue homogeneity andpossible inter-layer light piping could be an issue. In a similar blood-lipid phantomstudy validating the NIRO-300 (Hamamatsu Photonics, Hamamatsu City, Japan) theco-oximeter values seem less noisy than in present study, unfortunately the bloodsampling procedures are not described in detail [Suzuki et al., 1999]. The difficultieswith the reference blood co-oximetry prevent final conclusions on the NIRS device -co-oximetry validation.
The present study is to our knowledge the first to compare commercial NIRS de-vices in a phantom. Interestingly NIRO-300 and INVOS 5100 adult sensor showedlinearly correlated values with a large offset of 30.45 % and a slope of 0.53, only.
25

2 OxyPrem v1.2
This means that the point of equality is 65 %, i.e. approximately the normal cerebraloxygenation in adults. Many of the previous clinical studies comparing devices havethe drawback of rather narrow oxygenation range. For instance the NIRO-300 andINVOS 4100/5100 adult sensor have been compared several times showing compara-ble mean values during steady state, but all studies had very few if any rStO2 val-ues below 50 % [Bickler et al., 2011, Dullenkopf et al., 2003, Thavasothy et al., 2002,Yoshitani et al., 2002]. Regarding the difference between the INVOS adult and pedi-atric sensors, Dullenkopf et al. found a similar mean difference of 11.3 ± 5.37 % (SD)between the two sensors, while Pocivalnik found a mean difference of 10 % betweenthe NIRO-300 and the INVOS neonatal sensor [Pocivalnik et al., 2011], that has beenshown to give similar values to the paediatric sensor [Morris et al., 2012]. It is thus cer-tain that despite same sensor geometry and LED wavelengths, the INVOS adult sensorgives systematically lower values than the comparable neonatal and paediatric sensors.The neonatal head has a higher H2O content than the adult head [Metz et al., 2013a]and lower µ
′
s due to less advanced myelination.It is interesting that all the pair-wise comparisons showed simple linear
relations, while the algorithms behind OxyPrem, NIRO and INVOS aredifferent [Suzuki et al., 1999, Hueber et al., 1999, Lewis and Stoddart, 1992,Lewis et al., 1999]. The OxyPrem and NIRO calculate the difference in attenuationper distance between the two detectors. INVOS subtracts the attenuation at thenear detector scaled by a factor that is proportional to the assumed superficial layerthickness from the attenuation at the far detector in order to archieve a signalonly from deeper tissue. OxyPrem and NIRO assume wavelength dependent µ
′
s,while this is probably not the case for INVOS. Apparently none of the algorithmsaccount for the tissue H2O content. Lastly there is the possibility that it simplyis a matter of different calibrations. Changing the assumption of superficial layerthickness will change the INVOS rStO2 values by an offset and a scaling factor, itis therefore not unlikely that the difference between the INVOS sensors is a matterof different calibrations: ’... appropriate scale factors may be determined ... forany desired specific application of the methodology disclosed herein, and used tocalibrate or correlate the actual output of the implemented apparatus, for exampleby conventional computer data-processing techniques such as embodying the scalefactors in appropriate look-up tables, for example’ [Lewis et al., 1999].
A limitation, when comparing or calibrating NIRS devices in a simple phantom, isthat the sensor geometry in relation to the multi-layered structure of the human tissue- on the head: skin, scalp, and skull - are not emulated. In that respect it is importantto emphasize that the shorter light source-detector distance of the OxyPrem comparedto the INVOS could induce differences depending on the tissue interrogated. Futurevalidation of the calibration should include measurements on neonates of different sizesand perhaps also adult heads to examine the generalizability of the calibration. Howthe differences between the commercial devices identified here will compare to in vivouse remains to be tested, but it seems unlikely that NIRO-300 and INVOS adult sensorwith similar geometry will be in good agreement when the cerebral oxygenation is ei-ther very low or very high despite the differences in algorithms. Gagnon et al. did find aoxygenation dependent difference between INVOS and NIRO-300 in pigs on cardiopul-monary bypass and induced circulatory arrest [Gagnon et al., 2002]. Interestingly we
26

2.2 First OxyPrem v1.2 liquid phantom study [Hyttel-Sorensen et al., 2013b]
previously found no difference in ’dynamic range’ between the same two devices in theadult human forearm using arterial occlusion to achieve a wide range of StO2 values[Hyttel-Sorensen et al., 2011]. Clinical use in adults during surgery has removed theissue of poor reproducibility by using pre-surgery SO2 values as baseline. Our resultssuggest that treatment guideline stating that interventions should be initiated at a 20percentage points drop in saturation [Denault et al., 2007] it should also state on whatNIRS device. The trial by Murkin et al. on coronary bypass surgery showed reducedperioperative major organ morbidity and mortality and shorter postoperative hospitalstay with INVOS monitoring. If conducted with the NIRO, it is likely to have resultedin fewer interventions, but at more severe desaturations [Murkin et al., 2007].
In conclusion, it was possible to achieve good agreement between a prototype oxime-ter and a commercial oximeter by simple linear regression over a wide Hb-oxygen sat-uration range. This is remarkable since the prototype oximeter uses a theory-basedalgorithm and the commercial instrument uses a proprietary algorithm or look-uptable. Two other commercial systems also differed both in the similar simple way.
Acknowledgments
The Danish Council for Strategic Research financially supported this work.
27

2 OxyPrem v1.2
2.3 Phantom experiment varying optical properties[Kleiser et al., 2016a]
2.3.1 Motivation
The experiment described in section 2.2 was a first attempt to make use of dy-namic phantoms to compare and eventually validate near-infrared spectroscopy (NIRS)oximeters in a laboratory set-up under controlled conditions and free of the variationsand ethical concerns associated with in vivo measurements. We tried to treat the phan-tom like a patient and took blood samples regularly. We used this information to adjustcomposition of the gas mixture delivered to the membrane oxygenator and titrated glu-cose and sodium bicarbonate buffer (SBB) as needed to stay in the physiological range.In addition, we intended to measure the ’real’ oxygen haemoglobin saturation (SO2)of the phantom by co-oximetry as described by Suzuki et al. [Suzuki et al., 1999].This was unsuccessful and left us with relatively little knowledge about the actualoptical properties of the phantom, for which more detailed knowledge of the influenceof ingredients on phantom optical properties would have been required.
Changing the oxygenation with a membrane oxygenator was an innovative approach,but it had one major drawback. During phases of de-oxygenating or re-oxygenating,the liquid coming from the membrane oxygenator had either SO2 ≈ 0 % or 100 %,which created an inhomogeneity next to the outlet tube. Although the liquid wasstirred by a magnetic stirrer and an inhomogeneity could not be found when movingan INVOS adult sensor around, there was some doubt about phantom homogeneityleft.
The sensor fixation with tape as shown in Fig. 2.7 worked initially, but moistureeventually impaired stickiness of the tape with some sensors dislocating inside theliquid. As a result of this, data from both Oxyprem sensors was only partially usablebecause of interference from other devices. Imprecisely located sensors may also havebeen measuring SO2 of the phantom at a different height which is problematic ifhomogeneity cannot be assumed.
In a follow-up experiment we addressed these points [Kleiser et al., 2016a]. Weadded the OxiplexTS (ISS), a frequency domain (FD) device which can measure ab-solute absorption coefficient (µa) and reduced scattering coefficient (µ
′
s) to get insightinto the optical properties of the phantom. To reduce the probability of an inhomo-geneity inside the phantom we added baker’s yeast which de-oxygenated the phantomdistributedly over time and bubbled pure oxygen (O2) to re-oxygenate. Again, regularblood samples were taken and glucose as well as SBB were added as needed. Lastly,we mounted the sensors on holders which were fixated to the bucket with screws.
Tasks of the author with respect to this study included data analysis, creation of plotsand drafting of the paper. The actual experiment and its planning were shared work.
The following reproduction of the paper ’Comparison of Near-Infrared Oxime-ters in a Liquid Optical Phantom with Varying Intralipid and Blood Con-tent’ [Kleiser et al., 2016a] published in Oxygen Transport to Tissue XXXVIIhas been slightly adapted in terms of nomenclature and formatting.
28

2.3 Phantom experiment varying optical properties [Kleiser et al., 2016a]
Comparison of Near-InfraredOximeters in a Liquid Optical
Phantom with Varying Intralipidand Blood Content
S. Kleiser1,∗, S. Hyttel-Sorensen2, G. Greisen2 and M. Wolf1
1 Biomedical Optics Research Laboratory, Division of Neonatology, UniversityHospital of Zürich 8091 Zürich, Switzerland
2 Department of Neonatology, National University Hospital, Rigshospitalet,Blegdamsvej 9, Copenhagen, DK-2100, Denmark
Chapter in
Oxygen Transport to Tissue XXXVIIVolume 876 of the series Advances in Experimental Medicine and Biology
pages 413-418DOI:10.1007/978-1-4939-3023-4_52
Keywords Near-infrared spectroscopy Instrumentation Comparison Watercorrection Liquid phantom.
Abstract: The interpretation of cerebral tissue oxygen haemoglobin saturation (StO2)values in clinical settings is currently complicated by the use of different near-infraredspectroscopy (NIRS) devices producing different StO2 values for the same oxygenationdue to differences in the algorithms and technical aspects. The aim was to investigatethe effect of changes in reduced scattering coefficient (µ
′
s) and absorption coefficient(µa) on the StO2 of different NIRS devices in a liquid optical phantom. We comparedthree continuous-wave (CW) with a frequency domain (FD) NIRS device. Respon-siveness to oxygenation changes was only slightly altered by different intralipid (IL)concentrations. However, alterations in haematocrit (htc) showed a strong effect: in-creased htc led to a 20−35% increased response of all CW devices compared to the FDdevice, probably due to differences in algorithms regarding the water concentration.
2.3.2 Introduction
In the last decades, near-infrared spectroscopy (NIRS) has evolved to a valuable toolto measure and monitor tissue oxygen haemoglobin saturation (StO2) in research andvarious clinical applications [Wolf et al., 2012]. StO2 gives insight into the local bal-ance of oxygen supply and demand. This new information could be clinically useful.Especially for critically ill patients such as preterm children who are often sufferingfrom unstable cerebral oxygen supply and lack of cerebral auto-regulation , this infor-mation may be of value for tailoring clinical management [Greisen et al., 2011].
29

2 OxyPrem v1.2
Despite this potential, routine use is being hampered by the fact, that differentdevices give different readings [Sorensen et al., 2008]. It is necessary to quantifythese differences in order to transfer findings from one device to another. Test-ing devices on human subjects is problematic due to a lack of a reference method,inter-subject variations, poor precision, and physiological fluctuations in oxygenation[Bickler et al., 2011, Hessel et al., 2014, Hyttel-Sorensen et al., 2014a]. Furthermore,analysis of dynamic response is limited because large variations of oxygenation canonly be induced non-invasively and safely by cuff occlusion in limbs, but not in thebrain.
Recently, we compared multiple NIRS devices under controlled conditions in a liquidphantom with reduced scattering coefficient (µ
′
s) and absorption coefficient (µa) similarto neonatal brain tissue [Hyttel-Sorensen et al., 2013b]. Oxygenation was changed bya membrane oxygenator, which allowed a comparison over the whole saturation range.The aim of the present study was to improve the experimental procedure and toadditionally investigate mixtures with different blood and intralipid (IL) content toexamine how NIRS devices compare under variable conditions.
2.3.3 Methods
Three continuous-wave (CW) NIRS devices (Somanetics INVOS 5100 adult sensor,Hamamatsu NIRO-300 and OxyPrem, an in-house built prototype) and one frequencydomain (FD) NIRS device (ISS OxiplexTS) were compared. The OxiplexTS was cali-brated on a solid phantom with known optical properties before the first experiment.The sensors were fixed to the rim of a black bucket (Fig. 2.7). The NIRO-300 sensorwas wrapped in thin plastic foil for moisture protection, whereas all other sensors weredirectly immersed into the liquid. The top of the bucket was covered with thin plasticfoil and dark cloth to reduce entrance of room air and ambient light.
The main ingredients of the phantom were 6l of phosphate buffered saline (pH-value(pH) 7.4, pre-heated to 37 ◦C), 4 g of baker’s yeast, a variable amount of FreseniusKabi IL 200 mg/ml and human whole blood. The liquid was permanently mixedwith a magnetic stirrer. Temperature of the phantom was stabilized and monitoredby a MTRE Criticool temperature controller with its heat exchange mat wrappedaround the bucket. Oxygenation was changed similarly to a previous experiment[Suzuki et al., 1999]: yeast continuously metabolised glucose and oxygen (O2), thuscaused a steady decrease of phantom oxygenation. Re-oxygenation was achieved bybubbling pure O2. Important events were marked on all devices within a few seconds.
Two experiments were conducted, both with the same initial composition. In thefirst experiment, starting from 0.5 %, IL content was increased to 1.5 % in two stepswhile haematocrit (htc) was kept constant at 1 %. This resulted in changes of theµ
′
s, which is essentially determined by the IL concentration [Ninni et al., 2011]. In asecond experiment, htc was raised from 1 to 2% by adding blood while IL concentrationwas kept at 0.5 %. This mainly changed µa and not µ
′
s.OxyPrem StO2 was computed from raw data using a self-calibrating algorithm
[Hueber et al., 1999] assuming 0 % water, µ′
s of 0.5 % IL (interpolated from[Ninni et al., 2011]) and applying µas from [Matcher et al., 1995b] (weighted withlight-emitting diode (LED) emission spectra). OxiplexTS StO2 was computed from
30

2.3 Phantom experiment varying optical properties [Kleiser et al., 2016a]
raw data using the ISS Software OxiTS (version 3.1.1.0). Absorption coefficientswere applied from the manual (version 3.1) and as suggested by the manufacturer,0.01 cm−1 were subtracted at 692 nm as background µa. All light paths wereincluded in the analysis. Two StO2 datasets were calculated: one accounting for thepresumably true water content of 98 % (ISS98) and another without water correction(ISS0).
StO2, timestamps and events from all devices were imported into Matlab. Timeshifts between device clocks were determined and removed by searching the maximumof the event cross-correlation. Subsequently, data were interpolated (piecewise cubic)to a common time base and down-sampled to the slowest sampling rate of any of thedevices (≈ 0.2 Hz). For all comparisons and linear fits between the values of any twodevices, only data during periods of decreasing oxygenation were used and only if bothdevices were in the StO2 range of 40 − 85 %.
2.3.4 Results
The yeast induced a steady decline in oxygenation until all devices abruptly reacheda lower steady state at the same time. Adding O2 similarly led to an upper steadystate quite synchronized repeatedly in all devices (Fig. 2.9, 2.10). During repeateddesaturations in mixtures of 0.5 % IL and 1 % htc the INVOS adult sensor was ingood agreement with the ISS98 between 15 and 95 %, whereas both OxyPrem andNIRO-300 were much less responsive to the change in oxygenation with similar valuesat 70 %, but an overreading of as much as 25 % at the lowest StO2 (Fig. 2.8).
The stepwise increase in IL led to a stepwise increase in the StO2 at lower steadystate by the ISS98 and to a much smaller degree by the NIRO-300 (Fig.2.9). Thisresponse was not visible for the OxyPrem. The INVOS signal was at all times clippedat < 15 and > 95 %.
Increasing IL did not impact the association between ISS98 and NIRO-300, butdoubling the htc increased the steepness of the curve by a factor of 1.19 and reduced theoverreading at the lowest StO2 to approximately 15 % (Fig. 2.11). For the OxyPremand the INVOS adult sensor, the steepness increased by a factor of 1.25 and 1.35,respectively. ISS98 vs. ISS0 showed an overreading at the lowest StO2 of 30 % inthe mixture with 0.5 % IL and 1 % htc which reduced to 19 % StO2 when doublinghtc, whereas steepness increased by a factor of 1.14 (Fig.2.12). The linear correlationcoefficient between ISS98 and all CW devices was R2 > 0.99 in the StO2 range 40−85%for all mixtures.
2.3.5 Discussion and Conclusion
In the present liquid phantom study changes in IL concentration only had minorimpact on the pair-wise device relations, whereas an increase in htc resulted in a’steeper’ response of all CW devices compared to the FD device (ISS98). The absolutevalue of µ
′
s theoretically cancels out when calculating StO2 and only the wavelengthdependence remains, which was shown to be quite stable across different human tissues[Matcher et al., 1995a]. Consequently, it is not surprising that the responsiveness ofthe StO2 was independent of changes in IL concentration.
31

2 OxyPrem v1.2
Figure 2.7:Bucket with sensors mounted. Clock-wise from the top left: ISS OxiplexTS,OxyPrem, Hamamatsu NIRO300, Soma-netics INVOS adult sensor.
0 20 40 60 80 100
0
10
20
30
40
50
60
70
80
90
100
StO2 in %, OxiplexTS (98 % water assumed)
StO
2 in %
NIRS devices in liquid phantom: 0.5 % IL, 1 % htc
NIRO300INVOS adultOxyPremidentity line
Figure 2.8:Data points of NIRO-300, INVOS adultsensor and OxyPrem in 0.5 % IL and 1 %htc compared to ISS OxiplexTS with 98 %water assumption.
0.5 1 1.5 2 2.5 3 3.5 4−40
−20
0
20
40
60
80
100
time in hours
StO
2 in %
Time series in 0.5%/1%/1.5% IL & 1% htc
OxiplexTS (98 % water assumed)NIRO300OxyPremINVOS adult
IL addedIL added
Figure 2.9:Time series showing readings from all in-struments during experiment 1 with con-stant htc and increasing IL concentration.
6 6.5 7 7.5 8 8.5
−40
−20
0
20
40
60
80
100
time in hours
StO
2 in %
Time series with 0.5% IL & 1%/2% htc
OxiplexTS (98% water assumed)NIRO300OxyPremINVOS adult
blood added
Figure 2.10:Time series showing readings from all in-struments during experiment 2 with con-stant IL and increasing htc.
32

2.3 Phantom experiment varying optical properties [Kleiser et al., 2016a]
0 20 40 60 80 100
0
10
20
30
40
50
60
70
80
90
100
StO2 in %, OxiplexTS (98% water assumed)
StO
2 in %
, NIR
O30
0
Comparison of OxiplexTS (98% water assumed) and NIRO300
0.5% IL, 1% htc1% IL, 1% htc1.5% IL, 1% htc0.5% IL, 2% htc
Figure 2.11:Relationship of NIRO-300 and ISS Oxi-plexTS with 98% water assumption for dif-ferent IL concentrations and htc.
0 20 40 60 80 100
0
10
20
30
40
50
60
70
80
90
100
StO2 in %, OxiplexTS (98% water assumed)
StO
2 in %
, Oxi
plex
TS
(0
% w
ater
ass
umed
)
Comparison of OxiplexTS (98% water assumed) and OxiplexTS (0% water assumed)
0.5% IL, 1% htc1% IL, 1% htc1.5% IL, 1% htc0.5% IL, 2% htc
Figure 2.12:Relationship of ISS OxiplexTS with 0 and98% water assumption for different IL con-centrations and htc.
NIRO-300 and ISS0 behaved remarkably similarly to the increase in htc, whichseems related to both [Suzuki et al., 1999] not taking water absorption into account.The overreading by 25 − 30 % by OxyPrem, NIRO-300 and ISS0 at 1 % htc comparedto ISS98 StO2 at 0 % could be caused by water absorption at longer wavelengths(λ > 800 nm). This contributes more significantly to the total µa when htc is low,thus causing an overestimation of mainly oxyhemoglobin concentration. This effectis dependent on wavelengths employed by the device. This can explain the observedoverreading at the lowest levels of StO2 as well as the lowered responsiveness to oxy-genation changes. Metz et al. [Metz et al., 2013a] reported only a small influenceof water assumption on absolute StO2 values measured on the neonatal head (highStO2) and a high influence on the adult forearm (low StO2), which agrees well withour findings (Fig. 2.12); they observed higher variability when accounting for water,which can be explained by the increased responsiveness also observed in this study.
Although the design of the phantom aimed at reducing the possibilitiesof inhomogeneity in the phantom by eliminating the distinct outlet tube in[Hyttel-Sorensen et al., 2013b], the presence of oxygenation gradients from top tobottom as well as a gradient in yeast concentration cannot be entirely excluded.Sensors were placed at slightly different heights in the phantom. Therefore, allabsolute results have to be treated with care, as sensors could potentially have ’seen’different true oxygenations and changes thereof. However, in the two experimentsshown here, sensor positions were unchanged, thus the relative changes caused bychanging mixtures should not be affected by these possible gradients.
In mixtures with increased IL or htc, the lower steady-state StO2 for ISS98 did notreach 0 %. Also, the ISS98 reached maximum StO2 well above 100 %. An O2 gradientcould explain these observations. However, we do not expect a possible gradientto affect the current analysis which is looking only at relative changes of pair-wiserelations, because we only considered values in the range 40 − 85 % showing linear
33

2 OxyPrem v1.2
relations (R2 > 0.99) and it seems unlikely that a potential gradient was different atdifferent phantom compositions.
In comparison with [Hyttel-Sorensen et al., 2013b], the OxyPrem vs INVOS adultsensor relation was different in the present experiments. Possibly different sensorheights in combination with an O2 gradient could explain both changes in relativesensitivity as well as absolute numbers. Furthermore, OxyPrem measured horizontallywhereas all other sensors measured vertically in the direction of the gradient, whichcould also lead to a difference. Responsiveness of NIRO-300 vs INVOS adult sensorwas approximately 0.59 at 1 % htc and 0.51 at 2 % htc, which is in line with 0.53 at1.5 % htc reported in [Hyttel-Sorensen et al., 2013b]. This would be reasonable evenif there was a saturation gradient, as they were mounted at the same height.
In conclusion, we have employed an optical phantom with variable µ′
s and bloodcontent to investigate the effect of such changes on the steepness of the pair-wiserelation of three CW NIRS oximeters and one FD NIRS oximeter which measuredµ
′
s and allowed to make user-defined corrections for water content of the phantom.Findings were that µ
′
s changes had a minor influence on the devices, but changes inhtc led to different responsiveness to oxygenation changes presumably due to the waterassumption made in the algorithms.
Acknowledgements
This work was scientifically evaluated by the SNSF, partially financed by the SwissConfederation and funded by Nano-Tera.ch as well the Danish Council for StrategicResearch (SafeBoosC project), which the authors would like to gratefully acknowl-edge.
34

2.4 OxyPrem v1.2 in vivo evaluation
2.4 OxyPrem v1.2 in vivo evaluation
OxyPrem v1.2 performance was assessed in vivo by the ’OxyPrem Validation’ studyperformed at Biomedical Optics Research Laboratory (BORL), Neonatology, Univer-sity Hospital Zurich (USZ). The study protocol was accepted by the ethical com-mittee of Zurich (KEK 2010-0102/2) and Swissmedic (2010-MD-0019). Addition-ally, a study by Hyttel-Sorensen et al. was performed in Copenhagen, Denmark[Hyttel-Sorensen et al., 2014b].
Remark: The ’OxyPrem Validation’ adult data was acquired and evaluatedby Andreas Metz and is only presented here to provide a complete picture onOxyPrem v1.2 in vivo performance.Tasks of the author related to the ’OxyPrem Validation’ study in neonates withOxyPrem v1.2 were: building a number of devices (in part), preparation of the studyset-up (shared work), performing some of the measurements and data analysis of theprecision assessment with an evaluation script provided by Andreas Metz as startingpoint. Since September 2013 the author had the lead in administrative tasks relatedto the study. He supervised the master thesis of Tabea Vogel commonly with FelixScholkmann [Vogel, 2015].
2.4.1 Performance in adults
OxyPrem v1.2 was first tested in adults to obtain within-subject standard deviation(Sw) (repeatability) and between-subject standard deviation (Sb) (reproducibility).We obtained Sw = 1.7 % (reproducibility Sb = 3.92 %) on the forearm. OxyPrem v1.2showed similar results in repeated arterial occlusions than a NIRO-300 oximeter.OxyPrem v1.2 performance was also assessed in a different study by colleagues inCopenhagen, Denmark [Hyttel-Sorensen et al., 2014b]. In this study, precision wasreported by a within subject standard deviation Sw = 4.0 % on the adult forearm withOxyPrem values being transformed by the equation determined in a previous phantomexperiment [Hyttel-Sorensen et al., 2013b] (Sec. 2.2).
The different results (1.7% vs 4.0%) can partly be explained by the scaling factor of1.47 applied. But even when undoing this scaling for comparison, there is a differenceremaining (1.7 % vs 2.7 %). This may in part be addressed to differences in the studyprotocols. In our ’OxyPrem Validation’ study we have not varied sensor position,whereas it was varied within a small region in [Hyttel-Sorensen et al., 2014b].In our study, we further tried to minimize physiological changes to get anestimate of the device-related variability when resiting the sensor. Subjects werelying comfortably and were told to move as little as possible and to relax. In[Hyttel-Sorensen et al., 2014b], subjects were sitting at a table with their arm beingat rest. It seems plausible that these two factors were causing the observed changesin repeatability.
In the ’OxyPrem Validation’ study the rate of decline of StO2 on the adult forearmduring arterial occlusions was −9.18 ± 3.36 %/min for OxyPrem v1.2 whereas it was−8.58 ± 2.76 %/min for the NIRO-300. It has to be said that OxyPrem v1.2 andNIRO-300 were measuring at different locations with NIRO-300 always being placedmore distally. This may hamper comparability of the two values. In the study by
35
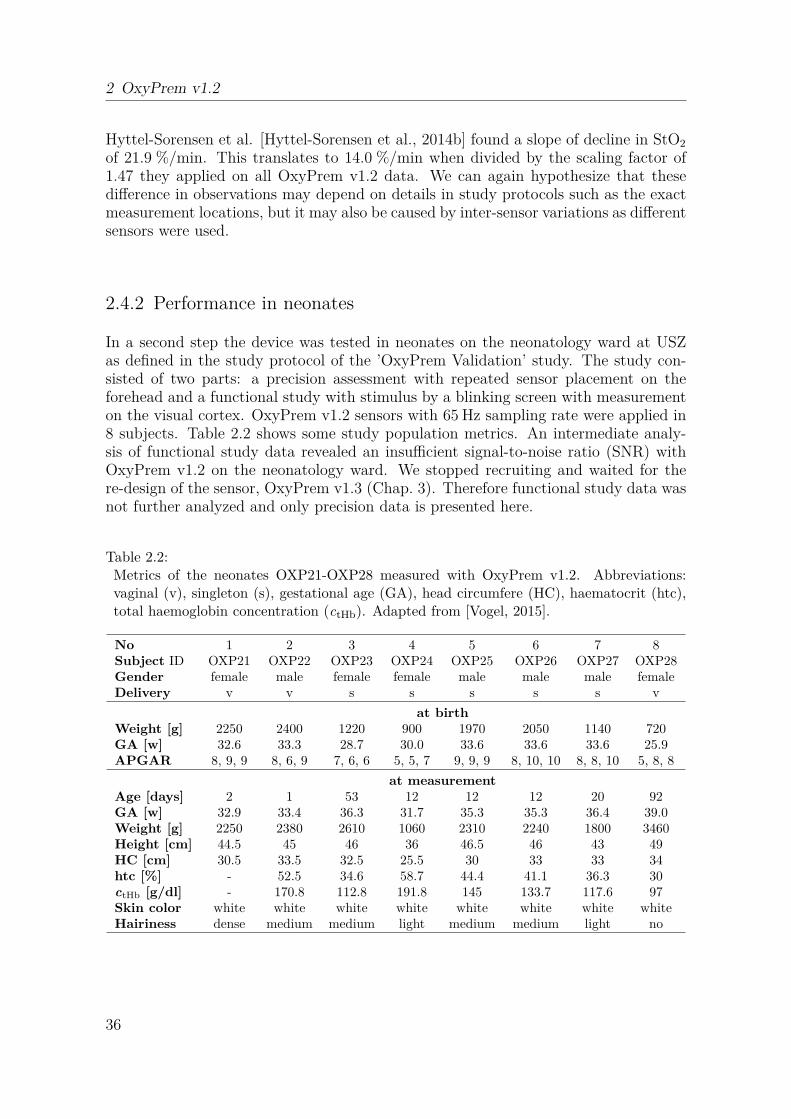
2 OxyPrem v1.2
Hyttel-Sorensen et al. [Hyttel-Sorensen et al., 2014b] found a slope of decline in StO2
of 21.9 %/min. This translates to 14.0 %/min when divided by the scaling factor of1.47 they applied on all OxyPrem v1.2 data. We can again hypothesize that thesedifference in observations may depend on details in study protocols such as the exactmeasurement locations, but it may also be caused by inter-sensor variations as differentsensors were used.
2.4.2 Performance in neonates
In a second step the device was tested in neonates on the neonatology ward at USZas defined in the study protocol of the ’OxyPrem Validation’ study. The study con-sisted of two parts: a precision assessment with repeated sensor placement on theforehead and a functional study with stimulus by a blinking screen with measurementon the visual cortex. OxyPrem v1.2 sensors with 65 Hz sampling rate were applied in8 subjects. Table 2.2 shows some study population metrics. An intermediate analy-sis of functional study data revealed an insufficient signal-to-noise ratio (SNR) withOxyPrem v1.2 on the neonatology ward. We stopped recruiting and waited for there-design of the sensor, OxyPrem v1.3 (Chap. 3). Therefore functional study data wasnot further analyzed and only precision data is presented here.
Table 2.2:Metrics of the neonates OXP21-OXP28 measured with OxyPrem v1.2. Abbreviations:vaginal (v), singleton (s), gestational age (GA), head circumfere (HC), haematocrit (htc),total haemoglobin concentration (ctHb). Adapted from [Vogel, 2015].
No 1 2 3 4 5 6 7 8Subject ID OXP21 OXP22 OXP23 OXP24 OXP25 OXP26 OXP27 OXP28Gender female male female female male male male femaleDelivery v v s s s s s v
at birthWeight [g] 2250 2400 1220 900 1970 2050 1140 720GA [w] 32.6 33.3 28.7 30.0 33.6 33.6 33.6 25.9APGAR 8, 9, 9 8, 6, 9 7, 6, 6 5, 5, 7 9, 9, 9 8, 10, 10 8, 8, 10 5, 8, 8
at measurementAge [days] 2 1 53 12 12 12 20 92GA [w] 32.9 33.4 36.3 31.7 35.3 35.3 36.4 39.0Weight [g] 2250 2380 2610 1060 2310 2240 1800 3460Height [cm] 44.5 45 46 36 46.5 46 43 49HC [cm] 30.5 33.5 32.5 25.5 30 33 33 34htc [%] - 52.5 34.6 58.7 44.4 41.1 36.3 30ctHb [g/dl] - 170.8 112.8 191.8 145 133.7 117.6 97Skin color white white white white white white white whiteHairiness dense medium medium light medium medium light no
36

2.4 OxyPrem v1.2 in vivo evaluation
2.4.2.1 Precision
A detailed analysis of the precision part of the study is presented in the master thesisof Tabea Vogel [Vogel, 2015]. Here only a summary is presented.
The OxyPrem v1.2 sensor was placed prefrontally on the forehead of the restingsubject and fixated with an elastic bandage or cap. After 1 minute of measurementthe sensor was shortly removed and placed again to the same location. In total therewere 5 times 1 minute of measurement recorded. For statistical data analysis themedian of each 1 minute block was calculated and a linear mixed effects model (lme)was used in the statistics software R [R Core Team, 2016]. We assessed Sw (residual,repeatability) and Sb (intercept, reproducibility). This evaluation was performed forboth regions R1 and R2 as well as for their averaged results (Rave).
Table 2.3:Median tissue oxygen haemoglobin saturation (StO2) values for each 1 minute measure-ment (M), average (ave) and standard deviation (SD) for each subject. Adapted from[Vogel, 2015]
StO2 [%], average of regions 1 and 2Subject ID M 1 M 2 M 3 M 4 M 5 ave SD
OXP21 73.0 68.3 71.0 67.8 72.3 70.5 2.3OXP22 63.0 59.1 59.6 55.9 55.0 58.5 3.2OXP23 58.9 69.7 60.3 65.2 57.9 62.4 5.0OXP24 65.8 66.9 67.7 61.6 64.3 65.3 2.4OXP25 61.6 59.5 62.4 67.6 67.0 63.6 3.5OXP26 70.8 67.5 71.8 70.4 73.0 70.7 2.1OXP27 70.8 69.2 63.0 64.3 70.2 67.5 3.6OXP28 55.2 58.6 49.4 56.1 53.9 54.6 3.4
Table 2.4:Reproducibility (inter-subject variability) and repeatability (intra-subject variability) fortissue oxygen haemoglobin saturation (StO2) obtained by a linear mixed effects model (lme)for both regions R1 and R2 as well as their average (Rave). Adapted from [Vogel, 2015]
Intercept ResidualReproducibility [%] Repeatability [%]R1 R2 Rave R1 R2 Rave
5.07 7.31 5.42 5.30 5.20 3.31
The repeatability we measured is clearly better than what Hyttel-Sorensen et al.have obtained [Hyttel-Sorensen et al., 2014b]. Their Sw = 6.7% (4.6% without scalingfactor) is substantially higher than the Sw = 3.3% we obtained. This may be attributedto several differences in experimental procedures. Whereas they measured 3 times oneach side of the forehead for 20 seconds on the second day of life of term borns, we
37

2 OxyPrem v1.2
measured 5 times for one minute, replaced the sensor onto the same location and oursubjects were born preterm, but older on average. In [Hyttel-Sorensen et al., 2014b]severe problems with noise in OxyPrem v1.2 signals were reported in their clinical set-ting. This may also attribute to the substantially worse repeatability they determined.
Although the good repeatability of [Jenny et al., 2011] could not be reproduced inthis study, it shows that taking the mean of several independent StO2 values improvesprecision. Both regions of the sensor alone performed much worse than their averagedvalue. It is also important to note that Sw(Rave) = 3.3 % is better than statisticallywould be expected by the doubled amount of observations (Eq. 2.1). This shows thatthe sensor design probing a larger volume of tissue is in principle beneficial.
√
Sw(RA)2 + Sw(RB)2
2· 1√
2=
√
5.32 + 5.22
2· 1√
2= 5.25 · 1√
2≈ 3.7 % (2.1)
Sw(Rave) = 3.3 % is not satisfactory, as this is in the range achieved with commercialinstruments. This unexpected result may partially be caused by high noise levels inOxyPrem v1.2 StO2 signals in the clinical setting. Depending on the operating envi-ronment, SNR was strongly reduced by electro-magnetic interference (EMI). However,the long measurement time of 60 s per block statistically reduces the effect of noise onthis analysis.
We therefore attribute the high Sw to the observation both, we and Hyttel-Sorensenet al. [Hyttel-Sorensen et al., 2014b] made: OxyPrem v1.2 is hard to place on tinyheads of newborns while maintaining good contact of all sources and detectors tothe skin. The result may be an additional component of variability caused by ’light-piping’ which describes at least a part of the light not having passed all its way fromthe light source to the detector within tissue but inside a non-absorbing and non-scattering channel which pipes photons by multiple reflections. Although it will beshown in Sec. 4.6 that very thin clear layers are acceptable, thicker layers may havean enormous effect on NIRS measurements [Wolf et al., 1999].
2.4.3 Agreement of in vivo and phantom experiments
The study by Hyttel-Sorensen et al. [Hyttel-Sorensen et al., 2014b] tried to showthat a linear transformation applied to OxyPrem v1.2 StO2 allows to achieve agree-ment with the INVOS adult oximeter (StO2, INVOS adult = 1.47 · StO2, OxyPrem v1.2 −33.1)[Hyttel-Sorensen et al., 2013b]. Data was acquired by simultaneous recordingswith both devices during arterial occlusion on the forearm and during the transitionperiod directly after birth by cesarean section. The experiments on the adult fore-arm resulted in significantly different slope and offset for ’transformed’ OxyPrem andINVOS adult. For measurements in neonates agreement seemed better, but data wasseverely impaired by noise which prevents final conclusions on this matter.
Manufacturing tolerances required a calibration of all OxyPrem v1.2 sensors onsolid phantoms. The initial method had to be refined between the experimentin Sec. 2.2 [Hyttel-Sorensen et al., 2013b] and Sec. 2.3 [Kleiser et al., 2016a] (also[Hyttel-Sorensen et al., 2014b]). After calibration, different OxyPrem v1.2 sensorsshowed good agreement of StO2 readings on silicone phantoms of 2 - 3 %. Different
38

2.5 Summary on OxyPrem v1.2
sensors were employed in the two liquid phantom experiments presented in thischapter (Sec. 2.2 and 2.3) and their response seems to slightly differ with less dynamicrange in the latter experiment. This may be an effect of both, changed responsivenessdue to different calibration procedures and some device-specific variation left aftercalibration.
The second liquid phantom experiment presented in this chapter in Sec. 2.3 revealedsensitivity changes depending on htc in the phantom and showed that these are dif-ferent for the investigated devices. It thus this seems possible that the experimentin Sec. 2.2 which was designed to simulate the head of a neonate may not be rep-resentative for the situation in vivo on the adult forearm. We also cannot excludeeffects of superficial layers which are present in vivo but not in the two liquid phantomexperiments presented in this chapter.
It further has been mentioned that there may have been an issue with ho-mogeneity in the two phantom experiments presented in this chapter (Sec. 2.2[Hyttel-Sorensen et al., 2013b] and Sec. 2.3 [Kleiser et al., 2016a]). Whereas all othersensors were mounted with their light paths oriented vertically, OxyPrem v1.2 lightpaths were located horizontally with both regions being at different height. So, ifthere was a oxygen haemoglobin saturation (SO2) gradient in the phantoms, thenOxyPrem v1.2 was affected differently than the other oximeters. We thus developedan improved phantom set-up which was used in the experiments in Chap. 3 and 4.
2.5 Summary on OxyPrem v1.2
OxyPrem v1.2 was employed in several studies which resulted in numerous publi-cations, e.g. [Hyttel-Sorensen et al., 2013b, Metz et al., 2013b, Metz et al., 2014,Nasseri et al., 2014, Hyttel-Sorensen et al., 2014b, Kleiser et al., 2016a,Kleiser et al., 2016c, Hapuarachchi et al., 2016]. In these studies, the devicewas shown to measure reliably over prolonged periods of time. We were able to showthat OxyPrem v1.2 measures similar to other near-infrared spectroscopy (NIRS)oximeters both in vivo and in vitro.
We did, however, observe a number of difficulties with the device in certain con-ditions which resulted in lower performance. We paused the ’OxyPrem Validation’with OxyPrem v1.2 study because an intermediate analysis of functional study datashowed insufficient signal-to-noise ratio (SNR). The study was continued with a newversion OxyPrem v1.3 (Chap. 3) which improved a number of issues we experiencedas sub-optimal with OxyPrem v1.2:
While precision on the adult forearm was as good as Sw = 1.7 %, OxyPrem v1.2performance in neonates was disappointing. We clearly expected within-subject stan-dard deviation (Sw) better than the 3.3% we observed. We attribute this high numberto the shape of the OxyPrem v1.2 sensor. With its hexagonal shape it extends in twodimensions and it is difficult to apply on surfaces that show curvature in more than onedirection. The principle is easy to explain with a sheet of paper which is folded arounda sphere. It is impossible to make a tight fit without buckling and crinkling the paper.The same happens to an OxyPrem v1.2 sensor when it is placed on the head of smallnewborns. The result is that likely not all sources and detectors of OxyPrem v1.2
39

2 OxyPrem v1.2
are in good contact with the skin causing ’light-piping’ or at least strong changes inoptical coupling. This creates an additional component of variation in tissue oxygenhaemoglobin saturation (StO2) measurements and thus increases Sw. For measure-ments of precision on the forearm this effect was not present because the arm can begeometrically well represented by a cylinder on which a sheet can be tightly fittedwithout any problems. Improving placement of OxyPrem v1.2 on spherical surfacesrequired repositioning of sources and detectors and thus a complete redesign of sensorgeometry and shape was needed.
OxyPrem v1.2 was designed to have the smallest possible sensor dimensions forgiven source-detector separation (SDS) of 15 mm and 25 mm. Therefore only 5 mm ofopaque silicone were placed around detectors. This resulted in the sensor being verysusceptible to ambient light which had to be faced with ambient light shielding byadditional bandages or dark cloth. This reduced ease of handling and demanded forimprovement in a sensor redesign.
Although we observed higher noise in OxyPrem v1.2 StO2 signals on the neona-tology ward than in our lab and offices at University Hospital Zurich (USZ) as well,Hyttel-Sorensen et al. [Hyttel-Sorensen et al., 2014b] had to face much higher noiselevels in OxyPrem v1.2 StO2 signals in their clinical setting. An intermediate analysisof functional study data acquired in the ’OxyPrem Validation’ study also revealed in-sufficient SNR. We identified electro-magnetic interference (EMI) as the reason for thelow SNR in the clinical settings. This was clearly not acceptable for a device intendedfor use in intensive-care settings. Unfortunately printed circuit board (PCB) layout ofOxyPrem v1.2 did not allow for implementation of shielding without a redesign.
The experiment with changes in total haemoglobin concentration (ctHb) in a liquidphantom (Sec. 2.3) [Kleiser et al., 2016a] revealed that like commercial continuous-wave (CW) NIRS oximeters, OxyPrem v1.2 sensitivity to oxygenation changes wasdifferent at high and low ctHb. Tissue ctHb in neonates is highly variable and coversa wide span [Arri et al., 2011, Ijichi et al., 2005] and it is usually not known for theinterrogated tissue. Therefore a dependence of StO2 readings on ctHb is highly un-desired for oximeters and adds substantially to the uncertainty of absolute StO2 inclinical practice. Implementation of different and more wavelengths were expected toreduce the problem in a redesign of the sensor.
All of the issues listed here were resolved by a redesign of the sensor resulting inOxyPrem v1.3 which is presented in the following Chap. 3.
40

3 OxyPrem v1.3
3.1 Introduction
Based on practical experience with OxyPrem v1.2 obtained by us and other groups inthe course of different studies (Sec. 2.5), a redesign of the sensor was planned and per-formed. In this redesign, we focused on several issues: Increasing precision in neonatesthrough better applicability on spherical surfaces, improving ambient light shielding,improving signal-to-noise ratio (SNR) in environments with much electro-magneticinterference (EMI), and increasing the robustness of tissue oxygen haemoglobin satu-ration (StO2) readings when total haemoglobin concentration (ctHb) is uncertain. Withintroduction of OxyPrem v1.3, all these issues could be successfully addressed. Fig. 3.1shows the result of the redesign, the OxyPrem v1.3 sensor. The sensor is encapsulatedwith soft and bio-compatible silicone. It is connected by cable to a PowerPCB whichcontains a battery and a bluetooth interface to communicate with a host computer.
Figure 3.1:Picture of OxyPrem v1.3 sensor and PowerPCB
The OxyPrem v1.3 sensor and the casing for the PowerPCB are designed to be man-ufactured by rapid prototyping technologies. During the development process manydesign iterations with dummy prototypes were performed. Feedback from experts andusers as well as from placement tests on puppets and dummy heads resembling thehead of preterm neonates led to the final version OxyPrem v1.3.
The OxyPrem v1.3 sensor consists of 4 light sources and 2 detectors which formtwo independent self-calibrating regions (Fig. 3.2). The outer region R1 with SDS of15 mm and 35 mm and the inner region R2 with SDS of 20 mm and 30 mm probe
41
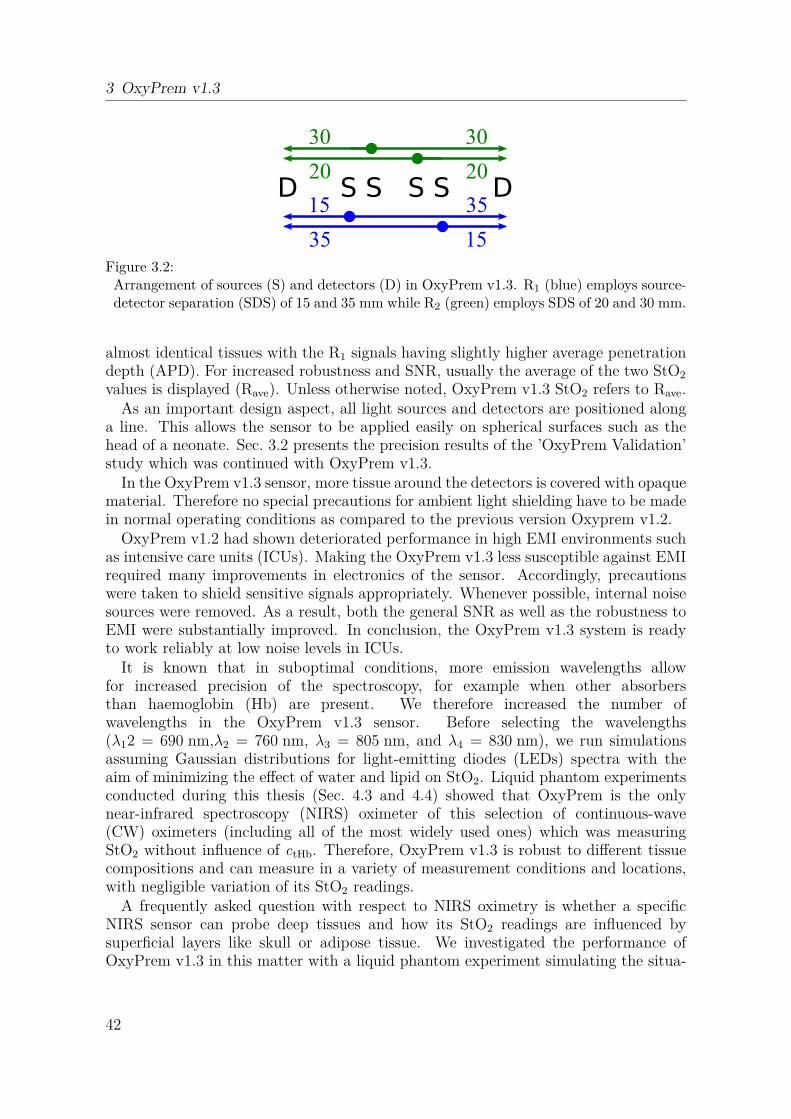
3 OxyPrem v1.3
D S S S S D20
30
20
30
35
15
15
35
Figure 3.2:Arrangement of sources (S) and detectors (D) in OxyPrem v1.3. R1 (blue) employs source-detector separation (SDS) of 15 and 35 mm while R2 (green) employs SDS of 20 and 30 mm.
almost identical tissues with the R1 signals having slightly higher average penetrationdepth (APD). For increased robustness and SNR, usually the average of the two StO2
values is displayed (Rave). Unless otherwise noted, OxyPrem v1.3 StO2 refers to Rave.As an important design aspect, all light sources and detectors are positioned along
a line. This allows the sensor to be applied easily on spherical surfaces such as thehead of a neonate. Sec. 3.2 presents the precision results of the ’OxyPrem Validation’study which was continued with OxyPrem v1.3.
In the OxyPrem v1.3 sensor, more tissue around the detectors is covered with opaquematerial. Therefore no special precautions for ambient light shielding have to be madein normal operating conditions as compared to the previous version Oxyprem v1.2.
OxyPrem v1.2 had shown deteriorated performance in high EMI environments suchas intensive care units (ICUs). Making the OxyPrem v1.3 less susceptible against EMIrequired many improvements in electronics of the sensor. Accordingly, precautionswere taken to shield sensitive signals appropriately. Whenever possible, internal noisesources were removed. As a result, both the general SNR as well as the robustness toEMI were substantially improved. In conclusion, the OxyPrem v1.3 system is readyto work reliably at low noise levels in ICUs.
It is known that in suboptimal conditions, more emission wavelengths allowfor increased precision of the spectroscopy, for example when other absorbersthan haemoglobin (Hb) are present. We therefore increased the number ofwavelengths in the OxyPrem v1.3 sensor. Before selecting the wavelengths(λ12 = 690 nm,λ2 = 760 nm, λ3 = 805 nm, and λ4 = 830 nm), we run simulationsassuming Gaussian distributions for light-emitting diodes (LEDs) spectra with theaim of minimizing the effect of water and lipid on StO2. Liquid phantom experimentsconducted during this thesis (Sec. 4.3 and 4.4) showed that OxyPrem is the onlynear-infrared spectroscopy (NIRS) oximeter of this selection of continuous-wave(CW) oximeters (including all of the most widely used ones) which was measuringStO2 without influence of ctHb. Therefore, OxyPrem v1.3 is robust to different tissuecompositions and can measure in a variety of measurement conditions and locations,with negligible variation of its StO2 readings.
A frequently asked question with respect to NIRS oximetry is whether a specificNIRS sensor can probe deep tissues and how its StO2 readings are influenced bysuperficial layers like skull or adipose tissue. We investigated the performance ofOxyPrem v1.3 in this matter with a liquid phantom experiment simulating the situa-
42
3.1 Introduction
tion in muscle measurements with different adipose tissue thicknesss (ATTs) (Sec. 4.5).Sensitivity of OxyPrem v1.3 to deeper layers of tissue was comparable if not evenslightly better than that of INVOS and Nonin adult sensors despite the fact thatOxyPrem v1.3 incorporates shorter SDS of 15, 20, 30 & 35 mm compared to 30 &40 mm (INVOS) and 20 & 40 mm (Nonin). Therefore the OxyPrem v1.3 sensor is notonly suitable for cerebral measurements in neonates but may also be employed as areplacement of other adult sensors in a wide range of measurement locations.
The author’s tasks related to OxyPrem v1.3 development and production precedingany published studies were manifold. To name a few, he was in charge of the overalllead in engineering and elaborated possible SDS depending on the given manufacturingpossibilities, determined the set of wavelengths chosen, designed and manufacturedseveral dummy sensors for user surveys, tested manufacturing procedures and provideda major proportion of suggestions for improvement to the electronics and to the sensorin general. Furthermore, he adapted the existing software to be able to communicatewith the new sensor, designed the casing for sensor and PowerPCB and elaborated amanufacturing process for these. Whereas he was not involved in printed circuit board(PCB) layout, he was contributing to first tests and manufacturing of several sensorsas well as to definition of a test protocol.
43

3 OxyPrem v1.3
3.2 In vivo validation in neonates
3.2.1 Introduction and methods
OxyPrem v1.3 performance was assessed in vivo by the ’OxyPrem Validation’ studyperformed at Biomedical Optics Research Laboratory (BORL), Neonatology, Univer-sity Hospital Zurich (USZ). The study protocol was approved by the ethical commit-tee of Zurich (KEK 2010-0102/2) and Swissmedic (2010-MD-0019). The protocol wasamended compared to the study with OxyPrem v1.2 (Sec. 2.4) to also include latepreterm children (34 < gestational age (GA) < 37 weeks). To assess physiologic fluc-tuations, we placed a second OxyPrem v1.3 sensor occipitally over the visual cortexmeasuring through hair and recorded peripheral arterial oxygen haemoglobin satura-tion (SpO2) with a Sensmart X-100 (Nonin). Otherwise the study protocol was un-changed compared to the study with OxyPrem v1.2 (Sec. 2.4): Precision was assessedby conducting a 60 s measurement five times on the head of a neonate subject withsensor lifted and resited to the same position on the left prefrontal cortex. We took themedian of each 60 s block and analyzed these values with a linear mixed effects model(lme) [Pinheiro et al., 2016] in the statistics software R [R Core Team, 2016] to as-sess within-subject standard deviation (Sw) as indicator of repeatability and between-subject standard deviation (Sb) as indicator of reproducibility. We evaluated bothregions R1 and R2 individually as well their average (Rave).
A second sub-study assessed the haemodynamic response of the visual cortex tostimuli by a blinking screen with a duration of 20 seconds and repeated 15 times.These data look promising, but still have to be analysed by others and are thereforenot part of this thesis. To obtain data from the visual cortex with usable signal-to-noiseratio (SNR), we recruited preferably light-haired subjects in both sub-studies.
In the following, a preliminary analysis of the precision data is presented. Ta-ble 3.1 provides an overview of the study population. Haematocrit (htc) and totalhaemoglobin concentration (ctHb) of the subject’s blood are the last ones acquiredfrom the subject before the measurement. However, not necessarily have these valuesbeen taken on the same day, on which the measurement took place.
Tasks of the author related to the ’OxyPrem Validation’ study in neonates withOxyPrem v1.3 included: building the devices used (in part), preparation of the studyset-up (in part), teaching of study team members, participating in a minor part of themeasurements and data analysis of the precision assessment. Since September 2013the author was in charge of most administrative tasks related to the study includingreporting to the authorities and drafting amendments to the study protocol.
3.2.2 Results
Tables 3.2 and 3.3 show the median values of tissue oxygen haemoglobin saturation(StO2) for R1 and the average of R1 and R2 (Rave) of each 60 s block measured withthe temporal sensor lifted off and put back in place after each block. This data isvisualized in Fig. 3.3, 3.4, and 3.5 which show boxplots of temporal StO2. Fig. 3.6 and3.7 show SpO2 and occipital StO2 which indicate systemic and cerebral physiological
44
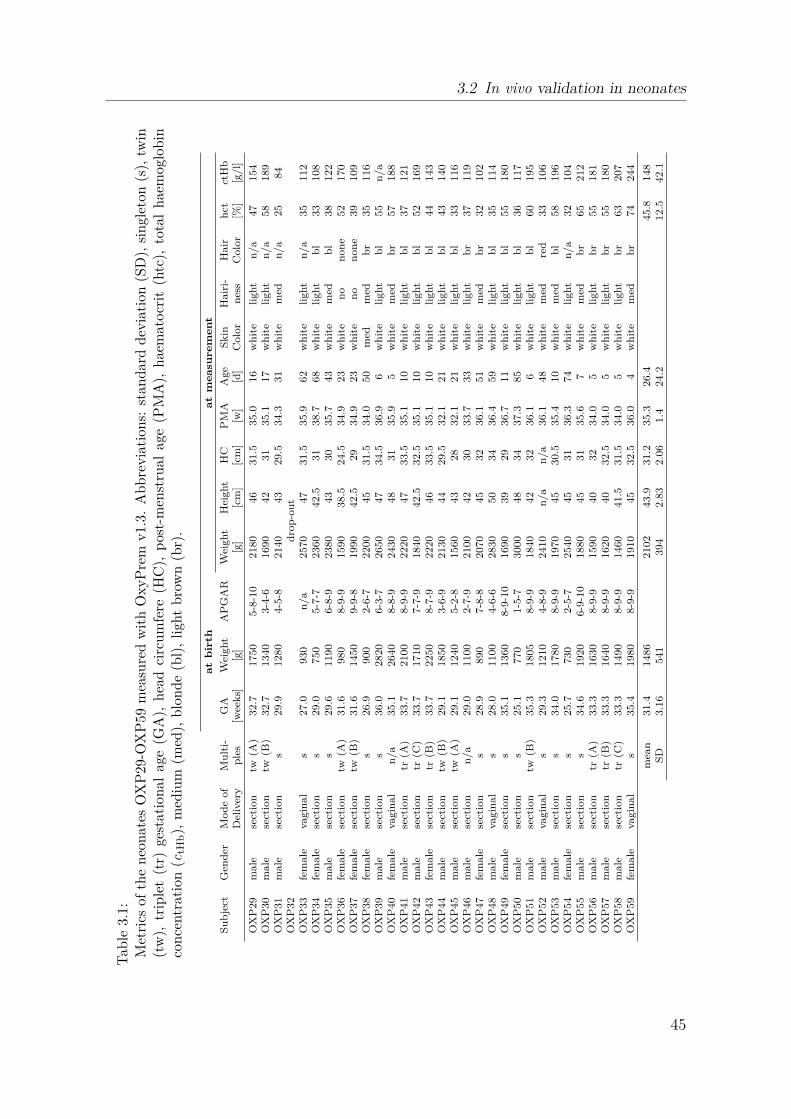
3.2 In vivo validation in neonates
Tab
le3.
1:M
etri
csof
the
neo
nat
esO
XP
29-O
XP
59
mea
sure
dw
ith
OxyP
rem
v1.
3.A
bbre
via
tion
s:st
andar
ddev
iati
on(S
D),
singl
eton
(s),
twin
(tw
),tr
iple
t(t
r)ge
stat
ional
age
(GA
),hea
dci
rcum
fere
(HC
),p
ost-
men
stru
alag
e(P
MA
),hae
mat
ocr
it(h
tc),
tota
lhae
mog
lobin
conce
ntr
ati
on(c
tHb),
med
ium
(med
),blo
nde
(bl)
,ligh
tbro
wn
(br)
.
at
bir
th
at
me
asu
re
me
nt
Su
bje
ctG
end
erM
od
eof
Mu
lti-
GA
Wei
gh
tA
PG
AR
Wei
gh
tH
eigh
tH
CP
MA
Age
Sk
inH
air
i-H
air
hct
ctH
bD
eliv
ery
ple
s[w
eek
s][g
][g
][c
m]
[cm
][w
][d
]C
olo
rn
ess
Colo
r[%
][g
/l]
OX
P29
male
sect
ion
tw(A
)32.7
1750
5-8
-10
2180
46
31.5
35.0
16
wh
ite
ligh
tn
/a
47
154
OX
P30
male
sect
ion
tw(B
)32.7
1340
3-4
-61690
42
31
35.1
17
wh
ite
ligh
tn
/a
58
189
OX
P31
male
sect
ion
s29.9
1280
4-5
-82140
43
29.5
34.3
31
wh
ite
med
n/a
25
84
OX
P32
dro
p-o
ut
OX
P33
fem
ale
vagin
al
s27.0
930
n/a
2570
47
31.5
35.9
62
wh
ite
ligh
tn
/a
35
112
OX
P34
fem
ale
sect
ion
s29.0
750
5-7
-72360
42.5
31
38.7
68
wh
ite
ligh
tb
l33
108
OX
P35
male
sect
ion
s29.6
1190
6-8
-92380
43
30
35.7
43
wh
ite
med
bl
38
122
OX
P36
fem
ale
sect
ion
tw(A
)31.6
980
8-9
-91590
38.5
24.5
34.9
23
wh
ite
no
non
e52
170
OX
P37
fem
ale
sect
ion
tw(B
)31.6
1450
9-9
-81990
42.5
29
34.9
23
wh
ite
no
non
e39
109
OX
P38
fem
ale
sect
ion
s26.9
900
2-6
-72200
45
31.5
34.0
50
med
med
br
35
116
OX
P39
male
sect
ion
s36.0
2820
6-3
-72650
47
34.5
36.9
6w
hit
eli
gh
tb
l55
n/a
OX
P40
fem
ale
vagin
al
n/a
35.1
2640
8-8
-92430
48
31
35.9
5w
hit
em
edb
r57
188
OX
P41
male
sect
ion
tr(A
)33.7
2100
8-9
-92220
47
33.5
35.1
10
wh
ite
ligh
tb
l37
121
OX
P42
male
sect
ion
tr(C
)33.7
1710
7-7
-91840
42.5
32.5
35.1
10
wh
ite
ligh
tb
l52
169
OX
P43
fem
ale
sect
ion
tr(B
)33.7
2250
8-7
-92220
46
33.5
35.1
10
wh
ite
ligh
tb
l44
143
OX
P44
male
sect
ion
tw(B
)29.1
1850
3-6
-92130
44
29.5
32.1
21
wh
ite
ligh
tb
l43
140
OX
P45
male
sect
ion
tw(A
)29.1
1240
5-2
-81560
43
28
32.1
21
wh
ite
ligh
tb
l33
116
OX
P46
male
sect
ion
n/a
29.0
1100
2-7
-92100
42
30
33.7
33
wh
ite
ligh
tb
r37
119
OX
P47
fem
ale
sect
ion
s28.9
890
7-8
-82070
45
32
36.1
51
wh
ite
med
br
32
102
OX
P48
male
vagin
al
s28.0
1100
4-6
-62830
50
34
36.4
59
wh
ite
ligh
tb
l35
114
OX
P49
fem
ale
sect
ion
s35.1
1360
8-9
-10
1690
39
29
36.7
11
wh
ite
ligh
tb
l55
180
OX
P50
male
sect
ion
s25.1
770
1-5
-73000
48
34
37.3
85
wh
ite
ligh
tb
l36
117
OX
P51
male
sect
ion
tw(B
)35.3
1805
8-9
-91840
42
32
36.1
6w
hit
eli
gh
tb
l60
195
OX
P52
male
vagin
al
s29.3
1210
4-8
-92410
n/a
n/a
36.1
48
wh
ite
med
red
33
106
OX
P53
male
sect
ion
s34.0
1780
8-9
-91970
45
30.5
35.4
10
wh
ite
med
bl
58
196
OX
P54
fem
ale
sect
ion
s25.7
730
2-5
-72540
45
31
36.3
74
wh
ite
ligh
tn
/a
32
104
OX
P55
male
sect
ion
s34.6
1920
6-9
-10
1880
45
31
35.6
7w
hit
em
edb
r65
212
OX
P56
male
sect
ion
tr(A
)33.3
1630
8-9
-91590
40
32
34.0
5w
hit
eli
gh
tb
r55
181
OX
P57
male
sect
ion
tr(B
)33.3
1640
8-9
-91620
40
32.5
34.0
5w
hit
eli
gh
tb
r55
180
OX
P58
male
sect
ion
tr(C
)33.3
1490
8-9
-91460
41.5
31.5
34.0
5w
hit
eli
gh
tb
r63
207
OX
P59
fem
ale
vagin
al
s35.4
1980
8-9
-91910
45
32.5
36.0
4w
hit
em
edb
r74
244
mea
n31.4
1486
2102
43.9
31.2
35.3
26.4
45.8
148
SD
3.1
6541
394
2.8
32.0
61.4
24.2
12.5
42.1
45
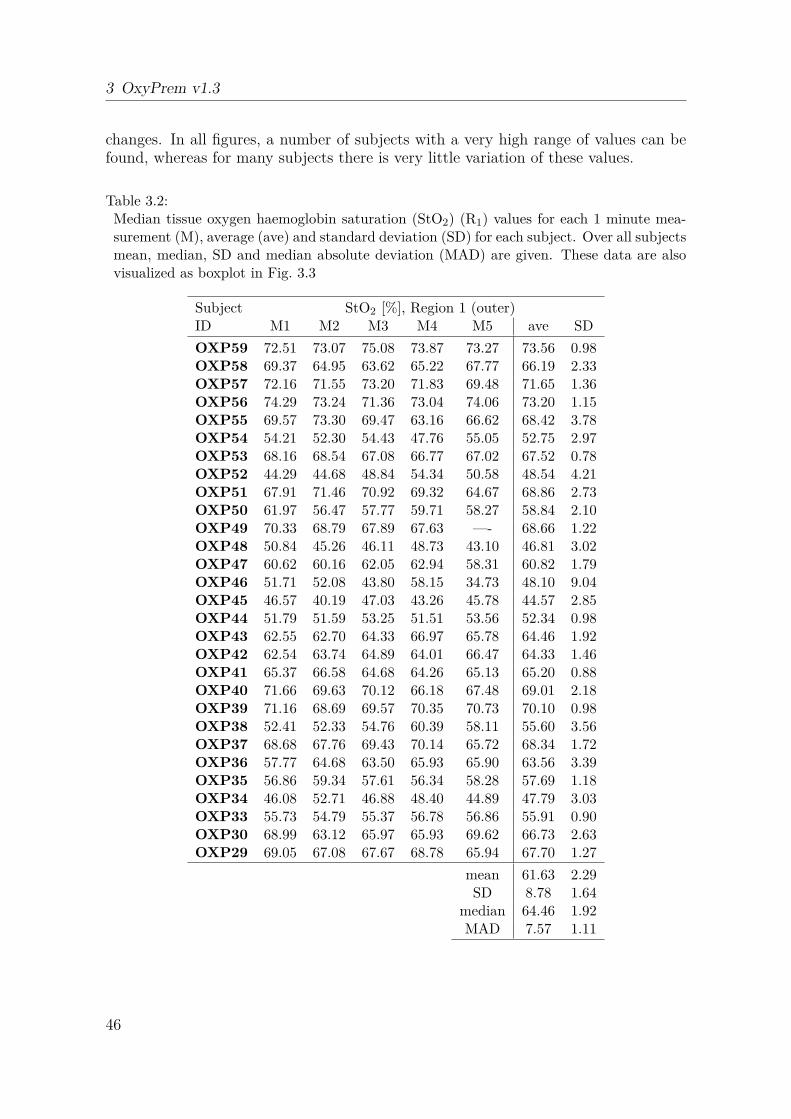
3 OxyPrem v1.3
changes. In all figures, a number of subjects with a very high range of values can befound, whereas for many subjects there is very little variation of these values.
Table 3.2:Median tissue oxygen haemoglobin saturation (StO2) (R1) values for each 1 minute mea-surement (M), average (ave) and standard deviation (SD) for each subject. Over all subjectsmean, median, SD and median absolute deviation (MAD) are given. These data are alsovisualized as boxplot in Fig. 3.3
Subject StO2 [%], Region 1 (outer)ID M1 M2 M3 M4 M5 ave SD
OXP59 72.51 73.07 75.08 73.87 73.27 73.56 0.98OXP58 69.37 64.95 63.62 65.22 67.77 66.19 2.33OXP57 72.16 71.55 73.20 71.83 69.48 71.65 1.36OXP56 74.29 73.24 71.36 73.04 74.06 73.20 1.15OXP55 69.57 73.30 69.47 63.16 66.62 68.42 3.78OXP54 54.21 52.30 54.43 47.76 55.05 52.75 2.97OXP53 68.16 68.54 67.08 66.77 67.02 67.52 0.78OXP52 44.29 44.68 48.84 54.34 50.58 48.54 4.21OXP51 67.91 71.46 70.92 69.32 64.67 68.86 2.73OXP50 61.97 56.47 57.77 59.71 58.27 58.84 2.10OXP49 70.33 68.79 67.89 67.63 —- 68.66 1.22OXP48 50.84 45.26 46.11 48.73 43.10 46.81 3.02OXP47 60.62 60.16 62.05 62.94 58.31 60.82 1.79OXP46 51.71 52.08 43.80 58.15 34.73 48.10 9.04OXP45 46.57 40.19 47.03 43.26 45.78 44.57 2.85OXP44 51.79 51.59 53.25 51.51 53.56 52.34 0.98OXP43 62.55 62.70 64.33 66.97 65.78 64.46 1.92OXP42 62.54 63.74 64.89 64.01 66.47 64.33 1.46OXP41 65.37 66.58 64.68 64.26 65.13 65.20 0.88OXP40 71.66 69.63 70.12 66.18 67.48 69.01 2.18OXP39 71.16 68.69 69.57 70.35 70.73 70.10 0.98OXP38 52.41 52.33 54.76 60.39 58.11 55.60 3.56OXP37 68.68 67.76 69.43 70.14 65.72 68.34 1.72OXP36 57.77 64.68 63.50 65.93 65.90 63.56 3.39OXP35 56.86 59.34 57.61 56.34 58.28 57.69 1.18OXP34 46.08 52.71 46.88 48.40 44.89 47.79 3.03OXP33 55.73 54.79 55.37 56.78 56.86 55.91 0.90OXP30 68.99 63.12 65.97 65.93 69.62 66.73 2.63OXP29 69.05 67.08 67.67 68.78 65.94 67.70 1.27
mean 61.63 2.29SD 8.78 1.64
median 64.46 1.92MAD 7.57 1.11
46

3.2 In vivo validation in neonates
Table 3.3:Median tissue oxygen haemoglobin saturation (StO2) (Rave) values for each 1 minute mea-surement (M), average (ave) and standard deviation (SD) for each subject. Over all subjectsmean, median, SD and median absolute deviation (MAD) are given. These data are alsovisualized as boxplot in Fig. 3.5
Subject StO2 [%], average of regions 1 and 2ID M1 M2 M3 M4 M5 ave SD
OXP59 68.37 66.98 69.08 68.73 67.83 68.20 0.82OXP58 66.50 54.08 59.53 60.11 61.90 60.42 4.48OXP57 72.25 70.56 72.56 70.90 65.60 70.38 2.80OXP56 74.75 74.47 72.84 73.53 72.52 73.62 0.98OXP55 68.98 73.02 68.63 61.91 62.69 67.05 4.67OXP54 49.99 48.47 43.26 40.97 46.68 45.87 3.72OXP53 63.42 66.78 64.13 64.16 63.22 64.34 1.43OXP52 44.77 43.91 47.40 55.65 48.09 47.96 4.64OXP51 68.24 71.20 71.23 69.39 64.54 68.92 2.76OXP50 56.17 48.97 51.70 54.14 49.08 52.01 3.15OXP49 64.39 67.65 63.82 63.86 —- 64.93 1.83OXP48 49.32 45.22 43.23 29.79 -1.56 33.20 20.77OXP47 53.66 59.86 61.65 61.63 54.57 58.27 3.88OXP46 52.17 52.51 39.80 57.92 33.59 47.20 10.10OXP45 47.91 37.79 44.41 45.61 45.58 44.26 3.83OXP44 54.04 53.26 54.94 53.47 54.93 54.13 0.79OXP43 61.51 62.77 64.07 67.93 64.27 64.11 2.40OXP42 63.32 63.30 64.75 64.59 66.65 64.52 1.37OXP41 66.22 67.79 65.49 65.06 67.47 66.40 1.20OXP40 71.52 69.13 69.98 66.70 67.97 69.06 1.85OXP39 68.59 65.98 68.40 67.60 68.96 67.90 1.18OXP38 54.74 46.78 56.48 62.40 60.00 56.08 5.99OXP37 68.98 69.08 70.06 70.86 68.75 69.54 0.89OXP36 54.43 63.66 61.94 64.26 64.77 61.81 4.26OXP35 55.96 59.67 52.74 56.06 51.91 55.27 3.09OXP34 40.72 52.17 47.39 45.73 40.61 45.32 4.87OXP33 57.06 55.63 54.89 56.39 57.93 56.38 1.19OXP30 66.11 62.11 62.29 66.81 66.39 64.74 2.34OXP29 69.63 67.03 68.18 67.64 65.20 67.53 1.62
mean 59.64 3.55SD 9.94 3.87
median 64.11 2.76MAD 8.25 2.22
47

3 OxyPrem v1.3
Subject OXPxx
0
10
20
30
40
50
60
70
80
90
100
StO
2 [%]
29 30 33 34 35 36 37 38 39 40 41 42 43 44 45 46 47 48 49 50 51 52 53 54 55 56 57 58 59
Figure 3.3:Boxplot of R1 tissue oxygenhaemoglobin saturation (StO2) data(temporal sensor).
Subject OXPxx
0
10
20
30
40
50
60
70
80
90
100
StO
2 [%]
29 30 33 34 35 36 37 38 39 40 41 42 43 44 45 46 47 48 49 50 51 52 53 54 55 56 57 58 59
Figure 3.4:Boxplot of R2 tissue oxygenhaemoglobin saturation (StO2) data(temporal sensor).
Subject OXPxx
0
10
20
30
40
50
60
70
80
90
100
StO
2 [%]
29 30 33 34 35 36 37 38 39 40 41 42 43 44 45 46 47 48 49 50 51 52 53 54 55 56 57 58 59
Figure 3.5:Boxplot of Rave tissue oxygenhaemoglobin saturation (StO2) data(temporal sensor). Colored data ismarked by the quality criteria andis excluded from analysis because ofmissing peripheral arterial oxygenhaemoglobin saturation (SpO2) data(blue) or because of unstable subjectphysiology (red: SpO2, brown: occipitalStO2).
55
60
65
70
75
80
85
90
95
100
105
SpO
2 [%]
29 30 33 34 35 36 37 38 39 40 41 42 43 44 45 46 47 48 49 50 51 52 53 54 55 56 57 58 59
Subject OXPxx
Figure 3.6:Boxplot of peripheral arterial oxygenhaemoglobin saturation (SpO2) data.Subjects marked in red are excluded be-cause the standard deviation (SD) of thefive 60 s-median values is greater 2 %which indicates unstable physiology.
48

3.2 In vivo validation in neonates
Subject OXPxx
0
10
20
30
40
50
60
70
80
90
100
StO
2 [%]
29 30 33 34 35 36 37 38 39 40 41 42 43 44 45 46 47 48 49 50 51 52 53 54 55 56 57 58 59
Figure 3.7:Boxplot of Rave tissue oxygenhaemoglobin saturation (StO2) data(occipital sensor).
30 35 40 45 50 55 60Subject
0
0.02
0.04
0.06
0.08
0.1
std(
SpO
2)
Figure 3.8:Plot of standard deviation (SD) of SpO2
throughout the whole measurement foreach subject
Table 3.4:Residual (repeatability, intra-subject variability) and intercept (reproducibility, inter-subject variability) for tissue oxygen haemoglobin saturation (StO2) obtained by a lmefor both regions R1 and R2 as well as their average (Rave). Additionally Rave of the occip-ital sensor (Occ) and peripheral arterial oxygen haemoglobin saturation (SpO2) are givenas markers for physiological changes. ’Stable physiology’ means that only subjects withSD(SpO2) < 2 % and SD(StO2) < 7.5 % for the occipital sensor were included in theanalysis. All values in [%].
All available data (n = 27-29) Stable physiology (n = 18)StO2 SpO2 StO2 SpO2
Temporal Occ Temporal OccR1 R2 Rave Rave R1 R2 Rave Rave
Repeatability 2.81 8.87 5.22 4.49 2.55 1.93 3.88 2.64 2.84 0.97Reproducibility 8.69 11.3 9.66 12.8 5.65 6.93 8.29 7.27 8.27 3.83
49

3 OxyPrem v1.3
OXP42
0 50 100 150 200 250 300 350 400 450t[s]
0
20
40
60
80
100
SpO
2, StO
2 [%]
ev (temporal)SpO2StO
2 R
ave (occipital)
StO2 R
ave (temporal)
Figure 3.9:Aligned time series of StO2 and SpO2 of subject OXP42. Fluctuations are visible in bothStO2 and the SpO2 traces. Amplitudes are different but their shape is very similar. Themagnitude of these fluctuations is larger than shifts introduced by sensor repositioning.Subject handling also creates shifts in occipital sensor readings without the sensor beinglifted off and put back into place.
OXP42
200 220 240 260 280 300 320 340 360 380 400t[s]
-3
-2
-1
0
1
2
3
Z-s
core
ev (temporal)SpO2StO
2 R
ave (occipital)
StO2 R
ave (temporal)
Figure 3.10:Z-score of tissue oxygen haemoglobin saturation (StO2) and peripheral arterial oxygenhaemoglobin saturation (SpO2) of subject OXP42. Strong fluctuations are visible in bothStO2 and SpO2 are highly synchronized.
50

3.2 In vivo validation in neonates
OXP41 temporal sensor
50 100 150 200 250 300 350
Time [s]
60
65
70
75
80
85S
tO2
[%]
StO2
R1
StO2
R2
measurement period
Figure 3.11:Tissue oxygen haemoglobin saturation (StO2) time series of R1 and R2 (temporal sensor) ofa typical subject. Variations during the measurement periods, most likely from physiologicorigin, are less pronounced in R1 than in R2.
3.2.3 Discussion
If all data are taken into account, a temporal Sw of 5.22 % is obtained for Rave. Thisvalue is in the range reported in the literature. R1 performs much better with temporalSw = 2.81 %, which is significantly better than each single region in OxyPrem v1.2(Sec. 2.4). However, occipital Sw = 4.49 % (Rave) and SpO2 Sw = 2.55 % are alsorelatively high. This shows that there is a lot of variation even without the processof lifting the temporal sensor off and putting it back in place. Please note that thesenumbers are each based on slightly different sets of subjects due to partially incompletedatasets. For two subjects (OXP33 and OXP48), there were technical problems withthe pulse oximeter resulting in no valid data available and in one subject we were notable to record occipital StO2 (OXP37). Subject OXP32 was completely excluded fromanalysis because inclusion criteria were not fulfilled and for subject OXP33 there wasaccidentally no data recorded.
Fig. 3.9 shows typical time series of temporal and occipital StO2 and SpO2. SpO2
fluctuates with SD of almost 4% (Fig. 3.8). With smaller amplitude, these oscillationsare visible in both StO2 signals as well. It can be observed that most of the variation inthe temporal StO2 is not actually caused by the action of shortly removing the sensorand putting it back onto the same spot. Furthermore, in the occipital StO2 evenstronger changes are visible, even though the sensor was not resited. This suggeststhat precision measurements in neonates are strongly confounded by physiologicalchanges in the subjects.
Fig. 3.10 shows data from the same subject as Z-score of both StO2 and SpO2. Z-scores were calculated with median and median absolute deviation (MAD) of the timepoints shown in the plot: Z-score(x) = (x − median(x))/MAD(x). Fig. 3.10 reveals
51
3 OxyPrem v1.3
that variations in both StO2 and SpO2 are strongly synchronized and that they showthe same periodicity and shape.
Table 3.4 shows the effect of removing the physiologically most unstable subjects onSw. Both repeatability as well as reproducibility clearly improve. To identify subjectswith instable physiology, a set of criteria were applied: (i) missing pulse oximeter data(blue in Fig. 3.5, 2 subjects), (ii) high variation in SpO2 (red in Fig. 3.5, SD > 2 %between blocks, 8 subjects), and (iii) high variation in occipital StO2 (brown in Fig. 3.5,SD> 7.5% between blocks, 1 subject). Application of these criteria filtered 11 subjectsout and in an analysis of the remaining 18 subjects temporal Sw = 2.64 % (Rave) andSw = 1.93 % (R1), which is amongst the best values reported so far.
Occipital Sw = 2.84% (Rave) and SpO2 Sw = 0.97% show that the stability criterionindeed reduced physiological fluctuations which cause reproducibility and repeatabilityto appear inappropriately high. It seems even likely, that with modest stability criteriaas we have chosen for this analysis, there is still a major contribution of physiologicalfluctuations to Sw, because numbers for the temporal sensor (which was resited) andfor the occipital sensor (which was kept in place) are still almost the same.
Based on criteria referring to physiological changes recorded by other sensors thanthe temporal near-infrared spectroscopy (NIRS) sensor, Sw of the resited sensor wassubstantially decreased to reach the range of precision required for clinical practice(< 3 %, [Wolf and Greisen, 2009, Greisen et al., 2016]). This, on the other hand, alsomeans that higher Sw findings in neonates compared to other patient groups are prob-ably caused by the unstable physiology in neonates rather than sensor imprecision. Wetherefore suggest to always measure a systemic physiological parameter such as SpO2
or if possible even a cerebral physiological parameter such as StO2 in a different partof the brain to have independent measures for detection of physiologically unstablesubjects. Otherwise fluctuations in subject physiology may corrupt precision results.
Fig.3.9 also shows another effect that matters in precision measurements. Theshorter the intervals, the stronger the effect of physiologic fluctuations. In this sub-ject, one period of physiological fluctuation is approximately 15 s. The chosen blocksize of 60 s averages these changes over several periods. Therefore, they cancel to acertain degree. Although SD of SpO2 over the full measurement in subject OXP42is almost 4 % (Fig. 3.8), this measurement passed the stability criteria with a SD of1.06 % over the median values of the five 60 s blocks. With shorter block sizes, thissmoothing effect diminishes, resulting in higher Sw. This may explain the improvedprecision we measured for OxyPrem v1.2 in our study (Sec. 2.4) compared to that ofHyttel-Sorensen et al. [Hyttel-Sorensen et al., 2014b].
Throughout all analyses, R1 (temporal Sw = 2.81 %, after criteria: temporal Sw =1.93%) performs much better than R2 (temporal Sw = 8.87%, after criteria: temporalSw = 3.88%) and also than Rave. This shows that averaging of two independent valuesin the specific case of OxyPrem v1.3 is not beneficial. This could be partially causedby R1 and R2 not being independent from each other, as they probe very similartissues. We would expect very similar behavior of the two regions, which is, however,not the case. In contrary, R1 performs superior to R2. It is likely, that this differencein repeatability is caused by geometric effects. R1 is calculated from light paths with15 mm and 35 mm whereas R2 is calculated from light paths with 20 mm and 30 mmsource-detector separation (SDS) (Fig. 3.2). This is related to multiple effects which
52

3.3 Summary on OxyPrem v1.3
may all contribute to the observed result: (i) The light sources of R2 may be moredifficult to bring into tight contact with tissue because of their location in the middle ofthe sensor, in particular because operators may be focused on achieving good contactfor the detectors which are the outermost elements. (ii) The difference of SDS in thebetter performing R1 is 20 mm, whereas this difference is only 10 mm in R2. This maycause accuracy problems when the sensor is bent strongly, as SDS of short and longlight paths might be differently affected. (iii) Due to higher SDS, R1 probes into deepertissue than R2. Therefore, there is less contribution of superficial tissue such as theskin to the StO2 signal of R1 than to that of R2. This has effect on Sw because thereare changes in blood volume and oxygenation expected in the skin due to ’pumping’effects when pressure on the tissue is changed during sensor manipulation.
It is worth noting that we were able to obtain reliable StO2 readings with theOxyPrem v1.3 sensor being placed occipitally on the visual cortex. These measure-ments were performed through hair, while there was no special preparation of thesubject’s hair. Subjects were mostly light-skinned and their hair was on average oflittle to medium density and of light color (Table 3.1). The maximum possible densityand darkness of hair is still to be determined. Nonetheless, the fact that we were ableto obtain readings at all, while measuring through hair without special precautions,is an achievement which we attribute to the improved design of the OxyPrem v1.3sensor.
3.2.4 Conclusion
In conclusion, we have found that subject physiology strongly influences the within-subject standard deviation (Sw), which was obtained for repeated placement of a tem-poral near-infrared spectroscopy (NIRS) sensor in the experiments. Sw in neonates isdominated by physiological variations occurring systemically or cerebrally and thereis only a minor contribution to Sw by the repeated measurement itself. To reducethis confounder, it is suggested to measure subject physiology in parallel and to applyquality criteria. With these measures, an overestimation of Sw in in vivo precisionassessments can be effectively reduced. A closer look at the data reveals that Sw couldbe as low as 2.6% for the average tissue oxygen haemoglobin saturation (StO2) of bothregions and 1.9 % for the outer region R1. This is the case if two subjects with incom-plete data and nine subjects with very unstable physiology are removed from analysis.Sw of 1.9 % is one of the best Sw ever reported and shows that OxyPrem v1.3 achievesexceptionally good precision. The fact that this was achieved in neonates underlinesthe good performance of OxPrem v1.3, because Sw in neonates are typically higherthan for other populations (Sec. 1.2.3). As a remarkable fact, it was possible to obtainreliable StO2 readings with an OxyPrem v1.3 sensor being occipitally placed on thevisual cortex without special treatment of hair.
3.3 Summary on OxyPrem v1.3
In this chapter, the near-infrared spectroscopy (NIRS) oximeter OxyPrem v1.3(Sec. 3.1) has been introduced. It was developed as successor of OxyPrem v1.2 which
53
3 OxyPrem v1.3
had shown several shortcomings in research practice. OxyPrem v1.3 performance wasassessed both in vivo in neonates and in vitro in liquid phantom experiments. Thesestudies revealed that all limitations present in the previous version OxyPrem v1.2were overcome by the redesigned OxyPrem v1.3.
In a precision study with OxyPrem v1.3, a superior within-subject standard de-viation (Sw) of 1.9 % for the outer region R1 in physiologically stable subjects wereobtained (Sec. 3.2). The ’technical’ precision, however, may be even higher becausewe still allowed for 2 % fluctuation in peripheral arterial oxygen haemoglobin satura-tion (SpO2) which confounds also Sw of tissue oxygen haemoglobin saturation (StO2).Still, OxyPrem v1.3 repeatability is amongst the best ever reported and below the3 % requested from clinicians [Wolf and Greisen, 2009, Greisen et al., 2016]. Thus,the latest prototype represents a major progress.
A large part of the improvements achieved can be attributed to the changes per-formed to the sensor in terms of shape and geometry. Compared to its predeces-sor, OxyPrem v1.3 shows improved applicability to tiny heads and is also easier tohandle because of improved ambient light shielding. Signal-to-noise ratio (SNR) ofOxyPrem v1.3 signals was substantially higher on the neonatology ward than SNR ofits predecessor. Although we have not quantified SNR, it has reached a level whichallows for functional activation studies with time resolution > 1 Hz, even in clinicalsettings associated with strong electro-magnetic interference (EMI).
An in vitro experiment in a liquid phantom (Sec. 4.3) showed that OxyPrem v1.3was the only continuous-wave (CW) NIRS oximeter whose StO2 readings were notinfluenced by changes in phantom total haemoglobin concentration (ctHb). As shownin table 4.6, at the hypoxic threshold of the safeguarding the brains of our smallestchildren (SafeBoosC) study common CW NIRS oximeters showed uncertainty in StO2
of up to 9.2 %, whereas we measured 1.9 % for OxyPrem v1.3. This is an importantdevice characteristic for clinicians eager to profit from absolute StO2 in their clinicaldecision-making because the displayed value is more reliable than with most otherNIRS oximeters.
Although OxyPrem v1.3 was not explicitly developed for use in adults, it main-tained even slightly more of its initial sensitivity in presence of a superficial layer thantwo common CW NIRS oximeters with adult sensors (Sec. 4.5). This means thatOxyPrem v1.3 can be used just as well in other patient groups such as adolescents andadults. It seems also qualified to replace other NIRS sensors designed to measure atother locations than the brain such as in muscles.
In conclusion, we have built a new NIRS oximeter which has outperformed a numberof widely used oximeters in several aspects. This was proven both for in vitro aswell as for in vivo measurements. The OxyPrem v1.3 is thus a highly precise NIRSoximeter whose StO2 readings are not affected by changes in ctHb. In presence of thickersuperficial layers OxyPrem v1.3 showed similar performance as compared to widelyused adult sensors. After this thorough validation and the experience we obtained invivo, the device is now ready for translation into clinical practice.
54

4 Phantom set-up for quantitative oximetercomparison
4.1 Improved liquid phantom set-up
4.1.1 Introduction
In the first intralipid (IL) phantom experiment (Sec. 2.2) we failed to provide a ref-erence tissue oxygen haemoglobin saturation (StO2) by co-oximetry. In the secondexperiment (Sec. 2.3) we also failed to calculate a reference StO2 by inserted oxygenpartial pressure (pO2) probes and repeated blood gas analysis data. In both exper-iments had potential problems with inhomogeneous oxygen haemoglobin saturation(SO2) at different heights. In the first experiment, the main concern was the outlettube where liquid coming from the membrane oxygenator had very different SO2. Inthe second experiment this concern was mainly based on an offset observed betweenexperiments of two subsequent days during which sensors were remounted, some prob-ably at slightly different heights, and because of a mismatch between two pO2 sensorswhich were placed in the phantom at different heights but unfortunately did not pro-vide trustworthy data. This uncertainty about phantom homogeneity was undesiredbecause it raised some questions about the validity of the data obtained from near-infrared spectroscopy (NIRS) sensors. During the development of a new set-up wetherefore solved these problems.
4.1.2 Set-up description
We designed a phantom container which can hold sensors for pO2, carbon dioxide par-tial pressure (pCO2), pH and temperature (T ), all measuring at the same height insidethe liquid. This enables calculation of SO2 if additionally 2,3-diphosphoglycerate con-centration (cDPG) is measured and an appropriate model is used. Dash et al. developeda model allowing for several parameters to deviate from the normal value at the sametime [Dash et al., 2016]. All these sensors are mounted in a single holder which canbe moved up-and downwards for height-scanning of the phantom. Therefore, a possi-ble gradient in pO2 can be detected. Additionally, we created the possibility to addOxyVLS, an oximeter based on visible-light spectroscopy (VLS) [Nasseri et al., 2016b].OxyVLS measures SO2 very locally and independent from scattering. Fig. 4.1 and 4.2show this set-up.
In the previous phantom experiments, sensors had to be put inside the liquid whichsometimes resulted in electric problems because of moisture penetrating connectors orthe sensor itself. Putting sensors inside thin plastic bags for protection from moisture
55
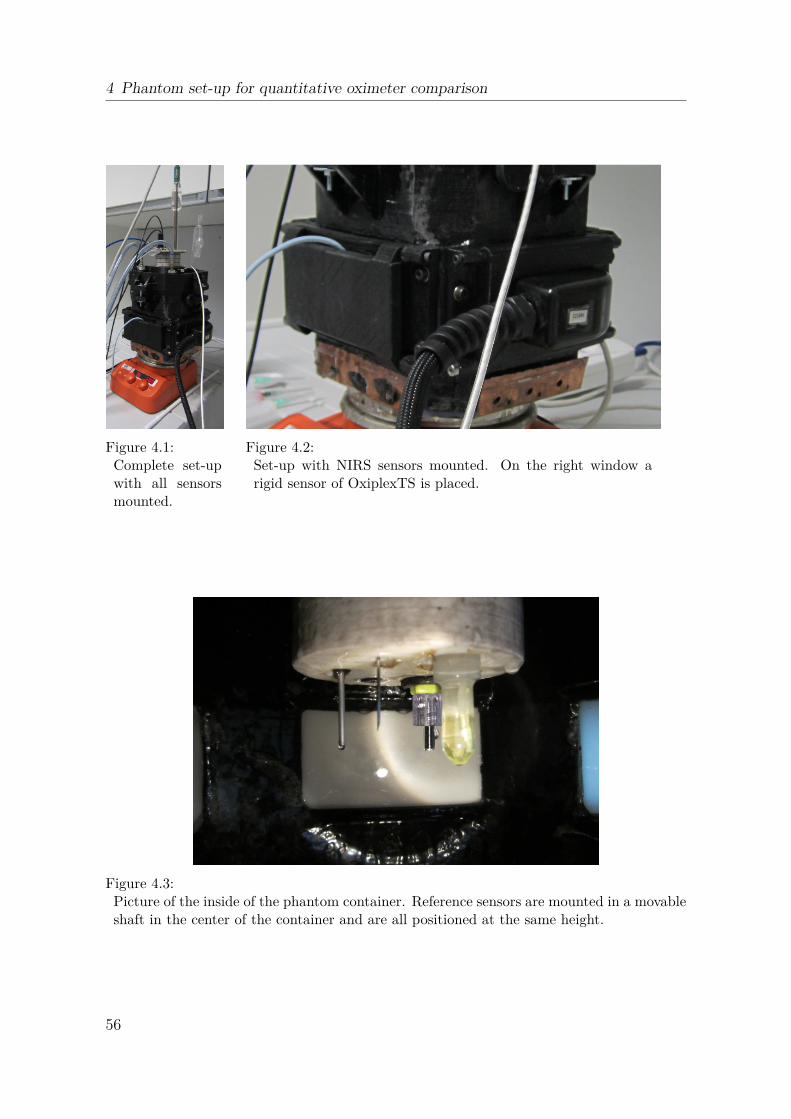
4 Phantom set-up for quantitative oximeter comparison
Figure 4.1:Complete set-upwith all sensorsmounted.
Figure 4.2:Set-up with NIRS sensors mounted. On the right window arigid sensor of OxiplexTS is placed.
Figure 4.3:Picture of the inside of the phantom container. Reference sensors are mounted in a movableshaft in the center of the container and are all positioned at the same height.
56
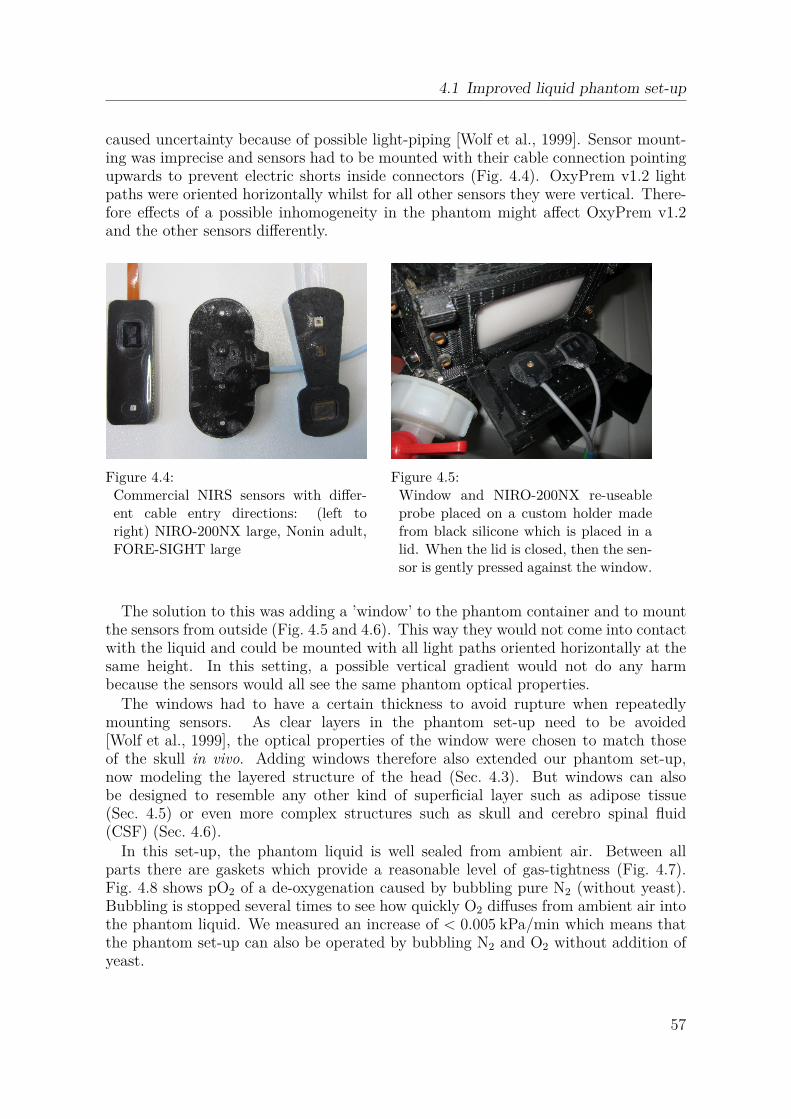
4.1 Improved liquid phantom set-up
caused uncertainty because of possible light-piping [Wolf et al., 1999]. Sensor mount-ing was imprecise and sensors had to be mounted with their cable connection pointingupwards to prevent electric shorts inside connectors (Fig. 4.4). OxyPrem v1.2 lightpaths were oriented horizontally whilst for all other sensors they were vertical. There-fore effects of a possible inhomogeneity in the phantom might affect OxyPrem v1.2and the other sensors differently.
Figure 4.4:Commercial NIRS sensors with differ-ent cable entry directions: (left toright) NIRO-200NX large, Nonin adult,FORE-SIGHT large
Figure 4.5:Window and NIRO-200NX re-useableprobe placed on a custom holder madefrom black silicone which is placed in alid. When the lid is closed, then the sen-sor is gently pressed against the window.
The solution to this was adding a ’window’ to the phantom container and to mountthe sensors from outside (Fig. 4.5 and 4.6). This way they would not come into contactwith the liquid and could be mounted with all light paths oriented horizontally at thesame height. In this setting, a possible vertical gradient would not do any harmbecause the sensors would all see the same phantom optical properties.
The windows had to have a certain thickness to avoid rupture when repeatedlymounting sensors. As clear layers in the phantom set-up need to be avoided[Wolf et al., 1999], the optical properties of the window were chosen to match thoseof the skull in vivo. Adding windows therefore also extended our phantom set-up,now modeling the layered structure of the head (Sec. 4.3). But windows can alsobe designed to resemble any other kind of superficial layer such as adipose tissue(Sec. 4.5) or even more complex structures such as skull and cerebro spinal fluid(CSF) (Sec. 4.6).
In this set-up, the phantom liquid is well sealed from ambient air. Between allparts there are gaskets which provide a reasonable level of gas-tightness (Fig. 4.7).Fig. 4.8 shows pO2 of a de-oxygenation caused by bubbling pure N2 (without yeast).Bubbling is stopped several times to see how quickly O2 diffuses from ambient air intothe phantom liquid. We measured an increase of < 0.005 kPa/min which means thatthe phantom set-up can also be operated by bubbling N2 and O2 without addition ofyeast.
57

4 Phantom set-up for quantitative oximeter comparison
Figure 4.6:Phantom container with a windowmounted. The frame is fixated withscrews pressing the silicone windowagainst the phantom container therebysealing it. Thickness of the windows canbe chosen freely.
Temp pCO2
TempTemp
pO2
pH
Figure 4.7:Reference sensors mounted to the mid-dle shaft. Gaskets between all parts pre-vent O2 from abient air from enteringthe phantom.
500 1000 1500 2000 2500 3000 3500 4000 4500 5000 5500Time [s]
1
2
3
4
5
pO2 [k
Pa]
bubbling N2
increase of 0.04 kPain 9 min
bubbling O2
Figure 4.8:pO2 when bubbling pure nitrogen (N2) with repeated stops which appear as plateaus withslow increase of 0.04 kPa in 9 min. The rapid increase at the end is caused by bubblingpure oxygen (O2).
58

4.1 Improved liquid phantom set-up
Figure 4.9:Phantom container with the middleshaft carrying the reference sensors atlowest possible position.
Figure 4.10:Phantom container with the middleshaft carrying the reference sensors athighest possible position.
4.1.3 Homogeneity test
Previously, phantom homogeneity was a concern. To test the homogeneity of thephantom, we de-oxygenated it by yeast and kept the container on a magnetic stirrerat 500 rpm. We monitored pO2 with a sensor mounted in the shaft which was movedup and down repeatedly. The two positions were approximately 8 cm different inheight (Fig. 4.9 and 4.10). The pO2 measurements (Fig. 4.11) revealed a differenceof approximately 0.3 kPa over this height difference. If we assume that the gradientis linear and that is is possible to place sensors with an accuracy of 0.5 cm, then thisrefers to a pO2 difference of < 0.02 kPa which is low enough to make meaningful andrepeatable experiments.
4.1.4 Effect of yeast on device readings
Although we had used yeast previously to de-oxygenate liquid phantoms[Kleiser et al., 2016a], we used the ability of the set-up to bubble N2 for de-oxygenation. We compared StO2 readings while bubbling N2 to those obtained whenperforming a second de-oxygenation in the same phantom after addition of yeast.We included a frequency domain (FD) oximeter, OxiplexTS (ISS), as reference andthree different continuous-wave (CW) oximeters with neonatal sensors. The phantomconsisted of phosphate buffered saline (PBS), human blood and IL. We aimed at totalhaemoglobin concentration (ctHb) = 45 µM and reduced scattering coefficient (µ
′
s) of5.5 cm−1. The experiment was part of the measurement series presented in Sec. 4.6,but this data is not presented there.
Fig. 4.12 shows StO2 of all oximeters. The edges of the curves at 50, 90 and 125 min
59

4 Phantom set-up for quantitative oximeter comparison
Figure 4.11:(left) pO2 of a phantom de-oxygenation by yeast while moving the middle shaft up anddown by ≈ 8 cm repeatedly. The data displayed in red color was analysed. (right) plot ofthe red samples with the linear fit over these subtracted. The two states (up and down)can be differentiated.
correspond to increases in N2 flow. At 140 min N2 flow is stopped, which causes anincrease in StO2 and is accelerated at 145 min by addition of O2 gas at a rate of 2l/min.At 160 min, 3 g of yeast are added which causes a second, faster de-saturation of thephantom.
OxiplexTS measures µ′
s and we used this to observe stability of the phantom interms of scattering. Fig. 4.13 shows a slight oxygenation dependence in µ
′
s reading at690 nm. Therefore, stability of µ
′
s should be assessed based on the 830 nm curve. µ′
s isinitially unchanged and after 100 min it decreases over time to a value which is ≈ 10%lower than the baseline value. The decrease is stopped at 140 min when addition ofN2 stopped. The artifact at 160 min was most likely caused by detector saturation. Afew min after this artifact, there is a small step-like increase in µ
′
s observable which iscaused by addition of yeast.
Fig.4.14-4.16 show StO2 of the three CW oximeters on the y-axis compared toOxiplexTS on the x-axis for both types of de-oxygenation. For INVOS neonatal thereis almost perfect agreement throughout the whole StO2 range. For NIRO 200 smallthere is perfect agreement at high StO2 and a slight deviation (≈ 2 %) for very lowStO2. For FORE-SIGHT small there is a constant offset of approximately 3% betweenthe two de-oxygenations.
Bubbling N2 is in principle the ’cleaner’ solution because no additional substanceshave to be added to the phantom. However, de-oxygenation works by gas exchangefrom the liquid into the N2 bubbles. This is creates local inhomogeneities withinthe phantom and is inefficient, as it requires high gas flows and takes a long time.Additionally, the mechanical stress through bubbling hampers stability of IL in thephantom, as diagnosed by a decrease in µ
′
s of ≈ 10 %. Addition of yeast on the otherhand, slightly increases µ
′
s but adds only negligibly to absorption. Spectra of µ′
s andabsorption coefficient (µa) are both flat without distinctive peaks (Fig. 4.48, Sec. 4.6).
60
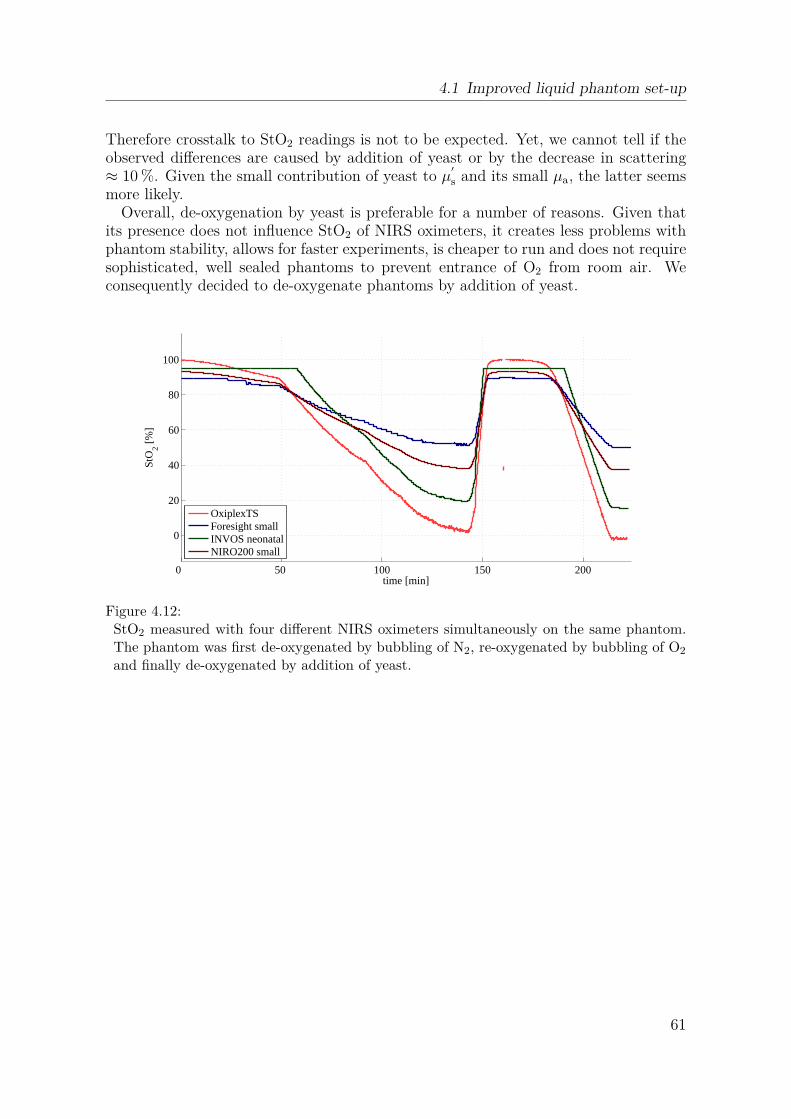
4.1 Improved liquid phantom set-up
Therefore crosstalk to StO2 readings is not to be expected. Yet, we cannot tell if theobserved differences are caused by addition of yeast or by the decrease in scattering≈ 10 %. Given the small contribution of yeast to µ
′
s and its small µa, the latter seemsmore likely.
Overall, de-oxygenation by yeast is preferable for a number of reasons. Given thatits presence does not influence StO2 of NIRS oximeters, it creates less problems withphantom stability, allows for faster experiments, is cheaper to run and does not requiresophisticated, well sealed phantoms to prevent entrance of O2 from room air. Weconsequently decided to de-oxygenate phantoms by addition of yeast.
time [min]
StO
2 [%]
0 50 100 150 200
0
20
40
60
80
100
OxiplexTSForesight smallINVOS neonatalNIRO200 small
Figure 4.12:StO2 measured with four different NIRS oximeters simultaneously on the same phantom.The phantom was first de-oxygenated by bubbling of N2, re-oxygenated by bubbling of O2
and finally de-oxygenated by addition of yeast.
61
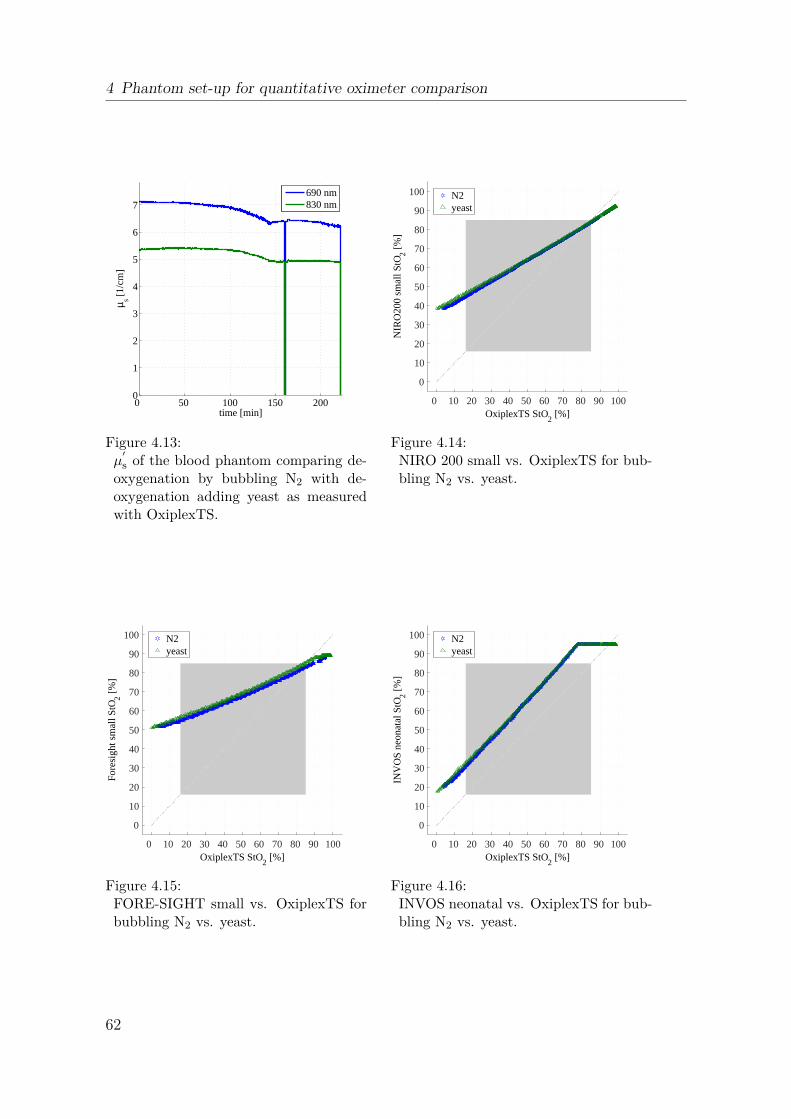
4 Phantom set-up for quantitative oximeter comparison
µ s [1/c
m]
time [min]
0 50 100 150 2000
1
2
3
4
5
6
7690 nm830 nm
Figure 4.13:µ
′
s of the blood phantom comparing de-oxygenation by bubbling N2 with de-oxygenation adding yeast as measuredwith OxiplexTS.
0 10 20 30 40 50 60 70 80 90 100OxiplexTS StO
2 [%]
0
10
20
30
40
50
60
70
80
90
100
NIR
O20
0 sm
all S
tO 2 [%]
N2yeast
Figure 4.14:NIRO 200 small vs. OxiplexTS for bub-bling N2 vs. yeast.
0 10 20 30 40 50 60 70 80 90 100OxiplexTS StO
2 [%]
0
10
20
30
40
50
60
70
80
90
100
For
esig
ht s
mal
l StO 2 [%
]
N2yeast
Figure 4.15:FORE-SIGHT small vs. OxiplexTS forbubbling N2 vs. yeast.
0 10 20 30 40 50 60 70 80 90 100OxiplexTS StO
2 [%]
0
10
20
30
40
50
60
70
80
90
100
INV
OS
neo
nata
l StO 2 [%
]
N2yeast
Figure 4.16:INVOS neonatal vs. OxiplexTS for bub-bling N2 vs. yeast.
62

4.2 Application of the set-up
4.2 Application of the set-up
Several different aspects related to NIRS oximeters have been investigated with thisphantom set-up. Sec. 4.3 and 4.4 compare oximeters quantitatively with the phantomsimulating a neonatal head at different levels of ctHb. Sec. 4.5 compares relative sen-sitivity of oximeters with the phantom simulating muscle oxygenation measurementswith different adipose tissue thickness (ATT). Sec. 4.6 describes a series of measure-ments with the phantom simulating the neonatal head whilst effects of several typicalapplication errors are investigated.
Tasks of the author during development of this phantom set-up comprised: CADdesign of all parts of the container and manufacturing of them with a 3D-printer,assembly of the container and silicone gasket design and fabrication. Based on a liter-ature search by Nassim Nasseri, the author engineered silicone composition for desiredwindow properties (with help of Linda Ahnen) and manufactured the windows (forskull and adipose tissue). Supervision of the bachelor’s thesis of Edouard Tang whichpreceded the development of the set-up presented in this section was done commonlywith Nassim Nasseri. Nassim Nasseri organized all sensors needed and major de-sign decisions were made jointly. In the pO2 measurements presented in this section,Nassim Nasseri and Bjørn Andresen were involved. The measurement comparing de-oxygenation by bubbling N2 and by addition of yeast was performed commonly withHelene Stachel during the course of her master thesis.
4.3 Quantitative comparison of oximeters[Kleiser et al., 2016b]
With the improved set-up introduced in Sec. 4.1 we performed a quantitative compar-ison of OxyPrem v1.3 and several commercial NIRS oximeters [Kleiser et al., 2016b].The set-up allowed us to compare absolute StO2 readings and we were thus able toprovide a conversion table valid for a typical neonate with ctHb of 45 µM. We furtherinvestigated how readings of each oximeter are affected by changes in ctHb in a rangetypically seen in neonates. OxyPrem v1.3 was the only CW NIRS oximeter which wasnot affected by this variation which seriously impairs trustworthiness of absolute StO2
readings in the other CW NIRS oximeters.The author’s taks related to this study were NIRS and pO2 reference data analysis,
creation of result plots and generation of conversion and threshold tables. Planningand conduction of the experiment were shared work.
The following reproduction of the paper ’Comparison of tissue oximeters on a liq-uid phantom with adjustable optical properties’ [Kleiser et al., 2016b] published inBiomedical Optics Express has been slightly adapted in terms of nomenclatureand formatting.
63
4 Phantom set-up for quantitative oximeter comparison
Comparison of tissue oximeters ona liquid phantom with adjustable
optical propertiesS. Kleiser1,3,4, N. Nasseri1,3,5, B. Andresen2, G. Greisen2 and M. Wolf1
1Biomedical Optics Research Laboratory, Department of Neonatology, UniversityHospital Zurich, Zurich, Switzerland
2Department of Neonatology, Copenhagen University Hospital, Rigshospitalet,Copenhagen, Denmark
3equal [email protected]
published 11 Jul 2016Vol. 7, No. 8
DOI:10.1364/BOE.7.002973
BIOMEDICAL OPTICS EXPRESS 2973http://dx.doi.org/10.1364/BOE.7.002973
OCIS codes: (120.3890) Medical optics instrumentation, (170.6510) Spectroscopy,tissue diagnostics.
Abstract: The safeguarding the brains of our smallest children (SafeBoosC) trialshowed that cerebral oximetry combined with a treatment guideline can reduce the theburden of hypoxia in neonates by 50 % [Brit. Med. J. 350, g7635 (2015)]. However,guidelines based on oximetry by one oximeter are not directly usable by other oxime-ters. We made a blood-lipid phantom simulating the neonatal head to determine therelation between oxygenation values obtained by different oximeters. We calculatedcoefficients for easy conversion from one oximeter to the other. We additionally deter-mined the corresponding SafeBoosC intervention thresholds at which we measured anuncertainty of up to 9.2 % when varying total haemoglobin concentration (ctHb) from25 µM to 70 µM. In conclusion, this paper makes the comparison of absolute valuesobtained by different oximeters possible.
4.3.1 Introduction
In neonatology, infants born preterm are vulnerable to hypoxic and ischemic insultswhich lead to long-term disabilities. Diagnostic methods to early detect these condi-tions and prevent lesions are urgently needed. Optical methods such as near-infraredspectroscopy (NIRS) may be able to fulfill this need by assessing cerebral oxygena-tion non-invasively [Volpe, 2009]. NIRS and visible-light spectroscopy (VLS) utilizelight to non-invasively and continuously assess tissue oxygen haemoglobin saturation(StO2). Although there are a number of commercial NIRS oximeters available andentering the clinics, the evidence for clinical benefit is weak. A recent randomized
64

4.3 Quantitative comparison of oximeters [Kleiser et al., 2016b]
clinical trial (safeguarding the brains of our smallest children (SafeBoosC)) carriedout across Europe in 8 tertiary neonatal intensive care units including 166 extremelypreterm infants, aimed to determine if it is possible to stabilize the cerebral oxygena-tion [Hyttel-Sorensen et al., 2015]. Cerebral oximetry was combined with a dedicatedtreatment guideline [Pellicer et al., 2013], providing a clinical intervention algorithmto assist neonatologists in clinical decision making when StO2 was outside the tar-get range of 55 % − 85 %. Cerebral oxygenation was acquired by INVOS 5100Cwith adult SomaSensor or NIRO-200NX with small reusable probe, within 3 hoursfrom birth. These two oximeters had previously been tested for comparability invivo[Hyttel-Sorensen et al., 2011]. The primary outcome measure of hypoxic and hy-peroxic burden, was defined as the integral of the difference between StO2 and thethreshold over time outside the target range of 55 % − 85 % and and compared be-tween the NIRS-visible group and a control group where NIRS was recorded but thedata was not available to the clinician. In the trial the hypoxic/hyperoxic burdenwas reduced by more than 50 %, paving the way for a future phase III study toshow whether optical spectroscopy prevents brain lesions in preterm infants in thefuture [Hyttel-Sorensen et al., 2015]. However, despite substantial progress, severalchallenges need to be solved.
One problem is validation, i.e. do these oximeters measure StO2 accurately? Howcan this be tested? StO2 corresponds to the ratio of oxy-haemoglobin concentration(cO2Hb) and total haemoglobin concentration (ctHb) (StO2 = cO2Hb/ctHb, wherebyctHb = cO2Hb + cHHb). NIRS measures the average cO2Hb and deoxy-haemoglobinconcentration (cHHb) in the field of view of the light bundle and is sensitive to thehaemoglobin (Hb) in small blood vessels, i.e. arterioles, capillaries and venules.
A common approach is to validate StO2 measured by the oximeter against co-oximetry of arterial and venous (e.g. jugular) blood samples [Nagdyman et al., 2008,Kreeger et al., 2012], similar to the validation procedure for pulse oximeters. Therebyoften a proportional contribution of 30 % arterial and 70 % venous blood to the StO2
is assumed. But this proportion cannot easily be measured and is likely to changeover time and varies between tissues and subjects [Wolf et al., 2012]. Moreover, ve-nous samples truly representative of the optically measured tissue are difficult andrisky to obtain. Jugular bulb represents global cerebral venous blood while the NIRSsensor samples only a small volume and it is known that brain oxygenation varies withlocation [Meyer et al., 1999]. Furthermore, jugular blood is possibly contaminated byextracerebral drainage [Clay, 2000] and 40 % of the patients suffer from thrombosisafter jugular bulb catherterization [Coplin et al., 1997]. Especially in preterm infantsthis procedure is not feasible for ethical reasons, which is probably true for adults aswell. Therefore, it is impossible to establish the accuracy of the methods in vivo fromblood sample co-oximetry. At best these tests add plausibility [Wolf et al., 2012].
Since there is no simple test so far and the specific StO2 value dependson several assumptions, it is not surprising that oximeters from differentmanufacturers provide different StO2 values as established by numerousstudies [Wolf et al., 2012, Dullenkopf et al., 2003, Sorensen and Greisen, 2006,Jenny et al., 2011, Pocivalnik et al., 2011, Dix et al., 2013, Szczapa et al., 2013,Hessel et al., 2014, Schneider et al., 2014]. With the lack of a standard, the needarose to translate between different oximeters within and between trials (e.g.
65

4 Phantom set-up for quantitative oximeter comparison
intervention thresholds in SafeBoosC). In vivo vascular occlusions have previouslybeen applied for this, because the induced ischemia allows characterization of theoximeter in a wide range of StO2 [Hyttel-Sorensen et al., 2011]. This approach,however, is negatively affected by tissue in-homogeneity and physiological alterationover time.
To overcome this problem, oximeters can be characterized in vitro in phantoms.This has the advantage of controllable optical properties with minimal variation,and can be constructed for the specific research question. Dye-based phantoms aremainly used for testing absorption measurements of oximeters, but are not suitable toassess oxygenation readings, as real Hb is needed for this. Readings can be evaluatedat multiple increments of StO2 [De Grand et al., 2006] or preferably in dynamicphantoms covering a continuous range of StO2 [Suzuki et al., 1999, Kurth et al., 1995,Kim and Liu, 2007, Hull et al., 1998, Bozkurt et al., 2005, Kraitl et al., 2013]. Suzukiet al used a liquid phantom when introducing the NIRO-300 comparing NIRSmeasurements with co-oximetry as reference [Suzuki et al., 1999]. We haveused a similar approach to directly compare oximeters as described previously[Hyttel-Sorensen et al., 2013b, Kleiser et al., 2016a, Nasseri et al., 2016b]. Here wepresent an improved setup, where we minimized the vertical gradient in the oxygen(O2) content of the liquid phantom and improved the alignment of the oximeterswhich were simultaneously measuring oxygenation of the phantom. This ensures thatthe different oximeters measure the same oxygenation and absolute StO2 values cantruly be compared. In addition we added a second layer to the measurement setup,which simulated the neonatal skull. This setup, thus, is closer to the structure of aneonatal head.
Aims of the current paper are to derive mathematical equations to convert StO2
measured by one oximeter to another one (INVOS adult/neonatal, Nonin neonatal,OxyPrem v1.3, OxiplexTS, and OxyVLS), to calculate oximeter-specific interventionthresholds for a phase III large scale follow-up trial of SafeBoosC, and to measurethe inaccuracy of different oximeters due to variation of ctHb at these thresholds. Theinfluence of Hb is expected from phantom and piglet studies demonstrating a changein continous wave NIRS measurements as ctHb changes [Kurth and Uher, 1997].
4.3.2 Methods and Materials
4.3.2.1 Oximeters
In the presented phantom experiment we included 4 NIRS oximeters with severalsensors, one visible light oximeter and conducted oximetry based on the Hb-O2 dis-sociation curve, all measuring StO2. We employed the following NIRS oximeters:OxiplexTS (ISS, Inc., Champaign, IL, USA), INVOS 5100C with Adult SomaSen-sor SAFB-SM and infant/neonatal OxyAlert NIRSensor CNN/SNN (Medtronic, Inc.,Minneapolis, MN, USA), SenSmart Model X-100 Universal Oximetry System withadult 8004CA and non-adhesive neonatal/pediatric sensor 8004CB-NA (Nonin Medi-cal, Inc., Plymouth, MN, USA) and OxyPrem v1.3 (in-house developed NIRS oximeter,University Hospital Zurich, Zurich, Switzerland).
As the intervention thresholds in SafeBoosC were determined from measurements
66

4.3 Quantitative comparison of oximeters [Kleiser et al., 2016b]
on > 400 preterm infants using INVOS 5100C with the adult SomaSensor[Hyttel-Sorensen et al., 2013a], this adult sensor is included in this study. INVOSand Nonin neonatal sensors as well as Oxyprem v1.3 are expected to be used in phaseIII of SafeBoosC and hence need to be characterized. The Nonin adult sensor wasadded to see how it compares to its neonatal sensor. The OxiplexTS and OxyVLS(in-house developed VLS oximeter, University Hospital Zurich, Zurich, Switzerland)were included to compare the performance of frequency domain (FD) NIRS andoximetry based on visible light spectroscopy to the performance of continuous-wave(CW) NIRS oximeters, respectively.
4.3.2.1.1 NIRS oximeters The INVOS system utilizes near-infrared light at 730 and810 nm, one source and two detectors at source-detector separation (SDS) of 30 and40 mm, providing two light paths. The INVOS 5100C provides "real-time data accu-racy" which is claimed to be what others call "absolute" for certain clinical indicationsin patients > 2.5 kg [Medtronic, 2011]. The oximeter is approved for clinical use.
SenSmart applies four wavelengths (730, 760, 810 and 870 nm) and provides sen-sors for adults (SDS: 20 and 40 mm) and neonates (SDS: 12.5 and 25 mm). Bothneonatal and adult sensors have two detector and two source locations, giving a totalof four light paths providing absolute StO2 for patients < 40 kg (neonatal/pediatricsensor)[Nonin, 2014a] and > 40 kg (adult sensor)[Nonin, 2014b]. The oximeter is ap-proved for clinical use.
In OxyPrem v1.3 we incorporated four wavelengths (690, 760, 805 and 830 nm).It employs a self-calibrating principle [Hueber et al., 1999] with 8 different light pathsderived from two detectors and 4 different SDS (15, 20, 30 and 35 mm). By applyingthis principle, the measured light intensity is independent of the sensitivity of thephoto-detectors, light intensity at the source, light coupling factors and the influenceof superficial tissue is reduced. The oximeter is not CE-marked but it has passedapproval by medical device agencies on several occasions to acquire absolute StO2 inhumans for clinical trials.
OxiplexTS is a FD NIRS oximeter with two wavelengths of 692 and 834 nm and aprobe with SDS of 25, 30, 35 and 40 mm and 4 light paths. The oximeter modulateslight at an RF frequency of 110MHz which enables measuring absolute absorption co-efficient (µa) and reduced scattering coefficient (µ
′
s) values. Subtraction of backgroundabsorbers and water content can be adjusted freely to account for different proper-ties of tissues before calculation of oxy-haemoglobin (O2Hb) and deoxy-haemoglobin(HHb). The oximeter is CE-marked for research purposes and acquires absolute StO2
[ISS, 2001].
4.3.2.1.2 Oximetry based on the hemoglobin-oxygen dissociation curve (StO2 derivedfrom oxygen partial pressure (pO2)) We calculated StO2 derived from pO2 based ona mathematical model assuming equilibrium binding of O2 with Hb inside red bloodcells. This model has the form of a Hill type equation and enables invertible calculationof StO2 based on pO2, carbon dioxide partial pressure (pCO2), pH, temperature (T ),and 2,3-diphosphoglycerate concentration (cDPG) [Dash and Bassingthwaighte, 2010,Dash et al., 2016]. To produce accurate results pO2, pCO2, pH, and T were measured
67

4 Phantom set-up for quantitative oximeter comparison
and kept in a physiological range. We assumed cDPG ≈ 0 as is typical for storedblood [Yoshida and Shevkoplyas, 2010]. The duration of each experiment was < 4hr,which excludes alterations in the amount of 2,3-diphosphoglycerate (DPG) occuringafter 4 hrs due to changes in pH [Bellingham et al., 1971]. Since small changes inpH and T create large shifts in the O2 Hb dissociation curve, we kept pH close tothe physiologically normal (pHphys = 7.4) value by adding sodium bicarbonate buffer(SBB) and stabilized the temperature between 37 − 38◦C by placing the phantomon a heating plate. We altered pO2 between 0 and ≥ 10 kPa to cover the full rangeof StO2 (0 − 100 %). Table 4.1 indicates the sensors employed to derive StO2 frompO2 (manufactured by PreSens - Precision Sensing GmbH, Regensburg, Germany andMetrohm AG, Herisau, Switzerland).
Table 4.1:Sensors to measure oxygen partial pressure (pO2), carbon dioxide partial pressure (pCO2),pH, and temperature (T ).
pO2 pCO2 pH T
transmitter Microx TX3 pCO2 mini v2 - Microx TX3sensor NTH-PSt1 flow through cell 691 pH meter pt1000
company Presens Presens Metrohm Presens
4.3.2.1.3 Oximetry based on visible light spectroscopy (OxyVLS) We employed aMaya2000 Pro (Ocean Optics, Inc., Dunedin, FL, USA) spectrometer (≈ 500−930nmspectral range, resolution ≈ 0.2 nm) combined with a tungsten halogen source(360 − 2400 nm, 7W , Ocean Optics) and a 400 µm reflection probe (Ocean Optics),with approximately 2 mm distance between light emission and detection. Spectrawere acquired every 12s. Based on VLS it is possible to determine the StO2
[Nasseri et al., 2016b]. Here we applied an improved method to measure StO2. Thewavelength range, from 520 nm to 600 nm, is remarkable by O2Hb having two peaks(λ = 542 nm and λ = 577 nm, data from [Zijlstra et al., 2000]) and HHb havingonly one peak (λ = 556 nm, data from [Zijlstra et al., 2000])[Nasseri et al., 2016b].Calculating StO2 based on the distance between the peaks as described in[Nasseri et al., 2016b] is prone to errors. In normal physiological conditions(70% < StO2 < 85 %) 1 nm error in measurement of the distance between the peakscreates an error of ≈ 5 − 10 % in StO2, which is too unstable. Moreover, whenStO2 < 30 % no peak is detectable, which previously prevented measurement ofStO2 < 30% [Nasseri et al., 2016b]. Here we apply the ’Interval analysis’ technique tothe spectrum of the liquid phantom in the range from 520 to 600nm to calculate StO2.The details of this technique are depicted elsewhere [Wodick and Lübbers, 1973]. Asdepicted in Fig. 4.17 we calculated the interval between two data points with thesame optical density in the range from λ = 520 nm to λ = 600 nm. By comparing it tothe interval analysis signal of Hb with known StO2 (resolution: 0.1 % StO2, data from[Zijlstra et al., 2000]), we calculated the StO2 of the liquid phantom. This methodled to more stable results and enabled measurement of StO2 < 30 %. Figure 4.18shows the interval signal calculated for O2Hb, i.e. StO2 = 100 %.
68

4.3 Quantitative comparison of oximeters [Kleiser et al., 2016b]
520 530 540 550 560 570 580 590 6000
10
20
30
40
50
60
70sp
ecifi
c ex
tinct
ion
coef
ficie
nt (
1/cm
/mM
)
time(s)
d3
d2
d4
d1
Figure 4.17:Spectrum of O2Hb. d1, d2, d3, and d4depict the intervals for wavelengths of520, 527, 542, and 570 nm, respectively.
520 530 540 550 560 570 5800
20
40
60
80
inte
rval
(nm
)
wavelength (nm)
Figure 4.18:Interval signal of O2Hb.
4.3.2.2 Measurement set-up and liquid phantom
We prepared two liquid phantoms in a phantom container. The set-up is describedbelow.
4.3.2.2.1 Phantom container The phantom container was built in-house. We de-ployed the CAD tool NX (Siemens PLM Software) to design the phantom containerand fabricated it from ABS plastic with a 3D-printer. The inside of the container wascovered with bio-compatible epoxy to avoid cytotoxic effects. The phantom containerwas an irregular octagonal shape with four wide and four narrow side faces as is shownin Fig. 4.19 and 4.20. In these figures, the windows are not actually displayed, justthe openings for them in the rigid container structure. This geometry enabled placing4 NIRS oximeters on each wide side of the container. The phantom container had thefollowing features:
Semi-infinite boundaries The side faces of the container and holders pressingthe sensors of the oximeters against the windows were built of absorbing material,thus effectively implementing a semi-infinite boundary condition. It also shielded thephantom from ambient light.
No ambient oxygen diffusion The cap of the container completely isolated thephantom from the ambient air. All the openings of the cap for placement of pO2,pCO2, pH, and T sensors as well as OxyVLS were sealed with silicone gaskets. Priorto measurement, we scanned the height of the phantom with a pO2 sensor.
High homogeneity and controlled temperature We applied a magnetic stirrer,whose speed was set to 500 rpm throughout the measurement, to effectively ensurehomogeneity. If a gradient in the phantom exists, then it is due to O2 diffusion fromair through the phantom surface. With air on top of the liquid containing yeast, wemeasured a vertical gradient of less than 40 Pa/cm which was negligible. Still wealigned all the sensors at the same height (< ±0.5 cm) with their light path beinghorizontal to exclude the effect of any remaining vertical O2 gradient. The bottompart of the phantom container constructed from copper enabled to place the phantom
69
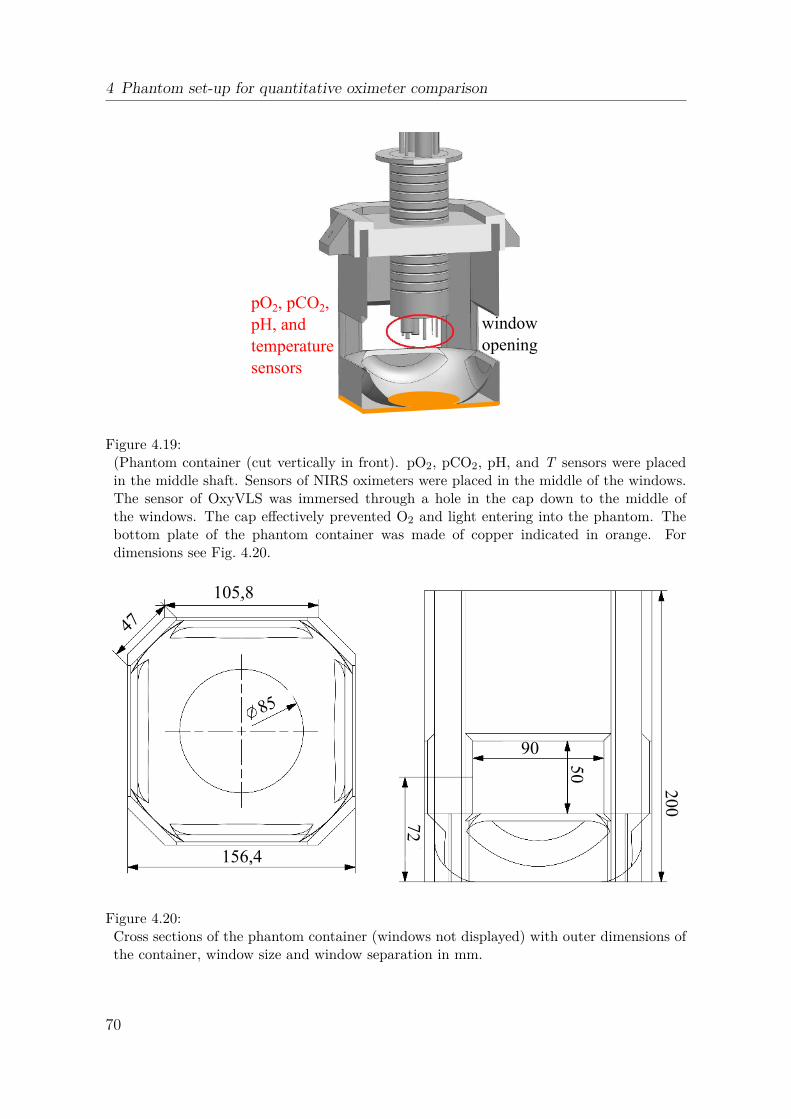
4 Phantom set-up for quantitative oximeter comparison
pO2, pCO2,
pH, and
temperature
sensors
window
opening
Figure 4.19:(Phantom container (cut vertically in front). pO2, pCO2, pH, and T sensors were placedin the middle shaft. Sensors of NIRS oximeters were placed in the middle of the windows.The sensor of OxyVLS was immersed through a hole in the cap down to the middle ofthe windows. The cap effectively prevented O2 and light entering into the phantom. Thebottom plate of the phantom container was made of copper indicated in orange. Fordimensions see Fig. 4.20.
105,8
85
156,4
47
90
50
72
200
Figure 4.20:Cross sections of the phantom container (windows not displayed) with outer dimensions ofthe container, window size and window separation in mm.
70

4.3 Quantitative comparison of oximeters [Kleiser et al., 2016b]
container on the hot plate of the stirrer, heating the liquid and thus keeping thephantom temperature constant.
Optical cross-talk The phantom container enabled simultaneous measurementwith 4 different NIRS oximeters. The minimum distance between the two closestoptodes of two different sensors was 7.5 cm, i.e. at least 3.5 cm larger than the largestinter-optode distance of any sensor. This effectively prevented cross-talk.
Windows simulating optical properties of the neonatal head We cast 4windows that reflected the optical properties of skull [Choi et al., 2004] with values ofµa = 0.10 cm−1 and µ
′
s = 9.6 cm−1 at 692 nm and µa = 0.11 cm−1 and µ′
s = 8.3 cm−1 at834 nm, which we expect to be a close approximation to the actual optical propertiesof the neonatal head. The windows were made from Silpuran 2420 silicone and werecolored with 1.15 ml/L Elastosil pigment paste FL RAL 9010 (white) (both WackerChemie AG, Munich, Germany) and 2.26 mg/L carbon black powder (Alfa Aesar,Thermo Fisher (Kandel) GmbH, Karlsruhe, Germany).These windows were placedon each wide face of the container and served as the interface between the NIRSoximeters and the liquid phantom. The thickness of the windows was 2.5 mm whichapproximately reflected the thickness of skull in neonates [Demel et al., 2014a].
All NIRS oximeters employed in this study claim to have algorithms which reducethe influence of superficial layers. Nonin neonatal as the oximeter with shortest SDS inour experiment has a penetration depth of 12.5mm [Nonin, 2014c] which is 5 times thethickness of the windows. Based on this, we expect the windows to have only marginalinfluence on StO2 readings. We nevertheless tried to make them similar to reality. Itis obvious that influence of more superficial layers can more effectively be reduced. Wetherefore neglected the well perfused skin containing Hb. The remaining layers, skulland cerebro spinal fluid (CSF), which contain very little Hb are well represented byour single silicone layer which resembles data obtained in vivo only showing two layers:outer and inner (brain) [Choi et al., 2004].We thus expect the phantom to be a goodapproximation for the neonatal head. Although the skull is perfused, its Hb content ismuch lower compared to the brain itself. As a result windows with no blood are stilla good estimation of the reality. In the future, the measurement set-up could possiblybe further improved: Developing windows which simulate the whole spectrum of Hbby means of mixing blood with the windows seems possible [De Grand et al., 2006]and might be even a closer approximation to the reality. But stability of blood cellsduring the production procedure of the windows and long term stability would firsthave to be verified.
4.3.2.2.2 Oxygen supply A tube from an industrial O2 tank (O2 ≥ 99.5 %, PanGasAG, Dagmersellen, Switzerland) through a flow-meter was immersed to approximately2 cm above the bottom of the container in order to provide O2 to the phantom whenneeded.
4.3.2.2.3 Liquid phantom The liquid phantom consisted of phosphate buffered saline(PBS) (after Kreis), pH = 7.4, Kantonsapotheke Zurich, Zurich, Switzerland), humanblood from expired human erythrocyte concentrate bags (expiry date < 2 months,ctHb = 220 g/l, haematocrit (htc) = 67 %), intralipid (IL) 20 % solution (Fresenius
71

4 Phantom set-up for quantitative oximeter comparison
Kabi AG, Bad Homburg, Germany), SBB 8.4% (1 mmol/ml) (B. Braun MedicalAG, Sempach, Switzerland), and glucose 50 % (AlleMan Pharma GmbH, Reutlin-gen, Germany). Fresh baker’s yeast was added, when needed, to de-oxygenate theHb. The optical properties of the liquid phantom resembled that of the neonatal brain[Arri et al., 2011, Ijichi et al., 2005]. We aimed at µ
′
s of 5.5 cm−1 and obtained an av-erage µ
′
s of 6.8 cm−1 (692 nm) and 5.4 cm−1 (834 nm) (measured by OxiplexTS). SincectHb is highly variable between neonates, we introduced three mixtures with differentlevels of ctHb for each phantom: 25, 45, and 70 µM. Table 4.2 indicates the ingredientsof the liquid phantom. The phantom contained ≈ 98 % water which is only slightlymore than up to 95 % reported for neonatal brain tissue [Dobbing and Sands, 1973].The IL content and hence the scattering was not changed. Theoretically this cancelsout when calculating StO2 out of O2Hb and ctHb with only the wavelength depen-dency remaining [Matcher et al., 1995a]. A previous phantom study confirmed this[Kleiser et al., 2016a].
For liquid phantoms containing Hb there are two possibilities to reversibly de-oxygenate the Hb. The first way is via gas-exchange, either by nitrogen (N2) in-flow or by a membrane oxygenator [Hyttel-Sorensen et al., 2013b]. The second way isby adding small quantities of respiring yeast into the phantom [Nasseri et al., 2016b,Kleiser et al., 2016a, Suzuki et al., 1999]. De-oxygenating by N2 in-flow is relativelyslow for large phantom volumes and also creates in-homogeneity which may invalidatethe results when lowering StO2. This method, however, works if the StO2 of the phan-tom is fixed at a certain level but this fixation requires a sophisticated set-up whichprevents any O2 diffusion from the ambient air into the phantom. The inhomogeneityproblem is not solved by using a membrane oxygenator because at the inlet, bloodwith a different level of oxygenation than that of the bulk phantom enters and is asource of inhomogeneity. A simpler alternative for de-oxygenating Hb is to add yeast.Yeast in the phantom, if stirred well, causes distributed O2 consumption and thereforeprevents inhomogeneity. This method is also much faster and therefore we decided tode-oxygenate the phantom by adding yeast. For oxygenating, however, we used O2
in-flow which might have created inhomogeneity but this is not an issue as we onlyused the data while de-oxygenating the phantom.
Table 4.2:Ingredients of the liquid phantom. Yeast 1 indicates the amount of yeast in phantom 1 andyeast 2, the amount of yeast in phantom 2.
mixture PBS blood IL SBB glucose yeast 1 yeast 2 htc ctHb
(ml) (ml) (ml) (ml) (ml) (g) (g) (%) (µM)
no. 1 2500 20.0 74 15 3 1.5 3 0.52 26.32 ≈ 25no. 2 2500 33.5 74 25 6 1.5 3 0.86 43.85 ≈ 45no. 3 2500 53.5 74 35 9 3.0 3 1.36 69.50 ≈ 70
4.3.2.3 Measurement protocol
We prepared two liquid phantoms with three mixtures each (table 4.2). Phantom 1and phantom 2 had the same ingredients (except from the amount of yeast). pO2,
72

4.3 Quantitative comparison of oximeters [Kleiser et al., 2016b]
pCO2, pH, and T sensors, OxyVLS, OxyPrem v1.3 and OxiplexTS were employedin both phantoms. Additionally, Nonin adult and INVOS adult oximeters were em-ployed in phantom 1, whereas Nonin neonatal and INVOS neonatal were employed inphantom 2. We started de-oxygenating the Hb by adding yeast and re-oxygenated itby providing an O2 to the phantom. The measurement started at pH = 7.4. Duringthe measurement, pH gradually decreased due to carbon dioxide (CO2) accumulationin the phantom (produced by yeast). In order to keep the pH close to pHphys = 7.4,we gave initially 15 ml and additionally two times 10 ml SBB to each phantom. Weadded more glucose (+3 ml) to both phantoms when adding more blood (leading tothe next mixture). Table 4.3 summarizes the procedure for phantom 1, and phantom2. To increase the speed of de-oxygenation, we added more yeast (+1.5 g) for mixtureno. 3 in phantom 1.
Table 4.3:Procedure of changing the StO2 level of phantom 1 and phantom 2.
step phantom 1 phantom 2
1. Prepare mixture no.1 as described in table 4.22. Start stirring (500 rpm)3. Start the measurement (initial oxygenation is high)4. Add 1.5 g yeast Add 3 g yeast5. Wait until pO2 reaches the low plateau6. Provide 2 l/min flow of O2 and stop when pO2 > 10 kPa7. Wait for low plateau of pO2 —————————-8. Add more blood and 3 ml glucose9. Wait for low pO2 plateau10. Repeat 6-9 for mixture no.2 Repeat 6-8 for mixture no. 211. Add 1.5 g yeast —————————-12. Repeat 6-7 for mixture no.3 Repeat 9 for mixture no. 3
We constantly monitored pO2, pCO2, pH, and T during the course of the measure-ment. Table 4.4 shows the range of pO2, pCO2, pH, and T during the measurementfor phantom 1 and phantom 2.
Table 4.4:Range of carbon dioxide partial pressure (pCO2), pH, and temperature (T ) in phantom 1and in phantom 2.
pCO2 (kPa) pH temperature (◦C)min mean max min mean max min mean max
phantom 1 1.88 4.31 9.23 7.09 7.28 7.52 37.50 37.81 38.00phantom 2 0.68 7.48 14.9 7.06 7.29 7.54 35.80 36.91 38.40
73

4 Phantom set-up for quantitative oximeter comparison
4.3.2.4 Data processing
We applied a moving average filter over 3 samples on OxyVLS data. For all otheroximeters, raw StO2 values were recorded. For INVOS, Nonin, OxyPrem v1.3 andOxiplexTS oximeters we placed several event markers throughout the measurementswhich were used for alignment of the different time-series. We re-sampled the datafrom all devices to 1
12Hz (sampling rate) and created time-series for all devices on
a common time base.We inspected the data visually thereafter to find the synchro-nization precision. This precision was higher than one sample. This means that themaximum time lag that could occur between samples in repeated measurements was12 s.
Obvious artifacts were removed, i.e data with saturated detector for the OxiplexTS.We applied 1st degree polynomial fits (based on lowest least square error) to calculatethe relation between StO2 measured by different oximeters during de-oxygenations inthe range of 16% ≤ StO2 ≤ 94 %.
4.3.3 Results
Figures 4.21 and 4.22 show the StO2 time series of the oximeters in phantom 1 andphantom 2, respectively. We increased ctHb step-wise: ctHb = 25µM, 45µM and 70µM(table 4.2) as depicted in Fig. 4.21 and 4.22 by the intensity of background red color.The changes in oxygenation are visible.
Figures 4.23-4.27 show in scatter plots how each individual oximeter compared toOxiplexTS at ctHb = 25 µM, 45 µM and 70 µM. OxiplexTS was chosen as referencebecause the StO2 derived from oxygen partial pressure (pO2) shows a drift in phantom2 (Fig. 4.22) and because it is commercially available (in contrast to OxyVLS). Thechoice of reference is discussed in detail in section 4.3.4.1. Equations of the linear fitsand coefficients of determination (R2) are given in the figure captions (StO2,device =a ∗ StO2,OxiplexTS + b). Only data-points while de-oxygenating (no O2 flow) within thegray rectangle (16 ≤ StO2 ≤ 94 %) were included for fitting. A dark gray polygon isdefined by the fitting lines for 25 µM and 70 µM. The area of this polygon is differentfor all oximeters and qualitatively reflects dependence of the StO2 reading on ctHb.For OxyPrem v1.3 and OxyVLS there are more data-points, because these sensorswere present in both phantoms. For oximeters from which data of more than onede-oxygenation was available, all available data was used to generate the fitting lines.
We do not report the results obtained from Nonin adult sensor, because we suspectthat the sensor was not properly attached to the window of the phantom and datawas implausible.
4.3.3.1 StO2 conversion table and SafeBoosC intervention threshold
In table 4.5 we show coefficients for conversion of values recorded by one oximeterto the other (at ctHb = 45 µM). For the SafeBoosC and other trials, interventionthresholds were applied to study different interventions. Here it is important to takeinto consideration the difference in values that oximeters display for a specific StO2.E.g. in the SafeBoosC trial the hypoxic threshold was 55 % and the hyperoxic 85 %,
74

4.3 Quantitative comparison of oximeters [Kleiser et al., 2016b]
0 20 40 60 80 100 120 140 160 180 200
time (min)
0
20
40
60
80
100
StO
2(%
)
OxiplexTS OxyPrem v1.3 INVOS adult OxyVLS StO2
derived from pO2
Figure 4.21:Time series of the StO2 readings of oximeters in phantom 1 with blood content expressedas the background red color.
0 20 40 60 80 100 120 140
time (min)
0
20
40
60
80
100
StO
2(%
)
OxiplexTS OxyPrem v1.3 NONIN neonatal INVOS neonatal OxyVLS StO2
derived from pO2
Figure 4.22:Time series of the StO2 readings of oximeters in phantom 2 with blood content expressedas the background red color.
75

4 Phantom set-up for quantitative oximeter comparison
0 10 20 30 40 50 60 70 80 90 100OxiplexTS StO
2 (%)
0
10
20
30
40
50
60
70
80
90
100
Oxy
VLS
StO
2 (%
)
25 M (1)25 M (2)25 M (3)45 M (1)45 M (2)70 M (1)70 M (2)
Figure 4.23:OxyVLS vs. OxiplexTS for ctHb =25 µM (y = 0.947x − 0.9, R2 = 0.9843),45 µM (y = 0.913x − 1.5, R2 = 0.9907)and 70 µM (y = 0.912x − 2.7, R2 =0.9892). 25 µM (1), 25 µM (2), 45 µM (1),and 70 µM (1) were measured on phan-tom 1, while 25 µM (3), 45 µM (2), and70 µM (2) were measured on phantom 2.
0 10 20 30 40 50 60 70 80 90 100OxiplexTS StO
2 (%)
0
10
20
30
40
50
60
70
80
90
100
Oxy
Pre
m v
1.3
StO 2 (
%)
25 M (1)25 M (2)25 M (3)45 M (1)45 M (2)70 M (2)70 M (1)
Figure 4.24:OxyPrem v1.3 vs. OxiplexTS for ctHb =25 µM (y = 0.675x + 23.5, R2 = 0.9985),45 µM (y = 0.709x + 21.3, R2 = 0.9990)and 70 µM (y = 0.768x + 17.2, R2 =0.9978). 25 µM (1), 25 µM (2), 45 µM (1),and 70 µM (1) were measured on phan-tom 1, while 25 µM (3), 45 µM (2), and70 µM (2) were measured on phantom 2.
76

4.3 Quantitative comparison of oximeters [Kleiser et al., 2016b]
0 10 20 30 40 50 60 70 80 90 100OxiplexTS StO
2 (%)
0
10
20
30
40
50
60
70
80
90
100
INV
OS
adu
lt S
tO 2 (%
)
25 M (1)25 M (2)45 M70 M
Figure 4.25:INVOS adult vs. OxiplexTS for ctHb =25 µM (y = 0.802x + 21.5, R2 = 0.9973),45 µM (y = 0.996x + 8.1, R2 = 0.9994)and 70 µM (y = 1.213x − 7.1, R2 =0.9997). All data was measured onphantom 1.
0 10 20 30 40 50 60 70 80 90 100OxiplexTS StO
2 (%)
0
10
20
30
40
50
60
70
80
90
100
INV
OS
neo
nata
l StO 2 (
%)
25 M45 M70 M
Figure 4.26:INVOS neonatal vs. OxiplexTS forctHb = 25 µM (y = 0.877x + 26.2, R2 =0.9991), 45 µM (y = 1.094x + 11.8, R2 =0.9994) and 70 µM (y = 1.438x − 9.4,R2 = 0.9995). All data was measuredon phantom 2.
0 10 20 30 40 50 60 70 80 90 100OxiplexTS StO
2 (%)
0
10
20
30
40
50
60
70
80
90
100
NO
NIN
neo
nata
l StO 2 (
%)
25 M45 M70 M
Figure 4.27:Nonin neonatal vs. OxiplexTS forctHb = 25 µM (y = 0.295x + 55.4, R2 =0.9940), 45 µM (y = 0.410x + 47.1, R2 =0.9989) and 70 µM (y = 0.539x + 37.6,R2 = 0.9982). All data was measured onphantom 2.
0 10 20 30 40 50 60 70 80 90 100OxiplexTS StO
2 (%)
0
10
20
30
40
50
60
70
80
90
100
StO
2 (%
)
OxiplexTSOxyPrem v1.3 (1)OxyPrem v1.3 (2)INVOS adultNONIN neonatalINVOS neonatalOxyVLS (1)OxyVLS (2)
Figure 4.28:All oximeters vs. OxiplexTS for ctHb =45 µM. The vertical black lines indicateINVOS adult measuring StO2 = 55 %and 85%. (1) and (2) indicate the phan-tom on which the data was acquired forOxyPrem v1.3 and OxyVLS.
77

4 Phantom set-up for quantitative oximeter comparison
based on values measured by the INVOS adult oximeter [Hyttel-Sorensen et al., 2015].Table 4.6 presents what these thresholds correspond to for other NIRS oximeters. Thetable also contains the uncertainty range of StO2 readings due to variations in ctHb
at these thresholds. Figure 4.28 displays for ctHb = 45 µM the StO2 measured by alloximeters compared to the OxiplexTS.
Table 4.5:Coefficients for linear StO2( %) conversion from any oximeter to the scale of any otheroximeter: StO2,to = a ∗ StO2,from + b.
to → OxiplexTS OxyPrem INVOS INVOS Nonin OxyVLSv1.3 adult neonatal neonatal
from ↓ b a b a b a b a b a b a
OxiplexTS 0.0 1.00 21.3 0.71 8.1 1.00 11.8 1.09 47.1 0.41 -1.5 0.91OxyPrem v1.3 -30.0 1.41 0.0 1.00 -21.9 1.41 -21.0 1.54 34.8 0.58 -28.9 1.29INVOS adult -8.1 1.00 15.6 0.71 0.0 1.00 3.0 1.10 43.8 0.41 -8.9 0.92INVOS neonatal -10.8 0.91 13.6 0.65 -2.7 0.91 0.0 1.00 42.7 0.38 -11.3 0.84Nonin neonatal -114.9 2.44 -60.1 1.73 -106.4 2.43 -113.8 2.67 0.0 1.00 -106.4 2.23OxyVLS 1.6 1.09 22.4 0.78 9.7 1.09 13.6 1.20 47.8 0.45 0.0 1.00
Table 4.6:Intervention thresholds for ctHb = 45 µM and range of uncertainty due to variation of ctHb
in the range of 25 µM to 70 µM.
INVOS OxyPrem INVOS Noninadult v1.3 neonatal neonatal
hypoxic threshold 55 % 55 % 63 % 66 %uncertainty range due to ctHb 9.2 % 1.9 % 9.2 % 6.4 %
hyperoxic threshold 85 % 76 % 96 % 79 %uncertainty range due to ctHb 3.2 % 0.9 % 7.7 % 1.0 %
4.3.4 Discussion
As depicted in Fig. 4.21 and 4.22, OxiplexTS, OxyPrem v1.3, Nonin neonatal, IN-VOS adult and neonatal, StO2 derived from pO2 and OxyVLS responded consistentlyand linearly correlated to the induced changes in StO2. Rise and decline of StO2
occurred simultaneously, but different oximeters showed different absolute values, dy-namic ranges and sensitivities. In phantom 1 curves became narrower because weinitially kept the phantom at high StO2 for 20min before adding yeast for the firsttime. For the second upper plateau in mixture no. 1, we oxygenated the phantomto ≈ 20 kPa. The upper plateaus in mixture no. 2 and 3 were oxygenated to only11kPa. The de-oxygenation at mixture no. 3 was faster than the previous ones becausethe additional yeast (1.5 g) outweighed the increased O2 capacity of the phantom byincreased ctHb.
78

4.3 Quantitative comparison of oximeters [Kleiser et al., 2016b]
In phantom 2 the experiment started at pO2 = 18 kPa and we re-oxygenated thephantom to 15 kPa for mixture no. 2 and 3. The curves become broader because ofthe increased O2 capacity by higher ctHb.
4.3.4.1 Reference StO2
In several previous phantom experiments co-oximetry has been applied, on samplestaken from the phantom, to compare the output of the oximeters to. This is a straight-forward procedure for experimental set-ups where ctHb is similar to that of humanblood [Kurth and Uher, 1997] . Inspired by Suzuki et al. [Suzuki et al., 1999] we triedto use co-oximetry by an ABL800 blood gas analyzer (Radiometer Medical ApS, Brøn-shøj, Denmark) as reference in a previous study [Hyttel-Sorensen et al., 2013b] . Thisfailed due to too low ctHb and too much turbidity (caused by Intralipid) in the sam-ple. Centrifugation of the phantom sample yielded acceptable CtHb, but the saturationvalues were not trustworthy as contamination by ambient air O2 was probable.
Instead, in this study we attempted to do oximetry utilizing the Hb-O2 dissociationcurve. We tried to obtain a reference StO2 from pO2, pCO2, pH, T and cDPG but itwas only partially successful. In phantom 1 (Fig. 4.21) high correlation (0.999%) toOxiplexTS was observed. But in phantom 2 (Fig. 4.22), there was a large deviationbetween this StO2 derived from pO2 and StO2 from OxiplexTS, which increased overtime. Later we identified the pH sensor as the cause of the problem with drifts ofup to ∆pH = ±0.2 when immersed repeatedly into buffer solutions. As pH playsa significant role, we believe that this created the observed drift between the StO2
derived from pO2 and OxiplexTS and OxyVLS values. Moreover, since a correct StO2
measurement employing this approach is dependent on a precise measurement of pO2,pCO2, pH, T , and a correct assumption for cDPG, we conclude that this approach isnot practical for phantom measurements.
The second option to be set as the reference was OxyVLS. But OxyVLS is a builtin-house oximeter which is still under development. It is also still not available in themarket or for other research institutions. As a result, if it was chosen as the reference,reproducing the results by others would not have been possible.
OxiplexTS was adjusted to subtract the known background absorption of the phan-tom (98 % water) before chromophore calculation and therefore did not show anydependence on ctHb. It was in a good agreement with OxyVLS (correlation coeffi-cient: 0.997), which inherently measures independent of ctHb. In addition it was ingood agreement with StO2 derived from pO2 in the first phantom, provides lower-noiseStO2 than OxyVLS at high sampling rate and more robust measurements than StO2
derived from pO2. Because of these reasons OxiplexTS was the best option and weset it as the reference for comparison of oximeters in this paper.
4.3.4.2 Plateaus, dynamic range, and sensitivity of the oximeters
The upper StO2 plateau was different for all oximeters but it was unaffected by ctHb.In Fig. 4.21 it seems that the upper plateau of StO2 measured by OxyVLS decreasedover time. One reason for this may be in the second upper plateau in mixture no. 1 weoxygenated the phantom to approx 20kPa. The upper plateaus in mixture no. 2 and 3
79
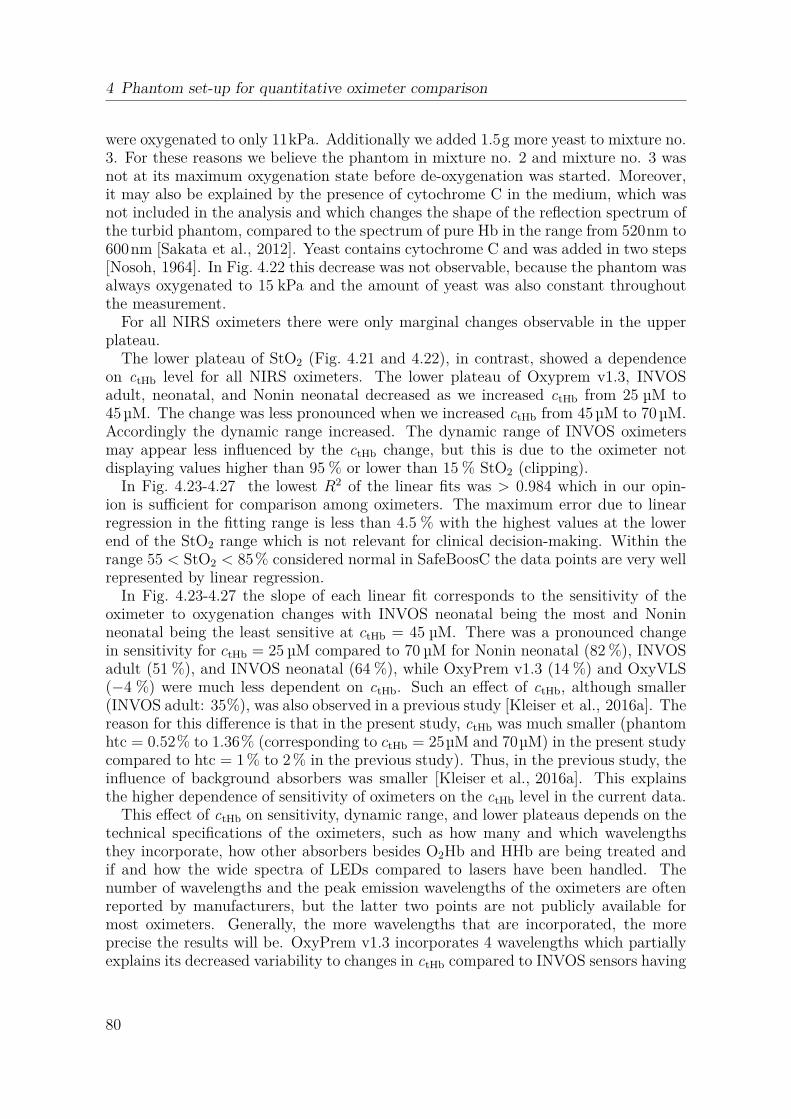
4 Phantom set-up for quantitative oximeter comparison
were oxygenated to only 11kPa. Additionally we added 1.5g more yeast to mixture no.3. For these reasons we believe the phantom in mixture no. 2 and mixture no. 3 wasnot at its maximum oxygenation state before de-oxygenation was started. Moreover,it may also be explained by the presence of cytochrome C in the medium, which wasnot included in the analysis and which changes the shape of the reflection spectrum ofthe turbid phantom, compared to the spectrum of pure Hb in the range from 520nm to600nm [Sakata et al., 2012]. Yeast contains cytochrome C and was added in two steps[Nosoh, 1964]. In Fig. 4.22 this decrease was not observable, because the phantom wasalways oxygenated to 15 kPa and the amount of yeast was also constant throughoutthe measurement.
For all NIRS oximeters there were only marginal changes observable in the upperplateau.
The lower plateau of StO2 (Fig. 4.21 and 4.22), in contrast, showed a dependenceon ctHb level for all NIRS oximeters. The lower plateau of Oxyprem v1.3, INVOSadult, neonatal, and Nonin neonatal decreased as we increased ctHb from 25 µM to45µM. The change was less pronounced when we increased ctHb from 45µM to 70µM.Accordingly the dynamic range increased. The dynamic range of INVOS oximetersmay appear less influenced by the ctHb change, but this is due to the oximeter notdisplaying values higher than 95 % or lower than 15 % StO2 (clipping).
In Fig. 4.23-4.27 the lowest R2 of the linear fits was > 0.984 which in our opin-ion is sufficient for comparison among oximeters. The maximum error due to linearregression in the fitting range is less than 4.5 % with the highest values at the lowerend of the StO2 range which is not relevant for clinical decision-making. Within therange 55 < StO2 < 85% considered normal in SafeBoosC the data points are very wellrepresented by linear regression.
In Fig. 4.23-4.27 the slope of each linear fit corresponds to the sensitivity of theoximeter to oxygenation changes with INVOS neonatal being the most and Noninneonatal being the least sensitive at ctHb = 45 µM. There was a pronounced changein sensitivity for ctHb = 25 µM compared to 70 µM for Nonin neonatal (82 %), INVOSadult (51 %), and INVOS neonatal (64 %), while OxyPrem v1.3 (14 %) and OxyVLS(−4 %) were much less dependent on ctHb. Such an effect of ctHb, although smaller(INVOS adult: 35%), was also observed in a previous study [Kleiser et al., 2016a]. Thereason for this difference is that in the present study, ctHb was much smaller (phantomhtc = 0.52% to 1.36% (corresponding to ctHb = 25µM and 70µM) in the present studycompared to htc = 1 % to 2 % in the previous study). Thus, in the previous study, theinfluence of background absorbers was smaller [Kleiser et al., 2016a]. This explainsthe higher dependence of sensitivity of oximeters on the ctHb level in the current data.
This effect of ctHb on sensitivity, dynamic range, and lower plateaus depends on thetechnical specifications of the oximeters, such as how many and which wavelengthsthey incorporate, how other absorbers besides O2Hb and HHb are being treated andif and how the wide spectra of LEDs compared to lasers have been handled. Thenumber of wavelengths and the peak emission wavelengths of the oximeters are oftenreported by manufacturers, but the latter two points are not publicly available formost oximeters. Generally, the more wavelengths that are incorporated, the moreprecise the results will be. OxyPrem v1.3 incorporates 4 wavelengths which partiallyexplains its decreased variability to changes in ctHb compared to INVOS sensors having
80

4.3 Quantitative comparison of oximeters [Kleiser et al., 2016b]
2 wavelengths only. However, variability of OxyPrem v1.3 is still less than that ofthe Nonin neonatal employing 4 wavelengths as well. The reason for that may bethe contribution of the background absorbers which we reduced in OxyPrem v1.3.When ctHb and hence absorption caused by O2Hb and HHb is low, e.g. in neonates,the relative contribution of such background absorbers is large and not negligible, asassumed by many oximeters. For the current phantom (table 4.2), lipids contributed ≈0.5% (being negligible) and water ≈ 98% of the volume. Except for a local absorptionminimum of water at 810 nm, both, O2Hb and water generally show an increase ofabsorption in the range 680 nm < λ < 920 nm. Lipid has low absorption in thewavelength range 600 nm ≤ λ ≤ 870 nm. Above this wavelength, absorption increasesrapidly. Therefore, depending on wavelengths employed, lipid might be relevant inhuman tissue with higher lipid contents and both, water and lipids, can possibly bemistaken as O2Hb by different oximeters. The result is an O2Hb offset even whenStO2 = 0 %. Since this error is wavelength dependent, the choice of wavelengths iscrucial in reducing this effect. In OxyPrem v1.3 wavelengths of 690, 760, 805 and830 nm were selected based on simulations in which the wide emission spectrum ofthe LEDs were modelled by Gaussian distributions and with the aim to reduce theinfluence of water and lipid to a minimum. Figure 4.24 shows that we achieved thisaim and OxyPrem v1.3 measures StO2 with negligible variation over the wide rangeof neonatal brain ctHb levels because of the considerations mentioned above.
4.3.4.3 Reproducibility of the procedure
One of the aims of this paper was to provide mathematical equations to convert theresults obtained by one oximeter to the results of the other oximeters (table 4.5).This will be valid only if the experiment is reproducible between the two phantoms.OxyPrem v1.3 and OxyVLS were present in both phantoms. In the first phantomwe de-oxygenated the phantom twice with the same amount of ctHb. This led to twodatasets with ctHb = 25µM in phantom 1. In addition we have a dataset in phantom 2.We applied individual linear fits to all three datasets in the range 16 ≤ StO2 ≤ 94 %.The standard deviations for slope (relative) and offset (absolute) coefficients were0.89 % and 0.86 % for OxyPrem v1.3 while 2.28 % and 2.17 % for OxyVLS.
In dynamic measurements the correct alignment of the time-series influences theresults of the comparison. We therefore aligned the data based on event markers andafterwards visually inspected the time-series. In the presented data, the highest rateof de-oxygenation was −8.3 % per minute at ctHb = 25 µM in phantom 2. This meansit takes 8 min until Hb reaches from StO2 = 94 % to StO2 = 16 %. If we assume thatalignment is off by one sample (12 s), then this corresponds to a worst case error of8.3%/60s∗12s = 1.66% which is well below the reproducibility of NIRS measurementsin vivo as reported in the literature [Hyttel-Sorensen et al., 2011, Wolf et al., 2012]and we consider this to be acceptable. We therefore conclude that the method wasindeed reproducible.
81

4 Phantom set-up for quantitative oximeter comparison
4.3.4.4 Comparability of oximeters
The equations for conversion of StO2 from one oximeter to the others assuming atypical neonate with ctHb = 45 µM (table 4.5) enable researchers to quantitativelyrelate their own findings to data in the literature obtained by other oximeters. Thismeans that clinicians do not have to wait until a specific observation has been madeand reported with the same oximeter available to them. Especially for small patientgroups such as preterm neonates this allows quicker implementation of new knowledgeinto practice.
4.3.4.5 SafeboosC intervention threshold
In table 4.6 we calculated oximeter-specific intervention thresholds for the clinical trialSafeBoosC corresponding to StO2 = 55 % and 85 % as measured by the INVOS adultoximeter for a typical neonate with ctHb = 45 µM. Our results show that the sameoxygenation leads to quite different StO2 values and intervention thresholds need tobe adjusted to the specific sensor and oximeter accordingly. e.g. the hypoxic thresholdhas to be 11 % higher in case of the Nonin neonatal oximeter compared to the INVOSadult. OxyVLS has an SDS ≈ 2 mm thus it is not suitable for brain monitoring. Forthis reason it is not included in table 4.6.
4.3.4.6 Implications of ctHb and background absorbers
A recent study reported that the variation of water content between infants leads toan uncertainty of StO2 readings of up to 8 % [Demel et al., 2014b], which is also sup-ported by [Kleiser et al., 2016a, Kurth and Uher, 1997]. This may systematically flawclinical decisions. Variation of water content has the same effect on the relative contri-bution of background absorbers as of variation of ctHb as addressed above. The currentexperiment revealed a ctHb dependence at the SafeBoosC intervention thresholds (Ta-ble 4.6). At the hypoxic threshold StO2, INVOS adult and neonatal (9.2 %) showedthe largest and OxyPrem v1.3 (1.9 %) the lowest dependence on ctHb, i.e. uncertaintyrange of StO2 readings.
In a trial with intervention thresholds, this means that oximeters with a high uncer-tainty effectively apply different StO2 thresholds to patients with low ctHb level thanfor patients with high ctHb level. We expect that the reliability of such studies will beimproved by oximeters providing more robust StO2 readings, because they result in amore homogeneous threshold for the patient population.
4.3.5 Conclusion
In this paper we confirmed that different oximeters measured different StO2 values onthe same phantom simulating the neonatal head. We provided mathematical equationswhich translate data obtained from one oximeter to the others. Moreover, we havecalculated the effect this has on intervention thresholds. We have additionally mea-sured the dependence of StO2 values on the ctHb, which varies substantially betweenoximeters.
82

4.3 Quantitative comparison of oximeters [Kleiser et al., 2016b]
Acknowledgments
The authors would like to thank Ranjan K. Dash (Medical College of Wisconsin,Department of Physiology) for valuable explanations to his SHbO2
model and for ex-tending it to the case of several variables deviating from normal values at the sametime [Dash et al., 2016]. The presented work was funded by The Danish Council forStrategic Research (grant number 00603-00482B) and the Nano-Tera projects Para-Tex, ObeSense and NewbornCare and the Clinical Research Priority Program TumorOxygenation of the University of Zurich.
83

4 Phantom set-up for quantitative oximeter comparison
4.4 Extended oximeter comparison
In the previous Sec. 4.3 we presented an in vitro set-up which allows for system-atic comparison of NIRS oximeters [Kleiser et al., 2016b]. We already compared somewidely used oximeters in that study, but NIRO and FORE-SIGHT devices were notavailable at the time. These instruments are also approved for clinical use and arewidely used in research and clinics. It was thus important to investigate and comparethese instruments as well prior to the start of the SafeBoosC 3 study. We there-fore repeated the experiment in Sec. 4.3 [Kleiser et al., 2016b], including NIRO andFORE-SIGHT instruments this time. We computed coefficients for transformation ofStO2 from any instrument to any other and determined device-specific hypoxic andhyperoxic thresholds. In addition, we repeated some of the measurements published in[Kleiser et al., 2016b] to demonstrate reproducibility of the procedure. The presenteddata is going to be published as a paper. For said paper data analysis was in themeanwhile repeated with a minimally changed data base, yielding slightly differentnumbers but the same main results.
Tasks of the author related to this study were planning of the experiment, organiz-ing supply materials, performing the measurements (shared work), data analysis andplot creation, requesting original in-vivo data from Trine W. Hessel, investigating theagreement between in vivo and in vitro data and creating the following text serving asfirst draft for a paper.
Abstract: This is an extension to the paper "Comparison of tissue oximeters ona liquid phantom with adjustable optical properties" [Kleiser et al., 2016b]. We usedthe same phantom set-up and methods to characterize additional oximeters: NIRO-200NX (Hamamatsu), FORE-SIGHT Elite (Casmed) and SenSmart-X100 (Nonin).Additionally, we included some of the sensors investigated in [Kleiser et al., 2016b] todemonstrate repeatability of the method. We compared each oximeter to OxiplexTS(ISS) and provide a table with coefficients for linear transformation of tissue oxygenhaemoglobin saturation (StO2) from one device to another and action thresholds forthe SafeBoosC study. Changes in total haemoglobin concentration (ctHb) had stronginfluence on StO2 readings of all newly investigated oximeters. Repeated determinationof SafeBoosC action thresholds with OxyPrem v1.3 (University Hospital Zurich) andINVOS 5100C (Medtronic) with adult sensor agreed to 1 % and 2 %, respectively.
4.4.1 Methods
We employed the method presented in [Kleiser et al., 2016b] with a new set of devicesand compared them to OxiplexTS (ISS). We investigated the oximeters NIRO-200NX(Hamamatsu), FORE-SIGHT Elite (Casmed) and SenSmart-X100 (Nonin). Addition-ally we repeated some of the measurements in [Kleiser et al., 2016b] to show repeata-bility of the method with the INVOS 5100C (Medtronic) and OxyPrem v1.3 (in-housedeveloped, University Hospital Zurich) oximeters.
The in vitro set-up consisted of a phantom container offering four locationsfor simultaneous recordings with near-infrared spectroscopy (NIRS) sensors[Kleiser et al., 2016b]. The sensors were attached to a layer of silicone with tailoredoptical properties and thickness (windows). As in [Kleiser et al., 2016b], the windows
84

4.4 Extended oximeter comparison
in this study resembled skull at 2.5mm thickness, which is a typical value for neonates.The phantom container was filled with a liquid containing human haemoglobin (Hb)whose oxygenation was varied and intralipid (IL) which was added to obtain areduced scattering coefficient (µ
′
s) of ≈ 5.5 cm−1, again typical for neonates. Eachphantom covered a typical clinical range of total haemoglobin concentration (ctHb) inneonates.
The investigation was performed in three phantoms on three different days. In thefirst phantom, FORE-SIGHT Elite with small adhesive (FORE-SIGHT small) andsmall non-adhesive sensors (FORE-SIGHT small band) as well as NIRO-200NX withsmall adhesive sensor (NIRO small) were investigated with one de-oxygenation permixture. In the second phantom two groups of oximeters were investigated: Group1 consisted of SenSmart X-100 with 8004CA adult sensor (Nonin adult), FORE-SIGHTelite with large sensor (FORE-SIGHT adult) and NIRO-200NX with large adhesivesensor (NIRO large). Group 2 consisted of FORE-SIGHT elite with medium sensor(FORE-SIGHT medium) and NIRO-200NX with re-usable probes in small (source-detector separation (SDS) = 3 cm, NIRO small RU) and large settings (SDS = 4 cm,NIRO large RU). Groups 1 and 2 were intermittently placed on the phantom: Twode-oxygenations at ctHb = 30 µM were performed with group 1 before switching togroup 2 and performing another one. Then ctHb was increased to 47.5 µM and onede-oxygenation was first measured with group 2 followed by group 1. After increasingctHb to 75 µM, there were two de-oxygenations performed with group 1 followed byone de-oxygenation with group 2. In the third phantom, the INVOS with adultSomaSensor SAFB-SM (INVOS adult), OxyPrem v1.3 and Nonin adult were employed.For ctHb = 30 µM and 75 µM one de-oxygenation was performed each while there weretwo de-oxygenations at ctHb = 47.5 µM in between which the sensors were removedand mounted again.
The phantom consisted of the same ingredients as in [Kleiser et al., 2016b], obtainedfrom the same suppliers. Main ingredient of the phantom was phosphate bufferedsaline (PBS) (Kreis, pH = 7.4) with a volume of 2.5 l to which 74 ml IL (20 %) andvarious amounts of blood were added. We added sodium bicarbonate buffer (SBB)(8.4% ≡ 1mmol/ml) initially (15ml) and each time when adding blood to the phantom(10 ml). We added 3 g of yeast stirred with a small amount of SBB and 3 ml glucose(50%) solution to the phantom to trigger de-oxygenation. Each time blood was added,also 3 ml of glucose were added. The phantom was re-oxygenated by adding pureoxygen (O2) by bubbling.
In [Kleiser et al., 2016b], we covered the typical range of ctHb in neonates with threedistinct mixtures of the phantom liquid (ctHb = 25 µM, 45 µM and 70 µM) . Phantom1 was created from a different erythrocyte concentrate bag than phantoms 2 and3. Unfortunately it was not feasible to determine ctHb before the measurements. Wetherefore did not exactly reproduce the amounts of blood used in [Kleiser et al., 2016b]but varied blood amounts slightly based on readings of the oximeters. Later, wedetermined ctHb ≈ 215 g/l and haematocrit (htc) ≈ 65.5 % for both blood bags.Table 4.7 shows the amounts of blood added and the effective ctHb of each mixtureand phantom.
We observed pH and temperature (T ) by repeated measurements in all three phan-toms. Overall, pH was in the range 7.13 ≤ pH ≤ 7.64 with a general decrease over
85
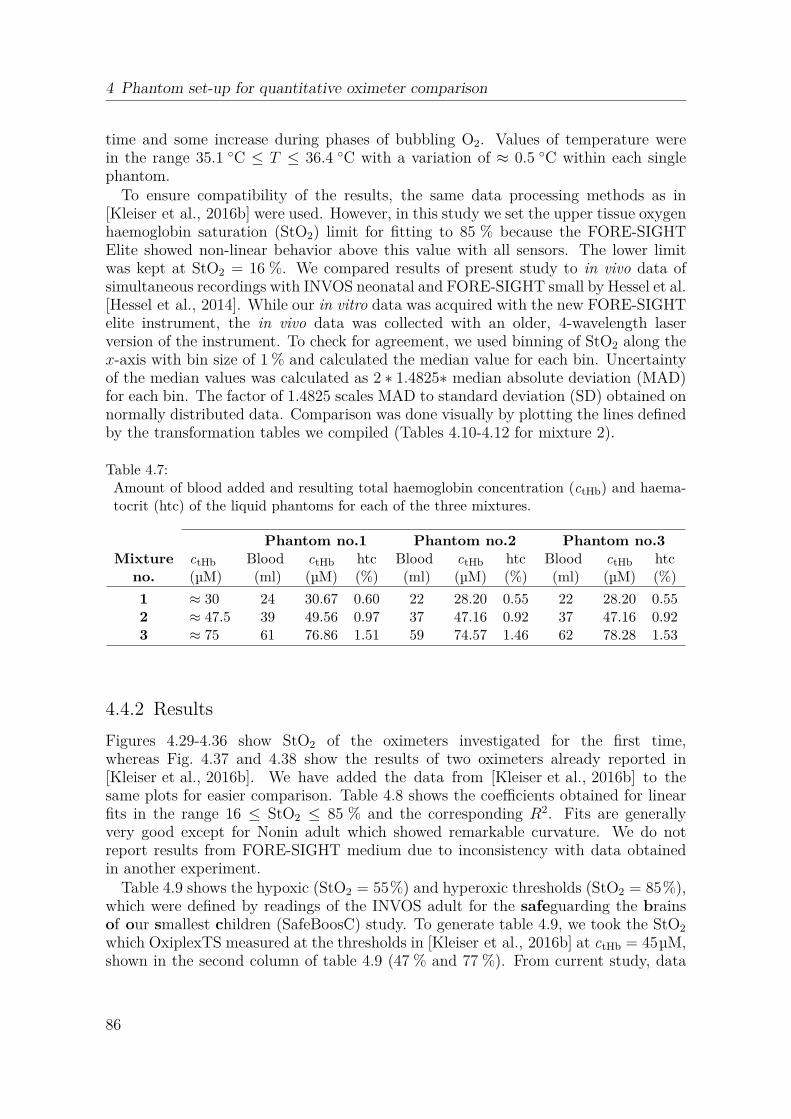
4 Phantom set-up for quantitative oximeter comparison
time and some increase during phases of bubbling O2. Values of temperature werein the range 35.1 ◦C ≤ T ≤ 36.4 ◦C with a variation of ≈ 0.5 ◦C within each singlephantom.
To ensure compatibility of the results, the same data processing methods as in[Kleiser et al., 2016b] were used. However, in this study we set the upper tissue oxygenhaemoglobin saturation (StO2) limit for fitting to 85 % because the FORE-SIGHTElite showed non-linear behavior above this value with all sensors. The lower limitwas kept at StO2 = 16 %. We compared results of present study to in vivo data ofsimultaneous recordings with INVOS neonatal and FORE-SIGHT small by Hessel et al.[Hessel et al., 2014]. While our in vitro data was acquired with the new FORE-SIGHTelite instrument, the in vivo data was collected with an older, 4-wavelength laserversion of the instrument. To check for agreement, we used binning of StO2 along thex-axis with bin size of 1 % and calculated the median value for each bin. Uncertaintyof the median values was calculated as 2 ∗ 1.4825∗ median absolute deviation (MAD)for each bin. The factor of 1.4825 scales MAD to standard deviation (SD) obtained onnormally distributed data. Comparison was done visually by plotting the lines definedby the transformation tables we compiled (Tables 4.10-4.12 for mixture 2).
Table 4.7:Amount of blood added and resulting total haemoglobin concentration (ctHb) and haema-tocrit (htc) of the liquid phantoms for each of the three mixtures.
Phantom no.1 Phantom no.2 Phantom no.3Mixture ctHb Blood ctHb htc Blood ctHb htc Blood ctHb htc
no. (µM) (ml) (µM) (%) (ml) (µM) (%) (ml) (µM) (%)
1 ≈ 30 24 30.67 0.60 22 28.20 0.55 22 28.20 0.552 ≈ 47.5 39 49.56 0.97 37 47.16 0.92 37 47.16 0.923 ≈ 75 61 76.86 1.51 59 74.57 1.46 62 78.28 1.53
4.4.2 Results
Figures 4.29-4.36 show StO2 of the oximeters investigated for the first time,whereas Fig. 4.37 and 4.38 show the results of two oximeters already reported in[Kleiser et al., 2016b]. We have added the data from [Kleiser et al., 2016b] to thesame plots for easier comparison. Table 4.8 shows the coefficients obtained for linearfits in the range 16 ≤ StO2 ≤ 85 % and the corresponding R2. Fits are generallyvery good except for Nonin adult which showed remarkable curvature. We do notreport results from FORE-SIGHT medium due to inconsistency with data obtainedin another experiment.
Table 4.9 shows the hypoxic (StO2 = 55%) and hyperoxic thresholds (StO2 = 85%),which were defined by readings of the INVOS adult for the safeguarding the brainsof our smallest children (SafeBoosC) study. To generate table 4.9, we took the StO2
which OxiplexTS measured at the thresholds in [Kleiser et al., 2016b] at ctHb = 45µM,shown in the second column of table 4.9 (47 % and 77 %). From current study, data
86

4.4 Extended oximeter comparison
at ctHb = 47.5 µM was used for this purpose. The table also lists the uncertainty ofStO2 readings when ctHb is could be anything in the range 30 ≤ ctHb ≤ 75 µM.
In [Kleiser et al., 2016b], we provided a table allowing for conversion of StO2 fromone oximeter to another for typical neonates which are simulated by mixture 2 (ctHb =45 µM in [Kleiser et al., 2016b], ctHb = 47.5 µM in present study). We reprintedresults of [Kleiser et al., 2016b] and added data obtained in this study. The result aretables 4.10-4.12.
0 10 20 30 40 50 60 70 80 90 100OxiplexTS StO
2 [%]
0
10
20
30
40
50
60
70
80
90
100
FO
RE
-SIG
HT
sm
all b
and
StO 2 [%
]
30 µM47.5 µM75 µM
Figure 4.29:FORE-SIGHT small with fixation bandvs. OxiplexTS for three different ctHb.Data was obtained in phantom 1.
0 10 20 30 40 50 60 70 80 90 100OxiplexTS StO
2 [%]
0
10
20
30
40
50
60
70
80
90
100
FO
RE
-SIG
HT
sm
all S
tO 2 [%]
30 µM47.5 µM75 µM
Figure 4.30:FORE-SIGHT small adhesive vs. Ox-iplexTS for three different ctHb. Datawas obtained in phantom 1.
Table 4.8:Coefficients for linear transformation StO2, Devicex
= a ∗ StO2, OxiplexTS + b.
ctHb = 30 µM ctHb = 47.5 µM ctHb = 75 µMa b R2 a b R2 a b R2
FORE-SIGHT small 0.35 51.0 0.998 0.47 43.5 0.997 0.57 35.6 0.994FORE-SIGHT small band 0.37 52.0 0.998 0.48 44.1 0.997 0.57 36.7 0.994FORE-SIGHT adult 0.49 38.9 0.961 0.52 40.1 0.994 0.66 29.6 0.995NIRO small 0.45 41.6 1.000 0.60 32.9 0.999 0.66 27.9 0.999NIRO small RU 0.49 41.9 0.999 0.57 36.1 0.999 0.68 28.1 0.999NIRO large 0.65 36.2 0.995 0.75 26.7 1.000 0.92 15.2 0.998NIRO large RU 0.61 36.6 1.000 0.69 29.6 1.000 0.81 21.7 0.999Nonin adult 0.56 2.7 0.984 0.85 -12.5 0.992 1.21 -34.1 0.991INVOS adult 0.83 18.8 0.999 1.03 5.1 0.999 1.28 -11.3 0.999OxyPrem v1.3 0.69 24.0 1.000 0.74 19.5 0.998 0.83 13.6 0.998
87

4 Phantom set-up for quantitative oximeter comparison
0 10 20 30 40 50 60 70 80 90 100OxiplexTS StO
2 [%]
0
10
20
30
40
50
60
70
80
90
100
FO
RE
-SIG
HT
sm
all S
tO 2 [%]
30 µM47.5 µM75 µM
Figure 4.31:FORE-SIGHT adult vs. OxiplexTS forthree different ctHb. Data was obtainedin phantom 2. The sensor was reposi-tioned after ctHb = 30 µM. There havebeen two consecutive de-oxygenations atctHb = 30 µM and 75 µM.
0 10 20 30 40 50 60 70 80 90 100OxiplexTS StO
2 [%]
0
10
20
30
40
50
60
70
80
90
100
Non
in a
dult
StO 2 [%
]
30 µM47.5 µM75 µM
Figure 4.32:Nonin adult vs. OxiplexTS for threedifferent ctHb. Data was obtained inphantom 2 and 3. In phantom 2, thesensor was repositioned after ctHb =30 µM. There have been two consecu-tive de-oxygenations at ctHb = 30 µMand 75 µM. In phantom 3, there were 2de-oxygenations at ctHb = 47.5 µM withsensor repositioning in between.
Table 4.9:SafeBoosC intervention thresholds for ctHb = 47.5 µM and range of uncertainty due tovariation of ctHb in the range of 30 µM to 75 µM. All values are given as StO2 [%].
OxiplexTS FORE-SIGHT OxyPremsmall small band adult v1.3
hypoxic threshold 47 66 67 65 54uncertainty range due to ctHb 4.9 5.9 1.2 3.6hyperoxic threshold 77 80 81 81 77uncertainty range due to ctHb 1.8 0.2 4.0 0.7
INVOS Nonin NIROadult adult large large RU small small RU
hypoxic threshold 53 27 63 62 61 63uncertainty range due to ctHb 9.1 6.0 8.1 5.7 3.8 4.8hyperoxic threshold 84 53 85 83 79 80uncertainty range due to ctHb 4.3 13.7 0.1 0.3 2.6 1.0
88

4.4 Extended oximeter comparison
0 10 20 30 40 50 60 70 80 90 100OxiplexTS StO
2 [%]
0
10
20
30
40
50
60
70
80
90
100
NIR
O s
mal
l RU
StO 2 [%
]
30 µM47.5 µM75 µM
Figure 4.33:NIRO-200NX small reusable vs. Oxi-plexTS three different ctHb. Data wasobtained in phantom 2. The sensor wasrepositioned after ctHb = 47.5 µM.
0 10 20 30 40 50 60 70 80 90 100OxiplexTS StO
2 [%]
0
10
20
30
40
50
60
70
80
90
100
NIR
O s
mal
l StO 2 [%
]
30 µM47.5 µM75 µM
Figure 4.34:NIRO-200NX small single-use vs. Ox-iplexTS for three different ctHb. Datawas obtained in phantom 1.
0 10 20 30 40 50 60 70 80 90 100OxiplexTS StO
2 [%]
0
10
20
30
40
50
60
70
80
90
100
NIR
O la
rge
RU
StO 2 [%
]
30 µM47.5 µM75 µM
Figure 4.35:NIRO-200NX large reusable vs. Oxi-plexTS three different ctHb. Data wasobtained in phantom 2. The sensor wasrepositioned after ctHb = 47.5 µM.
0 10 20 30 40 50 60 70 80 90 100OxiplexTS StO
2 [%]
0
10
20
30
40
50
60
70
80
90
100
NIR
O la
rge
StO 2 [%
]
30 µM47.5 µM75 µM
Figure 4.36:NIRO-200NX large single-use vs. Ox-iplexTS for three different ctHb. Datawas obtained in phantom 2. The sen-sor was repositioned after ctHb = 30 µMThere have been two consecutive de-oxygenations at ctHb = 30µM and 75µM.
89

4 Phantom set-up for quantitative oximeter comparison
0 10 20 30 40 50 60 70 80 90 100OxiplexTS StO
2 [%]
0
10
20
30
40
50
60
70
80
90
100
INV
OS
adu
lt S
tO 2 [%]
25 µM (1, old)25 µM (2, old)45 µM (old)70 µM (old)30 µM47.5 µM75 µM
Figure 4.37:INVOS adult vs. OxiplexTS for threedifferent ctHb. Data was obtainedin phantom 3. There were 2 de-oxygenations at ctHb = 47.5 µM withsensor repositioning in between. Datafrom [Kleiser et al., 2016b] is markedwith (old).
0 10 20 30 40 50 60 70 80 90 100OxiplexTS StO
2 [%]
0
10
20
30
40
50
60
70
80
90
100
Oxy
Pre
m v
1.3
StO 2 [%
]
25 µM (1, old)25 µM (2, old)25 µM (3, old)45 µM (1, old)45 µM (2, old)70 µM (1, old)70 µM (2, old)30 µM47.5 µM75 µM
Figure 4.38:Oxyprem v1.3 vs. OxiplexTS for threedifferent ctHb. Data was obtainedin phantom 3. There were 2 de-oxygenations at ctHb = 47.5 µM withsensor repositioning in between. Datafrom [Kleiser et al., 2016b] is markedwith (old).
Table 4.10:Coefficients for linear transformation of StO2 (%) from any oximeter to the scale of anyother oximeter: StO2,to = a ∗ StO2,from + b. Data from [Kleiser et al., 2016b] is printeditalic. Part 1.
OxiplexTS Oxyprem INVOS INVOS Nonin
to → v1.3 adult neonatal neonatal
from ↓ b a b a b a b a b a
Oxiplex TS 0.0 1.00 21.3 0.71 8.1 1.00 11.8 1.09 47.1 0.41
OxyPrem v1.3 -30.0 1.41 0.0 1.00 -21.9 1.41 -21.0 1.54 34.8 0.58
INVOS adult -8.1 1.00 15.6 0.71 0.0 1.00 3.0 1.10 43.8 0.41
INVOS neonatal -10.8 0.91 13.6 0.65 -2.7 0.91 0.0 1.00 42.7 0.38
Nonin neonatal -114.9 2.44 -60.1 1.73 -106.4 2.43 -113.8 2.67 0.0 1.00
FORE-SIGHT small -93.1 2.14 -44.7 1.52 -84.7 2.13 -90.0 2.34 8.9 0.88FORE-SIGHT small band -91.9 2.08 -43.9 1.48 -83.5 2.08 -88.7 2.28 9.4 0.85NIRO small -54.9 1.67 -17.7 1.18 -46.7 1.67 -48.3 1.83 24.6 0.69NIRO large RU -42.7 1.44 -9.0 1.02 -34.5 1.44 -34.9 1.58 29.6 0.59INVOS adult -4.9 0.97 17.8 0.69 3.1 0.97 6.4 1.07 45.1 0.40OxyPrem v1.3 -26.4 1.35 2.6 0.96 -18.2 1.35 -17.0 1.48 36.3 0.55Nonin adult 14.8 1.18 31.7 0.84 22.8 1.18 27.9 1.29 53.2 0.49FORE-SIGHT adult -76.5 1.91 -33.0 1.35 -68.2 1.90 -71.9 2.09 15.7 0.78NIRO large -35.6 1.33 -4.0 0.95 -27.4 1.33 -27.1 1.46 32.5 0.55NIRO small RU -63.5 1.76 -23.7 1.25 -55.2 1.75 -57.6 1.92 21.1 0.72
90
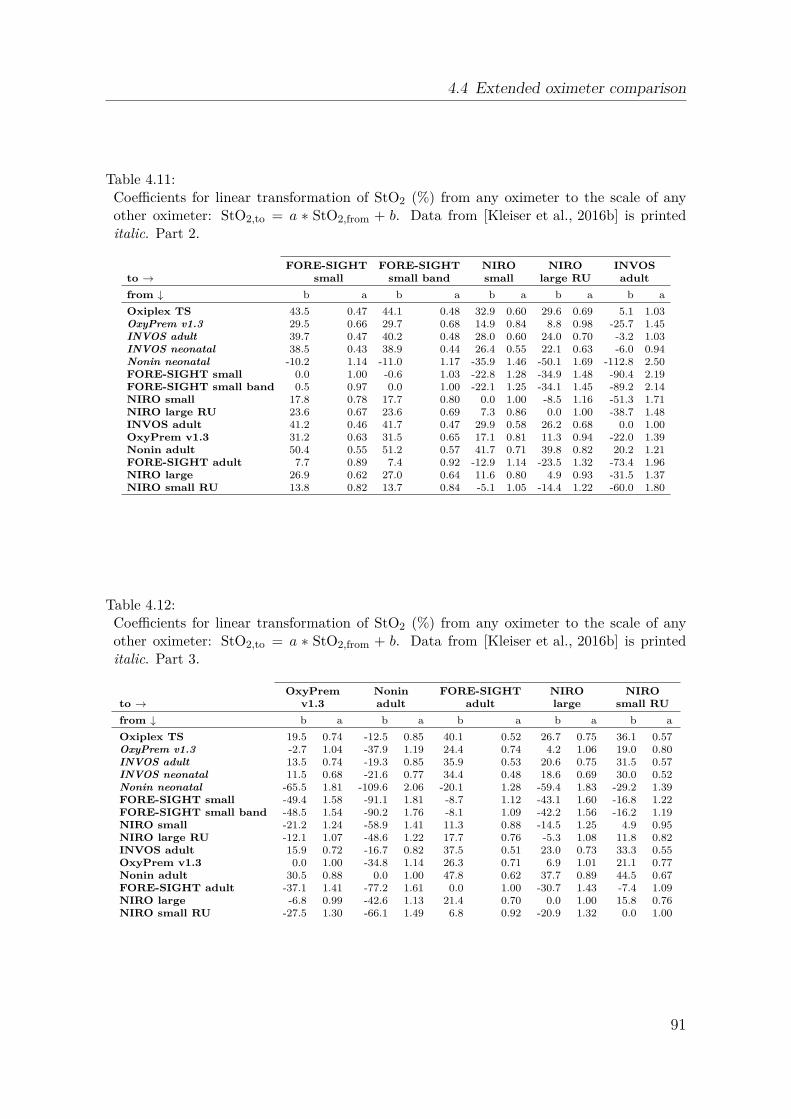
4.4 Extended oximeter comparison
Table 4.11:Coefficients for linear transformation of StO2 (%) from any oximeter to the scale of anyother oximeter: StO2,to = a ∗ StO2,from + b. Data from [Kleiser et al., 2016b] is printeditalic. Part 2.
FORE-SIGHT FORE-SIGHT NIRO NIRO INVOS
to → small small band small large RU adult
from ↓ b a b a b a b a b a
Oxiplex TS 43.5 0.47 44.1 0.48 32.9 0.60 29.6 0.69 5.1 1.03OxyPrem v1.3 29.5 0.66 29.7 0.68 14.9 0.84 8.8 0.98 -25.7 1.45INVOS adult 39.7 0.47 40.2 0.48 28.0 0.60 24.0 0.70 -3.2 1.03INVOS neonatal 38.5 0.43 38.9 0.44 26.4 0.55 22.1 0.63 -6.0 0.94Nonin neonatal -10.2 1.14 -11.0 1.17 -35.9 1.46 -50.1 1.69 -112.8 2.50FORE-SIGHT small 0.0 1.00 -0.6 1.03 -22.8 1.28 -34.9 1.48 -90.4 2.19FORE-SIGHT small band 0.5 0.97 0.0 1.00 -22.1 1.25 -34.1 1.45 -89.2 2.14NIRO small 17.8 0.78 17.7 0.80 0.0 1.00 -8.5 1.16 -51.3 1.71NIRO large RU 23.6 0.67 23.6 0.69 7.3 0.86 0.0 1.00 -38.7 1.48INVOS adult 41.2 0.46 41.7 0.47 29.9 0.58 26.2 0.68 0.0 1.00OxyPrem v1.3 31.2 0.63 31.5 0.65 17.1 0.81 11.3 0.94 -22.0 1.39Nonin adult 50.4 0.55 51.2 0.57 41.7 0.71 39.8 0.82 20.2 1.21FORE-SIGHT adult 7.7 0.89 7.4 0.92 -12.9 1.14 -23.5 1.32 -73.4 1.96NIRO large 26.9 0.62 27.0 0.64 11.6 0.80 4.9 0.93 -31.5 1.37NIRO small RU 13.8 0.82 13.7 0.84 -5.1 1.05 -14.4 1.22 -60.0 1.80
Table 4.12:Coefficients for linear transformation of StO2 (%) from any oximeter to the scale of anyother oximeter: StO2,to = a ∗ StO2,from + b. Data from [Kleiser et al., 2016b] is printeditalic. Part 3.
OxyPrem Nonin FORE-SIGHT NIRO NIRO
to → v1.3 adult adult large small RU
from ↓ b a b a b a b a b a
Oxiplex TS 19.5 0.74 -12.5 0.85 40.1 0.52 26.7 0.75 36.1 0.57OxyPrem v1.3 -2.7 1.04 -37.9 1.19 24.4 0.74 4.2 1.06 19.0 0.80INVOS adult 13.5 0.74 -19.3 0.85 35.9 0.53 20.6 0.75 31.5 0.57INVOS neonatal 11.5 0.68 -21.6 0.77 34.4 0.48 18.6 0.69 30.0 0.52Nonin neonatal -65.5 1.81 -109.6 2.06 -20.1 1.28 -59.4 1.83 -29.2 1.39FORE-SIGHT small -49.4 1.58 -91.1 1.81 -8.7 1.12 -43.1 1.60 -16.8 1.22FORE-SIGHT small band -48.5 1.54 -90.2 1.76 -8.1 1.09 -42.2 1.56 -16.2 1.19NIRO small -21.2 1.24 -58.9 1.41 11.3 0.88 -14.5 1.25 4.9 0.95NIRO large RU -12.1 1.07 -48.6 1.22 17.7 0.76 -5.3 1.08 11.8 0.82INVOS adult 15.9 0.72 -16.7 0.82 37.5 0.51 23.0 0.73 33.3 0.55OxyPrem v1.3 0.0 1.00 -34.8 1.14 26.3 0.71 6.9 1.01 21.1 0.77Nonin adult 30.5 0.88 0.0 1.00 47.8 0.62 37.7 0.89 44.5 0.67FORE-SIGHT adult -37.1 1.41 -77.2 1.61 0.0 1.00 -30.7 1.43 -7.4 1.09NIRO large -6.8 0.99 -42.6 1.13 21.4 0.70 0.0 1.00 15.8 0.76NIRO small RU -27.5 1.30 -66.1 1.49 6.8 0.92 -20.9 1.32 0.0 1.00
91

4 Phantom set-up for quantitative oximeter comparison
0 10 20 30 40 50 60 70 80 90 100FORE-SIGHT small StO
2 [%]
0
10
20
30
40
50
60
70
80
90
100
INV
OS
neo
nata
l StO 2 [%
]
Raw in vivoMedian in vivoIn vitro at 25 µMIn vitro at 45 µMIn vitro at 70 µM
in vivo with old 4 wavelength FORE-SIGHT
in vitro with new 5 wavelength FORE-SIGHT Elite
Figure 4.39:In vivo data from Hessel et al. [Hessel et al., 2014] of simultaneous recordings in neonateswith FORE-SIGHT small and INVOS neonatal compared to relations we obtained in vitro
at ctHb = 30, 47.5, and 75 µM. For each 1 % step in StO2 on the x-axis (FORE-SIGHT)there was a median of all y-values (INVOS) computed and displayed. The error bars arecalculated by 2 ∗ 1.4825∗ median absolute deviation (MAD) for each bin. Up to StO2 (x) ≈75 % the median values are well represented by the relations we obtained in vitro. Abovex ≈ 75 % there is no linear relation any more The black line at x = 47 % is the errorbar of this data point which extends outside the graph. Please note that in vivo datawas acquired with the old FORE-SIGHT instrument with 4 wavelengths and laser diodes,whereas in vitro data was acquired with the new FORE-SIGHT Elite instrument.
92

4.4 Extended oximeter comparison
10 20 30 40 50 60 70 80 90 100INVOS neonatal StO
2 [%]
0
100
200
300
400
500
600
700C
ount
s
40 50 60 70 80 90 100FORE-SIGHT small StO
2 [%]
0
50
100
150
200
250
300
Cou
nts
Figure 4.40:Histogram of in vivo data from Hessel et al. [Hessel et al., 2014]. INVOS neonatal showedStO2 = 95 % for a very large number of samples because of clipping at this value. Mostdata points are in the high StO2 range and low StO2 are marginally represented.
4.4.3 Discussion
This study is an extension to the study in [Kleiser et al., 2016b] using the same meth-ods. Therefore, we do not repeat the general discussion about aspects of the phantombut focus on new findings. Relations of all oximeters investigated to OxiplexTS onthe x-axis were linear except for some distinct exceptions. (1) Fig. 4.29, 4.30 and 4.31reveal that the FORE-SIGHT Elite oximeter is less sensitive to oxygenation changesfor StO2 > 85% where it becomes non-linear. This does not affect the analysis becausewe set the fitting range 16 ≤ StO2 ≤ 85% to circumvent this problem. (2) In Fig. 4.34the ctHb = 30 µM curve of NIRO small is non-linear at high StO2. This coincides withpH being measured at exactly the same time through an opening in the container lid. It seems probable that the pH-probe accidentally may have been placed in the lightpaths of the sensor. As this was at StO2 > 85 % it has no influence on the analysis.(3) Nonin adult to OxiplexTS behaviour is very non-linear (Fig. 4.32). The linear fitsare therefore not good and are depending on the StO2 range taken into account forfitting. In [Nasseri et al., 2016a] we had also observed non-linear behavior. We reportcoefficients for linear transformation from Nonin adult to other oximeters and viceversa, because the deviation from the fit lines is acceptable within the fit range, butask readers to not extrapolate to higher or lower StO2.
The slightly smaller fitting range (16 ≤ StO2 ≤ 85%) applied in this study comparedto [Kleiser et al., 2016b] does not affect results for all other oximeters because therewas little noise and all relations were linear in this StO2 range.
We do not report results for FORE-SIGHT medium because its response at ctHb =75 µM compared to response at the lower ctHb seemed different from the schemes ob-
93

4 Phantom set-up for quantitative oximeter comparison
served with the large and both small sensors on the same oximeter. Comparison ofFORE-SIGHT medium recordings with data from another, unpublished experimentwas inconsistent at all three ctHb. FORE-SIGHT medium was measuring simultane-ously with NIRO small RU and NIRO large RU. StO2 readings of NIRO small RUagreed well with another experiment in a different phantom (unpublished) which iswhy we can exclude phantom 2 as reason causing the deviation of FORE-SIGHTmedium. We also exclude bad sensor placement because it seems very unlikely thatdespite repositioning there was always bad optical coupling from sensor to the window.For lack of other likely reasons, we thus expect the individual sensor we used to bethe cause of the problem and consequently do not report results for FORE-SIGHTmedium.
For Nonin adult, we observed non-linear behavior, as previously in another phantomstudy with a different reference oximeter [Nasseri et al., 2016a]. Nonin adult behavedremarkably different in both studies with curvature being stronger in present study.Measurement with a brand new Nonin adult sensor in between the two de-oxygenationsat ctHb = 47.5 µM in phantom 3 did not result in a different response than shown inFig. 4.32. We therefore exclude a sensor defect. Nonin adult was used in two differentphantoms and the sensor was repositioned several times, so we also exclude bad sensorplacement with impaired optical coupling as possible reason. Readings of the otheroximeters measuring simultaneously with Nonin adult in both phantoms appear nor-mal. We consequently exclude the phantom being the reason for observed difference, aswell. The most remarkable difference between present study and [Nasseri et al., 2016a]are the different optical properties for the windows. This lets us suggest that in con-trast to other oximeters, Nonin adult seems to be very sensitive to optical propertiesof the superficial layer, although it is only 2.5 mm thick. We decided to report findingsof present study with Nonin adult for comparison to [Nasseri et al., 2016a], but askthe reader to treat them with some reservation.
The single-use sensors NIRO small and NIRO large produced slightly different resultsthan their re-usable counter parts. Although SDS of single use sensors and re-usablesensors are equal (in both cases 3cm for small and 4cm for large), probe geometries areslightly different with the detectors being square in the single use sensors. However,the results in table 4.9 between both small and both large sensors is negligible for thehypoxic threshold which is clinically most relevant.
4.4.3.1 Comparison to in vivo experiments
In lack of comparisons performed in vivo with the exact same versions of oximetersand sensors we used in our in vitro study, several comparisons with older versions ofthe instruments were considered:
FORE-SIGHT adult sensitivity compared to INVOS adult was 10.8 [%/min] /13.2 [%/min] ≈ 0.82 in [Hyttel-Sorensen et al., 2014a] on the adult forearm duringarterial occlusions with an old version of the FORE-SIGHT instrument. With thenew FORE-SIGHT Elite instrument, we found a ratio of 0.66/1.28 = 0.52 for theslopes of INVOS adult vs. OxiplexTS and FORE-SIGHT adult vs. OxiplexTS(table 4.8, ctHb = 75 µM). Agreement between these ratios is not good, but inanother study, the two device versions equipped with adult sensors also do not agree
94

4.4 Extended oximeter comparison
well [MacLeod et al., 2013]. Another reason may be that the phantom was simulatingreadings on the head of neonates and not on the adult forearm.
Nonin adult sensitivity compared to INVOS adult was 22.8(%/min)/13.2(%/min) ≈1.7 in [Hyttel-Sorensen et al., 2014a] on the adult forearm during arterial occlusionswith the old Nonin Equanox 7600 instrument equipped with the 8004CA sensor wealso used. We found a ratio of 1.21/1.28 ≈ 0.95 for the slopes of Nonin adult vs.OxiplexTS and INVOS adult vs. OxiplexTS (table 4.8, ctHb = 75 µM) with theNonin SenSmart X-100 instrument. Our in vitro observations seem to underestimatedifferences observed in vivo. However, it also seems possible that the two oximeterversions provide different StO2 readings or that Nonin adult StO2 readings are differentin phantom situations given its suspected high sensitivity to optical properties of thesuperficial layer.
Hyttel-Sorensen et al. [Hyttel-Sorensen et al., 2011] reported dynamic ranges(∆StO2) of 46.8 % for NIRO small RU, with the median dynamic range being equalto NIRO large RU for arterial occlusions on the forearm of healthy adults. At thehigh ctHb of 75 µM, our experiments revealed steepness of the linear fits with 0.81for NIRO large RU and 0.68 for NIRO small RU. We used two different re-usableprobes, one with small and one with large setting. This may also in part explain thedifferences, as probe-dependent readings were observed with a predecessor device[Sorensen et al., 2008]. However, ss the same tendency is also obvious with NIROsmall and NIRO large as well as for other oximeters, we think that influence of thestatic window might be slightly stronger for NIRO small RU because of its smallerSDS and its thereby reduced average photon penetration depth.
4.4.3.2 Comparison to in vivo data in neonates
Coefficients for transformation of StO2 from FORE-SIGHT small to INVOS neonatalare provided in table 4.10. Hessel et al. have compared these two sensors in neonatesdirectly after birth [Hessel et al., 2014], but with an older 4-wavelength version ofthe FORE-SIGHT instrument. They recorded with both sensors simultaneously, eachbeing placed on one hemisphere of the brain. Their complete StO2 data is plotted inFig. 4.39, with FORE-SIGHT small on the x-axis. Data was binned along the x-axiswith bin size of 1 % and the median was computed for each bin. Additionally we showfit lines we obtained in vitro for three different ctHb.
Although this seems to be an easy task, creation of a linear fit with this in vivodata is not straight forward for several reasons: (1) Some data has to be removedbecause of the INVOS oximeter clipping at StO2 = 95 %. Fig.4.40 reveals that this isthe case for almost 650 out of approximately 4600 overall value pairs which stronglydistorts the distribution of values. FORE-SIGHT small showed non-linear behaviorin the phantom measurements for StO2 > 85 %. For obtaining a valid fit, these datapoints should be removed, too. This means that a significant proportion of all datapoints would be disregarded, causing another problem. If data varies equally in bothdirections about the true mean, then we will estimate the mean wrongly if we cutaway data from one side of the distribution only. Even robust median statistics will bedistorted if clipped and non-linear data is removed. As a consequence, the resulting fitline depends strongly on which data points are omitted and its validity is questionable,
95

4 Phantom set-up for quantitative oximeter comparison
too. (2) For many situations in which linear regression models are applied, measure-ment of the independent variable (x-axis) without noise can be assumed. However,in the case of comparison of NIRS oximeters in vivo, values on x- and y-axes areboth affected by similar amounts of noise. It is a known fact that errors in the inde-pendent lead to underestimated linear slopes in straight line fits (regression dilution)[Fuller, 2008]. This is also the reason for the best linear estimates of x from y andy from x generally being different. Correction for regression dilution using advancedtechniques such as Deming regression is possible, but it is prone to introducing newerrors [Frost and Thompson, 2000] and is thus out of scope of this paper. (3) In thisin vivo data set, StO2 is not distributed evenly. For low StO2 there are very few datapoints only, which causes the steepness of the trend line to be weighted even moretowards zero than (2) would suggest because of the broad distribution of the pointcloud. As a result, it is likely that a fit on this specific data will miss the data pointsat low StO2 and thus will not extrapolate correctly to low StO2.
Due to the above difficulties, we decided not to show a linear fit to the in vivo databy Hessel et al. [Hessel et al., 2014]. In Fig. 4.39, we instead show median valuesfor each 1 % step on the x-axis without removing clipped data points and those fromnon-linear regions. For visual comparison, we have plotted the linear transformationfunctions obtained in vitro in present study for three different ctHb.
The lines lie within the point cloud and the vast majority of median values scattersaround the lines, showing good agreement for StO2(x) < 75 %. For StO2(x) > 75 %,median values are almost constant around StO2(y) ≈ 85 %. StO2(x) = 75 % coincideswith INVOS neonatal starting to clip at StO2 = 95 %. Overall, our in vitro relationsagree well with findings in vivo by Hessel at al. [Hessel et al., 2014]. However, thefact that two different versions of the FORE-SIGHT instrument were used limits thisobservation as we were not able to locate literature showing agreement or disagreementof the two instrument versions with neonatal sensors.
Hyttel-Sorensen et al. [Hyttel-Sorensen et al., 2014b] did a very similar comparisonin vivo on the head of neonates and on the adult forearm with OxyPrem v1.2and INVOS adult (also discussed in Sec. 2.4.3). OxyPrem v1.2 StO2 values werelinearly transformed by coefficients obtained in a homogeneous liquid phantom[Hyttel-Sorensen et al., 2013b]. A mixed effects model with INVOS adult asindependent obtained slightly higher slopes (significant for the adult forearm and notsignificant for neonates) than expected and a non-negligible offset. This is surprisingbecause regression dilution would have resulted in the opposite. Hyttel-Sorensenet al. give a number of possible reasons which could have negatively affected thecalibration procedure in [Hyttel-Sorensen et al., 2013b]. Amongst these are possibleregional differences in oxygen haemoglobin saturation (SO2) of the phantom (i.e. agradient in phantom SO2), missing repetitions of the experiment and different SDSof OxyPrem v1.2 (1.5 and 2.5 cm) and INVOS adult (3 and 4 cm) which should nothave any influence in a phantom without superficial layer, but certainly does in vivowhen superficial layers such as adipose tissue or the skull are present.
The liquid phantom set-up introduced in [Kleiser et al., 2016b] which is also em-ployed in present study, does not suffer from the aforementioned issues. The set-upwas tested for vertical gradients which were negligible [Kleiser et al., 2016b]. We wereable to reproduce results from [Kleiser et al., 2016b] with good accuracy (Sec. 4.4.3.3)
96
4.4 Extended oximeter comparison
and also repeatedly unmounted and re-mounted sensors onto the phantom set-up whichintroduced only minor variation. The set-up resembles a 2-layer model of skull (2.5mmthickness) and brain at different ctHb and thus is a more precise model of the real sit-uation than the phantom used in [Hyttel-Sorensen et al., 2013b].
4.4.3.3 Reproducibility of the method
We included INVOS adult and OxyPrem v1.3 in this study. Both oximeters were in-vestigated in [Kleiser et al., 2016b], enabling an estimation of repeatability of the pro-cedure. Fig. 4.37 and 4.38 show the resulting relationships of the two oximeters to Ox-iplexTS from both studies. Within the fitting range, differences are < 3 %. Table 4.10shows that linear transformation from present results to those of [Kleiser et al., 2016b]is y = 0.97x + 3.1 for INVOS adult and y = 0.96x + 2.6 for OxyPrem v1.3 which areboth close to the perfect relationship given by y = 1x + 0. Table 4.9 further showsthat uncertainty range due to changes in ctHb is slightly increased for OxyPrem v1.3 atthe hypoxic threshold and for INVOS adult at the hyperoxic threshold. This increaseis most likely caused by the sensor re-mounting between the two de-oxygenations atctHb = 47.5µM which showed resulted in a slight shift of values (Fig. 4.38). Estimationof hypoxic and hyperoxic thresholds only deviates by 2% and 1% for INVOS adult andby 1 % at both thresholds for OxyPrem v1.3 compared to [Kleiser et al., 2016b]. Wethus consider the observed degree of variation in the low percentage range acceptableand conclude good reproducibility.
4.4.4 Conclusion
We presented an in vitro study comparing near-infrared spectroscopy (NIRS) oxime-ters in a 2-layer liquid phantom resembling the head of neonates [Kleiser et al., 2016b]including additional instruments. For each oximeter and sensor, we calculated inter-vention thresholds as defined in the SafeBoosC study and uncertainty of these thresh-olds related to changes in total haemoglobin concentration (ctHb). Furthermore, wecombined both data sets to provide a table to transform tissue oxygen haemoglobinsaturation (StO2) from one oximeter to another. This table now includes the mostcommon cerebral NIRS oximeters. Repeated assessment of two oximeters investigatedin [Kleiser et al., 2016b] and sensor re-mounting showed good reproducibility of theresults.
97

4 Phantom set-up for quantitative oximeter comparison
4.5 Effect of superficial layer thickness[Nasseri et al., 2016a]
A slight alteration of the set-up presented in Sec. 4.1 allowed us to investigate theeffect of different adipose tissue thickness (ATT) on sensitivity of several near-infraredspectroscopy (NIRS) oximeters to oxygenation changes in the phantom. We createda different set of windows with optical properties of adipose tissue measured in vivo.Different window thicknesses and shifting of sensors after each cycle of oxygenation andde-oxygenation allowed us to compare 4 NIRS oximeters simultaneously while applyingOxyVLS as reference. This is of practical interest because for muscle oximetry therehave been lower dynamic ranges reported for thicker ATT and this experiment allowsfor a quantitative comparison of the matter.
Although OxyPrem v1.3 has shorter source-detector separation (SDS) than the otheroximeters with their adult sensors, OxyPrem v1.3 performs slightly better. For alloximeters, their sensitivity at thicknesses greater than 9 mm is severely impaired.However, the results also show that at the thickness of 2.5 mm chosen for the neona-tal head model (Sec. 4.3) sensitivity of all oximeters applied was almost unchangedcompared to extrapolated 0 mm thickness. Therefore, the exact absorption propertiesof the windows, which might not resemble those in vivo completely, have very limitedeffect on the results in the neonatal head model employed in the previous Sec 4.3and 4.4.
The author’s tasks related to this study were NIRS and oxygen partial pressure (pO2)reference data analysis, creation of in vitro result plots and generation of the errortable. Planning and conduction of the experiment were shared work.
The following reproduction of the paper ’Quantifying the effect of adipose tissuein muscle oximetry by near infrared spectroscopy’ [Nasseri et al., 2016a] published inBiomedical Optics Express has been slightly adapted in terms of nomenclatureand formatting.
98
4.5 Effect of superficial layer thickness [Nasseri et al., 2016a]
Quantifying the effect of adiposetissue in muscle oximetry by near
infrared spectroscopyNassim Nasseri1,3,∗, Stefan Kleiser1,3,∗∗, Daniel Ostojic 1, Tanja Karen2 and
Martin Wolf1
1 Biomedical Optics Research Laboratory, Department of Neonatology, UniversityHospital Zurich, Zurich, Switzerland
2 Department of Neonatology, University Hospital Zurich, Zurich, Switzerland
3equal contribution∗ [email protected]∗∗ [email protected]
published 17 Oct 2016Vol. 7, No. 11
10.1364/BOE.7.004605
BIOMEDICAL OPTICS EXPRESS 4605https://doi.org/10.1364/BOE.7.004605
OCIS codes: (120.3890) Medical optics instrumentation, (170.6510) Spectroscopy,tissue diagnostics.
Abstract: Change of muscle tissue oxygen haemoglobin saturation (StO2), due toexercise, measured by near-infrared spectroscopy (NIRS) is known to be lower forsubjects with higher adipose tissue thickness. This is most likely not physiologicalbut caused by the superficial fat and adipose tissue. In this paper we assessed, invitro, the influence of adipose tissue thickness (ATT) on muscle StO2, measured byNIRS oximeters. We measured StO2 of a liquid phantom by 3 continuous-wave (CW)oximeters (Sensmart Model X-100 Universal Oximetry System, INVOS 5100C, andOxyPrem v1.3), as well as a frequency-domain oximeter, OxiplexTS, through super-ficial layers with 4 different thicknesses. Later, we employed the results to calibrateOxyPrem v1.3 for adipose tissue thickness in vivo.
4.5.1 Introduction
The state of muscle oxygenation after specific interventions may be a valuable indi-cator of different medical conditions. For example, in [Duret et al., 2015], StO2 hasbeen measured on thenar eminence muscle of trauma patients with hemorrhagic shock.The results have shown that StO2 was different in patients with unchanged conditionscompared to those with worsened condition, after 72 hours of admission. Moreover,muscle oxygenation at the onset of muscle activity has been employed as a diagnostictool for mitochondrial diseases. A review on the application of NIRS for diagnosis ofmitochondrial dysfunction is available in [Hamaoka et al., 2007]. Response of muscleoxygenation to interventions such as movement, treadmill-walking, arterial and venous
99

4 Phantom set-up for quantitative oximeter comparison
occlusion, and plantar reflection has also been applied for diagnosis of peripheral ar-terial disease, acute and chronic compartment syndrome of the lower extremity, deepvein thrombosis, and buttock or lower extremity ischemia [Boezeman et al., 2016]. Asa result, monitoring the state of muscle oxygenation seems to have high clinical rel-evance. However, measuring muscle oxygenation may be difficult if NIRS oximetersare affected by superficial layers. This is, hence, needed to measure the influence ofadipose tissue layer on the StO2 measured by NIRS oximeters.
In a previous study, the multi-distance approach and a frequency domain (FD)NIRS oximeter were applied on several blocks with known optical properties whilethey were covered with thin layers with different optical properties. It was concludedthat superficial layers with thickness of less than 6 mm have negligible effects onmeasurement of absorption coefficient (µa) and reduced scattering coefficient (µ
′
s) ofthe deep layer [Franceschini et al., 1998]. But these results may not be transferableto CW NIRS oximeters which are more widely used in clinics and research. Most ofthese instruments have only two different source-detector separation (SDS) and do notallow for custom algorithms based on detected raw light intensities, rather only have asingle StO2 value as output. Hence it is not clear if CW NIRS oximetry is applicablein case of high ATT.
Determining the effect of ATT on muscle StO2 in vivo is not possible. StO2 cor-responds to the ratio of cO2Hb and total haemoglobin concentration (ctHb) = cO2Hb /(cO2Hb + cHHb), with oxy-haemoglobin concentration (cO2Hb) and deoxy-haemoglobinconcentration (cHHb). NIRS measures the average cO2Hb and cHHb in the light pathand is most sensitive to the haemoglobin (Hb) in small blood vessels, i.e. arteri-oles, capillaries and venules. Often a contribution of 30 % arterial and 70 % ve-nous blood to the cerebral and muscle StO2 is assumed. But this proportion can-not easily be measured and is likely not constant over time. It may change inpatients with arteriovascular disease and also differs between tissues and subjects[Wolf et al., 2012, Lima and Bakker, 2011]. This is not only the case for cerebraloximetry but also for muscle oximetry as blood from one muscle may drain into sev-eral veins and one vein may on the other hand carry blood from several muscles[Meissner, 2005]. Therefore, it is not currently possible to establish the effect of theATT on muscle StO2 in vivo from blood sample co-oximetry.
Phantoms are practical for evaluating oximeters and assessing their stabilityand performance. To test absorption measurement, solid or liquid phantomscontaining a dye and a scattering agent at known concentrations may be applied[Jelzow et al., 2014, Firbank and Delpy, 1993]. Phantoms may model severallayers of tissue with different thickness. Hb has a very distinctive absorptionspectrum. As a result, phantoms are desirable which contain real Hb whoseoxygenation can be changed by yeast [Suzuki et al., 1999, Kurth et al., 1995] or gasexchange[Hyttel-Sorensen et al., 2013b].
To obtain reference StO2 values, co-oximetry may be applied. Co-oximetry inphantoms is appropriate for set-ups containing undiluted blood [Kraitl et al., 2013].However, it is difficult to apply co-oximetry in phantoms with diluted blood[Hyttel-Sorensen et al., 2013b]. As a result we employed an in-house made oximeter(OxyVLS) which functions based on visible light spectroscopy (VLS) as the referenceoximeter. A good agreement between the values measured by this oximeter and
100
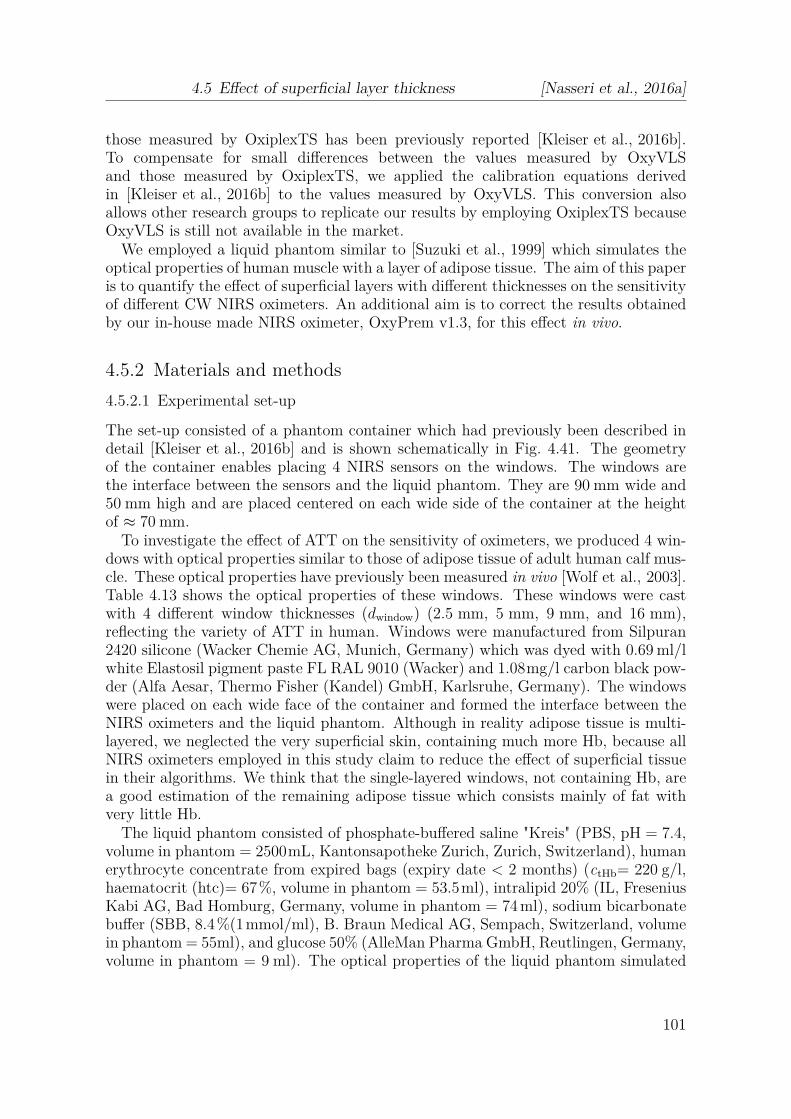
4.5 Effect of superficial layer thickness [Nasseri et al., 2016a]
those measured by OxiplexTS has been previously reported [Kleiser et al., 2016b].To compensate for small differences between the values measured by OxyVLSand those measured by OxiplexTS, we applied the calibration equations derivedin [Kleiser et al., 2016b] to the values measured by OxyVLS. This conversion alsoallows other research groups to replicate our results by employing OxiplexTS becauseOxyVLS is still not available in the market.
We employed a liquid phantom similar to [Suzuki et al., 1999] which simulates theoptical properties of human muscle with a layer of adipose tissue. The aim of this paperis to quantify the effect of superficial layers with different thicknesses on the sensitivityof different CW NIRS oximeters. An additional aim is to correct the results obtainedby our in-house made NIRS oximeter, OxyPrem v1.3, for this effect in vivo.
4.5.2 Materials and methods
4.5.2.1 Experimental set-up
The set-up consisted of a phantom container which had previously been described indetail [Kleiser et al., 2016b] and is shown schematically in Fig. 4.41. The geometryof the container enables placing 4 NIRS sensors on the windows. The windows arethe interface between the sensors and the liquid phantom. They are 90 mm wide and50 mm high and are placed centered on each wide side of the container at the heightof ≈ 70 mm.
To investigate the effect of ATT on the sensitivity of oximeters, we produced 4 win-dows with optical properties similar to those of adipose tissue of adult human calf mus-cle. These optical properties have previously been measured in vivo [Wolf et al., 2003].Table 4.13 shows the optical properties of these windows. These windows were castwith 4 different window thicknesses (dwindow) (2.5 mm, 5 mm, 9 mm, and 16 mm),reflecting the variety of ATT in human. Windows were manufactured from Silpuran2420 silicone (Wacker Chemie AG, Munich, Germany) which was dyed with 0.69 ml/lwhite Elastosil pigment paste FL RAL 9010 (Wacker) and 1.08mg/l carbon black pow-der (Alfa Aesar, Thermo Fisher (Kandel) GmbH, Karlsruhe, Germany). The windowswere placed on each wide face of the container and formed the interface between theNIRS oximeters and the liquid phantom. Although in reality adipose tissue is multi-layered, we neglected the very superficial skin, containing much more Hb, because allNIRS oximeters employed in this study claim to reduce the effect of superficial tissuein their algorithms. We think that the single-layered windows, not containing Hb, area good estimation of the remaining adipose tissue which consists mainly of fat withvery little Hb.
The liquid phantom consisted of phosphate-buffered saline "Kreis" (PBS, pH = 7.4,volume in phantom = 2500mL, Kantonsapotheke Zurich, Zurich, Switzerland), humanerythrocyte concentrate from expired bags (expiry date < 2 months) (ctHb= 220 g/l,haematocrit (htc)= 67%, volume in phantom = 53.5ml), intralipid 20% (IL, FreseniusKabi AG, Bad Homburg, Germany, volume in phantom = 74 ml), sodium bicarbonatebuffer (SBB, 8.4%(1mmol/ml), B. Braun Medical AG, Sempach, Switzerland, volumein phantom = 55ml), and glucose 50% (AlleMan Pharma GmbH, Reutlingen, Germany,volume in phantom = 9 ml). The optical properties of the liquid phantom simulated
101

4 Phantom set-up for quantitative oximeter comparison
openings for windows
and NIRS oximeters
opening for insertion
of OxyVLS sensor
directly into the
phantom
oxygen in-flow through
a plastic tube
temperature, pH, pO2,
and pCO2 sensors
magnetic stirrer and hot plate
Figure 4.41:The experimental set-up is shown schematically. The cap of the container effectively pre-vented oxygen and light entering into the phantom. NIRS sensors were placed in the middleof each window.
the calf muscle [Wolf et al., 2003]. Table 4.13 indicates the optical properties of thede-oxygenated liquid phantom.
Table 4.13:Optical properties of the de-oxygenated liquid phantom and the windows.
834 nm 692 nm
µa (cm−1) µ′
s (cm−1) µa (cm−1) µ′
s (cm−1)
windows 0.057 4.4 0.059 5.0
liquid phantom 0.13 4.9 0.26 5.9
4.5.2.2 Comparison of the liquid phantom to previous studies
The liquid phantom described here has been previously employed and in detail de-scribed for in vitro comparison of cerebral oximeters [Kleiser et al., 2016b]. The no. 3mixture of phantom 2 [Kleiser et al., 2016b] with ctHb = 70 µM and the same concen-tration of all other ingredients has been replicated with the only exception of settingthe concentration of SBB to 55 mL this time. The windows assembled in this studyhad different thicknesses (dwindow) and optical properties when compared to set-upin [Kleiser et al., 2016b] to reflect adipose tissue with different thicknesses. temper-ature (T ) in this measurement (30.50 ◦C < T < 34.02 ◦C) was lower than the one
102
4.5 Effect of superficial layer thickness [Nasseri et al., 2016a]
reported in [Kleiser et al., 2016b] (37.10 ◦C < T < 38.40 ◦C). This deviation does notfalsify our results because reference oxygenation values are not obtained as describedin [Kleiser et al., 2016b] from oxygen-Hb dissociation curve. The mixture no. 3 from[Kleiser et al., 2016b] is in good agreement with the current mixture (Table 4.14) inthe sense of pH quantities (7.06 < pH < 7.27) and carbon dioxide partial pressure(pCO2) quantities (7.07 kPa < pCO2 < 14.96 kPa).
Table 4.14:pH, temperature (T ), and carbon dioxide partial pressure (pCO2) range in 4 cycles ofmeasurement.
pH T (◦C) pCO2 (kPa)min mean max min mean max min mean max
cycle 1 7.14 7.17 7.21 30.50 31.24 32.00 11.96 13.41 15.15
cycle 2 7.15 7.20 7.22 32.02 32.58 33.20 12.87 13.93 16.35
cycle 3 7.18 7.23 7.27 32.80 33.21 33.60 11.32 12.22 14.59
cycle 4 7.25 7.31 7.35 33.21 33.60 34.02 10.38 11.51 13.43
4.5.2.3 NIRS oximeters
In this paper we employed OxiplexTS with rigid sensor (ISS, Inc., Champaign, IL,USA), INVOS 5100C with adult SomaSensor SAFB-SM (Medtronic, Inc., Minneapo-lis, MN, USA/ INVOS adult), Sensmart Model X-100 Universal Oximetry Systemwith adult 8004CA (Nonin Medical, Inc., Plymouth, MN, USA/ Nonin adult) andOxyPrem v1.3 (in-house made NIRS oximeter, University Hospital Zurich, Zurich,Switzerland). All oximeters measure absolute StO2. Table 4.15 shows wavelengthsemployed by each oximeter, SDS, number of light paths, and the average penetrationdepth (APD) that each oximeter achieves in a semi-infinite medium with the sameoptical properties as the windows. We calculated the mean APD based on Eq. (4.1)[Patterson et al., 1995], including the longest SDS, assuming µ′
a and µ′s as measured by
OxiplexTS on a solid block phantom with window optical properties, dwindow = 55mm,and linearly interpolated over wavelength. For each oximeter we calculated the APDfor each wavelength, the oximeter employs and then reported the average of theseAPD values.
APD =12
[ SDSmax
(3µaµ′s)
1
2
]1
2
(4.1)
4.5.2.4 in vitro measurement
We conducted 4 cycles of oxygenation-de-oxygenation of Hb in the liquid phantom.At the end of each cycle we shifted the NIRS oximeters to the next window. Henceafter 4 repetitions, each oximeter had measured through 4 different dwindow.We de-oxygenated the phantom by adding respiring yeast into the phantom
103

4 Phantom set-up for quantitative oximeter comparison
Table 4.15:Technical information on NIRS oximeters, INVOS adult, Nonin adult, OxyPrem v1.3, Ox-iplexTS.
Oximeter peak wavelength (nm) SDS (mm) APD no. ofλ1 λ2 λ3 λ4 p1 p2 p3 p4 (mm) light paths
INVOS adult 730 810 − − 30 40 − − 10.6 2
Nonin adult 730 760 810 870 20 40 − − 10.6 4
OxyPrem v1.3 690 760 805 830 15 20 30 35 9.9 8
OxiplexTS 692 834 − − 25 30 35 40 10.5 4
and re-oxygenated it by providing an oxygen (O2) in-flow to the phantom, asdescribed in [Kleiser et al., 2016b]. We preferred this approach over gas exchange[Hyttel-Sorensen et al., 2013b] because of less set-up complexity, higher speedof de-oxygenating and more homogeneity in the phantom [Kleiser et al., 2016b].Table 4.16 shows the location of each sensor in different cycles of the measurementand Table 4.14 shows the ranges of pH, T and pCO2 in each cycle.
Table 4.16:Sensor placememt during 4 different cycles of oxygenation-de-oxygenation.
dwindow cycle 1 cycle 2 cycle 3 cycle 4
2.5 mm OxiplexTS OxyPrem v1.3 INVOS adult Nonin adult
5 mm Nonin adult OxiplexTS OxyPrem v1.3 INVOS adult
9 mm INVOS adult Nonin adult OxiplexTS OxyPrem v1.3
16 mm OxyPrem v1.3 INVOS adult Nonin adult OxiplexTS
4.5.2.4.1 Oximetry by visible light spectroscopy (OxyVLS) For oximetry by visiblelight spectroscopy we employed our in-house made oximeter, OxyVLS (BiomedicalOptics Research Laboratory (BORL), University Hospital of Zurich, Zurich, Switzer-land) [Kleiser et al., 2016b]. This oximeter measures StO2 based on the shape of theabsorption spectrum of Hb in the range 520 nm < λ < 600 nm. Figure 4.42 shows howthe shape of the absorption spectrum of Hb changes based on its oxygenation state.We have provided the technical details of this oximeter in [Kleiser et al., 2016b]. Pre-viously, we set the FD NIRS oximeter, OxiplexTS, as the reference oximeter because itmeasures independent from ctHb and in a robust way and because it is available in themarket for other researchers. Because of the same reasons, we applied the equationwe calculated previously to convert the results obtained by OxyVLS to OxiplexTS forctHb = 70µM and reported these values as reference StO2 values [Kleiser et al., 2016b].
4.5.2.4.2 Data processing We applied a moving average filter over 3 samples on theOxyVLS dataset. The data is dynamic, but the de-oxygenation occurs in approxi-mately a linear manner and averaging over 3 samples, therefore, does not introduce
104

4.5 Effect of superficial layer thickness [Nasseri et al., 2016a]
Figure 4.42:Absorption spectrum of Hb based on its oxygenation state. Data from [Zijlstra et al., 2000].
an error in comparison. For all other oximeters, raw StO2 values were recorded. Thedifferent oximeters with different sampling rates were connected to different computerswith slightly different clocks. Event marks were not available in all oximeters. Thus,data were synchronized manually based on the StO2 rising point as soon as we startedre-oxygenating. We resampled the data from all oximeters to 1
12Hz and applied a kol-
mogorov zurbenko filter with 3 iterations on them. Obvious artifacts were removed, i.e. data with saturated detector for the OxiplexTS. We visually inspected data for cor-rect alignment of the time-series within one sample. We applied 1st degree polynomialfits to calculate the relation between StO2 measured by each oximeter vs. referenceduring de-oxygenations in the range of 80 % ≥ StO2 ≥ 30 % and at 4 different dwindow.
For sensitivity analysis, we applied sigmoid functions to model the loss of sensitivityto the change of oxygenation as dwindow increases. We normalized the sensitivity of eachoxmeter to its sensitivity at dwindow = 0 mm and call this relative sensitivity (RS). Weintroduced a scaling factor in the sigmoid equations. We then divided all sensitivityvalues by this factor to produce Fig. 4.45. This way, as expected, we reach relativesensitivity of 1 when there is no adipose tissue (ATT = 0). The sigmoid functionestimates the relative sensitivity of the oximeter to muscle oxygenation when it isapplied on tissue with known ATT. In case of peripheral tissue, this thickness can bemeasured by a caliper and may be applied for calibration. Such sigmoid functions havepreviously been employed to model the superficial layer thickness dependence of µa
and µ′
s measurements by FD NIRS oximeters [Franceschini et al., 1998]. Extrapolationuntil 35 mm and the specific form of the sigmoid functions have been chosen for thepurpose of comparison to [Franceschini et al., 1998].
4.5.2.5 In vivo measurement
We recruited a 32 years old, male subject with a body mass index (BMI) of 29.6and blood pressure of 120/80 mmHg at the time of the measurement. We employedOxyPrem v1.3 and conducted 3 measurements on the subject, one on the belly andthe other two, on different arm muscles. We chose extensor carpi ulnaris and brachio-
105
4 Phantom set-up for quantitative oximeter comparison
radialis muscles, as they are easily accessible and their oxygenation can be varied bypneumatic pressure cuff occlusion on the upper arm. Prior to the NIRS measurements,we measured the ATT by a caliper over these two muscles, as well as on the belly. Ateach location we measured 5 times and took the average value as ATT (Table 4.17).We chose a caliper for this purpose because its results are in good agreement withthose from CT [Orphanidou et al., 1994].
Table 4.17:Adipose tissue thickness on different body regions of the subject who was recruited for thein vivo measurement.
region ATT (mm)
extensor carpi ulnaris muscle 3.6brachioradialis muscle 4.65
belly 33.40
4.5.3 Results
Figure 4.43 shows the time-series of the 4 cycles, measured by 4 different NIRS oxime-ters and at 4 different dwindow. It is observable that the dynamic range of StO2 variesbetween oximeters and decreases when the oximeters measure through windows withhigher dwindow.
Figure 4.44 shows scatter plots of Nonin adult, OxyPrem v1.3, OxiplexTS andINVOS adult, respectively vs. the reference. We limited our analysis to 30 % ≤StO2 ≤ 80% in which the relation between OxyVLS and the NIRS oximeters was linear(R2 > 0.97 in all cases) and is physiologically relevant (gray square) [Bauer et al., 2004,Comerota et al., 2003]. The results of cycle 1 for Nonin adult (Nonin adult on 5 mmwindow) was implausible. Thus we reported this value but excluded it from furtheranalysis. In addition to the data, we provided linear fits of all samples in the range30 % ≤ StO2 ≤ 80 % which is indicated by the gray background in Fig. 4.44. Here, wedefine sensitivity of each oximeter at each dwindow, to be the slope of its correspondinglinear fit. As depicted in Fig. 4.44 the sensitivity of all oximeters decreases as dwindow
increases. Figure 4.45 shows the trend of the relative sensitivity of each oximeter asdwindow increases. Figure. 4.46 shows a comparison of the trend of relative sensitivityvs. dwindow
APD, between the CW oximeters and the FD oximeter. It is visible that as dwindow
APDincreases, the FD oximeter retains higher relative sensitivity.
4.5.3.1 Calibration in vivo
We assume that at ATT= 2.5mm the influence of the superficial layers is negligible andwe calibrate StO2 with thicker and known ATT to StO2 values with ATT = 2.5 mm.As shown in Fig. 4.44(a)-(d), linear fits at different dwindow cross at different points foreach oximeter. This crossing point is for each oximeter a function of the thickness ofthe window. There is a narrow region which is almost one point for OxyPrem v1.3 thatall the linear fits cross. For OxyPrem v1.3, the y-value at this point corresponds to
106

4.5 Effect of superficial layer thickness [Nasseri et al., 2016a]
time (min)
StO
2 (%
)
0 20 40 60 80 100 120 140 160 180
0
20
40
60
80
100 OxiplexTS 2.5mmOxyPrem v1.3 2.5mmINVOS adult 2.5mmNonin adult 2.5mmOxiplexTS 5mmOxyPrem v1.3 5mmINVOS adult 5mmNonin adult 5mmOxiplexTS 9mmOxyPrem v1.3 9mmINVOS adult 9mmNonin adult 9mmOxiplexTS 16mmOxyPrem v1.3 16mmINVOS adult 16mmNonin adult 16mmOxyVLS
Figure 4.43:Time series of 4 cycles of oxygenation measurement by OxiplexTS, OxyPrem v1.3, INVOSadult, and Nonin adult at 2.5 mm, 5 mm, 9 mm, and 16 mm window thickness.
StO2 superficial which is the StO2 value that the oximeter measures on a block phantomwith dwindow = 55 mm and the same optical properties as those of the windows. In invivo measurements, StO2 superficial can be measured on a region with high ATT, i.e. onthe belly.
For in vivo calibration by OxyPrem v1.3, we measured StO2 superficial = 79%±1% onthe belly of the subject. StO2 superficial is to be measured for each single oximeter andeach single subject on the belly, prior to the measurement on the muscle. However,it has to be noted that this method only works for oximeters like OxyPrem v1.3which, as depicted in Fig. 4.44, have a single crossing point. RS of OxyPrem v1.3 atATT = 3.6 mm is 0.96 and at ATT = 4.65 mm is 0.91 (Table 4.17 and Fig. 4.45(b)).Equation (4.2) depicts the general calibration and Fig. 4.47 shows StO2 of extensorcarpi ulnaris as well as the brachioradialis muscles of the subject, before and aftercalibration, measured by OxyPrem v1.3.
StO2, calibrated =StO2, not calibrated + (RS − 1)StO2 superficial
RS(4.2)
4.5.3.2 in vitro evaluation of calibration
To evaluate the calibration procedure proposed in section 4.5.3.1, we applied the cali-bration equation (Eq. 4.2) on the OxyPrem v1.3 in vitro dataset, obtained in the phan-tom, for dwindow = 5, 9, and 16 mm. We calculated RS based on Fig. 4.44(b) and mea-sured StO2 superficial by applying OxyPrem v1.3 on a block phantom (dwindow = 55mm)which had the same optical properties as those of the windows, prior to the measure-ment (StO2 superficial = 68%). Table 4.18 shows the value each oximeter measured on
107
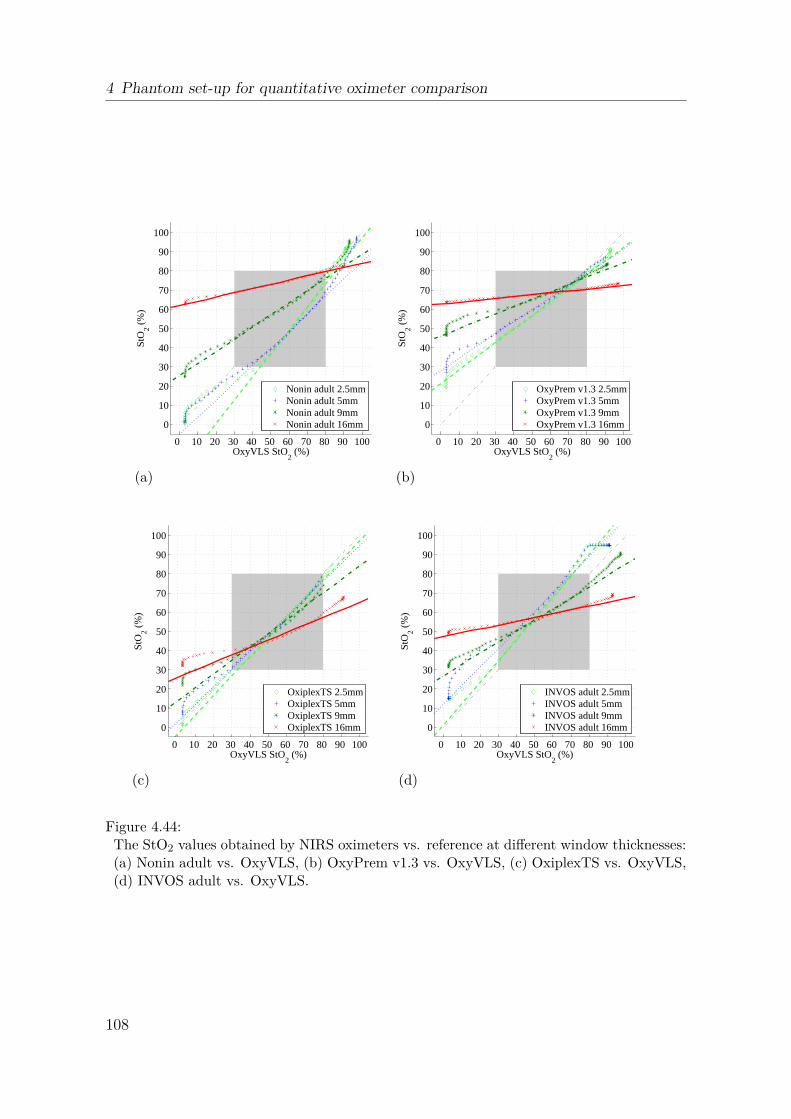
4 Phantom set-up for quantitative oximeter comparison
OxyVLS StO2 (%)
StO
2 (%
)
0 10 20 30 40 50 60 70 80 90 100
0
10
20
30
40
50
60
70
80
90
100
Nonin adult 2.5mmNonin adult 5mmNonin adult 9mmNonin adult 16mm
(a)
OxyVLS StO2 (%)
StO
2 (%
)
0 10 20 30 40 50 60 70 80 90 100
0
10
20
30
40
50
60
70
80
90
100
OxyPrem v1.3 2.5mmOxyPrem v1.3 5mmOxyPrem v1.3 9mmOxyPrem v1.3 16mm
(b)
OxyVLS StO2 (%)
StO
2 (%
)
0 10 20 30 40 50 60 70 80 90 100
0
10
20
30
40
50
60
70
80
90
100
OxiplexTS 2.5mmOxiplexTS 5mmOxiplexTS 9mmOxiplexTS 16mm
(c)
OxyVLS StO2 (%)
StO
2 (%
)
0 10 20 30 40 50 60 70 80 90 100
0
10
20
30
40
50
60
70
80
90
100
INVOS adult 2.5mmINVOS adult 5mmINVOS adult 9mmINVOS adult 16mm
(d)
Figure 4.44:The StO2 values obtained by NIRS oximeters vs. reference at different window thicknesses:(a) Nonin adult vs. OxyVLS, (b) OxyPrem v1.3 vs. OxyVLS, (c) OxiplexTS vs. OxyVLS,(d) INVOS adult vs. OxyVLS.
108

4.5 Effect of superficial layer thickness [Nasseri et al., 2016a]
0 5 10 15 20 25 30 350
0.25
0.5
0.75
1
Nonin adult, SDS = 20/40 mm
superficial layer thickness (mm)
rela
tive
sens
itivi
ty
(a)
0 5 10 15 20 25 30 350
0.25
0.5
0.75
1
OxyPrem v1.3, SDS = 15/20/30/35 mm
superficial layer thickness (mm)
rela
tive
sens
itivi
ty
(b)
0 5 10 15 20 25 30 350
0.25
0.5
0.75
1
Oxiplex TS, SDS = 25/30/35/40 mm
superficial layer thickness (mm)
rela
tive
sens
itivi
ty
(c)
0 5 10 15 20 25 30 350
0.25
0.5
0.75
1
INVOS adult, SDS = 30/40 mm
superficial layer thickness (mm)
rela
tive
sens
itivi
ty
(d)
Figure 4.45:Sensitivity of NIRS oximeters measured on superficial layers with different thicknesses andthe corresponding trend lines: (a) Nonin adult: y = 411.2x−2.724
1+411.2x−2.724 , R2adj = 1.000, the
gray point was excluded from fitting because of implausibility, (b) OxyPrem v1.3: y =1732x−3.346
1+1732x−3.346 , R2adj = 0.9997, (c) OxiplexTS: y = 260.2x−2.188
1+260.2x−2.188 , R2adj = 0.9999, (d) INVOS
adult: y = 449.1x−2.767
1+449.1x−2.767 , R2adj = 1.000
.
0 0.5 1 1.5 2 2.5 3 3.50
0.2
0.4
0.6
0.8
1
window thickness / average penetration depth
rela
tive
sens
itivi
ty
CW oximeterstrend of CW oximetersFD oximetertrend of FD oximeter
Figure 4.46:Trend of the relative sensitivity of oximeters vs. window thickness
average penetration depth. The trend lines fol-
low the equations y = 0.7052x−2.977
1+0.7052x−2.977 , R2adj = 0.9945 ( CW oximeters) and y = 1.5174x−2.188
1+1.517x−2.188 ,
R2adj = 0.9999 ( FD oximeter). The gray point was excluded from fitting because of im-
plausibility.
109

4 Phantom set-up for quantitative oximeter comparison
time [s]
StO
2
0 50 100 150 200 250 300 350 400 450 500 5500
20
40
60
80
1004.65mm uncalibrated4.65mm calibrated3.6mm uncalibrated3.6mm calibrated
Figure 4.47:StO2 measured by OxyPrem v1.3 on extensor carpi ulnaris (ATT = 3.6 mm) as well asthe brachioradialis (ATT = 4.65 mm) muscle, before and after calibration. The verti-cal line indicates the start of an arterial occlusion at 250mmHg. StO2,3.6mm,calibrated =StO2,3.6 mm, uncalibrated−0.03
0.96 and StO2,4.65 mm,calibrated =StO2,4.65 mm,uncalibrated−0.07
0.91 .
this block phantom. We interpolated all datasets ([reference , StO2,OxyP rem,dwindow,x])
during de-oxygenation, in the range 80 % ≥ StO2, OxyVLS ≥ 30 %, to 1 % steps (corre-sponding to 78.1 % ≥ StO2,OxyPrem, 2.5 mm ≥ 42.6 %. We calculated the maximum error(emax) and additionally we applied Eq. (4.3) to calculate the root-mean-square (RMS)error (eRMS) where, n is the number of data points (n = 51). Table 4.19 shows emax
and eRMS of the in vitro measurement by OxyPrem v1.3 due to window thickness andalso indicates the relative reduction of this error due to the calibration.
Table 4.18:StO2 value measured by different oximeters on a solid block phantom with the same opticalproperties as those of the windows (StO2 superficial).
oximeter OxyPrem v1.3 OxiplexTS INVOS Nonin
StO2 superficial 68% 13% 53% 78%
eRMS =
√
√
√
√
1n
n∑
t=1
(StO2, calibrated − StO2, 2.5mm)2 (4.3)
110

4.5 Effect of superficial layer thickness [Nasseri et al., 2016a]
Table 4.19:Maximum and RMS error of StO2 measurement for uncalibrated and calibrated in vitro
data , measured by OxyPrem v1.3.
ATT = 5 mm ATT = 9 mm ATT = 16 mm
em
ax
uncalibrated 4.9% 16.8% 23.3%
calibrated 4.1% 9.1% 10.9%
relative reduction 16% 46% 53%
eR
MS uncalibrated 2.9% 8.5% 11.9%
calibrated 2.1% 6.2% 8.4%
relative reduction 28% 27% 29%
4.5.4 Discussion
4.5.4.1 Reference oximetry
OxyVLS was the only oximeter which was directly immersed into the liquid phantomand its output was independent of dwindow. We calibrated the results obtained byOxyVLS to the results obtained by OxiplexTS based on the equations we reported in[Kleiser et al., 2016b] for ctHb = 70 µM and then employed them as the reference StO2
values. This allows other research groups to reproduce our results.
4.5.4.2 Initial sensitivity of oximeters and the influence of superficial layers on it
It has been reported that different cerebral oximeters show different absolute values oftissue oxygenation on the same tissue. These values depend on the assumptions theymake and algorithms they apply [Wolf et al., 2012, Dullenkopf et al., 2003,Sorensen and Greisen, 2006, Jenny et al., 2011, Pocivalnik et al., 2011,Dix et al., 2013, Szczapa et al., 2013, Hessel et al., 2014, Schneider et al., 2014].Similar results have been reported for oximetry on the muscles of lower arm bydifferent NIRS oximeters [Hyttel-Sorensen et al., 2014b]. As a result the exactrelation between the values measured by different oximeters are not known. The aimof this study was to solely quantify the effect of adipose tissue on measurements bya specific oximeter. A separate calibration step is needed to be able to compare theresults obtained by different oximeters as shown in [Kleiser et al., 2016b].
4.5.4.3 Effect of superficial layers on continuous-wave and frequency-domain NIRSoximeters
In Fig. 4.45(a)-(d) it is observable that when dwindow ≤ 5mm all oximeters have arelative sensitivity of more than 84% with OxiplexTS having the highest relative sen-sitivity at this thickness and also at other thicknesses. OxiplexTS is an FD oximeterand its high relative sensitivity at dwindow = 16mm may be due to the fact thatits phase measurement contributes to having more information from the deep tissue[Gratton et al., 1994].
111

4 Phantom set-up for quantitative oximeter comparison
Relative sensitivity= 50% is reached for CW oximeters at dwindow/APD ≈ 0.9 andFD oximeter at dwindow/APD ≈ 1.2. This means that the penetration depth of theoximeters is dominated by their largest SDS and that the FD oximeter performs betterat higher superficial layer thickness than the CW oximeters.
4.5.4.4 In vivo calibration of OxyPrem v1.3
For in vivo calibration of ATT, a calibration point is required. For calibration ofOxyPrem v1.3 we proposed to measure this point (StO2 superficial) on the belly of thesubject, where ATT is high and the oximeter only measures the adipose tissue. Thisvalue corresponds to the point all curves cross one another in Fig. 4.44(b).
Figure 4.47 shows the result of an arterial occlusion on extensor carpi ulnaris andbrachioradialis muscles of a subject, before and after calibration, by OxyPrem v1.3.The two muscles have different initial StO2. The difference between calibrated and notcalibrated StO2 is bigger for brachioradialis muscle as this muscle had a higher ATTcompared to extensor carpi ulnaris. After calibration and with time passing by fromthe moment of occlusion, the two curves converge. This is expected, as for very longcomplete occlusions lim tocclusion→∞(StO2) = 0 %. Table 4.19 shows that the calibrationprocedure reduced eRMS at ATT > 2.5 mm by ≈ 28 % and emax by 16 − 53 % for thein vitro data which is also transferable to the in vivo data.
4.5.4.5 Applicability of in vivo calibration to other NIRS oximeters
By comparing Fig. 4.44(a) and (b) to Table 4.18, it is observable that all curves ofOxyPrem v1.3 and 3 curves of Nonin adult (5 mm was excluded due to implausibility)cross at about StO2 superficial. OxiplexTS is an FD oximeter and it measures absoluteµa and µ
′
s. µa and µ′
s may have different penetration depths [Franceschini et al., 1998]and as a result its crossing point does not correspond to StO2 superficial. The locationof the crossing point for the INVOS adult is strongly dependent on the window thick-ness. In our calibration procedure we assume that all the linear fits in Fig. 4.44 crossone another at a single point which corresponds to the value the oximeter measureson a solid block phantom with the same optical properties as those of windows. Ourresults show that this assumption is appropriate for OxyPrem v1.3 and may be appro-priate for Nonin adult too but not for other oximeters employed in this measurement.Slight deviation of StO2 superficial from the crossing point in Fig. 4.44(b) creates theeRMS. As a result absolute calibration for ATT was only possible for OxyPrem v1.3.However, in case of ∆StO2 measurement, for which only the relative sensitivity isneeded (Eq. (4.2)), our procedure is still applicable. This point has to be noted be-cause ∆StO2 is the main parameter which has been previously clinically monitored inmuscle oximetry [Boezeman et al., 2016, Hamaoka et al., 2007, Duret et al., 2015]. Incase of correcting ∆StO2, we expect lower errors than reported in Table 4.3 because noStO2 superficial is required but only the equations for relative sensitivity and a measureof ATT (∆StO2,calibrated = ∆StO2,not calibrated
RS).
112
4.5 Effect of superficial layer thickness [Nasseri et al., 2016a]
4.5.4.6 Suitability of the optical properties of the windows
The windows do not have the same absorption spectrum as adipose tissue. However,If we assume adipose tissue consists of 70 % fat [Brook, 1971] and 30 % water withvery small ctHb, 0.043 < µa < 0.063 cm−1; for 690 nm < λ < 870 nm, µ
′
s = 5 cm−1, andSDS= 40mm, this leads to 10.1mm <APD< 11.2mm. For our windows we determined10.5 mm < APD < 10.6 mm for the oximeters with SDS = 40 mm (Table 4.15), whichis in good agreement with expected APD in vivo. Therefore, the loss in sensitivityto muscle will be similar in vitro and in vivo, but the absolute StO2 differs on theblock phantom and on the belly. Our in vivo calibration procedure meliorates this bymeasuring StO2 superficial on the belly.
The variation in the optical properties of the adipose tissue as observed in[Wolf et al., 2003], in the worst case produces 21 % variation in the APD of theoximeters, assuming SDS = 40 mm. However, in most realistic in vivo measurementswe expect a much lower variation (≈ 11 %) due to the inter-quartile range of adiposetissue optical properties reported in [Wolf et al., 2003] with small intra-subjectvariation.
4.5.4.7 Comparison to [Kleiser et al., 2016b], presenting data from the same phantom
This study was conducted by employing mixture no. 3 of phantom 2 which is describedin [Kleiser et al., 2016b]. We compared the results reported here to those reported in[Kleiser et al., 2016b]. In the present measurement we converted OxyVLS raw valuesto those which would have been measured by OxiplexTS at ctHb = 70 µM based onthe equation in [Kleiser et al., 2016b]. In Fig. 4.44(c) we would therefore expect alinear equation of y = 1x + 0 on the 2.5mm window and have found y = 1.005x −3.5 which in our opinion is in a good agreement with our previous findings. TheOxiplexTS to OxyPrem v1.3 equation for ctHb = 70 µM was y = 0.77x + 17.2 in[Kleiser et al., 2016b]. In the present experiment the comparison of linear fits for the2.5mm window yields y = 0.71x + 23.9. This results in an average difference of 3.3%for 30% < StO2 < 80% between the two experiments. For the OxiplexTS to INVOSadult equation this difference is in average 6.4% in the same range of StO2. As aresult there was a good agreement between the results reported here and our previousfindings. Small differences between the phantom employed here and the phantom in[Kleiser et al., 2016b], as described in section 4.5.2.2, may explain the small differencesin the results we reported.
4.5.4.8 Applicability to cerebral oximetry
The calibration method demonstrated in the current manuscript reduces the effectof the superficial adipose tissue layer in muscle oximetry. This is only feasible if ameasurement can be conducted on a region in which the thickness of the adipose tissueis high (> 3 APD). Thus, this method is not applicable in absolute brain oximetry toremove the influence of the skull.
113

4 Phantom set-up for quantitative oximeter comparison
4.5.4.9 Contribution of myoglobin
Boushel et al. state in their review on muscle oximetry that the spectra of Hband myoglobin are indistinguishable, e.g. the absorption peak at 755 nm of Hb isshifted by only ≈ 5 nm to 760 nm due to presence of myoglobin[Marcinek et al., 2007,Boushel and Piantadosi, 2000]. Since most NIRS oximeters apply LEDs with broadwavelength distribution of ≈ 30nm (full width at half maximum (FWHM)), they can-not distinguish between presence and absence of myoglobin. As a result our phantomcontaining only Hb was a realistic model of human muscle.
4.5.5 Conclusion
We conclude that all oximeters employed in this study were seriously affected bythe thickness of the superficial layer. At 16 mm window thickness, sensitivity wasonly a small fraction of the sensitivity at 2.5 mm window thickness, but all oximetersstill measured the changes in phantom oxygenation. We modeled the trend of therelative sensitivity of the oximeters, measured in vitro, in relation to window thicknesswith sigmoid functions. Generally, relative sensitivity decreased to ≈ 50 % when thewindow thickness was equal to the average penetration depth of each oximeter in thewindows. OxiplexTS performed better than the continuous-wave oximeters, but wasstill seriously affected by the thickness of the superficial layer. Our OxyPrem v1.3 invivo calibration procedure significantly reduced the maximum measurement error dueto adipose tissue thickness but its practical value has to be further studied becauseit depends on a number of assumptions and involves a multiplication of any error ofestimation. A similar calibration procedure for ∆StO2 measurement can be appliedto all NIRS oximeters employed in this study.
Funding
This presented work was funded by the Nano-Tera projects, ObeSense, ParaTex, andNewbornCare, and the Clinical Research Priority Program Tumor Oxygenation of theUniversity of Zurich.
114

4.6 Investigation of superficial effects [Stachel, 2016]
4.6 Investigation of superficial effects[Stachel, 2016]
Many near-infrared spectroscopy (NIRS) oximetry application guidelines tell users toavoid certain situations if possible. Amongst these are measuring with superficial clearlayers, placement on hair and local inhomogeneities such as big superficial vessels andplacement on top of or across big fissures in cerebral measurements. Derived fromtheory, it is quite plausible that all mentioned conditions alter results. However, it isnot clear to which extent such imperfections in the NIRS measurement falsify tissueoxygen haemoglobin saturation (StO2) readings. This is of importance because inpractice they cannot always be avoided.
Typical examples of clear layers that may be present in a patient requiring moni-toring by NIRS oximetry are some ultrasound gel remaining after examination, or inneonates a thin layer of oil applied to the skin. Local inhomogeneities with higherabsorption such as birth marks, hair or big superficial vessels may be unavoidabledepending on the patient. For neonates with their relatively small head, one side ofthe forehead might not be big enough to place a sensor. Then either part of the sensorhas to measure through hair or the sensor has to be placed centrally on the foreheadon top of the central fissure separating the two brain hemispheres which is filled withcerebro spinal fluid (CSF).
Our phantom model allowed investigating all these conditions with small adaptationsin the master thesis of Helene Stachel [Stachel, 2016]. Clear layers were put betweensensor and silicone window. To simulate local inhomogeneities by birthmarks or hair,we applied thin foils with a similar spectrum like melanin in the near-infrared (NIR)onto parts of the sensors. Placement on top of fissures filled with CSF was simulatedby special 2-layer windows. OxiplexTS was placed on a window simulating skull at2.5 mm thickness (Sec. 4.3) without any alterations to provide for a stable reference.
Results are that thin clear layers do not affect StO2 readings, whereas thick layersshould be avoided. Local inhomogeneities should be avoided with all sensors thatdo not completely cancel coupling coefficients in their algorithms. We expect sensorsincorporating a self-calibrating algorithm such as OxyPrem v1.3 to be not affected bythis kind of error, although this is yet to be shown. Lastly, our model of the centralfissure showed altered sensitivity and absolute StO2 readings. However, there is onlya small difference between perpendicular and parallel fissure orientation. Therefore itmay be possible that the effect is caused by the baseline being determined on skull-only windows, whereas the two other conditions included a CSF layer also outside thefissure area.
Tasks of the author related to this study were supervising of the master thesis ofHelene Stachel, organizing material supply, planning and conducting the experiments(joint effort) and providing a matlab script as base for NIRS data evaluation and plotcreation.
The following pages reproduce the master thesis of Helene Stachel [Stachel, 2016]with slight adaptations in terms of nomenclature and formatting.
115

4 Phantom set-up for quantitative oximeter comparison
Master ThesisMAS Medizinphysik
Investigation of typical applicationerrors handling NIRS oximeters
handed in on August 1st, 2016
Author:Helene Stachel
Supervisors:Dipl.-Ing Stefan Kleiser
Prof. Martin Wolf
Abstract: The handling ofnear-infrared spectroscopy (NIRS) devices in clinical set-tings is prone to application errors. The aim was to assess the impact light piping,melanin and the irregular shape of the cerebro spinal fluid (CSF) layer have on themeasurement of tissue oxygen haemoglobin saturation (StO2). Three continuous-wave(CW) devices (Foresight, NIRO-200NX and INVOS) with their infant sensors werecompared to a frequency domain (FD) device (OxiplexTS) on liquid optical phantomsmimicking the optical properties of a neonate’s brain. Thin clear layers showed nosignificant effect. Asymmetric light absorption by melanin mimicked filters lead tosystematically different StO2 values. Vertical and horizontal sensor placement on themiddle of a preterm infant’s forehead showed significant impairment of the measure-ment signal due to the underlying fissure filled with CSF. Placement of NIRS sensors oneither thick clear layers, hair, skin marks or centered on the preterm infant’s foreheadproves to be unreliable.
4.6.1 Introduction
4.6.1.1 Background information
In the year 1977 Jöbsis demonstrated the possibility to monitor cerebral tissueoxygen haemoglobin saturation (StO2) in a non-invasive, continuous manner.Jöbsis pointed out that working with light in thenear-infrared (NIR) range hasnot only applications in research, but also in the clinical diagnostics and moni-toring [Jobsis, 1977]. His work marks the beginning of near-infrared spectroscopy(NIRS). Since 1977, many NIRS devices have been built and approved for clinicalapplication [Wolf et al., 2012]. However, the measurement precision of today’sNIRS devices is still not high enough. Devices from different companies relyon different algorithms delivering varying StO2 values for the same measure-ment [Wolf et al., 2012, Van Bel et al., 2008]. As a trend monitor NIRS devices are
116

4.6 Investigation of superficial effects [Stachel, 2016]
recommendable [Van Bel et al., 2008]. However, absolute values to be used as treat-ment guidelines have to be adapted to the measurement regime of each NIRS deviceseparately [Kleiser et al., 2016a, Kleiser et al., 2016b, Hyttel-Sorensen et al., 2013b].
4.6.1.2 Practical problems using NIRS in daily clinical routine
Typically, a NIRS device is equipped with light sources in the near infrared rangeand light sensitive detectors. The sensors are connected to the measurement deviceby optical or electrical signal wiring. These sensors are attached to the region to bemeasured, either through adhesives or with the help of bandages. NIRS devices areusually continuous wave devices [Scholkmann et al., 2014a] and employ the diffusionapproximation.
Most NIRS algorithms basically assume an homogeneous semi-infinite geome-try [Fantini et al., 1994]. More sophisticated algorithms remove the influence ofsuperficial layers (such as skin or bone) assessing the StO2 of underlying tissue. Whenapplying the NIRS sensor to the human body, these assumptions need to be fulfilled.Consequently, there are some situations generally to be avoided, such as light piping,additional absorbers not accounted for and inhomogeneous structures.
Whenever there is a clear layer between the sensor and the biological tissue to bemeasured, this may lead to light piping [Wolf et al., 1999]. In a clinical setting, sucha clear layer could be created by sweat or oil as neonates, especially preterm infants,are anointed regularly. The usage of ultrasound couplant gel could create a clear,light channeling layer, which could require a thorough cleaning after every ultrasoundexamination before (re-) applying the NIRS sensor. Finally, even air gaps can leadto light piping. Air gaps are easily created through movements or surface bending towhich a rigid sensor may not adapt to.
NIRS devices utilize the absorption spectra of hemoglobin, as oxygenated and de-oxygenated hemoglobin molecules show different absorption spectral features in thenear infrared range. Hemoglobin is the most prominent absorber of near infraredlight in this region, but others may be present too. For example, some NIRS devicestake water into account [Scholkmann et al., 2014a]. Melanin on the other hand isusually not accounted for in a NIRS algorithm, despite having an unfavorable influ-ence [Pringle et al., 1999]. An important application of NIRS is the trend-monitoringof brain oxygenation [Van Bel et al., 2008, Wolf et al., 2012], but avoiding the intru-sion of hair under the sensor is especially tricky when applying the sensor onto thehead. Furthermore, birth marks should be avoided.
Cerebro spinal fluid (CSF) does not only represent a clear, homogeneous fluidpossibly enabling light piping below the skull, but also exhibits an inhomogeneousstructure right underneath the forehead. Mostly, the CSF layer is approximatelyhomogeneous with a thickness of ≈ 2.4mm [Demel et al., 2014a]. However, the mediallongitudinal fissure represents an irregularity which might pose a problem if the sensoris applied right above it.
117
4 Phantom set-up for quantitative oximeter comparison
4.6.1.3 Aim
The aim is to assess whether light piping, melanin or the irregular shape of the CSFlayer lead to errors in the StO2 values of commercially available NIRS devices. In aclinical setting, such unfavorable circumstances can not always be avoided. It is to betested whether such NIRS measurements are still reliable.
4.6.2 Methods
4.6.2.1 Basic measurement setup
The basic measurement setup described in this work was previously utilized for similarstudies [Kleiser et al., 2016b]. Essentially, a black container is filled with a liquidphantom, mimicking the optical properties of a neonatal brain. This container isequipped with four openings, where each opening has a clamp to attach a silicone layermimicking skull properties in the near infrared range. These layers are called windowsfrom here on, as they close the container, but allow near infrared light to pass throughin a controlled manner. The windows are made from a two-component silicone (WackerChemie AG, SILPURAN 2420 A/B), mixed with color additives mimicking opticalproperties of bone in the near infrared region. The windows mimicking bone propertieswere manufactured by Stefan Kleiser as described in paper [Kleiser et al., 2016b], theirrecipe is given in table 4.20.
Table 4.20:The recipe shows the quantities of carbon black powder and white color paste neededper liter silicone SILPURAN 2420. SILPURAN 2420 and ELASTOSIL color pastes areboth manufactured by Wacker Chemie AG (Munich, Germany). Carbon black powder wasobtained from Alfa Asar, Thermo Fisher GmbH (Karlsruhe, Germany).
tissue to bemimicked
absorptioncoefficient (µa)(834 nm) [1/cm]
reducedscattering
coefficient (µ′
s)(834 nm) [1/cm]
carbon blackpowder[mg l−1]
ELASTOSILcolor pasteFL white
[µl l−1]
bone 0.11 8.3 2.26 1.15CSF 0.04 2.4 0.75 0.39
In addition to the four window openings, the black liquid phantom container incor-porates additional openings to allow
• measuring the temperature,
• assessing the liquid phantom’s pH value and
• adding ingredients to the liquid phantom.
118
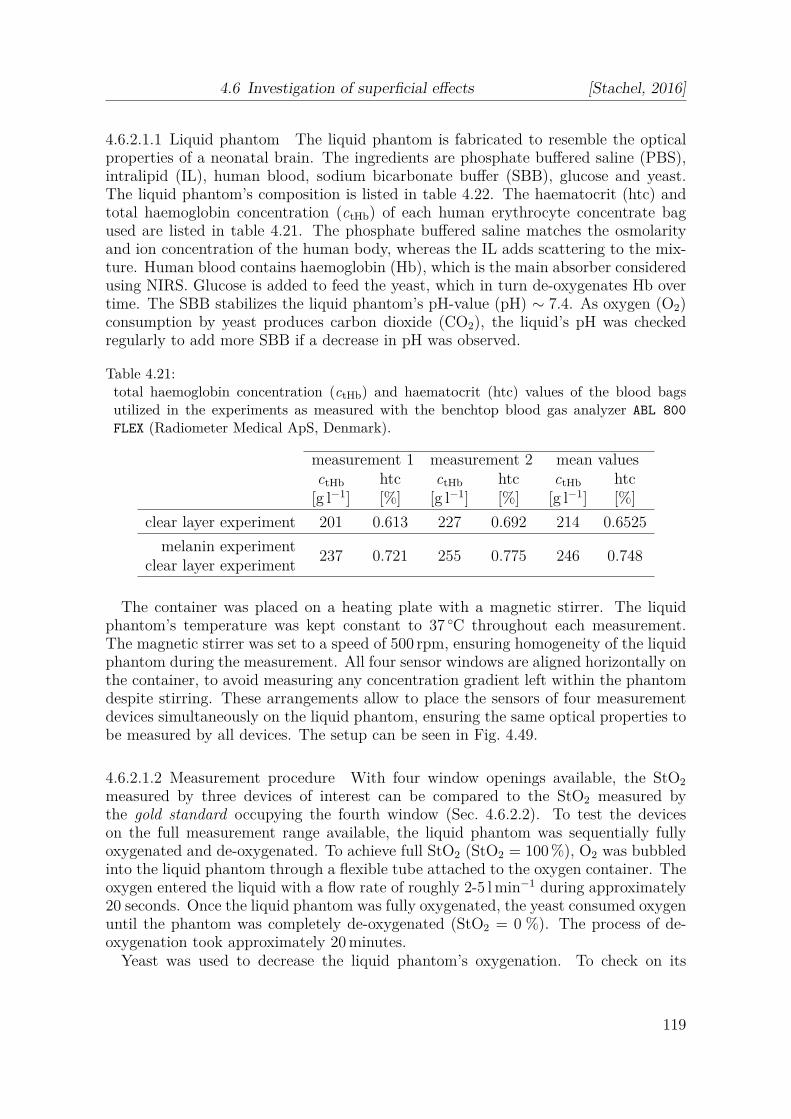
4.6 Investigation of superficial effects [Stachel, 2016]
4.6.2.1.1 Liquid phantom The liquid phantom is fabricated to resemble the opticalproperties of a neonatal brain. The ingredients are phosphate buffered saline (PBS),intralipid (IL), human blood, sodium bicarbonate buffer (SBB), glucose and yeast.The liquid phantom’s composition is listed in table 4.22. The haematocrit (htc) andtotal haemoglobin concentration (ctHb) of each human erythrocyte concentrate bagused are listed in table 4.21. The phosphate buffered saline matches the osmolarityand ion concentration of the human body, whereas the IL adds scattering to the mix-ture. Human blood contains haemoglobin (Hb), which is the main absorber consideredusing NIRS. Glucose is added to feed the yeast, which in turn de-oxygenates Hb overtime. The SBB stabilizes the liquid phantom’s pH-value (pH) ∼ 7.4. As oxygen (O2)consumption by yeast produces carbon dioxide (CO2), the liquid’s pH was checkedregularly to add more SBB if a decrease in pH was observed.
Table 4.21:total haemoglobin concentration (ctHb) and haematocrit (htc) values of the blood bagsutilized in the experiments as measured with the benchtop blood gas analyzer ABL 800
FLEX (Radiometer Medical ApS, Denmark).
measurement 1 measurement 2 mean valuesctHb htc ctHb htc ctHb htc
[g l−1] [%] [g l−1] [%] [g l−1] [%]
clear layer experiment 201 0.613 227 0.692 214 0.6525
melanin experiment237 0.721 255 0.775 246 0.748
clear layer experiment
The container was placed on a heating plate with a magnetic stirrer. The liquidphantom’s temperature was kept constant to 37 ◦C throughout each measurement.The magnetic stirrer was set to a speed of 500 rpm, ensuring homogeneity of the liquidphantom during the measurement. All four sensor windows are aligned horizontally onthe container, to avoid measuring any concentration gradient left within the phantomdespite stirring. These arrangements allow to place the sensors of four measurementdevices simultaneously on the liquid phantom, ensuring the same optical properties tobe measured by all devices. The setup can be seen in Fig. 4.49.
4.6.2.1.2 Measurement procedure With four window openings available, the StO2
measured by three devices of interest can be compared to the StO2 measured bythe gold standard occupying the fourth window (Sec. 4.6.2.2). To test the deviceson the full measurement range available, the liquid phantom was sequentially fullyoxygenated and de-oxygenated. To achieve full StO2 (StO2 = 100 %), O2 was bubbledinto the liquid phantom through a flexible tube attached to the oxygen container. Theoxygen entered the liquid with a flow rate of roughly 2-5 l min−1 during approximately20 seconds. Once the liquid phantom was fully oxygenated, the yeast consumed oxygenuntil the phantom was completely de-oxygenated (StO2 = 0 %). The process of de-oxygenation took approximately 20 minutes.
Yeast was used to decrease the liquid phantom’s oxygenation. To check on its
119

4 Phantom set-up for quantitative oximeter comparison
Table 4.22:List of ingredients for one phantom. Once mixed, the optical properties of such a liquidphantom are stable for several hours.
ingredient amount details
phosphate buffered saline(PBS)
2500 ml The salt solution was bought from the Kan-tonsapotheke Zurich, Switzerland and con-tained 8 g of sodium chloride, 0.2 g potas-sium chloride, 1.435 g di-sodium hydrogenphosphate and 0.2 g potassium hydrogenphosphate.
intralipid (IL) 74 ml IL 20 % solution (Fresenius Kabi AG, BadHomburg, Germany)
human blood 34 ml Expired human erythrocyte concentratebags from the blood bank. The expirationdate is not longer ago than 2 months attime of measurement.
sodium bicarbonatebuffer (SBB) 8.4%
20 ml Manufactured by B. Braun Medical AG,Sempach, Switzerland.
glucose 50 % solution 3 ml AlleMan Pharma GmbH, Reutlingen, Ger-many
fresh baker’s yeast 3 g ALDI SUISSE AG
120

4.6 Investigation of superficial effects [Stachel, 2016]
optical properties, spectrophotometric measurements were performed with an UV-Vis-NIR spectrophotometer (UV1610, Shimadzu Corporation, Kyoto, Japan) showingno relevant absorption or scattering characteristics in the wavelength region of inter-est (Fig. 4.48). It is important to know these features to avoid introducing strongadditional absorbers not considered by the tissue oximeters.
(a)Absorption spectrum of fresh yeast
(b)Scattering spectrum of fresh yeast
Figure 4.48:Undiluted fresh yeast was measured with an UV-Vis-NIR spectrophotometer (UV1610,Shimadzu Corporation, Kyoto, Japan) and analyzed with the inverse adding doubling (IAD,http://omlc.org/software/iad/, [Prahl, 2011]) program. The absorption µa shows nostriking features in the region of interest (marked grey). Fresh yeast shows high scatteringvalues. However, the dilution with 2500 ml of saline reduced the absorption and scatteringof yeast to a negligible amount when compared to the liquid phantom’s other ingredients(table 4.22).
121

4 Phantom set-up for quantitative oximeter comparison
(a)Liquid phantom container with pH-meter, temperature sensor and a tube(O2 supply) attached.
(b)3 measurement devices, from left to right:Foresight, Nonin (was not used in these com-parisons) and OxiplexTS. The liquid phan-tom container is positioned behind the Oxi-plexTS.
Figure 4.49:Measurement setup with the liquid phantom container shown in the picture on the left.The measurement devices attached to the liquid phantom container are positioned on atable in front of the container.
4.6.2.2 Choice of devices
Three tissue oximeters commercially available were chosen to be tested, as they areoften deployed in clinics. All devices were equipped with pediatric sensors.
1. Foresight Elite, tissue oximeter from CAS Medical Systems, Inc. (CASMED),Branford USA. The Foresight system is provided with five wavelengths. Thesmall sensor makes use of two source-detector separation (SDS).
2. NIRO-200NX, tissue oximeter from Hamamatsu Photonics K.K., Japan. TheNIRO-200NX makes use of three wavelengths (735 nm, 810 nm and 850 nm).The small sensor used has two SDS.
3. INVOS 5100C, tissue oximeter from Medtronic, Minneapolis, USA. The INVOSmakes use of two wavelengths (730 nm and 810 nm). The Oxyalert NeonatalNIRSensor was used, having two detectors at a SDS of 30 mm and 40 mm.
The gold standard these devices are compared to is the OxiplexTS (ISS, Champaign,Illinois USA) with a rigid sensor exploiting four SDS (25 cm, 30 cm, 35 cm and 40 cm).This oximeter works with two modulated light sources (692 nm and 834 nm) deliveringabsolute tissue absorption and reduced scattering values. In contrast to other tissueoximeters, this device is not approved for clinical use, but has a CE mark for researchpurposes. This device is considered to be the gold standard as it is the only devicedelivering raw data and absolute measurement values. Raw data was analyzed withMatlab scripts (MATLAB and Statistics Toolbox Release 2016a, The MathWorks,Inc., Natick, Massachusetts, United States.) written by group members of the BORLgroup.
122

4.6 Investigation of superficial effects [Stachel, 2016]
4.6.2.3 Clear layer experiment
To simulate the effect of a clear layer on a NIRS measurement, three different settingswere prepared. On top of the basic setup, the windows were manipulated as follows:
1. A sandwich foil (Toppits, Cofresco Frischhalteprodukte GmbH & Co. KG,Nordrhein-Westfalen, Germany) was added on top of the sensor before the sen-sor was clamped upon the (bone) window (Fig. 4.50a). The sandwich foil had athickness of 0.05 mm.
2. A thin layer of ultrasound couplant gel (Parker Laboratories, Inc., Fairfield USA)was evenly distributed on the sensor before the sensor was clamped against thewindow (Fig. 4.50b).
3. A thick layer of ultrasound couplant gel was distributed across the sensor beforeattaching it on the window (Fig. 4.50c).
→ Excess couplant gel was squeezed out underneath the sensor, leaving only a thinlayer. The exact thickness of the couplant gel layer was not determinable.
In each of those scenarios, all manipulations were performed on all three sensors tobe tested simultaneously in the same manner. The only sensor not to be manipulatedwas the OxiplexTS’ rigid sensor. After a full oxygenation cycle per measurement,the sensors were removed from the windows and prepared for the next measurement.This series of measurements contained three measurements with manipulations andtwo baseline measurements, one performed before the manipulations and one after themanipulations.
When preparing the liquid phantom for this series of measurements, a first cy-cle of oxygenation and de-oxygenation was performed before the baseline measure-ment by bubbling nitrogen (N2) instead of adding yeast to the phantom. Bub-bling nitrogen is the other option available to reversibly de-oxygenate a liquid phan-tom [Kleiser et al., 2016b]. This process proved to be very slow, lasting over 2.5 h.Subsequently, 3 g of yeast were added to the phantom, initiating the first baselinemeasurement with a liquid phantom as described in table 4.22.
4.6.2.4 Melanin experiment
NIRS algorithms of the devices tested employ at least two measurements at differentSDS, where the signal measured at both SDS is affected by superficial layers. Thesignal from the shorter SDS contains more information about the superficial layer,whereas the signal with larger SDS contains more in-depth information. This knowl-edge can be implemented in data analysis to lower the influence of superficial layerson the measured StO2 of the underlying tissue [Saager and Berger, 2005]. With suchtechniques, the influence of a homogeneous melanin layer in superficial tissue can bereduced as long as the light intensity is not weakened too much. However, if this layerwas inhomogeneous, the superficial layer would look different for the two SDS and thisalgorithm would not be able to cancel the effect of melanin completely.
123

4 Phantom set-up for quantitative oximeter comparison
(a)A sandwich foil of thick-ness 0.05 mm covers thesensor.
(b)Ultrasound Couplant layerafter the measurement.
(c)Detector coated with athick layer of ultrasoundcouplant before the mea-surement.
Figure 4.50:To investigate light piping, each device was measured five times on the same liquid phantom.The first and the last measurements were baseline measurements with the bare sensorson the bare windows. Apart from the baseline, each measurement was performed withaccessories mimicking light piping on all pediatric sensors. The only NIRS device not beingmanipulated was the OxiplexTS.
The aim is to investigate the measurement error created by a little hair or a darkskin spot underneath one detector. Consequently, asymmetric coverage of the sen-sor was applied in this series of measurements to test the NIRS devices. As Fore-sight, NIRO-200NX and INVOS operate two detectors, but only one spot with (mul-tiple) light sources, covering the light sources would deliver a symmetric signal distor-tion (Fig. 4.51). To achieve asymmetric signal distortion, the detectors were coveredby turns with an extra layer of absorbing material.
To mimic absorption of melanin, 247 color filters (LEE filters, Hampshire UK) weremeasured with a spectrophotometer (Maya200Pro, OceanOptics, Inc., Dunedin FLUSA) in transmittance mode. The filters’ transmittance was compared to the melaninabsorption spectrum published in [Jacques and McAuliffe, 1991], [Jacques, 2013]
µa,melanosome = 519[
cm−1]
·(500 nm
λ
)3.5
= 519 · 5003.5 ·(
1λ(nm)
)3.5[
cm−1]
≈ 1.7 · 1012 ·(
1λ(nm)
)3.5[
cm−1]
.
The filters transmittance spectrum was transformed to an absorption spectrum as-suming the scattering to be negligible
− ln(T ) ≈ µa · d,
with d being the foil’s thickness. As the concentration of melanin in the human skin
124

4.6 Investigation of superficial effects [Stachel, 2016]
varies, it was of interest to find the color foil with an absorption as close to themelanin absorption as possible. The filter matching this trend best was 113 magenta,(Fig. 4.52). The transmittance spectrum of 113 magenta shown in Fig. 4.53 incorpo-rates a wave-like structure, showing an interference effect called thin-film interferenceor Fabry-Perot effect. This effect is undesirable, but does not have a significant neg-ative impact on the measurement, as the foil’s absorption still matches the melaninabsorption curve sufficiently. Furthermore, three foils were applied simultaneouslyper measurement and device, to reduce light intensity at least about 10 %. To holdthe foils in place, an adhesive was used (Klebestift 20 g, PaperCompetence, Forch-heim Germany). This adhesive added scattering, leading to a decrease in thin layerinterference and measured light intensity.
Four measurements were performed, starting and ending without applying any 113magenta foil to the detectors. These measurements are considered to be the baselinemeasurements. After the first baseline measurement, the sensors were removed fromthe liquid phantom container to attach the 113 magenta foil to the detector withsmaller SDS. After another measurement cycle, the sensors were again removed fromthe container to reposition the 113 magenta foil onto the detector with larger SDS.
(a)Three 113 magenta foils glued to-gether (Klebestift 20 g, PaperCompe-tence, Forchheim Germany)
(b)NIRO-200NX, outer detector is dimin-ished.
(c)INVOS, inner detector is diminished.
(d)Foresight, outer detector is diminished.
Figure 4.51:Asymmetric coverage of detectors with 113 magenta to mimic melanin absorption.
125
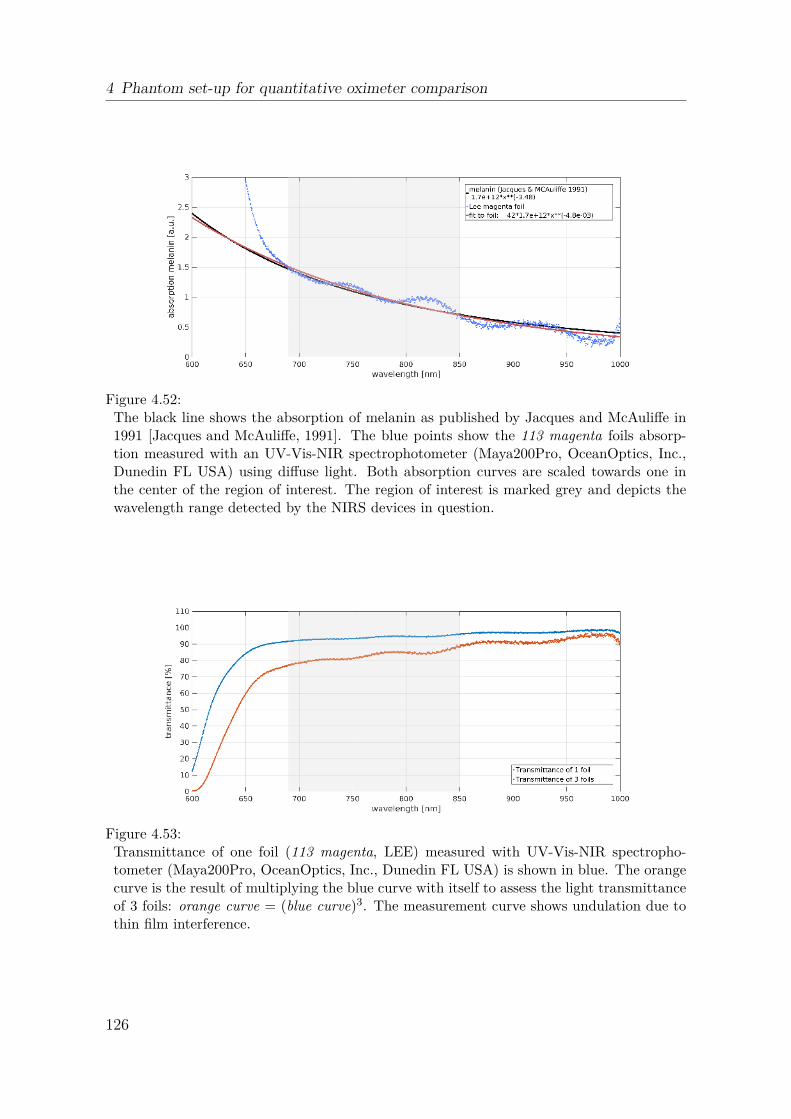
4 Phantom set-up for quantitative oximeter comparison
Figure 4.52:The black line shows the absorption of melanin as published by Jacques and McAuliffe in1991 [Jacques and McAuliffe, 1991]. The blue points show the 113 magenta foils absorp-tion measured with an UV-Vis-NIR spectrophotometer (Maya200Pro, OceanOptics, Inc.,Dunedin FL USA) using diffuse light. Both absorption curves are scaled towards one inthe center of the region of interest. The region of interest is marked grey and depicts thewavelength range detected by the NIRS devices in question.
Figure 4.53:Transmittance of one foil (113 magenta, LEE) measured with UV-Vis-NIR spectropho-tometer (Maya200Pro, OceanOptics, Inc., Dunedin FL USA) is shown in blue. The orangecurve is the result of multiplying the blue curve with itself to assess the light transmittanceof 3 foils: orange curve = (blue curve)3. The measurement curve shows undulation due tothin film interference.
126

4.6 Investigation of superficial effects [Stachel, 2016]
4.6.2.5 Cerebrospinal fluid (CSF) experiment
Figure 4.54:Illustration from [Fukui et al., 2003], demonstrating a Monte Carlo model of near infraredlight traveling through the neonatal head. The head was modeled with multiple layers. Es-pecially interesting for this work is the irregular shape of the brain, allowing a comparativelylarge fissure at the forehead to be filled with CSF.
The CSF layer has a comparatively large structural irregularity in the neonatal fore-head (Fig. 4.54). This irregularity is not accounted for when using NIRS oximeters.The aim is to test whether placing a NIRS oximeter horizontally or vertically over thisirregularity creates a significant error measuring StO2. Within a series of measure-ments, the placement of NIRS sensors right in front of this CSF irregularity is tested.Two windows with bone and CSF properties were manufactured for that purpose.Firstly, windows with bone properties as listed in table 4.20 were casted and left forcuring in the oven at 38 ◦C during approximately 20 min. Subsequently, the castingmold with incompletely cured silicone was removed from the oven. A lid was placedon top of the casting mold (see Fig. 4.55) with holes on top. Those holes served as aninlet for a new mixture of silicone mimicking CSF properties as listed in table 4.20.The lid’s form allowed the second layer of silicone to take the shape of a CSF layer asseen at the front-head of a 28 week old preterm infant. There is an evenly ≈ 2.4 mmthick layer with a centered bulge added to the original (bone) window. As the bonemimicking silicone was not completely cured before the CSF mimicking silicone waspoured onto it, the two layers of silicone bonded without blending. The resultingwindows can be seen in Fig. 4.56.
CSF itself shows practically no absorption or scattering in the near infrared range.It is a clear, translucent fluid. CSF fills the space between the arachnoid and piamatter, which is interspersed with arachnoid trabeculae. Eiji Okada and David T.Delpy simulated the optical properties of the CSF layer with Monte Carlo simulations
127

4 Phantom set-up for quantitative oximeter comparison
to match experimental values [Okada and Delpy, 2003], [Okada, 2013]. The resultingscattering and absorption values are listed in table 4.20.
Two windows with bone and CSF properties were casted. One window had thebulge placed vertically over the window, the other horizontally. Attaching these twodifferent windows to the liquid phantom container allowed to place the NIRS sensorsonto the window as if they were placed onto the forehead horizontally and verticallyans shown in Fig. 4.56e, 4.56f, respectively. In addition to the two CSF windows,two normal bone windows were attached to the liquid phantom container. The sensorfrom the OxiplexTS was left on the same bone window during all four measurementsof this measurement series. The other sensors were removed after each measurementcycle to be attached to the next window. Four cycles were performed, allowing tomeasure with each sensor the vertical CSF window, the horizontal CSF window andthe normal bone window. For each device, the first window was also the final windowas this measurement round was repeated at the end. The bone window represents thebaseline measurement.
4.6.3 Results
A series of measurements is shown in Fig. 4.57. StO2 measured by all four devices isplotted against the measurement time for the CSF experiment. As this experimentrequired the sensors of the devices Foresight, NIRO-200NX and INVOS to be reposi-tioned after every oxygenation cycle, the measurements were stopped for short timeintervals three times. The breaks in between the individual measurements are depictedred, whereas the intervention setting is represented by a grey shaded background of themeasurement cycle in question. As the measurement setting changed three times (twodifferent CSF windows and the baseline to cycle through), there are three differentshades of grey drawn. This figure shows some interesting features, for example is theOxiplexTS the only NIRS device capable of sampling through the full measurementrange (StO2 ∈ [0 %, 100 %]). Furthermore, there are differences visible between theindividual oxygenation cycles, as the devices’ measurement ranges change from onesetting to the next.
To assess the change in StO2 by the intervention added to the setup, scatter plotsare better than time series. Scatter plots allow to compare the StO2 values from allcycles to each other within a series of measurement, if correctly allocated to the goldstandard. For each measurement cycle, the StO2 measured by the OxiplexTS canbe assigned to the corresponding values measured by the other tissue oximeters. Asshown in Fig. 4.57, the oxygenation of the liquid phantom took place in a shortertime than deoxygenation. Consequently, allocation of StO2 from Foresight, NIRO-200NX and INVOS to the results from OxiplexTS is less error prone to the decreasein StO2. The scatter plots shown in Fig. 4.59, 4.60, 4.61 as well as Fig. 4.58 illustratethe StO2 measured by OxiplexTS on the x-axis and the allocated StO2 values fromForesight, NIRO-200NX and INVOS on the y-axis. For each oxygenation cycle, thevalues depicted in the scatter plots are from the decreasing slope measured with theOxiplexTS in the range
StOOxiplexTS2 ∈ [95%, . . . , 5%]
128

4.6 Investigation of superficial effects [Stachel, 2016]
(a)Side view onto the casting lid for the hor-izontal CSF phantom. The casting lidcontains holes allowing surplus siliconeto escape.
(b)Bottom view onto the casting lid. Thereis an opening in the center of the lid inthe shape of a central sulcus.
(c)This container is the original siliconemold to cast silicone windows that canbe attached to the liquid phantom con-tainer. As a modification, a new lid willbe used with this mold.
(d)Modified setup: casting lid (solid colors)with casting mold (semi-transparent col-ors). This enables to cast a second layerof silicone within the shape of a centralsulcus on top of a flat layer of silicone.
Figure 4.55:CAD design of silicone casting mold to create windows with a central sulcus added hori-zontally. The design was performed with NX 8-5 (Siemens Product Lifecycle ManagementSoftware Inc, Plano TX USA)
129
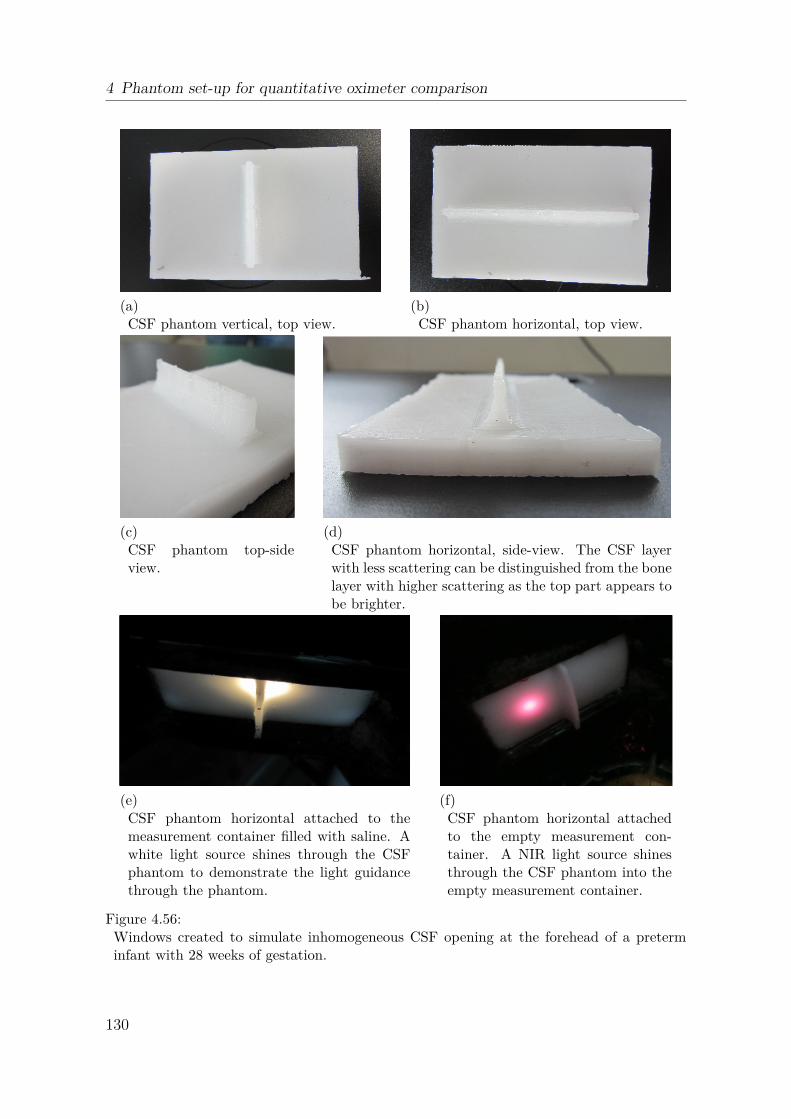
4 Phantom set-up for quantitative oximeter comparison
(a)CSF phantom vertical, top view.
(b)CSF phantom horizontal, top view.
(c)CSF phantom top-sideview.
(d)CSF phantom horizontal, side-view. The CSF layerwith less scattering can be distinguished from the bonelayer with higher scattering as the top part appears tobe brighter.
(e)CSF phantom horizontal attached to themeasurement container filled with saline. Awhite light source shines through the CSFphantom to demonstrate the light guidancethrough the phantom.
(f)CSF phantom horizontal attachedto the empty measurement con-tainer. A NIR light source shinesthrough the CSF phantom into theempty measurement container.
Figure 4.56:Windows created to simulate inhomogeneous CSF opening at the forehead of a preterminfant with 28 weeks of gestation.
130
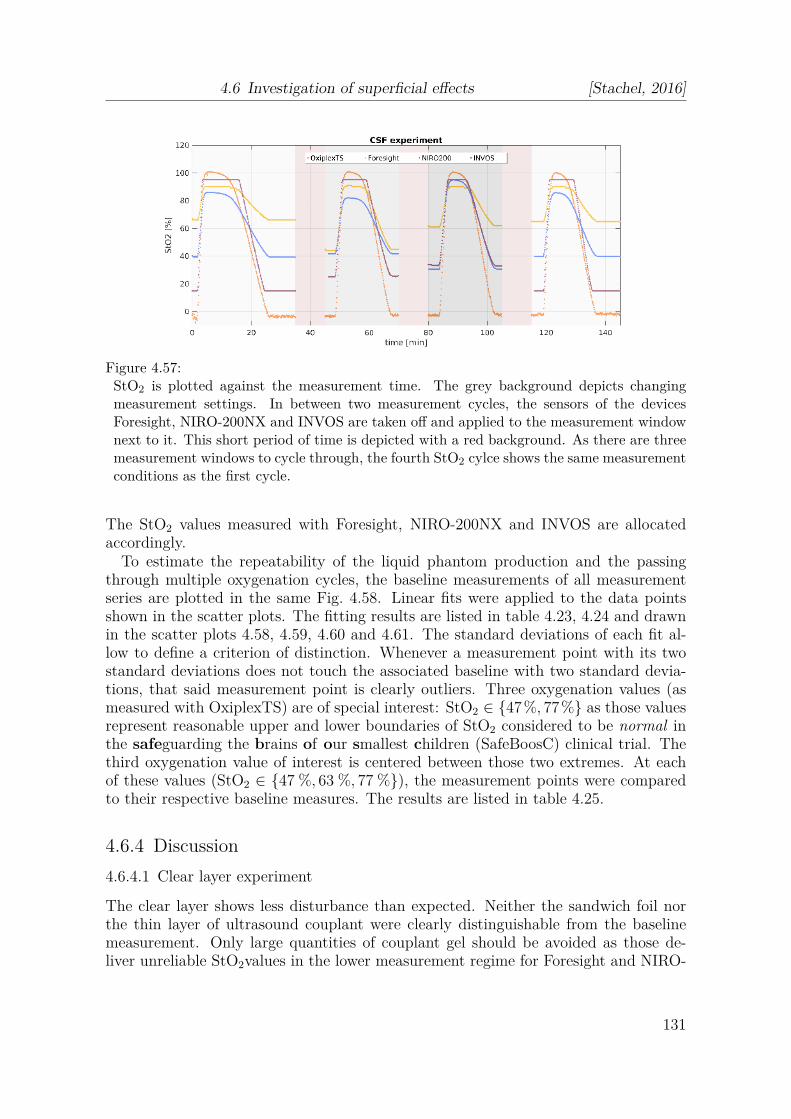
4.6 Investigation of superficial effects [Stachel, 2016]
Figure 4.57:StO2 is plotted against the measurement time. The grey background depicts changingmeasurement settings. In between two measurement cycles, the sensors of the devicesForesight, NIRO-200NX and INVOS are taken off and applied to the measurement windownext to it. This short period of time is depicted with a red background. As there are threemeasurement windows to cycle through, the fourth StO2 cylce shows the same measurementconditions as the first cycle.
The StO2 values measured with Foresight, NIRO-200NX and INVOS are allocatedaccordingly.
To estimate the repeatability of the liquid phantom production and the passingthrough multiple oxygenation cycles, the baseline measurements of all measurementseries are plotted in the same Fig. 4.58. Linear fits were applied to the data pointsshown in the scatter plots. The fitting results are listed in table 4.23, 4.24 and drawnin the scatter plots 4.58, 4.59, 4.60 and 4.61. The standard deviations of each fit al-low to define a criterion of distinction. Whenever a measurement point with its twostandard deviations does not touch the associated baseline with two standard devia-tions, that said measurement point is clearly outliers. Three oxygenation values (asmeasured with OxiplexTS) are of special interest: StO2 ∈ {47%, 77%} as those valuesrepresent reasonable upper and lower boundaries of StO2 considered to be normal inthe safeguarding the brains of our smallest children (SafeBoosC) clinical trial. Thethird oxygenation value of interest is centered between those two extremes. At eachof these values (StO2 ∈ {47 %, 63 %, 77 %}), the measurement points were comparedto their respective baseline measures. The results are listed in table 4.25.
4.6.4 Discussion
4.6.4.1 Clear layer experiment
The clear layer shows less disturbance than expected. Neither the sandwich foil northe thin layer of ultrasound couplant were clearly distinguishable from the baselinemeasurement. Only large quantities of couplant gel should be avoided as those de-liver unreliable StO2values in the lower measurement regime for Foresight and NIRO-
131
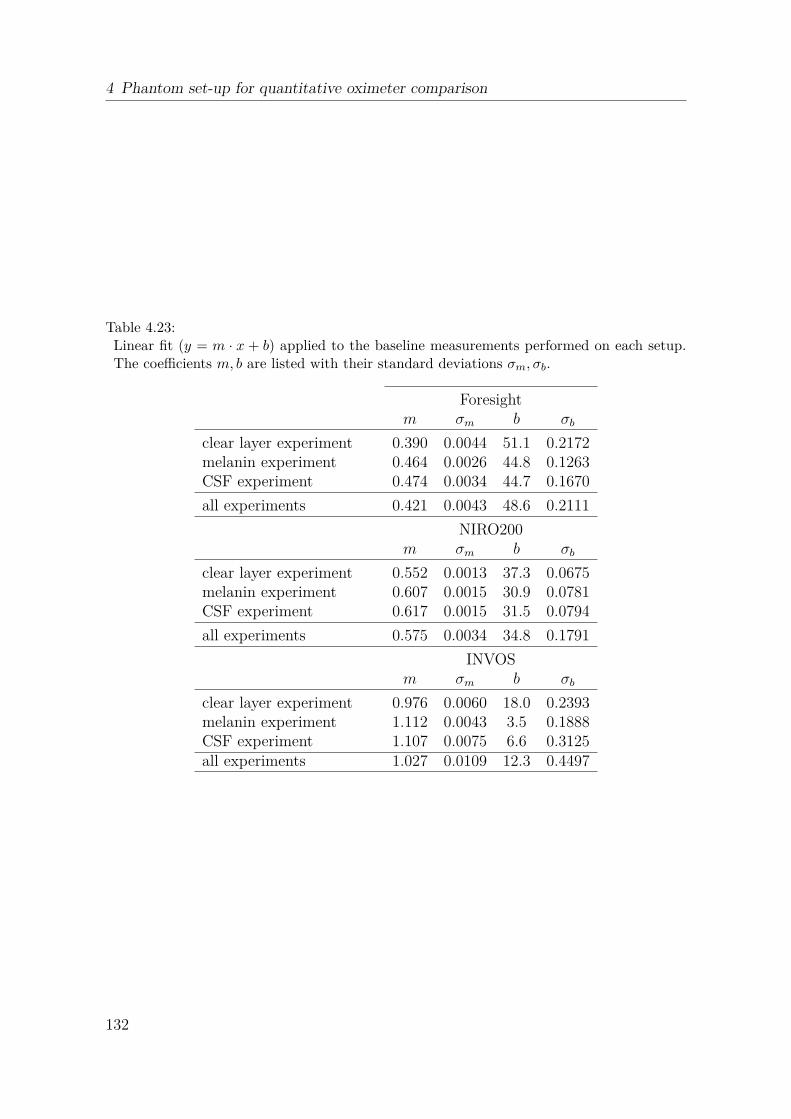
4 Phantom set-up for quantitative oximeter comparison
Table 4.23:Linear fit (y = m · x + b) applied to the baseline measurements performed on each setup.The coefficients m, b are listed with their standard deviations σm, σb.
Foresightm σm b σb
clear layer experiment 0.390 0.0044 51.1 0.2172melanin experiment 0.464 0.0026 44.8 0.1263CSF experiment 0.474 0.0034 44.7 0.1670
all experiments 0.421 0.0043 48.6 0.2111
NIRO200m σm b σb
clear layer experiment 0.552 0.0013 37.3 0.0675melanin experiment 0.607 0.0015 30.9 0.0781CSF experiment 0.617 0.0015 31.5 0.0794
all experiments 0.575 0.0034 34.8 0.1791
INVOSm σm b σb
clear layer experiment 0.976 0.0060 18.0 0.2393melanin experiment 1.112 0.0043 3.5 0.1888CSF experiment 1.107 0.0075 6.6 0.3125all experiments 1.027 0.0109 12.3 0.4497
132

4.6 Investigation of superficial effects [Stachel, 2016]
Table 4.24:Linear fit (y = m · x + b) applied to all measurements. The coefficients m, b are listed withtheir standard deviations σm, σb.
measurementForesight
m σm b σb
first baseline 0.390 0.0044 51.1 0.2172sandwich foil 0.378 0.0021 51.7 0.1063
ultrasonic couplant 0.368 0.0018 53.5 0.0904ultrasonic couplant thick 0.236 0.0019 65.6 0.0894
first baseline 0.464 0.0026 44.8 0.1263inner detector covered 0.570 0.0044 34.0 0.2258outer detector covered 0.433 0.0028 48.5 0.1309
bone window 0.474 0.0034 44.7 0.1670CSF vertical 0.298 0.0023 61.6 0.1060
CSF horizontal 0.259 0.0020 66.2 0.0819
measurementNIRO200
m σm b σb
first baseline 0.552 0.0013 37.3 0.0675sandwich foil 0.549 0.0012 36.9 0.0638
ultrasonic couplant 0.535 0.0013 38.0 0.0687ultrasonic couplant thick 0.366 0.0019 49.8 0.1188
first baseline 0.607 0.0015 30.9 0.0781inner detector covered 0.417 0.0017 30.7 0.1003outer detector covered 0.962 0.0029 35.0 0.0882
bone window 0.617 0.0015 31.5 0.0794CSF vertical 0.446 0.0017 39.7 0.1024
CSF horizontal 0.386 0.0019 41.7 0.1166
measurementINVOS
m σm b σb
first baseline 0.976 0.0060 18.0 0.2393sandwich foil 0.903 0.0030 21.9 0.1227
ultrasonic couplant 0.919 0.0030 20.4 0.1258ultrasonic couplant thick 0.748 0.0033 32.3 0.1367
first baseline 1.112 0.0043 3.5 0.1888inner detector covered 1.075 0.0072 -4.9 0.3801outer detector covered 1.113 0.0034 10.3 0.1272
bone window 1.107 0.0075 6.6 0.3125CSF vertical 0.756 0.0045 25.2 0.2095
CSF horizontal 0.617 0.0043 32.3 0.2167
133

4 Phantom set-up for quantitative oximeter comparison
Figure 4.58:The baseline measurements for all devices and measurement series are shown. For everydevice, a linear fit is applied to all baseline measurements performed with it.
Table 4.25:The X marks outliers. The Xon the other hand marks measurement values that cannot be clearly distinguished from the measurements baseline. The points of interest areStOOxiplexTS
2 = 47 %, 63 % and 77 % measured with the OxiplexTS.
measurementForesight NIRO200 INVOS
47% 63% 77% 47% 63% 77% 47% 63% 77%
sandwich foil X X X X X X X X X
ultrasonic couplant X X X X X X X X X
ultrasonic couplant thick X X X X X X X X X
inner detector covered X X X X X X X X X
outer detector covered X X X X X X X X X
CSF vertical X X X X X X X X X
CSF horizontal X X X X X X X X X
134

4.6 Investigation of superficial effects [Stachel, 2016]
Figure 4.59:Scatter plots from all measurements performed with Foresight. The baseline measure-ments are shown in green, all measurements are listed in chronological order. A linearfit was performed onto every scattering plot, considering the datapoints within the greymarked region. Every linear fit is drawn with two standard deviations surrounding it.
135

4 Phantom set-up for quantitative oximeter comparison
Figure 4.60:Scatter plots from all measurements performed with NIRO-200NX. The baseline mea-surements are shown in green, all measurements are listed in chronological order. A linearfit was performed onto every scattering plot, considering the datapoints within the greymarked region. Every linear fit is drawn with two standard deviations surrounding it.
136

4.6 Investigation of superficial effects [Stachel, 2016]
Figure 4.61:Scatter plots from all measurements performed with INVOS. The baseline measurementsare shown in green, all measurements are listed in chronological order. A linear fit wasperformed onto every scattering plot, considering the datapoints within the grey markedregion. Every linear fit is drawn with two standard deviation (SD) surrounding it.
137

4 Phantom set-up for quantitative oximeter comparison
200NX. As the ultrasound couplant gel was applied onto the sensors before they wereclamped against the windows, most gel was pressed away, leaving only a thin layer.The thickness of the gel layer left underneath the sensor during measurement couldnot be determined.
The baseline measurement for the clear layer experiment shows a shift when com-pared to the melanin and CSF experiment. This may be due to the oxygenation cyclethat preceded the first baseline measurement. The de-oxygenation of the liquid phan-tom was achieved through nitrogen (N2) bubbling and took about 2 h instead of theusual ≈ 20 minutes. The IL used to adjust the liquid phantom’s scattering proper-ties is known to be stable for several hours. Afterwards, the scattering diminishesslowly. Over the course of this measurement series, the scattering diminished fromµ
′
s(834 nm) = 6.5 cm−1 to 3.7 cm−1. The reduction in scattering could be due to itsnormal deterioration within the liquid phantom or a mechanical effect to the precedingbubbling with N2. Another reason for a different baseline behavior could be the usageof another blood bag (table 4.21). The liquid phantom for the clear layer experimentwas prepared with a different blood sample than the other two experiments.Although the baseline from the clear layer experiment deviates from the baselines of theother experiments, the data within this series of measurement is conclusive (Fig. 4.58-4.61).
4.6.4.2 Melanin experiment
The 113 magenta foil has a distinguishable impact on all measurement devices. Fore-sight handles the additional decrease in light intensity better than the other clinicaldevices do. Nevertheless, even Foresight has difficulties when the detector with shorterSDS is diminished.
The number of foils used to manipulate the light entering the detector was chosento reduce the light intensity by roughly 10 % − 20 %. The NIRS devices still measuredenough light to not recognize the impaired measurement situation. Although the lightdiminished with respect to wavelength as if the absorber was melanin (Fig. 4.52), theabsolute change in absorption does not match the one a NIRS sensor will see whenplaced on top of hair or dark skin spots. As different skin spots as well as hair typescontain different concentrations of melanin, the problematic absorption introduced byit could only be approximated roughly. This effect will be patient dependent.
4.6.4.3 Cerebrospinal fluid experiment
The experiment shows significant deviations from the baseline measurements for bothCSF windows (vertical and horizontal). INVOS is the only device to show a range ofoxygen saturation values being comparable to the baseline measurement. But even forINVOS, the major part of its StO2slope as shown in Fig. 4.61 is significantly differentfrom the baseline. Even more eye-catching is the difference between the two CSFmeasurements themselves. For all devices, the placement of the NIRS sensor on thevertical CSF window shows StO2values closer to the baseline than placement on thehorizontal CSF window does.
138

4.6 Investigation of superficial effects [Stachel, 2016]
The baseline measurement was performed on the normal, bare bone window. Thismeans that the significant differences found in table 4.25 demonstrate the differencebetween a measurement on a two layer structure (bone and brain tissue) and a threelayer structure (bone, CSF and brain tissue) with an inhomogeneity being incorporatedinto the middle structure. It would be interesting to compare a homogeneous threelayer structure to the three layer structure presented in this work (Fig. 4.56). The cor-rect window for such a baseline measurement would not only contain an homogeneousbone layer, but also a homogeneous CSF layer added on top of it.
4.6.5 Conclusion
For the usage of NIRS oximeters in clinical routine, this work demonstrates that nospecial measures have to be taken to avoid thin layers of sweat or oil on the patientsskin to apply NIRS sensors. However, thick layers of light piping material (such asultrasound couplant gel) should be removed. Hair and skin marks have to be avoidedfor correct NIRS sensor placement when they are not homogeneously distributed un-derneath the sensor. Applying NIRS to the forehead of a preterm infant is problematicif the sensor crosses the forehead’s center (with the underlying medial longitudinal fis-sure), either vertically or horizontally. Applying the sensor on the side of the head isadvisable in such cases.
4.6.6 Outlook
It would be of interest to repeat the measurements described in this thesis with otherNIRS devices. Concerning the clear layer experiment, multiple windows with differ-ent and clearly defined thicknesses could be measured to assess a critical clear layerthickness.
The CSF inhomogeneity studied in this thesis was drawn from brain scans of apreterm infant with 28 weeks of gestational age. Future research could include dif-ferent inhomogeneities to be studied, ranging from the term neonate to the geriatrichuman brain. If further effort is spent on the CSF inhomogeneity, it is advisable tomanufacture the windows for baseline measurements with an additional CSF layeradded on top of the bone layer.
Acknowledgements
Sincere thanks go to Stefan Kleiser, who supervised this project with great patience,care and involvement. Despite long days of measurement and preparation, he wasalways kind, good-humored and very professional. I thank Prof. Dr. Martin Wolf forhis encouragement and insight into the problems NIRS faces in the clinical routine.His profound knowledge was a steady guidance through this project. Special thanksto the whole BORL team, whereof I am proud to work with. Last but not least,many thanks go to Urs Isler and Nadine Engbersen for proof-reading and constructiveconversations.
139

4 Phantom set-up for quantitative oximeter comparison
4.7 Summary on phantom experiments
To cope with the issue of comparability of values obtained from different oximetersand sensors, we performed a series of in vitro experiments. We employed liquidphantoms containing human blood and IL which resembled optical properties of theneonatal head. We were the first to show that different NIRS oximeters obtain dif-ferent StO2 readings in simultaneous measurements on the same phantom (Sec. 2.2,[Hyttel-Sorensen et al., 2013b]). In a second experiment, we included a frequency do-main (FD) oximeter which was capable of differentiating between the effects of absorp-tion and scattering (Sec. 2.3, [Kleiser et al., 2016a]). Compared to the FD oximeter asreference, the investigated continuous-wave (CW) NIRS oximeters showed marginallychanged sensitivity to oxygenation changes upon altered µ
′
s, whereas they producedclearly different results when ctHb was increased.
Learning from these two experiments and their experimental shortcomings, we de-veloped and constructed an improved set-up which allows for comparison of absoluteStO2 readings (Chap. 4). The set-up consists of two layers, a static superficial layer(window) and the liquid phantom simulating the tissue of interest. Thus the real sit-uation for NIRS oximetry is modeled more precisely. We found a small but negligiblevertical oxygen partial pressure (pO2) gradient in the set-up and also did not see arelevant effect of yeast addition on StO2 readings. The phantom set-up presented inthis Chap.4 is a versatile tool for comparison of NIRS oximeters and investigation ofa variety of effects on StO2 readings.
We used this phantom set-up in a study comparing cerebral NIRS oximeters onan absolute scale with thin (2.5 mm) windows resembling optical properties similarto those of the skull (Sec. 4.3, [Kleiser et al., 2016b]). We compiled a conversiontable which solves the issue of incomparability of StO2 recorded by different NIRSoximeters and sensors. We additionally derived the hypoxic and hyperoxic thresholdsneeded for a large scale continuation of the SafeBoosC study which is likely to includea variety of NIRS oximeters. We performed measurements at three different ctHb levelsto take into account the variability within the neonatal population. We observed astrong influence of variations in ctHb on StO2 readings for all commercial CW NIRSoximeters. In contrast, our OxyPrem v1.3 was almost immune to this effect, whichcauses substantial uncertainty in estimation of the true StO2 and systematically affectsclinical decisions based on thresholds.
We extended this study by more commercial NIRS oximeters and repeated mea-surements with two oximeters already included in [Kleiser et al., 2016b] (Sec. 4.4).We provided an extended conversion table including the most common NIRS oxime-ters. Repeated sensor mounting caused minor variation in StO2 readings (< 3%). Therepeated determination of SafeBoosC action thresholds agreed well (≤ 2 % difference)with results of Sec. 4.3 [Kleiser et al., 2016b].
The phantom set-up was further employed in a study investigating the effect of adi-pose tissue thickness (ATT) on determination of muscle StO2. We applied superficiallayers of different thickness, simulating the optical properties of adipose tissue in vivo.The study investigated the sensitivity of StO2 readings compared to the extrapolatedsituation without the superficial layer. In this experiment including three commercialoximeters with adult sensors and OxyPrem v1.3, we found the sensitivity of all oxime-
140

4.7 Summary on phantom experiments
ters to be only marginally influenced by thin windows. This is an important findingfor the experiments in Sec. 4.3 and 4.4 because otherwise absolute comparisons wouldhave been hampered. All oximeters retained > 50 % of their initial sensitivity atATT = 9 mm, but were only marginally sensitive at ATT = 16 mm.
We further used the phantom set-up to investigate errors introduced by typicalhandling imperfections to StO2 readings of NIRS oximeters. We did not observe aneffect of thin superficial clear layers such as oil on the skin of neonates, but foundaltered readings for thicker layers which must consequently be avoided. For sensorshaving a non-symmetric arrangement of light sources and detectors, we found a strongeffect of the sensor being partially covered by thin foils which resembled the absorp-tion spectrum of melanin, the most dominant absorber in hair and birth marks. Weconsequently ask NIRS users to avoid placement of these sensors on superficially inho-mogeneous locations. We expect sensors with symmetric arrangement of light sourcesand detectors and self-calibrating algorithm such as OxyPrem v1.3 to be immune tothis effect.
141


5 Conclusions and outlook
5.1 Conclusions
Two of the most criticized aspects of cerebral near-infrared spectroscopy (NIRS) oxime-try in neonates are insufficient precision and lack of comparability of tissue oxygenhaemoglobin saturation (StO2) values obtained from different oximeters and sensors.This thesis provided solutions for both issues: A novel instrument, OxyPrem, was pre-sented in two versions alongside with a validation of precision. Comparability betweenNIRS oximeters was achieved by development of a 2-layer phantom set-up and a seriesof experiments.
To solve the issue of precision, we have developed the OxyPrem oximeter, based ona symmetric geometry and a self-calibrating algorithm. OxyPrem v1.2 was designedwith minimized source-detector separation (SDS) to decrease sensor outline (Chap. 2).Two independent self-calibrating regions were formed by light sources and detectorsbeing arranged in a hexagonal shape. On the forearm of healthy adults we obtainedone of the best within-subject standard deviation (Sw) ever reported, but it did notperform as well as we expected in neonates. We associate this with its sheet-likesensor, making it impossible to place the sensor on the tiny and strongly curved headof neonates in its entirety.
This problem was resolved by a successor version of the device, OxyPrem v1.3(Chap. 3) in which we arranged all light sources and detectors on a line, easing ap-plication on tiny spheres such as the head of newborn children. An in vivo study inpreterm neonates comprising of repeated sensor placement on the forehead revealed Sw
of 2.8 %, achieving the precision requirements expressed by neonatologists. The studyfurther showed that physiological changes in StO2 have strong influence on Sw whichmeans that precision of the instrument is better than this number. An additionalanalysis including only physiologically stable subjects revealed that precision of theinstrument is < 1.9 % which is likely still an overestimation. Thus, for a reasonableestimation of device-related Sw, physiology has to be monitored and quality criteriahave to be introduced. Sw of 1.9 % for cerebral measurements in preterm neonatesis one of the best repeatabilities ever reported. OxyPrem v1.3 clearly outperformscommercial cerebral oximeters available today, and solves the issue of poor precisionin NIRS oximetry.
Comparability between different oximeters and sensors was achieved by in vitrophantom experiments (Chap.4). Simultaneous recordings with different NIRS oxime-ters and sensors showed distinct differences between these, enabled creation of atransformation table and determination of device specific action thresholds for thesafeguarding the brains of our smallest children (SafeBoosC) study. The experi-ment further revealed a strong dependence of StO2 reported by all investigated instru-
143

5 Conclusions and outlook
ments on total haemoglobin concentration (ctHb), which means that readings of NIRSoximeters are subject to even larger measurement uncertainty than previously known.However, with OxyPrem v1.3 the problem is virtually inexistant.
Additional phantom experiments identify clear layers as uncritical as long as theyare very thin, whereas they severely alter StO2 readings as they become thicker. Thusclear substances should be wiped away before placement of NIRS sensors. Basedour findings we further recommend to not place NIRS sensors on top of the centralfissure and other locations known for comprising a thick layer of cerebro spinal fluid(CSF). Partial placement of sensors on hair or birth marks falsify StO2 readings of thecommercial instruments we investigated. Sensors with symmetry and self-calibratingalgorithm such as OxyPrem, on the other hand, are by principle immune to this effect.
Another phantom experiment showed that OxyPrem is as suited for measurementsin presence of thick superficial layers as commonly used NIRS oximeters with adultsensors. This demonstrates that OxyPrem v1.3 can provide StO2 readings in olderchildren or adults as well, underlining its versatility.
5.2 Outlook
Validation of OxyPrem v1.3 showed that its performance is superior to commerciallyavailable near-infrared spectroscopy (NIRS) oximeters in several aspects. Practicalexperience obtained in the in vivo study in a neonatal intensive care unit (NICU)setting showed that the instrument is a robust tool and that it is ready for translationinto clinical practice. Nevertheless, we are aware that the instrument is still a prototypewhich can be improved to meet all needs in clinical application. In consequence, morecomprehensive studies with the instrument are to be conducted as a logical next stepin the pre-commercial development.
In an interative process, user feedback will allow for enhancing important aspectsrelated to daily clinical practice. In a first step, thorough investigation of hygieneissues and ease-of-use will provide us with deeper insight to the risks associated withthe instrument and its use. This will lead to improvements such as easier operation andhandling of the instrument and implementation of an appealing, easily understandablegraphical user interface. Both aspects will facilitate safe operation of the instrumentwith good user experience.
Although the primary target group of OxyPrem v1.3 are neonates, we showed thatit performs similar, if not even slightly better in terms of sensitivity to deeper tis-sue than two of the most commonly used NIRS oximeters with adult sensors. Hence,OxyPrem v1.3 can also be applied in other patient groups such as children, adolescentsand adults. For clinicians treating a very heterogeneous patient collective, the instru-ment is a superb alternative because they need only one type of sensor. Thus theyobtain comparable tissue oxygen haemoglobin saturation (StO2) readings, in contrastto the currently most widespread oximeters, which provide different values dependingon the type of sensor.
Beside intensive care, other fields of application for OxyPrem v1.3 seem promising.With its wireless interface, the instrument may be used for muscle StO2 determina-tion in sports, rehabilitation and treatment of obesity. Determination of the hypoxic
144

5.2 Outlook
threshold in muscles may enable exact dosing of exercise to achieve optimal trainingeffect or fat burning. For patients suffering from sleep apnea, measurements withOxyPrem v1.3 in their own bed at home might be a first step before going to a sleeplaboratory, increasing patient conveniece and saving cost at the same time.
Furthermore, it seems feasible to implement measurement of several additional phys-iological parameters into the same sensor. Besides StO2, also peripheral arterial oxygenhaemoglobin saturation (SpO2), fractional tissue oxygen extraction (FTOE) and pulserate, which are all in principle extractable from the NIRS signals, electrical activityin the brain or blood flow may be assessed. Depending on the need of clinicians, ad-ditional chromophores of interest such as cytochrome oxidase could be determined infuture versions of the instrument. Combined reading of several parameters and theircorrelations over time might provide a completely new, multi-dimensional source ofinformation about the health status of a subject which would remain disclosed to thehuman eye otherwise because of its complexity. The result could be systems assistingclinicians in decision making to provide optimal care to their patients.
The phantom experiment presented in Sec. 4.3 [Kleiser et al., 2016b] drew atten-tion of several members of the ’ISO/TC 121/SC 3 - NWIP cerebral tissue oximeters’committee and a common experiment was conducted. This shows the great interestin these studies and the impact on medical device industry. Phantom measurementscan in principle replace in vivo calibration performed by some manufacturers, an inva-sive and risky procedure of limited validity. For phantom measurements replacing invivo calibration completely, the issue of an independently determined reference oxy-gen haemoglobin saturation (SO2) should be more thoroughly validated. This canbe achieved for example by further work on OxyVLS, a visible-light spectroscopy(VLS) based sensor or in development of more sophisticated measurement set-ups andschemes for calculation of SO2 from oxygen partial pressure (pO2).
The phantom experiments presented in this thesis can, slightly altered, also be per-formed to investigate other phenomena associated with NIRS oximeters. The effect ofabsorbers which could possibly confound StO2 readings in vivo, could be systemati-cally investigated by either adding them to the liquid phantom or to the windows. Asshown in Sec. 4.6, the windows do not necessarily have to consist of a single, flat layerbut may consist of several layers with arbitrary shapes. Modern rapid prototypingtechnology might in the future allow for combination of the macroscopic liquid phan-tom with micro-fluidic channels resembling vasculature in tissue. These modificationscan serve to either model the typical situation in cerebral measurements more pre-cisely or to investigate the effect of several suboptimal measurement situations morethoroughly and feed this into application guidelines.
145


Bibliography
[Arri et al., 2011] Arri, S. J., Muehlemann, T., Biallas, M., Bucher, H. U., and Wolf,M. (2011). Precision of cerebral oxygenation and hemoglobin concentration measure-ments in neonates measured by near-infrared spectroscopy. Journal of BiomedicalOptics, 16(4):047005.
[Ayers et al., 2008] Ayers, F., Grant, A., Kuo, D., Cuccia, D. J., and Durkin, A. J.(2008). Fabrication and characterization of silicone-based tissue phantoms withtunable optical properties in the visible and near infrared domain. In Nordstrom,R. J., editor, Proc. SPIE 6870, Design and Performance Validation of PhantomsUsed in Conjunction with Optical Measurements of Tissue, San Jose, CA.
[Balaban et al., 2013] Balaban, D. Y., Duffin, J., Preiss, D., Mardimae, A., Vesely, A.,Slessarev, M., Zubieta-Calleja, G. R., Greene, E. R., Macleod, D. B., and Fisher,J. A. (2013). The in-vivo oxyhaemoglobin dissociation curve at sea level and highaltitude. Respiratory physiology & neurobiology, 186:45–52.
[Bauer et al., 2004] Bauer, T. A., Brass, E. P., and Hiatt, W. R. (2004). Impairedmuscle oxygen use at onset of exercise in peripheral arterial disease. Journal ofVascular Surgery, 40(3):488 – 493.
[Bellingham et al., 1971] Bellingham, A. J., Detter, J. C., and Lenfant, C. (1971).Regulatory mechanisms of hemoglobin oxygen affinity in acidosis and alkalosis. TheJournal of Clinical Investigation, 50(3):700–706.
[Benni et al., 2005] Benni, P. B., Chen, B., Dykes, F. D., Wagoner, S. F., Heard,M., Tanner, A. J., Young, T. L., Rais-Bahrami, K., Rivera, O., and Short, B. L.(2005). Validation of the cas neonatal nirs system by monitoring vv-ecmo patients:preliminary results. Advances in experimental medicine and biology, 566:195–201.
[Bickler et al., 2011] Bickler, P. E., Feiner, J. R., Eilers, H., and Rollins, M. (2011).Performance of 5 cerebral oximeters during hypoxia in healthy volunteers. In Amer-ican Society of Anesthesiologists Annual Meeting Poster session, Chicago, Illinois,US,.
[Bland and Altman, 1986] Bland, J. M. and Altman, D. G. (1986). Statistical methodsfor assessing agreement between two methods of clinical measurement. The Lancet,327(8476):307 – 310.
[Boezeman et al., 2016] Boezeman, R. P., Moll, F. L., Unlu, C., and de Vries, J.-P. P. (2016). Systematic review of clinical applications of monitoring muscle tissueoxygenation with near-infrared spectroscopy in vascular disease. Microvascular Re-search, 104:11 – 22.
147

BIBLIOGRAPHY
[Bohr et al., 1904] Bohr, C., Hasselbalchand, K., and Krogh, A. (1904). Ueber einenin biologischer beziehung wichtigen einfluss, den die kohnensaeurespanng und desblutes auf dessen sauerstoffbindung uebt. Skand. Arch. Physiol., 16:401–412.
[Boushel and Piantadosi, 2000] Boushel, R. and Piantadosi, C. A. (2000). Near-infrared spectroscopy for monitoring muscle oxygenation. Acta Physiologica Scan-dinavica, 168(4):615–622.
[Bozkurt et al., 2005] Bozkurt, A., Rosen, A., Rosen, H., and Onaral, B. (2005). Aportable near-infrared spectroscopy system for bedside monitoring of newborn brain.BioMedical Engineering OnLine, 4:29.
[Brook, 1971] Brook, C. G. (1971). Composition of human adipose tissue from deepand subcutaneous sites. The British journal of nutrition, 25:377–380.
[Brun and Greisen, 1994] Brun, N. C. and Greisen, G. (1994). Cerebrovascular re-sponses to carbon dioxide as detected by near-infrared spectrophotometry: compar-ison of three different measures. Pediatric research, 36:20–24.
[Cerussi et al., 1996] Cerussi, A., Maier, J., Fantini, S., Franceschini, M. A., and Grat-ton, E. (1996). The frequency-domain multi-distance method in the presence ofcurved boundaries. In Biomedical Optical Spectroscopy and Diagnostics, page AP9.Optical Society of America.
[Choi et al., 2004] Choi, J., Wolf, M., Toronov, V., Wolf, U., Polzonetti, C., Hueber,D., Safonova, L. P., Gupta, R., Michalos, A., Mantulin, W., and Gratton, E. (2004).Noninvasive determination of the optical properties of adult brain: near-infraredspectroscopy approach. Journal of Biomedical Optics, 9(1):221–229.
[Clay, 2000] Clay, H. D. (2000). Validity and reliability of the SjO2 catheter in neu-rologically impaired patients: a critical review of the literature. Journal of Neuro-science Nursing, 32(4):194–203.
[Comerota et al., 2003] Comerota, A. J., Throm, R. C., Kelly, P., and Jaff, M. (2003).Tissue (muscle) oxygen saturation (sto2): A new measure of symptomatic lower-extremity arterial disease. Journal of Vascular Surgery, 38(4):724 – 729.
[Coplin et al., 1997] Coplin, W. M., O’Keefe, G. E., Grady, M. S., Grant, G. A.,March, K. S., Winn, H. R., and Lam, A. M. (1997). Thrombotic, infectious, andprocedural complications of the jugular bulb catheter in the intensive care unit.Neurosurgery, 41(1):101–107.
[Cubeddu et al., 1997] Cubeddu, R., Pifferi, A., Taroni, P., Torricelli, A., and Valen-tini, G. (1997). A solid tissue phantom for photon migration studies. Physics inMedicine and Biology, 42(10):1971.
[Dash and Bassingthwaighte, 2010] Dash, R. and Bassingthwaighte, J. (2010). Er-ratum to: Blood HbO2 and HbCO2 dissociation curves at varied O2, CO2, pH,2, 3−DPG and temperature levels. Annals of Biomedical Engineering, 38(4):1683–1701.
148

BIBLIOGRAPHY
[Dash et al., 2016] Dash, R., Korman, B., and Bassingthwaighte, J. (2016). Simpleaccurate mathematical models of blood HbO2 and HbCO2 dissociation curves atvaried physiological conditions - evaluation and comparison with other models. Eu-ropean Journal of Applied Physiology, 116(1):97–113.
[Daubeney et al., 1996] Daubeney, P. E., Pilkington, S. N., Janke, E., Charlton, G. A.,Smith, D. C., and Webber, S. A. (1996). Cerebral oxygenation measured by near-infrared spectroscopy: comparison with jugular bulb oximetry. The Annals of tho-racic surgery, 61:930–934.
[De Grand et al., 2006] De Grand, A. M., Lomnes, S. J., Lee, D. S., Pietrzykowski,M., Ohnishi, S., Morgan, T. G., Gogbashian, A., Laurence, R. G., and Frangioni,J. V. (2006). Tissue-like phantoms for near-infrared fluorescence imaging systemassessment and the training of surgeons. Journal of Biomedical Optics, 11(1):014007.
[Demel et al., 2014a] Demel, A., Feilke, K., Wolf, M., Poets, C. F., and Franz, A. R.(2014a). Correlation between skin, bone, and cerebrospinal fluid layer thickness andoptical coefficients measured by multidistance frequency-domain near-infrared spec-troscopy in term and preterm infants. Journal of Biomedical Optics, 19(1):017004–1–017004–8.
[Demel et al., 2014b] Demel, A., Wolf, M., Poets, C. F., and Franz, A. R. (2014b).Effect of different assumptions for brain water content on absolute measures ofcerebral oxygenation determined by frequency-domain near-infrared spectroscopyin preterm infants: an observational study. BMC Pediatrics, 14:206.
[Denault et al., 2007] Denault, A., Deschamps, A., and Murkin, J. M. (2007). A pro-posed algorithm for the intraoperative use of cerebral near-infrared spectroscopy.Seminars in cardiothoracic and vascular anesthesia, 11:274–281.
[Di Ninni et al., 2012] Di Ninni, P., Berube-Lauziere, Y., Mercatelli, L., Sani, E., andMartelli, F. (2012). Fat emulsions as diffusive reference standards for tissue simu-lating phantoms? Applied optics, 51:7176–7182.
[Dimofte et al., 2005] Dimofte, A., Finlay, J. C., and Zhu, T. C. (2005). A methodfor determination of the absorption and scattering properties interstitially in turbidmedia. Physics in medicine and biology, 50:2291–2311.
[Dix et al., 2013] Dix, L. M., van Bel, F., Baerts, W., and Lemmers, P. M. (2013).Comparing near-infrared spectroscopy devices and their sensors for monitoring re-gional cerebral oxygen saturation in the neonate. Pediatric Research, 74(5):557–563.
[Dobbing and Sands, 1973] Dobbing, J. and Sands, J. (1973). Quantitative growthand development of human brain. Archives of Disease in Childhood, 48(10):757–67.
[Driver et al., 1989] Driver, I., Feather, J. W., King, P. R., and Dawson, J. B. (1989).The optical properties of aqueous suspensions of intralipid, a fat emulsion. Physicsin Medicine and Biology, 34(12):1927.
149

BIBLIOGRAPHY
[Dullenkopf et al., 2003] Dullenkopf, A., Frey, B., Baenziger, O., Gerber, A., andWeiss, M. (2003). Measurement of cerebral oxygenation state in anaesthetized chil-dren using the invos 5100 cerebral oximeter. Paediatric anaesthesia, 13:384–391.
[Duret et al., 2015] Duret, J., Pottecher, J., Bouzat, P., Brun, J., Harrois, A., Payen,J.-F., and Duranteau, J. (2015). Skeletal muscle oxygenation in severe traumapatients during haemorrhagic shock resuscitation. Critical Care, 19(1):1–7.
[Fantini et al., 1994] Fantini, S., Franceschini, M. A., and Gratton, E. (1994). Semi-infinite-geometry boundary problem for light migration in highly scattering media:a frequency-domain study in the diffusion approximation. J. Opt. Soc. Am. B,11(10):2128–2138.
[Firbank and Delpy, 1993] Firbank, M. and Delpy, D. T. (1993). A design for a sta-ble and reproducible phantom for use in near-infrared imaging and spectroscopy.Physics in Medicine and Biology, 38(6):847–853.
[Franceschini et al., 1998] Franceschini, M. A., Fantini, S., Paunescu, L. A., Maier,J. S., and Gratton, E. (1998). Influence of a superficial layer in the quantitativespectroscopic study of strongly scattering media. Applied Optics, 37(31):7447–7458.
[Franceschini et al., 2007] Franceschini, M. A., Thaker, S., Themelis, G., Krish-namoorthy, K. K., Bortfeld, H., Diamond, S. G., Boas, D. A., Arvin, K., and Grant,P. E. (2007). Assessment of infant brain development with frequency-domain near-infrared spectroscopy. Pediatric research, 61:546–551.
[Frost and Thompson, 2000] Frost, C. and Thompson, S. G. (2000). Correcting for re-gression dilution bias: comparison of methods for a single predictor variable. Journalof the Royal Statistical Society: Series A (Statistics in Society), 163(2):173–189.
[Fukui et al., 2003] Fukui, Y., Ajichi, Y., and Okada, E. (2003). Monte carlo predic-tion of near-infrared light propagation in realistic adult and neonatal head models.Appl. Opt., 42(16):2881–2887.
[Fuller, 2008] Fuller, W. A. (2008). A Single Explanatory Variable, pages 1–99. JohnWiley & Sons, Inc.
[Gagnon et al., 2002] Gagnon, R. E., Macnab, A. J., Gagnon, F. A., Blackstock, D.,and LeBlanc, J. G. (2002). Comparison of two spatially resolved nirs oxygenationindices. Journal of clinical monitoring and computing, 17:385–391.
[Goutelle et al., 2008] Goutelle, S., Maurin, M., Rougier, F., Barbaut, X., Bour-guignon, L., Ducher, M., and Maire, P. (2008). The hill equation: a review of itscapabilities in pharmacological modelling. Fundamental & clinical pharmacology,22:633–648.
[Gratton et al., 1994] Gratton, G., Maier, J. S., Fabiani, M., Mantulin, W. W., andGratton, E. (1994). Feasibility of intracranial near-infrared optical scanning. Psy-chophysiology, 31(2):211–215.
150

BIBLIOGRAPHY
[Greisen et al., 2016] Greisen, G., Andresen, B., Plomgaard, A. M., and Hyttel-Sorensen, S. (2016). Cerebral oximetry in preterm infants: an agenda for researchwith a clear clinical goal. Neurophotonics, 3:031407.
[Greisen et al., 2011] Greisen, G., Leung, T., and Wolf, M. (2011). Has the timecome to use near-infrared spectroscopy as a routine clinical tool in preterm infantsundergoing intensive care? Philosophical transactions. Series A, Mathematical,physical, and engineering sciences, 369:4440–4451.
[Hamaoka et al., 2007] Hamaoka, T., McCully, K. K., Quaresima, V., Yamamoto, K.,and Chance, B. (2007). Near-infrared spectroscopy/imaging for monitoring muscleoxygenation and oxidative metabolism in healthy and diseased humans. Journal ofBiomedical Optics, 12(6):062105.
[Hapuarachchi et al., 2016] Hapuarachchi, T., Scholkmann, F., Caldwell, M., Hag-mann, C., Kleiser, S., Metz, A. J., Pastewski, M., Wolf, M., and Tachtsidis, I.(2016). Simulation of preterm neonatal brain metabolism during functional neu-ronal activation using a computational model. In Elwell, C. E., Leung, T. S., andHarrison, D. K., editors, Oxygen Transport to Tissue XXXVII, pages 111–120, NewYork, NY. Springer New York.
[Hernandez et al., 2009] Hernandez, S. E., Rodriguez, V. D., Perez, J., Martin, F. A.,Castellano, M. A., and Gonzalez-Mora, J. L. (2009). Diffuse reflectance spectroscopycharacterization of hemoglobin and intralipid solutions: in vitro measurements withcontinuous variation of absorption and scattering. Journal of biomedical optics,14:034026.
[Hessel et al., 2014] Hessel, T. W., Hyttel-Sorensen, S., and Greisen, G. (2014). Cere-bral oxygenation after birth - a comparison of invos and fore-sight near-infraredspectroscopy oximeters. Acta paediatrica (Oslo, Norway : 1992), 103:488–493.
[Hill, 1910] Hill, A. (1910). Proceedings of the physiological society: The possibleeffects of the aggregation of the molecules of haemoglobin on its dissociation curves.The Journal of Physiology, 40(suppl):i–vii.
[Hlastala and Woodson, 1975] Hlastala, M. P. and Woodson, R. D. (1975). Saturationdependency of the bohr effect: interactions among h-+, co2, and dpg. Journal ofapplied physiology, 38:1126–1131.
[Hlastala and Woodson, 1983] Hlastala, M. P. and Woodson, R. D. (1983). Bohr ef-fect data for blood gas calculations. Journal of applied physiology: respiratory,environmental and exercise physiology, 55:1002–1007.
[Hlastala et al., 1977] Hlastala, M. P., Woodson, R. D., and Wranne, B. (1977). In-fluence of temperature on hemoglobin-ligand interaction in whole blood. Journal ofapplied physiology: respiratory, environmental and exercise physiology, 43:545–550.
151

BIBLIOGRAPHY
[Hoffman and Inoue, 2006] Hoffman, J. F. and Inoue, S. (2006). Directly observed re-versible shape changes and hemoglobin stratification during centrifugation of humanand amphiuma red blood cells. Proceedings of the National Academy of Sciences ofthe United States of America, 103(8):2971–2976.
[Hueber et al., 1999] Hueber, D. M., Fantini, S., Cerussi, A. E., and Barbieri,B. (1999). New optical probe designs for absolute (self-calibrating) nir tissuehemoglobin measurements. Optical Tomography and Spectroscopy of Tissue III,Proc. SPIE 3597:618–631.
[Hull et al., 1998] Hull, E. L., Nichols, M. G., and Foster, T. H. (1998). Quantitativebroadband near-infrared spectroscopy of tissue-simulating phantoms containing ery-throcytes. Physics in Medicine and Biology, 43(11):3381–3404.
[Hyttel-Sorensen et al., 2013a] Hyttel-Sorensen, S., Austin, T., van Bel, F., Benders,M., Claris, O., Dempsey, E. M., Fumagalli, M., Gluud, C., Hagmann, C., Hellstrom-Westas, L., Lemmers, P., Naulaers, G., van Oeveren, W., Pellicer, A., Pichler, G.,Roll, C., Stoy, L. S., Wolf, M., and Greisen, G. (2013a). Clinical use of cerebraloximetry in extremely preterm infants is feasible. Danish medical journal, 60:A4533.
[Hyttel-Sorensen et al., 2014a] Hyttel-Sorensen, S., Hessel, T. W., and Greisen, G.(2014a). Peripheral tissue oximetry: comparing three commercial near-infrared spec-troscopy oximeters on the forearm. Journal of clinical monitoring and computing,28:149–155.
[Hyttel-Sorensen et al., 2014b] Hyttel-Sorensen, S., Hessel, T. W., la Cour, A., andGreisen, G. (2014b). A comparison between two nirs oximeters (invos, oxyprem)using measurement on the arm of adults and head of infants after caesarean section.Biomedical optics express, 5:3671–3683.
[Hyttel-Sorensen et al., 2013b] Hyttel-Sorensen, S., Kleiser, S., Wolf, M., and Greisen,G. (2013b). Calibration of a prototype nirs oximeter against two commercial deviceson a blood-lipid phantom. Biomedical optics express, 4:1662–1672.
[Hyttel-Sorensen et al., 2015] Hyttel-Sorensen, S., Pellicer, A., Alderliesten, T.,Austin, T., van Bel, F., Benders, M., Claris, O., Dempsey, E., Franz, A. R., Fu-magalli, M., Gluud, C., Grevstad, B., Hagmann, C., Lemmers, P., van Oeveren,W., Pichler, G., Plomgaard, A. M., Riera, J., Sanchez, L., Winkel, P., Wolf, M.,and Greisen, G. (2015). Cerebral near infrared spectroscopy oximetry in extremelypreterm infants: phase ii randomised clinical trial. BMJ (Clinical research ed.),350:g7635.
[Hyttel-Sorensen et al., 2011] Hyttel-Sorensen, S., Sorensen, L. C., Riera, J., andGreisen, G. (2011). Tissue oximetry: a comparison of mean values of regionaltissue saturation, reproducibility and dynamic range of four nirs-instruments on thehuman forearm. Biomedical optics express, 2:3047–3057.
152

BIBLIOGRAPHY
[Ijichi et al., 2005] Ijichi, S., Kusaka, T., Isobe, K., Okubo, K., Kawada, K., Namba,M., Okada, H., Nishida, T., Imai, T., and Itoh, S. (2005). Developmental changesof optical properties in neonates determined by near-infrared time-resolved spec-troscopy. Pediatric research, 58:568–573.
[ISS, 2001] ISS (2001). OxiplexTS near infrared, non-invasive, tissue spectrometer.Technical report, ISS, Inc., 1602 Newton Drive Champaign, Illinois 61822, USA.
[Jacques, 2013] Jacques, S. L. (2013). Optical properties of biological tissues: a review.Physics in Medicine and Biology, 58(11):R37.
[Jacques and McAuliffe, 1991] Jacques, S. L. and McAuliffe, D. J. (1991). Themelanosome: threshold temperature for explosive vaporization and internal absorp-tion coefficient during pulsed laser irradiation. Photochemistry and Photobiology,53(6):769–775.
[JCGM, 2012] JCGM (2012). International vocabulary of metrology - Basic and gen-eral concepts and associated terms (VIM), 3rd edition. Joint Committee for Guidesin Metrology.
[Jelzow et al., 2014] Jelzow, A., Wabnitz, H., Tachtsidis, I., Kirilina, E., Bruhl, R.,and Macdonald, R. (2014). Separation of superficial and cerebral hemodynamicsusing a single distance time-domain NIRS measurement. Biomedical Optics Express,5(5):1465–1482.
[Jenny et al., 2011] Jenny, C., Biallas, M., Trajkovic, I., Fauchere, J.-C., Bucher,H. U., and Wolf, M. (2011). Reproducibility of cerebral tissue oxygen saturationmeasurements by near-infrared spectroscopy in newborn infants. Journal of biomed-ical optics, 16:097004.
[Jobsis, 1977] Jobsis, F. (1977). Noninvasive, infrared monitoring of cerebral and my-ocardial oxygen sufficiency and circulatory parameters. Science, 198(4323):1264–1267. cited By 2020.
[Johns et al., 2005] Johns, M., Giller, C., German, D., and Liu, H. (2005). Determi-nation of reduced scattering coefficient of biological tissue from a needle-like probe.Optics express, 13:4828–4842.
[Jopling et al., 2009] Jopling, J., Henry, E., Wiedmeier, S. E., and Christensen, R. D.(2009). Reference ranges for hematocrit and blood hemoglobin concentration duringthe neonatal period: data from a multihospital health care system. Pediatrics,123:e333–e337.
[Kasman and Brady, 2011] Kasman, N. and Brady, K. (2011). Cerebral oximetry forpediatric anesthesia: why do intelligent clinicians disagree? Paediatric anaesthesia,21:473–478.
153

BIBLIOGRAPHY
[Kim and Liu, 2007] Kim, J. G. and Liu, H. (2007). Variation of haemoglobin ex-tinction coefficients can cause errors in the determination of haemoglobin concen-tration measured by near-infrared spectroscopy. Physics in Medicine and Biology,52(20):6295–322.
[Kleiser et al., 2016a] Kleiser, S., Hyttel-Sorensen, S., Greisen, G., and Wolf, M.(2016a). Comparison of near-infrared oximeters in a liquid optical phantom withvarying intralipid and blood content. In Elwell, C. E., Leung, T. S., and Harrison,D. K., editors, Oxygen Transport to Tissue XXXVII, volume 876, pages 413–418,New York, NY. Springer New York.
[Kleiser et al., 2016b] Kleiser, S., Nasseri, N., Andresen, B., Greisen, G., and Wolf,M. (2016b). Comparison of tissue oximeters on a liquid phantom with adjustableoptical properties. Biomed. Opt. Express, 7(8):2973–2992.
[Kleiser et al., 2016c] Kleiser, S., Pastewski, M., Hapuarachchi, T., Hagmann, C.,Fauchere, J.-C., Tachtsidis, I., Wolf, M., and Scholkmann, F. (2016c). Characteriz-ing fluctuations of arterial and cerebral tissue oxygenation in preterm neonates bymeans of data analysis techniques for nonlinear dynamical systems. In Elwell, C. E.,Leung, T. S., and Harrison, D. K., editors, Oxygen Transport to Tissue XXXVII,pages 511–519, New York, NY. Springer New York.
[Knirsch et al., 2008] Knirsch, W., Stutz, K., Kretschmar, O., Tomaske, M., Balmer,C., Schmitz, A., Berger, F., Bauersfeld, U., Weiss, M., and on Non-Invasive Haemo-dynamic Monitoring in Paediatrics, W. G. (2008). Regional cerebral oxygenationby nirs does not correlate with central or jugular venous oxygen saturation dur-ing interventional catheterisation in children. Acta anaesthesiologica Scandinavica,52:1370–1374.
[Ko et al., 2006] Ko, W., Kwak, Y., and Kim, S. (2006). Measurement of opticalcoefficients of tissue-like solutions using a combination method of infinite and semi-infinite geometries with continuous near infrared light. Japanese Journal of AppliedPhysics, 45(9R):7158.
[Kraitl et al., 2013] Kraitl, J., Timm, U., and Ewald, H. (2013). Non-invasive mea-surement of blood and tissue parameters based on vis-nir spectroscopy. SPIE Con-ference on Optical Diagnostics and Sensing XIII: Toward Point-of-Care Diagnostics,8591:859105.
[Kreeger et al., 2012] Kreeger, R. N., Ramamoorthy, C., Nicolson, S. C., Ames, W. A.,Hirsch, R., Peng, L. F., Glatz, A. C., Hill, K. D., Hoffman, J., Tomasson, J., andKurth, C. D. (2012). Evaluation of pediatric near-infrared cerebral oximeter forcardiac disease. The Annals of Thoracic Surgery, 94(5):1527–1533.
[Kurth and Uher, 1997] Kurth, C. and Uher, B. (1997). Cerebral hemoglobin and opti-cal pathlength influence near-infrared spectroscopy measurement of cerebral oxygensaturation. Anesthesia & Analgesia, 84(6):1297–1305.
154

BIBLIOGRAPHY
[Kurth et al., 1995] Kurth, C. D., Liu, H., Thayer, W. S., and Chance, B. (1995). Adynamic phantom brain model for near-infrared spectroscopy. Physics in Medicineand Biology, 40(12):2079–2092.
[Kusaka et al., 2002] Kusaka, T., Isobe, K., Nagano, K., Okubo, K., Yasuda, S.,Kondo, M., Itoh, S., Hirao, K., and Onishi, S. (2002). Quantification of cerebraloxygenation by full-spectrum near-infrared spectroscopy using a two-point method.Comparative biochemistry and physiology. Part A, Molecular & integrative physiol-ogy, 132:121–132.
[Leung et al., 2004] Leung, T. S., Aladangady, N., Elwell, C. E., Delpy, D. T., andCosteloe, K. (2004). A new method for the measurement of cerebral blood vol-ume and total circulating blood volume using near infrared spatially resolved spec-troscopy and indocyanine green: application and validation in neonates. Pediatricresearch, 55:134–141.
[Lewis et al., 1999] Lewis, G. D., Messing, W. P., and Stewart, M. C. (1999). Opticalcerebral oximeter. U.S. patent US5902235.
[Lewis and Stoddart, 1992] Lewis, G. D. and Stoddart, H. F. (1992). Method andappartus for in vivo optical spectroscopic examination. U.S. patent US5139025.
[Liem and Greisen, 2010] Liem, K. D. and Greisen, G. (2010). Monitoring of cerebralhaemodynamics in newborn infants. Early human development, 86:155–158.
[Lima and Bakker, 2011] Lima, A. and Bakker, J. (2011). Near-infrared spectroscopyfor monitoring peripheral tissue perfusion in critically ill patients. Revista Brasileirade terapia intensiva, 23:341–351.
[Liu et al., 2014] Liu, L., Oza, S., Hogan, D., Perin, J., Rudan, I., Lawn, J. E.,Cousens, S., Mathers, C., and Black, R. E. (2014). Global, regional, and nationalcauses of child mortality in 2000-2013, with projections to inform post-2015 priori-ties: an updated systematic analysis. The Lancet, 385(9966):430–440.
[MacLeod et al., 2013] MacLeod, D., Ikeda, K., Cheng, C., and Shaw, C. (2013). Val-idation of the next generation fore-sight elite tissue oximeters for adult cerebraltissue oxygen saturation. Anesth Analg, 116(supp):1–182.
[Marcinek et al., 2007] Marcinek, D. J., Amara, C. E., Matz, K., Conley, K. E., andSchenkman, K. A. (2007). Wavelength shift analysis: a simple method to determinethe contribution of hemoglobin and myoglobin to in vivo optical spectra. Appliedspectroscopy, 61:665–669.
[Matcher et al., 1995a] Matcher, S., Kirkpatrick, P., Nahid, K., Cope, M., and Delpy,D. (1995a). Absolute quantification methods in tissue near-infrared spectroscopy.Proc SPIE, San Jose, CA, 2389:486–495.
[Matcher et al., 1995b] Matcher, S. J., Elwell, C. E., Cooper, C. E., Cope, M., andDelpy, D. T. (1995b). Performance comparison of several published tissue near-infrared spectroscopy algorithms. Analytical Biochemistry, 227(1):54–68.
155
BIBLIOGRAPHY
[McBryde et al., 2016] McBryde, F. D., Malpas, S. C., and Paton, J. F. (2016). Intra-cranial mechanisms for preserving brain blood flow in health and disease. Actaphysiologica (Oxford, England).
[Medtronic, 2011] Medtronic (2011). The INVOS system improving patient out-comes through cerebral/somatic oximetry. Technical Report 11-PM-0256 MN21010,Medtronic, Inc., Minneapolis, MN, USA.
[Meissner, 2005] Meissner, M. H. (2005). Lower extremity venous anatomy. Seminarsin interventional radiology, 22:147–156.
[Menke et al., 2003] Menke, J., Voss, U., Mueller, G., and Jorch, G. (2003). Repro-ducibility of cerebral near infrared spectroscopy in neonates. Biology of the neonate,83:6–11.
[Metz et al., 2013a] Metz, A. J., Biallas, M., Jenny, C., Muehlemann, T., and Wolf,M. (2013a). The effect of basic assumptions on the tissue oxygen saturation value ofnear infrared spectroscopy. Advances in experimental medicine and biology, 765:169–175.
[Metz et al., 2013b] Metz, A. J., Pugin, F., Huber, R., Achermann, P., and Wolf, M.(2013b). Brain tissue oxygen saturation increases during the night in adolescents.In Van Huffel, S., Naulaers, G., Caicedo, A., Bruley, D. F., and Harrison, D. K.,editors, Oxygen Transport to Tissue XXXV, pages 113–119, New York, NY. SpringerNew York.
[Metz et al., 2014] Metz, A. J., Pugin, F., Huber, R., Achermann, P., and Wolf, M.(2014). Changes of cerebral tissue oxygen saturation at sleep transitions in ado-lescents. In Swartz, H. M., Harrison, D. K., and Bruley, D. F., editors, OxygenTransport to Tissue XXXVI, pages 279–285, New York, NY. Springer New York.
[Meyer et al., 1999] Meyer, B., Schaller, C., Frenkel, C., Ebeling, B., and Schramm,J. (1999). Distributions of local oxygen saturation and its response to changesof mean arterial blood pressure in the cerebral cortex adjacent to arteriovenousmalformations. Stroke, 30(12):2623–2630.
[Morgan, 1999] Morgan, T. J. (1999). The oxyhaemoglobin dissociation curve in crit-ical illness. Critical care and resuscitation : journal of the Australasian Academy ofCritical Care Medicine, 1:93–100.
[Morris et al., 2012] Morris, N., Pichler, G., Pocivalnik, M., Brandner, A., Mueller,W., and Urlesberger, B. (2012). Cerebral regional oxygen saturation (crso2): aredifferent sensors comparable? Paediatric anaesthesia, 22:1132–1134.
[Murkin et al., 2007] Murkin, J. M., Adams, S. J., Novick, R. J., Quantz, M., Bain-bridge, D., Iglesias, I., Cleland, A., Schaefer, B., Irwin, B., and Fox, S. (2007).Monitoring brain oxygen saturation during coronary bypass surgery: a randomized,prospective study. Anesthesia and analgesia, 104:51–58.
156
BIBLIOGRAPHY
[Myers et al., 2009] Myers, D., McGraw, M., George, M., Mulier, K., and Beilman,G. (2009). Tissue hemoglobin index: a non-invasive optical measure of total tissuehemoglobin. Critical Care, 13(5):S2.
[Myers et al., 2005] Myers, D. E., Anderson, L. D., Seifert, R. P., Ortner, J. P.,Cooper, C. E., Beilman, G. J., and Mowlem, J. D. (2005). Noninvasive methodfor measuring local hemoglobin oxygen saturation in tissue using wide gap secondderivative near-infrared spectroscopy. Journal of biomedical optics, 10:034017.
[Nagdyman et al., 2008] Nagdyman, N., Ewert, P., Peters, B., Miera, O., Fleck, T.,and Berger, F. (2008). Comparison of different near-infrared spectroscopic cerebraloxygenation indices with central venous and jugular venous oxygenation saturationin children. Pediatric Anesthesia, 18(2):160–166.
[Nagdyman et al., 2005] Nagdyman, N., Fleck, T., Schubert, S., Ewert, P., Peters, B.,Lange, P. E., and Abdul-Khaliq, H. (2005). Comparison between cerebral tissueoxygenation index measured by near-infrared spectroscopy and venous jugular bulbsaturation in children. Intensive care medicine, 31:846–850.
[Nasseri et al., 2016a] Nasseri, N., Kleiser, S., Ostojic, D., Karen, T., and Wolf, M.(2016a). Quantifying the effect of adipose tissue in muscle oximetry by near infraredspectroscopy. Biomed. Opt. Express, 7(11):4605–4619.
[Nasseri et al., 2016b] Nasseri, N., Kleiser, S., Reidt, S., and Wolf, M. (2016b). Localmeasurement of flap oxygen saturation; an application of visible light spectroscopy.In Elwell, C. E., Leung, T. S., and Harrison, D. K., editors, Oxygen Transport toTissue XXXVII, volume 876, pages 391 – 397, New York, NY. Springer New York.
[Nasseri et al., 2014] Nasseri, N., Zysset, C., Büthe, L., Kleiser, S., Tröster, G., andWolf, M. (2014). Evaluation of a textile-based near infrared spectroscopy systemin calf muscle oxygenation measurements. In Swartz, H. M., Harrison, D. K., andBruley, D. F., editors, Oxygen Transport to Tissue XXXVI, pages 355–360, NewYork, NY. Springer New York.
[Ninni et al., 2011] Ninni, P. D., Martelli, F., and Zaccanti, G. (2011). Intralipid: to-wards a diffusive reference standard for optical tissue phantoms. Physics in medicineand biology, 56:N21–N28.
[Nonin, 2014a] Nonin (2014a). Model 8004CA, Instructions for use - english. TechnicalReport 9539-001-02, Nonin Medical, Inc., 13700 1st Avenue North Plymouth, MN,55441-5443, USA.
[Nonin, 2014b] Nonin (2014b). Model 8004CB-NA, Instructions for use - english. Tech-nical Report 9223-001-02, Nonin Medical, Inc., 13700 1st Avenue North Plymouth,MN, 55441-5443, USA.
[Nonin, 2014c] Nonin (2014c). Sensmart model x-100 universal oximetry system forpediatric patients. Technical report, Nonin Medical, 13700 1st Avenue North Ply-mouth, MN, 55441-5443, U.S.A.
157
BIBLIOGRAPHY
[Nosoh, 1964] Nosoh, Y. (1964). Absorption spectrum of actively respiring yeast cells.Archives of Biochemistry and Biophysics, 105(2):439 – 445.
[Okada, 2013] Okada, E. (2013). Photon Migration in NIRS Brain Imaging, pages37–58. Springer US, Boston, MA.
[Okada and Delpy, 2003] Okada, E. and Delpy, D. T. (2003). Near-infrared light prop-agation in an adult head model. i. modeling of low-level scattering in the cere-brospinal fluid layer. Appl. Opt., 42(16):2906–2914.
[Orphanidou et al., 1994] Orphanidou, C., McCargar, L., Birmingham, C., Math-ieson, J., and Goldner, E. (1994). Accuracy of subcutaneous fat measurement:Comparison of skinfold calipers, ultrasound, and computed tomography. Journal ofthe American Dietetic Association, 94(8):855 – 858.
[Patterson et al., 1995] Patterson, M. S., Osei, E. K., Andersson-Engels, S., and Wil-son, B. C. (1995). Absorption spectroscopy in tissue-simulating materials: a theo-retical and experimental study of photon paths. Applied Optics, 34(1):22–30.
[Pellicer and Bravo, 2011] Pellicer, A. and Bravo, M. d. C. (2011). Near-infrared spec-troscopy: a methodology-focused review. Seminars in fetal & neonatal medicine,16:42–49.
[Pellicer et al., 2013] Pellicer, A., Greisen, G., Benders, M., Claris, O., Dempsey, E.,Fumagalli, M., Gluud, C., Hagmann, C., Hellstrom-Westas, L., Hyttel-Sorensen,S., Lemmers, P., Naulaers, G., Pichler, G., Roll, C., van Bel, F., van Oeveren,W., Skoog, M., Wolf, M., and Austin, T. (2013). The safeboosc phase ii randomisedclinical trial: a treatment guideline for targeted near-infrared-derived cerebral tissueoxygenation versus standard treatment in extremely preterm infants. Neonatology,104:171–178.
[Pellicer et al., 2001] Pellicer, A., Valverde, E., GayaÂą, F., Quero, J., and Cabanas,F. (2001). Postnatal adaptation of brain circulation in preterm infants. Pediatricneurology, 24:103–109.
[Pin-Barre and Laurin, 2015] Pin-Barre, C. and Laurin, J. (2015). Physical exerciseas a diagnostic, rehabilitation, and preventive tool: Influence on neuroplasticity andmotor recovery after stroke. Neural plasticity, 2015:608581.
[Pinheiro et al., 2016] Pinheiro, J., Bates, D., DebRoy, S., Sarkar, D., and R CoreTeam (2016). nlme: Linear and Nonlinear Mixed Effects Models. R package version3.1-128.
[Plomgaard et al., 2016a] Plomgaard, A. M., Hagmann, C., Alderliesten, T., Austin,T., van Bel, F., Claris, O., Dempsey, E., Franz, A., Fumagalli, M., Gluud, C.,Greisen, G., Hyttel-Sorensen, S., Lemmers, P., Pellicer, A., Pichler, G., and Ben-ders, M. (2016a). Brain injury in the international multicenter randomized safebooscphase ii feasibility trial: cranial ultrasound and magnetic resonance imaging assess-ments. Pediatric research, 79:466–472.
158

BIBLIOGRAPHY
[Plomgaard et al., 2016b] Plomgaard, A. M., van Oeveren, W., Petersen, T. H., Alder-liesten, T., Austin, T., van Bel, F., Benders, M., Claris, O., Dempsey, E., Franz, A.,Fumagalli, M., Gluud, C., Hagmann, C., Hyttel-Sorensen, S., Lemmers, P., Pellicer,A., Pichler, G., Winkel, P., and Greisen, G. (2016b). The safeboosc ii random-ized trial: treatment guided by near-infrared spectroscopy reduces cerebral hypoxiawithout changing early biomarkers of brain injury. Pediatric research, 79:528–535.
[Pocivalnik et al., 2011] Pocivalnik, M., Pichler, G., Zotter, H., Tax, N., Mueller, W.,and Urlesberger, B. (2011). Regional tissue oxygen saturation: comparability andreproducibility of different devices. Journal of biomedical optics, 16:057004.
[Prahl, 2011] Prahl, S. (2011). Everything i think you should know about inverseadding-doubling. Oregon Medical Laser Center, St. Vincent Hospital, pages 1–74.
[Pringle et al., 1999] Pringle, J., Roberts, C., Kohl, M., and Lekeux, P. (1999). Nearinfrared spectroscopy in large animals: Optical pathlength and influence of haircovering and epidermal pigmentation. The Veterinary Journal, 158(1):48 – 52.
[R Core Team, 2016] R Core Team (2016). R: A Language and Environment for Sta-tistical Computing. R Foundation for Statistical Computing, Vienna, Austria.
[Rais-Bahrami et al., 2006] Rais-Bahrami, K., Rivera, O., and Short, B. L. (2006).Validation of a noninvasive neonatal optical cerebral oximeter in veno-venous ecmopatients with a cephalad catheter. Journal of perinatology : official journal of theCalifornia Perinatal Association, 26:628–635.
[Roche-Labarbe et al., 2010] Roche-Labarbe, N., Carp, S. A., Surova, A., Patel, M.,Boas, D. A., Grant, P. E., and Franceschini, M. A. (2010). Noninvasive opticalmeasures of cbv, sto(2), cbf index, and rcmro(2) in human premature neonates’brains in the first six weeks of life. Human brain mapping, 31:341–352.
[Roche-Labarbe et al., 2012] Roche-Labarbe, N., Fenoglio, A., Aggarwal, A., Dehaes,M., Carp, S. A., Franceschini, M. A., and Grant, P. E. (2012). Near-infrared spec-troscopy assessment of cerebral oxygen metabolism in the developing prematurebrain. Journal of cerebral blood flow and metabolism : official journal of the Inter-national Society of Cerebral Blood Flow and Metabolism, 32:481–488.
[Saager and Berger, 2005] Saager, R. B. and Berger, A. J. (2005). Direct character-ization and removal of interfering absorption trends in two-layer turbid media. J.Opt. Soc. Am. A, 22(9):1874–1882.
[Sakata et al., 2012] Sakata, Y., Abajian, M., Ripple, M. O., and Springett, R. (2012).Measurement of the oxidation state of mitochondrial cytochrome c from the neo-cortex of the mammalian brain. Biomedical Optics Express, 3(8):1933–1946.
[Scheeren et al., 2012] Scheeren, T. W. L., Schober, P., and Schwarte, L. A. (2012).Monitoring tissue oxygenation by near infrared spectroscopy (nirs): background andcurrent applications. Journal of clinical monitoring and computing, 26:279–287.
159

BIBLIOGRAPHY
[Schneider et al., 2014] Schneider, A., Minnich, B., Hofstätter, E., Weisser, C.,Hattinger-Jürgenssen, E., and Wald, M. (2014). Comparison of four near-infraredspectroscopy devices shows that they are only suitable for monitoring cerebral oxy-genation trends in preterm infants. Acta Paediatrica, 103(9):934–938.
[Scholkmann et al., 2014a] Scholkmann, F., Kleiser, S., Metz, A. J., Zimmermann, R.,Pavia, J. M., Wolf, U., and Wolf, M. (2014a). A review on continuous wave func-tional near-infrared spectroscopy and imaging instrumentation and methodology.NeuroImage, 85, Part 1:6 – 27. Celebrating 20 Years of Functional Near InfraredSpectroscopy (fNIRS).
[Scholkmann et al., 2014b] Scholkmann, F., Metz, A. J., and Wolf, M. (2014b). Mea-suring tissue hemodynamics and oxygenation by continuous-wave functional near-infrared spectroscopy - how robust are the different calculation methods againstmovement artifacts? Physiological Measurement, 35(4):717.
[Shimizu et al., 2005] Shimizu, N., Gilder, F., Bissonnette, B., Coles, J., Bohn, D.,and Miyasaka, K. (2005). Brain tissue oxygenation index measured by near infraredspatially resolved spectroscopy agreed with jugular bulb oxygen saturation in normalpediatric brain: a pilot study. Child’s nervous system : ChNS : official journal ofthe International Society for Pediatric Neurosurgery, 21:181–184.
[Siggaard-Andersen and Siggaard-Andersen, 1995] Siggaard-Andersen, M. andSiggaard-Andersen, O. (1995). Oxygen status algorithm, version 3, with someapplications. Acta anaesthesiologica Scandinavica. Supplementum, 107:13–20.
[Sorensen and Greisen, 2006] Sorensen, L. C. and Greisen, G. (2006). Precision ofmeasurement of cerebral tissue oxygenation index using near-infrared spectroscopyin preterm neonates. Journal of Biomedical Optics, 11(5):054005.
[Sorensen et al., 2008] Sorensen, L. C., Leung, T. S., and Greisen, G. (2008). Com-parison of cerebral oxygen saturation in premature infants by near-infrared spatiallyresolved spectroscopy: observations on probe-dependent bias. Journal of biomedicaloptics, 13:064013.
[Stachel, 2016] Stachel, H. (2016). Investigation of typical application errors handlingnirs oximeters. Master’s thesis, ETH Zurich, MAS Medizinphysik.
[Steinback and Poulin, 2016] Steinback, C. D. and Poulin, M. J. (2016). Influence ofhypoxia on cerebral blood flow regulation in humans. Advances in experimentalmedicine and biology, 903:131–144.
[Suzuki et al., 1999] Suzuki, S., Takasaki, S., Ozaki, T., and Kobayashi, Y. (1999).A tissue oxygenation monitor using nir spatially resolved spectroscopy. OpticalTomography and Spectroscopy of Tissue Iii, Proceedings Of, 3597:582–592.
[Swietach et al., 2010] Swietach, P., Tiffert, T., Mauritz, J. M. A., Seear, R., Esposito,A., Kaminski, C. F., Lew, V. L., and Vaughan-Jones, R. D. (2010). Hydrogen iondynamics in human red blood cells. The Journal of physiology, 588:4995–5014.
160
BIBLIOGRAPHY
[Szczapa et al., 2013] Szczapa, T., Karpiński, L., Moczko, J., Weindling, M., Kor-nacka, A., Wróblewska, K., Adamczak, A., Jopek, A., Chojnacka, K., and Gadzi-nowski, J. (2013). Comparison of cerebral tissue oxygenation values in full termand preterm newborns by the simultaneous use of two near-infrared spectroscopydevices: an absolute and a relative trending oximeter. Journal of Biomedical Optics,18(8):087006.
[Thavasothy et al., 2002] Thavasothy, M., Broadhead, M., Elwell, C., Peters, M., andSmith, M. (2002). A comparison of cerebral oxygenation as measured by the niro300 and the invos 5100 near-infrared spectrophotometers. Anaesthesia, 57:999–1006.
[Van Bel et al., 2008] Van Bel, F., Lemmers, P., and Naulaers, G. (2008). Monitoringneonatal regional cerebral oxygen saturation in clinical practice: value and pitfalls.Neonatology, 94(4):237–244.
[van Staveren et al., 1991] van Staveren, H. J., Moes, C. J., van Marie, J., Prahl, S. A.,and van Gemert, M. J. (1991). Light scattering in intralipid-10% in the wavelengthrange of 400 - 1100 nm. Applied optics, 30:4507–4514.
[Vogel, 2015] Vogel, T. C. E. (2015). Measurement of tissue oxygenation and hemo-dynamics in preterm infants using near-infrared spectroscopy (nirs): Repeatabilityand reproducibility of a novel measurement device, and systematic literature re-search on stimulus-evoked functional brain activity in preterms using functionalnirs. mathesis, Medical Department University of Zurich.
[Volpe, 2009] Volpe, J. J. (2009). Brain injury in premature infants: a complex amal-gam of destructive and developmental disturbances. The Lancet Neurology, 8(1):110– 124.
[Wallace et al., 2000] Wallace, D., Barbieri, B., and Hintz, S. R. (2000). Neonatalcerebral oxygenation measurements and the effects of curvature on frequency domainmultiple distance near infrared spectroscopy. In Biomedical Optical Spectroscopy andDiagnostics, page SuF1. Optical Society of America.
[Watzman et al., 2000] Watzman, H. M., Kurth, C. D., Montenegro, L. M., Rome,J., Steven, J. M., and Nicolson, S. C. (2000). Arterial and venous contributions tonear-infrared cerebral oximetry. Anesthesiology, 93:947–953.
[Werner and Stevens, 2015] Werner, J. K. and Stevens, R. D. (2015). Traumatic braininjury: recent advances in plasticity and regeneration. Current opinion in neurology,28:565–573.
[Wodick and Lübbers, 1973] Wodick, R. and Lübbers, D. W. (1973). Quantitativeanalysis of reflection spectra and other spectra of inhomogeneous light paths con-ducted in multi component systems with the aid of interval analysis part 1. BiologicalChemistry, 354(8):903–915.
161

BIBLIOGRAPHY
[Wolf et al., 1998] Wolf, M., Baenziger, O., Keel, M., Dietz, V., von Siebenthal, K.,and Bucher, H. U. (1998). Testing near-infrared spectrophotometry using a liquidneonatal head phantom. In BiOS Europe’98, pages 79–86. International Society forOptics and Photonics.
[Wolf and Greisen, 2009] Wolf, M. and Greisen, G. (2009). Advances in near-infraredspectroscopy to study the brain of the preterm and term neonate. Clinics in peri-natology, 36:807–34, vi.
[Wolf et al., 1999] Wolf, M., Keel, M., Dietz, V., von Siebenthal, K., Bucher, H. U.,and Baenziger, O. (1999). The influence of a clear layer on near-infrared spectropho-tometry measurements using a liquid neonatal head phantom. Physics in medicineand biology, 44:1743–1753.
[Wolf et al., 2012] Wolf, M., Naulaers, G., van Bel, F., Kleiser, S., and Greisen, G.(2012). A review of near-infrared spectroscopy for term and preterm newborns.Journal of Near Infrared Spectroscopy, 20(1):43–55.
[Wolf et al., 2003] Wolf, U., Wolf, M., Choi, J. H., Paunescu, L., Safonova, L. P.,Michalos, A., and Gratton, E. (2003). Mapping of hemodynamics on the humancalf with near-infrared spectroscopy and the influence of the adipose tissue thickness.Advances in Experimental Medicine and Biology, 510:225 – 230.
[Wyatt et al., 1986] Wyatt, J. S., Cope, M., Delpy, D. T., Wray, S., and Reynolds,E. O. (1986). Quantification of cerebral oxygenation and haemodynamics in sicknewborn infants by near infrared spectrophotometry. Lancet (London, England),2:1063–1066.
[Yoshida and Shevkoplyas, 2010] Yoshida, T. and Shevkoplyas, S. S. (2010). Anaero-bic storage of red blood cells. blood transfusions, 8(4):220 – 236.
[Yoshitani et al., 2005] Yoshitani, K., Kawaguchi, M., Iwata, M., Sasaoka, N., Inoue,S., Kurumatani, N., and Furuya, H. (2005). Comparison of changes in jugularvenous bulb oxygen saturation and cerebral oxygen saturation during variationsof haemoglobin concentration under propofol and sevoflurane anaesthesia. Britishjournal of anaesthesia, 94:341–346.
[Yoshitani et al., 2002] Yoshitani, K., Kawaguchi, M., Tatsumi, K., Kitaguchi, K., andFuruya, H. (2002). A comparison of the invos 4100 and the niro 300 near-infraredspectrophotometers. Anesthesia and analgesia, 94:586–90; table of contents.
[Zijlstra et al., 1991] Zijlstra, W. G., Buursma, A., and Meeuwsen-van der Roest,W. P. (1991). Absorption spectra of human fetal and adult oxyhemoglobin,de-oxyhemoglobin, carboxyhemoglobin, and methemoglobin. Clinical chemistry,37:1633–1638.
[Zijlstra et al., 2000] Zijlstra, W. G., Buursma, A., and van Assendelft, O. W. (2000).Visible and near infrared absorption spectra of human and animal haemoglobin de-termination and application. VSP: Utrecht.
162

Acknowledgements
I would like to thank all people supporting me in the last years during my PhD thesisat the Biomedical Optics Research Laboratory (BORL), Department of Neonatology,University Hospital Zurich (USZ).
My first thank you is for Hans Ulrich Bucher and later Dirk Bassler who providedinfrastructure and a research-friendly atmosphere in their role as head of the Depart-ment of Neonatology.
Then I would like to thank Martin Wolf for giving me the opportunity to work onthis thesis, his great role as advisor and for providing me with all tools and materialsneeded. He was always there when feedback, input or knowledgeable advice was neededand thus strongly contributed to the achievements presented in this thesis.
I thank Markus Rudin for enabling and guiding this thesis. I very much appreciatehis honest and valuable input during progress reports. I also want to express mysincere gratitude to Roger Gassert for co-reffering this thesis.
Of course, I could not have done the work presented in this thesis alone. I thereforeowe a great ’thank you’ to my co-workers at BORL, who were always open for discus-sions and gave plenty of constructive feedback and input. There was never a ’no’ whenhelp was needed and I am very grateful for this nice way of working together. How-ever, I want to address some special thanks to those members of BORL with whom Icollaborated the most.
• Nassim Nasseri for the very fruitful cooperation, resulting in a number of papersrelated to our liquid phantom model and for her contribution to OxyPrem v1.3development and device manufacturing.
• Daniel Ostojic for his commitment to both OxyPrem versions over many years,his great help in the latest liquid phantom experiments and in the ’OxyPremValidation’ study measurements in neonates.
• Andreas Metz for the many hours we spent commonly in the lab while manufac-turing OxyPrem v1.2 sensors, for the solid base he left behind when he finishedhis PhD at our group.
• Felix Scholkmann for being my office-mate over years, always providing an answerto whichever kind of question I had and for his great commitment related to the’OxyPrem Validation’ study.
• Helene Stachel for her commitment related to the phantom measurements duringher master thesis.
• Iris Suter for helping me with all kinds of administrative issues and her greatcontributions to lively discussions at lunch and social events.
I also want to express my honest gratitude to the clinical personnel at the De-partment of Neonatology at USZ who were always helpful and never kept a question
163
Acknowledgements
unanswered. No matter at which door I knocked, I was always directly helped or toldwhere to go. This applies especially to Hans Ulrich Bucher, Jean-Claude Fauchère andTanja Karen who showed large efforts in association with the ’OxyPrem Validation’study.
The collaboration with Gorm Greisen, Simon Hyttel-Sørensen and Bjørn Andresenfrom Copenhagen provided great input to OxyPrem and phantom development, andwas extremely productive. I learned a lot scientifically in the joint experiments andwhile writing papers commonly. I am very thankful for this.
Several students contributed to the projects I was involved. Edouard Tang developeda first version of the 2-layer liquid phantom set-up. Petar Jokic and Andrea Sorodeveloped a smartphone app communicating with OxyPrem and Petar Jokic laterdeveloped a USB interface for OxyPrem v1.3. I would like to thank all of them fortheir efforts.
I am grateful to my family and friends who always showed great understanding,believed in me and supported me whenever needed. This applies particularly to mywife Heike and my son Julian who gave me the strength and motivation to succeed indaily work and thus ultimately enabled this thesis.
Finally, I want to thank Christopher Heinrich, Leonhard Kleiser, Timo Langenbach,Philipp Müller, Alexander Nitsch, Daniel Ostojic and Felix Scholkmann for proofread-ing of parts of this thesis and Tobias Langner for providing LATEX-support.
Grenzach-Wyhlen, November 17th, 2016 Stefan Kleiser
164
Related Documents


