Central Texas Education Snapshot 2007 San Marcos Profile

Central Texas Education Snapshot 2007 San Marcos Profile.
Dec 14, 2015
Welcome message from author
This document is posted to help you gain knowledge. Please leave a comment to let me know what you think about it! Share it to your friends and learn new things together.
Transcript
Central TexasEducation Snapshot
2007
San Marcos Profile
What is the E3 Alliance?
A catalyst for change in Central Texas andin regions across the state
Building a research-based regional blueprint to align our education systems
to better fulfill the potential of every citizen and in turn, increase economic outcomes.
Acknowledgements
Authors:
Susan Dawson
Hannah Gourgey
Dan Murphy
Jeff Schulz
Jim Walker
This Snapshot would not be possible without:
Contributors:Steve MurdockEd FullerTony GrassoJon HockenyosMeg MooreTEA: Nina Taylor Perry Weirich Uri Woli (& others)
THECB: Donn Godin Julie Eklund (& others)
Region 13: Kathy Burbank (& others)
Funders:
AARO
Austin Community College District
Michael & Susan Dell Foundation
Opportunity Austin
Texas Education Agency
(Complete list of funders at www.e3alliance.org)
What is the Snapshot?
• A comprehensive review of education in Central Texas:– Who and where our students are – Performance outcomes – Comparisons by demographic and district– Factors influencing student achievement – Where and how students matriculate into college– Ultimate education success rates– Recommendations based on initial findings
This type of comprehensive review has never before been compiled for any region in the state, and offers us detailed guidance in building the Central Texas Blueprint for Change.
OV-1

Why a Regional Snapshot?
1. To use as a communication tool in our efforts to engage the region around systemic change in education
2. To focus and drive our more detailed research
3. From Information to Action: to guide regional Alignment activities
OV-2
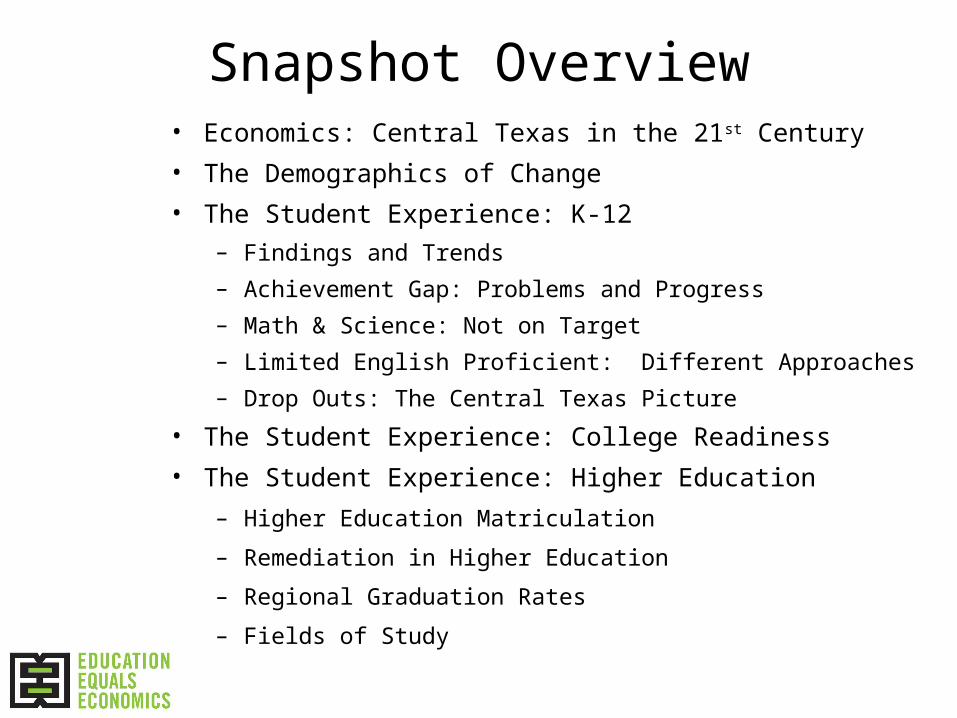
Snapshot Overview• Economics: Central Texas in the 21st Century
• The Demographics of Change
• The Student Experience: K-12
– Findings and Trends
– Achievement Gap: Problems and Progress
– Math & Science: Not on Target
– Limited English Proficient: Different Approaches
– Drop Outs: The Central Texas Picture
• The Student Experience: College Readiness
• The Student Experience: Higher Education
– Higher Education Matriculation
– Remediation in Higher Education
– Regional Graduation Rates
– Fields of Study
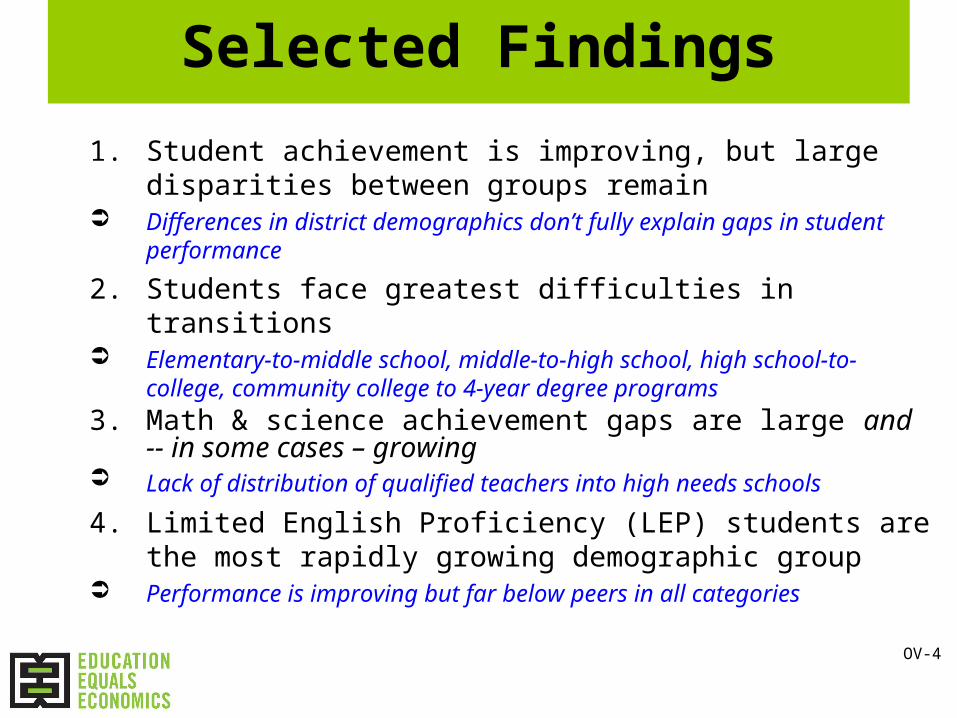
Selected Findings
1. Student achievement is improving, but large disparities between groups remain
Differences in district demographics don’t fully explain gaps in student performance
2. Students face greatest difficulties in transitions Elementary-to-middle school, middle-to-high school, high school-
to-college, community college to 4-year degree programs
3. Math & science achievement gaps are large and -- in some cases – growing
Lack of distribution of qualified teachers into high needs schools
4. Limited English Proficiency (LEP) students are the most rapidly growing demographic group
Performance is improving but far below peers in all categoriesOV-4
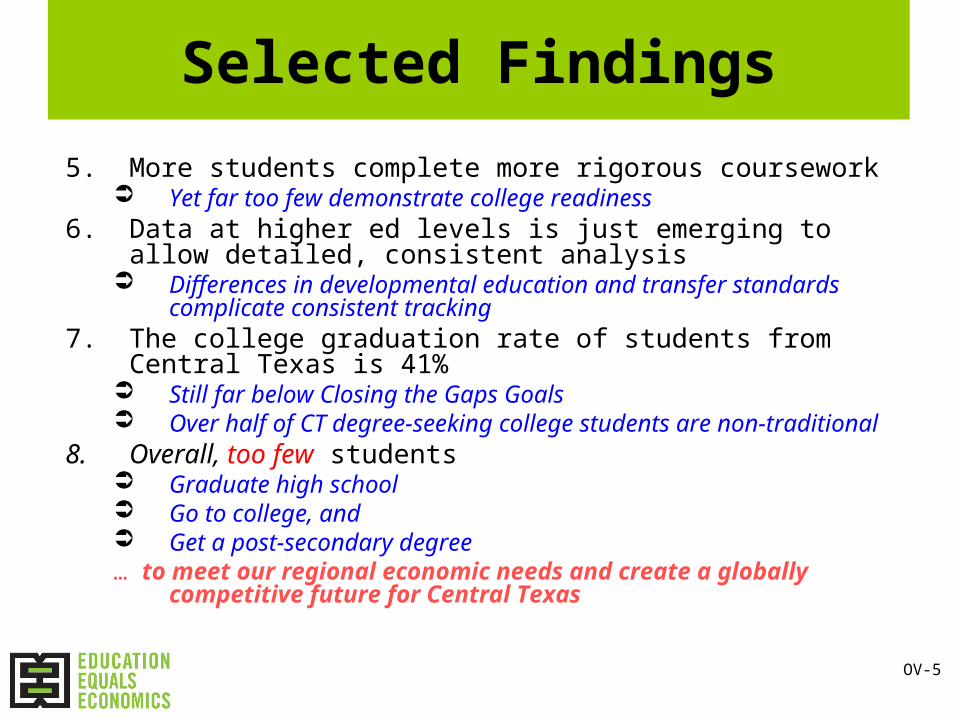
Selected Findings
5. More students complete more rigorous coursework Yet far too few demonstrate college readiness
6. Data at higher ed levels is just emerging to allow detailed, consistent analysis
Differences in developmental education and transfer standards complicate consistent tracking
7. The college graduation rate of students from Central Texas is 41% Still far below Closing the Gaps Goals Over half of CT degree-seeking college students are non-traditional
8. Overall, too few students Graduate high school Go to college, and Get a post-secondary degree … to meet our regional economic needs and create a globally
competitive future for Central Texas
OV-5

Central Texas Economics: Highlights
• Education attainment is not keeping pace with economic need
• Meeting Closing the Gaps goals would likely yield an additional $1.9 trillion by 2030 for the State1
• Meeting educational attainment goals would increase employment by more than 100,000 jobs
EC-1A
1: A Tale of Two States and One Million Jobs by the Perryman Group, 2007
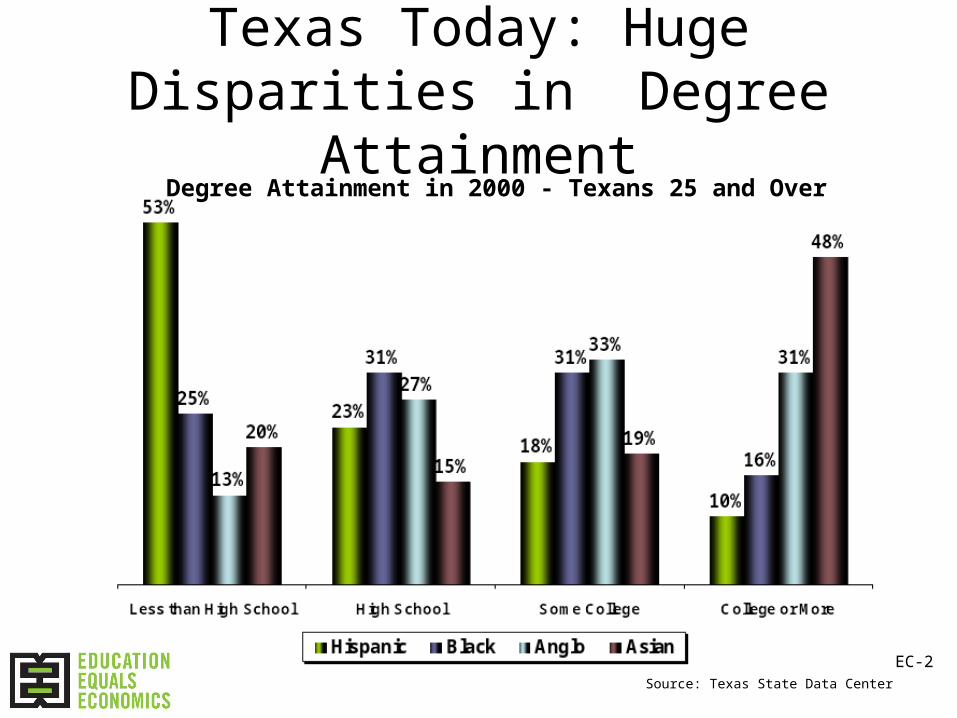
Texas Today: Huge Disparities in Degree Attainment
Degree Attainment in 2000 - Texans 25 and Over
Source: Texas State Data Center
EC-2
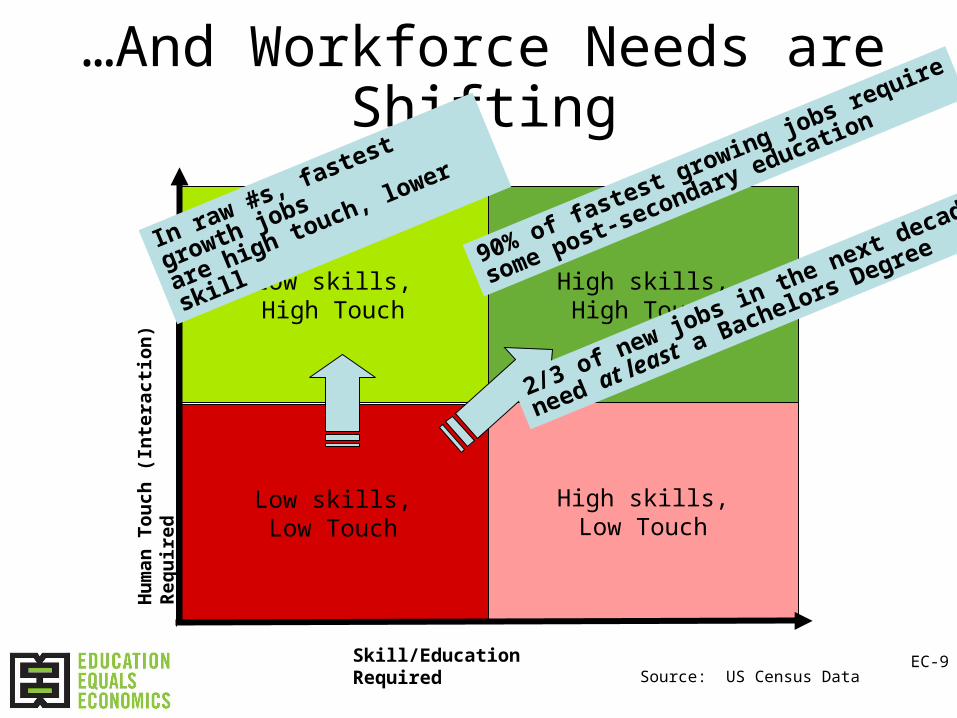
Low skills,Low Touch
High skills,High Touch
High skills,Low Touch
Low skills,High Touch
…And Workforce Needs are Shifting
90% of fastest growing jobs require
some post-secondary education
2/3 of new jobs in the next decade
need at least a Bachelors DegreeIn raw #s, fastest growth jobs
are high touch, lower skill H
um
an
To
uch
(In
tera
ctio
n)
Req
uir
ed
Skill/Education RequiredSource: US Census Data
EC-9
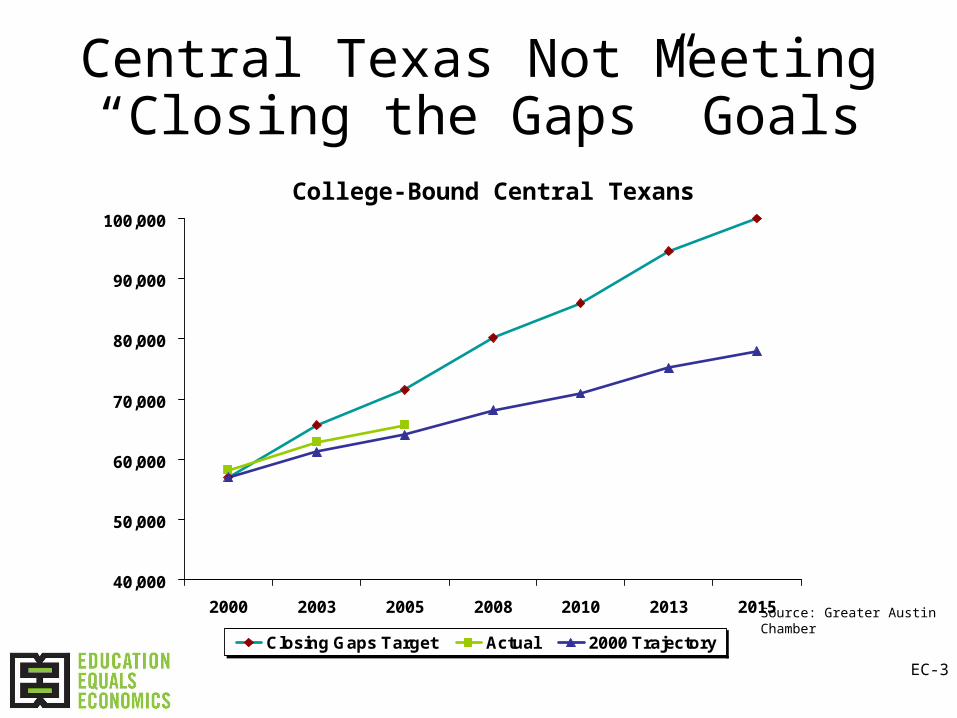
Central Texas Not Meeting “Closing the Gaps” Goals
40,000
50,000
60,000
70,000
80,000
90,000
100,000
2000 2003 2005 2008 2010 2013 2015
Closing Gaps Target Actual 2000 Trajectory
College-Bound Central Texans
Source: Greater AustinChamber
EC-3

18.8%
29.0% 28.7%
18.2%
5.3%
30.1%28.7%
23.9%
12.9%
4.4%
No H.S. Diploma H.S. Graduate Some College Bachelor Degree Grad/Prof Degree
2000 2040
Projected % of Texas Population Ages 18 to 65 by Educational Attainment
* Projections are shown for the 1.0 scenario
Without Systemic Change, Attainment will Drop Even More
EC-4Source: State Demographer Steve Murdock; http://txsdc.utsa.edu/tpepp/2006projections/summary/
Represents a 6.2% drop in bachelors and above degrees
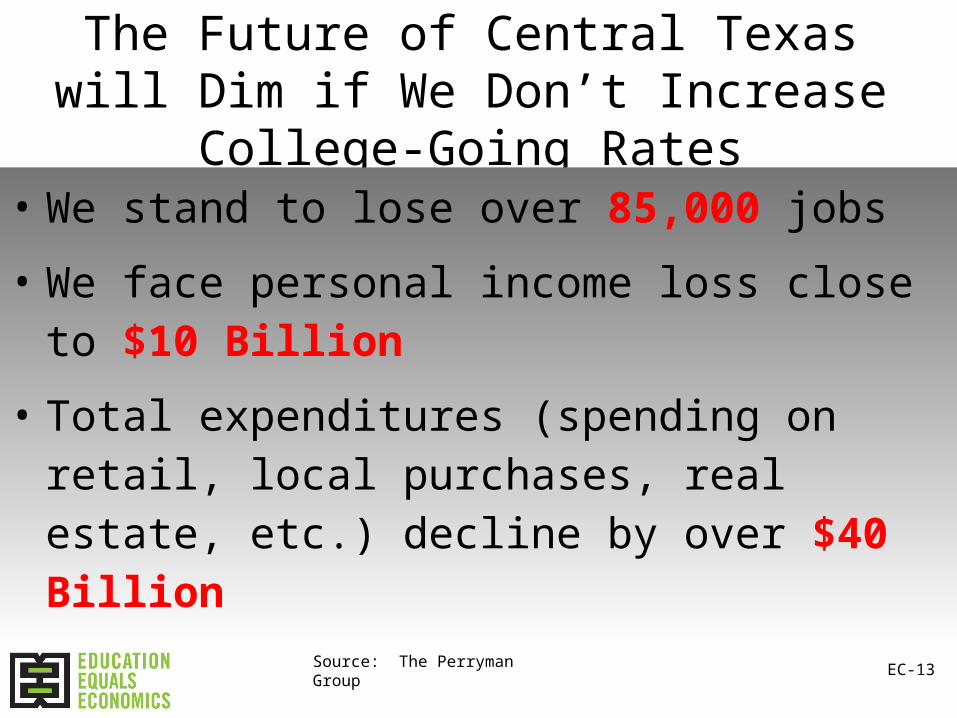
The Future of Central Texas will Dim if We Don’t Increase College-Going Rates
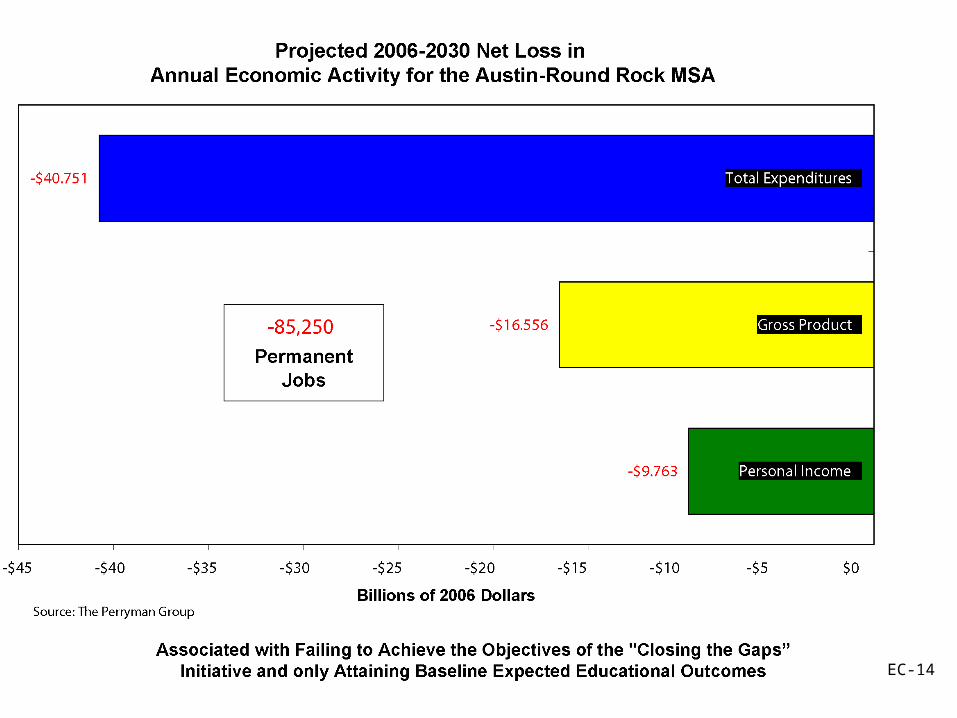
• We stand to lose over 85,000 jobs
• We face personal income loss close to $10 Billion
• Total expenditures (spending on retail, local purchases, real estate, etc.) decline by over $40 Billion
Source: The Perryman Group EC-13
EC-14
The Demographics of Change
-40.0%
-20.0%
0.0%
20.0%
40.0%
60.0%
80.0%
100.0%
120.0%
140.0%
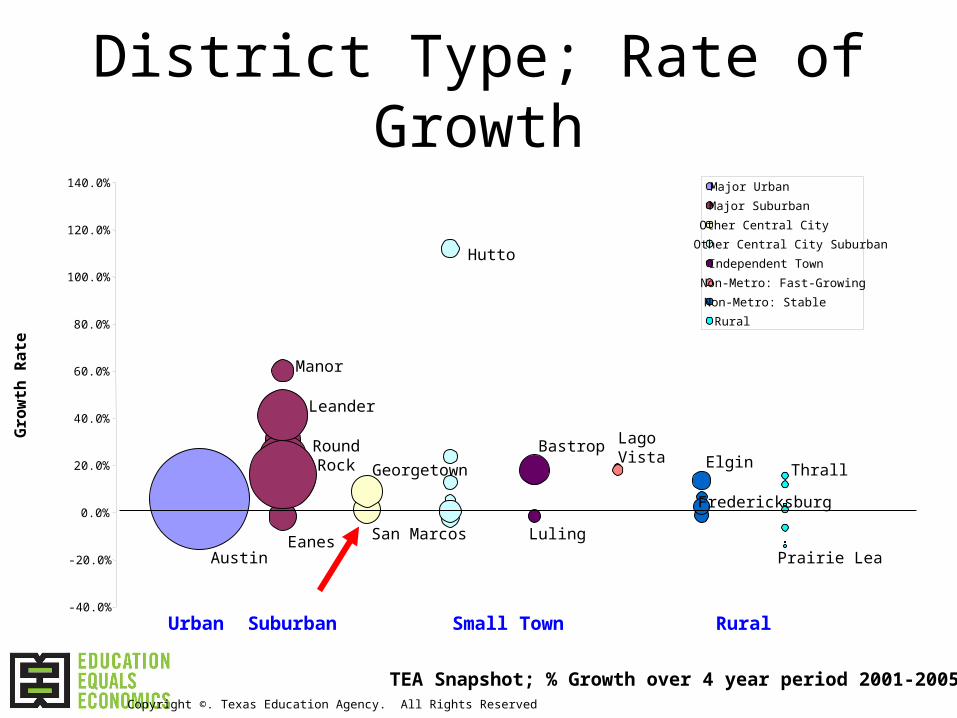
Community Type
Gro
wth
Ra
te
Major Urban
Major Suburban
Other Central City
Other Central City Suburban
Independent Town
Non-Metro: Fast-Growing
Non-Metro: Stable
Rural
District Type; Rate of Growth
Manor
Austin
RoundRock Elgin
Hutto
EanesPrairie Lea
Bastrop
Urban Small TownSuburban Rural
Leander
ThrallGeorgetown
Fredericksburg
LagoVista
LulingSan Marcos
TEA Snapshot; % Growth over 4 year period 2001-2005Copyright ©. Texas Education Agency. All Rights Reserved
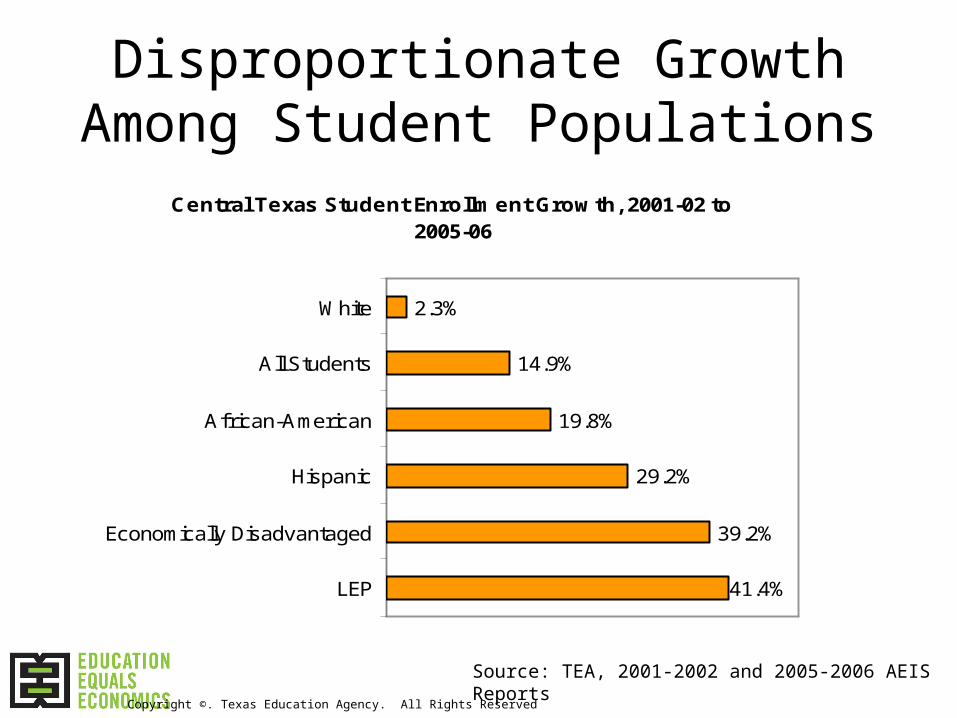
Central Texas Student Enrollment Growth, 2001-02 to 2005-06
39.2%
29.2%
19.8%
14.9%
2.3%
41.4%LEP
Economically Disadvantaged
Hispanic
African-American
All Students
White
Disproportionate Growth Among Student Populations
Source: TEA, 2001-2002 and 2005-2006 AEIS Reports
Copyright ©. Texas Education Agency. All Rights Reserved
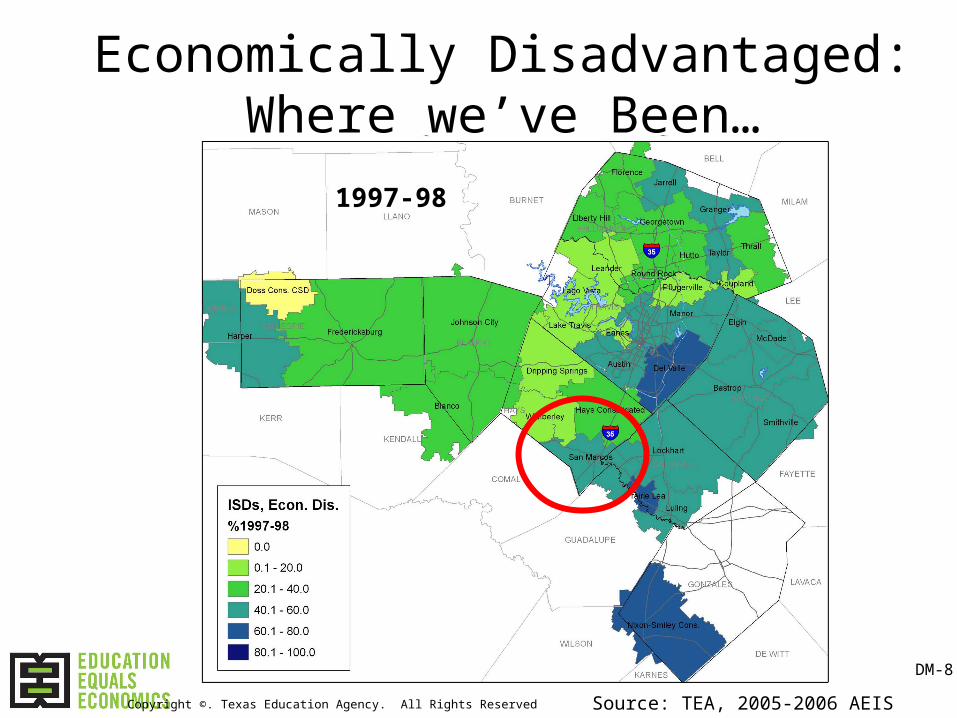
Economically Disadvantaged:Where we’ve Been…
Source: TEA, 2005-2006 AEIS Reports
1997-98
DM-8
Copyright ©. Texas Education Agency. All Rights Reserved
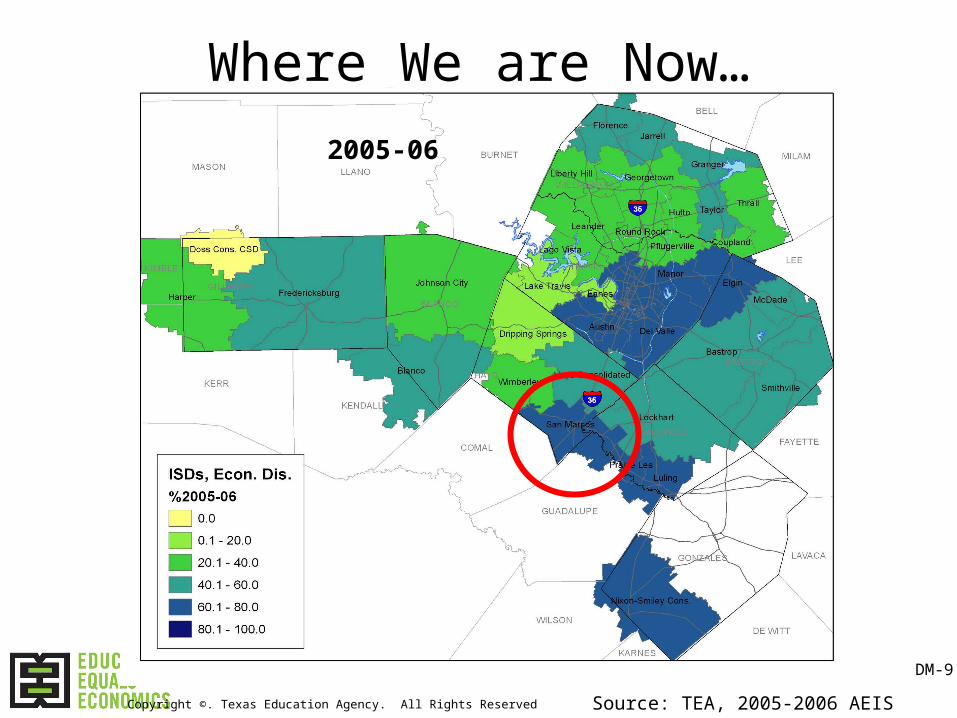
Where We are Now…
2005-06
Source: TEA, 2005-2006 AEIS Reports
DM-9
Copyright ©. Texas Education Agency. All Rights Reserved
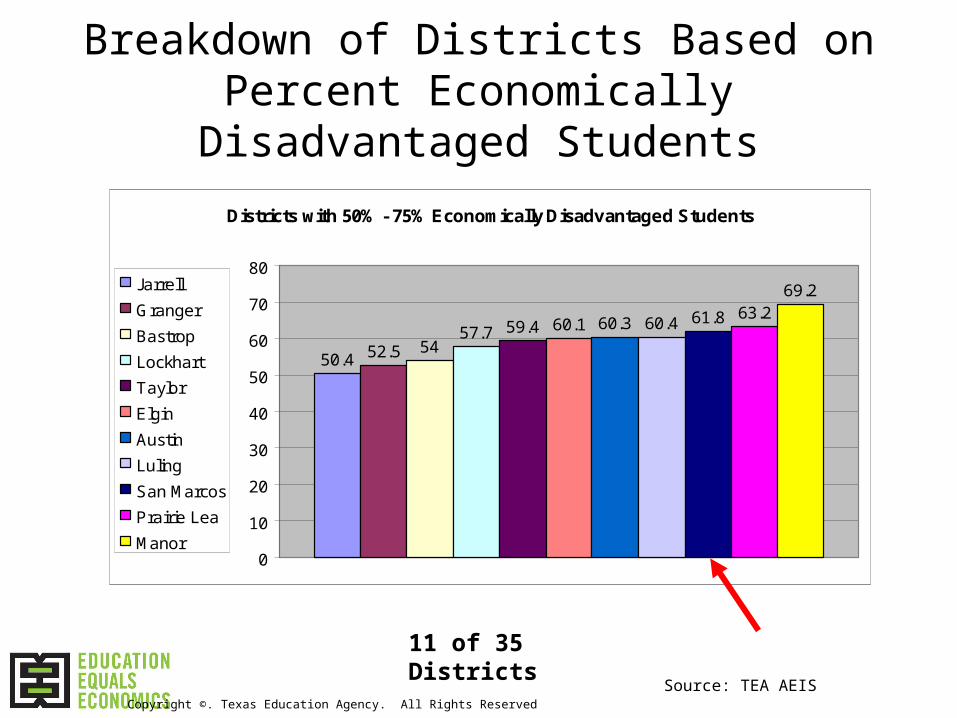
Breakdown of Districts Based on Percent Economically Disadvantaged Students
Districts with 50% - 75% Economically Disadvantaged Students
50.4 52.5 5457.7 59.4 60.1 60.3 60.4 61.8 63.2
69.2
0
10
20
30
40
50
60
70
80Jarrell
Granger
Bastrop
Lockhart
Taylor
Elgin
Austin
Luling
San Marcos
Prairie Lea
Manor
Source: TEA AEIS
11 of 35 Districts
Copyright ©. Texas Education Agency. All Rights Reserved
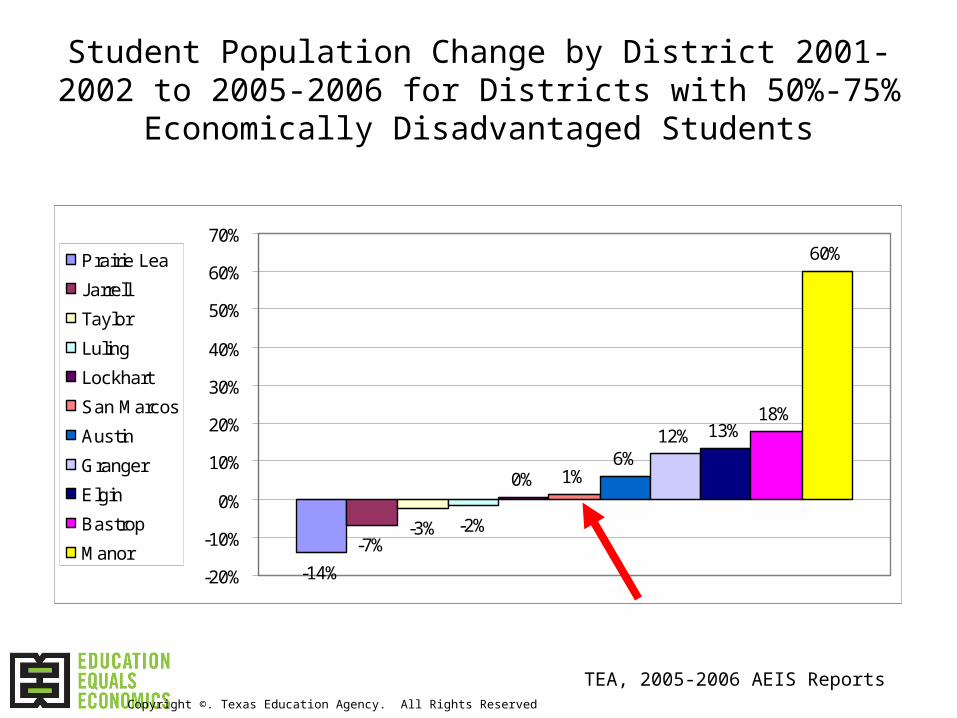
Student Population Change by District 2001-2002 to 2005-2006 for Districts with 50%-75% Economically
Disadvantaged Students
-14%
-7%-3% -2%
0% 1%6%
12% 13%18%
60%
-20%
-10%
0%
10%
20%
30%
40%
50%
60%
70%Prairie Lea
Jarrell
Taylor
Luling
Lockhart
San Marcos
Austin
Granger
Elgin
Bastrop
Manor
TEA, 2005-2006 AEIS ReportsCopyright ©. Texas Education Agency. All Rights Reserved
The Student Experience: K – 12 Highlights
• Findings and Trends
• Achievement Gap: Problems and Progress
• Math & Science: Not on Target
• Limited English Proficient Students: Different Approaches
• Drop Outs: The Central Texas Picture

Disparities Between Math and ELA at Exit Level TAKS
Percent Passing ELA and Math Exit Level TAKS, 2006
40
50
60
70
80
90
100
Del Valle Bastrop Austin SanMarcos
SmallAVERAGE
MediumAVERAGE
Manor RoundRock
Eanes
Per
cen
t
ELA
Math
7 Target Districts; Averages of Small and Medium
Source: TEA AEIS Reports Copyright ©. Texas Education Agency. All Rights Reserved

Source: TEA, 2005-2006 AEIS Reports
Central Texas 2005 High School Graduation Rate
Source: TEA Division of Performance Reporting, Ad-hoc Report
K12-15
Copyright ©. Texas Education Agency. All Rights Reserved
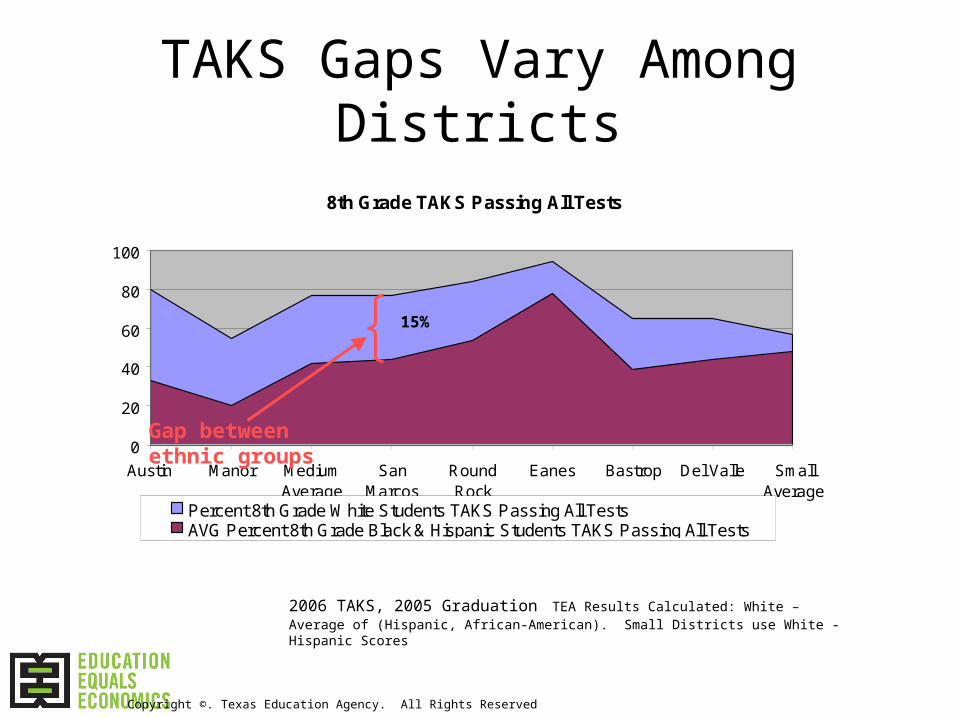
TAKS Gaps Vary Among Districts
8th Grade TAKS Passing All Tests
0
20
40
60
80
100
Austin Manor MediumAverage
SanMarcos
RoundRock
Eanes Bastrop Del Valle SmallAverage
Percent 8th Grade White Students TAKS Passing All TestsAVG Percent 8th Grade Black & Hispanic Students TAKS Passing All Tests
2006 TAKS, 2005 Graduation TEA Results Calculated: White – Average of (Hispanic, African-American). Small Districts use White - Hispanic Scores
Gap betweenethnic groups
15%
Copyright ©. Texas Education Agency. All Rights Reserved
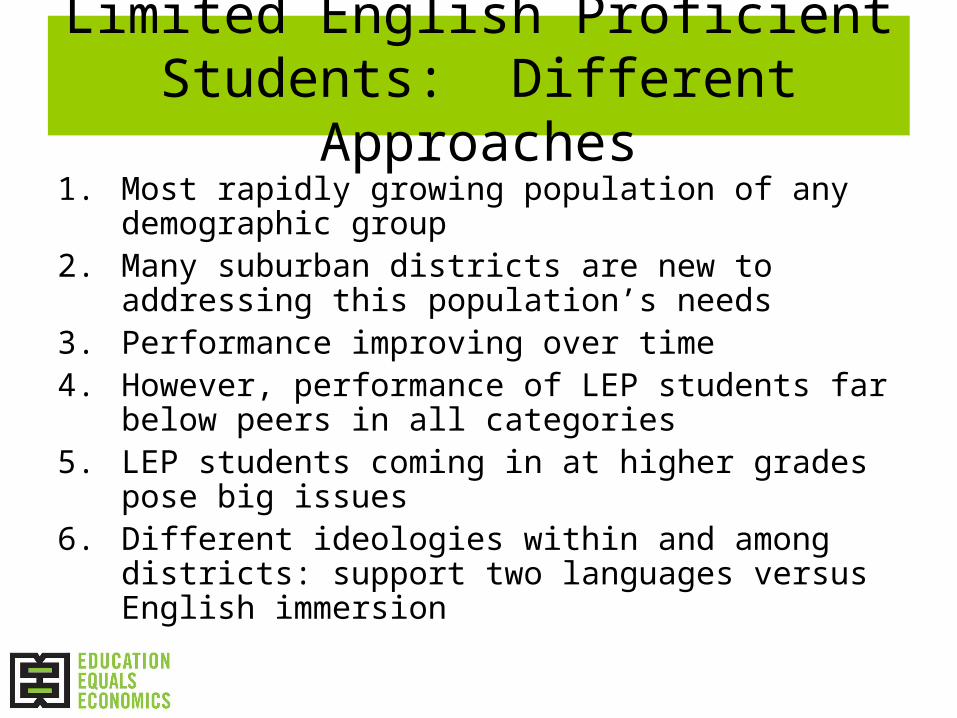
Limited English Proficient Students: Different Approaches
1. Most rapidly growing population of any demographic group
2. Many suburban districts are new to addressing this population’s needs
3. Performance improving over time4. However, performance of LEP students far below
peers in all categories5. LEP students coming in at higher grades pose big
issues6. Different ideologies within and among districts: support
two languages versus English immersion

Percent of Students Classified as Limited English Proficient, Grouped by District Size
1.2%
5.2% 5.8%
12.7%
4.9%7.3% 7.7%
15.4%
Charter Small Medium Large
2001-2002 LEP
2005-2006 LEP
Source: TEA 2001-2002 and 2005-2006 AEIS Reports
LEP Population Experiencing Significant Growth
San Marcos LEP Population grew 16% over the past 5 years
Source: TEA, 2001-2002 and 2005-2006 AEIS ReportsCopyright ©. Texas Education Agency. All Rights Reserved
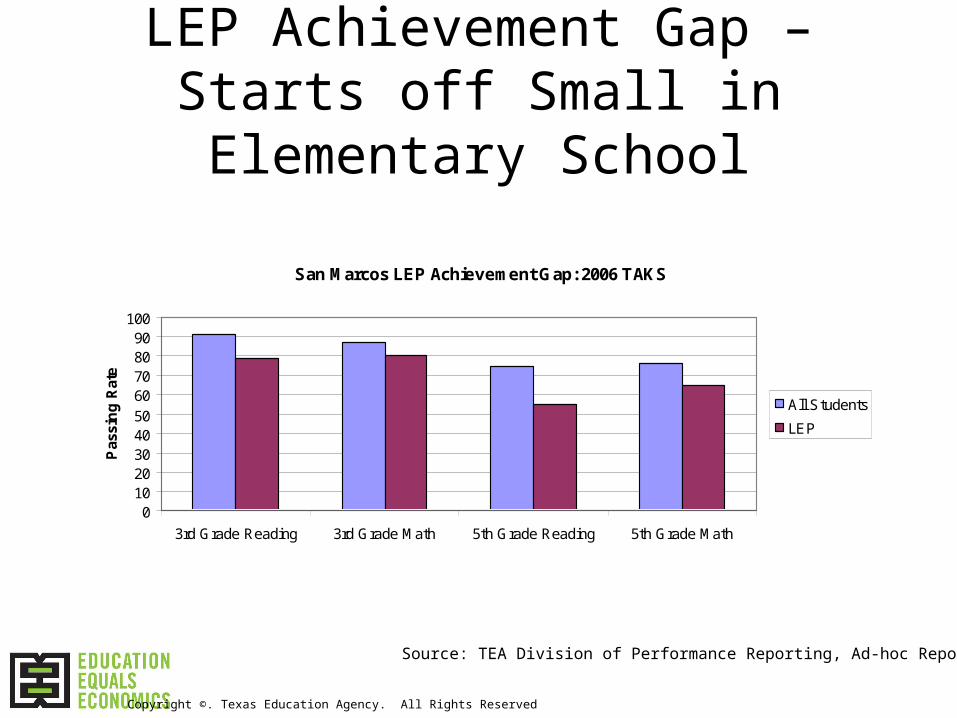
LEP Achievement Gap – Starts off Small in Elementary School
San Marcos LEP Achievement Gap: 2006 TAKS
0102030405060708090
100
3rd Grade Reading 3rd Grade Math 5th Grade Reading 5th Grade Math
Pas
sin
g R
ate
All Students
LEP
Source: TEA Division of Performance Reporting, Ad-hoc Report
Copyright ©. Texas Education Agency. All Rights Reserved
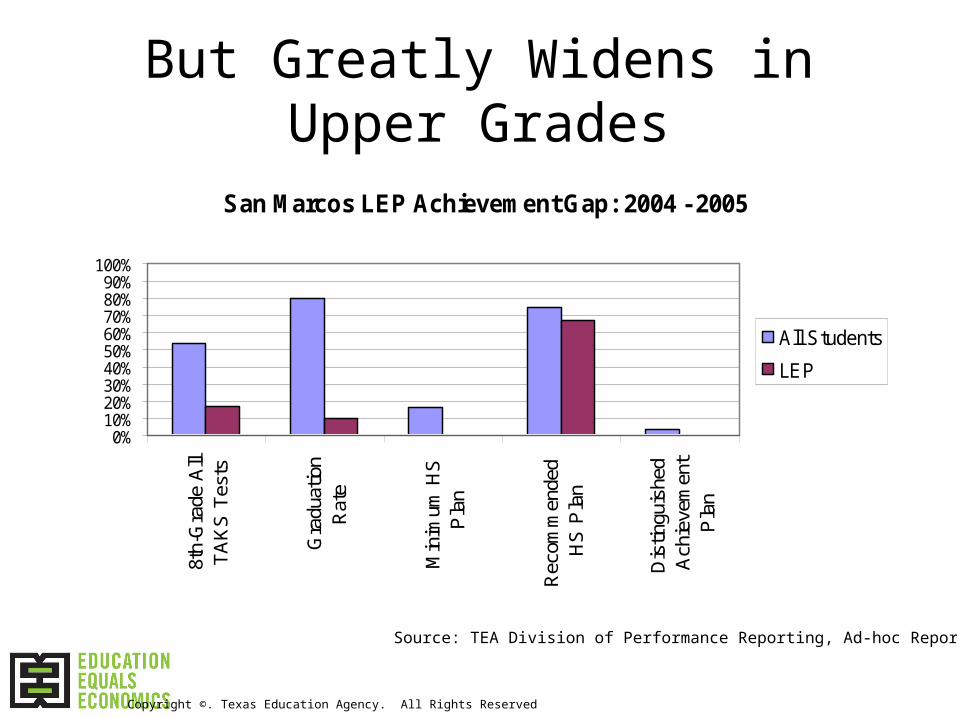
But Greatly Widens in Upper Grades
Source: TEA Division of Performance Reporting, Ad-hoc Report
San Marcos LEP Achievement Gap: 2004 - 2005
0%10%20%30%40%50%60%70%80%90%
100%
8th-
Gra
de A
llT
AK
S T
ests
Gra
duat
ion
Rat
e
Min
imum
HS
Pla
n
Rec
omm
ende
dH
S P
lan
Dis
tingu
ishe
dA
chie
vem
ent
Pla
n
All Students
LEP
Copyright ©. Texas Education Agency. All Rights Reserved
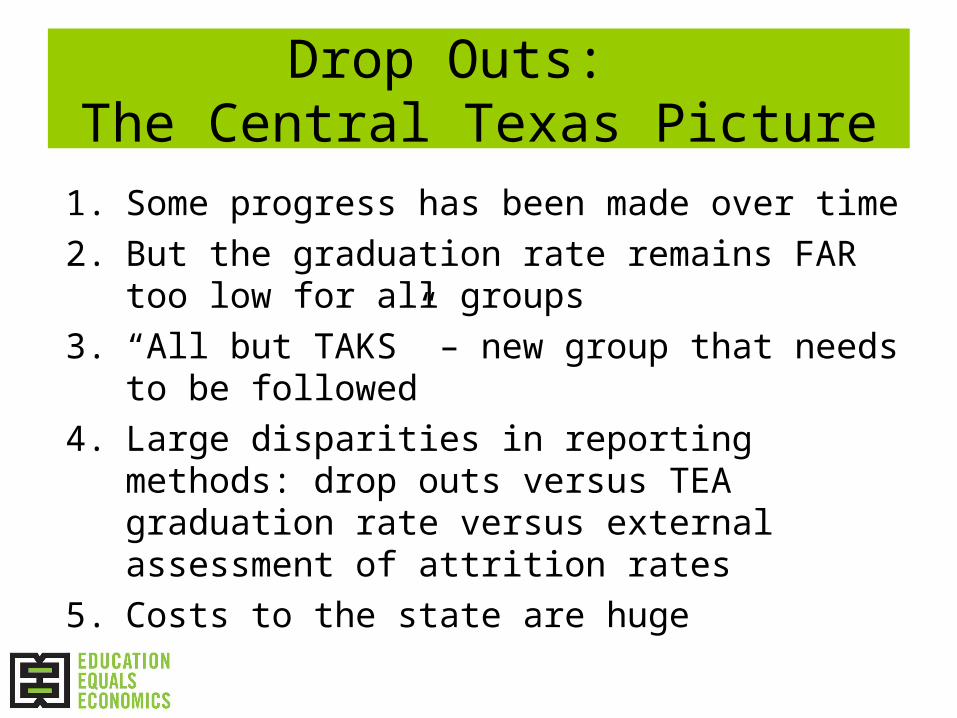
Drop Outs: The Central Texas Picture
1. Some progress has been made over time
2. But the graduation rate remains FAR too low for all groups
3. “All but TAKS” – new group that needs to be followed
4. Large disparities in reporting methods: drop outs versus TEA graduation rate versus external assessment of attrition rates
5. Costs to the state are huge
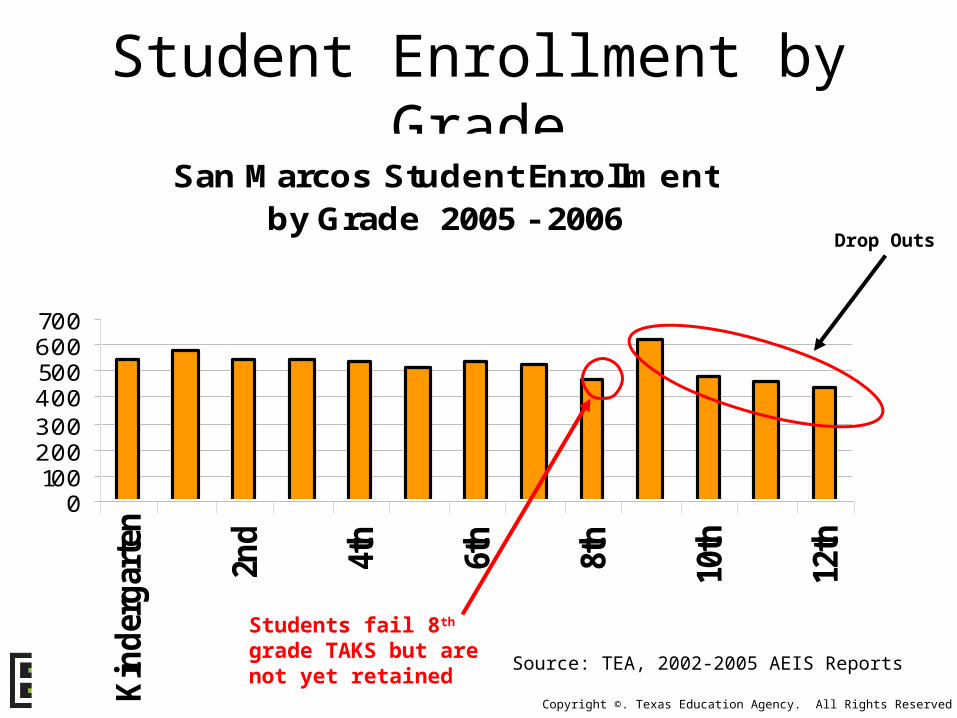
Student Enrollment by GradeSan Marcos Student Enrollment
by Grade 2005 - 2006
0100200300400500600700
Kin
der
gar
ten
2nd
4th
6th
8th
10th
12th
Drop Outs
Source: TEA, 2002-2005 AEIS Reports
Students fail 8th grade TAKS but are not yet retained
Copyright ©. Texas Education Agency. All Rights Reserved
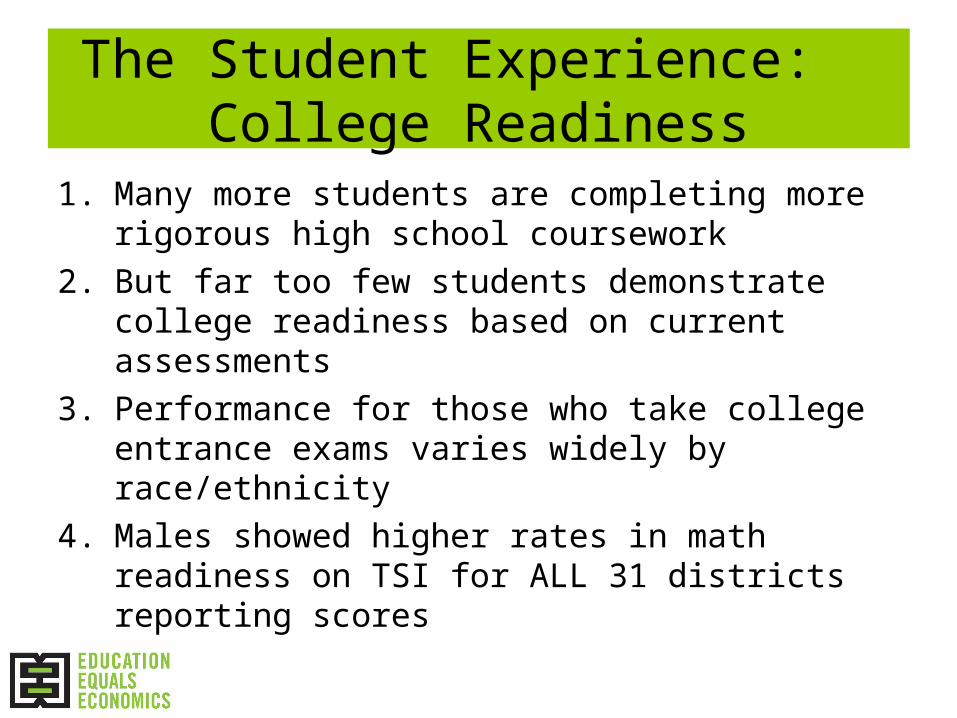
The Student Experience: College Readiness
1. Many more students are completing more rigorous high school coursework
2. But far too few students demonstrate college readiness based on current assessments
3. Performance for those who take college entrance exams varies widely by race/ethnicity
4. Males showed higher rates in math readiness on TSI for ALL 31 districts reporting scores
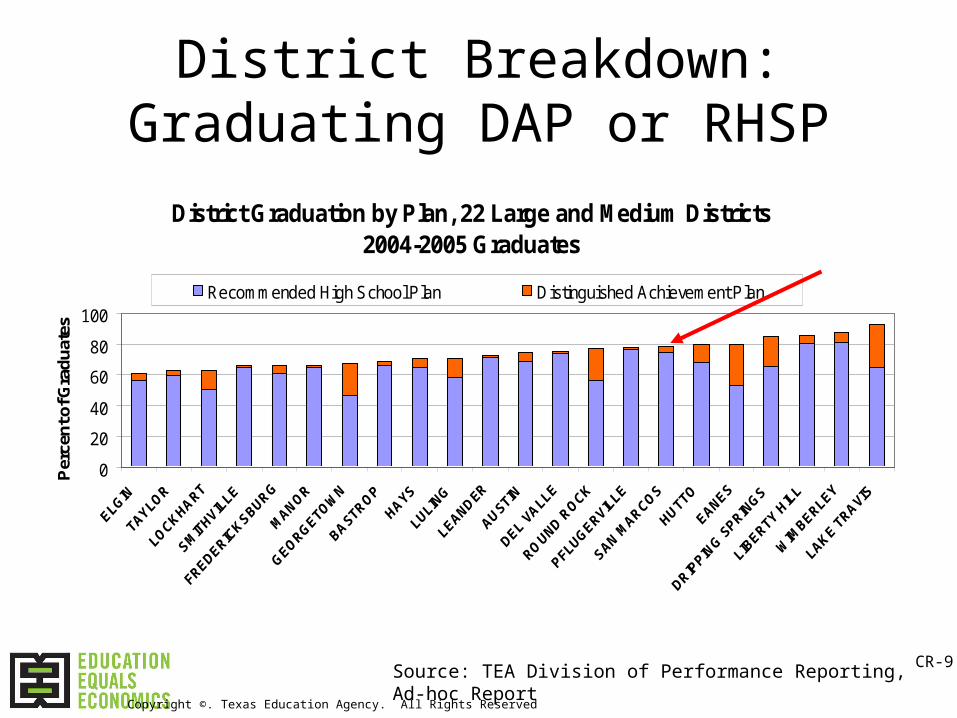
District Breakdown: Graduating DAP or RHSP
District Graduation by Plan, 22 Large and Medium Districts2004-2005 Graduates
0
20
40
60
80
100
Per
cen
t of G
rad
uat
es
Recommended High School Plan Distinguished Achievement Plan
Source: TEA Division of Performance Reporting, Ad-hoc ReportCR-9
Copyright ©. Texas Education Agency. All Rights Reserved

Note: Eanes ISD not included because not all SAT/ACT data available
Source: 2005-06 AEIS Report and the Top 10% of state in grad rates
High School Plan May Not Correlate to College Enrollment
Comparison of 7 Target Districts with Texas Districts in Top 10% for College Matriculation
0%10%20%30%40%50%60%70%80%90%
Grads w/ RHSPor DAP
Grads Found inHigher ED
Grads TakingSAT or ACT
Grads AboveCriterion
Austin
Bastrop
Del Valle
Manor
Round Rock
San Marcos
Top 10 %Average
CR-10
Copyright ©. Texas Education Agency. All Rights Reserved
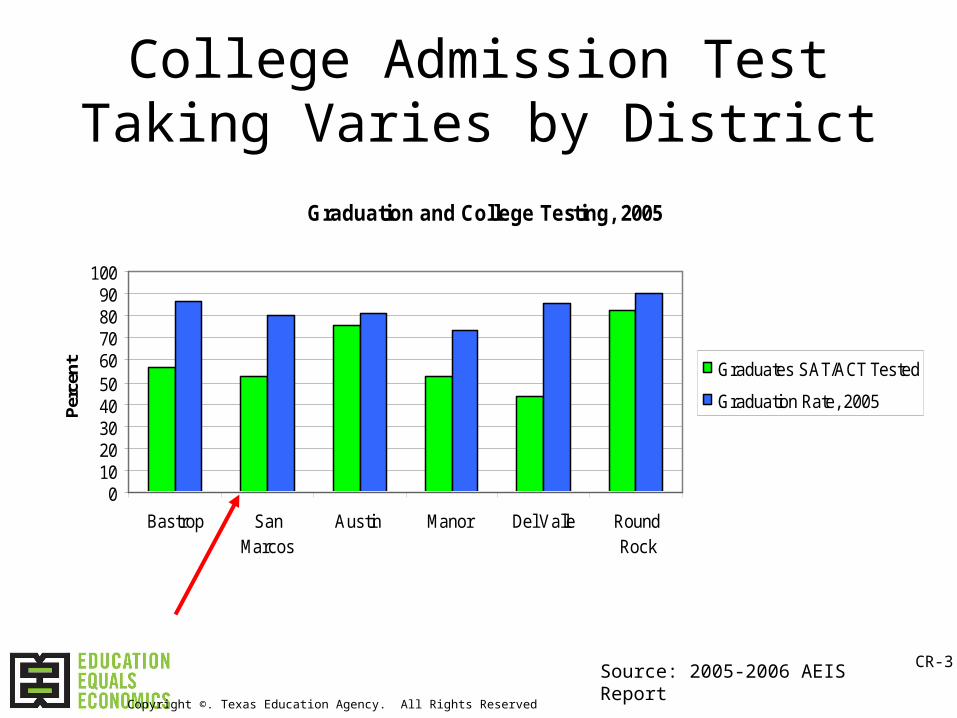
College Admission Test Taking Varies by District
Graduation and College Testing, 2005
0102030405060708090
100
Bastrop SanMarcos
Austin Manor Del Valle RoundRock
Per
cen
t Graduates SAT/ACT Tested
Graduation Rate, 2005
Source: 2005-2006 AEIS ReportCR-3
Copyright ©. Texas Education Agency. All Rights Reserved
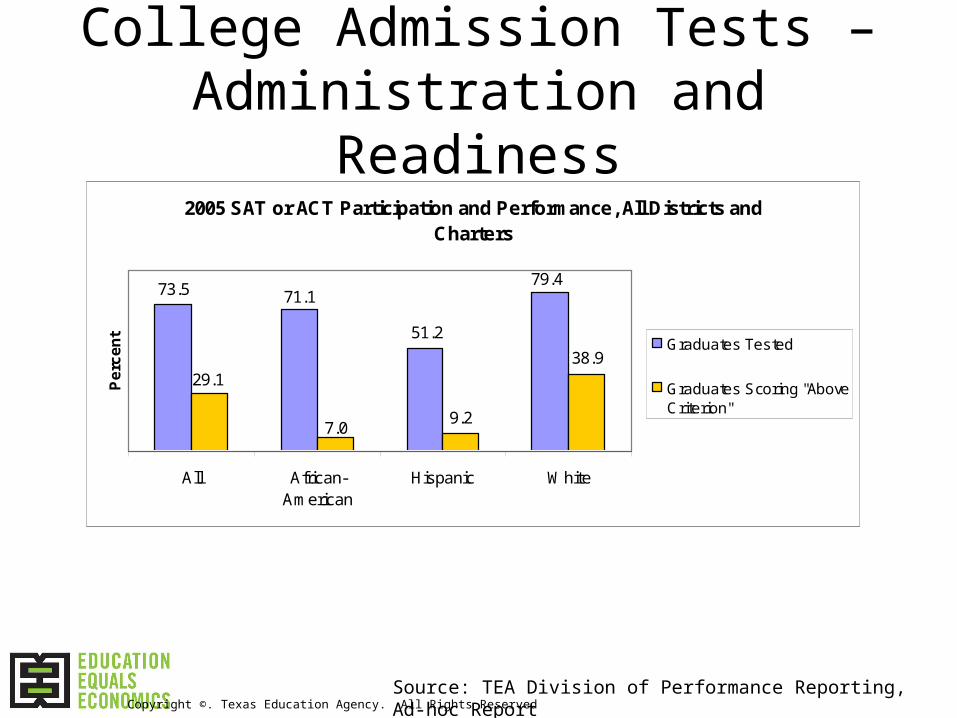
College Admission Tests – Administration and Readiness
2005 SAT or ACT Participation and Performance, All Districts and Charters
9.2
38.9
73.5 71.1
51.2
79.4
29.1
7.0
All African-American
Hispanic White
Pe
rce
nt
Graduates Tested
Graduates Scoring "AboveCriterion"
Source: TEA Division of Performance Reporting, Ad-hoc ReportCopyright ©. Texas Education Agency. All Rights Reserved
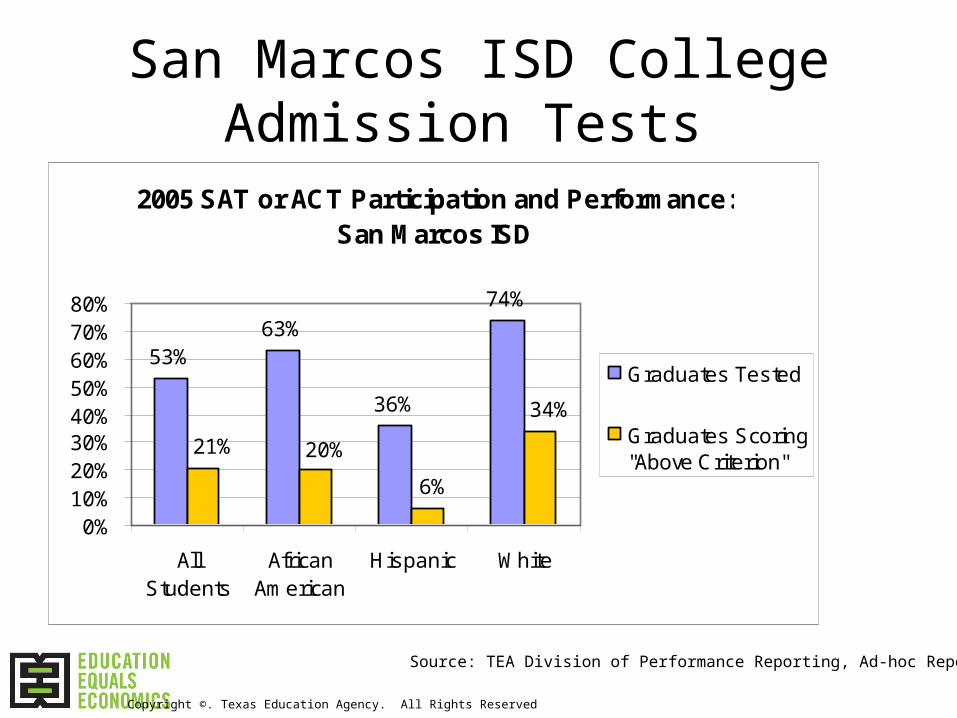
San Marcos ISD College Admission Tests
2005 SAT or ACT Participation and Performance: San Marcos ISD
53%63%
36%
74%
20%21%
6%
34%
0%10%20%30%40%50%60%70%80%
AllStudents
AfricanAmerican
Hispanic White
Graduates Tested
Graduates Scoring"Above Criterion"
Source: TEA Division of Performance Reporting, Ad-hoc Report
Copyright ©. Texas Education Agency. All Rights Reserved

TSI Performance Rates on All Standards are LowTarget Texas Success Initiative Pass Rates 2003
010
2030
405060
7080
90100
Austin ISD BastropISD
Del ValleISD
Eanes ISD Manor ISD RoundRock ISD
SanMarcosCISD
Rate of Passing
% Met All Standards (of grads) % Met Math Standards (of tested)
% Met Writing Standards (of tested) %Met Reading Standards (of tested)
Note: TSI is the standard used to determine readiness to enroll in higher education without developmental coursework
http://www.thecb.state.tx.us/reports/xls/1156.xls
CR-12
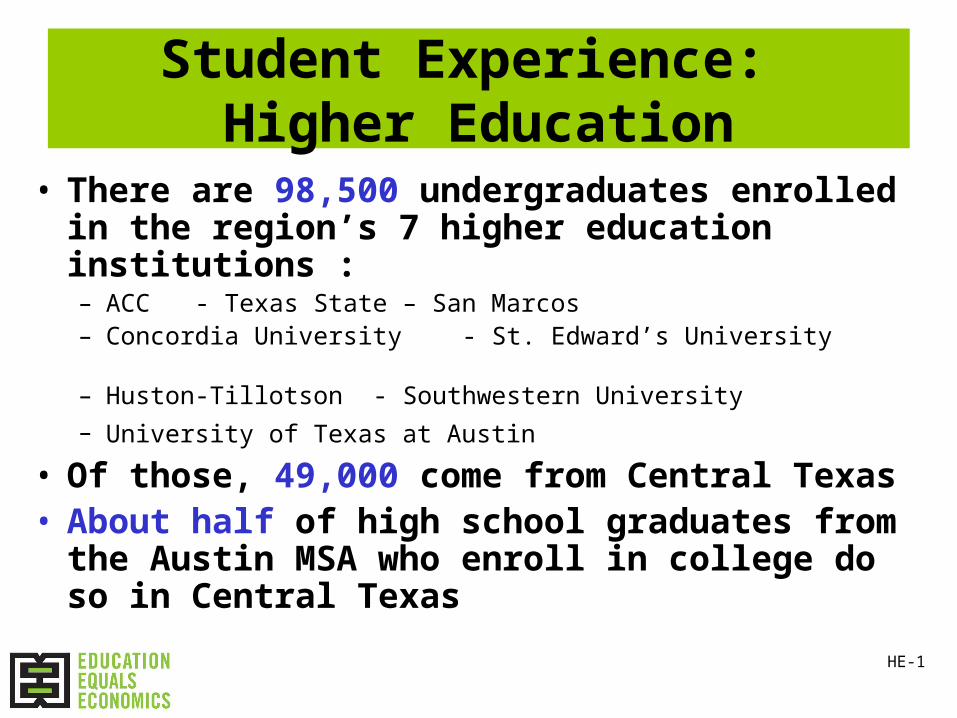
Student Experience: Higher Education
• There are 98,500 undergraduates enrolled in the region’s 7 higher education institutions :– ACC - Texas State – San Marcos– Concordia University - St. Edward’s University– Huston-Tillotson - Southwestern University
– University of Texas at Austin
• Of those, 49,000 come from Central Texas• About half of high school graduates from the
Austin MSA who enroll in college do so in Central Texas
HE-1
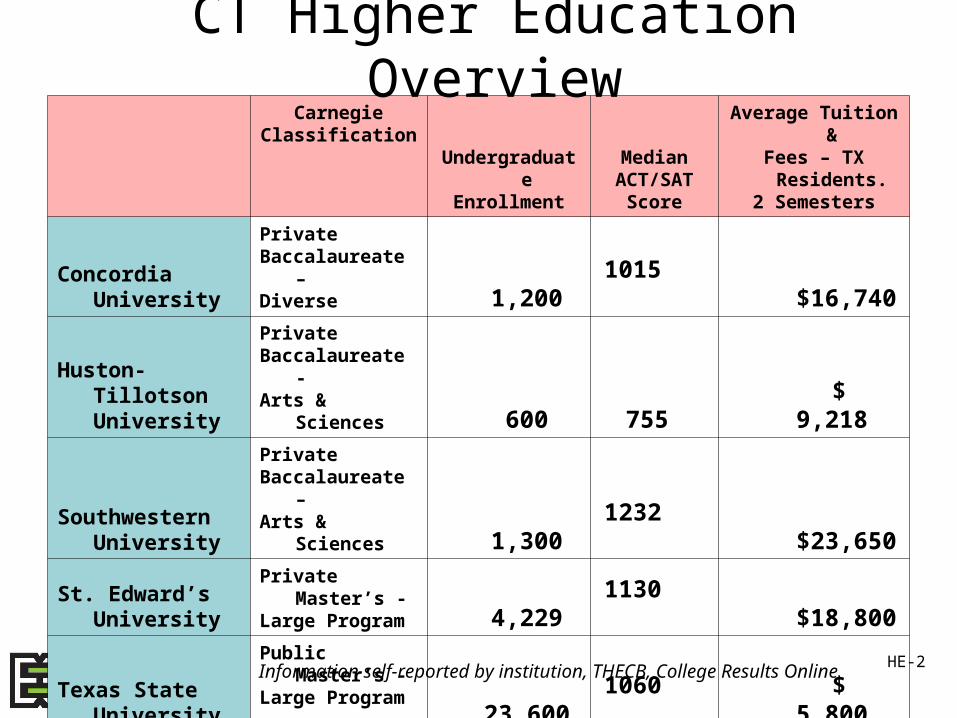
CarnegieClassification Undergraduate
Enrollment
MedianACT/SAT
Score
Average Tuition &Fees – TX Residents.
2 Semesters
Concordia University
PrivateBaccalaureate –Diverse 1,200 1015 $16,740
Huston-Tillotson University
PrivateBaccalaureate -Arts & Sciences 600 755 $ 9,218
Southwestern University
PrivateBaccalaureate –Arts & Sciences 1,300 1232 $23,650
St. Edward’s University
Private Master’s -Large Program 4,229 1130 $18,800
Texas State University
Public Master’s -Large Program 23,600 1060 $ 5,800
University of TexasPublic Research -Very High Level 37,000 1235 $ 8,788
Austin Community College
Public Associates - Diverse 33,200 NA $ 1,600
CT Higher Education Overview
Information self-reported by institution, THECB, College Results OnlineHE-2
0200400600800
100012001400160018002000
ACC
Texas
Sta
te S
an M
arco
s
UTSA
Blinn
Colleg
e
UT Aus
tin
Concord
ia
Huston
Tillotso
n
St. Edwar
d's
South
western
Nu
mb
er o
f st
ud
ents
-40%-20%0%20%40%60%80%100%120%140%
Per
cen
t C
han
ge
'01-
05
Number of CT Students Enrolled Percent Change from 01-05
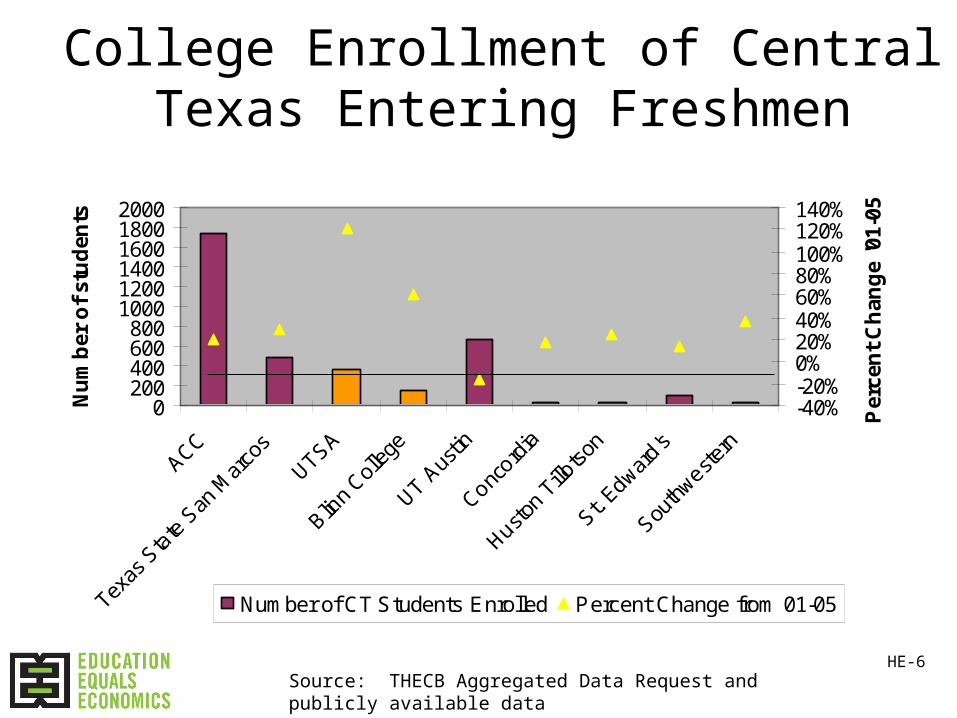
College Enrollment of Central Texas Entering Freshmen
Source: THECB Aggregated Data Request and publicly available data
HE-6
Higher Education Matriculation
1. About half of Central Texas students matriculate into college in Texas
2. About half of those go to Central Texas colleges
3. To meet the “Closing the Gaps” goals, we need 20K more students in higher education by 2010; almost 40K by 2015
4. More and more of our students are “non-traditional” – not 18-24 year old full time college goers

Ethnic Breakdown of CT Grads NOT Quickly Matriculating
FY1998-2005: Percentage Non-Matriculating Graduates by Ethnicity; Fall Following H.S. Graduation
0%
10%
20%
30%
40%
50%
60%
70%
80%
1998-2000 2001-2003 2004-2005
Cohort
Pe
rce
nt
No
n-M
atr
icu
lati
ng
Afr. Amer
Asian/Native Amer.
Hispanic
White
THECB Requested Aggregate Data
Gaps Still Exist But Closing Slightly Across Ethnicity/Race
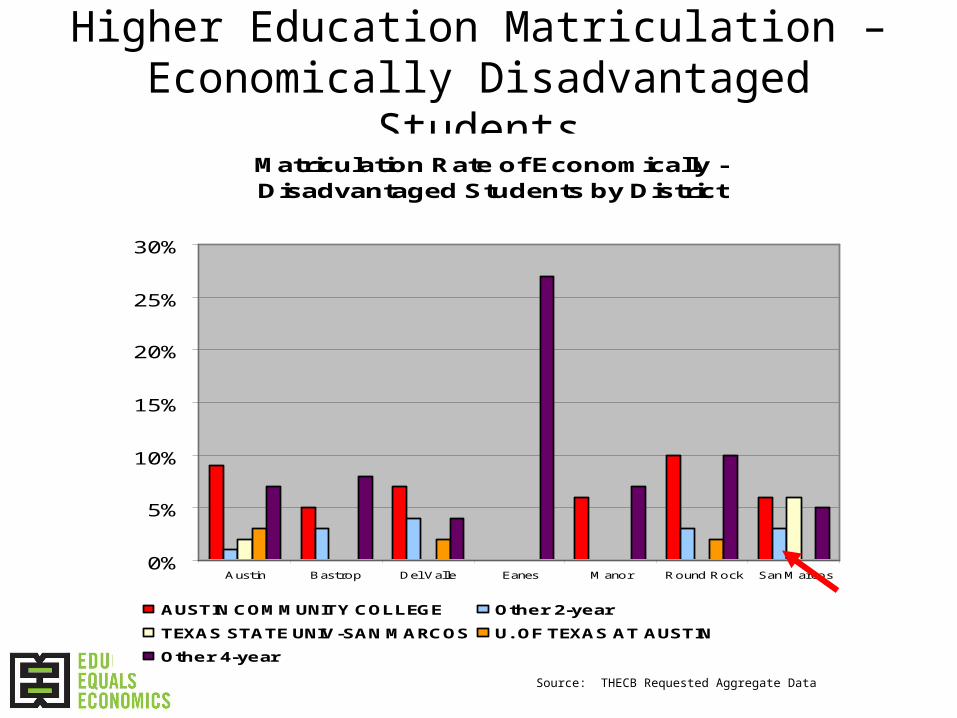
Higher Education Matriculation –Economically Disadvantaged Students
Matriculation Rate of Economically -Disadvantaged Students by District
0%
5%
10%
15%
20%
25%
30%
Austin Bastrop Del Valle Eanes Manor Round Rock San Marcos
AUSTIN COMMUNITY COLLEGE Other 2-year
TEXAS STATE UNIV-SAN MARCOS U. OF TEXAS AT AUSTIN
Other 4-year
Source: THECB Requested Aggregate Data
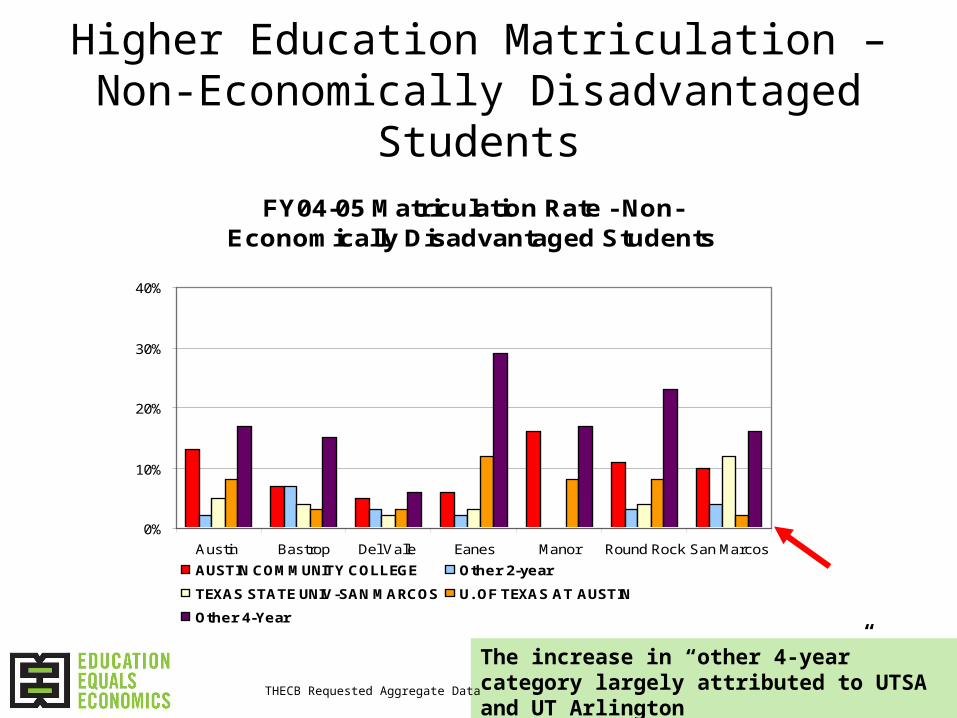
Higher Education Matriculation –Non-Economically Disadvantaged Students
The increase in “other 4-year” category largely attributed to UTSA and UT Arlington THECB Requested Aggregate Data
FY04-05 Matriculation Rate - Non-Economically Disadvantaged Students
0%
10%
20%
30%
40%
Austin Bastrop Del Valle Eanes Manor Round Rock San Marcos
AUSTIN COMMUNITY COLLEGE Other 2-year
TEXAS STATE UNIV-SAN MARCOS U. OF TEXAS AT AUSTIN
Other 4-Year

College Remediation Varies Widelyby District
Percent Students Requiring Remediation by District 98-04
0%
10%
20%
30%
40%
50%
60%
98-00
2001-03
2004-05
THECB: Aggregated Data Request
Includes all large and E3 target districts
DE-4
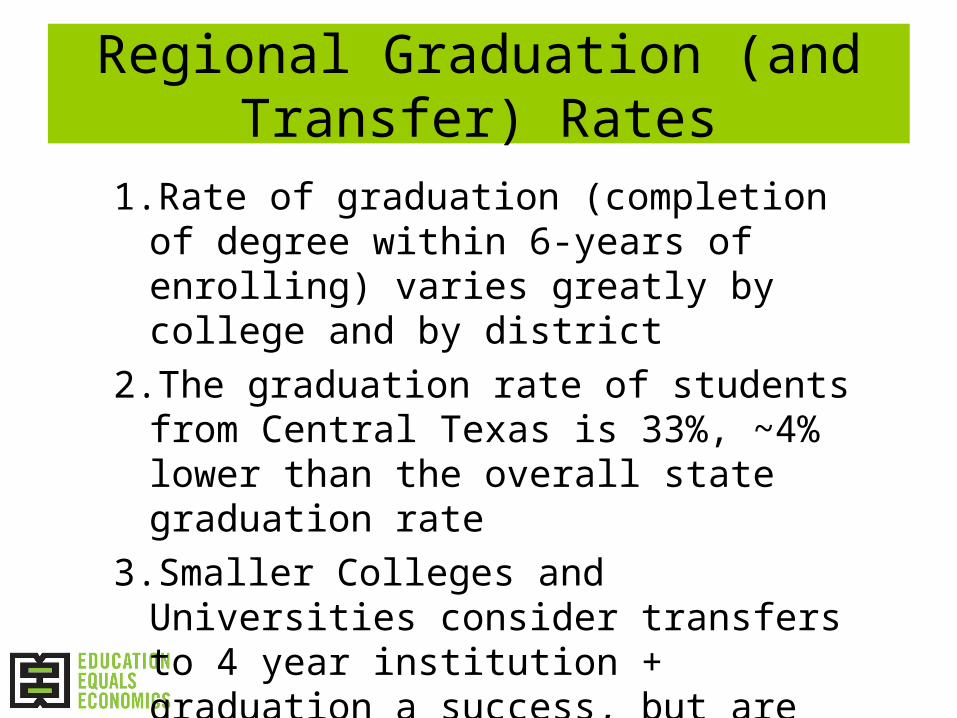
Regional Graduation (and Transfer) Rates
1.Rate of graduation (completion of degree within 6-years of enrolling) varies greatly by college and by district
2.The graduation rate of students from Central Texas is 33%, ~4% lower than the overall state graduation rate
3.Smaller Colleges and Universities consider transfers to 4 year institution + graduation a success, but are unable to report these students as such

6 Year Graduation Rates
Undergraduate Enrollment
Percent of StartingUndergraduates who
Graduate
Rate including Transfers Out
Graduating
Concordia University 1,200 31.5% ?
Huston-Tillotson University 600 15.8% ?
Southwestern University 1,300 75.1% ?
St. Edward’s University 4,229 52.2% ?
Texas State University 23,600 46% 53%
University of Texas 37,000 74% 74.8%
Austin Community College 33,200 See next tableInformation self-reported by institution, graduation rate from US Dept. of Ed. IntegratedPost-Secondary Education Data System (Privates), & THECB (Publics)1998-2004 6-Year Graduation Rate
http://www.thecb.state.tx.us/Reports/PDF/1248.PDF GR-2

ACC Graduation & Transfer Graduation Rates
Degree or Status Graduation Rate
Baccalaureate or aboveGraduated with at least a BA/BS from a Texas public or
private institution
27.9%
Associate 4.0%
Certificate 1.7%
Total 33.6%
THECB 1999 report based on a 6 year graduation rateGR-3
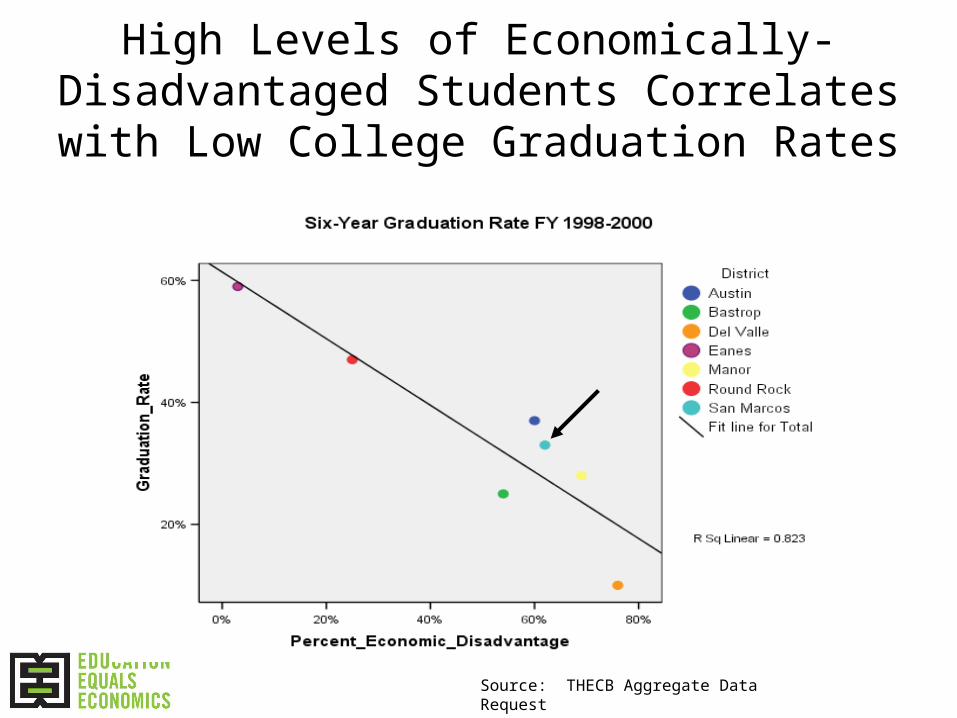
High Levels of Economically-Disadvantaged Students Correlates with Low College
Graduation Rates
Source: THECB Aggregate Data Request

Wide Variation in College Graduation Rates Across Large Districts
Six-Year Graduation Rate for 7 Target Districts FY 2001-03
30%
21%16%
48%
23%
38%
31%
0%
10%
20%
30%
40%
50%
60%
Austin ISD Bastrop ISD Del ValleISD
Eanes ISD Manor ISD Round RockISD
San MarcosISD
Source: THECB Aggregate Data Request
• CT (including A&M and UTSA) graduates more engineers now than in 2002
• Still need to increase the number of graduates in key “STEM” fields (e.g. sciences, engineering, and computer engineering)
• Health Sciences face critical shortages, particularly in nursing. Two new programs slated to come on line between 2008 and 2010.
• Industry demands are for “engineers who can communicate.” Need to still consider importance of soft skills and well-rounded critical thinkers.
Fields of Study
FS-1
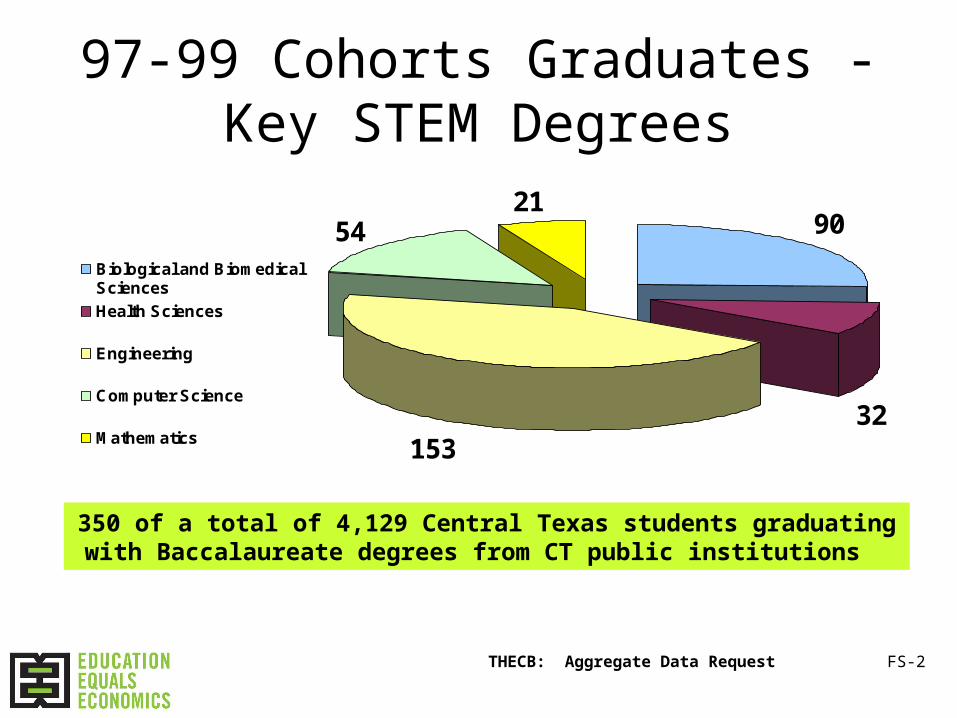
97-99 Cohorts Graduates - Key STEM Degrees
905421
32153
Biological and BiomedicalSciences
Health Sciences
Engineering
Computer Science
Mathematics
350 of a total of 4,129 Central Texas students graduating with Baccalaureate degrees from CT public institutions
THECB: Aggregate Data Request FS-2
Preliminary Recommendations
PR-1

Preliminary Recommendations (1)• K-12 Overall
– Share Snapshot with youth services organizations as means for deploying services more strategically
– Implement Chamber Progress Report in all seven target districts– Focus on leadership capacity & stability: change management,
goals prioritization, strategic planning– Consider regional strategic compensation strategy to retain key
teachers & principals
• Achievement Gaps– Hold regional deliberations on achievement gap implications for
different constituencies– Analyze and share data/lessons where similar districts show
differing gaps
PR-2
Preliminary Recommendations (2)• Limited English Proficient (LEP) Students
– Heighten awareness of implications in slowly changing districts (Biggest gaps are often where districts change slowly)
– Build on Feria work – sharing information on how to engage parents in child’s education with Spanish-speaking families
– Develop forums for sharing data/outcomes on competing approaches to bilingual education
– Standardize bilingual/LEP criteria, curriculum, evaluation
• Math/Science– Join statewide teacher quality study – Examine assignment stipends as part of strategic compensation– Expand proven summer bridge programs and team-based
coaching for math and science students– Expand proven summer bridge programs in math remediation
BEFORE fall classes commence– Support regional Science, Technology, Engineering and Math
(STEM) effortsPR-3
Preliminary Recommendations (3)
• Drop Outs– Provide a “cheat sheet” to help the community understand
dropout data and economic implications– Identify and support successful early interventions– Share best practices from innovative retention/recovery
programs (e.g. 9th grade structures, AYW, Garza)
• College Readiness– Work with the state to develop more robust college readiness
measures– Standardize college readiness assessment tools for more
consistent use– Work with THSP to spread strong high school redesign models
supporting college and career readiness
PR-4
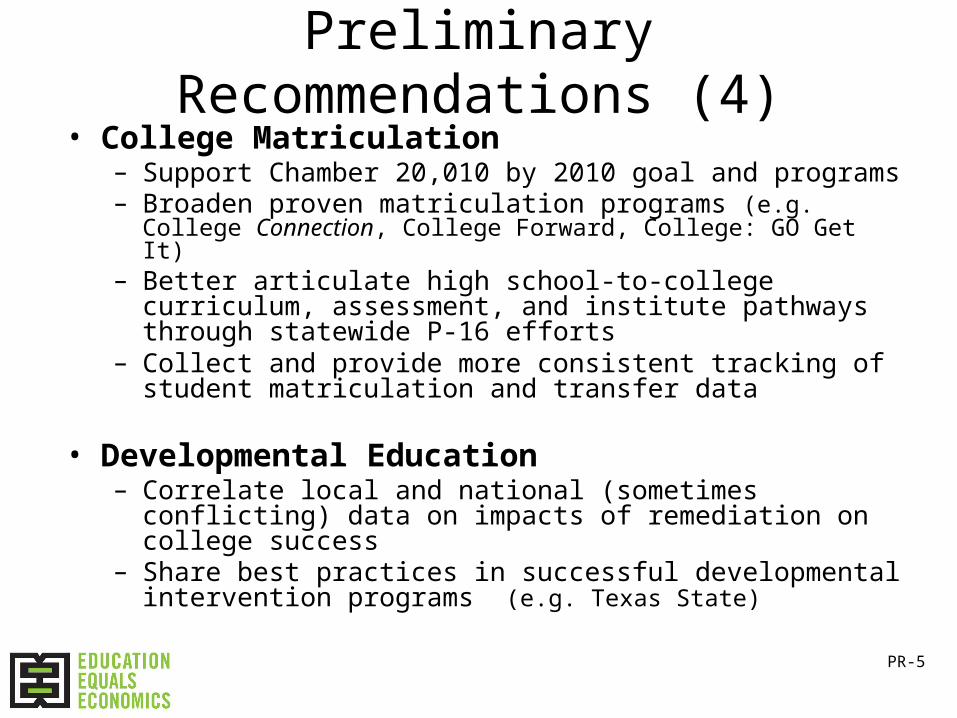
Preliminary Recommendations (4)• College Matriculation
– Support Chamber 20,010 by 2010 goal and programs– Broaden proven matriculation programs (e.g. College Connection,
College Forward, College: GO Get It)– Better articulate high school-to-college curriculum, assessment,
and institute pathways through statewide P-16 efforts– Collect and provide more consistent tracking of student
matriculation and transfer data
• Developmental Education– Correlate local and national (sometimes conflicting) data on
impacts of remediation on college success– Share best practices in successful developmental intervention
programs (e.g. Texas State)
PR-5
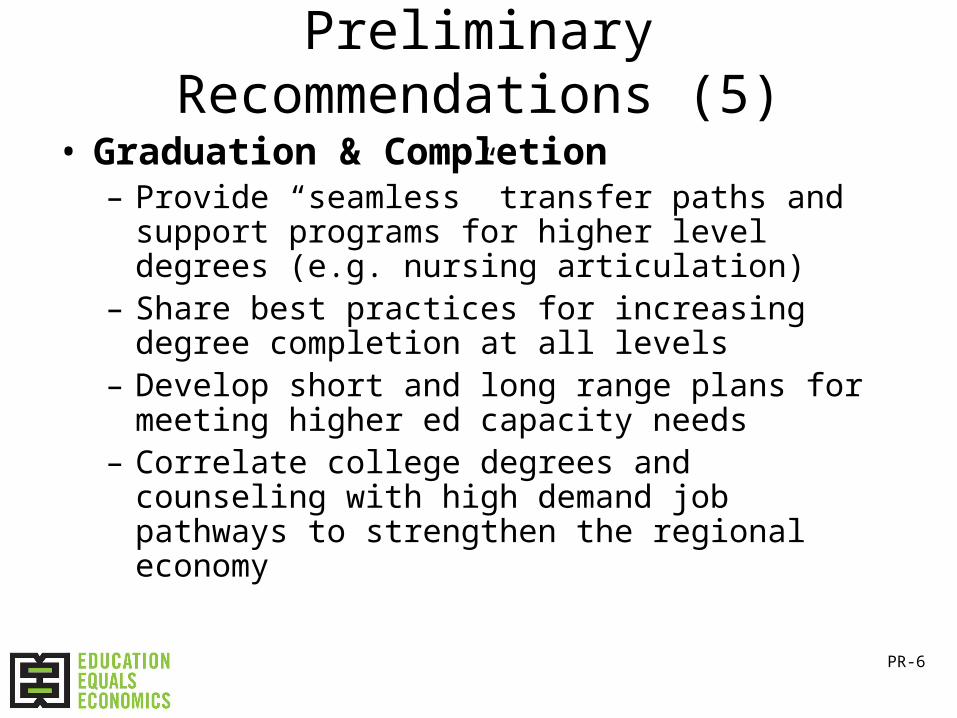
Preliminary Recommendations (5)
• Graduation & Completion– Provide “seamless” transfer paths and support
programs for higher level degrees (e.g. nursing articulation)
– Share best practices for increasing degree completion at all levels
– Develop short and long range plans for meeting higher ed capacity needs
– Correlate college degrees and counseling with high demand job pathways to strengthen the regional economy
PR-6
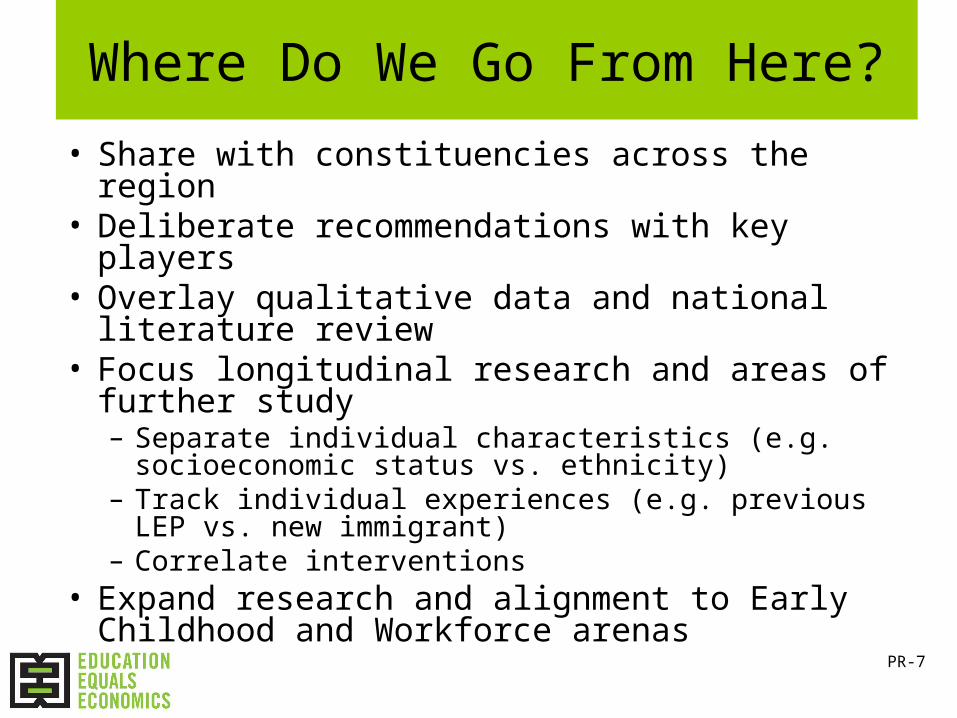
Where Do We Go From Here?
• Share with constituencies across the region• Deliberate recommendations with key players• Overlay qualitative data and national literature
review• Focus longitudinal research and areas of further
study– Separate individual characteristics (e.g.
socioeconomic status vs. ethnicity)– Track individual experiences (e.g. previous LEP vs.
new immigrant)– Correlate interventions
• Expand research and alignment to Early Childhood and Workforce arenas
PR-7
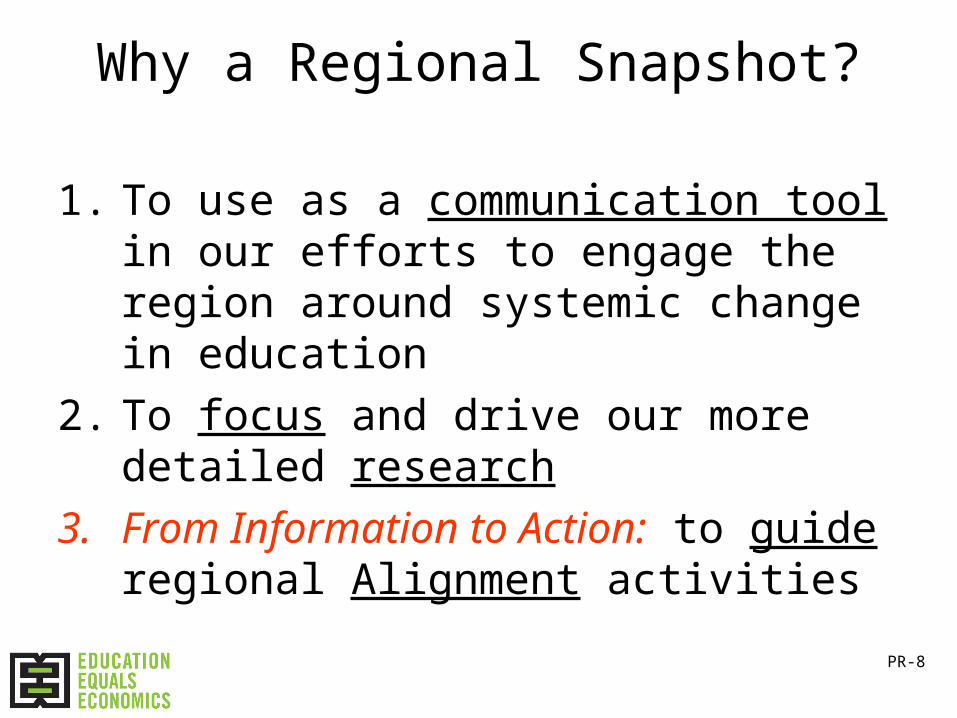
Why a Regional Snapshot?
1. To use as a communication tool in our efforts to engage the region around systemic change in education
2. To focus and drive our more detailed research
3. From Information to Action: to guide regional Alignment activities
PR-8
For More Information …
Hannah Gourgey
Director of Analysis and Alignment
E3 Alliance
www.e3alliance.org
Related Documents


