Cell vs. WiFi: On the Performance of Metro Area Mobile Connections Joel Sommers Colgate University [email protected] Paul Barford University of Wisconsin [email protected] ABSTRACT Cellular and 802.11 WiFi are compelling options for mobile Inter- net connectivity. The goal of our work is to understand the per- formance afforded by each of these technologies in diverse en- vironments and use conditions. In this paper, we compare and contrast cellular and WiFi performance using crowd-sourced data from Speedtest.net. Our study considers spatio-temporal per- formance (upload/download throughput and latency) using over 3 million user-initiated tests from iOS and Android apps in 15 dif- ferent metro areas collected over a 15 week period. Our basic per- formance comparisons show that (i) WiFi provides better absolute download/upload throughput, and a higher degree of consistency in performance; (ii) WiFi networks generally deliver lower absolute latency, but the consistency in latency is often better with cellular access; (iii) throughput and latency vary widely depending on the particular access type (e.g., HSPA, EVDO, LTE, WiFi, etc.) and service provider. More broadly, our results show that performance consistency for cellular and WiFi is much lower than has been re- ported for wired broadband. Temporal analysis shows that average performance for cell and WiFi varies with time of day, with the best performance for large metro areas coming at non-peak hours. Spa- tial analysis shows that performance is highly variable across metro areas, but that there are subregions that offer consistently better per- formance for cell or WiFi. Comparisons between metro areas show that larger areas provide higher throughput and lower latency than smaller metro areas, suggesting where ISPs have focused their de- ployment efforts. Finally, our analysis reveals diverse performance characteristics resulting from the rollout of new cell access tech- nologies and service differences among local providers. Categories and Subject Descriptors C.2.1 [Network Architecture and Design]: Wireless communica- tion; C.4 [Performance of Systems]: Performance attributes; C.4 [Performance of Systems]: Measurement Techniques General Terms Design, Experimentation, Measurement, Performance Permission to make digital or hard copies of all or part of this work for personal or classroom use is granted without fee provided that copies are not made or distributed for profit or commercial advantage and that copies bear this notice and the full citation on the first page. To copy otherwise, to republish, to post on servers or to redistribute to lists, requires prior specific permission and/or a fee. IMC’12, November 14–16, 2012, Boston, Massachusetts, USA. Copyright 2012 ACM 978-1-4503-1705-4/12/11 ...$15.00. Keywords Cellular, WiFi 1. INTRODUCTION Over the last five years there has been an explosion in the avail- ability and use of mobile devices that are both cellular and 802.11 WiFi enabled. The combination of a short range, high-speed capa- bility and a longer range, lower speed capability is compelling and enables a wide range of new mobile applications. Driven by the popularity of applications that run on hybrid cell phones such as the iPhone and Android-based devices, there is a large and growing demand for bandwidth by mobile users. A vexing problem for WiFi enabled cell phone users, service providers and application designers is seeking out and supporting the connectivity option that provides the best and most reliable per- formance. Over shorter time scales issues that affect performance include local availability of services, load at a particular site, char- acteristics of the handset, and interference. Over longer time scales, performance is affected by issues such as the ongoing introduction of new technology and deployment of new service provider infras- tructure. To assist users in the effort of understanding their connectivity options, a number of commercial and open-source throughput test- ing applications are available. When invoked, these applications at- tempt to determine the maximum bandwidth for both uploads and downloads from the target device. At basis, these applications send streams of random bytes via HTTP (e.g., data blobs through GET and POST methods) between the target device and a test server. The receiving application measures the bits/second received over small time periods (e.g., one second) and reports the highest sus- tained rate that is achieved. Details of the specific mechanisms for selecting sending rates, measurements and reporting vary between applications. However, data gathered by these applications offer the possibility to provide unique insights into mobile device per- formance. In this paper, we describe an investigation of mobile device per- formance using crowd-sourced data provided by one of the most popular and widely deployed mobile bandwidth testers, Speedtest. net [7]. This unique and rich data set includes information about the device operating system used for the test (iOS or Android), a unique handset identifier, GPS coordinates of the mobile device, time of test, upload and download speeds achieved, etc. Of equal importance is the fact that Speedtest servers are deployed in over 600 locations world wide and are used by tens of thousands of users on a daily basis. The focus of our study is to understand the spatio-temporal char- acteristics of performance of WiFi-enabled cell phones in a selec- tion of metro areas with different population densities and diverse 301

Welcome message from author
This document is posted to help you gain knowledge. Please leave a comment to let me know what you think about it! Share it to your friends and learn new things together.
Transcript
Cell vs. WiFi: On the Performance of Metro Area Mobile
Connections
Joel SommersColgate University
Paul BarfordUniversity of Wisconsin
ABSTRACT
Cellular and 802.11 WiFi are compelling options for mobile Inter-net connectivity. The goal of our work is to understand the per-formance afforded by each of these technologies in diverse en-vironments and use conditions. In this paper, we compare andcontrast cellular and WiFi performance using crowd-sourced datafrom Speedtest.net. Our study considers spatio-temporal per-formance (upload/download throughput and latency) using over 3million user-initiated tests from iOS and Android apps in 15 dif-ferent metro areas collected over a 15 week period. Our basic per-formance comparisons show that (i) WiFi provides better absolutedownload/upload throughput, and a higher degree of consistency inperformance; (ii) WiFi networks generally deliver lower absolutelatency, but the consistency in latency is often better with cellularaccess; (iii) throughput and latency vary widely depending on theparticular access type (e.g., HSPA, EVDO, LTE, WiFi, etc.) andservice provider. More broadly, our results show that performanceconsistency for cellular and WiFi is much lower than has been re-ported for wired broadband. Temporal analysis shows that averageperformance for cell and WiFi varies with time of day, with the bestperformance for large metro areas coming at non-peak hours. Spa-tial analysis shows that performance is highly variable across metroareas, but that there are subregions that offer consistently better per-formance for cell or WiFi. Comparisons between metro areas showthat larger areas provide higher throughput and lower latency thansmaller metro areas, suggesting where ISPs have focused their de-ployment efforts. Finally, our analysis reveals diverse performancecharacteristics resulting from the rollout of new cell access tech-nologies and service differences among local providers.
Categories and Subject Descriptors
C.2.1 [Network Architecture and Design]: Wireless communica-tion; C.4 [Performance of Systems]: Performance attributes; C.4[Performance of Systems]: Measurement Techniques
General Terms
Design, Experimentation, Measurement, Performance
Permission to make digital or hard copies of all or part of this work forpersonal or classroom use is granted without fee provided that copies arenot made or distributed for profit or commercial advantage and that copiesbear this notice and the full citation on the first page. To copy otherwise, torepublish, to post on servers or to redistribute to lists, requires prior specificpermission and/or a fee.IMC’12, November 14–16, 2012, Boston, Massachusetts, USA.Copyright 2012 ACM 978-1-4503-1705-4/12/11 ...$15.00.
Keywords
Cellular, WiFi
1. INTRODUCTIONOver the last five years there has been an explosion in the avail-
ability and use of mobile devices that are both cellular and 802.11WiFi enabled. The combination of a short range, high-speed capa-bility and a longer range, lower speed capability is compelling andenables a wide range of new mobile applications. Driven by thepopularity of applications that run on hybrid cell phones such asthe iPhone and Android-based devices, there is a large and growingdemand for bandwidth by mobile users.
A vexing problem for WiFi enabled cell phone users, serviceproviders and application designers is seeking out and supportingthe connectivity option that provides the best and most reliable per-formance. Over shorter time scales issues that affect performanceinclude local availability of services, load at a particular site, char-acteristics of the handset, and interference. Over longer time scales,performance is affected by issues such as the ongoing introductionof new technology and deployment of new service provider infras-tructure.
To assist users in the effort of understanding their connectivityoptions, a number of commercial and open-source throughput test-ing applications are available. When invoked, these applications at-tempt to determine the maximum bandwidth for both uploads anddownloads from the target device. At basis, these applications sendstreams of random bytes via HTTP (e.g., data blobs through GETand POST methods) between the target device and a test server.The receiving application measures the bits/second received oversmall time periods (e.g., one second) and reports the highest sus-tained rate that is achieved. Details of the specific mechanisms forselecting sending rates, measurements and reporting vary betweenapplications. However, data gathered by these applications offerthe possibility to provide unique insights into mobile device per-formance.
In this paper, we describe an investigation of mobile device per-formance using crowd-sourced data provided by one of the mostpopular and widely deployed mobile bandwidth testers, Speedtest.net [7]. This unique and rich data set includes information aboutthe device operating system used for the test (iOS or Android), aunique handset identifier, GPS coordinates of the mobile device,time of test, upload and download speeds achieved, etc. Of equalimportance is the fact that Speedtest servers are deployed in over600 locations world wide and are used by tens of thousands of userson a daily basis.
The focus of our study is to understand the spatio-temporal char-acteristics of performance of WiFi-enabled cell phones in a selec-tion of metro areas with different population densities and diverse
301
geographic characteristics. We seek answers to basic questionssuch as: what is the relative performance of cellular vs. WiFi ina given geographic area? How does performance vary across localaccess providers, and how does cell and WiFi performance vary insub-regions within the metro area? How does cellular and WiFiperformance vary temporally in the metro area and in sub-regionswithin those areas? How consistent is performance for individualusers over time? What specific features in the data differentiateobserved performance? The long-term goal of our work is to for-mulate conclusions about the spatio-temporal aspects of WiFi en-abled cell phone performance that will lead to improvements in therelevant protocols, configurations, and infrastructure.
Our evaluation indicates a rich yet complex set of characteristicsof spatio-temporal performance of mobile devices in a metro area.As expected, we find absolute WiFi download and upload perfor-mance to be superior to cellular performance in most areas, andthat WiFi exhibits a higher degree of performance consistency. Wealso find that WiFi latency measurements are at least a factor of twolower than cell latency in all areas, but that different providers canexhibit vastly different latency characteristics, and consistency inlatency is often better with cellular access. Further, the absolute la-tency difference between cell and WiFi tends to be smaller in largermetro areas and the overall variability in latency is lower, suggest-ing that greater efforts have been made to optimize those cellulardeployments. Although we find cell performance in large metro ar-eas superior to performance in other areas, throughput and latencyperformance measures vary widely depending on the specific ac-cess type and service provider. Furthermore, we observe that whilenew cellular access technologies such as 4G LTE offer throughputspeeds comparable to WiFi, the upload performance consistency iscurrently low, suggesting that these deployments are not yet fullyoptimized. More generally, our results show that performance con-sistency for cellular and WiFi is significantly lower than has beenreported for wired broadband access. Our results also show thatbased on trends toward higher throughput cellular access technolo-gies, connectivity decisions based solely on throughput may not beobvious in the future.
Recognizing the diversity of physical and IT infrastructures andtime variations in usage patterns within a given metro area, ouranalysis includes evaluations of subareas over a variety of time win-dows. Our results show that download/upload performance in sub-areas follows a standard diurnal cycle but is highly variable. Specif-ically, we find that while WiFi performance tends to be more uni-form across subareas, cell performance in subareas shows highervariability and there are fewer instances of subareas with consis-tently good performance. We find that subareas with consistentlypoor performance tend to be more localized in large metro areas forboth cell and WiFi. These results have implications for both usersand operators in terms of expectations for performance in both fixedand vehicular settings, for diagnosis of performance degradationand for future provisioning.
2. DATAIn this section we describe the unique data set that forms the basis
of our study. We discuss Speedtest’s deployment and performancemeasurement system. We also describe the Speedtest data that arethe focus of our study and provide information about the metroareas in which the data were collected. Finally, we discuss howconclusions drawn from the data sets can be influenced by the areasand methods used for collection.
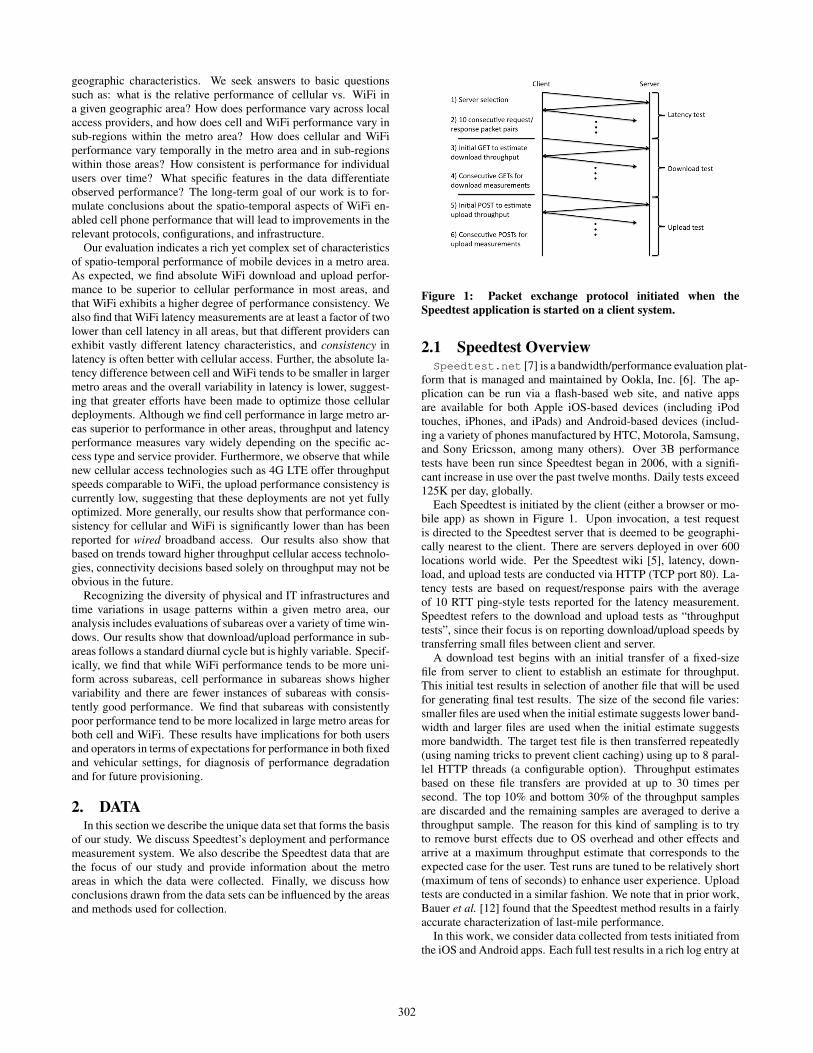
Figure 1: Packet exchange protocol initiated when the
Speedtest application is started on a client system.
2.1 Speedtest OverviewSpeedtest.net [7] is a bandwidth/performance evaluation plat-
form that is managed and maintained by Ookla, Inc. [6]. The ap-plication can be run via a flash-based web site, and native appsare available for both Apple iOS-based devices (including iPodtouches, iPhones, and iPads) and Android-based devices (includ-ing a variety of phones manufactured by HTC, Motorola, Samsung,and Sony Ericsson, among many others). Over 3B performancetests have been run since Speedtest began in 2006, with a signifi-cant increase in use over the past twelve months. Daily tests exceed125K per day, globally.
Each Speedtest is initiated by the client (either a browser or mo-bile app) as shown in Figure 1. Upon invocation, a test requestis directed to the Speedtest server that is deemed to be geographi-cally nearest to the client. There are servers deployed in over 600locations world wide. Per the Speedtest wiki [5], latency, down-load, and upload tests are conducted via HTTP (TCP port 80). La-tency tests are based on request/response pairs with the averageof 10 RTT ping-style tests reported for the latency measurement.Speedtest refers to the download and upload tests as “throughputtests”, since their focus is on reporting download/upload speeds bytransferring small files between client and server.
A download test begins with an initial transfer of a fixed-sizefile from server to client to establish an estimate for throughput.This initial test results in selection of another file that will be usedfor generating final test results. The size of the second file varies:smaller files are used when the initial estimate suggests lower band-width and larger files are used when the initial estimate suggestsmore bandwidth. The target test file is then transferred repeatedly(using naming tricks to prevent client caching) using up to 8 paral-lel HTTP threads (a configurable option). Throughput estimatesbased on these file transfers are provided at up to 30 times persecond. The top 10% and bottom 30% of the throughput samplesare discarded and the remaining samples are averaged to derive athroughput sample. The reason for this kind of sampling is to tryto remove burst effects due to OS overhead and other effects andarrive at a maximum throughput estimate that corresponds to theexpected case for the user. Test runs are tuned to be relatively short(maximum of tens of seconds) to enhance user experience. Uploadtests are conducted in a similar fashion. We note that in prior work,Bauer et al. [12] found that the Speedtest method results in a fairlyaccurate characterization of last-mile performance.
In this work, we consider data collected from tests initiated fromthe iOS and Android apps. Each full test results in a rich log entry at
302
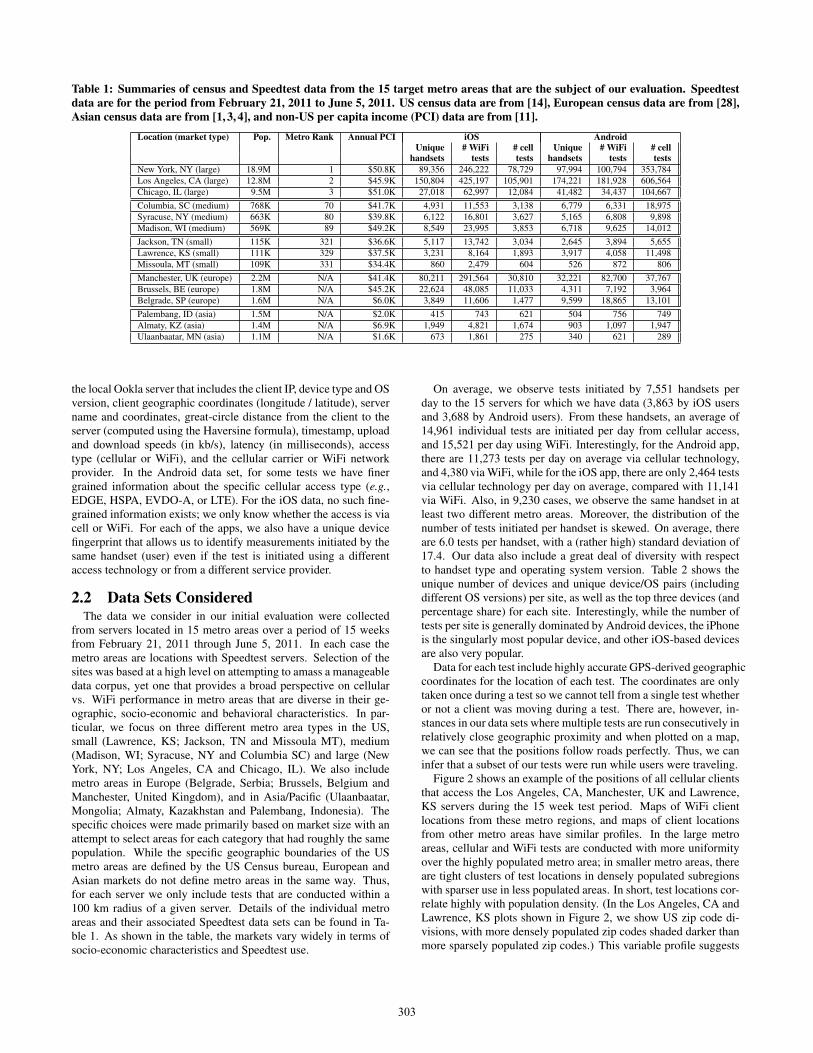
Table 1: Summaries of census and Speedtest data from the 15 target metro areas that are the subject of our evaluation. Speedtest
data are for the period from February 21, 2011 to June 5, 2011. US census data are from [14], European census data are from [28],
Asian census data are from [1, 3, 4], and non-US per capita income (PCI) data are from [11].
Location (market type) Pop. Metro Rank Annual PCI iOS Android
Unique # WiFi # cell Unique # WiFi # cell
handsets tests tests handsets tests tests
New York, NY (large) 18.9M 1 $50.8K 89,356 246,222 78,729 97,994 100,794 353,784
Los Angeles, CA (large) 12.8M 2 $45.9K 150,804 425,197 105,901 174,221 181,928 606,564
Chicago, IL (large) 9.5M 3 $51.0K 27,018 62,997 12,084 41,482 34,437 104,667
Columbia, SC (medium) 768K 70 $41.7K 4,931 11,553 3,138 6,779 6,331 18,975
Syracuse, NY (medium) 663K 80 $39.8K 6,122 16,801 3,627 5,165 6,808 9,898
Madison, WI (medium) 569K 89 $49.2K 8,549 23,995 3,853 6,718 9,625 14,012
Jackson, TN (small) 115K 321 $36.6K 5,117 13,742 3,034 2,645 3,894 5,655
Lawrence, KS (small) 111K 329 $37.5K 3,231 8,164 1,893 3,917 4,058 11,498
Missoula, MT (small) 109K 331 $34.4K 860 2,479 604 526 872 806
Manchester, UK (europe) 2.2M N/A $41.4K 80,211 291,564 30,810 32,221 82,700 37,767
Brussels, BE (europe) 1.8M N/A $45.2K 22,624 48,085 11,033 4,311 7,192 3,964
Belgrade, SP (europe) 1.6M N/A $6.0K 3,849 11,606 1,477 9,599 18,865 13,101
Palembang, ID (asia) 1.5M N/A $2.0K 415 743 621 504 756 749
Almaty, KZ (asia) 1.4M N/A $6.9K 1,949 4,821 1,674 903 1,097 1,947
Ulaanbaatar, MN (asia) 1.1M N/A $1.6K 673 1,861 275 340 621 289
the local Ookla server that includes the client IP, device type and OSversion, client geographic coordinates (longitude / latitude), servername and coordinates, great-circle distance from the client to theserver (computed using the Haversine formula), timestamp, uploadand download speeds (in kb/s), latency (in milliseconds), accesstype (cellular or WiFi), and the cellular carrier or WiFi networkprovider. In the Android data set, for some tests we have finergrained information about the specific cellular access type (e.g.,EDGE, HSPA, EVDO-A, or LTE). For the iOS data, no such fine-grained information exists; we only know whether the access is viacell or WiFi. For each of the apps, we also have a unique devicefingerprint that allows us to identify measurements initiated by thesame handset (user) even if the test is initiated using a differentaccess technology or from a different service provider.
2.2 Data Sets ConsideredThe data we consider in our initial evaluation were collected
from servers located in 15 metro areas over a period of 15 weeksfrom February 21, 2011 through June 5, 2011. In each case themetro areas are locations with Speedtest servers. Selection of thesites was based at a high level on attempting to amass a manageabledata corpus, yet one that provides a broad perspective on cellularvs. WiFi performance in metro areas that are diverse in their ge-ographic, socio-economic and behavioral characteristics. In par-ticular, we focus on three different metro area types in the US,small (Lawrence, KS; Jackson, TN and Missoula MT), medium(Madison, WI; Syracuse, NY and Columbia SC) and large (NewYork, NY; Los Angeles, CA and Chicago, IL). We also includemetro areas in Europe (Belgrade, Serbia; Brussels, Belgium andManchester, United Kingdom), and in Asia/Pacific (Ulaanbaatar,Mongolia; Almaty, Kazakhstan and Palembang, Indonesia). Thespecific choices were made primarily based on market size with anattempt to select areas for each category that had roughly the samepopulation. While the specific geographic boundaries of the USmetro areas are defined by the US Census bureau, European andAsian markets do not define metro areas in the same way. Thus,for each server we only include tests that are conducted within a100 km radius of a given server. Details of the individual metroareas and their associated Speedtest data sets can be found in Ta-ble 1. As shown in the table, the markets vary widely in terms ofsocio-economic characteristics and Speedtest use.
On average, we observe tests initiated by 7,551 handsets perday to the 15 servers for which we have data (3,863 by iOS usersand 3,688 by Android users). From these handsets, an average of14,961 individual tests are initiated per day from cellular access,and 15,521 per day using WiFi. Interestingly, for the Android app,there are 11,273 tests per day on average via cellular technology,and 4,380 via WiFi, while for the iOS app, there are only 2,464 testsvia cellular technology per day on average, compared with 11,141via WiFi. Also, in 9,230 cases, we observe the same handset in atleast two different metro areas. Moreover, the distribution of thenumber of tests initiated per handset is skewed. On average, thereare 6.0 tests per handset, with a (rather high) standard deviation of17.4. Our data also include a great deal of diversity with respectto handset type and operating system version. Table 2 shows theunique number of devices and unique device/OS pairs (includingdifferent OS versions) per site, as well as the top three devices (andpercentage share) for each site. Interestingly, while the number oftests per site is generally dominated by Android devices, the iPhoneis the singularly most popular device, and other iOS-based devicesare also very popular.
Data for each test include highly accurate GPS-derived geographiccoordinates for the location of each test. The coordinates are onlytaken once during a test so we cannot tell from a single test whetheror not a client was moving during a test. There are, however, in-stances in our data sets where multiple tests are run consecutively inrelatively close geographic proximity and when plotted on a map,we can see that the positions follow roads perfectly. Thus, we caninfer that a subset of our tests were run while users were traveling.
Figure 2 shows an example of the positions of all cellular clientsthat access the Los Angeles, CA, Manchester, UK and Lawrence,KS servers during the 15 week test period. Maps of WiFi clientlocations from these metro regions, and maps of client locationsfrom other metro areas have similar profiles. In the large metroareas, cellular and WiFi tests are conducted with more uniformityover the highly populated metro area; in smaller metro areas, thereare tight clusters of test locations in densely populated subregionswith sparser use in less populated areas. In short, test locations cor-relate highly with population density. (In the Los Angeles, CA andLawrence, KS plots shown in Figure 2, we show US zip code di-visions, with more densely populated zip codes shaded darker thanmore sparsely populated zip codes.) This variable profile suggests
303
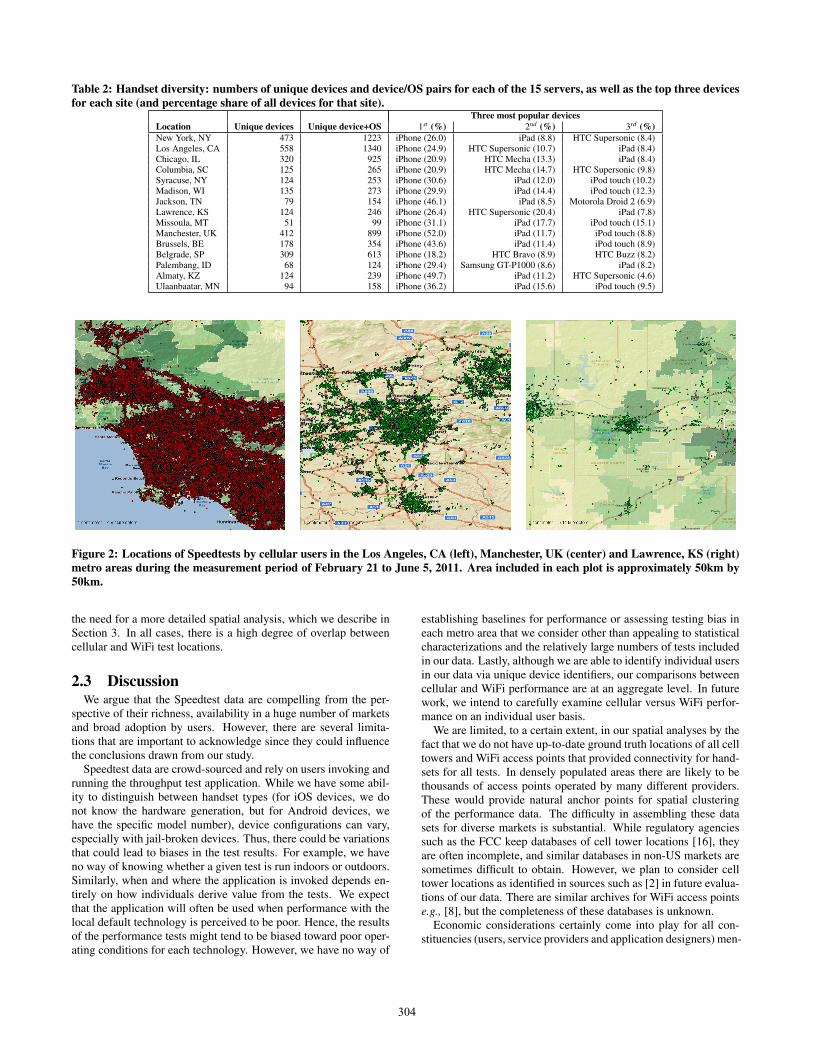
Table 2: Handset diversity: numbers of unique devices and device/OS pairs for each of the 15 servers, as well as the top three devices
for each site (and percentage share of all devices for that site).Three most popular devices
Location Unique devices Unique device+OS 1st (%) 2nd (%) 3rd (%)
New York, NY 473 1223 iPhone (26.0) iPad (8.8) HTC Supersonic (8.4)Los Angeles, CA 558 1340 iPhone (24.9) HTC Supersonic (10.7) iPad (8.4)Chicago, IL 320 925 iPhone (20.9) HTC Mecha (13.3) iPad (8.4)Columbia, SC 125 265 iPhone (20.9) HTC Mecha (14.7) HTC Supersonic (9.8)Syracuse, NY 124 253 iPhone (30.6) iPad (12.0) iPod touch (10.2)Madison, WI 135 273 iPhone (29.9) iPad (14.4) iPod touch (12.3)Jackson, TN 79 154 iPhone (46.1) iPad (8.5) Motorola Droid 2 (6.9)Lawrence, KS 124 246 iPhone (26.4) HTC Supersonic (20.4) iPad (7.8)Missoula, MT 51 99 iPhone (31.1) iPad (17.7) iPod touch (15.1)Manchester, UK 412 899 iPhone (52.0) iPad (11.7) iPod touch (8.8)Brussels, BE 178 354 iPhone (43.6) iPad (11.4) iPod touch (8.9)Belgrade, SP 309 613 iPhone (18.2) HTC Bravo (8.9) HTC Buzz (8.2)Palembang, ID 68 124 iPhone (29.4) Samsung GT-P1000 (8.6) iPad (8.2)Almaty, KZ 124 239 iPhone (49.7) iPad (11.2) HTC Supersonic (4.6)Ulaanbaatar, MN 94 158 iPhone (36.2) iPad (15.6) iPod touch (9.5)
Figure 2: Locations of Speedtests by cellular users in the Los Angeles, CA (left), Manchester, UK (center) and Lawrence, KS (right)
metro areas during the measurement period of February 21 to June 5, 2011. Area included in each plot is approximately 50km by
50km.
the need for a more detailed spatial analysis, which we describe inSection 3. In all cases, there is a high degree of overlap betweencellular and WiFi test locations.
2.3 DiscussionWe argue that the Speedtest data are compelling from the per-
spective of their richness, availability in a huge number of marketsand broad adoption by users. However, there are several limita-tions that are important to acknowledge since they could influencethe conclusions drawn from our study.
Speedtest data are crowd-sourced and rely on users invoking andrunning the throughput test application. While we have some abil-ity to distinguish between handset types (for iOS devices, we donot know the hardware generation, but for Android devices, wehave the specific model number), device configurations can vary,especially with jail-broken devices. Thus, there could be variationsthat could lead to biases in the test results. For example, we haveno way of knowing whether a given test is run indoors or outdoors.Similarly, when and where the application is invoked depends en-tirely on how individuals derive value from the tests. We expectthat the application will often be used when performance with thelocal default technology is perceived to be poor. Hence, the resultsof the performance tests might tend to be biased toward poor oper-ating conditions for each technology. However, we have no way of
establishing baselines for performance or assessing testing bias ineach metro area that we consider other than appealing to statisticalcharacterizations and the relatively large numbers of tests includedin our data. Lastly, although we are able to identify individual usersin our data via unique device identifiers, our comparisons betweencellular and WiFi performance are at an aggregate level. In futurework, we intend to carefully examine cellular versus WiFi perfor-mance on an individual user basis.
We are limited, to a certain extent, in our spatial analyses by thefact that we do not have up-to-date ground truth locations of all celltowers and WiFi access points that provided connectivity for hand-sets for all tests. In densely populated areas there are likely to bethousands of access points operated by many different providers.These would provide natural anchor points for spatial clusteringof the performance data. The difficulty in assembling these datasets for diverse markets is substantial. While regulatory agenciessuch as the FCC keep databases of cell tower locations [16], theyare often incomplete, and similar databases in non-US markets aresometimes difficult to obtain. However, we plan to consider celltower locations as identified in sources such as [2] in future evalua-tions of our data. There are similar archives for WiFi access pointse.g., [8], but the completeness of these databases is unknown.
Economic considerations certainly come into play for all con-stituencies (users, service providers and application designers) men-
304
tioned or discussed in this paper. For users, connectivity may besubject to data transfer limits and traffic shaping. Although WiFiuser plans are rarely data-quantity limited, they are partitioned amongopenly available for free, openly available for paying users, and pri-vate connectivity.
Service providers make decisions on infrastructure density basedon many different issues including projected user growth, risks as-sociated with losing customers due to under provisioning and ge-ographic expansion of service. Finally, application designers mustcarefully consider how to manage data transfers so that user experi-ence under expected conditions is acceptable. Otherwise, they risklosing customers. While these issues are fascinating and certainlyplay a role in the use of mobile devices, drawing explicit lines be-tween the Speedtest measurements and economic issues is a subjectof future study.
3. EVALUATION METHODOLOGYOur evaluation takes a top-down approach to assessing the spatio-
temporal performance characteristics of cellular and WiFi through-put and latency in the target metro areas. This section describes themethods that we use to evaluate Speedtest data toward the goal ofbeing able to draw conclusions about the relative capabilities androbustness of each technology.
3.1 Basic Performance CharacteristicsWe begin by calculating the basic statistical characteristics of
performance for each technology including maximum, average, min-imum and standard deviation over the entire 15 week period in eachof the 15 metro areas. This analysis does not distinguish betweentimes of day or subregions within a given metro area. As such, it ig-nores the more complex and potentially interesting characteristicsof performance. However, it does enables us to begin to understandthe data from an aggregate perspective and establish simple rank-ings between area types (i.e., large, medium, small, Europe, andAsia) and rankings of metro areas within each area type.
From this coarse view of the data, we drill down by analyzingper-handset performance measures. For the set of tests initiatedby each handset in a metro region, we separate the series of testsby access technology (WiFi, cell, or some more detailed cell ac-cess type) and by service provider. To obtain the service provider,we use the IPv4 to autonomous system mapping data provided bywww.team-cymru.org. From this grouping, we can computesummary statistics such as the median, mean, or 95th percentilefor throughput and latency for a given handset (user) when using agiven access provider and access technology in a given market. Wethen plot scatterplots of upload vs. download throughput to com-pare the throughput performance that different users obtain fromdifferent networks and access technologies. We also compute per-formance consistency measures using the same method of [33].In particular, we plot CDFs of normalized per-handset through-put and latency performance. The normalization is performed bytaking the average divided by the 95th percentile in the case of up-load/download throughput, or taking the average divided by the 5th
percentile in the case of latency.
3.2 Temporal CharacteristicsThe diurnal behavior of Internet traffic is one of its most well-
known empirical characteristics. Prior studies of WiFi networks(e.g., [22]) and cellular traffic (e.g., [20]) have shown that diurnalusage patterns are also evident. The goal of our temporal analysis isto assess the extent to which client tests follow a diurnal pattern andhow the expected diurnal use of cellular and WiFi has an impact onperformance in our target metro areas. By drilling down on smaller
time windows, we also expect to be able to observe and characterizeanomalous events such as outages and periods of degraded service.
Our temporal analysis considers two characteristics: client useversus time, and performance versus time. In the case of the for-mer, we plot the aggregate hourly invocations of the test applicationover the 15 week period. In the case of the latter, we plot the aver-age hourly upload and download performance for cellular and WiFiover the 15 week period. We also compute the per-handset averagenormalized performance for each hour of the day, and the stan-dard deviation of the normalized performance for each hour of theday, as in [33]. These measures allow us to determine whether cer-tain hours in the day give consistently better or worse performancethan others. Note that while we have a large number of total datapoints across all servers, the data are still quite temporally sparse.Thus, we do not examine time windows smaller than 1 hour. Nev-ertheless, these plots provide insights on how performance for eachtechnology varies with time of day in each metro area.
3.3 Spatial Characteristics of SubregionsWe believe that metro areas are a highly useful spatial aggregate
for our study since they provide a sufficient corpus of daily datafor temporal analysis and are commonly used in socio-economicanalyses. Analyses at the metro area scale can enable the impact oflarge scale events such as storms or power outages to be evaluated.However, metro areas typically comprise hundreds of square miles,potentially thousands of cellular and WiFi access points and mil-lions of users. As indicated above, this density can preclude iden-tification of smaller scale unexpected or noteworthy events, whichis a goal of our work. To that end, we also analyze performance insubregions for each metro area.
To analyze subregions, we generate a spatial interpolation ofperformance using a technique called inverse distance weighting(IDW) [32]. In IDW, the interpolated performance varies accord-ing to the distance away from measurement points. The methodcan produce a smooth contour of predicted performance based onmeasurement data, and we color each contour band depending oninterpolated performance (e.g., blue for good performance, yellowfor intermediate performance, and red for poor performance).
With 15 weeks of data for each metro area, the question of thetemporal selection of data for subregions is also important. Se-lections over longer time periods enable a first order perspectivesimilar to what we conduct for entire metro areas, while selectionsover shorter time scales enable assessment of localized changes inperformance, which is a goal of our work. Similar to our basic andtemporal analyses, we consider subregion performance over the full15 weeks as well as shorter intervals of days or hours.
Our spatial analysis is facilitated by the ArcGIS tool [19] —awidely used Geographic Information System that is easily adaptedto processing the Speedtest data. With ArcGIS, we are able to per-form IDW and kriging [29] analyses, among other types of spa-tial analyses. We are also able to overlay our plots on base mapsthat include roads and administrative or political boundaries, suchas county, state and country borders, and postcode or zipcode di-visions. ArcGIS exposes a Python-based API, which we heavilyleveraged for our work. While this API does not expose all Ar-cGIS functionality, it enables repetitive tasks to be automated. Intotal, the scripts that were developed for Speedtest data analysiscomprised several hundred lines of code, which we intend to makepublicly available.
4. PERFORMANCE RESULTSIn this section we report the results of our spatio-temporal anal-
yses of cellular and WiFi performance in the 15 target metro areas.
305
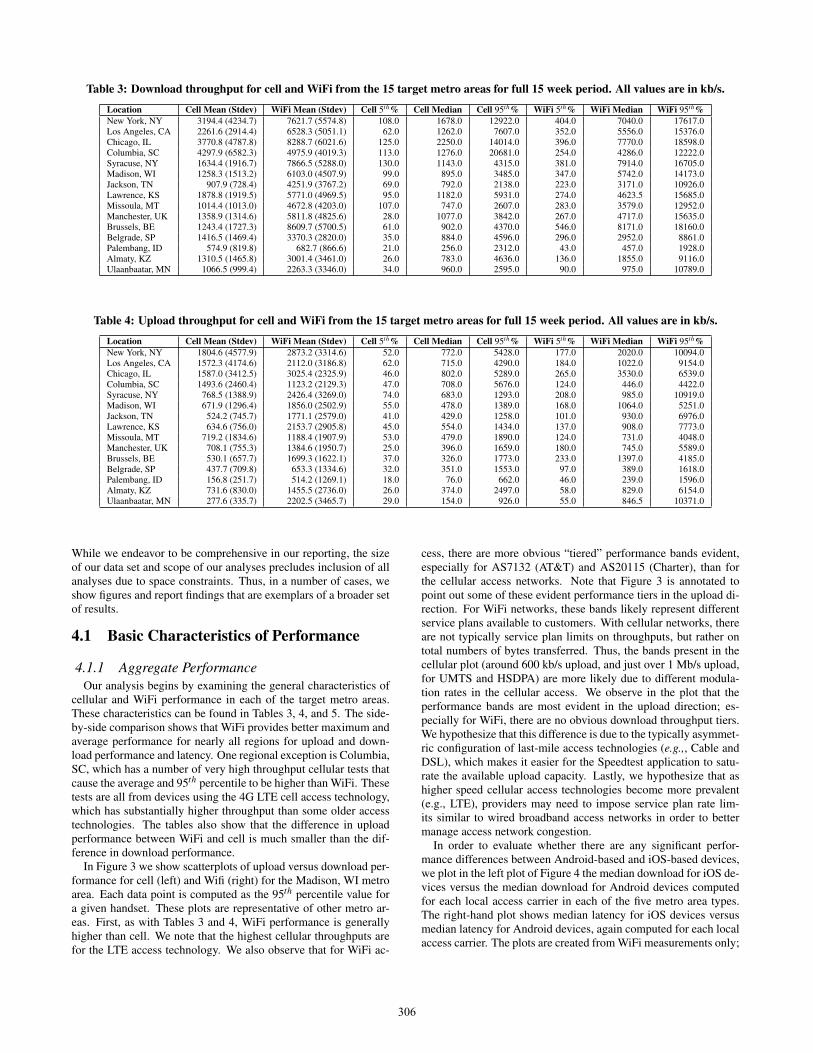
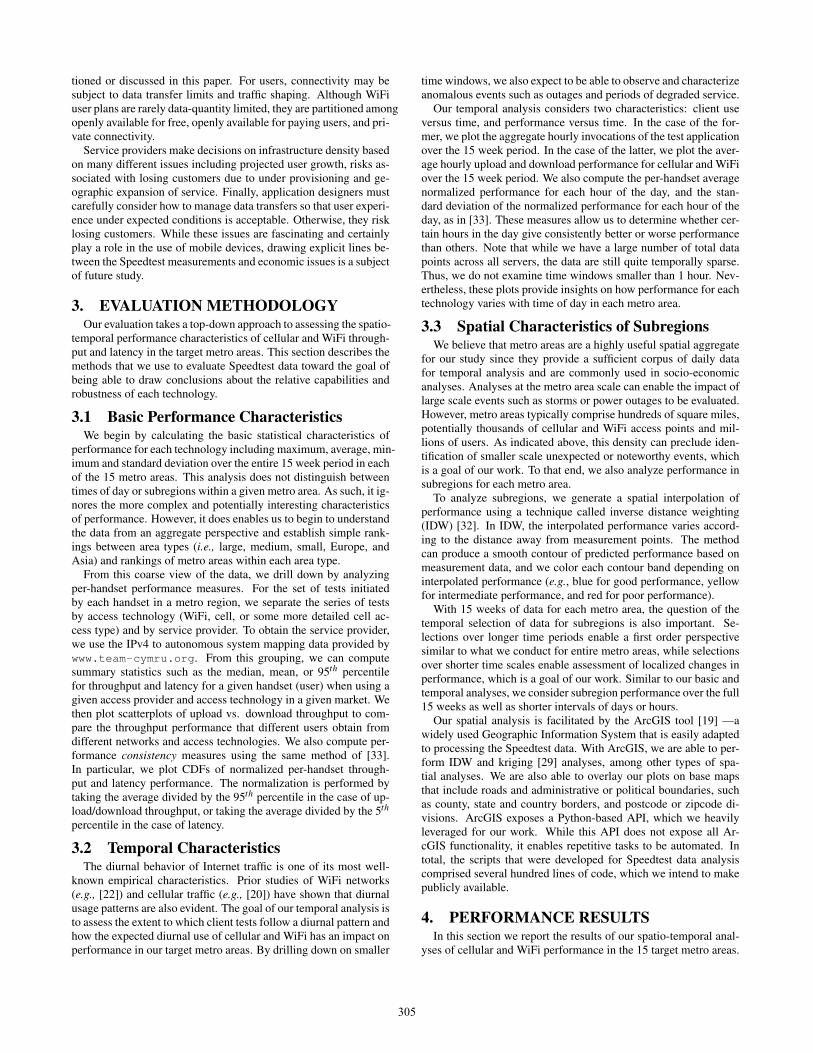
Table 3: Download throughput for cell and WiFi from the 15 target metro areas for full 15 week period. All values are in kb/s.
Location Cell Mean (Stdev) WiFi Mean (Stdev) Cell 5th% Cell Median Cell 95th% WiFi 5th% WiFi Median WiFi 95th%
New York, NY 3194.4 (4234.7) 7621.7 (5574.8) 108.0 1678.0 12922.0 404.0 7040.0 17617.0Los Angeles, CA 2261.6 (2914.4) 6528.3 (5051.1) 62.0 1262.0 7607.0 352.0 5556.0 15376.0Chicago, IL 3770.8 (4787.8) 8288.7 (6021.6) 125.0 2250.0 14014.0 396.0 7770.0 18598.0Columbia, SC 4297.9 (6582.3) 4975.9 (4019.3) 113.0 1276.0 20681.0 254.0 4286.0 12222.0Syracuse, NY 1634.4 (1916.7) 7866.5 (5288.0) 130.0 1143.0 4315.0 381.0 7914.0 16705.0Madison, WI 1258.3 (1513.2) 6103.0 (4507.9) 99.0 895.0 3485.0 347.0 5742.0 14173.0Jackson, TN 907.9 (728.4) 4251.9 (3767.2) 69.0 792.0 2138.0 223.0 3171.0 10926.0Lawrence, KS 1878.8 (1919.5) 5771.0 (4969.5) 95.0 1182.0 5931.0 274.0 4623.5 15685.0Missoula, MT 1014.4 (1013.0) 4672.8 (4203.0) 107.0 747.0 2607.0 283.0 3579.0 12952.0Manchester, UK 1358.9 (1314.6) 5811.8 (4825.6) 28.0 1077.0 3842.0 267.0 4717.0 15635.0Brussels, BE 1243.4 (1727.3) 8609.7 (5700.5) 61.0 902.0 4370.0 546.0 8171.0 18160.0Belgrade, SP 1416.5 (1469.4) 3370.3 (2820.0) 35.0 884.0 4596.0 296.0 2952.0 8861.0Palembang, ID 574.9 (819.8) 682.7 (866.6) 21.0 256.0 2312.0 43.0 457.0 1928.0Almaty, KZ 1310.5 (1465.8) 3001.4 (3461.0) 26.0 783.0 4636.0 136.0 1855.0 9116.0Ulaanbaatar, MN 1066.5 (999.4) 2263.3 (3346.0) 34.0 960.0 2595.0 90.0 975.0 10789.0
Table 4: Upload throughput for cell and WiFi from the 15 target metro areas for full 15 week period. All values are in kb/s.
Location Cell Mean (Stdev) WiFi Mean (Stdev) Cell 5th% Cell Median Cell 95th% WiFi 5th% WiFi Median WiFi 95th%
New York, NY 1804.6 (4577.9) 2873.2 (3314.6) 52.0 772.0 5428.0 177.0 2020.0 10094.0Los Angeles, CA 1572.3 (4174.6) 2112.0 (3186.8) 62.0 715.0 4290.0 184.0 1022.0 9154.0Chicago, IL 1587.0 (3412.5) 3025.4 (2325.9) 46.0 802.0 5289.0 265.0 3530.0 6539.0Columbia, SC 1493.6 (2460.4) 1123.2 (2129.3) 47.0 708.0 5676.0 124.0 446.0 4422.0Syracuse, NY 768.5 (1388.9) 2426.4 (3269.0) 74.0 683.0 1293.0 208.0 985.0 10919.0Madison, WI 671.9 (1296.4) 1856.0 (2502.9) 55.0 478.0 1389.0 168.0 1064.0 5251.0Jackson, TN 524.2 (745.7) 1771.1 (2579.0) 41.0 429.0 1258.0 101.0 930.0 6976.0Lawrence, KS 634.6 (756.0) 2153.7 (2905.8) 45.0 554.0 1434.0 137.0 908.0 7773.0Missoula, MT 719.2 (1834.6) 1188.4 (1907.9) 53.0 479.0 1890.0 124.0 731.0 4048.0Manchester, UK 708.1 (755.3) 1384.6 (1950.7) 25.0 396.0 1659.0 180.0 745.0 5589.0Brussels, BE 530.1 (657.7) 1699.3 (1622.1) 37.0 326.0 1773.0 233.0 1397.0 4185.0Belgrade, SP 437.7 (709.8) 653.3 (1334.6) 32.0 351.0 1553.0 97.0 389.0 1618.0Palembang, ID 156.8 (251.7) 514.2 (1269.1) 18.0 76.0 662.0 46.0 239.0 1596.0Almaty, KZ 731.6 (830.0) 1455.5 (2736.0) 26.0 374.0 2497.0 58.0 829.0 6154.0Ulaanbaatar, MN 277.6 (335.7) 2202.5 (3465.7) 29.0 154.0 926.0 55.0 846.5 10371.0
While we endeavor to be comprehensive in our reporting, the sizeof our data set and scope of our analyses precludes inclusion of allanalyses due to space constraints. Thus, in a number of cases, weshow figures and report findings that are exemplars of a broader setof results.
4.1 Basic Characteristics of Performance
4.1.1 Aggregate Performance
Our analysis begins by examining the general characteristics ofcellular and WiFi performance in each of the target metro areas.These characteristics can be found in Tables 3, 4, and 5. The side-by-side comparison shows that WiFi provides better maximum andaverage performance for nearly all regions for upload and down-load performance and latency. One regional exception is Columbia,SC, which has a number of very high throughput cellular tests thatcause the average and 95th percentile to be higher than WiFi. Thesetests are all from devices using the 4G LTE cell access technology,which has substantially higher throughput than some older accesstechnologies. The tables also show that the difference in uploadperformance between WiFi and cell is much smaller than the dif-ference in download performance.
In Figure 3 we show scatterplots of upload versus download per-formance for cell (left) and Wifi (right) for the Madison, WI metroarea. Each data point is computed as the 95th percentile value fora given handset. These plots are representative of other metro ar-eas. First, as with Tables 3 and 4, WiFi performance is generallyhigher than cell. We note that the highest cellular throughputs arefor the LTE access technology. We also observe that for WiFi ac-
cess, there are more obvious “tiered” performance bands evident,especially for AS7132 (AT&T) and AS20115 (Charter), than forthe cellular access networks. Note that Figure 3 is annotated topoint out some of these evident performance tiers in the upload di-rection. For WiFi networks, these bands likely represent differentservice plans available to customers. With cellular networks, thereare not typically service plan limits on throughputs, but rather ontotal numbers of bytes transferred. Thus, the bands present in thecellular plot (around 600 kb/s upload, and just over 1 Mb/s upload,for UMTS and HSDPA) are more likely due to different modula-tion rates in the cellular access. We observe in the plot that theperformance bands are most evident in the upload direction; es-pecially for WiFi, there are no obvious download throughput tiers.We hypothesize that this difference is due to the typically asymmet-ric configuration of last-mile access technologies (e.g.,, Cable andDSL), which makes it easier for the Speedtest application to satu-rate the available upload capacity. Lastly, we hypothesize that ashigher speed cellular access technologies become more prevalent(e.g., LTE), providers may need to impose service plan rate lim-its similar to wired broadband access networks in order to bettermanage access network congestion.
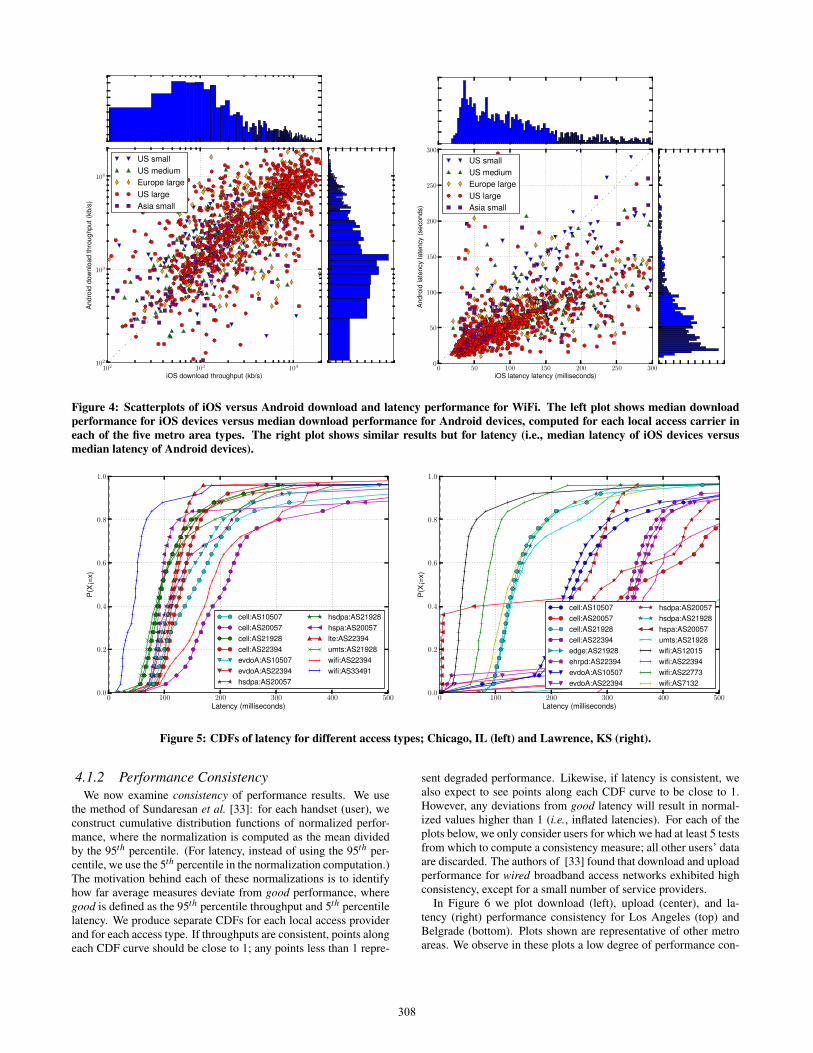
In order to evaluate whether there are any significant perfor-mance differences between Android-based and iOS-based devices,we plot in the left plot of Figure 4 the median download for iOS de-vices versus the median download for Android devices computedfor each local access carrier in each of the five metro area types.The right-hand plot shows median latency for iOS devices versusmedian latency for Android devices, again computed for each localaccess carrier. The plots are created from WiFi measurements only;
306
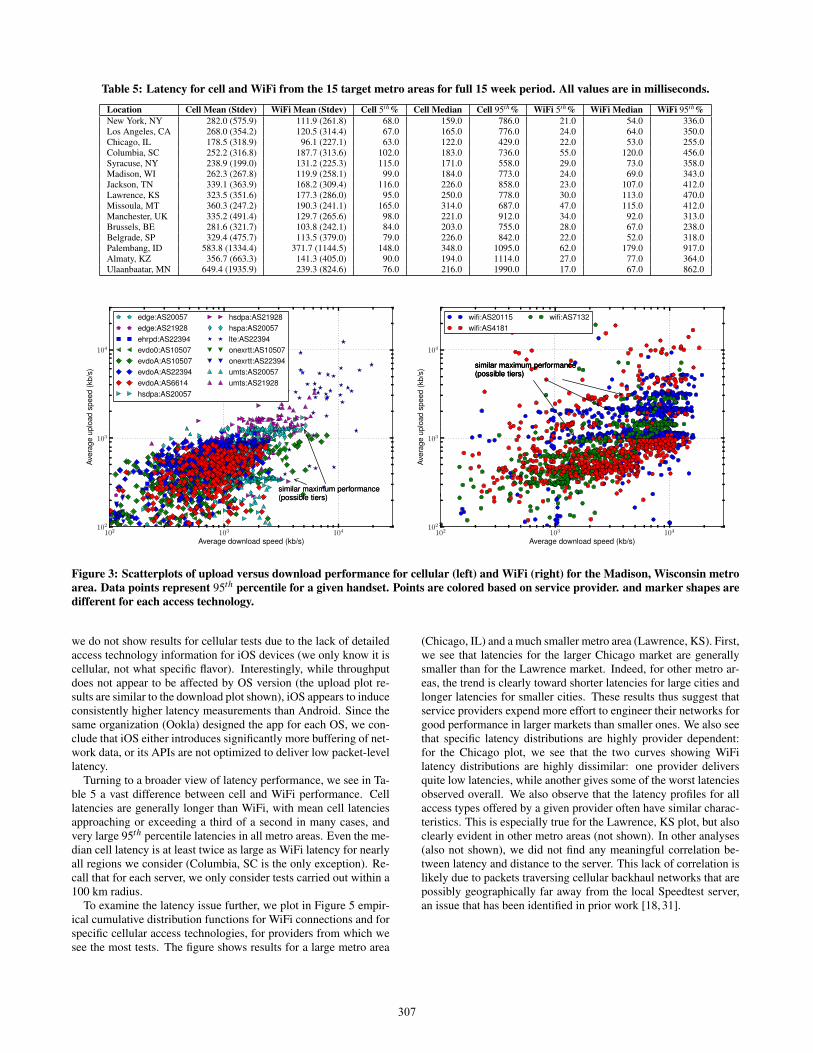
Table 5: Latency for cell and WiFi from the 15 target metro areas for full 15 week period. All values are in milliseconds.
Location Cell Mean (Stdev) WiFi Mean (Stdev) Cell 5th% Cell Median Cell 95th% WiFi 5th% WiFi Median WiFi 95th%
New York, NY 282.0 (575.9) 111.9 (261.8) 68.0 159.0 786.0 21.0 54.0 336.0Los Angeles, CA 268.0 (354.2) 120.5 (314.4) 67.0 165.0 776.0 24.0 64.0 350.0Chicago, IL 178.5 (318.9) 96.1 (227.1) 63.0 122.0 429.0 22.0 53.0 255.0Columbia, SC 252.2 (316.8) 187.7 (313.6) 102.0 183.0 736.0 55.0 120.0 456.0Syracuse, NY 238.9 (199.0) 131.2 (225.3) 115.0 171.0 558.0 29.0 73.0 358.0Madison, WI 262.3 (267.8) 119.9 (258.1) 99.0 184.0 773.0 24.0 69.0 343.0Jackson, TN 339.1 (363.9) 168.2 (309.4) 116.0 226.0 858.0 23.0 107.0 412.0Lawrence, KS 323.5 (351.6) 177.3 (286.0) 95.0 250.0 778.0 30.0 113.0 470.0Missoula, MT 360.3 (247.2) 190.3 (241.1) 165.0 314.0 687.0 47.0 115.0 412.0Manchester, UK 335.2 (491.4) 129.7 (265.6) 98.0 221.0 912.0 34.0 92.0 313.0Brussels, BE 281.6 (321.7) 103.8 (242.1) 84.0 203.0 755.0 28.0 67.0 238.0Belgrade, SP 329.4 (475.7) 113.5 (379.0) 79.0 226.0 842.0 22.0 52.0 318.0Palembang, ID 583.8 (1334.4) 371.7 (1144.5) 148.0 348.0 1095.0 62.0 179.0 917.0Almaty, KZ 356.7 (663.3) 141.3 (405.0) 90.0 194.0 1114.0 27.0 77.0 364.0Ulaanbaatar, MN 649.4 (1935.9) 239.3 (824.6) 76.0 216.0 1990.0 17.0 67.0 862.0
102
103
104
Average download speed (kb/s)
102
103
104
Avera
ge
uplo
ad
speed
(kb/s
)
similar maximum performance(possible tiers)similar maximum performance(possible tiers)
edge:AS20057
edge:AS21928
ehrpd:AS22394
evdo0:AS10507
evdoA:AS10507
evdoA:AS22394
evdoA:AS6614
hsdpa:AS20057
hsdpa:AS21928
hspa:AS20057
lte:AS22394
onexrtt:AS10507
onexrtt:AS22394
umts:AS20057
umts:AS21928
102
103
104
Average download speed (kb/s)
102
103
104
Avera
ge
uplo
ad
speed
(kb/s
) similar maximum performance(possible tiers)similar maximum performance(possible tiers)similar maximum performance(possible tiers)
wifi:AS20115
wifi:AS4181
wifi:AS7132
Figure 3: Scatterplots of upload versus download performance for cellular (left) and WiFi (right) for the Madison, Wisconsin metro
area. Data points represent 95th percentile for a given handset. Points are colored based on service provider. and marker shapes are
different for each access technology.
we do not show results for cellular tests due to the lack of detailedaccess technology information for iOS devices (we only know it iscellular, not what specific flavor). Interestingly, while throughputdoes not appear to be affected by OS version (the upload plot re-sults are similar to the download plot shown), iOS appears to induceconsistently higher latency measurements than Android. Since thesame organization (Ookla) designed the app for each OS, we con-clude that iOS either introduces significantly more buffering of net-work data, or its APIs are not optimized to deliver low packet-levellatency.
Turning to a broader view of latency performance, we see in Ta-ble 5 a vast difference between cell and WiFi performance. Celllatencies are generally longer than WiFi, with mean cell latenciesapproaching or exceeding a third of a second in many cases, andvery large 95th percentile latencies in all metro areas. Even the me-dian cell latency is at least twice as large as WiFi latency for nearlyall regions we consider (Columbia, SC is the only exception). Re-call that for each server, we only consider tests carried out within a100 km radius.
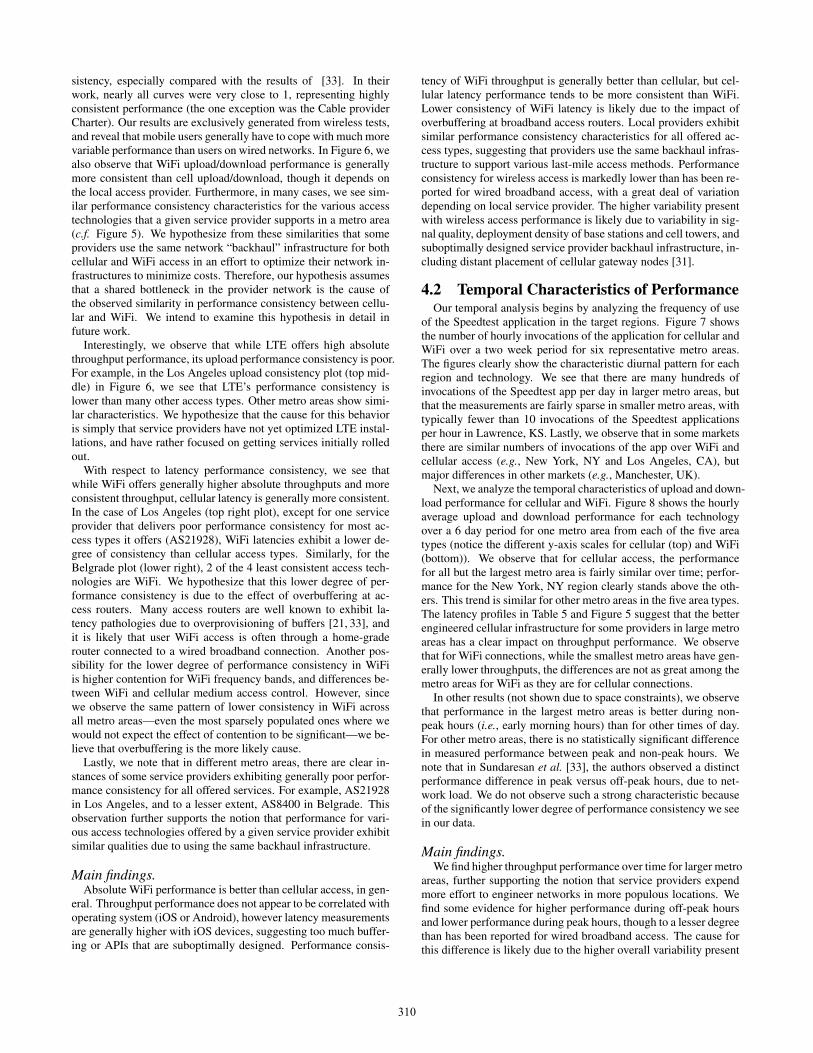
To examine the latency issue further, we plot in Figure 5 empir-ical cumulative distribution functions for WiFi connections and forspecific cellular access technologies, for providers from which wesee the most tests. The figure shows results for a large metro area
(Chicago, IL) and a much smaller metro area (Lawrence, KS). First,we see that latencies for the larger Chicago market are generallysmaller than for the Lawrence market. Indeed, for other metro ar-eas, the trend is clearly toward shorter latencies for large cities andlonger latencies for smaller cities. These results thus suggest thatservice providers expend more effort to engineer their networks forgood performance in larger markets than smaller ones. We also seethat specific latency distributions are highly provider dependent:for the Chicago plot, we see that the two curves showing WiFilatency distributions are highly dissimilar: one provider deliversquite low latencies, while another gives some of the worst latenciesobserved overall. We also observe that the latency profiles for allaccess types offered by a given provider often have similar charac-teristics. This is especially true for the Lawrence, KS plot, but alsoclearly evident in other metro areas (not shown). In other analyses(also not shown), we did not find any meaningful correlation be-tween latency and distance to the server. This lack of correlation islikely due to packets traversing cellular backhaul networks that arepossibly geographically far away from the local Speedtest server,an issue that has been identified in prior work [18, 31].
307
102
103
104
iOS download throughput (kb/s)
102
103
104
Andro
iddow
nlo
ad
thro
ughput
(kb/s
)
US small
US medium
Europe large
US large
Asia small
0 50 100 150 200 250 300
iOS latency latency (milliseconds)
0
50
100
150
200
250
300
Andro
idla
tency
late
ncy
(seconds)
US small
US medium
Europe large
US large
Asia small
Figure 4: Scatterplots of iOS versus Android download and latency performance for WiFi. The left plot shows median download
performance for iOS devices versus median download performance for Android devices, computed for each local access carrier in
each of the five metro area types. The right plot shows similar results but for latency (i.e., median latency of iOS devices versus
median latency of Android devices).
0 100 200 300 400 500
Latency (milliseconds)
0.0
0.2
0.4
0.6
0.8
1.0
P(X
¡=x)
cell:AS10507
cell:AS20057
cell:AS21928
cell:AS22394
evdoA:AS10507
evdoA:AS22394
hsdpa:AS20057
hsdpa:AS21928
hspa:AS20057
lte:AS22394
umts:AS21928
wifi:AS22394
wifi:AS33491
0 100 200 300 400 500
Latency (milliseconds)
0.0
0.2
0.4
0.6
0.8
1.0
P(X
¡=x)
cell:AS10507
cell:AS20057
cell:AS21928
cell:AS22394
edge:AS21928
ehrpd:AS22394
evdoA:AS10507
evdoA:AS22394
hsdpa:AS20057
hsdpa:AS21928
hspa:AS20057
umts:AS21928
wifi:AS12015
wifi:AS22394
wifi:AS22773
wifi:AS7132
Figure 5: CDFs of latency for different access types; Chicago, IL (left) and Lawrence, KS (right).
4.1.2 Performance Consistency
We now examine consistency of performance results. We usethe method of Sundaresan et al. [33]: for each handset (user), weconstruct cumulative distribution functions of normalized perfor-mance, where the normalization is computed as the mean dividedby the 95th percentile. (For latency, instead of using the 95th per-centile, we use the 5th percentile in the normalization computation.)The motivation behind each of these normalizations is to identifyhow far average measures deviate from good performance, wheregood is defined as the 95th percentile throughput and 5th percentilelatency. We produce separate CDFs for each local access providerand for each access type. If throughputs are consistent, points alongeach CDF curve should be close to 1; any points less than 1 repre-
sent degraded performance. Likewise, if latency is consistent, wealso expect to see points along each CDF curve to be close to 1.However, any deviations from good latency will result in normal-ized values higher than 1 (i.e., inflated latencies). For each of theplots below, we only consider users for which we had at least 5 testsfrom which to compute a consistency measure; all other users’ dataare discarded. The authors of [33] found that download and uploadperformance for wired broadband access networks exhibited highconsistency, except for a small number of service providers.
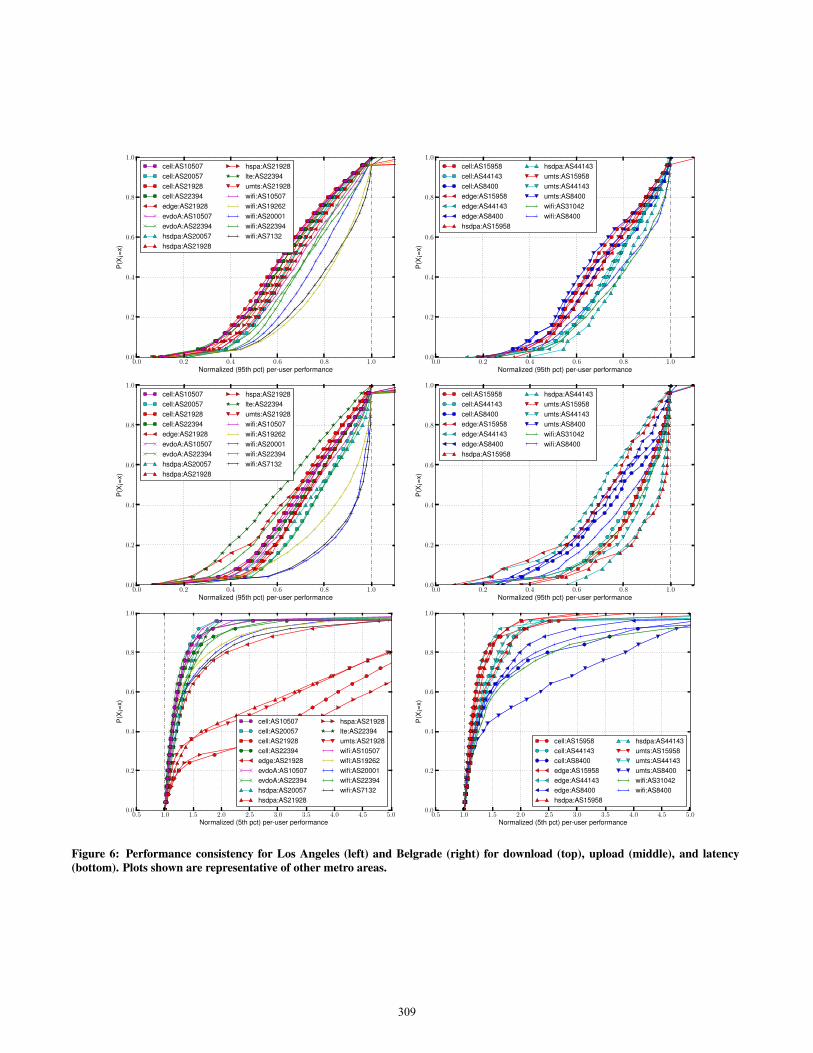
In Figure 6 we plot download (left), upload (center), and la-tency (right) performance consistency for Los Angeles (top) andBelgrade (bottom). Plots shown are representative of other metroareas. We observe in these plots a low degree of performance con-
308
0.0 0.2 0.4 0.6 0.8 1.0
Normalized (95th pct) per-user performance
0.0
0.2
0.4
0.6
0.8
1.0
P(X
¡=x)
cell:AS10507
cell:AS20057
cell:AS21928
cell:AS22394
edge:AS21928
evdoA:AS10507
evdoA:AS22394
hsdpa:AS20057
hsdpa:AS21928
hspa:AS21928
lte:AS22394
umts:AS21928
wifi:AS10507
wifi:AS19262
wifi:AS20001
wifi:AS22394
wifi:AS7132
0.0 0.2 0.4 0.6 0.8 1.0
Normalized (95th pct) per-user performance
0.0
0.2
0.4
0.6
0.8
1.0
P(X
¡=x)
cell:AS15958
cell:AS44143
cell:AS8400
edge:AS15958
edge:AS44143
edge:AS8400
hsdpa:AS15958
hsdpa:AS44143
umts:AS15958
umts:AS44143
umts:AS8400
wifi:AS31042
wifi:AS8400
0.0 0.2 0.4 0.6 0.8 1.0
Normalized (95th pct) per-user performance
0.0
0.2
0.4
0.6
0.8
1.0
P(X
¡=x)
cell:AS10507
cell:AS20057
cell:AS21928
cell:AS22394
edge:AS21928
evdoA:AS10507
evdoA:AS22394
hsdpa:AS20057
hsdpa:AS21928
hspa:AS21928
lte:AS22394
umts:AS21928
wifi:AS10507
wifi:AS19262
wifi:AS20001
wifi:AS22394
wifi:AS7132
0.0 0.2 0.4 0.6 0.8 1.0
Normalized (95th pct) per-user performance
0.0
0.2
0.4
0.6
0.8
1.0
P(X
¡=x)
cell:AS15958
cell:AS44143
cell:AS8400
edge:AS15958
edge:AS44143
edge:AS8400
hsdpa:AS15958
hsdpa:AS44143
umts:AS15958
umts:AS44143
umts:AS8400
wifi:AS31042
wifi:AS8400
0.5 1.0 1.5 2.0 2.5 3.0 3.5 4.0 4.5 5.0
Normalized (5th pct) per-user performance
0.0
0.2
0.4
0.6
0.8
1.0
P(X
¡=x)
cell:AS10507
cell:AS20057
cell:AS21928
cell:AS22394
edge:AS21928
evdoA:AS10507
evdoA:AS22394
hsdpa:AS20057
hsdpa:AS21928
hspa:AS21928
lte:AS22394
umts:AS21928
wifi:AS10507
wifi:AS19262
wifi:AS20001
wifi:AS22394
wifi:AS7132
0.5 1.0 1.5 2.0 2.5 3.0 3.5 4.0 4.5 5.0
Normalized (5th pct) per-user performance
0.0
0.2
0.4
0.6
0.8
1.0
P(X
¡=x)
cell:AS15958
cell:AS44143
cell:AS8400
edge:AS15958
edge:AS44143
edge:AS8400
hsdpa:AS15958
hsdpa:AS44143
umts:AS15958
umts:AS44143
umts:AS8400
wifi:AS31042
wifi:AS8400
Figure 6: Performance consistency for Los Angeles (left) and Belgrade (right) for download (top), upload (middle), and latency
(bottom). Plots shown are representative of other metro areas.
309
sistency, especially compared with the results of [33]. In theirwork, nearly all curves were very close to 1, representing highlyconsistent performance (the one exception was the Cable providerCharter). Our results are exclusively generated from wireless tests,and reveal that mobile users generally have to cope with much morevariable performance than users on wired networks. In Figure 6, wealso observe that WiFi upload/download performance is generallymore consistent than cell upload/download, though it depends onthe local access provider. Furthermore, in many cases, we see sim-ilar performance consistency characteristics for the various accesstechnologies that a given service provider supports in a metro area(c.f. Figure 5). We hypothesize from these similarities that someproviders use the same network “backhaul” infrastructure for bothcellular and WiFi access in an effort to optimize their network in-frastructures to minimize costs. Therefore, our hypothesis assumesthat a shared bottleneck in the provider network is the cause ofthe observed similarity in performance consistency between cellu-lar and WiFi. We intend to examine this hypothesis in detail infuture work.
Interestingly, we observe that while LTE offers high absolutethroughput performance, its upload performance consistency is poor.For example, in the Los Angeles upload consistency plot (top mid-dle) in Figure 6, we see that LTE’s performance consistency islower than many other access types. Other metro areas show simi-lar characteristics. We hypothesize that the cause for this behavioris simply that service providers have not yet optimized LTE instal-lations, and have rather focused on getting services initially rolledout.
With respect to latency performance consistency, we see thatwhile WiFi offers generally higher absolute throughputs and moreconsistent throughput, cellular latency is generally more consistent.In the case of Los Angeles (top right plot), except for one serviceprovider that delivers poor performance consistency for most ac-cess types it offers (AS21928), WiFi latencies exhibit a lower de-gree of consistency than cellular access types. Similarly, for theBelgrade plot (lower right), 2 of the 4 least consistent access tech-nologies are WiFi. We hypothesize that this lower degree of per-formance consistency is due to the effect of overbuffering at ac-cess routers. Many access routers are well known to exhibit la-tency pathologies due to overprovisioning of buffers [21, 33], andit is likely that user WiFi access is often through a home-graderouter connected to a wired broadband connection. Another pos-sibility for the lower degree of performance consistency in WiFiis higher contention for WiFi frequency bands, and differences be-tween WiFi and cellular medium access control. However, sincewe observe the same pattern of lower consistency in WiFi acrossall metro areas—even the most sparsely populated ones where wewould not expect the effect of contention to be significant—we be-lieve that overbuffering is the more likely cause.
Lastly, we note that in different metro areas, there are clear in-stances of some service providers exhibiting generally poor perfor-mance consistency for all offered services. For example, AS21928in Los Angeles, and to a lesser extent, AS8400 in Belgrade. Thisobservation further supports the notion that performance for vari-ous access technologies offered by a given service provider exhibitsimilar qualities due to using the same backhaul infrastructure.
Main findings.Absolute WiFi performance is better than cellular access, in gen-
eral. Throughput performance does not appear to be correlated withoperating system (iOS or Android), however latency measurementsare generally higher with iOS devices, suggesting too much buffer-ing or APIs that are suboptimally designed. Performance consis-
tency of WiFi throughput is generally better than cellular, but cel-lular latency performance tends to be more consistent than WiFi.Lower consistency of WiFi latency is likely due to the impact ofoverbuffering at broadband access routers. Local providers exhibitsimilar performance consistency characteristics for all offered ac-cess types, suggesting that providers use the same backhaul infras-tructure to support various last-mile access methods. Performanceconsistency for wireless access is markedly lower than has been re-ported for wired broadband access, with a great deal of variationdepending on local service provider. The higher variability presentwith wireless access performance is likely due to variability in sig-nal quality, deployment density of base stations and cell towers, andsuboptimally designed service provider backhaul infrastructure, in-cluding distant placement of cellular gateway nodes [31].
4.2 Temporal Characteristics of PerformanceOur temporal analysis begins by analyzing the frequency of use
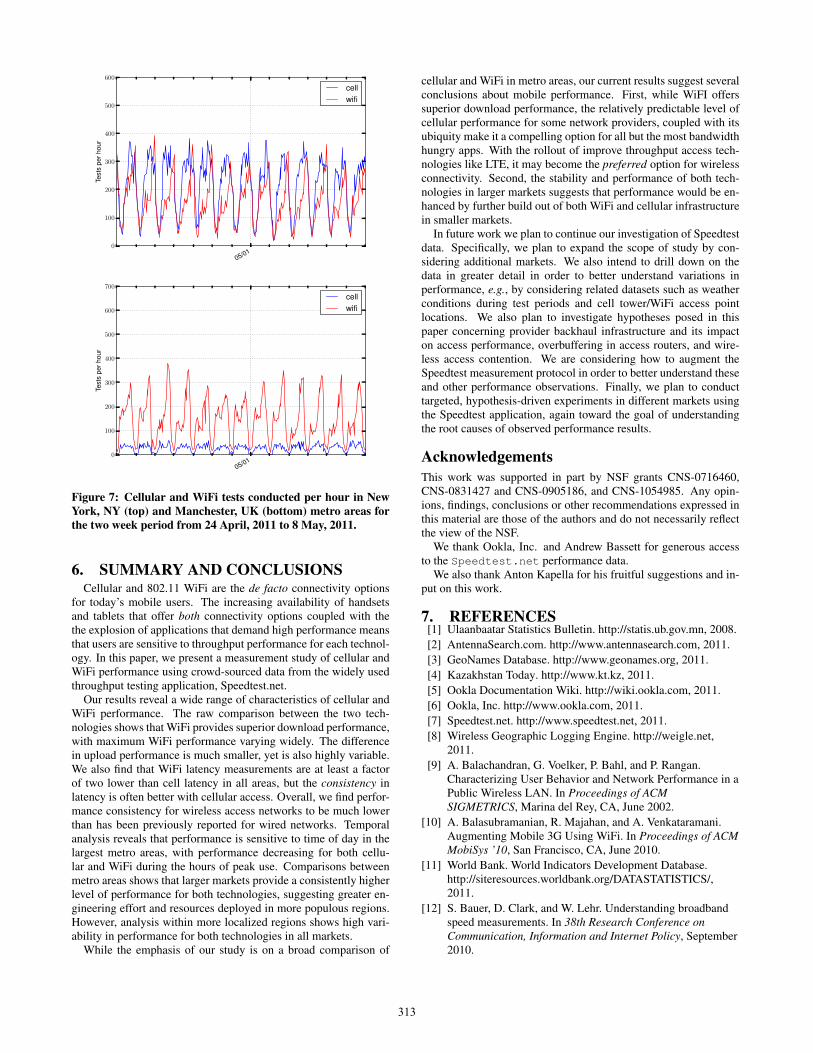
of the Speedtest application in the target regions. Figure 7 showsthe number of hourly invocations of the application for cellular andWiFi over a two week period for six representative metro areas.The figures clearly show the characteristic diurnal pattern for eachregion and technology. We see that there are many hundreds ofinvocations of the Speedtest app per day in larger metro areas, butthat the measurements are fairly sparse in smaller metro areas, withtypically fewer than 10 invocations of the Speedtest applicationsper hour in Lawrence, KS. Lastly, we observe that in some marketsthere are similar numbers of invocations of the app over WiFi andcellular access (e.g., New York, NY and Los Angeles, CA), butmajor differences in other markets (e.g., Manchester, UK).
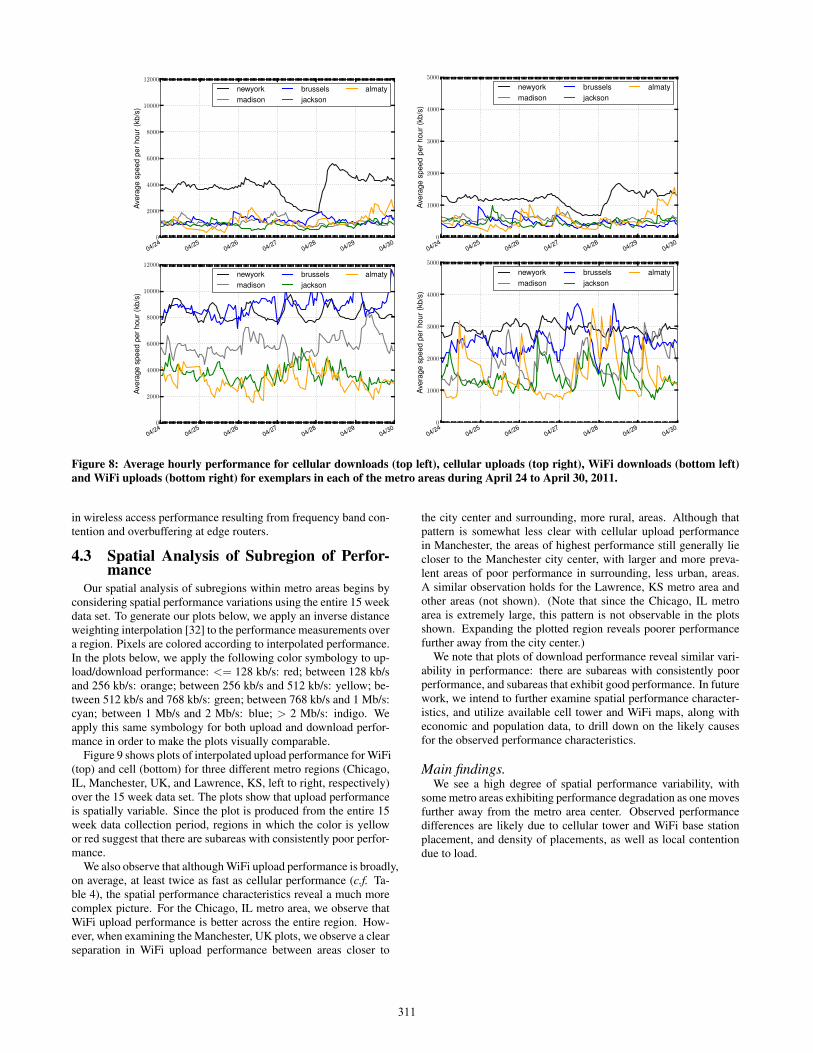
Next, we analyze the temporal characteristics of upload and down-load performance for cellular and WiFi. Figure 8 shows the hourlyaverage upload and download performance for each technologyover a 6 day period for one metro area from each of the five areatypes (notice the different y-axis scales for cellular (top) and WiFi(bottom)). We observe that for cellular access, the performancefor all but the largest metro area is fairly similar over time; perfor-mance for the New York, NY region clearly stands above the oth-ers. This trend is similar for other metro areas in the five area types.The latency profiles in Table 5 and Figure 5 suggest that the betterengineered cellular infrastructure for some providers in large metroareas has a clear impact on throughput performance. We observethat for WiFi connections, while the smallest metro areas have gen-erally lower throughputs, the differences are not as great among themetro areas for WiFi as they are for cellular connections.
In other results (not shown due to space constraints), we observethat performance in the largest metro areas is better during non-peak hours (i.e., early morning hours) than for other times of day.For other metro areas, there is no statistically significant differencein measured performance between peak and non-peak hours. Wenote that in Sundaresan et al. [33], the authors observed a distinctperformance difference in peak versus off-peak hours, due to net-work load. We do not observe such a strong characteristic becauseof the significantly lower degree of performance consistency we seein our data.
Main findings.We find higher throughput performance over time for larger metro
areas, further supporting the notion that service providers expendmore effort to engineer networks in more populous locations. Wefind some evidence for higher performance during off-peak hoursand lower performance during peak hours, though to a lesser degreethan has been reported for wired broadband access. The cause forthis difference is likely due to the higher overall variability present
310
04/2404/25
04/2604/27
04/2804/29
04/300
2000
4000
6000
8000
10000
12000
Ave
rage
speed
per
hour
(kb/s
)
newyork
madison
brussels
jackson
almaty
04/2404/25
04/2604/27
04/2804/29
04/300
1000
2000
3000
4000
5000
Ave
rage
speed
per
hour
(kb/s
)
newyork
madison
brussels
jackson
almaty
04/2404/25
04/2604/27
04/2804/29
04/300
2000
4000
6000
8000
10000
12000
Ave
rage
speed
per
hour
(kb/s
)
newyork
madison
brussels
jackson
almaty
04/2404/25
04/2604/27
04/2804/29
04/300
1000
2000
3000
4000
5000
Ave
rage
speed
per
hour
(kb/s
)
newyork
madison
brussels
jackson
almaty
Figure 8: Average hourly performance for cellular downloads (top left), cellular uploads (top right), WiFi downloads (bottom left)
and WiFi uploads (bottom right) for exemplars in each of the metro areas during April 24 to April 30, 2011.
in wireless access performance resulting from frequency band con-tention and overbuffering at edge routers.
4.3 Spatial Analysis of Subregion of Perfor-mance
Our spatial analysis of subregions within metro areas begins byconsidering spatial performance variations using the entire 15 weekdata set. To generate our plots below, we apply an inverse distanceweighting interpolation [32] to the performance measurements overa region. Pixels are colored according to interpolated performance.In the plots below, we apply the following color symbology to up-load/download performance: <= 128 kb/s: red; between 128 kb/sand 256 kb/s: orange; between 256 kb/s and 512 kb/s: yellow; be-tween 512 kb/s and 768 kb/s: green; between 768 kb/s and 1 Mb/s:cyan; between 1 Mb/s and 2 Mb/s: blue; > 2 Mb/s: indigo. Weapply this same symbology for both upload and download perfor-mance in order to make the plots visually comparable.
Figure 9 shows plots of interpolated upload performance for WiFi(top) and cell (bottom) for three different metro regions (Chicago,IL, Manchester, UK, and Lawrence, KS, left to right, respectively)over the 15 week data set. The plots show that upload performanceis spatially variable. Since the plot is produced from the entire 15week data collection period, regions in which the color is yellowor red suggest that there are subareas with consistently poor perfor-mance.
We also observe that although WiFi upload performance is broadly,on average, at least twice as fast as cellular performance (c.f. Ta-ble 4), the spatial performance characteristics reveal a much morecomplex picture. For the Chicago, IL metro area, we observe thatWiFi upload performance is better across the entire region. How-ever, when examining the Manchester, UK plots, we observe a clearseparation in WiFi upload performance between areas closer to
the city center and surrounding, more rural, areas. Although thatpattern is somewhat less clear with cellular upload performancein Manchester, the areas of highest performance still generally liecloser to the Manchester city center, with larger and more preva-lent areas of poor performance in surrounding, less urban, areas.A similar observation holds for the Lawrence, KS metro area andother areas (not shown). (Note that since the Chicago, IL metroarea is extremely large, this pattern is not observable in the plotsshown. Expanding the plotted region reveals poorer performancefurther away from the city center.)
We note that plots of download performance reveal similar vari-ability in performance: there are subareas with consistently poorperformance, and subareas that exhibit good performance. In futurework, we intend to further examine spatial performance character-istics, and utilize available cell tower and WiFi maps, along witheconomic and population data, to drill down on the likely causesfor the observed performance characteristics.
Main findings.We see a high degree of spatial performance variability, with
some metro areas exhibiting performance degradation as one movesfurther away from the metro area center. Observed performancedifferences are likely due to cellular tower and WiFi base stationplacement, and density of placements, as well as local contentiondue to load.
311
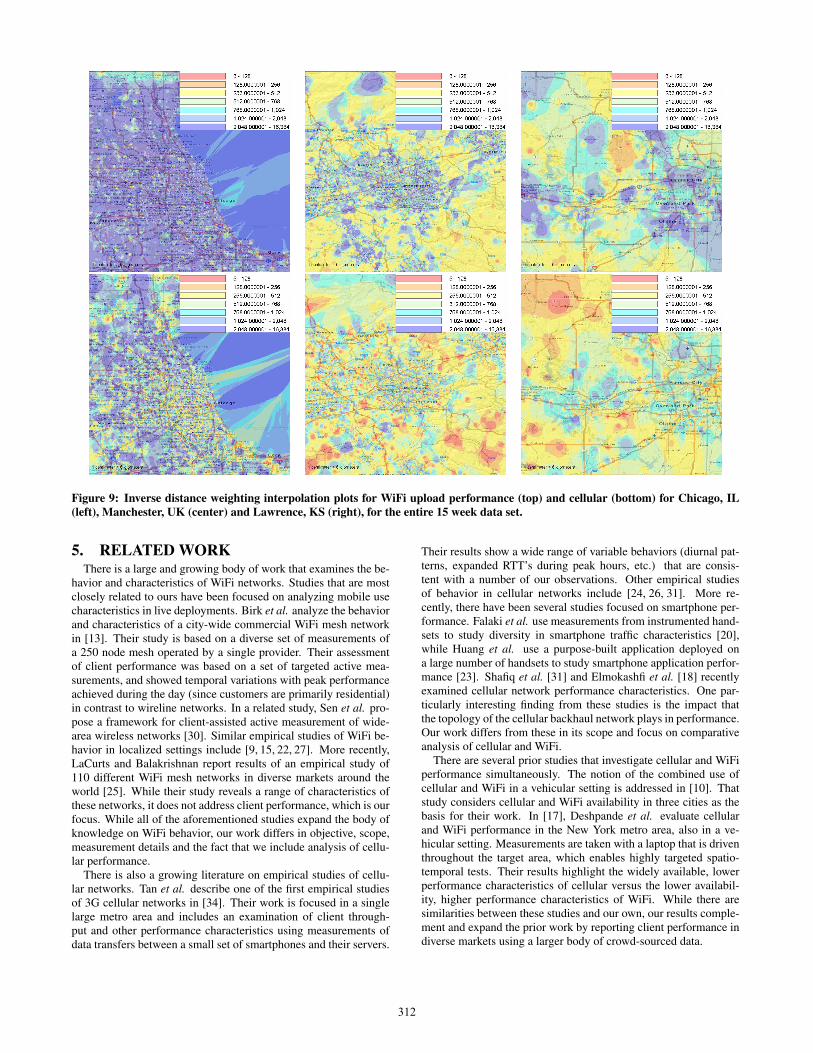
Figure 9: Inverse distance weighting interpolation plots for WiFi upload performance (top) and cellular (bottom) for Chicago, IL
(left), Manchester, UK (center) and Lawrence, KS (right), for the entire 15 week data set.
5. RELATED WORKThere is a large and growing body of work that examines the be-
havior and characteristics of WiFi networks. Studies that are mostclosely related to ours have been focused on analyzing mobile usecharacteristics in live deployments. Birk et al. analyze the behaviorand characteristics of a city-wide commercial WiFi mesh networkin [13]. Their study is based on a diverse set of measurements ofa 250 node mesh operated by a single provider. Their assessmentof client performance was based on a set of targeted active mea-surements, and showed temporal variations with peak performanceachieved during the day (since customers are primarily residential)in contrast to wireline networks. In a related study, Sen et al. pro-pose a framework for client-assisted active measurement of wide-area wireless networks [30]. Similar empirical studies of WiFi be-havior in localized settings include [9, 15, 22, 27]. More recently,LaCurts and Balakrishnan report results of an empirical study of110 different WiFi mesh networks in diverse markets around theworld [25]. While their study reveals a range of characteristics ofthese networks, it does not address client performance, which is ourfocus. While all of the aforementioned studies expand the body ofknowledge on WiFi behavior, our work differs in objective, scope,measurement details and the fact that we include analysis of cellu-lar performance.
There is also a growing literature on empirical studies of cellu-lar networks. Tan et al. describe one of the first empirical studiesof 3G cellular networks in [34]. Their work is focused in a singlelarge metro area and includes an examination of client through-put and other performance characteristics using measurements ofdata transfers between a small set of smartphones and their servers.
Their results show a wide range of variable behaviors (diurnal pat-terns, expanded RTT’s during peak hours, etc.) that are consis-tent with a number of our observations. Other empirical studiesof behavior in cellular networks include [24, 26, 31]. More re-cently, there have been several studies focused on smartphone per-formance. Falaki et al. use measurements from instrumented hand-sets to study diversity in smartphone traffic characteristics [20],while Huang et al. use a purpose-built application deployed ona large number of handsets to study smartphone application perfor-mance [23]. Shafiq et al. [31] and Elmokashfi et al. [18] recentlyexamined cellular network performance characteristics. One par-ticularly interesting finding from these studies is the impact thatthe topology of the cellular backhaul network plays in performance.Our work differs from these in its scope and focus on comparativeanalysis of cellular and WiFi.
There are several prior studies that investigate cellular and WiFiperformance simultaneously. The notion of the combined use ofcellular and WiFi in a vehicular setting is addressed in [10]. Thatstudy considers cellular and WiFi availability in three cities as thebasis for their work. In [17], Deshpande et al. evaluate cellularand WiFi performance in the New York metro area, also in a ve-hicular setting. Measurements are taken with a laptop that is driventhroughout the target area, which enables highly targeted spatio-temporal tests. Their results highlight the widely available, lowerperformance characteristics of cellular versus the lower availabil-ity, higher performance characteristics of WiFi. While there aresimilarities between these studies and our own, our results comple-ment and expand the prior work by reporting client performance indiverse markets using a larger body of crowd-sourced data.
312
05/010
100
200
300
400
500
600
Tests
per
hour
cell
wifi
05/010
100
200
300
400
500
600
700
Tests
per
hour
cell
wifi
Figure 7: Cellular and WiFi tests conducted per hour in New
York, NY (top) and Manchester, UK (bottom) metro areas for
the two week period from 24 April, 2011 to 8 May, 2011.
6. SUMMARY AND CONCLUSIONSCellular and 802.11 WiFi are the de facto connectivity options
for today’s mobile users. The increasing availability of handsetsand tablets that offer both connectivity options coupled with thethe explosion of applications that demand high performance meansthat users are sensitive to throughput performance for each technol-ogy. In this paper, we present a measurement study of cellular andWiFi performance using crowd-sourced data from the widely usedthroughput testing application, Speedtest.net.
Our results reveal a wide range of characteristics of cellular andWiFi performance. The raw comparison between the two tech-nologies shows that WiFi provides superior download performance,with maximum WiFi performance varying widely. The differencein upload performance is much smaller, yet is also highly variable.We also find that WiFi latency measurements are at least a factorof two lower than cell latency in all areas, but the consistency inlatency is often better with cellular access. Overall, we find perfor-mance consistency for wireless access networks to be much lowerthan has been previously reported for wired networks. Temporalanalysis reveals that performance is sensitive to time of day in thelargest metro areas, with performance decreasing for both cellu-lar and WiFi during the hours of peak use. Comparisons betweenmetro areas shows that larger markets provide a consistently higherlevel of performance for both technologies, suggesting greater en-gineering effort and resources deployed in more populous regions.However, analysis within more localized regions shows high vari-ability in performance for both technologies in all markets.
While the emphasis of our study is on a broad comparison of
cellular and WiFi in metro areas, our current results suggest severalconclusions about mobile performance. First, while WiFI offerssuperior download performance, the relatively predictable level ofcellular performance for some network providers, coupled with itsubiquity make it a compelling option for all but the most bandwidthhungry apps. With the rollout of improve throughput access tech-nologies like LTE, it may become the preferred option for wirelessconnectivity. Second, the stability and performance of both tech-nologies in larger markets suggests that performance would be en-hanced by further build out of both WiFi and cellular infrastructurein smaller markets.
In future work we plan to continue our investigation of Speedtestdata. Specifically, we plan to expand the scope of study by con-sidering additional markets. We also intend to drill down on thedata in greater detail in order to better understand variations inperformance, e.g., by considering related datasets such as weatherconditions during test periods and cell tower/WiFi access pointlocations. We also plan to investigate hypotheses posed in thispaper concerning provider backhaul infrastructure and its impacton access performance, overbuffering in access routers, and wire-less access contention. We are considering how to augment theSpeedtest measurement protocol in order to better understand theseand other performance observations. Finally, we plan to conducttargeted, hypothesis-driven experiments in different markets usingthe Speedtest application, again toward the goal of understandingthe root causes of observed performance results.
Acknowledgements
This work was supported in part by NSF grants CNS-0716460,CNS-0831427 and CNS-0905186, and CNS-1054985. Any opin-ions, findings, conclusions or other recommendations expressed inthis material are those of the authors and do not necessarily reflectthe view of the NSF.
We thank Ookla, Inc. and Andrew Bassett for generous accessto the Speedtest.net performance data.
We also thank Anton Kapella for his fruitful suggestions and in-put on this work.
7. REFERENCES[1] Ulaanbaatar Statistics Bulletin. http://statis.ub.gov.mn, 2008.
[2] AntennaSearch.com. http://www.antennasearch.com, 2011.
[3] GeoNames Database. http://www.geonames.org, 2011.
[4] Kazakhstan Today. http://www.kt.kz, 2011.
[5] Ookla Documentation Wiki. http://wiki.ookla.com, 2011.
[6] Ookla, Inc. http://www.ookla.com, 2011.
[7] Speedtest.net. http://www.speedtest.net, 2011.
[8] Wireless Geographic Logging Engine. http://weigle.net,2011.
[9] A. Balachandran, G. Voelker, P. Bahl, and P. Rangan.Characterizing User Behavior and Network Performance in aPublic Wireless LAN. In Proceedings of ACM
SIGMETRICS, Marina del Rey, CA, June 2002.
[10] A. Balasubramanian, R. Majahan, and A. Venkataramani.Augmenting Mobile 3G Using WiFi. In Proceedings of ACM
MobiSys ’10, San Francisco, CA, June 2010.
[11] World Bank. World Indicators Development Database.http://siteresources.worldbank.org/DATASTATISTICS/,2011.
[12] S. Bauer, D. Clark, and W. Lehr. Understanding broadbandspeed measurements. In 38th Research Conference on
Communication, Information and Internet Policy, September2010.
313
[13] V. Birk, S. Rayanchu, S. Saha, S. sen, V. Shrivastava, andS. Banerjee. A Measurement Study of a Commercial-gradeUrban WiFi Mesh. In Proceedings of ACM Internet
Measurement Conference, Vouliagmeni, Greece, October2008.
[14] United States Census Bureau. Population and HousingOccupancy Status 2010.http://www.census.gov/popest/estimates.html, 2011.
[15] Y. Cheng, J. Bellardo, P. Benko, A. Snoeren, G. Voelker, andS. Savage. Solving the Puzzle of Enterprise 802.11 Analysis.In Proceedings of ACM SIGCOMM ’06, Pisa, Italy, August2006.
[16] US Federal Communications Commission. GeographicInformation Systems. http://wireless.fcc.gov, 2011.
[17] P. Deshpande, X. Hou, and S. Das. Performance Comparisonof 3G and Metro-Scale WiFi for Vehicular Network Access.In Proceedings of ACM Internet Measurement Conference,Melbourne, Australia, November 2010.
[18] A. Elmokashfi, A. Kvalbein, J. Xiang, and K. Evensen.Characterizing delays in Norwegian 3G networks. In Passive
and Active Measurement Conference, March 2012.
[19] ESRI. ArcGIS Geographic Information Systems.http://www.esri.com, 2011.
[20] H. Falaki, R. Mahajan, S. Kandula, D. Lymberopoulos,R. Govindan, and D. Estrin. Diversity in Smartphone Usage.In Proceedings of ACM MOBISYS ’10, San Francisco, CA,June 2010.
[21] J. Gettys and K. Nichols. Bufferbloat: Dark buffers in theinternet. Queue, 9(11), November 2011.
[22] T. Henderson, D. Kotz, and I. Abyzov. The Changing Usageof a Mature Campus-wide Wireless Network. In Proceedings
of ACM MOBICOM ’04, Philadelphia, PA, October 2004.
[23] J. Huang, Q. Xu, B. Tiwana, Z. Mao, M. Zhang, and P. Bahl.Anatomizing Application Performance on Smartphones. InProceedings of ACM MobiSys ’10, San Francisco, CA, June2010.
[24] K. Jang, M. Han, S. Cho, H. Ryu, J. Lee, and S. Moom. 3Gand 3.5G Wireless Network Performance Measured fromMoving Cars and High-speed Trains. In Proceedings of ACM
MICNET ’09, Beijing, China, September 2009.
[25] K. LaCurts and H. Balakrishnan. Measurement and Analysisof Real-World 802.11 Mesh Networks. In Proceedings of
ACM Internet Measurement Conference, Melbourne,Australia, November 2010.
[26] X. Liu, A. Sridharan, S. Machiraju, M. Seshadri, andH. Zang. Anatomizing Application Performance onSmartphones. In Proceedings of ACM MobiSys ’10, SanFrancisco, CA, June 2010.
[27] M. McNett and G. Voelker. Access and Mobility of WirelessPDA Users. ACM Mobile Computing and Communications
Review, 9(2), April 2005.
[28] European Spatial Planning Observation Network. Study onUrban Functions. http://www.espon.eu/, 2007.
[29] M.A. Oliver and R. Webster. Kriging: A method ofinterpolation for geographical information systems. Int.
Journal of Geographic Information Systems, 4(3), 1990.
[30] S. Sen, J. Yoon, J. Hare, J. Ormont, and S. Banerjee. Canthey hear me how?: A case for a client-assisted approach tomonitoring wide-area wireless networks. In Proceedings of
ACM Internet Measurement Conference, Berlin, Germany,November 2011.
[31] M. Z. Shafiq, L. Ji, A. X. Liu, and J. Wang. Characterizingand modeling internet traffic dynamics of cellular devices. InProceedings of ACM SIGMETRICS ’11, San Jose, CA, June2011.
[32] D. Shepard. A two-dimensional interpolation function forirregularly-spaced data. In Proceedings of the 1968 23rd
ACM national conference, ACM ’68, pages 517–524, 1968.
[33] S. Sundaresan, W. de Donato, N. Feamster, R. Teixeira,S. Crawford, and A. Pescapè. Broadband internetperformance: A view from the gateway. In Proceedings of
ACM SIGCOMM ’11, Toronto, Canada, August 2011.
[34] F. Lam W. Tan and W Lau. An Empirical Study on 3GNetwork Capacity and Performance. In Proceedings of IEEE
INFOCOM, Anchorage, AK, May 2007.
314
Related Documents