PROJECT DESIGN DOCUMENT FORM (CDM-SSC-PDD) - Version 03 CDM – Executive Board 1 CLEA DEVELOPMET MECHAISM PROJECT DESIG DOCUMET FORM (CDM-SSC-PDD) Version 03 - in effect as of: 22 December 2006 COTETS A. General description of the small scale project activity B. Application of a baseline and monitoring methodology C. Duration of the project activity / crediting period D. Environmental impacts E. Stakeholders’ comments Annexes Annex 1: Contact information on participants in the proposed small scale project activity Annex 2: Information regarding public funding Annex 3: Baseline information Annex 4: Monitoring Information

Welcome message from author
This document is posted to help you gain knowledge. Please leave a comment to let me know what you think about it! Share it to your friends and learn new things together.
Transcript

PROJECT DESIGN DOCUMENT FORM (CDM-SSC-PDD) - Version 03
CDM – Executive Board
1
CLEA� DEVELOPME�T MECHA�ISM
PROJECT DESIG� DOCUME�T FORM (CDM-SSC-PDD)
Version 03 - in effect as of: 22 December 2006
CO�TE�TS
A. General description of the small scale project activity
B. Application of a baseline and monitoring methodology
C. Duration of the project activity / crediting period
D. Environmental impacts
E. Stakeholders’ comments
Annexes
Annex 1: Contact information on participants in the proposed small scale project activity
Annex 2: Information regarding public funding
Annex 3: Baseline information
Annex 4: Monitoring Information
PROJECT DESIGN DOCUMENT FORM (CDM-SSC-PDD) - Version 03
CDM – Executive Board
2
Revision history of this document
Version
Number
Date Description and reason of revision
01 21 January
2003
Initial adoption
02 8 July 2005 • The Board agreed to revise the CDM SSC PDD to reflect
guidance and clarifications provided by the Board since
version 01 of this document.
• As a consequence, the guidelines for completing CDM SSC
PDD have been revised accordingly to version 2. The latest
version can be found at
<http://cdm.unfccc.int/Reference/Documents>.
03 22 December
2006 • The Board agreed to revise the CDM project design
document for small-scale activities (CDM-SSC-PDD), taking
into account CDM-PDD and CDM-NM.
PROJECT DESIGN DOCUMENT FORM (CDM-SSC-PDD) - Version 03
CDM – Executive Board
3
SECTIO� A. General description of small-scale project activity
A.1 Title of the small-scale project activity:
Cable Cars Metro Medellín, Colombia
Version 1.0
October 14th 2008
A.2. Description of the small-scale project activity:
The project is the construction and operation of six cable cars in the city of Medellin, Colombia. All lines
are operated by Empresa de Transporte Masivo del Valle de Aburrá Ltda. (ETMVA). They are used as
mass transit options in hilly areas of the city. The cable cars are an integrative part of the metro system of
Medellin with a pre-pay fare system and seamless transfer to the metro. Using cable cars as a mass transit
option is unique worldwide. Only two comparable systems operate currently world-wide, both however
with much lower capacity.
The six cable car lines included in this PDD are:
• Cable car Line K: This line links people living in Santo Domingo Savio, a steep slope in the
Northeastern part of Medellin, to the metro-station Acevedo operated by ETMVA.The cable car
has two intermediate stops and the final stop at the metro station to allow for seamless transfer to
the metro. The cable car has a length of 2.1 kilometres and a capacity of 3’000 passengers per
hour per direction. It transports around 27,000 passengers per day.
• Cable car Line J (MetroCable Nuevo Occidente): This line operates in the Western part of the
city and links Pajarito with San Javier which is at the same time a metro-station. The cable car
has two intermediate stops and the final stop at the metro station to allow for seamless transfer to
the metro. The cable car has a length of 2.7 kilometres and a capacity of 3,000 persons per hour
per direction. It is expected to transport around 28,000 passengers per day.
• Metrocable Arvi: This is a peri-urban cable car connecting El Tambo with the final station of
cable car Line K in Santo Domingo. El Tambo is in a zone which is used frequented by people
for recreational activities and is now reached exclusively by road i.e. basically bus or taxis. The
cable car has no intermediate stations. It has a length of 4.5 kilometres, a final capacity of 1,200
passengers per hour per direction and expects to transport initially around 3,000 passengers per
day.
• Cable car Line Centro Occidental: This line is planned to link Picachito with the metro station of
Acevedo where already the cable car line K operates. The line is planned with two intermediate
stops and the final stop at the metro station to allow for seamless transfer to the metro. The cable
car has a planned length of 2.7 kilometres with a capacity of 3,000 persons per hour per
direction. It is expected to transport around 28,000 passengers per day.
• Cable car Extension Metro Line B (2 lines): These two lines are planned to link the sectors El
Pinal and La Sierra with the metro-station San Antonio and the metro line B extension. The cable
cars have as final stop the metro line B extension station to allow for seamless transfer to the
metro. The cable cars have each a planned length of 2 kilometres with a capacity of 3’000
passengers per hour per direction. They are expected to transport around 27,000 passengers per
day each.
PROJECT DESIGN DOCUMENT FORM (CDM-SSC-PDD) - Version 03
CDM – Executive Board
4
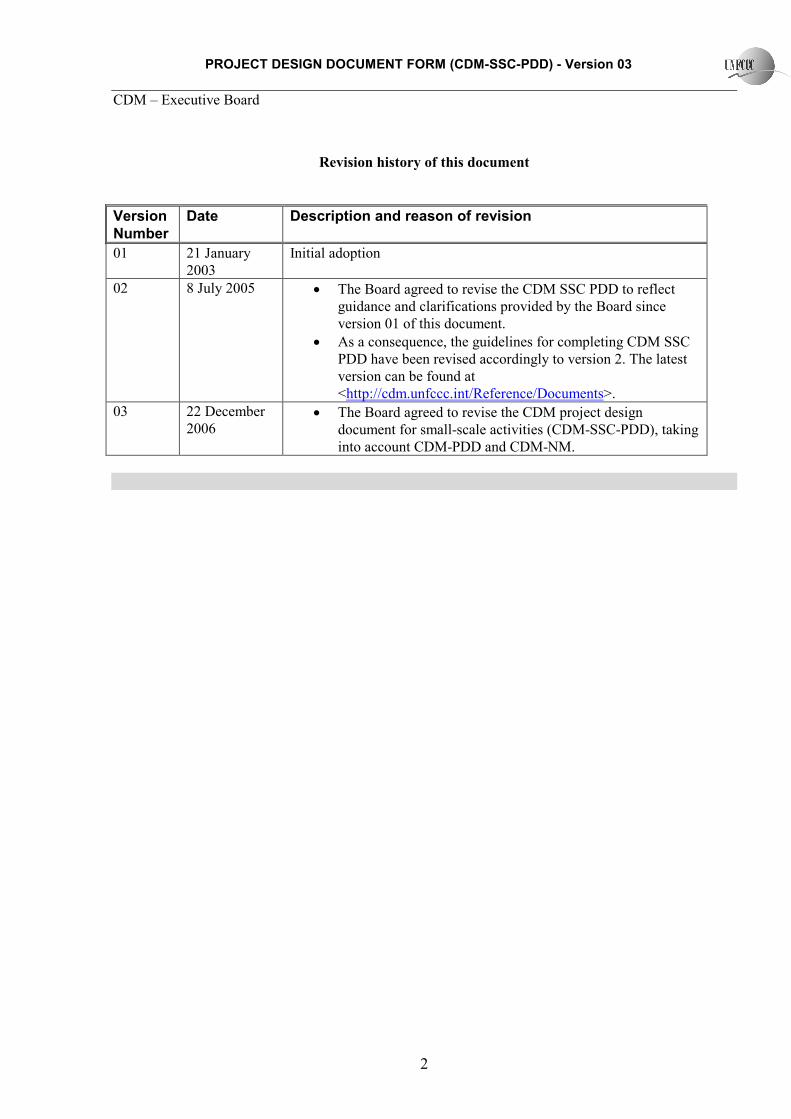
The baseline transport mode of cable car passengers is basically small and medium buses having
numerous accidents, high costs and considerable time lost for travel to the workplace downtown. The
cable car substitutes to a certain extent these conventional transport modes, and reduces travel-time as
well as travel cost - both important aspects for the people living in this zone. The zones were the cable
cars operate are considered the poorest economic areas of Medellin. Seamless transfer to the Metro
allows for hassle free and lower cost travel as tickets are integrated. This is also an important measure to
increase the attractiveness of public transport in Medellin, where Metro has lost as relative share of
transport means relative to passenger cars or taxis between 2002 and 2005 from 26% to 21% (share of
metro of daily trips made by metro, taxi and cars; based on Empresa de Desarrollo Urbano de Medellín;
2005: Encuesta Origen–Destino, Universidad Nacional1).
Picture 1: Metrocable Line K
1 File 24
PROJECT DESIGN DOCUMENT FORM (CDM-SSC-PDD) - Version 03
CDM – Executive Board
5
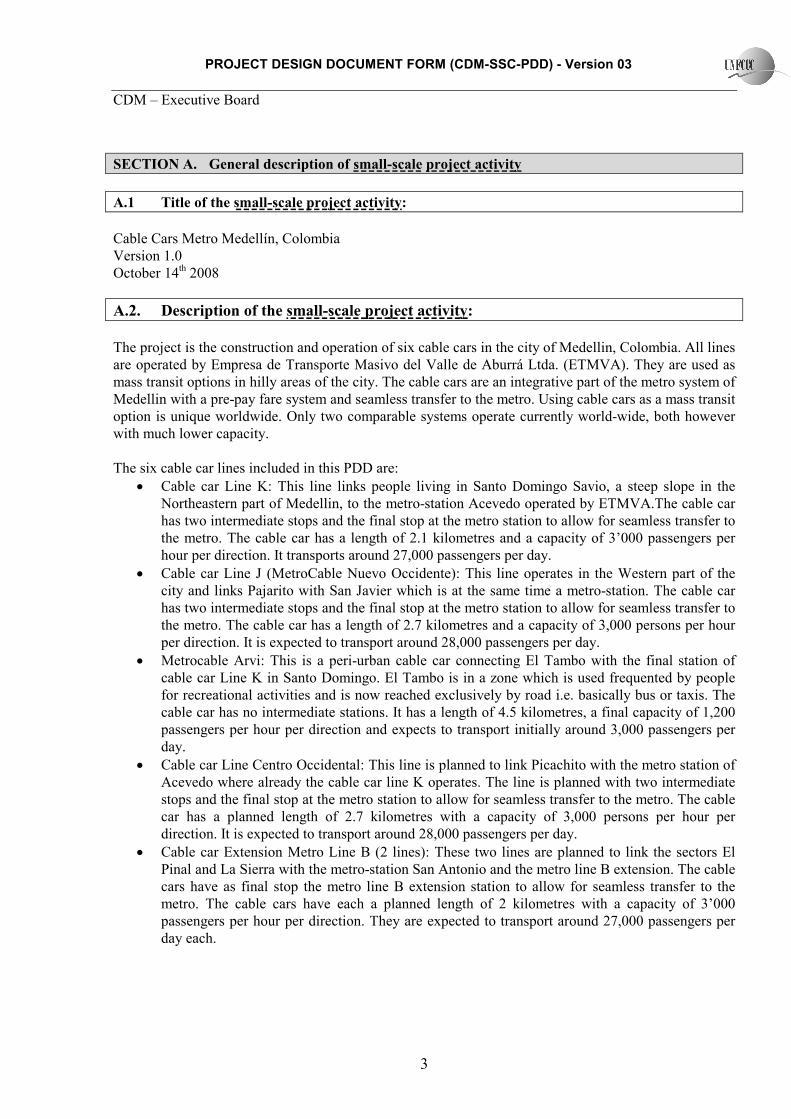
Picture 2: Metrocable Line J Station (under construction)
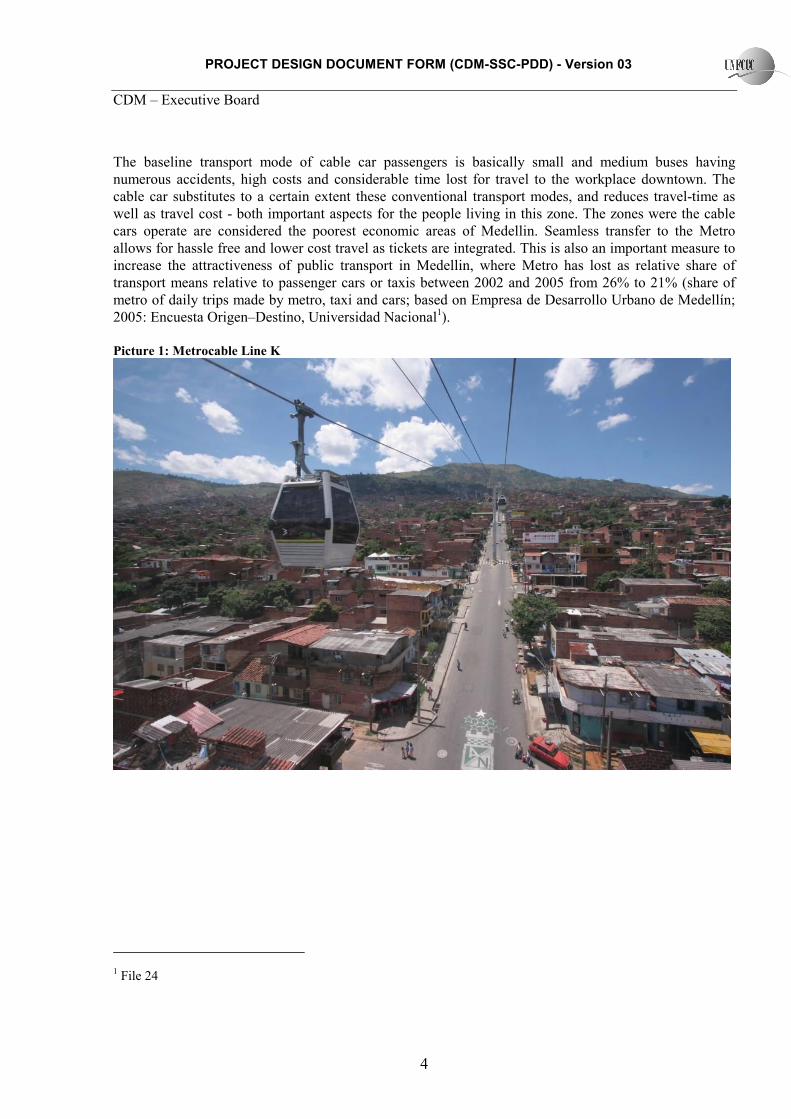
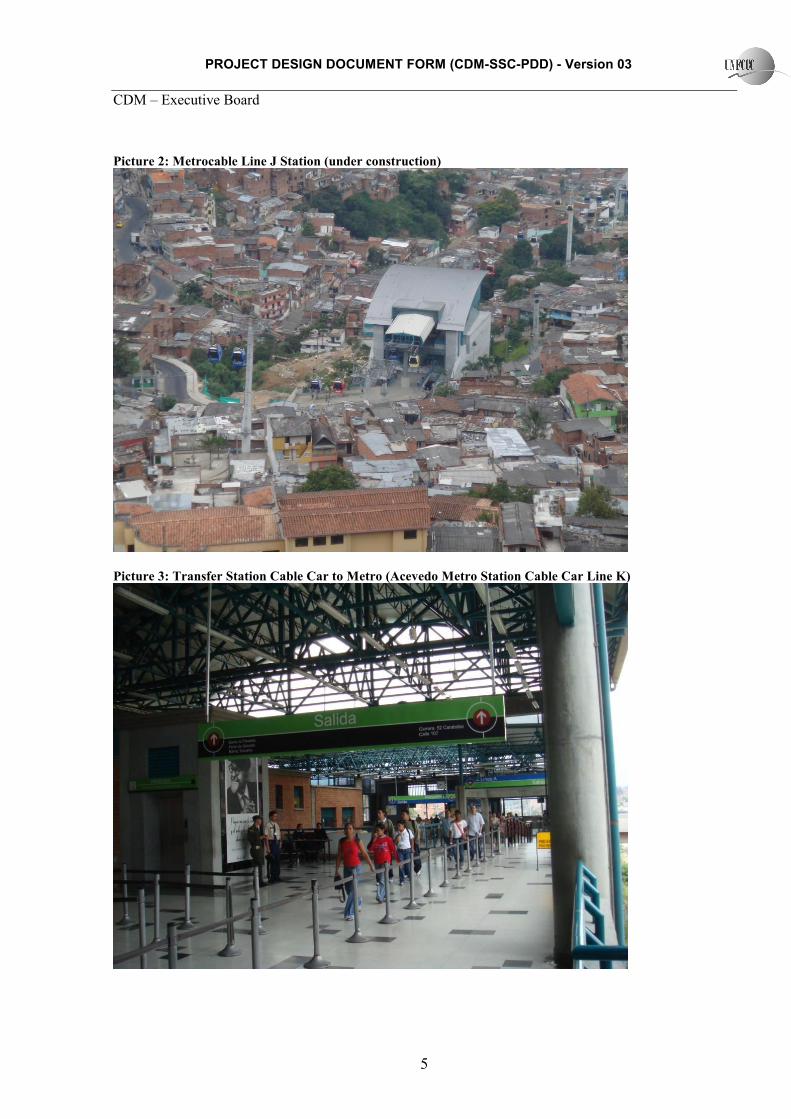
Picture 3: Transfer Station Cable Car to Metro (Acevedo Metro Station Cable Car Line K)

PROJECT DESIGN DOCUMENT FORM (CDM-SSC-PDD) - Version 03
CDM – Executive Board
6
Picture 4: Current Transport Means (Area of Cable Car Line J)
The project has an important impact on sustainable development including positive environmental and
positive socio-economic benefits of the people in the area of influence of the project.
The positive environmental impacts due to reduced usage of buses and other fossil powered transport
means are less emissions of particulate matter (PM10), carbon monoxide (CO), hydrocarbons (HCs),
sulphur dioxide (SO2) and nitrogen oxides (NOx) resulting in less ozone formulation also as a result of
reduced NOx and HC emissions. Local air pollution levels are high and especially curbside particulate
emissions are considerable, due also to steep roads and outdated and badly maintained buses.
The social impact is positive due to reduced travel times, reduced travel cost (the new integrated fare
charged for the cable car is the same as fare charged currently for the Metro; currently the grand majority
of users pay the bus plus the Metro as the bus takes them to a metro station), reduced number of
accidents and less respiratory diseases due to an improved local air quality, especially less particulate
matter2. ETMVA has realized an extensive social program for the construction of the cable cars offering
numerous new facilities for inhabitants of the zone such as local recreation facilities, green spaces and
parks plus other social extension activities thus improving significantly local living conditions. Local
stakeholders were extensively included in the project design and construction thus achieving a very
positive attitude towards the cable car. During the construction phase of each cable car around 450
additional jobs are created (150 per substation). People displaced due to infrastructure requirements
realized an agreement with the municipality on compensation.
2 For PM 10 there exists a clear dose-response function between air quality levels and respiratory diseases, affecting
especially children, sick and elder persons.

PROJECT DESIGN DOCUMENT FORM (CDM-SSC-PDD) - Version 03
CDM – Executive Board
7
Another important sustainable development impact of the project is that the project acts as a clean
technology demonstration project with a potential replication in various cities of Colombia as well as in
other Latin American cities. Only few aerial cable cars are used as mass transit systems including the
Roosevelt Island Tramway in the USA. The project is thus not only novel for the host country but also
for the region and one of the only cable car based mass transit systems worldwide.
A.3. Project participants:
�ame of Party involved
(*) ((host) indicates a
host Party)
Private and/or public entity(ies)
project participants (*)
(as applicable)
Kindly indicate if the Party
involved wishes to be
considered as project
participant (Yes/�o)
Colombia (host) Empresa de Transporte Masivo del Valle de Aburrá
Ltda. (ETMVA)
No
Colombia Centro Nacional de Produccion Mas Limpia y
Tecnologias Ambientales
No
Switzerland Grütter Consulting AG No
A.4. Technical description of the small-scale project activity:
A.4.1. Location of the small-scale project activity:
A.4.1.1. Host Party(ies):
Colombia
A.4.1.2. Region/State/Province etc.:
Departamento de Antioquia
A.4.1.3. City/Town/Community etc:
Metropolitan Area of Medellin
A.4.1.4. Details of physical location, including information allowing the
unique identification of this small-scale project activity :
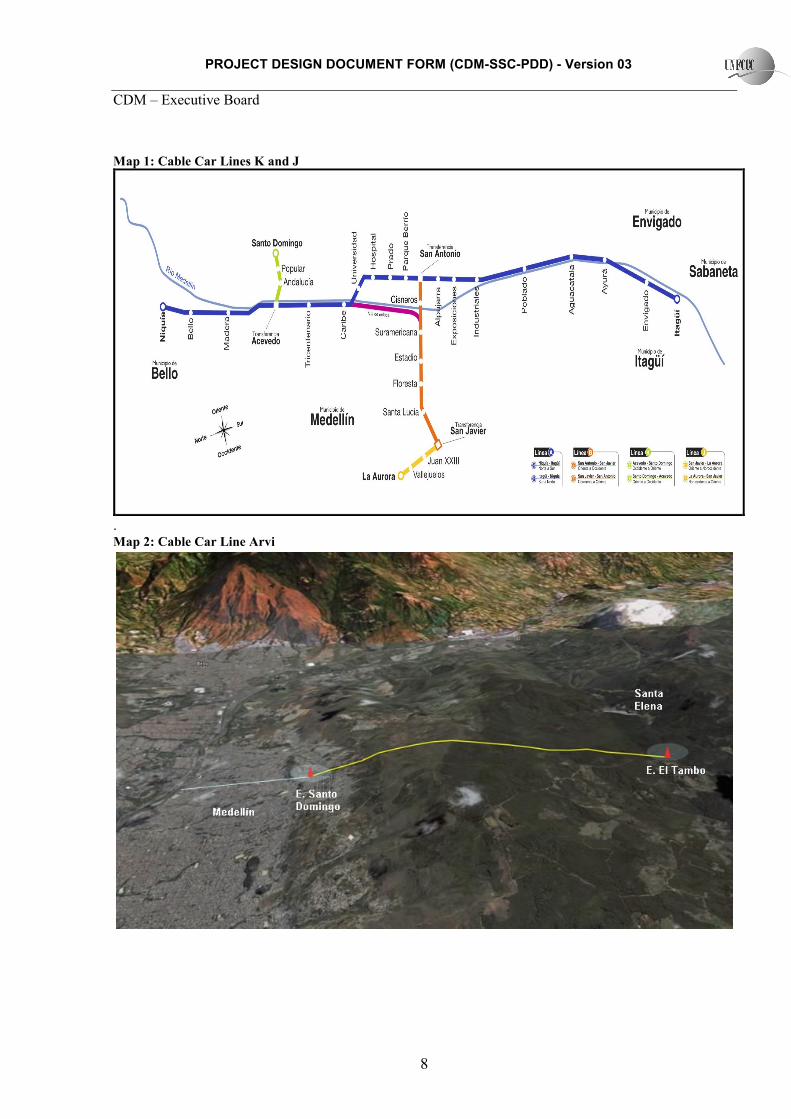
The cable car Line K has as stations Santo Domingo, Popular, Andalucía, and Acevedo where it connects
with the Metro. The cable car Line J has as stations La Aurora, Vallejuelos, Juan XXIII and San Javier,
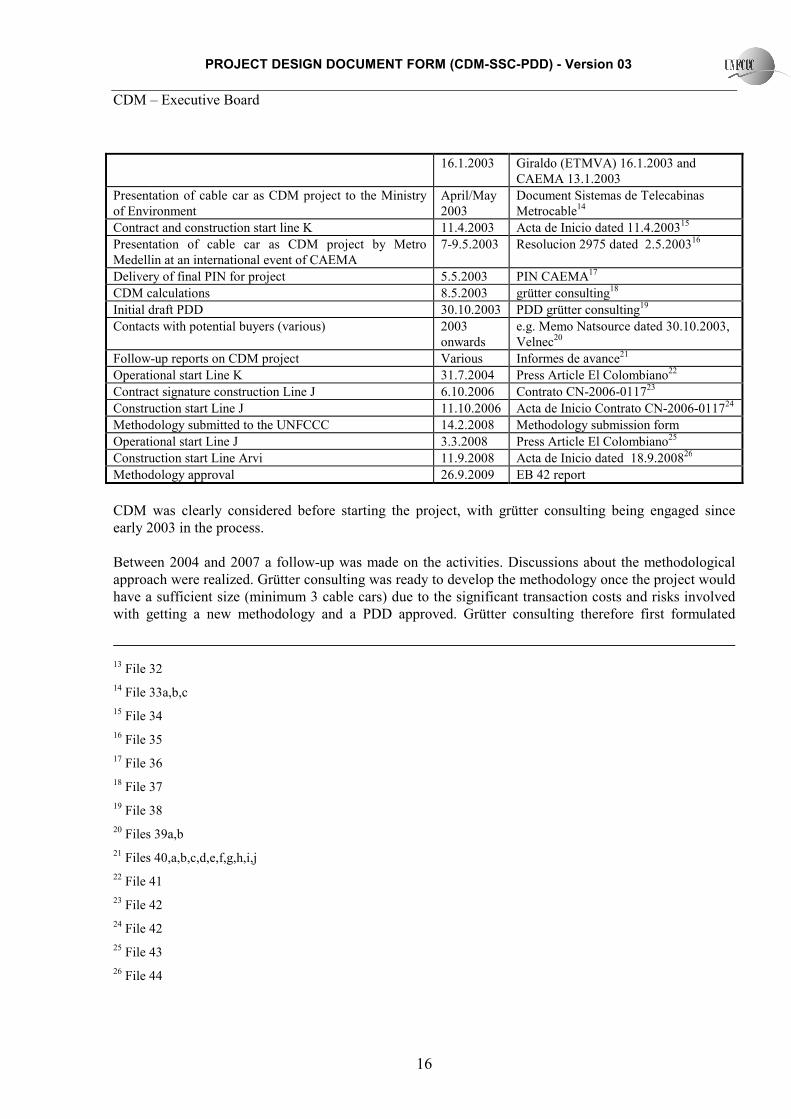
where it connects with the Metro. The cable car Line Arvi has as stations El Tambo and Santo Domingo,
where it connects with the cable car Line K. The cable car Line Centro Occidental has three stations and
connects with the metro at the Acevedo station. The cable car lines Extension Line B Metro connect with
the metro at the San Antonio station. For the last three cable cars station names and exact location have
not yet been defined.
PROJECT DESIGN DOCUMENT FORM (CDM-SSC-PDD) - Version 03
CDM – Executive Board
8
Map 1: Cable Car Lines K and J
. Map 2: Cable Car Line Arvi

PROJECT DESIGN DOCUMENT FORM (CDM-SSC-PDD) - Version 03
CDM – Executive Board
9
Map 3: Cable Car Line Centro Occidental
Map 4: Cable Car Lines Extension Metro Line B
Metro Cables Sistema guiado GLT

PROJECT DESIGN DOCUMENT FORM (CDM-SSC-PDD) - Version 03
CDM – Executive Board
10
A.4.2. Type and category(ies) and technology/measure of the small-scale project activity:
Sectoral scope 7: Transport as listed in the sectoral scopes for accreditation of the operational entities
The same technology is used for all cable cars. The cable car is operated by electricity using mono-cabins
with a seating capacity of 8 persons and a maximum capacity of 10 persons.
Table 1: System Characteristics of Cable Car Lines K, J and Arvi
Line K3 Line J
4 Line Arvi
5
Number of cabins 90 119 27 initial / 54 final
Slope length 2,072 m 2,700 m 4,462 m
Vertical rise 399 m 309 m 631 m6
Hourly capacity per direction 3,000 p/h 3,000 p/h 600 p/h initial / 1,200 p/h final
Line speed 5 m/s 5 m/s 6 m/s
Maximum frequency 12 s 12 s 65 s
Travel time 7 min 9 min 14 min
Number of stations 4 4 2
Number of line towers 20 31 25
The cable car lines Centro Occidente and the 2 lines Extension Metro Line B have not yet been defined
in detail. They will however have comparable characteristics to the lines J and K.
The cable car technology was acquired from the French firm Pomagalski7 for the line K and J (the other
lines have not yet defined the equipment). The detachable grip monocable ropeway system allows cabin
speed in the terminals to be limited to minimum values, in order that loading and unloading of passengers
is easy and also accessible to disabled persons. Besides the main electric drive, the ropeway has
provision for an auxiliary diesel drive which allows the passenger ropeway system to be operated at a
low speed in emergency situations by way of independent hydrostatic transmission. As an alternative to
this rescue drive, there is yet another (backup drive) also by hydrostatic transmission, which operates
directly on the drive bull wheel. In a situation of irrecoverable failure, the cabins are transported by
return to the stations by means of the rescue drives referred to above. In the very unlikely event of the
haul rope not being able to function at all, the passengers will be evacuated by specialized rescue staff of
ETMVA, resorting to vertical rescue equipment.
3 See File 25a and 25b
4 See File 26a and 26b
5 See File 27a
6 Maximum height difference; from the Station Santo Domingo (1,850 m altitude) it first goes upwards and then
downwards to the final station (2,350 m altitude)
7 See www.poma.net ; see File 28a and 28b

PROJECT DESIGN DOCUMENT FORM (CDM-SSC-PDD) - Version 03
CDM – Executive Board
11
Picture 5: Cabins Used
The cable car technology is an environmentally sound technology new for Colombia. Comparable
systems are used for tourism purposes e.g. in Funchal (Portugal8). Contracts include training of local staff
in maintenance and operation of the system thus assuring technology and know-how transfer. While
cable cars for tourism purposes are frequent their usage for mass transit is novel. No other systems with
comparable characteristics exist in Colombia and no cable cars for mass transit are known to operate in
Latin America. Only few aerial cable cars are used world-wide as mass transit systems including the
Roosevelt Island Tramway and the Portland Aerial Tram (both in the USA)9 which have been identified
8 See http://www.madeiracablecar.com/indexen.html
9 See http://www.rioc.com/thetram.htm and http://www.portlandtram.org/

PROJECT DESIGN DOCUMENT FORM (CDM-SSC-PDD) - Version 03
CDM – Executive Board
12
as the only currently operating mass transit aerial cable cars worldwide. The project is thus not only
novel for the host country but also for the region and one of the only cable car based mass transit systems
worldwide.
A.4.3 Estimated amount of emission reductions over the chosen crediting period:
Years Annual estimation of emission
reductions in tCO2eq
2009 (9 months) 6,900
2010 9,600
2011 15,979
2012 19,399
2013 19,929
2014 20,449
2015 21,018
2016 (3 months) 5,402
Total estimated reductions 1st crediting period (tonnes of CO2eq) 118,676
Total number of crediting years (1st crediting period) 7
Annual average over the crediting period of estimated reductions (tCO2eq) 16,954
A.4.4. Public funding of the small-scale project activity:
There is no Official Development Assistance in this project and the project will not receive any public
funding from Parties included in Annex I. Funding is from the district government and from ETMVA
through budgetary allocations and does not include any official development assistance and is not
counted towards the financial obligations of Annex 1 parties.
A.4.5. Confirmation that the small-scale project activity is not a debundled component of a
large scale project activity:
There is no registered small-scale CDM project activity or an application to register another small-scale
CDM project activity with the same project participants, in the same project category and registered
within the previous 2 years. The proposed project is thus not a debundled component of a large-scale
project activity according to Appendix C of the simplified modalities and procedures for small-scale
CDM project activities and Annex 27 EB 36 “Compendium of guidance on the debundling for SSC
project activities” section B.2.
SECTIO� B. Application of a baseline and monitoring methodology
B.1. Title and reference of the approved baseline and monitoring methodology applied to the
small-scale project activity:
AMS-III.U, version 1.0
Cable Cars for Mass Transit Systems (MRTS)

PROJECT DESIGN DOCUMENT FORM (CDM-SSC-PDD) - Version 03
CDM – Executive Board
13
B.2 Justification of the choice of the project category:
The following table relates the applicability criteria with the project.
Table 2: Applicability of the Project
Applicability Criteria Project Conditions
1. Measures are limited to those that result in emission
reductions of less than or equal to 60’000t CO2eq
annually
1. The projected emission reductions of the project are
well below the established limit, being in the highest
year below 25ktCO2 reduced.
2. A new cable car is built. Extensions of existing cable
cars are not applicable
2. All lines are new.
3. Cable cars are for passenger transport only. The
passenger performs partially or totally his trip on the
cable car.
3. All lines are for passenger transport. Passengers
perform part of their trip or the entire trip on the cable
car.
4. Cable cars are established as mass transit mean. The cable car must be built in an area that is accessible by
road (origin and final destination of the cable car).
4. All lines are mass transit means and integrated with
the metro of Medellin or with another cable car. Both the
origin and the destination of all cable car lines can be
accessed by road.
5. The methodology is applicable if fuels used in the
baseline and or project case are electricity, gaseous or
liquid fossil fuels. If bio-fuel blends are used as liquid
fuels, the specific fuel consumption value and emission
factors used for determining baseline and project
emissions shall be adjusted accordingly
5. Project fuel used is electricity. Baseline fuel used is
basically pure diesel, plus to a minor extent gasoline
(basically taxis and passenger cars). No bio-fuels are
used.
According to the resolution 180687 dated June 17th 2003
Art. 5 gasoline shall be blended in Medellin with 10%
ethanol as per latest 27th of September of 2005
10.
According to EB 22 report Annex 3 “Clarifications on
the consideration of national and/or sectoral policies and
circumstances in baseline scenarios (version 02)” this is
a national regulation that gives comparative advantages
to less emission-intensive technologies (type E- policy).
According to Art. 7 of the above mentioned document
“National and/or sectoral policies or regulations under
paragraph 6 (b) (type E- policies) that have been
implemented since the adoption by the COP of the CDM
M&P (decision 17/CP.7, 11 November 2001) need not
be taken into account in developing a baseline scenario
(i.e. the baseline scenario could refer to a hypothetical
situation without the national and/or sectoral policies or
regulations being in place).” The regulation requiring
blending with ethanol was issued after Nov 11th 2001
and the implementation deadline was 27th September
2005, well after 11.11.2001. The baseline fuel used by
passenger cars and taxis can thus be considered as
unblended gasoline i.e. the baseline fuel refers to a
10 The law 693 dated 27.9.2001 to which regulation 180687 refers, calls for an oxygenation of fuels without making
the usage of ethanol compulsory for this purpose. World-wide oxygenation of gasoline was and is made primarily
with MTBE and not through the usage of ethanol. Law 693 also does not specify a certain blending level (the
applicability condition of the methodology allows blending of up to 3%). Law 693 can thus be considered a general
policy to promote the oxygenation of gasoline fuels without specifying neither the usage of bio-fuels nor a certain
blending level. See File 29a and 29b

PROJECT DESIGN DOCUMENT FORM (CDM-SSC-PDD) - Version 03
CDM – Executive Board
14
hypothetical situation without the national regulation
being in place as clarified by the EB 22 Annex 3.
6. The methodology is applicable if the analysis of
possible baseline scenario alternatives leads to the result
that a continuation of the current public transport system
is the scenario that reasonably represents the
anthropogenic emissions by sources of greenhouse gases
(GHG) that would occur in the absence of the proposed
project activity (i.e. the baseline scenario).
6. The most probable baseline scenario is a continuation
of traditional transport means as prevalent before
establishment of the cable car lines.
The project complies with all applicability conditions of the methodology.
B.3. Description of the project boundary:
The spatial extent of the project boundary is the geographical area of trips of passengers using the cable
car lines i.e. the metropolitan area of the city of Medellin in total.
As electricity from an interconnected grid is used, the project boundary also includes the power plants
connected physically to the electricity system that supply power to the project.
For project and baseline emissions for liquid fuels only CO2 is included while for gaseous fuels CO2 and
CH4 is included. N2O emissions are not included.
B.4. Description of baseline and its development:
Baseline Determination
Alternatives that were studied include:
1. Metro extension, tram or light duty rail
2. Bus lanes
3. Continuation of the current public transport system
4. Implementation of the project without CDM
All alternatives are compatible with legal requirements.
Metro extension as well as the establishment of BRT type bus lanes is not feasible due to the topographic
conditions of the project areas where the cable car lines are established, due to the large investment cost
and due to the limited passenger density in the project areas not warranting mass transit systems of this
type.
A continuation of the existing public transport system does not require investments, nor does it face
resistance of bus operators. Also, albeit with deficiencies, the current public transport systems is working
and operational. This is thus an alternative without major negative points and without risk for ETMVA.
The implementation of the project in absence of the CDM is not probable. This is demonstrated in
chapter B.5.

PROJECT DESIGN DOCUMENT FORM (CDM-SSC-PDD) - Version 03
CDM – Executive Board
15
Baseline Description
GHG emission reductions are achieved through an improved efficiency of transporting passengers with
the cable car compared to the traditional transport mode passengers would have used in absence of the
project.
Baseline emissions are those which would have been caused by passengers using the cable car and in
absence of latter would have used baseline modes of transport from their trip origin to their trip
destination. Baseline emissions per PKM per mode are fixed ex-ante and are annually updated based on a
technology improvement factor. Total baseline emissions are calculated based on the number of project
passengers, the baseline emission factor per PKM and the trip distance on the respective mode. The
baseline emissions include total trip emissions of project passengers from their trip origin to their trip
destination.
Steps followed to determine baseline emissions are:
1. Identify relevant vehicle categories
2. Determine emissions per kilometre of vehicle categories through fuel consumption data
3. Determine emissions per passenger-kilometre though occupation data per mode category or
through average trip distance per passenger per mode category
4. Determine trip modes and trip distances of cable car passengers in absence of the project based
on a survey realized of cable car users
5. Calculate total baseline emissions based on the average baseline trip emissions and the number
of passengers transported by the cable car.
For formulas applied see section B.6.
B.5. Description of how the anthropogenic emissions of GHG by sources are reduced below
those that would have occurred in the absence of the registered small-scale CDM project activity:
The additionality of the project is determined using the “Tool for the demonstration and assessment of
additionality (version 05, EB 39 Annex 10)”. Also the EB 35 Annex 34 Guideline on “Non-binding best
practice examples to demonstrate additionality for SSC project activities” was used.
The project starting date is before the start of validation. Therefore proof is given that CDM was
considered before the project starting date. The project starting date is defined in accordance with EB 41
Paragraph 67. EB 41 Annex 46 “Guidance on the demonstration and assessment of prior consideration of
the CDM” was also taken into account, specifically Paragraph C.
Table 3: CDM Project Chronology
Milestone Date Documentary Proof
Identification of the cable car as CDM project 8.2.2002 Article El Tiempo, 8.2.2002, p.2711
PIN draft cable car (2 versions) 13.1.2003
and
PIN draft 112 and CAEMA PIN
13
Metrocable authored byIsabel Crisitina
11 File 30
12 File 31
PROJECT DESIGN DOCUMENT FORM (CDM-SSC-PDD) - Version 03
CDM – Executive Board
16
16.1.2003 Giraldo (ETMVA) 16.1.2003 and
CAEMA 13.1.2003
Presentation of cable car as CDM project to the Ministry
of Environment
April/May
2003
Document Sistemas de Telecabinas
Metrocable14
Contract and construction start line K 11.4.2003 Acta de Inicio dated 11.4.200315
Presentation of cable car as CDM project by Metro
Medellin at an international event of CAEMA
7-9.5.2003 Resolucion 2975 dated 2.5.200316
Delivery of final PIN for project 5.5.2003 PIN CAEMA17
CDM calculations 8.5.2003 grütter consulting18
Initial draft PDD 30.10.2003 PDD grütter consulting19
Contacts with potential buyers (various) 2003
onwards
e.g. Memo Natsource dated 30.10.2003,
Velnec20
Follow-up reports on CDM project Various Informes de avance21
Operational start Line K 31.7.2004 Press Article El Colombiano22
Contract signature construction Line J 6.10.2006 Contrato CN-2006-011723
Construction start Line J 11.10.2006 Acta de Inicio Contrato CN-2006-011724
Methodology submitted to the UNFCCC 14.2.2008 Methodology submission form
Operational start Line J 3.3.2008 Press Article El Colombiano25
Construction start Line Arvi 11.9.2008 Acta de Inicio dated 18.9.200826
Methodology approval 26.9.2009 EB 42 report
CDM was clearly considered before starting the project, with grütter consulting being engaged since
early 2003 in the process.
Between 2004 and 2007 a follow-up was made on the activities. Discussions about the methodological
approach were realized. Grütter consulting was ready to develop the methodology once the project would
have a sufficient size (minimum 3 cable cars) due to the significant transaction costs and risks involved
with getting a new methodology and a PDD approved. Grütter consulting therefore first formulated
13 File 32
14 File 33a,b,c
15 File 34
16 File 35
17 File 36
18 File 37
19 File 38
20 Files 39a,b
21 Files 40,a,b,c,d,e,f,g,h,i,j
22 File 41
23 File 42
24 File 42
25 File 43
26 File 44
PROJECT DESIGN DOCUMENT FORM (CDM-SSC-PDD) - Version 03
CDM – Executive Board
17
AM0031 which has the conceptual base for all types of mass transit projects and a much larger market
potential. This would form also the base for the cable car methodology. After nearly 2 years of
discussion this first transport methodology was finally approved by the UNFCCC in the 2nd semester
2006 and the first project got registered (TransMilenio project number 0672) in December 2006. In 2007
grütter consulting refined AM0031 for stand-alone bus lanes (NM0229), a situation comparable to the
cable car. The comments on this methodology served as base for a new version (NM0258 and NM0266)
and as template for the cable car methodology presented to the UNFCCC early 2008. The cable car
methodology developed is thus based on prior work realized. The approach developed in AM0031 was
intended from the start as a general approach for mass urban transit projects relying on comparing GHG
efficiency of various transport modes.
As mentioned a methodology and PDD development for only 1 cable car line was considered as
economically non-feasible. Therefore the project developer waited until a 2nd and third line were near to
implementation before investing in the whole process. This is the reason why no special time pressure
was exerted on the methodology and project development.
STEP 1. IDE�TIFICATIO� OF ALTER�ATIVES TO THE PROJECT ACTIVITY
CO�SISTE�T WITH CURRE�T LAWS A�D REGULATIO�S
Sub-step 1a: Define alternatives to the project activity
Alternatives that were studied included:
1. Metro extension, tram or light duty rail
2. Bus lanes
3. Continuation of the current public transport system
4. Implementation of the project without CDM
As mentioned in B.4. alternatives 1 and 2 are technically (topography of region and existing
infrastructure) and financially (basically investment cost in relation with limited passenger density) not
feasible and are thus not further assessed. The alternatives studied is thus basically a continuation of the
current public transport system and the implementation of the project without CDM
Sub-step 1b. Consistency with mandatory laws and regulations
All alternatives proposed comply with all applicable legal and regulatory requirements.
STEP 2: I�VESTME�T A�ALYSIS
Principles used for all calculations are in accordance with EB 39 Annex 35 “Guidance on the Assessment
of Investment Analysis”:
• The period of assessment taken is 20 years. This is in accordance with EB 39 Annex 35 point 3
where a maximum of 20 years is considered as appropriate.
• Depreciation and other non-cash items such as amortization are not included when calculating
the IRR and the NPV. Also taxation has not been included as cost. This is in accordance with EB
39 Annex 35 point 5.
• All calculations are based on data available, when the initial financial feasibility study was
realized for the respective line (see footnotes). This is in accordance with EB 39 Annex 35 point
6.

PROJECT DESIGN DOCUMENT FORM (CDM-SSC-PDD) - Version 03
CDM – Executive Board
18
• The detailed spreadsheets for each line are available to the Validator, the EB and the UNFCCC
secretariat but are not public domain, due to containing sensitive contractual data.
• Financing expenditures are not included when calculating the IRR. This is in accordance with EB
39 Annex 35 point 8.
• The project cannot be developed by another entity as only ETMVA operates metro services in
Medellin.
• The NPV is calculated with the cost of capital of ETMVA being 16% in national currency
(nominal rate) for the Line K, and 13% for the Line J and for the line ARVI27.
• All calculations are made in current Colombian Pesos (i.e. in nominal values) using an expected
inflation rate of Colombia and a projected annual currency devaluation based on macroeconomic
projections of the National Planning Department of Colombia. It is projected that ticket prices
increase with the inflation rate i.e. remain constant in real terms.
• Sensitivity analysis is made assuming 20% lower investment costs as well as 20% increased
ticket prices28. Increasing ticket prices by 20% would in practice however lead to less passengers
(due to price elasticity) and thus also less than 20% increase of income. This is not taken into
account thus making a very conservative (in the CDM project sense) scenario.
Table 4: Financial Indicators
Line K29,30
Line J31 Line Arvi
32
Total investment 56,358 million COP33 96,910 million COP
34 44,500 million COP
35
Financial participation ETMVA 45%36 27%
37 34%
38
IRR 7.8% 1.9% -1.9%
NPV Negative (- 25,080 million
COP)
Negative (- 57,050
million COP)
Negative (- 29,590
million COP)
Simple Payback 13 years 17 years > 20 years
27 Differences are due to different years in which the financial feasibility was made with changing market
circumstances, not least inflation.
28 Equivalent results are obtained if in general 20% lower costs are assumed; 20% more passengers however will
lead to less favourable results due to increased costs when transporting more passengers e.g. electricity
29 Based on planning documents as of July 2002
30 File 45
31 File 46
32 File 47
33 At exchange rates for 2002 and 2003 21 million USD
34 At exchange rates for 2006 and 2007 36 million USD
35 At exchange rate mid 2008 23 million USD
36 The remaining 55% is paid by the Municipality of Medellin
37 The remaining 73% is paid by the Municipality of Medellin
38 The remaining 66% are paid by: 17% Government of the Province of Antioquia, 34% Municipality of Medellin,
7% Corporación Parque Arví, 9% National Transport Ministry

PROJECT DESIGN DOCUMENT FORM (CDM-SSC-PDD) - Version 03
CDM – Executive Board
19
The IRR of the projects is between a negative value of 1.9% and 7.8%. Line K has the highest nominal
IRR, is however also based on 6% inflation i.e. the IRR in real and not nominal terms is 1.8%. Clearly
none of the lines are thus profitable. Even with optimistic assumptions of 20% lower investment or 20%
higher income all cable car lines remain unprofitable with negative NPVs.
Table 5: Sensitivity Analysis Financial Indicators
Line K Line J Line Arvi
IRR with 20% lower
investment
9.9% 3.7% -0.2%
NPV with 20% lower
investment
Negative Negative Negative
IRR with 20% higher
ticket prices
10.9% 5.3% 1.6%
NPV with 20% higher
ticket prices
Negative Negative Negative
For the new lines no detailed economic assessment has yet been made. However the general framework
is comparable to the lines J and K (similar length, construction elements, passenger numbers and ticket
income). Thus no significant variation in relation to the lines J and K can be expected. The higher cost of
the line J, built after line K is also an indication that no general decrease of costs with new lines can be
expected.
The conclusion reached is thus that the project is economically and financially not attractive.
STEP 3: BARRIER A�ALYSIS
Sub-step 3a. Identify barriers that would prevent the implementation of the proposed CDM
project activity
Investment Barrier
The metro of Medellin had a cost overrun of factor 2 and construction took 12 instead of projected 5
years. Due to the cost overrun ETMVA is still engaged in various pending national and international
lawsuits39 thus also having difficulties in achieving favourable financial conditions and new loans.
Investing another 29 million USD (first three lines) in a new mass transit option not used in other parts of
the world is thus a large risk. As with many new and innovative ventures cost overruns are frequent. This
is also documented clearly in the case of the first cable car (Line K) which suffered an increase of
projected costs between March and July 2002 of 12.25%, leading to additional costs for ETMVA of 1.28
million USD. Carbon finance can cover such cost-overruns thus reducing considerably the risk of
ETMVA in investing in new technologies40.
Technological Barrier
No other country in Latin America is using cable cars as mass public transport means. The technology
itself is not used except in singular places for tourism purposes in Colombia. This means that staff needs
39 See for a full description http://www.metrodemedellin.org.co/includes/tribunal_arbtrmnto.asp
40 The income from the CER sale of line K only would e.g. be sufficient to cover fully this cost overrun (based on
3x7 years crediting period with annually 5,300tCERs (line K only) at an average net sales price of 18 USD (70% of
CER 2008 sales price as published on EEX)

PROJECT DESIGN DOCUMENT FORM (CDM-SSC-PDD) - Version 03
CDM – Executive Board
20
to be trained and know-how needs to be assimilated. The project is thus clearly very innovative bearing
significant technical risks.
Prevailing Practice and First of its Kind
The project is clearly a ‘first of its kind”. No other cable car systems for mass transit operate in Colombia
or in any other country of Latin America. Also world-wide it is unique to use cable cars as a mass
transport option. The only identified aerial cable cars which are used as mass transit systems is the
Roosevelt Island Tramway in the USA41. However the Roosevelt Island Tramway transports not more
than 3,000 passengers per day which is the hourly capacity of line K or line J per direction. The Portland
Aerial Tram in the USA42 has only started operations January 2007 i.e. after cable car line K entered in
operations. Also this cable car carries only a fraction of the passengers transported by the cable car lines
K and J. The Portland cable car transports daily less than 5,000 passengers while Line K transports on a
typical day more than 35,000 passengers i.e. 7x more. The cable cars of Medellin can thus be considered
unique and first of its kind worldwide. The prevailing practice in Medellin as well as other cities is a bus
system based on a multiple number of different types of vehicles. Small buses are for the steep slopes and
narrow roads of the project region the most appropriate conventional vehicle types and would thus
continue to operate in the same scale in absence of the project activity.
According to the draft methodological tool CDM Methodology Panel Meeting 34 Annex 10 “Note on the
barrier -first-of-its kind” the cable car project clearly represents this case. According to this tool “A
project activity is assumed to be additional if no similar project has been implemented previously in a
certain geographical area. If a project activity is “first-of-its-kind”, it is clear that implementation of the
specific technology is not yet “common practice”. If a project activity is “first-of-its-kind”, no additional
assessment steps are undertaken to confirm additionality. Considering the guidance of the tool the
cable car project is a clear cut case of first-of-its-kind:
• The project technology43 has not been in commercial operation in the applicable geographical
area44
• The project technology has not been proposed by another CDM project worldwide
The cable car faces significant barriers not prevalent to the current bus based mass transit system. CDM
can help to alleviate these barriers basically by allowing for more financial flexibility and thus reducing
the exposure and risk of ETMVA. It also allows for a capitalization of the global environmental benefit
of the project not only in financial terms but positioning the company as a leader in environmental terms.
Registering the project as a CDM project also alleviates the barrier of co-financing of the Municipality of
Medellin due to the image gained in realizing efforts which promote the usage of clean and
environmentally friendly technologies contributing to reduce the effects of global warming.
The implementation of this project with carbon finance can promote this environmentally friendly and
innovative technology for mass transit purposes and can thus contribute towards making public transit
41 See http://www.rioc.com/thetram.htm
42 See http://www.portlandtram.org/
43 The specific project technology is to use cable cars for mass transit purposes: this is technologically seen
significantly different from low density tourism usage due to demands on wear and tear, mass passenger handling
and continuous high load operations
44 The applicable geographical area is the country. No comparable technology is used in total Latin America.
PROJECT DESIGN DOCUMENT FORM (CDM-SSC-PDD) - Version 03
CDM – Executive Board
21
more attractive while reducing GHG emissions. The project can claim to be one of the few truly
innovative and unique climate friendly technologies proposed under the CDM.
Sub-step 3 b. Show that the identified barriers would not prevent the implementation of at least
one of the alternatives (except the proposed project activity)
A continuation of current practices does not face any of above mentioned barriers.
STEP 4. COMMO� PRACTICE A�ALYSIS
Sub-step 4a. Analyze other activities similar to the proposed project activity
No other mass transit system for urban public transport based on cable cars operates in Colombia or in
Latin America at the time of project design Line K. Only one comparable system operated worldwide in
the year 2003 (see above) and even this system had a far lower capacity than the cable car of Medellin.
See also arguments presented above showing that the project is first-of-its-kind.
Sub-step 4b. Discuss any similar options that are occurring
No other company or institution implementing a similar project has been identified.
B.6. Emission reductions:
B.6.1. Explanation of methodological choices:
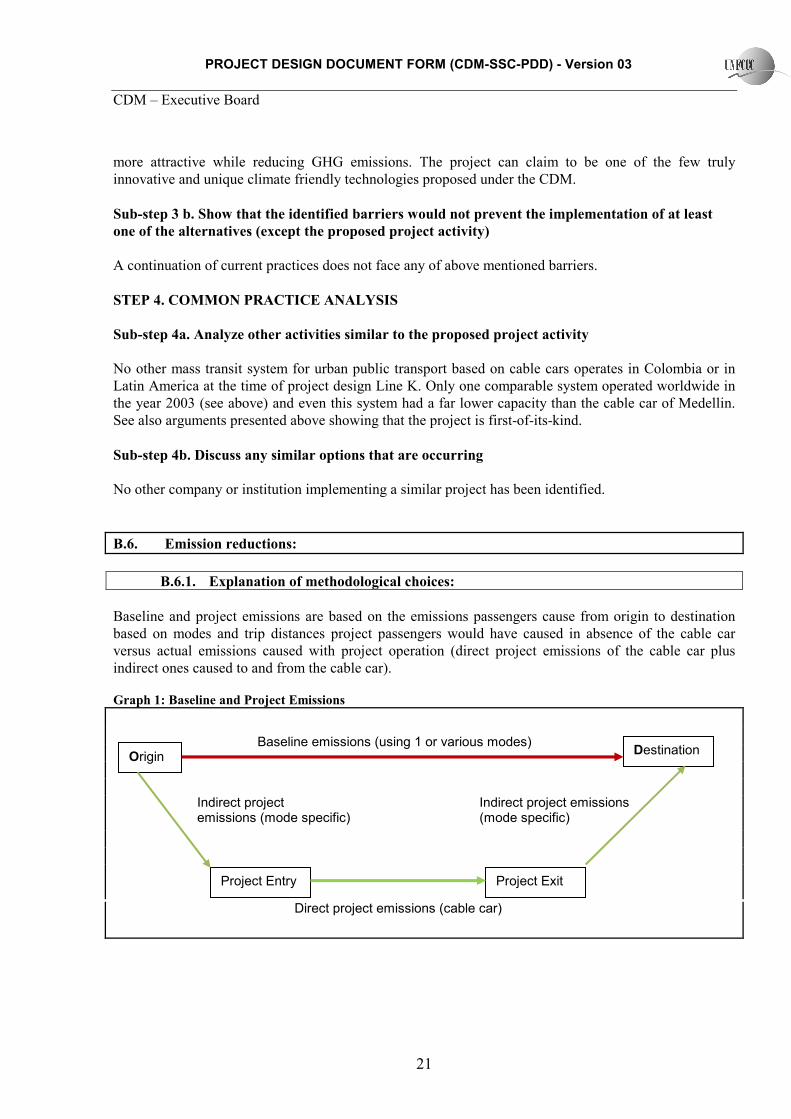
Baseline and project emissions are based on the emissions passengers cause from origin to destination
based on modes and trip distances project passengers would have caused in absence of the cable car
versus actual emissions caused with project operation (direct project emissions of the cable car plus
indirect ones caused to and from the cable car).
Graph 1: Baseline and Project Emissions
Origin Destination
Baseline emissions (using 1 or various modes)
Project Entry Project Exit
Direct project emissions (cable car)
Indirect project emissions (mode specific)
Indirect project emissions (mode specific)
PROJECT DESIGN DOCUMENT FORM (CDM-SSC-PDD) - Version 03
CDM – Executive Board
22
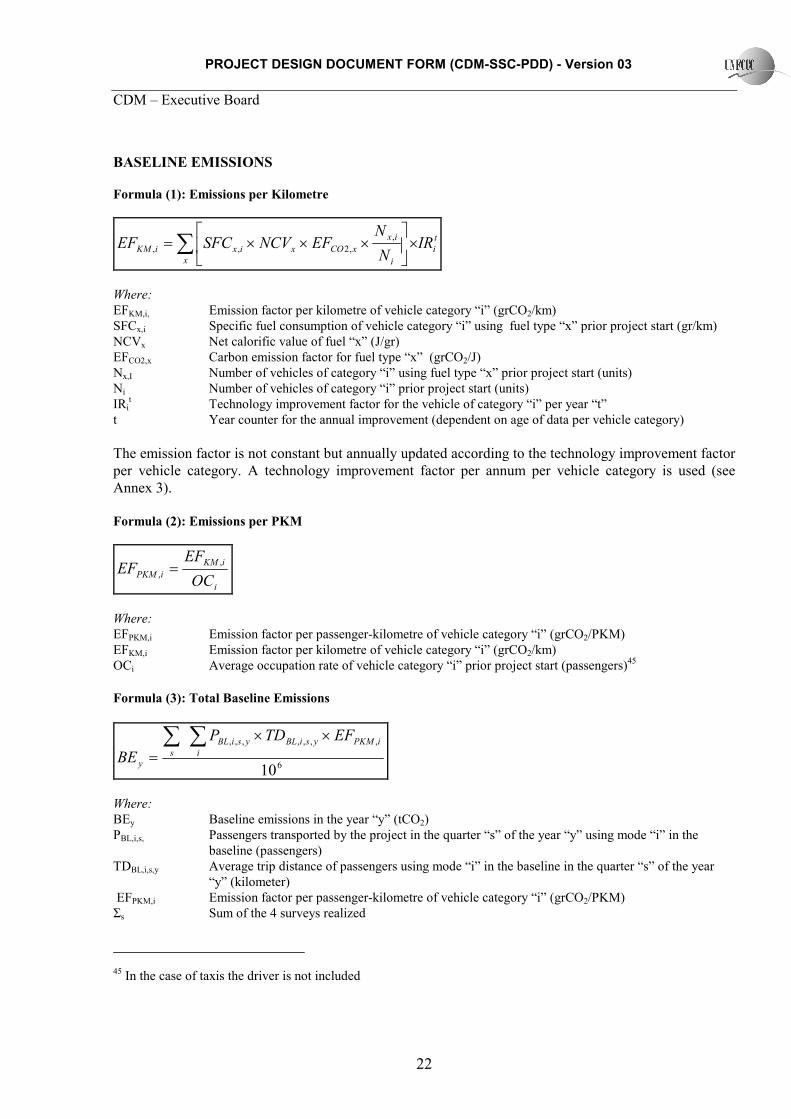
BASELI�E EMISSIO�S
Formula (1): Emissions per Kilometre
t
i
x i
ix
xCOxixiKM IR�
�EF�CVSFCEF ∑ ×
×××= ,
,2,,
Where:
EFKM,i, Emission factor per kilometre of vehicle category “i” (grCO2/km)
SFCx,i Specific fuel consumption of vehicle category “i” using fuel type “x” prior project start (gr/km)
NCVx Net calorific value of fuel “x” (J/gr)
EFCO2,x Carbon emission factor for fuel type “x” (grCO2/J)
Nx,I Number of vehicles of category “i” using fuel type “x” prior project start (units)
Ni Number of vehicles of category “i” prior project start (units)
IRit Technology improvement factor for the vehicle of category “i” per year “t”
t Year counter for the annual improvement (dependent on age of data per vehicle category)
The emission factor is not constant but annually updated according to the technology improvement factor
per vehicle category. A technology improvement factor per annum per vehicle category is used (see
Annex 3).
Formula (2): Emissions per PKM
i
iKM
iPKMOC
EFEF
,
, =
Where:
EFPKM,i Emission factor per passenger-kilometre of vehicle category “i” (grCO2/PKM)
EFKM,i Emission factor per kilometre of vehicle category “i” (grCO2/km)
OCi Average occupation rate of vehicle category “i” prior project start (passengers)45
Formula (3): Total Baseline Emissions
6
,,,,,,,
10
∑∑ ××
= i
iPKMysiBLysiBL
s
y
EFTDP
BE
Where:
BEy Baseline emissions in the year “y” (tCO2)
PBL,i,s, Passengers transported by the project in the quarter “s” of the year “y” using mode “i” in the
baseline (passengers)
TDBL,i,s,y Average trip distance of passengers using mode “i” in the baseline in the quarter “s” of the year
“y” (kilometer)
EFPKM,i Emission factor per passenger-kilometre of vehicle category “i” (grCO2/PKM)
Σs Sum of the 4 surveys realized
45 In the case of taxis the driver is not included
PROJECT DESIGN DOCUMENT FORM (CDM-SSC-PDD) - Version 03
CDM – Executive Board
23
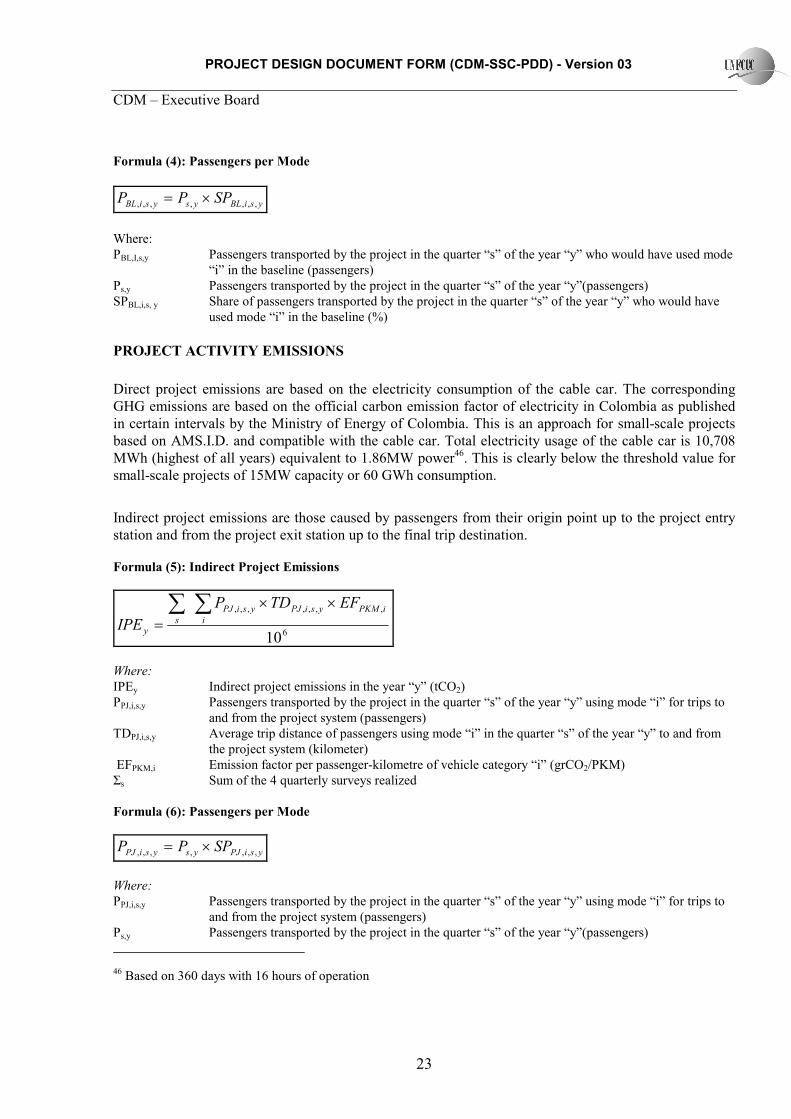
Formula (4): Passengers per Mode
ysiBLysysiBL SPPP ,,,,,,, ×=
Where:
PBL,I,s,y Passengers transported by the project in the quarter “s” of the year “y” who would have used mode
“i” in the baseline (passengers)
Ps,y Passengers transported by the project in the quarter “s” of the year “y”(passengers)
SPBL,i,s, y Share of passengers transported by the project in the quarter “s” of the year “y” who would have
used mode “i” in the baseline (%)
PROJECT ACTIVITY EMISSIO�S
Direct project emissions are based on the electricity consumption of the cable car. The corresponding
GHG emissions are based on the official carbon emission factor of electricity in Colombia as published
in certain intervals by the Ministry of Energy of Colombia. This is an approach for small-scale projects
based on AMS.I.D. and compatible with the cable car. Total electricity usage of the cable car is 10,708
MWh (highest of all years) equivalent to 1.86MW power46. This is clearly below the threshold value for
small-scale projects of 15MW capacity or 60 GWh consumption.
Indirect project emissions are those caused by passengers from their origin point up to the project entry
station and from the project exit station up to the final trip destination.
Formula (5): Indirect Project Emissions
6
,,,,,,,
10
∑∑ ××
= i
iPKMysiPJysiPJ
sy
EFTDP
IPE
Where:
IPEy Indirect project emissions in the year “y” (tCO2)
PPJ,i,s,y Passengers transported by the project in the quarter “s” of the year “y” using mode “i” for trips to
and from the project system (passengers)
TDPJ,i,s,y Average trip distance of passengers using mode “i” in the quarter “s” of the year “y” to and from
the project system (kilometer)
EFPKM,i Emission factor per passenger-kilometre of vehicle category “i” (grCO2/PKM)
Σs Sum of the 4 quarterly surveys realized
Formula (6): Passengers per Mode
ysiPJysysiPJ SPPP ,,,,,,, ×=
Where:
PPJ,i,s,y Passengers transported by the project in the quarter “s” of the year “y” using mode “i” for trips to
and from the project system (passengers)
Ps,y Passengers transported by the project in the quarter “s” of the year “y”(passengers)
46 Based on 360 days with 16 hours of operation
PROJECT DESIGN DOCUMENT FORM (CDM-SSC-PDD) - Version 03
CDM – Executive Board
24
SPPJ,i,s,y Share of passengers transported by the project in the quarter “s” of the year “y” using mode “i” to
and from the project systems (%)
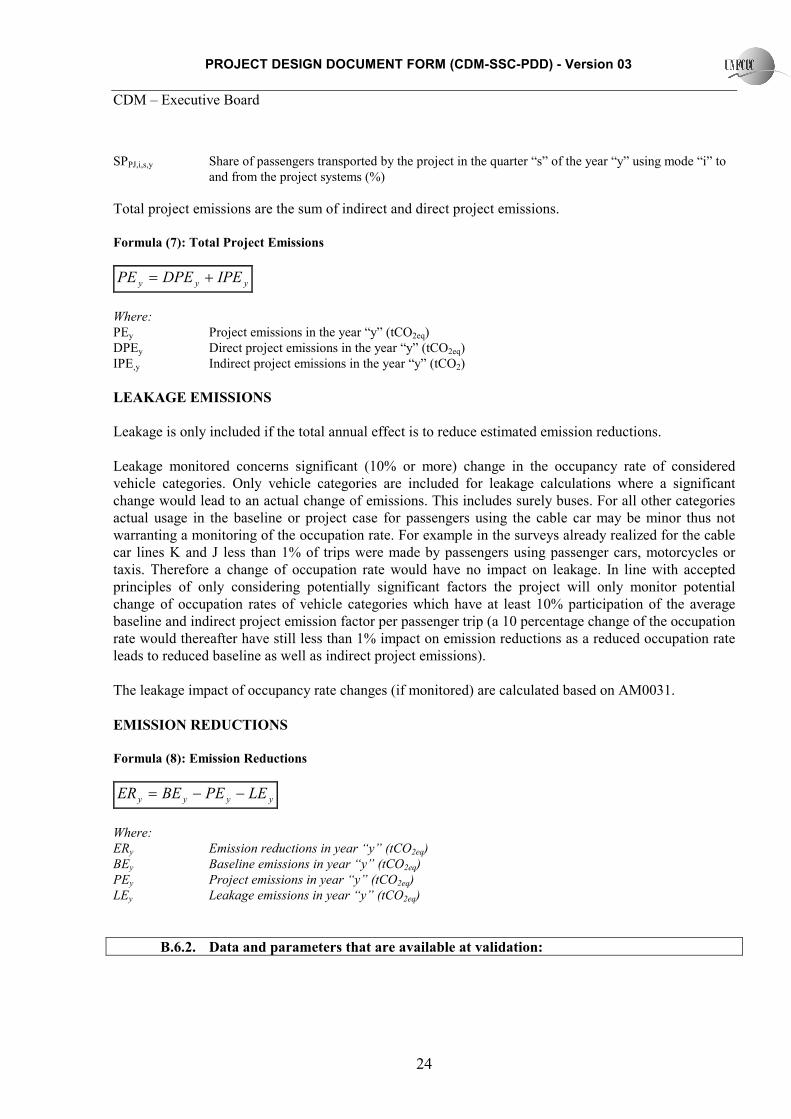
Total project emissions are the sum of indirect and direct project emissions.
Formula (7): Total Project Emissions
yyy IPEDPEPE +=
Where:
PEy Project emissions in the year “y” (tCO2eq)
DPEy Direct project emissions in the year “y” (tCO2eq)
IPE,y Indirect project emissions in the year “y” (tCO2)
LEAKAGE EMISSIO�S
Leakage is only included if the total annual effect is to reduce estimated emission reductions.
Leakage monitored concerns significant (10% or more) change in the occupancy rate of considered
vehicle categories. Only vehicle categories are included for leakage calculations where a significant
change would lead to an actual change of emissions. This includes surely buses. For all other categories
actual usage in the baseline or project case for passengers using the cable car may be minor thus not
warranting a monitoring of the occupation rate. For example in the surveys already realized for the cable
car lines K and J less than 1% of trips were made by passengers using passenger cars, motorcycles or
taxis. Therefore a change of occupation rate would have no impact on leakage. In line with accepted
principles of only considering potentially significant factors the project will only monitor potential
change of occupation rates of vehicle categories which have at least 10% participation of the average
baseline and indirect project emission factor per passenger trip (a 10 percentage change of the occupation
rate would thereafter have still less than 1% impact on emission reductions as a reduced occupation rate
leads to reduced baseline as well as indirect project emissions).
The leakage impact of occupancy rate changes (if monitored) are calculated based on AM0031.
EMISSIO� REDUCTIO�S
Formula (8): Emission Reductions
yyyy LEPEBEER −−=
Where:
ERy Emission reductions in year “y” (tCO2eq)
BEy Baseline emissions in year “y” (tCO2eq)
PEy Project emissions in year “y” (tCO2eq)
LEy Leakage emissions in year “y” (tCO2eq)
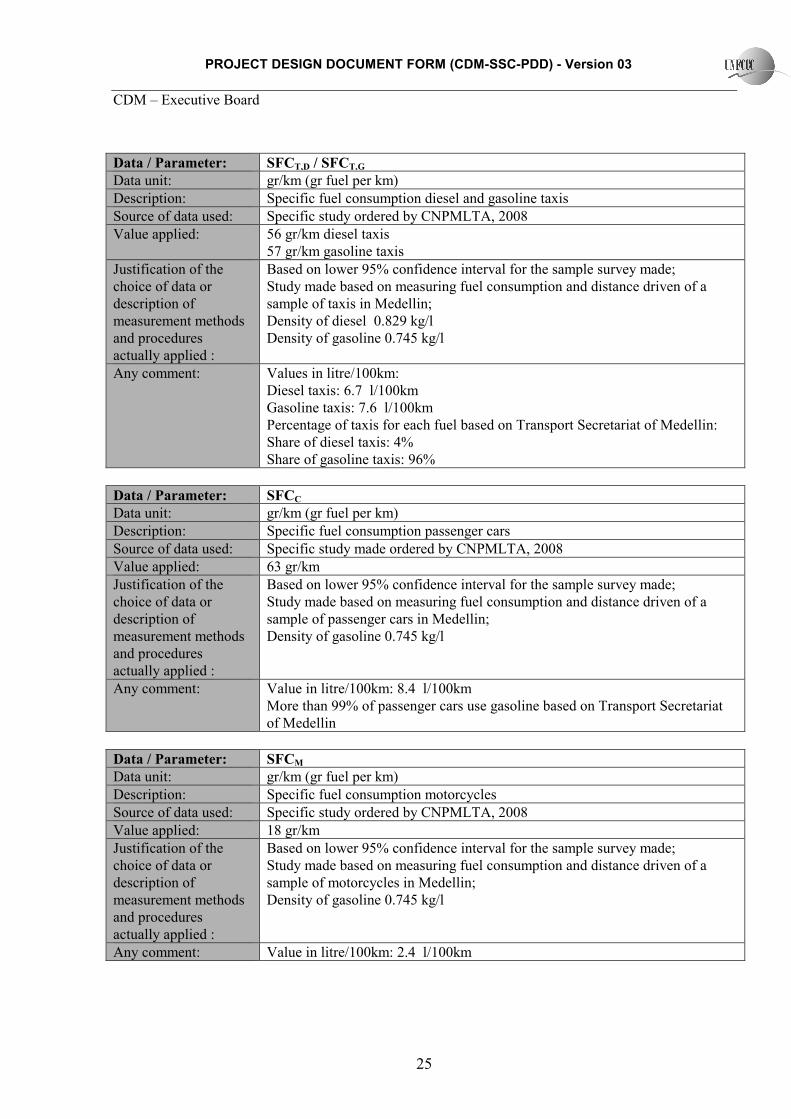
B.6.2. Data and parameters that are available at validation:
PROJECT DESIGN DOCUMENT FORM (CDM-SSC-PDD) - Version 03
CDM – Executive Board
25
Data / Parameter: SFCT,D / SFCT,G
Data unit: gr/km (gr fuel per km)
Description: Specific fuel consumption diesel and gasoline taxis
Source of data used: Specific study ordered by CNPMLTA, 2008
Value applied: 56 gr/km diesel taxis
57 gr/km gasoline taxis
Justification of the
choice of data or
description of
measurement methods
and procedures
actually applied :
Based on lower 95% confidence interval for the sample survey made;
Study made based on measuring fuel consumption and distance driven of a
sample of taxis in Medellin;
Density of diesel 0.829 kg/l
Density of gasoline 0.745 kg/l
Any comment: Values in litre/100km:
Diesel taxis: 6.7 l/100km
Gasoline taxis: 7.6 l/100km
Percentage of taxis for each fuel based on Transport Secretariat of Medellin:
Share of diesel taxis: 4%
Share of gasoline taxis: 96%
Data / Parameter: SFCC
Data unit: gr/km (gr fuel per km)
Description: Specific fuel consumption passenger cars
Source of data used: Specific study made ordered by CNPMLTA, 2008
Value applied: 63 gr/km
Justification of the
choice of data or
description of
measurement methods
and procedures
actually applied :
Based on lower 95% confidence interval for the sample survey made;
Study made based on measuring fuel consumption and distance driven of a
sample of passenger cars in Medellin;
Density of gasoline 0.745 kg/l
Any comment: Value in litre/100km: 8.4 l/100km
More than 99% of passenger cars use gasoline based on Transport Secretariat
of Medellin
Data / Parameter: SFCM
Data unit: gr/km (gr fuel per km)
Description: Specific fuel consumption motorcycles
Source of data used: Specific study ordered by CNPMLTA, 2008
Value applied: 18 gr/km
Justification of the
choice of data or
description of
measurement methods
and procedures
actually applied :
Based on lower 95% confidence interval for the sample survey made;
Study made based on measuring fuel consumption and distance driven of a
sample of motorcycles in Medellin;
Density of gasoline 0.745 kg/l
Any comment: Value in litre/100km: 2.4 l/100km

PROJECT DESIGN DOCUMENT FORM (CDM-SSC-PDD) - Version 03
CDM – Executive Board
26
Data / Parameter: SFCB,M / SFCB,S
Data unit: gr/km (gr fuel per km)
Description: Specific fuel consumption diesel of medium and small buses
Source of data used: Specific study made ordered by CNPMLTA, 2008
Value applied: 237 gr/km medium buses
160 gr/km small buses
Justification of the
choice of data or
description of
measurement methods
and procedures
actually applied :
Based on lower 95% confidence interval for the sample survey made;
Study made based on measuring fuel consumption and distance driven of a
sample of buses in Medellin;
Density of diesel 0.829 kg/l
All buses registered diesel.
Only small and medium buses registered on routes used in area of cable cars
Any comment: Values in litre/100km:
Medium buses: 28.6 l/100km
Small buses: 19.3 l/100km
Share of medium buses 59% and small buses 41% based on registration of all
buses in area of influence of project
Data / Parameter: �CVD / �CVG
Data unit: MJ/kg
Description: Net calorific value of diesel and gasoline
Source of data used: Academia Colombiana de Ciencias Exactas, Fisicas y Naturales realized for
UPME (Unidad de Planeacion Minero Energetica) of the Ministry of Mines and
Energy
Value applied: 42.67 diesel
42.44 gasoline
Justification of the
choice of data or
description of
measurement methods
and procedures
actually applied :
National official data
Lower heat value is taken thus conservative
Any comment:
Data / Parameter: EFCO2,D / EFCO2,G
Data unit: grCO2/MJ
Description: Carbon emission factor of diesel and gasoline
Source of data used: Academia Colombiana de Ciencias Exactas, Fisicas y Naturales realized for
UPME (Unidad de Planeacion Minero Energetica) of the Ministry of Mines and
Energy
Value applied: 73.9 diesel
74.6 gasoline
Justification of the
choice of data or
description of
measurement methods
and procedures
National official data
PROJECT DESIGN DOCUMENT FORM (CDM-SSC-PDD) - Version 03
CDM – Executive Board
27
actually applied :
Any comment:
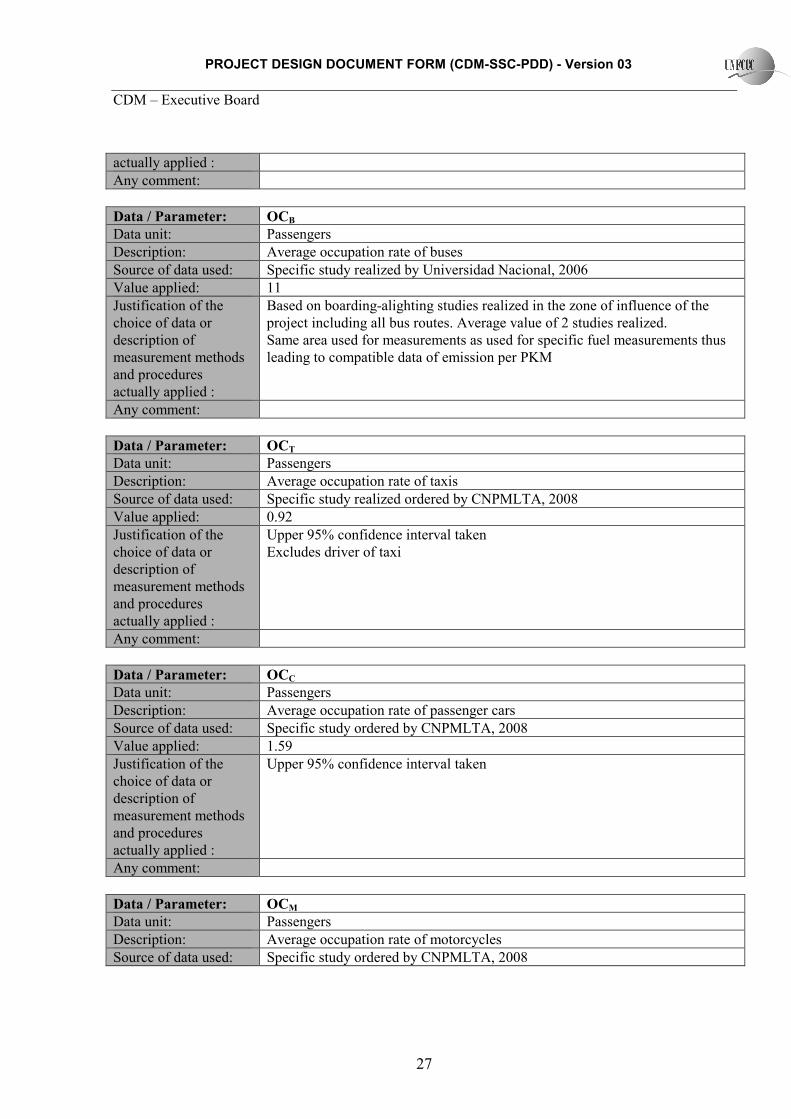
Data / Parameter: OCB
Data unit: Passengers
Description: Average occupation rate of buses
Source of data used: Specific study realized by Universidad Nacional, 2006
Value applied: 11
Justification of the
choice of data or
description of
measurement methods
and procedures
actually applied :
Based on boarding-alighting studies realized in the zone of influence of the
project including all bus routes. Average value of 2 studies realized.
Same area used for measurements as used for specific fuel measurements thus
leading to compatible data of emission per PKM
Any comment:
Data / Parameter: OCT
Data unit: Passengers
Description: Average occupation rate of taxis
Source of data used: Specific study realized ordered by CNPMLTA, 2008
Value applied: 0.92
Justification of the
choice of data or
description of
measurement methods
and procedures
actually applied :
Upper 95% confidence interval taken
Excludes driver of taxi
Any comment:
Data / Parameter: OCC
Data unit: Passengers
Description: Average occupation rate of passenger cars
Source of data used: Specific study ordered by CNPMLTA, 2008
Value applied: 1.59
Justification of the
choice of data or
description of
measurement methods
and procedures
actually applied :
Upper 95% confidence interval taken
Any comment:
Data / Parameter: OCM
Data unit: Passengers
Description: Average occupation rate of motorcycles
Source of data used: Specific study ordered by CNPMLTA, 2008

PROJECT DESIGN DOCUMENT FORM (CDM-SSC-PDD) - Version 03
CDM – Executive Board
28
Value applied: 1.21
Justification of the
choice of data or
description of
measurement methods
and procedures
actually applied :
Upper 95% confidence interval taken
Any comment:
Data / Parameter: ECelec, metro
Data unit: kWh
Description: Electricity consumption of metro
Source of data used: ETMVA, 2007
Value applied: 47,923,361
Justification of the
choice of data or
description of
measurement methods
and procedures
actually applied :
Based on aggregated monthly data
Based on electricity used for traction
Any comment:
Data / Parameter: Pmetro
Data unit: Passengers
Description: Passengers transported of metro
Source of data used: ETMVA, 2007
Value applied: 133,983,496
Justification of the
choice of data or
description of
measurement methods
and procedures
actually applied :
Based on aggregated monthly data
Identical database as for electricity usage
Any comment:
Data / Parameter: TDmetro
Data unit: Kilometre
Description: Average trip distance of metro passengers
Source of data used: ETMVA, year 2007
Value applied: 9.5
Justification of the
choice of data or
description of
measurement methods
and procedures
actually applied :
Based on origin-destination surveys
Same year and database as for electricity consumption and passenger numbers
of metro
Any comment: The project will only monitor potential change of occupation rates of vehicle

PROJECT DESIGN DOCUMENT FORM (CDM-SSC-PDD) - Version 03
CDM – Executive Board
29
categories which have at least 10% participation of the average baseline and
indirect project emission factor per passenger trip (a 10 percentage change of
the occupation rate would thereafter have still less than 1% impact on emission
reductions as a reduced occupation rate leads to reduced baseline as well as
indirect project emissions).
B.6.3 Ex-ante calculation of emission reductions:
Baseline Emissions
Table 6: Estimated Baseline Emissions (tCO2)
2009 2010 2011 2012 2013 2014 2015 2016 Total
11,325 15,712 26,832 32,790 33,635 34,483 35,392 9,084 199,253
Data includes 9 months in 2009 and 3 months in 2016.
Project Emissions
Table 7: Estimated Project Emissions (tCO2)
2009 2010 2011 2012 2013 2014 2015 2016 Total
4,426 6,112 10,853 13,390 13,706 14,034 14,373 3,681 80,577
Data includes 9 months in 2009 and 3 months in 2016.
Leakage Emissions
Leakage emissions are zero based on no expected change of occupation rates.
B.6.4 Summary of the ex-ante estimation of emission reductions:
Year Estimation of project
activity emissions
(tCO2e)
Estimation of
baseline emissions
(tCO2e)
Estimation of
leakage (tCO2e)
Estimation of overall
emission reductions
(tCO2e)
2009 (9 months) 4,426 11,325 0 6,900
2010 6,112 15,712 0 9,600
2011 10,853 26,832 0 15,979
2012 13,390 32,790 0 19,399
2013 13,706 33,635 0 19,929
2014 14,034 34,483 0 20,449
2015 14,373 35,392 0 21,018
2016 (3 months) 3,681 9,084 0 5,402
Total (tCO2e) 80,577 199,253 0 118,676
B.7 Application of a monitoring methodology and description of the monitoring plan:
B.7.1 Data and parameters monitored:

PROJECT DESIGN DOCUMENT FORM (CDM-SSC-PDD) - Version 03
CDM – Executive Board
30
Data / Parameter: P
Data unit: Passengers
Description: Passengers transported by each cable car
Source of data to be
used:
ETMVA
Value of data applied
for the purpose of
calculating expected
emission reductions in
section B.5
Projected passenger per cable car line (millions)
Line 2009 2010 2011 2012 2013 2014 2015 2016
K 9.04 12.20 12.34 12.49 12.64 12.79 12.95 3.28
J 5.72 8.40 9.24 9.37 9.52 9.66 9.80 2.49
Arvi 0.84 1.14 1.16 1.18 1.20 1.22 1.23 0.31
C-Occ 0 0 8.48 8.61 8.74 8.87 9.00 2.28
Ext B47 0 0 8.18 17.18 18.04 18.94 19.89 5.22
Description of
measurement methods
and procedures to be
applied:
Passenger numbers based on entry statistics based on turnpikes (daily,
aggregated monthly)
QA/QC procedures to
be applied:
Passenger numbers based on automated ticketing controls at stations.
Any comment: 2009 based on 9 months and 2016 on 3 months
Data / Parameter: IPEP
Data unit: grCO2/passenger
Description: Indirect project emissions per passengers
Source of data: Specific survey
Value of data applied
for the purpose of
calculating expected
emission reductions in
section B.5
Projected indirect project emissions per passenger (grCO2)
Line 2009 2010 2011 2012 2013 2014 2015 2016
K 186 186 186 186 186 186 186 186
J 183 183 183 183 183 183 183 183
Arvi 185 185 185 185 185 185 185 185
C-Occ 185 185 185 185 185 185
Ext B48 185 185 185 185 185 185
Measurement
procedures (if any):
4 surveys in total realized after full project operation for each cable car
(quarterly). See annex 4 for details of survey. The survey identifies the trip
(mode and distance) from origin to cable car entry station and from project cable
car exit station to final destination.
The average value of the 4 surveys will be used for calculation of the indirect
project emissions per cable car.
For projection purposes the values of 1 survey each realized October 2008 on the
cable car lines K and J was taken.
The emissions of the metro influencing the indirect project emissions are
updated based on the availability (publication) of new carbon emission factor of
47 2 units
48 2 units
PROJECT DESIGN DOCUMENT FORM (CDM-SSC-PDD) - Version 03
CDM – Executive Board
31
the Ministry of Mines and Energy.
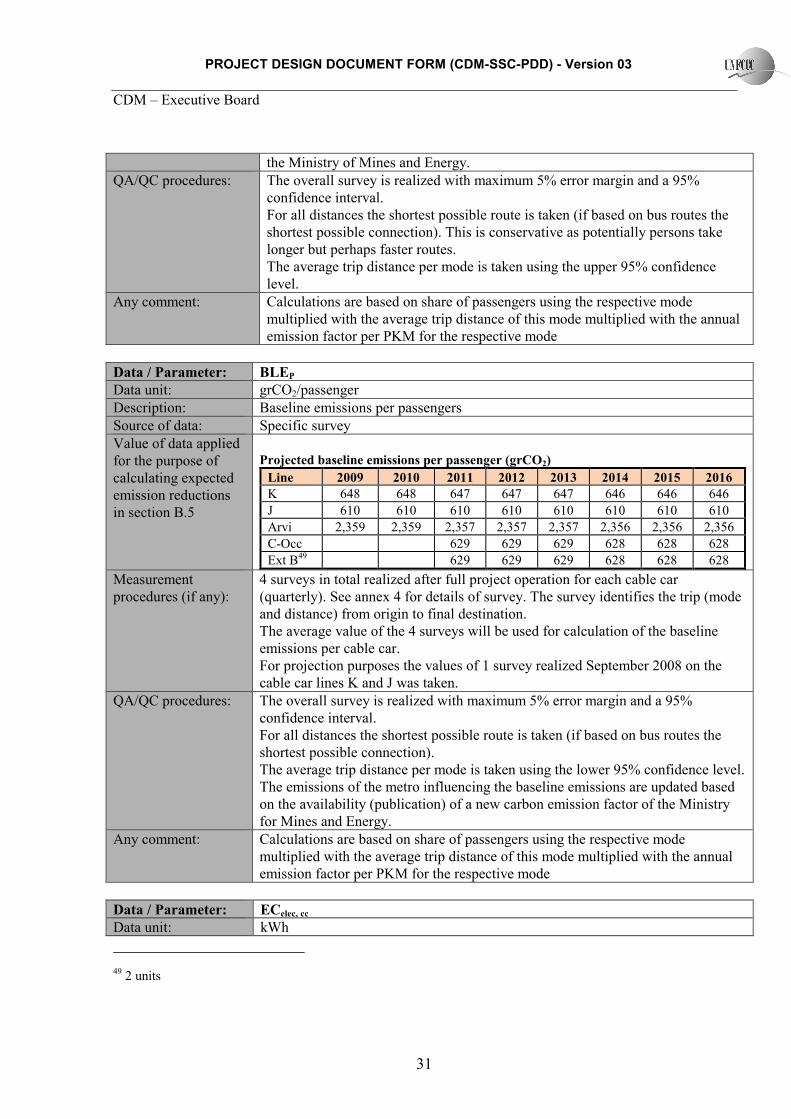
QA/QC procedures: The overall survey is realized with maximum 5% error margin and a 95%
confidence interval.
For all distances the shortest possible route is taken (if based on bus routes the
shortest possible connection). This is conservative as potentially persons take
longer but perhaps faster routes.
The average trip distance per mode is taken using the upper 95% confidence
level.
Any comment: Calculations are based on share of passengers using the respective mode
multiplied with the average trip distance of this mode multiplied with the annual
emission factor per PKM for the respective mode
Data / Parameter: BLEP
Data unit: grCO2/passenger
Description: Baseline emissions per passengers
Source of data: Specific survey
Value of data applied
for the purpose of
calculating expected
emission reductions
in section B.5
Projected baseline emissions per passenger (grCO2)
Line 2009 2010 2011 2012 2013 2014 2015 2016
K 648 648 647 647 647 646 646 646
J 610 610 610 610 610 610 610 610
Arvi 2,359 2,359 2,357 2,357 2,357 2,356 2,356 2,356
C-Occ 629 629 629 628 628 628
Ext B49 629 629 629 628 628 628
Measurement
procedures (if any):
4 surveys in total realized after full project operation for each cable car
(quarterly). See annex 4 for details of survey. The survey identifies the trip (mode
and distance) from origin to final destination.
The average value of the 4 surveys will be used for calculation of the baseline
emissions per cable car.
For projection purposes the values of 1 survey realized September 2008 on the
cable car lines K and J was taken.
QA/QC procedures: The overall survey is realized with maximum 5% error margin and a 95%
confidence interval.
For all distances the shortest possible route is taken (if based on bus routes the
shortest possible connection).
The average trip distance per mode is taken using the lower 95% confidence level.
The emissions of the metro influencing the baseline emissions are updated based
on the availability (publication) of a new carbon emission factor of the Ministry
for Mines and Energy.
Any comment: Calculations are based on share of passengers using the respective mode
multiplied with the average trip distance of this mode multiplied with the annual
emission factor per PKM for the respective mode
Data / Parameter: ECelec, cc
Data unit: kWh
49 2 units
PROJECT DESIGN DOCUMENT FORM (CDM-SSC-PDD) - Version 03
CDM – Executive Board
32
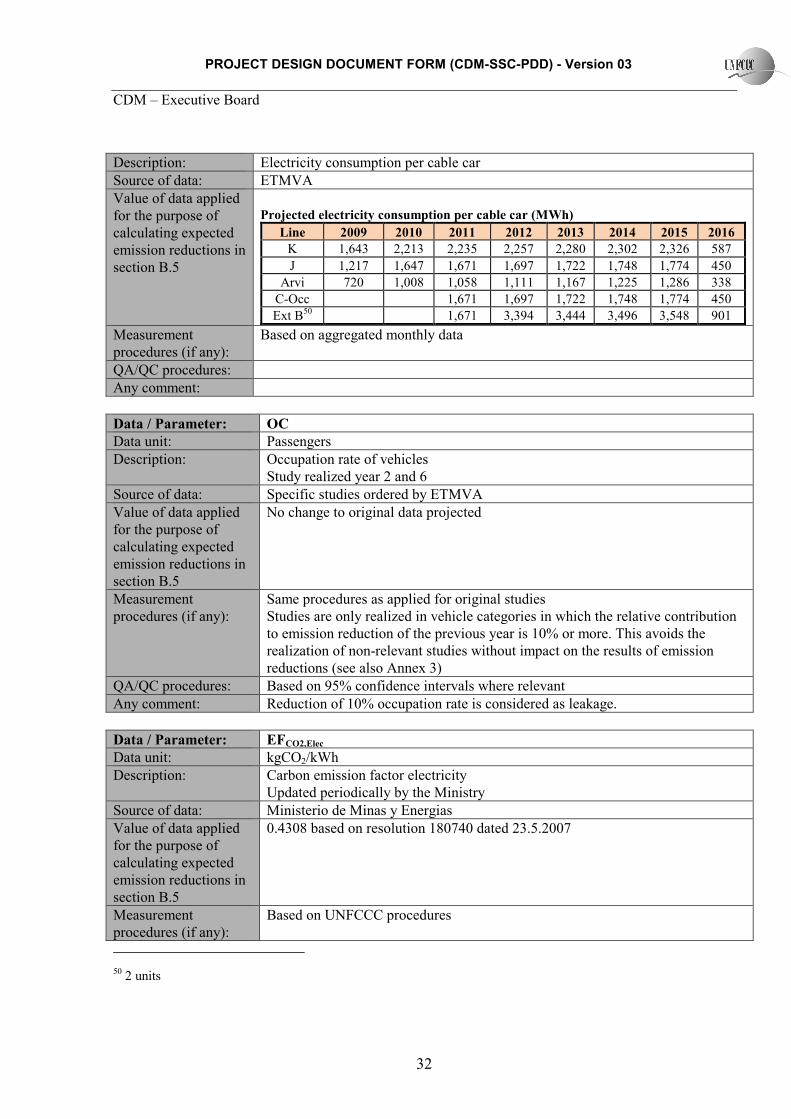
Description: Electricity consumption per cable car
Source of data: ETMVA
Value of data applied
for the purpose of
calculating expected
emission reductions in
section B.5
Projected electricity consumption per cable car (MWh)
Line 2009 2010 2011 2012 2013 2014 2015 2016
K 1,643 2,213 2,235 2,257 2,280 2,302 2,326 587
J 1,217 1,647 1,671 1,697 1,722 1,748 1,774 450
Arvi 720 1,008 1,058 1,111 1,167 1,225 1,286 338
C-Occ 1,671 1,697 1,722 1,748 1,774 450
Ext B50 1,671 3,394 3,444 3,496 3,548 901
Measurement
procedures (if any):
Based on aggregated monthly data
QA/QC procedures:
Any comment:
Data / Parameter: OC
Data unit: Passengers
Description: Occupation rate of vehicles
Study realized year 2 and 6
Source of data: Specific studies ordered by ETMVA
Value of data applied
for the purpose of
calculating expected
emission reductions in
section B.5
No change to original data projected
Measurement
procedures (if any):
Same procedures as applied for original studies
Studies are only realized in vehicle categories in which the relative contribution
to emission reduction of the previous year is 10% or more. This avoids the
realization of non-relevant studies without impact on the results of emission
reductions (see also Annex 3)
QA/QC procedures: Based on 95% confidence intervals where relevant
Any comment: Reduction of 10% occupation rate is considered as leakage.
Data / Parameter: EFCO2,Elec
Data unit: kgCO2/kWh
Description: Carbon emission factor electricity
Updated periodically by the Ministry
Source of data: Ministerio de Minas y Energias
Value of data applied
for the purpose of
calculating expected
emission reductions in
section B.5
0.4308 based on resolution 180740 dated 23.5.2007
Measurement
procedures (if any):
Based on UNFCCC procedures
50 2 units
PROJECT DESIGN DOCUMENT FORM (CDM-SSC-PDD) - Version 03
CDM – Executive Board
33
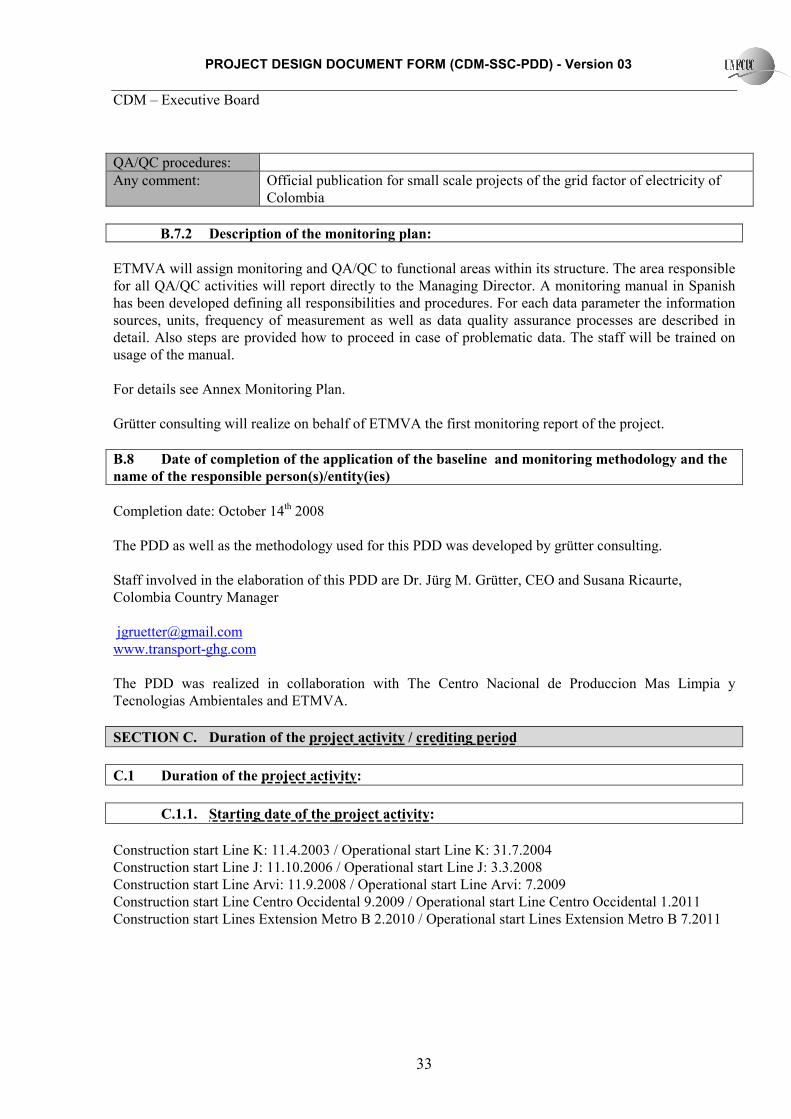
QA/QC procedures:
Any comment: Official publication for small scale projects of the grid factor of electricity of
Colombia
B.7.2 Description of the monitoring plan:
ETMVA will assign monitoring and QA/QC to functional areas within its structure. The area responsible
for all QA/QC activities will report directly to the Managing Director. A monitoring manual in Spanish
has been developed defining all responsibilities and procedures. For each data parameter the information
sources, units, frequency of measurement as well as data quality assurance processes are described in
detail. Also steps are provided how to proceed in case of problematic data. The staff will be trained on
usage of the manual.
For details see Annex Monitoring Plan.
Grütter consulting will realize on behalf of ETMVA the first monitoring report of the project.
B.8 Date of completion of the application of the baseline and monitoring methodology and the
name of the responsible person(s)/entity(ies)
Completion date: October 14th 2008
The PDD as well as the methodology used for this PDD was developed by grütter consulting.
Staff involved in the elaboration of this PDD are Dr. Jürg M. Grütter, CEO and Susana Ricaurte,
Colombia Country Manager
www.transport-ghg.com
The PDD was realized in collaboration with The Centro Nacional de Produccion Mas Limpia y
Tecnologias Ambientales and ETMVA.
SECTIO� C. Duration of the project activity / crediting period
C.1 Duration of the project activity:
C.1.1. Starting date of the project activity:
Construction start Line K: 11.4.2003 / Operational start Line K: 31.7.2004
Construction start Line J: 11.10.2006 / Operational start Line J: 3.3.2008
Construction start Line Arvi: 11.9.2008 / Operational start Line Arvi: 7.2009
Construction start Line Centro Occidental 9.2009 / Operational start Line Centro Occidental 1.2011
Construction start Lines Extension Metro B 2.2010 / Operational start Lines Extension Metro B 7.2011
PROJECT DESIGN DOCUMENT FORM (CDM-SSC-PDD) - Version 03
CDM – Executive Board
34
C.1.2. Expected operational lifetime of the project activity:
30 years
C.2 Choice of the crediting period and related information:
C.2.1. Renewable crediting period
C.2.1.1. Starting date of the first crediting period:
1.4.2009 or the 1st day of the month following project registration at the UNFCCC
C.2.1.2. Length of the first crediting period:
7 years, 0 months
C.2.2. Fixed crediting period:
C.2.2.1. Starting date:
NA
C.2.2.2. Length:
NA
SECTIO� D. Environmental impacts
D.1. If required by the host Party, documentation on the analysis of the environmental impacts
of the project activity:
For each cable car line an environmental impact assessment (EIA) and an environmental management
plan (EMP) was realized through specialized companies51. A separation of environmental impacts during
the construction including pre-construction activities and during the operation of the cable car was made.
An environmental base-line was established with which the project and its possible impacts are
compared.
Following areas are considered in the EIA:
• Construction debris
• Impacts on water resources
• Waste generation
• Soil contamination
51 Files 48a,b,c,d

PROJECT DESIGN DOCUMENT FORM (CDM-SSC-PDD) - Version 03
CDM – Executive Board
35
• Noise pollution
• Air quality impact
• Impact on vegetation
• Impact on transport routes
• Modification of landscape (including cable car stations and operation of cable car)
Environmental impact assessments in Colombia also include social impacts listed here in chapter E.
The environmental management plan contains for each area expedients which indicate exactly the issue,
formulate objectives, define responsibilities and indicators, track changes and control that procedures as
described in the EMP are followed. An example of such an expedient is given in Annex 5.
ETMVA has a person in charge of environmental affairs and has made the follow-up of all environmental
management plans with the entities in charge of construction. ETMVA is since 17.4.2007 ISO 14001
certified.
D.2. If environmental impacts are considered significant by the project participants or the host
Party, please provide conclusions and all references to support documentation of an environmental
impact assessment undertaken in accordance with the procedures as required by the host Party:
During construction the most important environmental impacts considered for all cable car lines is
construction debris.
During operations the most important environmental impacts considered for all cable car lines are:
• Landscape changing: The major impact is due to the stations which are large buildings. During
operations the cable car cabins also constitute a certain change of landscape. The construction
however also leads to new green and recreational spaces, e.g., in the cable car line K.
• Air quality improvement: The project reduces fossil fuel used by private and public transport
means. This reduces local curb-side and ambient air pollution. The main impact is on reduced air
pollution from buses, which are basically diesel powered. Air quality improvement is thus
basically of particle matter, NOx (pre-cursor of ozone), SO2 and to a minor extent HCs (pre-
cursor of ozone) and CO. Particle matter is one of the most serious air pollution problems of the
city resulting in numerous health problems, especially affecting children and elderly people
through respiratory diseases.
Line J had as potential environmental impact additionally a loss of vegetation coverage, possible
collisions of birds with the cable car cabins and potential water pollution during the construction phase.
The Environmental Management Plan realized for each cable car line formulates measures to minimize
and mitigate the potential negative impact on the environment during construction and operations and
defines how to monitor the implementation of all measures. This results in environmental expedients for
all major areas.
The project complies with all local and national environmental regulations and has all required permits
for construction and operation of the cable car lines J, K and Arvi. The other three cable car lines are still
in the planning stage and will thus apply for the environmental permits in a later stage.

PROJECT DESIGN DOCUMENT FORM (CDM-SSC-PDD) - Version 03
CDM – Executive Board
36
The overall environmental impact of the cable car is considered as highly positive especially concerning
air quality improvement and living conditions in the area of influence of the project due to reduced
passenger transport on precarious roads.
SECTIO� E. Stakeholders’ comments
E.1. Brief description how comments by local stakeholders have been invited and compiled:
A social impact plan was realized for each cable car line. Social integration and a positive attitude of the
community towards ETMVA and its activities is one of the most important objectives of all activities
realized by the company52. Therefore Metro Medellin realizes numerous meetings with stakeholders
starting at a very early stage, includes their wishes and in general realizes a large quantity of activities
going far beyond public transport in favour of the local community. Results of such activities are
obviously seen in the line K where lots of improvements took place due to the cable car construction and
living conditions of inhabitants improved considerably. One result is e.g. that criminality dropped
drastically in this area. This positive experience solving not only transport but also social problems is
now being considered, e.g., by Rio de Janeiro which plans to copy the experience of Medellin by
realizing a cable car in the Favelas of Rio most prone to criminality with the goal of providing a
sustainable and environmentally friendly transport mode while also solving severe social problems
through a community program as part of the establishment of a new transit mean.
For the line J and the line K numerous activities were realized with the local community including, e.g.,
“Metroamigos” working with children of the community in recreational and playing activities but also in
social values53, computer training courses, guided visits of the construction areas, cultural activities etc.
Line J realized in total some 50 meetings with stakeholders with some 2,000 participants in total54.
For the Line Arvi working groups for different areas were realized with the local population. The
working groups were created by a meeting with different stakeholders on February 13th, 14
th and 19
th
2008 i.e. before construction start. Working groups include environment, education & culture, social and
economic contribution of the project, safety, living environment and infrastructure. 75 persons
participated in this meeting being individuals as well as representatives of different organizations and
institutions including schools, foundations, associations, environmental groups etc. A list of participants
is attached in Annex 6.
In general the community was invited to participate through various means including meetings, walk-in
information cubicles, street events, schools and internet.
One of the affected stakeholders is people owning property which is required for the cable car
construction. Through the Municipality55 negotiations concerning sale of properties were realized with
all affected people to come to a mutually acceptable solution.
52 Files 49a,b,c
53 Metro J included in this program more than 2,000 children from 15 schools
54 A list of all meetings realized including topic and participants is available for the Validator.
55 Office of negotiations of the Municipality of Medellin

PROJECT DESIGN DOCUMENT FORM (CDM-SSC-PDD) - Version 03
CDM – Executive Board
37
E.2. Summary of the comments received:
Comments are recorded by ETMVA and enter into the social adjustment plan. Questions concerned e.g.
the safety of the cable cars, how the cable car affects the livelihood of people and questions concerning
the functioning of the system.
E.3. Report on how due account was taken of any comments received:
Through regular meetings and working groups of stakeholders suggestions, comments and critical points
were recorded and a follow-up is realized thereafter on actions taken.
ETMVA also receives comments through its website56 and has a special area for relationship with the
community. Equal to the environmental section social expedients are realized with targets, responsible
persons, actions, and monitoring.
56 see http://www.metrodemedellin.org.co/portal/contenidos.asp?sec=4&subsec=21&pagina=1

PROJECT DESIGN DOCUMENT FORM (CDM-SSC-PDD) - Version 03
CDM – Executive Board
38
Annex 1
CO�TACT I�FORMATIO� O� PARTICIPA�TS I� THE PROJECT ACTIVITY
Organization: Empresa de Transporte Masivo del Valle del Aburra Ltda
Street/P.O.Box: Calle 44 # 46 – 001
Building:
City: Bello
State/Region: Antioquia
Postfix/ZIP:
Country: Colombia
Telephone: (4) 454 86 20
FAX: (4) 452 44 50
E-Mail:
URL: www.metrodemedellin.gov.co
Represented by:
Title: Directora de Planeación
Salutation: Mrs
Last Name: Restrepo
Middle Name:
First Name: Maria Elena
Department: Planeación
Mobile:
Direct FAX: (4) 452 44 50
Direct tel: (4) 454 86 20
Personal E-Mail: [email protected]
Organization: Centro Nacional de Producción Más Limpia y Tecnologías Ambientales
Street/P.O.Box: Carrera 46 # 56 11 piso 8
Building: Tecnoparque
City: Medellin
State/Region: Antioquia
Postfix/ZIP:
Country: Colombia
Telephone: (4) 251 73 43
FAX: (4) 513 09 30
E-Mail: [email protected]
URL: www.cnpml.org
Represented by:
Title: Executive Director
Salutation: Mr
Last Name: Arango
Middle Name:
First Name: Carlos
Department:

PROJECT DESIGN DOCUMENT FORM (CDM-SSC-PDD) - Version 03
CDM – Executive Board
39
Mobile:
Direct FAX: (4) 513 09 30
Direct tel: (4) 251 73 43
Personal E-Mail: [email protected]
Organization: Grütter Consulting AG
Street/P.O.Box: Thiersteinerstr. 22/5
Building:
City: Reinach
State/Region: BL
Postfix/ZIP: 4153
Country: Switzerland
Telephone: (591) 2 278 84 74
FAX: (591) 2 211 65 52 intern 104
E-Mail: [email protected]
URL: www.transport-ghg.com
Represented by:
Title: CEO
Salutation:
Last Name: Grütter
Middle Name: Michael
First Name: Jürg
Department:
Mobile: (591) 705 82 987
Direct FAX:
Direct tel: (591) 2 278 84 74
Personal E-Mail: [email protected]

PROJECT DESIGN DOCUMENT FORM (CDM-SSC-PDD) - Version 03
CDM – Executive Board
40
Annex 2
I�FORMATIO� REGARDI�G PUBLIC FU�DI�G
There is no Official Development Assistance in this project and the project will not receive any public
funding from Parties included in Annex I. Funding is from the district government through budgetary
allocations and from ETMVA and does not include any official development assistance and is not
counted towards the financial obligations of Annex 1 parties.
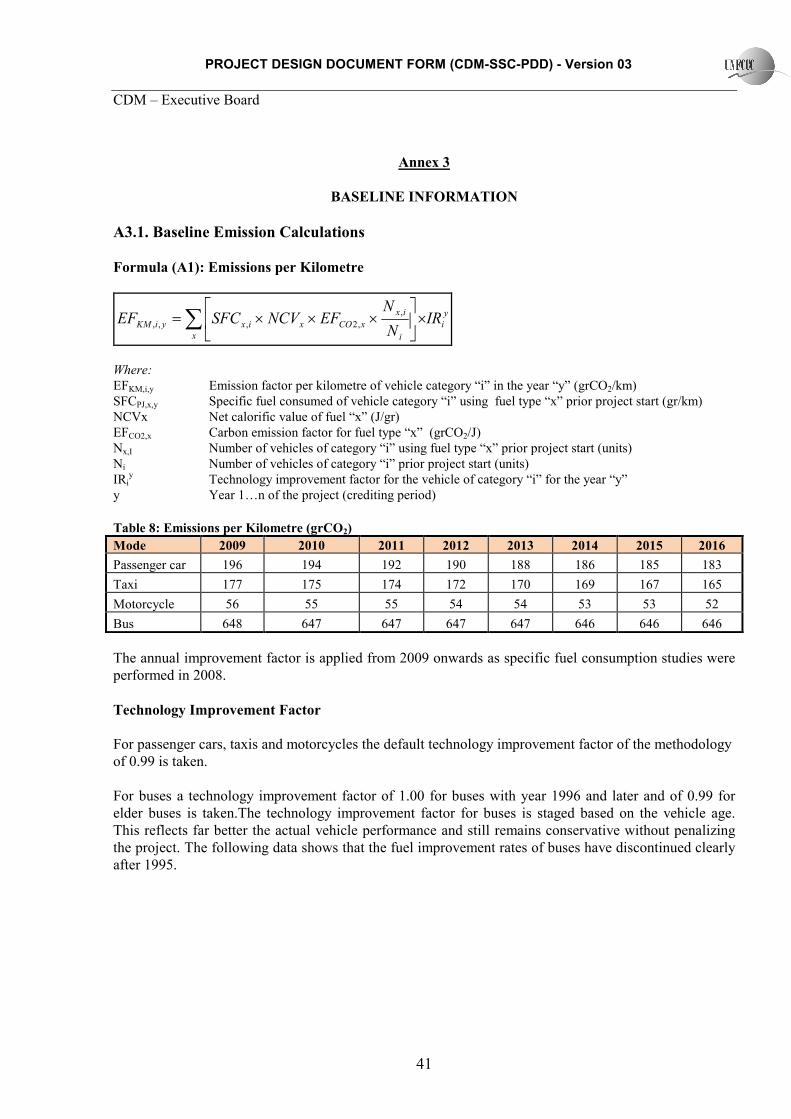
PROJECT DESIGN DOCUMENT FORM (CDM-SSC-PDD) - Version 03
CDM – Executive Board
41
Annex 3
BASELI�E I�FORMATIO�
A3.1. Baseline Emission Calculations
Formula (A1): Emissions per Kilometre
y
i
x i
ix
xCOxixyiKM IR�
�EF�CVSFCEF ∑ ×
×××= ,
,2,,,
Where:
EFKM,i,y Emission factor per kilometre of vehicle category “i” in the year “y” (grCO2/km)
SFCPJ,x,y Specific fuel consumed of vehicle category “i” using fuel type “x” prior project start (gr/km)
NCVx Net calorific value of fuel “x” (J/gr)
EFCO2,x Carbon emission factor for fuel type “x” (grCO2/J)
Nx,I Number of vehicles of category “i” using fuel type “x” prior project start (units)
Ni Number of vehicles of category “i” prior project start (units)
IRiy Technology improvement factor for the vehicle of category “i” for the year “y”
y Year 1…n of the project (crediting period)
Table 8: Emissions per Kilometre (grCO2)
Mode 2009 2010 2011 2012 2013 2014 2015 2016
Passenger car 196 194 192 190 188 186 185 183
Taxi 177 175 174 172 170 169 167 165
Motorcycle 56 55 55 54 54 53 53 52
Bus 648 647 647 647 647 646 646 646
The annual improvement factor is applied from 2009 onwards as specific fuel consumption studies were
performed in 2008.
Technology Improvement Factor
For passenger cars, taxis and motorcycles the default technology improvement factor of the methodology
of 0.99 is taken.
For buses a technology improvement factor of 1.00 for buses with year 1996 and later and of 0.99 for
elder buses is taken.The technology improvement factor for buses is staged based on the vehicle age.
This reflects far better the actual vehicle performance and still remains conservative without penalizing
the project. The following data shows that the fuel improvement rates of buses have discontinued clearly
after 1995.
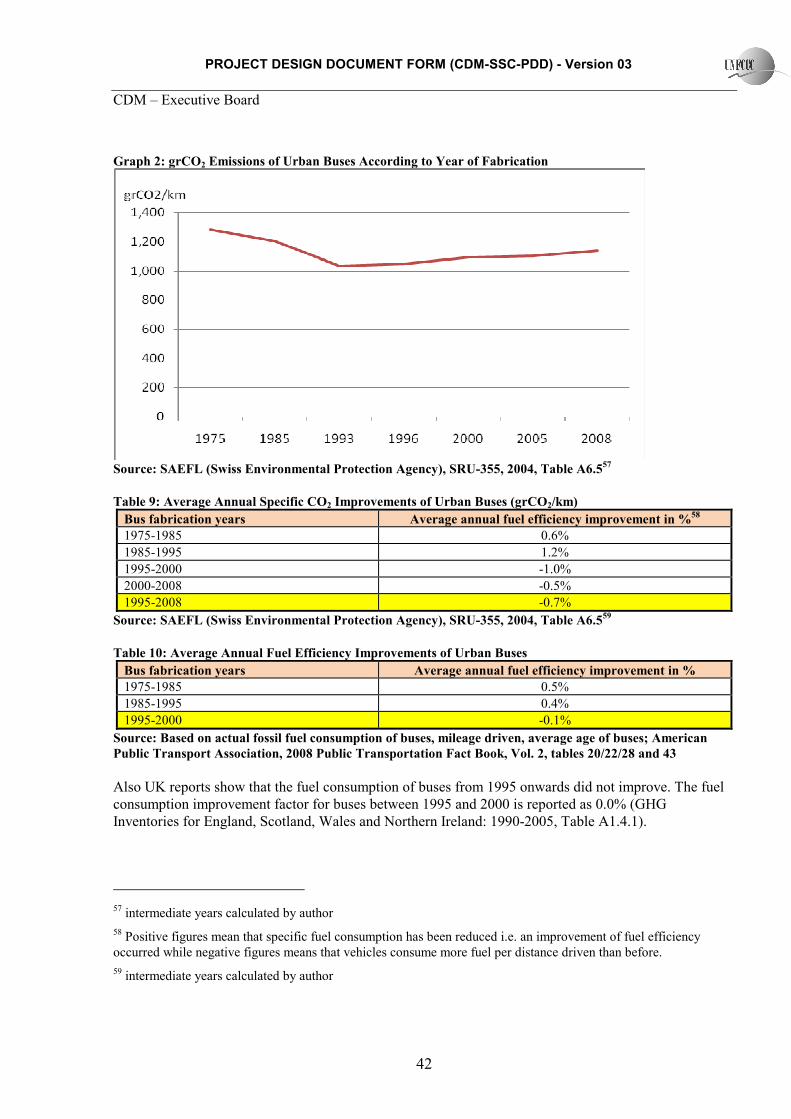
PROJECT DESIGN DOCUMENT FORM (CDM-SSC-PDD) - Version 03
CDM – Executive Board
42
Graph 2: grCO2 Emissions of Urban Buses According to Year of Fabrication
Source: SAEFL (Swiss Environmental Protection Agency), SRU-355, 2004, Table A6.5
57
Table 9: Average Annual Specific CO2 Improvements of Urban Buses (grCO2/km)
Bus fabrication years Average annual fuel efficiency improvement in %58
1975-1985 0.6%
1985-1995 1.2%
1995-2000 -1.0%
2000-2008 -0.5%
1995-2008 -0.7%
Source: SAEFL (Swiss Environmental Protection Agency), SRU-355, 2004, Table A6.559
Table 10: Average Annual Fuel Efficiency Improvements of Urban Buses
Bus fabrication years Average annual fuel efficiency improvement in %
1975-1985 0.5%
1985-1995 0.4%
1995-2000 -0.1%
Source: Based on actual fossil fuel consumption of buses, mileage driven, average age of buses; American
Public Transport Association, 2008 Public Transportation Fact Book, Vol. 2, tables 20/22/28 and 43
Also UK reports show that the fuel consumption of buses from 1995 onwards did not improve. The fuel
consumption improvement factor for buses between 1995 and 2000 is reported as 0.0% (GHG
Inventories for England, Scotland, Wales and Northern Ireland: 1990-2005, Table A1.4.1).
57 intermediate years calculated by author
58 Positive figures mean that specific fuel consumption has been reduced i.e. an improvement of fuel efficiency
occurred while negative figures means that vehicles consume more fuel per distance driven than before.
59 intermediate years calculated by author
PROJECT DESIGN DOCUMENT FORM (CDM-SSC-PDD) - Version 03
CDM – Executive Board
43
Summarized the range of annual fuel efficiency improvements of different data sources for urban buses is
between 0.0% and -0.7% (i.e. the fuel efficiency worsened by 0.7% annually). While prior to 1995 fuel
efficiency improvements of 0.4 to 1.2% can be registered the fuel efficiency improvements since 1995
are 0 or negative. It is thus justified and conservative to assume an annual technology improvement
factor for buses of 1% for buses aged 1995 and elder and 0% for buses aged 1996 and newer. Thus the
technology improvement factor for buses as listed in the following table is used.
Table 11: Technology Improvement Factor Buses
Vehicle category Improvement Factor IR
Buses produced prior 1996 0.99
Buses produced 1996 and thereafter 1.00
Formula (A2): Emissions per PKM
i
iKM
iPKMOC
EFEF
,
, =
Where:
EFPKM,i Emission factor per passenger-kilometre of vehicle category “i” (grCO2/PKM)
EFKM,i Emission factor per kilometre of vehicle category “i” (grCO2/km)
OCi Average occupation rate of vehicle category “i” prior project start (passengers)60
Table 12: Emissions per PKM (grCO2/PKM)
Mode 2009 2010 2011 2012 2013 2014 2015 2016
Passenger car 123 122 121 120 118 117 116 115
Taxi 193 191 189 187 185 183 181 180
Motorcycle 46 46 45 45 44 44 44 43
Bus 58 58 58 58 58 58 58 58
Metro 16 16 16 16 16 16 16 16
Metro emissions per PKM are updated regularly with new data available on the carbon emission factor of
electricity in Colombia.
Relative Participation of Modes in Emission Reductions year 200961
The following shows the influence of mode shift from passenger cars, taxis and motorcycles on emission
reductions achieved by the project. It is clear from the data below that the important emission reductions
achieved by the project are based on shifting from buses to cable car (combined with metro in many
cases). The necessity for monitoring occupation rates of vehicle categories other than buses is thus not
given. Even a drastic decrease of occupation rates of these vehicle categories would only result in
marginal shifts of emission reductions. As an example a 20% decrease of occupation rates of cars would
60 In the case of taxis the driver is not included
61 Calculation based on eliminating for baseline and indirect project emissions all passengers which responded to
having used the respective modes

PROJECT DESIGN DOCUMENT FORM (CDM-SSC-PDD) - Version 03
CDM – Executive Board
44
lead to 4 tons of change in emission reductions. This clearly shows that (costly) monitoring of occupation
rates of cars would not be warranted.
The relative contribution of each mode to emission reductions will be monitored in the year in which
occupation rate measurements for leakage should be made to determine the relevance and thus necessity
of realizing such surveys. If the relative contribution is less than 10% no such surveys would be realized
as the actual impact of a change of occupation rates would be non-significant.
Table 13: Relative Contribution of Modes for Emission Reductions Achieved by Project Year 2009
Mode Relative Contribution to Emission Reductions
Passenger cars 0.3 %
Taxis 4 %
Motorcycles 0.7 %

PROJECT DESIGN DOCUMENT FORM (CDM-SSC-PDD) - Version 03
CDM – Executive Board
45
Annex 4
MO�ITORI�G I�FORMATIO�
A.4.1. Monitoring Plan
The monitoring plan has two aims: to ensure the environmental integrity of the project activity and to
ensure that the data monitoring requirements are closely aligned with the current practice of the project
operator.
The monitoring methodology has ex-ante determined emission factors per PKM for all modes of
transport. The total baseline emissions are derived by applying to these emission factors the activity level
(PKM per mode transported) of the project.
A special unit is in charge of managing all data in relation to the CDM project including responsibility
for data collection, quality assurance, reports and data storage. The unit is under direct supervision of the
CEO of ETMVA.
A (Spanish) monitoring manual will be realized for ETMVA and staff will be familiarized with this
manual in a special training course. The Manual defines responsibilities and procedures, has a section on
all data variables to be monitored, includes monitoring report formats as well as the Spanish formats of
the survey. The data section has for each data variable information on how to collect the required
information, the frequency of collection, data units (including transformation of common data units),
quality control measures to be realized, steps to be taken in case of data problems, and some additional
hints and comments. The monitoring manual can be reviewed by the validator62.
A.4.2. Details of Survey to Identify Mode of Transport
The following survey principles shall be followed:
� The sampling size is determined by the 95% confidence interval and the 5% maximum error margin.
� Sampling is statistically robust and relevant i.e. the survey has a random distribution and is
representative of the persons using the project transport system.
� The methodology to select persons for interviews is random
� Only persons over age 12 are interviewed
� The survey is realized on all week days including weekends with the sample size per day being
proportional to the number of passengers transported by the project per corresponding week day.
� The sample size upwards and downwards in the cable car is proportional to the number of passengers
transported upwards/downwards on the cable car.
� The survey is realized in a quarterly manner for each cable car during one (1) calendar year.
Thereafter the survey is not repeated
Survey
Interviewer:……………………………
Date: .-………………………………….
62 File 50
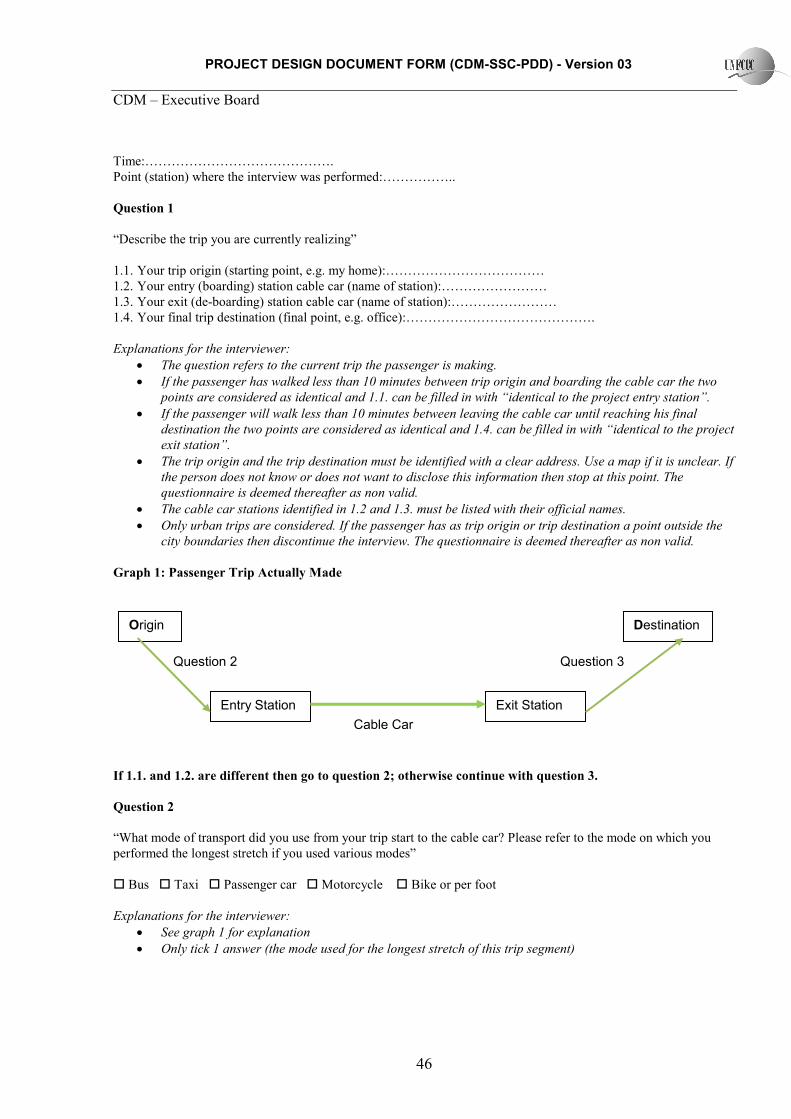
PROJECT DESIGN DOCUMENT FORM (CDM-SSC-PDD) - Version 03
CDM – Executive Board
46
Time:…………………………………….
Point (station) where the interview was performed:……………..
Question 1
“Describe the trip you are currently realizing”
1.1. Your trip origin (starting point, e.g. my home):………………………………
1.2. Your entry (boarding) station cable car (name of station):……………………
1.3. Your exit (de-boarding) station cable car (name of station):……………………
1.4. Your final trip destination (final point, e.g. office):…………………………………….
Explanations for the interviewer:
• The question refers to the current trip the passenger is making.
• If the passenger has walked less than 10 minutes between trip origin and boarding the cable car the two
points are considered as identical and 1.1. can be filled in with “identical to the project entry station”.
• If the passenger will walk less than 10 minutes between leaving the cable car until reaching his final
destination the two points are considered as identical and 1.4. can be filled in with “identical to the project
exit station”.
• The trip origin and the trip destination must be identified with a clear address. Use a map if it is unclear. If
the person does not know or does not want to disclose this information then stop at this point. The
questionnaire is deemed thereafter as non valid.
• The cable car stations identified in 1.2 and 1.3. must be listed with their official names.
• Only urban trips are considered. If the passenger has as trip origin or trip destination a point outside the
city boundaries then discontinue the interview. The questionnaire is deemed thereafter as non valid.
Graph 1: Passenger Trip Actually Made
If 1.1. and 1.2. are different then go to question 2; otherwise continue with question 3.
Question 2
“What mode of transport did you use from your trip start to the cable car? Please refer to the mode on which you
performed the longest stretch if you used various modes”
� Bus � Taxi � Passenger car � Motorcycle � Bike or per foot
Explanations for the interviewer:
• See graph 1 for explanation
• Only tick 1 answer (the mode used for the longest stretch of this trip segment)
Origin Destination
Entry Station Exit Station
Cable Car
Question 2 Question 3

PROJECT DESIGN DOCUMENT FORM (CDM-SSC-PDD) - Version 03
CDM – Executive Board
47
If 1.1. and 1.4. are different then go to question 3; otherwise continue with question 4.
Question 3
“ What mode of transport will you use from the point where you leave the cable car until your final destination?
Please refer to the mode on which you will perform the longest stretch if you intend to use various modes”
� Bus � Metro � Taxi � Passenger car � Motorcycle � Bike or per foot
Explanations for the interviewer:
• See graph for explanation
• Only tick 1 answer (the mode used for the longest stretch of this trip segment)
Question 4
“Assuming that the cable car you are currently using would not exist: Would you have made the trip you are
currently doing anyway or would you have stayed at home/office/origin”
� I would have made the trip � I would have stayed at home/office/origin
For the interviewer:
• The purpose of this question is to know if the passenger made this trip only because the cable car exists. In
absence of the cable car the passenger would not have made any trip and would have stayed at his point of
origin.
• Please verify if the person has understood the question
If you would have made the trip continue with question 5; otherwise the questionnaire is terminated.
Question 5
“Assuming that the cable car you are currently using would not exist: Would you have used 1 or various modes of
transport for your entire trip from origin to destination?”
� I would have used 1 mode � go to question 6
� I would have used more than 1 mode (e.g. taxi plus bus)
If you would have used various modes of transport identify the intermediate points where you changed the mode of
transport except if between these points you walked less than 10 minutes. Example: From home I would have taken
the bus to point XXY and from there I would have taken the taxi to my office.
a. Origin of trip (identical to 1.1.):……………………………
b. Intermediate point 1:
c. Intermediate point 2:
d. Destination of trip (identical to 1.4.):…………………………………
For the interviewer
• The trip origin and the trip destination are identical to question 1 i.e. they are the actual trip starting point
and the actual destination of the passenger you are questioning
• We want to know how the passenger would have reached his destination if the cable car would not exist i.e.
the passenger should relate how he did this or a comparable trip before existence of the cable car using all
other existing modes of transport he normally used.

PROJECT DESIGN DOCUMENT FORM (CDM-SSC-PDD) - Version 03
CDM – Executive Board
48
• The trip route between origin and destination can and is usually different. We must reach however the
same final destination.
• The passenger may have used one or various modes between starting and final point e.g. car plus bus or
bus plus metro etc. Each time he would have changed modes we must identify the geographical point
where he would have changed modes (5.2. and 5.3.)
• It is not previewed that more than 2 intermediate points exist (this would mean 3 modes of transport for 1
trip i.e. origin to point 1, point 1 to point 2, point 2 to destination). If the passenger used more modes and
thus had more intermediate points these shall be added.
• Walking trips of less than 10 minutes are not counted e.g. walking from origin to bus station of less than 10
minutes is not counted as a separate trip.
• The points must be identified with a clear address. Use a map if it is unclear. If the person does not know
or does not want to disclose this information then stop at this point. The questionnaire is deemed thereafter
as non valid.
Question 6
“What mode of transport would you have used between each identified point?” Please answer this question for each
distance realized separately e.g. origin to XXY and XXY to destination.
Trip segment (based on question 5 e.g. origin to point XXY):…………………………….
Mode I would have used in absence of the cable car for this trip segment:
� Bus � Metro � Taxi � go to 6A � Passenger car � got to 6B � Motorcycle � go to 6C � Bike or
per foot
Explanations for the interviewer:
• See graph 2 for explanation
• Only tick 1 answer (the mode used for the longest stretch of this trip segment)
• For each segment of the trip make a separate answer
Question 6A
“Have you used a taxi in the last 6 months?”
� Yes � No
If the passenger responds with �o this specific questionnaire is deemed as non-consistent and removed from the
final counting
Question 6B
“Do you or your family own a car or do you have access to a car (e.g. car-sharing) or have you used a passenger car
in the last 6 months?”
� Yes � No
If the passenger responds with �o this specific questionnaire is deemed as non-consistent and removed from the
final counting

PROJECT DESIGN DOCUMENT FORM (CDM-SSC-PDD) - Version 03
CDM – Executive Board
49
Question 6C
“Do you or your family own a motorcycle or do you have access to a motorcycle or have you used a motorcycle in
the last 6 months?”
� Yes � No
If the passenger responds with �o this specific questionnaire is deemed as non-consistent and removed from the
final counting
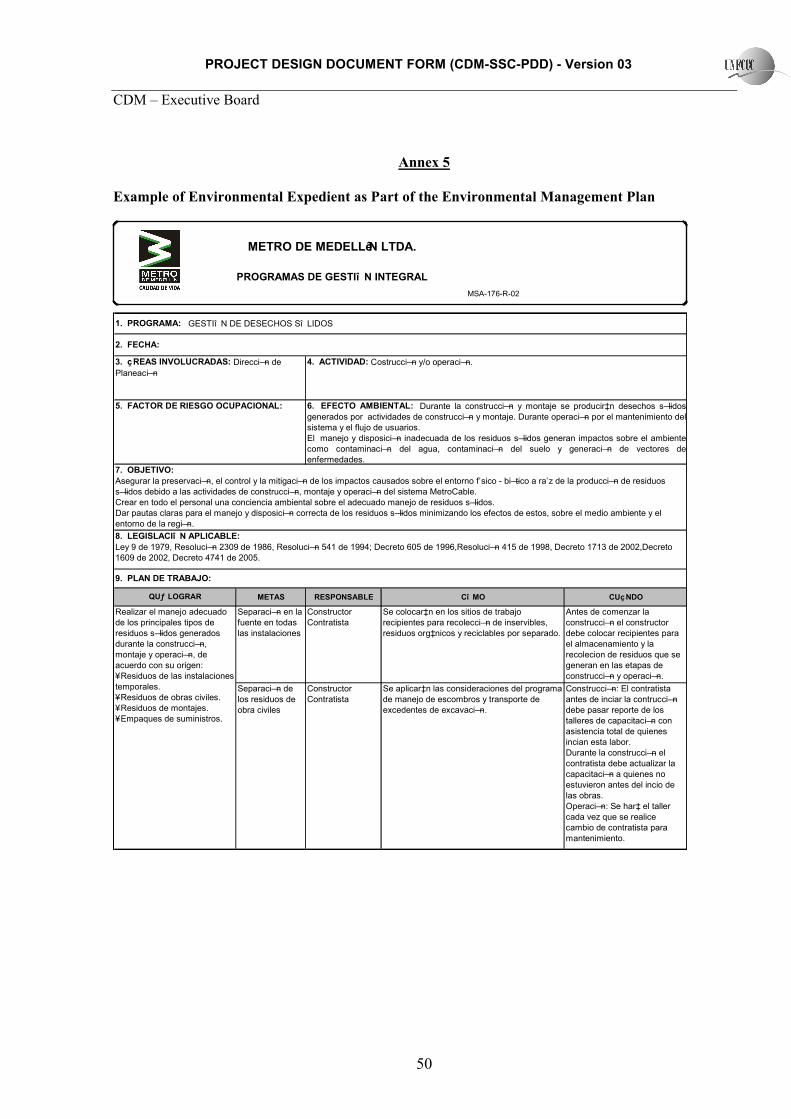
PROJECT DESIGN DOCUMENT FORM (CDM-SSC-PDD) - Version 03
CDM – Executive Board
50
Annex 5
Example of Environmental Expedient as Part of the Environmental Management Plan
METAS RESPONSABLE Cî MO CUçNDO
Se aplicar‡n las consideraciones del programa
de manejo de escombros y transporte de
excedentes de excavaci—n.
5. FACTOR DE RIESGO OCUPACIONAL: 6. EFECTO AMBIENTAL: Durante la construcci—n y montaje se producir‡n desechos s—lidos
generados por actividades de construcci—n y montaje. Durante operaci—n por el mantenimiento del
sistema y el flujo de usuarios.
El manejo y disposici—n inadecuada de los residuos s—lidos generan impactos sobre el ambiente
como contaminaci—n del agua, contaminaci—n del suelo y generaci—n de vectores de
enfermedades.
2. FECHA:
1. PROGRAMA: GESTIî N DE DESECHOS Sî LIDOS
3. çREAS INVOLUCRADAS: Direcci—n de
Planeaci—n
4. ACTIVIDAD: Costrucci—n y/o operaci—n.
9. PLAN DE TRABAJO:
QUƒ LOGRAR
Separaci—n en la
fuente en todas
las instalaciones
Constructor
Contratista
Se colocar‡n en los sitios de trabajo
recipientes para recolecci—n de inservibles,
residuos org‡nicos y reciclables por separado.
Antes de comenzar la
construcci—n el constructor
debe colocar recipientes para
el almacenamiento y la
recolecion de residuos que se
generan en las etapas de
construcci—n y operaci—n.
Realizar el manejo adecuado
de los principales tipos de
residuos s—lidos generados
durante la construcci—n,
montaje y operaci—n, de
acuerdo con su origen:
¥ Residuos de las instalaciones
temporales.
¥ Residuos de obras civiles.
¥ Residuos de montajes.
¥ Empaques de suministros.
Construcci—n: El contratista
antes de inciar la contrucci—n
debe pasar reporte de los
talleres de capacitaci—n con
asistencia total de quienes
incian esta labor.
Durante la construcci—n el
contratista debe actualizar la
capacitaci—n a quienes no
estuvieron antes del incio de
las obras.
Operaci—n: Se har‡ el taller
cada vez que se realice
cambio de contratista para
mantenimiento.
Separaci—n de
los residuos de
obra civiles
Constructor
Contratista
7. OBJETIVO:
Asegurar la preservaci—n, el control y la mitigaci—n de los impactos causados sobre el entorno f’sico - bi—tico a ra’z de la producci—n de residuos
s—lidos debido a las actividades de construcci—n, montaje y operaci—n del sistema MetroCable.
Crear en todo el personal una conciencia ambiental sobre el adecuado manejo de residuos s—lidos.
Dar pautas claras para el manejo y disposici—n correcta de los residuos s—lidos minimizando los efectos de estos, sobre el medio ambiente y el
entorno de la regi—n.
8. LEGISLACIî N APLICABLE:
Ley 9 de 1979, Resoluci—n 2309 de 1986, Resoluci—n 541 de 1994; Decreto 605 de 1996,Resoluci—n 415 de 1998, Decreto 1713 de 2002,Decreto
1609 de 2002, Decreto 4741 de 2005.
MSA-176-R-02
METRO DE MEDELLêN LTDA.
PROGRAMAS DE GESTIî N INTEGRAL
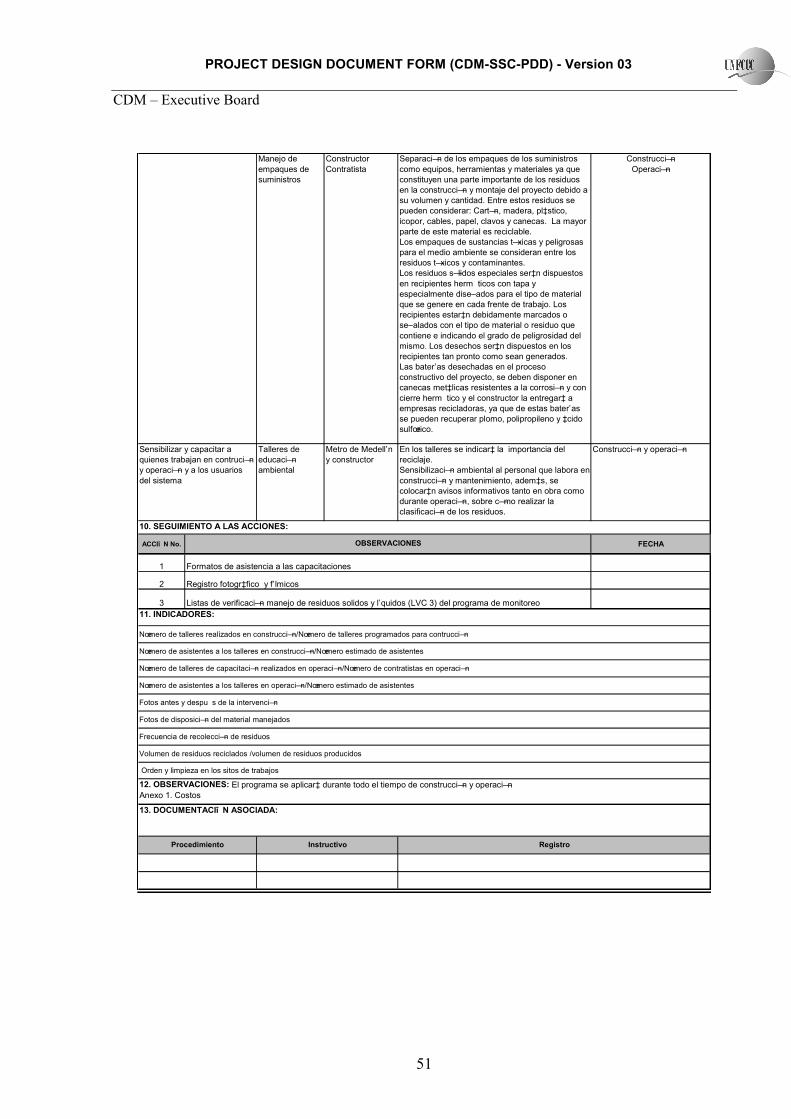
PROJECT DESIGN DOCUMENT FORM (CDM-SSC-PDD) - Version 03
CDM – Executive Board
51
Talleres de
educaci—n
ambiental
Metro de Medell’n
y constructor
En los talleres se indicar‡ la importancia del
reciclaje.
Sensibilizaci—n ambiental al personal que labora en
construcci—n y mantenimiento, adem‡s, se
colocar‡n avisos informativos tanto en obra como
durante operaci—n, sobre c—mo realizar la
clasificaci—n de los residuos.
Construcci—n y operaci—n
ACCIî N No. FECHA
1
2
3
Manejo de
empaques de
suministros
Constructor
Contratista
Separaci—n de los empaques de los suministros
como equipos, herramientas y materiales ya que
constituyen una parte importante de los residuos
en la construcci—n y montaje del proyecto debido a
su volumen y cantidad. Entre estos residuos se
pueden considerar: Cart—n, madera, pl‡stico,
icopor, cables, papel, clavos y canecas. La mayor
parte de este material es reciclable.
Los empaques de sustancias t—xicas y peligrosas
para el medio ambiente se consideran entre los
residuos t—xicos y contaminantes.
Los residuos s—lidos especiales ser‡n dispuestos
en recipientes herm ticos con tapa y
especialmente dise–ados para el tipo de material
que se genere en cada frente de trabajo. Los
recipientes estar‡n debidamente marcados o
se–alados con el tipo de material o residuo que
contiene e indicando el grado de peligrosidad del
mismo. Los desechos ser‡n dispuestos en los
recipientes tan pronto como sean generados.
Las bater’as desechadas en el proceso
constructivo del proyecto, se deben disponer en
canecas met‡licas resistentes a la corrosi—n y con
cierre herm tico y el constructor la entregar‡ a
empresas recicladoras, ya que de estas bater’as
se pueden recuperar plomo, polipropileno y ‡cido
sulfœrico.
Construcci—n
Operaci—n
12. OBSERVACIONES: El programa se aplicar‡ durante todo el tiempo de construcci—n y operaci—n
Anexo 1. Costos
10. SEGUIMIENTO A LAS ACCIONES:
OBSERVACIONES
11. INDICADORES:
Fotos de disposici—n del material manejados
Formatos de asistencia a las capacitaciones
Registro fotogr‡fico y f’lmicos
Listas de verificaci—n manejo de residuos solidos y l’quidos (LVC 3) del programa de monitoreo
Fotos antes y despu s de la intervenci—n
13. DOCUMENTACIî N ASOCIADA:
RegistroInstructivoProcedimiento
Sensibilizar y capacitar a
quienes trabajan en contruci—n
y operaci—n y a los usuarios
del sistema
Orden y limpieza en los sitos de trabajos
Frecuencia de recolecci—n de residuos
Volumen de residuos reciclados /volumen de residuos producidos
Nœmero de asistentes a los talleres en operaci—n/Nœmero estimado de asistentes
Nœmero de talleres realizados en construcci—n/Nœmero de talleres programados para contrucci—n
Nœmero de asistentes a los talleres en construcci—n/Nœmero estimado de asistentes
Nœmero de talleres de capacitaci—n realizados en operaci—n/Nœmero de contratistas en operaci—n
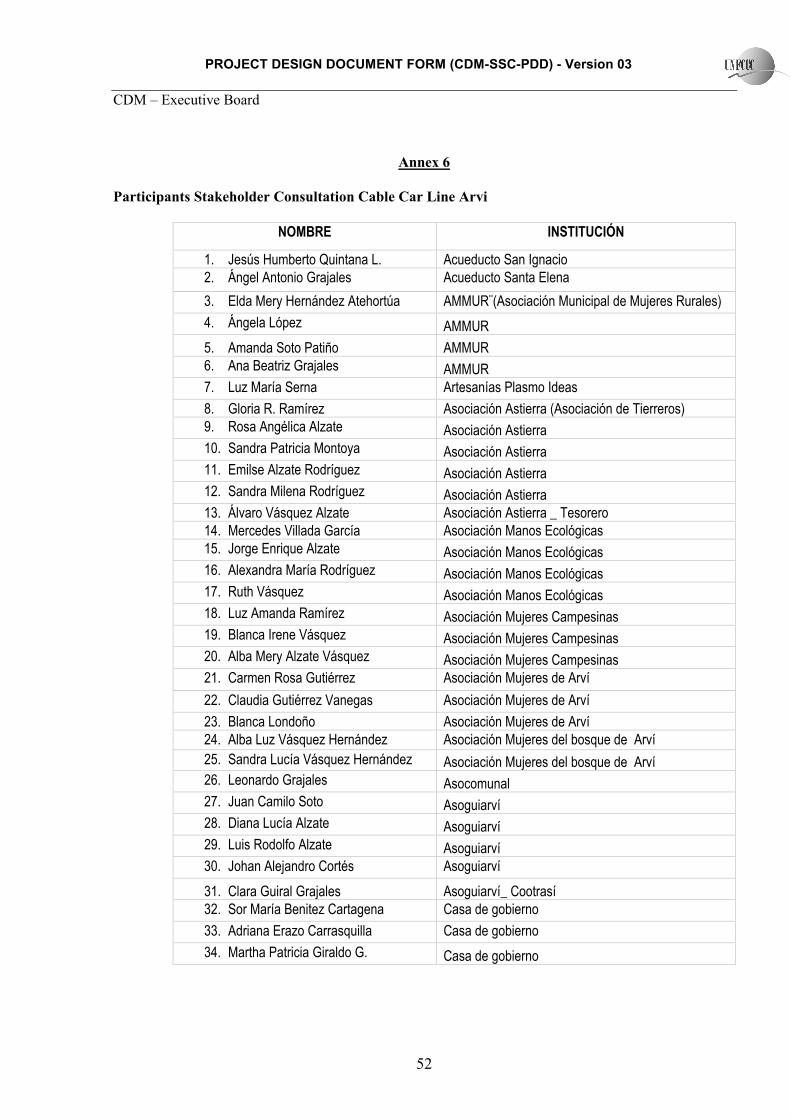
PROJECT DESIGN DOCUMENT FORM (CDM-SSC-PDD) - Version 03
CDM – Executive Board
52
Annex 6
Participants Stakeholder Consultation Cable Car Line Arvi
NOMBRE INSTITUCIÓN
1. Jesús Humberto Quintana L. Acueducto San Ignacio 2. Ángel Antonio Grajales Acueducto Santa Elena
3. Elda Mery Hernández Atehortúa AMMUR¨(Asociación Municipal de Mujeres Rurales)
4. Ángela López AMMUR
5. Amanda Soto Patiño AMMUR 6. Ana Beatriz Grajales AMMUR 7. Luz María Serna Artesanías Plasmo Ideas
8. Gloria R. Ramírez Asociación Astierra (Asociación de Tierreros) 9. Rosa Angélica Alzate Asociación Astierra 10. Sandra Patricia Montoya Asociación Astierra 11. Emilse Alzate Rodríguez Asociación Astierra 12. Sandra Milena Rodríguez Asociación Astierra 13. Álvaro Vásquez Alzate Asociación Astierra _ Tesorero 14. Mercedes Villada García Asociación Manos Ecológicas 15. Jorge Enrique Alzate Asociación Manos Ecológicas 16. Alexandra María Rodríguez Asociación Manos Ecológicas 17. Ruth Vásquez Asociación Manos Ecológicas 18. Luz Amanda Ramírez Asociación Mujeres Campesinas 19. Blanca Irene Vásquez Asociación Mujeres Campesinas 20. Alba Mery Alzate Vásquez Asociación Mujeres Campesinas 21. Carmen Rosa Gutiérrez Asociación Mujeres de Arví
22. Claudia Gutiérrez Vanegas Asociación Mujeres de Arví
23. Blanca Londoño Asociación Mujeres de Arví 24. Alba Luz Vásquez Hernández Asociación Mujeres del bosque de Arví 25. Sandra Lucía Vásquez Hernández Asociación Mujeres del bosque de Arví 26. Leonardo Grajales Asocomunal 27. Juan Camilo Soto Asoguiarví 28. Diana Lucía Alzate Asoguiarví 29. Luis Rodolfo Alzate Asoguiarví 30. Johan Alejandro Cortés Asoguiarví
31. Clara Guiral Grajales Asoguiarví_ Cootrasí 32. Sor María Benitez Cartagena Casa de gobierno
33. Adriana Erazo Carrasquilla Casa de gobierno
34. Martha Patricia Giraldo G. Casa de gobierno

PROJECT DESIGN DOCUMENT FORM (CDM-SSC-PDD) - Version 03
CDM – Executive Board
53
NOMBRE INSTITUCIÓN
35. Jorge F Quiceno Gil Comité Emergencias 36. Lucila Grisales A. Cooforestal (G8) 37. Álvaro Zapata R. Cooforestal (G8) 38. Estella Rojas Cooforestal (G8) 39. Juan Agudelo Cooforestal (G8) 40. Nelson Rojas Cooforestal (G8) 41. Roberto Iral Castrillón Cooforestal (G8) 42. Diana Patricia Hincapié Q. Coopasana - cultura 43. Carlos Alberto Zuluaga Corantioquia
44. Isabel Cristina Barítica Corantioquia
45. Mauricio Jaramillo Corporación Arcadia 46. Luís Fernando García Corporación Barrio Comparsa
47. Sandra Patricia Nieto Marín Corporación Campo Sano Santa Elena Ccasemur
48. Luz Estella Soto Ríos Corporación Campo Sano Santa Elena Ccasemur
49. Berenice Zapata Ruiz Corporación Campo Sano Santa Elena Ccasemur 50. Blanca Hernández Corporación el Silletero 51. Rodrigo Alonso Sánchez Sánchez Corporación Esfera Verde 52. Federico Alzate Zapata Corporación Esfera Verde 53. Juan Guillermo Sánchez Edil Santa Elena 54. Claudia P. Tapias Gómez Edil Santa Elena 55. Luís Orlando Atehortua Soto Edil Santa Elena
56. Yeny Hincapié Quintana Edil Santa Elena 57. Bertha Nubia Alzate Edil Santa Elena 58. William de Jesús Londoño Edil Santa Elena _Presidente 59. Juan Ángel Soto A. Edil_Cabildo Adulto Mayor 60. Martha Llano Fundación Sentir - Red Turística 61. Corinne Willis independiente
62. Beatriz Álvarez Institución Educativa El Placer 63. Mario Zapata Montoya Institución Educativa Santa Elena 64. Álvaro Cuervo Montoya Institución Educativa Santa Elena
65. Rubén Darío Muñoz Calle Institución Educativa. Santa Elena
66. Ligia Elena Ríos Ríos JAC El Llano
67. Jorge Hernández JAC Los Vásquez y G(8)
68. Rafael Ángel Isaza JAC Mazo
69. Albeiro Vásquez JAC Mazo y Cooforestal (G8) 70. Fernando Zapata JAC Santa Elena Central 71. Ricardo González Plan desarrollo Corregimental

PROJECT DESIGN DOCUMENT FORM (CDM-SSC-PDD) - Version 03
CDM – Executive Board
54
NOMBRE INSTITUCIÓN
72. Merced Días Contreras Policía Santa Elena 73. German Vargas Trasancoop 74. Nelson Andrés Días Trasancoop 75. Ignacio Ramos Veterinario
- - - - -
Related Documents


