DEVELOPMENT CORP. Indonesian Coalbed Methane April 2012 SEKAYU PSC Immediate Gas to Surface CBM-SE-03 Proved Concept: Gas-to-surface at Sekayu PSC in two wells 1.06 Tcf Unrisked Gross Recoverable Prospective Resources at Sekayu PSC Gross Exploration Cost: USD0.01/Mcf Return Target: 20X Risked Return on Exploration Investment Material Acreage and Operatorship: 3,035 km 2 net Strategically Positioned for Quick Commercialization First Production/Revenue Expected 3Q 2012 Growth Strategy: Distressed PSCs and Partnership Program Exit Strategy: Derisk and Monetize CBM Blocks Through Asset Sales Experienced, Motivated Management and Technical Teams

Welcome message from author
This document is posted to help you gain knowledge. Please leave a comment to let me know what you think about it! Share it to your friends and learn new things together.
Transcript

D E V E LO P M E N T C O R P.
Indonesian Coalbed Methane
April 2012
SEKAYU PSC Immediate Gas to Surface
CBM-SE-03
Proved Concept: Gas-to-surface at Sekayu PSC in two wells
1.06 Tcf Unrisked Gross Recoverable Prospective Resources at Sekayu PSC
Gross Exploration Cost: USD0.01/Mcf
Return Target: 20X Risked Return on Exploration Investment
Material Acreage and Operatorship: 3,035 km2 net
Strategically Positioned for Quick Commercialization
First Production/Revenue Expected 3Q 2012
Growth Strategy: Distressed PSCs and Partnership Program
Exit Strategy: Derisk and Monetize CBM Blocks Through Asset Sales
Experienced, Motivated Management and Technical Teams
2
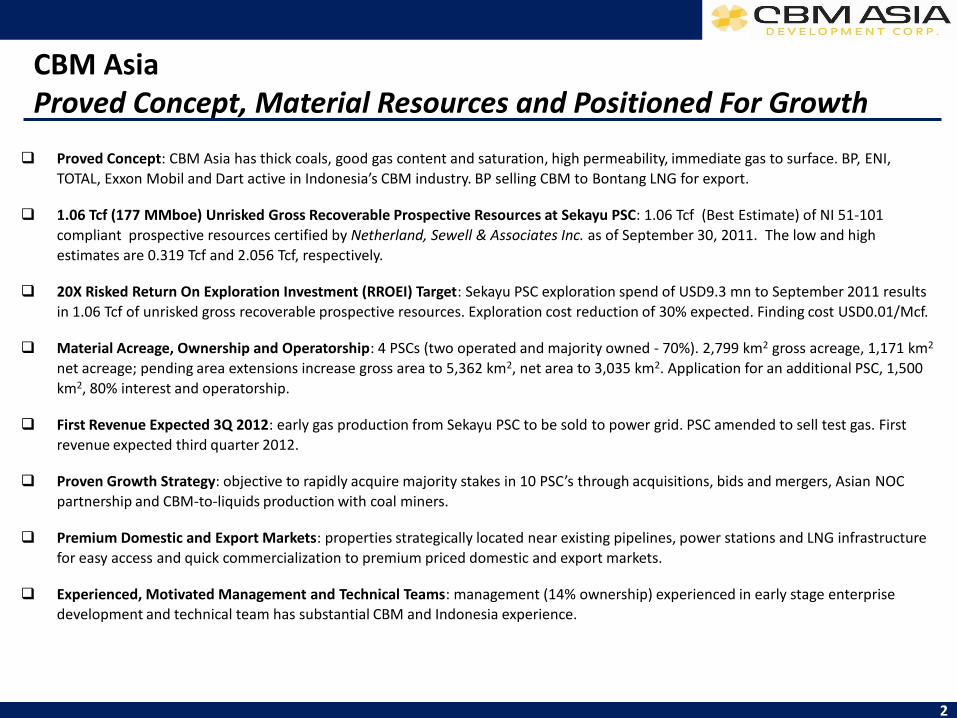
Proved Concept: CBM Asia has thick coals, good gas content and saturation, high permeability, immediate gas to surface. BP, ENI,
TOTAL, Exxon Mobil and Dart active in Indonesia’s CBM industry. BP selling CBM to Bontang LNG for export.
1.06 Tcf (177 MMboe) Unrisked Gross Recoverable Prospective Resources at Sekayu PSC: 1.06 Tcf (Best Estimate) of NI 51-101
compliant prospective resources certified by Netherland, Sewell & Associates Inc. as of September 30, 2011. The low and high
estimates are 0.319 Tcf and 2.056 Tcf, respectively.
20X Risked Return On Exploration Investment (RROEI) Target: Sekayu PSC exploration spend of USD9.3 mn to September 2011 results
in 1.06 Tcf of unrisked gross recoverable prospective resources. Exploration cost reduction of 30% expected. Finding cost USD0.01/Mcf.
Material Acreage, Ownership and Operatorship: 4 PSCs (two operated and majority owned - 70%). 2,799 km2 gross acreage, 1,171 km2
net acreage; pending area extensions increase gross area to 5,362 km2, net area to 3,035 km2. Application for an additional PSC, 1,500
km2, 80% interest and operatorship.
First Revenue Expected 3Q 2012: early gas production from Sekayu PSC to be sold to power grid. PSC amended to sell test gas. First
revenue expected third quarter 2012.
Proven Growth Strategy: objective to rapidly acquire majority stakes in 10 PSC’s through acquisitions, bids and mergers, Asian NOC
partnership and CBM-to-liquids production with coal miners.
Premium Domestic and Export Markets: properties strategically located near existing pipelines, power stations and LNG infrastructure
for easy access and quick commercialization to premium priced domestic and export markets.
Experienced, Motivated Management and Technical Teams: management (14% ownership) experienced in early stage enterprise development and technical team has substantial CBM and Indonesia experience.
CBM Asia Proved Concept, Material Resources and Positioned For Growth

3
HULU PSC 70% WI
1,983 km2^
CBMA-Operator
CBM Asia Current Asset Portfolio and Gas Pricing
SEKAYU PSC 24% WI^^ 580 km2
1.06 Tcf (gross)
KUTAI WEST PSC 18% WI 869 km2
BENTIAN BESAR 70% WI
1,930 km2^
CBMA-Operator
KUTAI II 40% WI
Arbitration 560 km2
KUALA KAPUAS I Application
80% WI 1,501 km2
CBMA-Operator
SUMATRA KALIMANTAN
USD11/Mcf USD12/Mcf
USD6-13/Mcf
USD7-15/Mcf
USD5.50-9.40/Mcf
^ Including pending extensions ^^ See page 15 for details on working interest

4
Alan Charuk, President & CEO, Director: over 20 years of experience in the formation and financing of resource companies in emerging markets including Indonesia, Nicaragua, Colombia and Cuba. Substantial on the ground emerging market experienced.
Keith Potter, Consultant-General Manager, Indonesia: over 29 years of international oil and gas industry experience, 12 years CBM experience and 10 years Indonesia experience. Former President Director of PT Seamgas, a subsidiary of Westside Corporation and PT Bumi Resources, which discovered 3 TCF CBM.
Jim Charuk, Bsc Geology, VP Exploration, Director: over 20 years experience in the oil & gas exploration and production industry. Managed reservoir identification, evaluation, and exploitation programs on six continents, as well as a worldwide drill technology program for Chevron.
Scott H. Stevens, Chairman: SVP and Director of Advanced Resources International an internationally recognized CBM and shale gas consulting firm. Since 1995 Mr Stevens has been working with the Government of Indonesia, Chevron, and other multinationals to high-grade CBM resources and develop current CBM regulations in Indonesia.
Adam Clarke, VP Corporate Development, Director: former Managing Partner of Expedition Capital (HK) and Senior Managing Director Bear Stearns Asia (HK). 20 years of oil & gas investment related experience in the Asia-Pacific region including Indonesian oil & gas and coal industries.
Dr. James Friberg, Ph.D. Sedimentology, Director: former President of Black Gold Energy (Indonesia) - which was acquired by Niko Resources for CAD300 mn in 2009 -Exploration Manager for Unocal Indonesia (now Chevron) and Unocal’s Chief Geologist Worldwide.
Dr. Harvey Price, Ph.D. Mathematics, VP CBM Technologies: helped develop the first theories on coalbed methane's commercial viability. Dr. Price managed the world’s first simultaneous coal mine degasification and methane production venture.
CBM Asia Management Team: Highly Technical With Indonesian Experience
Technical Corporate
Charles Bloomquist, P.Eng, VP Operations, Director: petroleum engineer with over 30 years experience in North America, Africa and Asia. Worked with Indonesia’s National Oil Company Pertamina to manage drilling projects in Sumatra.

Asia-Pacific CBM
Oil Major View: Indonesia Looks Like Australia & USA - Not Like China
Australia Indonesia China
CBM Gas In
Place >500 Tcf 453 Tcf >500 Tcf
Reservoir
Quality
Excellent: Mostly High Gas
Saturation &
Permeability
Excellent: Mostly High Gas
Saturation &
Permeability
Challenging: Low Gas
Saturation &/or Permeability
Development
Stage
Development: AUD30bn of
mergers/acquisitions
Production: >600 MMcf/d after
8 years - likely to outstrip USA
by 2020
Major Oil
Company
CBM Activity
BHP, BP,
ConocoPhillips,
Chevron all tested
CBM but then left due
to poor geology.
Exploration: Land grab and
de-risking now underway
Multi-billion dollar
consolidation likely to occur
as in Australia
Struggling
Production: only 145
MMcf/d after 20 years
5
USA
>500 Tcf
Excellent: Mostly High Gas
Saturation &
Permeability
Fully Mature
Production: 5 Bcf/d

Source: SPE 88630, ^Resource estimates are not NI 51-101 compliant
Completeable High CBM ResourcesTarget Coal Coal Average Graded Area Completeable
Formation Thickness (m) Rank (Ro%) Depth (m) (km2) (Tcf)
1 S. Sumatra S. Sumatra/Jambi M.Enim 37 0.47 762 7,350 1832 Barito S. Kalimantan Warukin 28 0.45 915 6,330 1023 Kutai E. Kalimantan Prangat 21 0.50 915 6,100 804 C. Sumatra Riau Petani 15 0.40 762 5,150 535 N. Tarakan E. Kalimantan Tabul 15 0.45 701 2,734 186 Berau E. Kalimantan Latih 24 0.45 671 780 8.47 Ombilin Riau Sawaht 24 0.80 762 47 0.58 Pasir/Asem S. Kalimantan Warukin 15 0.45 701 385 3.09 NW Java Java T.Akar 6 0.70 1,524 100 0.8
10 Sulawesi Sulawesi Toraja 6 0.55 610 500 2.011 Bengkulu Bengkulu Lemau 12 0.40 610 772 3.6
Total 30,248 453
Basin Province
6
Why Indonesian CBM? Substantial Resource Potential: 453 Tcf
^

7
Why Indonesian CBM? Low Geological Risk: Abundant Conventional and Coal Control Data
Kutai West PSC & Kutai II PSC: covered by seismic with
significant conventional well control data available
Sekayu PSC: 8 conventional wells inside and 6 outside the PSC area, substantial seismic coverage
CBM SE-02
CBM SE-03
CBM SE-04
CBM SE-01
Bentian Besar PSC: covered by seismic and one conventional well in the
extension area
Hulu PSC: covered by seismic, two conventional wells
to the north of the block.
2,000
2,500
1,500
1,000
500
0
Fm
1
Depth(Feet)
Fm
2F
m 3
Mud Gas Units Unknown0 100 200 300 400
JA
F01525
.CD
R
Thick Coal Seams with Gas Kicks

0%
20%
40%
60%
80%
100%
Evaluatio
n
Stud
y
G&
G
Stud
y
Co
re
Drillin
g
Pro
du
ction
Te
st
Pilo
t G
as Sales
De
velo
p
Plan
Gas
Co
ntract
De
velo
p
Bu
ild O
ut
Lon
g Term
G
as Sales
8
HIGH CAPEX DEVELOPMENT LOW CAPEX EXPLORATION PHASE
DER
ISK
RA
TE
EXPLORATION AND DEVELOPMENT CYCLE
Why Indonesian CBM? Low Capital At Risk: USD6.5 mn to USD9.0 mn per PSC
Development Phase
production ramp up cost reduction
asset sale/jv potential
Capex Trend relatively modest pre development
Value Creation Trend rapid increase
Exploration Phase II Pilot Tests
USD6-10 mn
Determine: well spacing
well type reserves audit
commercialization contracts
Exploration Phase I Coring/Prod Tests
USD4-6 mn
Determine: coal depth
permeability gas content
initial flow rates resource audit
DIVESTITURE ASSET SALE
Acquisition USD2.5-3.0 mn
Study USD300-500K
Signature Bonus USD1.0mn
Performance Bond USD1.0-1.5mn
Risk Capital Acquisition and 1st Exploration Phase
9
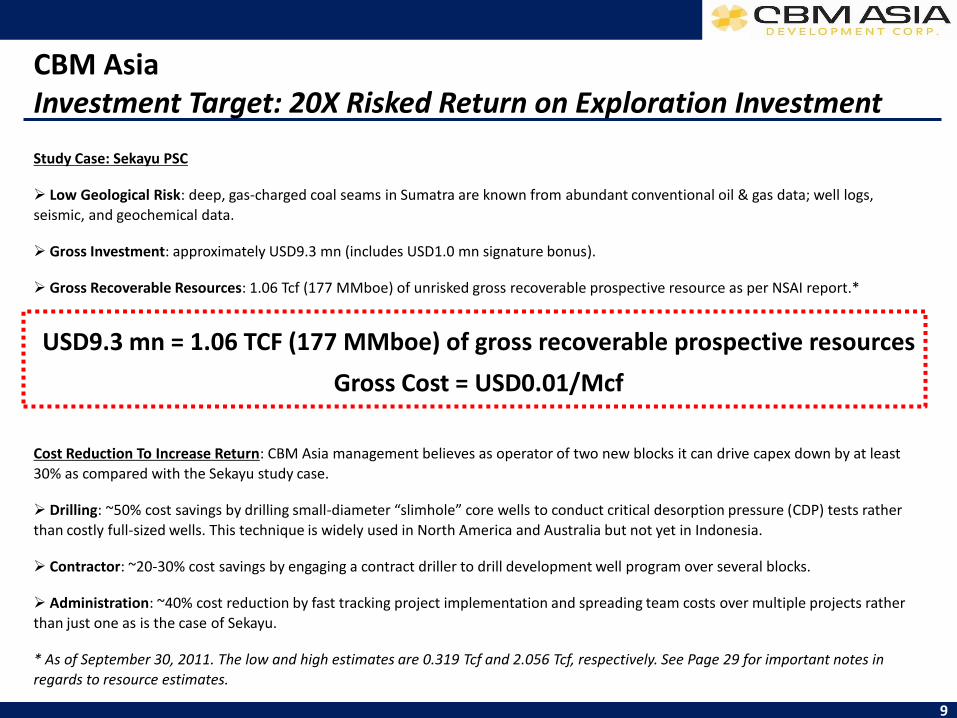
Study Case: Sekayu PSC
Low Geological Risk: deep, gas-charged coal seams in Sumatra are known from abundant conventional oil & gas data; well logs,
seismic, and geochemical data.
Gross Investment: approximately USD9.3 mn (includes USD1.0 mn signature bonus).
Gross Recoverable Resources: 1.06 Tcf (177 MMboe) of unrisked gross recoverable prospective resource as per NSAI report.*
USD9.3 mn = 1.06 TCF (177 MMboe) of gross recoverable prospective resources
Gross Cost = USD0.01/Mcf
Cost Reduction To Increase Return: CBM Asia management believes as operator of two new blocks it can drive capex down by at least
30% as compared with the Sekayu study case.
Drilling: ~50% cost savings by drilling small-diameter “slimhole” core wells to conduct critical desorption pressure (CDP) tests rather
than costly full-sized wells. This technique is widely used in North America and Australia but not yet in Indonesia.
Contractor: ~20-30% cost savings by engaging a contract driller to drill development well program over several blocks.
Administration: ~40% cost reduction by fast tracking project implementation and spreading team costs over multiple projects rather
than just one as is the case of Sekayu.
* As of September 30, 2011. The low and high estimates are 0.319 Tcf and 2.056 Tcf, respectively. See Page 29 for important notes in
regards to resource estimates.
CBM Asia Investment Target: 20X Risked Return on Exploration Investment

0.00
0.20
0.40
0.60
0.80
1.00
1.20
0
100
200
300
400
500
600
700
800
900
1,000
4.00 5.00 6.00 7.00 8.00 9.00 10.00
Gas Price (USD/Mcf)
USDmn USD/Mcf
10
Indonesia CBM Value Potential: 1.0 Tcf NPV10 Model = USD400-700 mn
Indonesia CBM PSC terms dictate contractor after-tax take is approximately 45%. Based on these terms and the following recovery, capex and operating assumptions: 1. Estimate ultimate recovery (EUR) /well: 1.0 Bcf 2. Drilling, completion & gathering costs/well: USD763 K 3. Operating costs: USD0.82/Mcf 1.0 Tcf of recoverable resources result in an in-the-ground pre-development value estimate range USD417-667 mn based on likely realized gas price range of USD6.00-8.00/Mcf (with 3% annual escalation rate). To achieve an 80% confidence level in the NPV(10) value requires approximately USD20 million of capex. USD2.5-3.0 mn - signature bonus, study and performance bond USD4.0-6.0 mn - 4 core wells and production tests to prove gas content, permeability, coal thickness and gas saturation. USD6-10.0 mn - two pilot projects to prove commercialization.
1.0 Tcf Recoverable CBM Project Value Sensitivity (NPV10)
Note: This model has been prepared solely for illustrative purposes. It does not represent actual values associated with CBM Asia’s current asset portfolio.

11
Indonesia CBM Value Potential: Australia Transaction Comparison
Australia’s coalbed methane industry has consolidated in recent years. These transactions provide an indication of potential CBM asset values in Indonesia.
Queensland’s lower tax regime and lower drilling costs are mostly offset by Indonesia’s higher gas prices and established/operating infrastructure – pipeline/LNG facilities.
Based on 33 reported transactions, the 2P average transaction value is USD1.03/Mcf, with a 3P average transaction value of USD0.45/Mcf.
1 Jul-03 - Oil Company of Australia Limited 12 May-08 - Santos CSG interests 23 Jul-09 - Eastern Gas Star Limited2 Jul-05 - Fairveiw CSG 13 Jun-08 - Arrow Australian CSG Assets 24 Dec-09 - ATP6503 Sep-05 - Sydney Gas Joint Venture 14 Aug 08 - Sunshine Gas Limited 25 Mar-10 - Dawson SeamGas CSG Fields4 Sep-05 - Moura CSG Field 15 Sep-08 - Origin Energy CSG Assets 26 Mar-10 - Arrow Energy Limited5 Sep-05 - ATP638P, PL198 16 Oct-08 - Queensland Gas Company Limited 27 Sep-10 - Glandstone LNG6 Feb-06 - Argyle and Lauren CSG Project 17 Dec-08 - Gloucester Project 28 Sep-10 - Apollo Gas Limited7 May-06 - CH4 Gs Limited 18 Dec-08 - Sydney Gas Limited 29 Dec-10 - Gladstone LNG8 Jun-06 - Maranbah Gas Project 19 Feb-09 - Pure Energy Resources Limited 30 Apr-11 - Australia Pacific LNG9 Jul-06 - Arrow Energy NL 20 Apr-09 - Tipton West Joint Venture 31 Apr-11 - ATP688P & ATP769P
10 Dec-06 - Queensland Gas Company Limited 21 Apr-09 - ATP788P 32 Jul-11 - East Star Gas Limited11 Feb-08 - Walloons CSG interest 22 Jul-09 - Narrabri Gas Project 33 Jul-11 - Narrabri Gas Project
0.00
0.50
1.00
1.50
2.00
2.50
3.00
3.50
4.00
1 2 3 4 5 6 7 8 9 10 11 12 13 14 15 16 17 18 19 20 21 22 23 24 25 26 27 28 29 30 31 32 33
2P Transaction Price
3P Transaction Price
Linear (2P Transaction Price)
Linear (3P Transaction Price)
USD/Mcf
Source: Grant Samuel
Queensland Indonesia
Gas Price (USD/Mcf)
Domestic 3.50-4.00* 5.00-9.50
Export na 8.00-12.00
Fiscal Regime Royalty/Tax PSC
Royalty 10% 5-10%
MRRT/Profit Petroleum 22.5% 19.6%
Income Tax 30.0% 44.0%
Total Tax 45.5%^ 55.0%* Grant Samuel ^ Queensland Resource Council
2P avg = USD1.03/Mcf 3P avg = USD0.45/Mcf

12
HULU
Indonesia Natural Gas Commercialization & Price: LNG, Steam Flood, Electricity & Industry
SEKAYU
KUTAI WEST
BESAR
KUTAI II Grissik-Duri Pipeline Length: 563 km Capacity: 420 MMcf/d
Chevron Duri Steam Flood +USD11/Mcf Linked to oil
price
Grissik-Singapore Pipeline Length: 477 km Capacity: 350 MMcf/d
South Sumatra – West Java I & II Pipeline
Length: 1,000 km Capacity: 970 MMcf/d
Singapore Market +USD11-15/Mcf
North Asia LNG Exports
+USD15/Mcf Linked to oil price
KUALA KAPUAS I
West Java Market Pop: 63.3 mn GRP/capita: USD2,540 Gas Price: +USD6-10/Mcf
Grissik
South Sumatra Market Pop: 16.9mn GRP/capita: USD1,923 Gas Price: +USD5-7/Mcf
Semarang
West Java LNG 500 MMcf/d
Central Java LNG 400 MMcf/d
Java LNG Imports USD11/Mcf
11% of oil price
Proposed Kalimantan – Java Pipeline
Length: 1,219 km Capacity: 1,000 MMcf/d
Bongtang LNG Capacity: 22.3 MMtpa Utilization Rate: 75%
East Java Market Pop: 39.56 mn GRP/capita: USD1,852 Gas Price: +USD6-8/Mcf
13
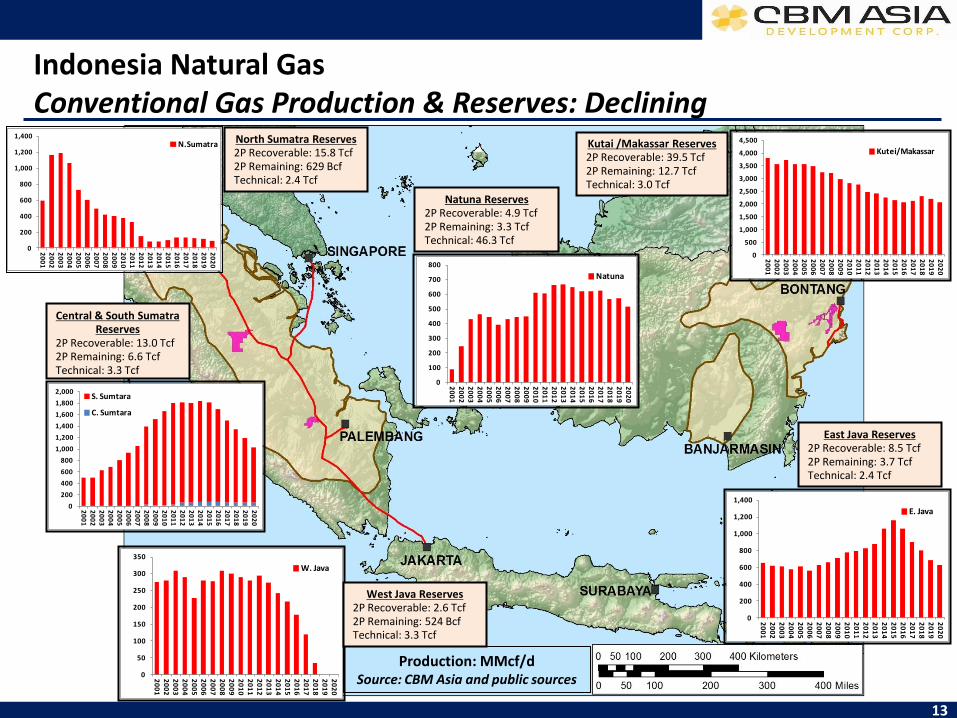
Indonesia Natural Gas Conventional Gas Production & Reserves: Declining
North Sumatra Reserves 2P Recoverable: 15.8 Tcf 2P Remaining: 629 Bcf Technical: 2.4 Tcf
0
500
1,000
1,500
2,000
2,500
3,000
3,500
4,000
4,500
20
01
20
02
20
03
20
04
20
05
20
06
20
07
20
08
20
09
20
10
20
11
20
12
20
13
20
14
20
15
20
16
20
17
20
18
20
19
20
20
Kutei/Makassar
0
200
400
600
800
1,000
1,200
1,400
20
01
20
02
20
03
20
04
20
05
20
06
20
07
20
08
20
09
20
10
20
11
20
12
20
13
20
14
20
15
20
16
20
17
20
18
20
19
20
20
E. Java
0
50
100
150
200
250
300
350
20
01
20
02
20
03
20
04
20
05
20
06
20
07
20
08
20
09
20
10
20
11
20
12
20
13
20
14
20
15
20
16
20
17
20
18
20
19
20
20
W. Java
0
200
400
600
800
1,000
1,200
1,400
20
01
20
02
20
03
20
04
20
05
20
06
20
07
20
08
20
09
20
10
20
11
20
12
20
13
20
14
20
15
20
16
20
17
20
18
20
19
20
20
N.Sumatra
0
200
400
600
800
1,000
1,200
1,400
1,600
1,800
2,000
20
01
20
02
20
03
20
04
20
05
20
06
20
07
20
08
20
09
20
10
20
11
20
12
20
13
20
14
20
15
20
16
20
17
20
18
20
19
20
20
S. Sumtara
C. Sumtara
Central & South Sumatra Reserves
2P Recoverable: 13.0 Tcf 2P Remaining: 6.6 Tcf Technical: 3.3 Tcf
West Java Reserves 2P Recoverable: 2.6 Tcf 2P Remaining: 524 Bcf Technical: 3.3 Tcf
Natuna Reserves 2P Recoverable: 4.9 Tcf 2P Remaining: 3.3 Tcf Technical: 46.3 Tcf
East Java Reserves
2P Recoverable: 8.5 Tcf 2P Remaining: 3.7 Tcf Technical: 2.4 Tcf
Kutai /Makassar Reserves 2P Recoverable: 39.5 Tcf 2P Remaining: 12.7 Tcf Technical: 3.0 Tcf
0
100
200
300
400
500
600
700
800
20
01
20
02
20
03
20
04
20
05
20
06
20
07
20
08
20
09
20
10
20
11
20
12
20
13
20
14
20
15
20
16
20
17
20
18
20
19
20
20
Natuna
Production: MMcf/d Source: CBM Asia and public sources

14
Indonesia Natural Gas Natural Gas Supply/Demand Trends – Domestic and Export
0
5,000
10,000
15,000
20,000
19
80
19
82
19
84
19
86
19
88
19
90
19
92
19
94
19
96
19
98
20
00
20
02
20
04
20
06
20
08
20
10
Consumption
Production
Indonesia: gas consumption per capita of 6.1 Mcf/year far below world average of 16.6 Mcf/year or economic peers of 20 Mcf/year. Production unlikely to match demand growth supporting strong domestic prices. Asia: demand outstripping supply - 9.5 Bcf/d deficit. 2.6 billion people (China, India and Vietnam - 40% of world’s population) consume less than 2.4 Mcf/capita or 1/6 the world average. The potential for a surge in demand supports export pricing.
0
1,000
2,000
3,000
19
80
19
82
19
84
19
86
19
88
19
90
19
92
19
94
19
96
19
98
20
00
20
02
20
04
20
06
20
08
20
10
Production
Consumption
Indonesia: Gas Demand & Production
Asia-Pacific: Gas Demand & Production
BC
F B
CF
Source: EIA and World Bank
GDP / NATURAL GAS Pop Capita Mcf / Bcf / 10 Year Mcf / BCF / 10 Year Mcf / BCF /
2010 mn USD Capita / Y Day Growth Capita / Y Day Growth Capita / Y Day
Australia 22 42,131 51.1 3.1 36% 77.5 4.7 46% 26.3 1.6Bangladesh 149 675 4.8 1.9 95% 4.8 1.9 95% 0.0 0.0China 1,338 4,428 2.8 10.3 287% 2.5 9.1 211% -0.3 -1.2India 1,171 1,475 1.9 6.2 168% 1.6 5.1 117% -0.4 -1.2Indonesia 240 2,946 6.1 4.0 101% 12.2 8.0 55% 6.1 4.0Japan 127 42,831 29.2 10.2 28% 1.4 0.5 -10% -27.8 -9.7Korea, South 49 20,757 31.0 4.1 111% 0.6 0.1 na -30.4 -4.1Malaysia 28 8,373 40.3 3.1 28% 76.4 5.9 29% 36.1 2.8New Zealand 4 26,932 33.7 0.4 -35% 34.8 0.4 -33% 1.1 0.0Pakistan 174 1,073 8.1 3.8 81% 8.1 3.8 81% 0.0 0.0Philippines 93 1,820 1.1 0.3 1330% 1.1 0.3 1330% 0.0 0.0Singapore 4 36,968 67.4 0.8 612% 0.0 0.0 na -67.4 -0.8Taiwan 23 16,422 22.8 1.5 122% 0.4 0.0 -69% -22.4 -1.4Thailand 69 4,169 23.0 4.4 90% 18.5 3.5 94% -4.5 -0.9Vietnam 87 1,166 3.3 0.8 532% 3.3 0.8 531% 0.0 0.0 Africa 1,025 3.5 9.7 56% 7.2 20.2 59% 3.7 10.5Asia 3,780 5.4 56.1 92% 4.5 46.6 77% -0.9 -9.5Eurasia 286 73.5 57.5 9% 91.8 71.9 8% 18.3 14.3Europe 574 35.9 56.5 15% 18.9 29.7 -2% -17.1 -26.9C&S America 475 10.2 13.3 37% 11.2 14.6 46% 1.0 1.3Middle East 216 61.3 36.3 88% 77.0 45.6 108% 15.7 9.3North America 457 63.8 79.9 9% 62.8 78.6 4% -1.0 -1.3World 6,815 16.6 309.4 29% 16.4 307.1 26% -0.1 -2.3
-------- Consumption -------- ------- Production -------- -- Surplus/(Deficit) --

15
CBM Asia Asset Portfolio: Four Awarded PSCs, One Application
Total
Area South Central East East East South Ex
PSC Name Sekayu Hulu Kutai-West2Besar Kutai II3
Kuala Kapuas I Kutia-II
PSC Status PSC Granted
PSC Granted
Waiting on
Extension
Approval
PSC Granted
PSC Granted
Waiting on
Extension
Approval
PSC Granted
Ownership in
Abritration
Application For PSC
Submitted
CBMA Working Interest 12% 70% 18% 70% 40% 80%
Right to Acquire1 12% na na na na na
Operatorship and Technical Leader - Operator PT Medco CBMA Newton CBMA Ephindo CBMA - Technical Lead JSSE/Medco CBMA CBMA CBMA Ephindo CBMA
Partners - CBM Asia 70% 70% 40% 80% - South Sumatra Energy 50% - Kutai West CBM 45% - Newton Energy 55% - PT Medco 50% - Ephindo Energy 60% - Other 30% 30% 20%
Acreage with Extensions (km2) - Gross 580 1,983 869 1,930 560 1,501 6,863 - Net 139 1,388 156 1,351 224 1,201 4,236
Recoverable Prospective Resource (BCF) - Best Estimates - NI 51-101 Compliant (Gross) 1,062 na na na na na 1,062 - NI 51-101 Compliant (Net) 254 na na na na na 254
Geological Data Estimates (CBM Asia)Usuable Area 80% 55% 65% 75% 45% 50%Net Coal Thickness (ft) 158 114 98 82 98 193Gas Content (scf/ton) 120 130 160 160 160 110Ash+Moisture Content 20% 20% 15% 15% 15% 28%Coal Density (ton acre/foot) 1,800 1,800 1,800 1,800 1,800 1,800Permeability (mD) 187 187 25 25 25 25Recovery Rate 55% 55% 55% 55% 55% 55%
--- Sumatra ---
1. Through South Sumatra Energy - CBM Asia has the right to acquire, indirectly, a 12% participating interest in the Sekayu PSC, together with the exclusive right to
secure financing, indirectly, on behalf of an additional 12% participating interest in the Sekayu PSC. 2 Kutai West CBM: (Ephindo Ilthabi CBM Holding 60%, CBM Asia
40%), 3. CBM Asia has a participation agreement to acquire 40% of Kutai II PSC - ownerships rights are in dispute and under arbitration in Singapore.
--- Kalimantan ---

CAD mn 1H 09 2H 09 1H 10 2H 10 1H 11 2H 11 1H 12 2H 12 1H 13 2H 13 1H 14 2H 14 1H 15 2H 15
Overhead 0.9 1.1 0.6 0.7 0.9 1.1 0.9 0.9 0.9 0.9 0.9 0.9 0.9 0.9
Projects:
Support 0.1 0.2 0.1 0.2 0.1 0.4 0.9 1.0 1.0 1.0 1.0 1.0 1.0 1.0Sekayu 0.0 1.4 0.8 1.0 1.3 1.7 1.0 1.3 1.3Kutai West 0.2 0.1 0.2 0.0 0.2 0.9 2.4 0.3 1.8 1.8Hulu 1.0 0.6 0.4 5.5 4.5 4.5 0.2Besar 1.0 0.6 0.4 5.4 4.5 4.5 0.2Kuala Kapuas I 0.0 2.0 0.4 4.9 3.7 5.7 1.5 0.0 0.0New PSC 1New PSC 2 New PSC 3Total 1.2 2.8 1.7 1.9 2.5 6.1 8.3 4.7 20.7 16.4 16.6 3.7 1.9 1.9
6%13%19%25%31%38%50%56%63%69%75%
0%
20%
40%
60%
80%
2009 2010 2011 2012 2013 2014 2015
Sekayu Kutai West Hulu Besar New PSCs
16
CBM Asia Use of Proceeds Strategy: Derisk Minority Stakes Then Sell to Finance Majority Stakes
Financed With Equity Financed With Equity/Asset Sale Proceeds
Ass
et D
eri
sk L
eve
l / V
alu
e
2012 Budget Sekayu: CAD2.7 mn - 5 well pilot & two core wells. Target: first production & sales and upgrade resources to 1P, 2P, 3P reserves and contingent resource. 70% derisked. Kutai West: CAD2.5 mn - 2 core wells and 2 production wells. Target: establish NI 51-101 compliant contingent resource estimate. 50% derisked.
Not Yet Budgeted
Asset Sale
17
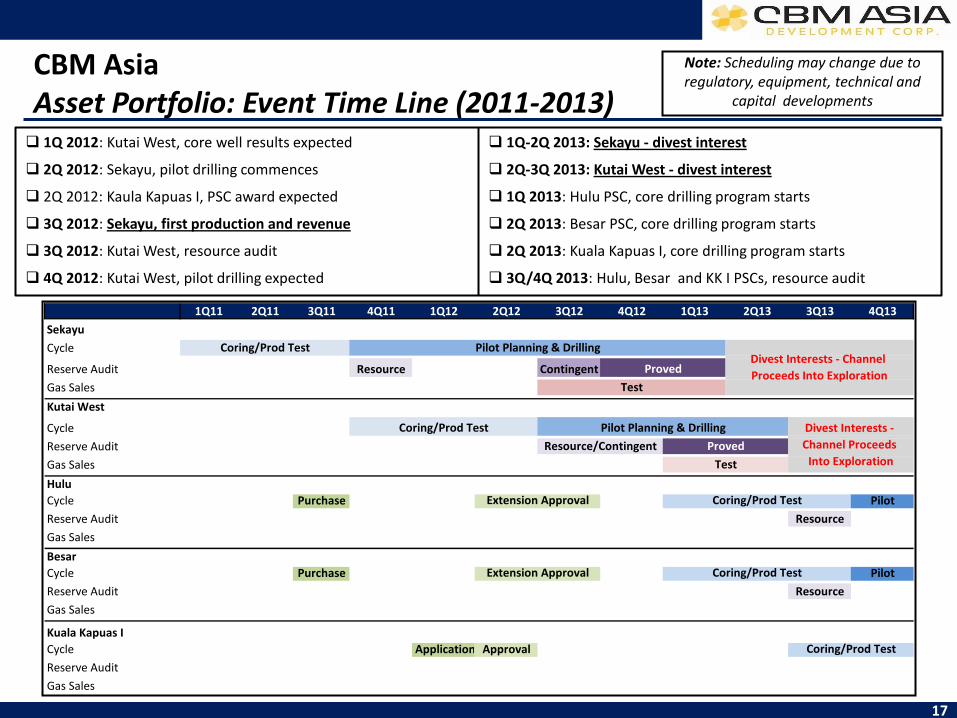
CBM Asia Asset Portfolio: Event Time Line (2011-2013)
Note: Scheduling may change due to regulatory, equipment, technical and
capital developments
1Q 2012: Kutai West, core well results expected
2Q 2012: Sekayu, pilot drilling commences
2Q 2012: Kaula Kapuas I, PSC award expected
3Q 2012: Sekayu, first production and revenue
3Q 2012: Kutai West, resource audit
4Q 2012: Kutai West, pilot drilling expected
1Q-2Q 2013: Sekayu - divest interest
2Q-3Q 2013: Kutai West - divest interest
1Q 2013: Hulu PSC, core drilling program starts
2Q 2013: Besar PSC, core drilling program starts
2Q 2013: Kuala Kapuas I, core drilling program starts
3Q/4Q 2013: Hulu, Besar and KK I PSCs, resource audit
1Q11 2Q11 3Q11 4Q11 1Q12 2Q12 3Q12 4Q12 1Q13 2Q13 3Q13 4Q13
Sekayu
Cycle
Reserve Audit Resource Contingent
Gas Sales
Kutai West
Cycle
Reserve Audit
Gas Sales
Hulu
Cycle Purchase Pilot
Reserve Audit Resource
Gas Sales
Besar
Cycle Purchase Pilot
Reserve Audit Resource
Gas Sales
Kuala Kapuas I
Cycle Application Approval
Reserve Audit
Gas Sales
Coring/Prod TestExtension Approval
Extension Approval
Coring/Prod Test
Resource/Contingent
Test
Divest Interests -
Channel Proceeds
Into Exploration
Coring/Prod Test
Pilot Planning & Drilling
Proved
Coring/Prod Test
Coring/Prod Test
Divest Interests - Channel
Proceeds Into ExplorationTest
Pilot Planning & Drilling
Proved

18
Sekayu PSC The CBM ‘SWEET SPOT’ - 2 Wells Flowing Gas to Surface
SEKAYU PSC Gross Area: 580 km2 Gross Unrisked Recoverable Prospective Resource: 1.06 Tcf Best Estimate. Commercialization: close to Trans Sumatra Gas Pipeline. Early stage commercialization focused on small scale power production. Operation Calendar: 2Q 12: Production Pilot, 3Q 12: First production
Lemigas CBM Pilot: flowed gas
demonstrating gas saturation.
SE-CBM-03 Immediate Gas To
Surface.
Short Distance to Gas Pipeline.
4 2
1 3
CBM Asia

19
Sekayu PSC Superior to USA Analog: Powder River Basin
South Sumatra geology compares favorably with Powder River Basin (Wyoming, USA), which most experts consider the best commercial analog for
Indonesia.
The Powder River Basin is the world’s second largest CBM field, producing 1.5 Bcf/d and expected to recover 30 Tcf.
Well test results indicate that Sekayu CBM reservoir conditions are significantly better than in the Powder
River Basin.
indicates better result at Sekayu
Reservoir
Property Variable Source Variable Source
Depth (ft) 1,200 BBC 2,000 Well Logs Deeper = more pressure, higher potential gas content
Coal Thickness (ft) 120 BBC 147 Well Logs Thicker = more potential gas in place
Coal Rank (Ro) 0.3% USGS 0.3%-0.4% Lab Test Higher Rank = higher potential gas content
Gas Content (ft3/ton d.a.f) 50 USGS >100 Corelab Higher Gas Content = more potential gas in place
Gas Saturation 60% USGS 95% Weatherford Higher Saturation = faster potential gas production
Permeability (mD) 500 USGS 500 Medco Comparable
Gas Price of 10% ROE (USD/Mcf) 4.22 BBC TBD Testing Sekayu looks favorable but requires production testing
Current Gas Price (USD/Mcf) 2.50 NYMEX 5.50-9.40 Medco Higher gas prices in Sumatra
Source: BBC = Bill Barrett Resources 2011. USGS = US Geological Survey, 2004
Comment
Wyoming USA
Powder River
Big George Coal
Indonesia
South Sumatra
Sekayu PSC
2,000
2,500
1,500
1,000
500
0
Fm
1
Depth(Feet)
Fm
2F
m 3
Mud Gas Units Unknown0 100 200 300 400
JA
F01525
.CD
R

20
Kutai West PSC & Kutai II PSC Adjacent to BP’s Sanga-Sanga PSC and Bontang LNG
SANGA-SANGA PSC
WORLD’S FIRST CBM TO LNG BP/ENI has been exporting CBM from Bontang as LNG since
March 2011 – world first. ENI estimates the PSC holds as
much as 13Tcf (non 51-101 compliant) in CBM resources.
RECENT DEVELOPMENTS BY MAJORS TOTAL: in March 2011 acquired PSC in Kutai Basin, Kalimantan. TOTAL’s first coalbed methane block worldwide. Located close to CBM Asia’s Kutai West PSC interests. BP: Continues to test their first CBM PSC at Sanga-Sanga, immediately east and adjacent to CBM Asia’s interests at Kutai West. Recently acquired Sanga-Sanga West PSC.
Dart Energy Flowed Gas to Surface
KUTAI II PSC Gross Area: 560 km2 – original area Working Interest: 40% (interest level in arbitration)*** Commercialization: adjacent to Bontang LNG gas trunk line Operation Calendar: NA
KUTAI WEST PSC Gross Area: 869 km2 Working Interest: 18% & technical lead Commercialization: adjacent to Bontang LNG gas trunk line Operation Calendar: 4Q 2011: core well drilling 3Q 2012: resource audit
Well 2B Complete
Moving Rig to Well 2C

21
Hulu PSC Central Sumatra: 70% Working Interest and Operated Tertiary Basin
INDONESIA
Indragiri Hulu
N. Sumatra Basin
C. Sumatra Basin
S. Sumatra Basin
HULU PSC Working Interest: 70% & operatorship Gross Area: Current: 519 km2
With Pending Extensions: 1,983 km2
Commercialization: Adjacent to Gassik-Duri pipeline: Duri steam flood, local power & industrial sales. Operation Calendar: 1Q 13: Exploration
HULU PSC: GEOLOGICAL DERISK
Significant seismic coverage over sweet spots and two conventional wells providing coal thickness and gas indication data.
USD11/Mcf

22
Bentian Besar PSC - Kalimantan Kalimantan: 70% Working Interest and Operatorship
BENTIAN BESAR PSC Working Interest: 70% & operatorship Gross Area: Base 830 km2, With Pending Extension: 1,930 km2
Commercialization: Bontang LNG, industry and power generation Operational Calendar: 1Q 13: Exploration
BENTIAN BESAR PSC: GEOLOGICAL DERISK Significant seismic coverage over sweet spots and one conventional well in the main sweet spot indicating 261 ft of net coal thickness.

23
Kuala Kapuas I Application Kalimantan: 80% Working Interest and Operatorship
KUALA KAPUAS I APPLICATION Working Interest: 80% & operatorship Gross Area: 1,500 km2 Commercialization: Mini-LNG / Kalimantan-Java Pipeline Operational Calendar: 2Q-3Q 12: Secure PSC through Application Process 2Q 13: Exploration
KUALA KAPUAS I APPLICATION: GEOLOGICAL DERISK 15 conventional wells in adjacent blocks, seismic coverage and large airborne gravity survey over entire block.
RECENT DEVELOPMENT BY
MAJORS
BP: acquired three CBM PSC’s in the Barito Basin. ExxonMobil: drilling 19 CBM test wells at four CBM PSCs in the Barito Basin.
2,000
2,500
1,500
1,000
500
0
Fm
1
Depth(Feet)
Fm
2F
m 3
Mud Gas Units Unknown0 100 200 300 400
JA
F01525
.CD
R

24
Growth Opportunities JAA, Opportunistic Acquisitions, NOC Partnership and CBM to Liquids
Distressed CBM Opportunities
CBM Asia is investigating all existing CBM PSC to determine acquisition or merger opportunities. Recent activities include the acquisition of 70% interest and operatorship in two PSCs.
New Area CBM Opportunities
CBM Asia is investigating CBM bidding rounds for new acreage offered by the Indonesian government.
Asian Oil Company Partnership Program
CBM Asia is actively engaged with several Asian oil and gas companies to form a joint venture to explore for CBM opportunities in Indonesia.
CBM to Liquids
CBM Asia is actively engaged with Indonesian coal mining groups in regards to producing stranded CBM on their properties as feedstock for gas to liquids conversion. Very high logistical margins available due to high diesel prices at coal mining sites.

25
Indonesian CBM PSC Terms Fiscal Flow=45% After Tax; Most Favorable Terms In Country
GROSS PRODUCTION
(-) FTP (5-10%) FTP – 5-10%
(19.6 -21.8%,100% ) FTP 5-10%*
(78.2-80.4%)
(-) Cost Recovery (90-100%)
Profit Petroleum Split
Taxable Income
(-) Income Tax (44%)
Contractor Share (78.1 - 80.4%) (gas)
Indonesia Share (19.6 - 21.8%) (gas)
(+) DMO Fee
(-) DMO (25%)
CONTRACTOR TAKE
Revenue
minus FTP (royalty)
minus Cost Recovery
(formula to recover capex and opex)
= Profit Split (government and
contractor)
Domestic Market
Obligation (no price
adjustment)
- Income Tax
= Contractor Take
Revenue Flow
Indonesia Contractor
INDONESIA TAKE
* Royalty split with government in
some contracts.
26
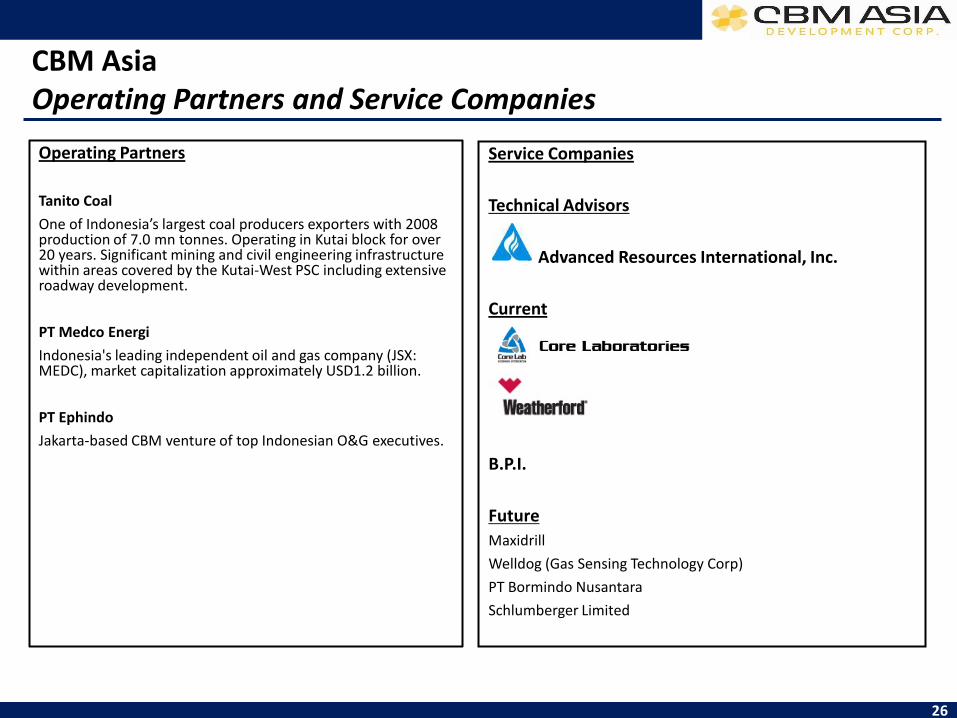
Operating Partners
Tanito Coal
One of Indonesia’s largest coal producers exporters with 2008 production of 7.0 mn tonnes. Operating in Kutai block for over 20 years. Significant mining and civil engineering infrastructure within areas covered by the Kutai-West PSC including extensive roadway development.
PT Medco Energi
Indonesia's leading independent oil and gas company (JSX: MEDC), market capitalization approximately USD1.2 billion.
PT Ephindo
Jakarta-based CBM venture of top Indonesian O&G executives.
CBM Asia Operating Partners and Service Companies
Service Companies
Technical Advisors
Advanced Resources International, Inc.
Current
B.P.I.
Future
Maxidrill
Welldog (Gas Sensing Technology Corp)
PT Bormindo Nusantara
Schlumberger Limited

27
CBM Asia Corporate and Financial Highlights
Listings:
Canada: TSX Venture Exchange – symbol TCF Germany: Frankfurt Stock Exchange – symbol IY2 USA: OTC – CBMDF
Head Office:
Share and Warrant Issue History:
Outstanding Issued Shares: 151.9 mn* Outstanding Warrants: 96.0 mn (CAD36.2 mn value)* Outstanding Options: 14.0 mn (CAD2.9 mn value)* Fully Diluted Shares: 261.9 mn* Cash: CAD9.9 mn* Debt: Nil*
Transfer Agent and Registrar: Computershare Trust Company of Canada 3rd Floor, 510 Burrard Street Vancouver, British Columbia Canada, V6C 3B9
Auditors: BDO Canada LLP 600 Cathedral Place 925 West Georgia Street Vancouver, British Columbia Canada, V6C 3L2
Legal Counsel: Canada Gregory T. Chu, A Law Corporation 650- 1188 West Georgia St. Vancouver, British Columbia Canada, V6E 4A2
Reporting Jurisdictions: British Columbia, Alberta, Ontario CUSIP Number: 1248XC101
CBM Asia Development Corp. 404 - 815 Hornby Street Vancouver, British Columbia Canada V6Z 2E6
Legal Counsel: Singapore Drew & Napier LLC 10 Collyer Quay #10-01 Ocean Financial Centre Singapore , 049315
Share Ownership Structure*
*as of March 12, 2012
Date
No. of Shares
mn Price CAD
Raised CAD
mn
Warrants
Attached
Exercise Price
CAD Period Years
Aug-08 8.2 0.60 4.9 0.50 0.90 2Oct-09 11.0 0.30 3.3 1.00 0.40 3Mar-11 4.3 0.15 0.6 na na naMar-11 5.7 0.17 1.0 na na naJul-11 13.4 0.32 4.3 1.00 0.55 2Dec-11 7.2 0.18 1.3 1.00 0.35 2Feb-12 16.3 0.18 2.9 1.00 0.35 2Mar-12 49.6 0.18 8.9 1.00 0.35 2
14%
30%
9%
47%
Management
Institutions
Professional
Other
28
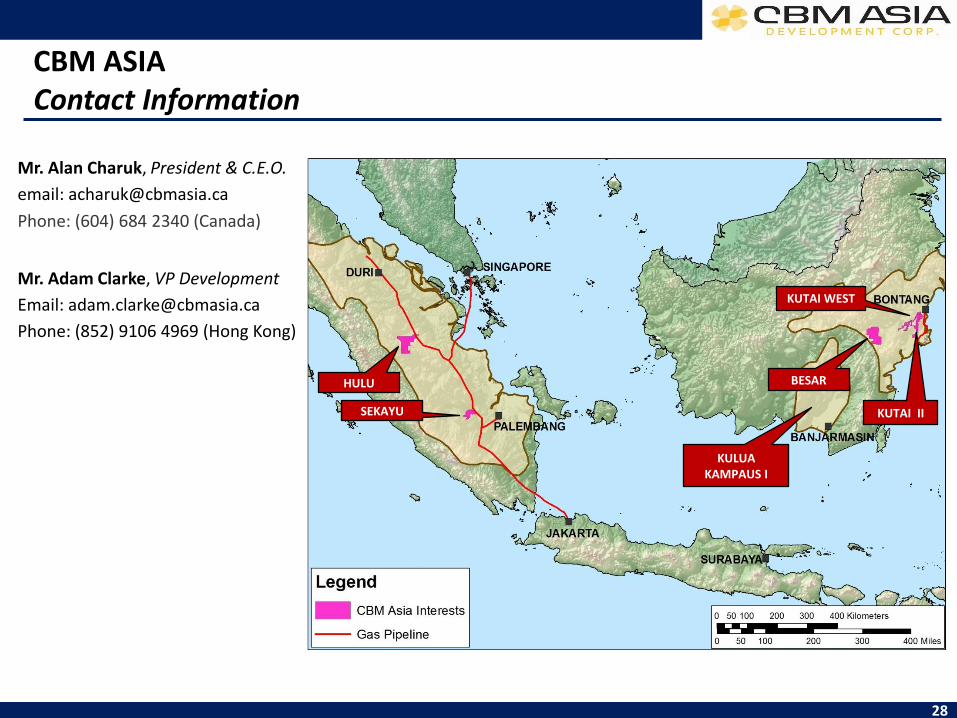
CBM ASIA Contact Information
Mr. Alan Charuk, President & C.E.O.
email: [email protected]
Phone: (604) 684 2340 (Canada)
Mr. Adam Clarke, VP Development
Email: [email protected]
Phone: (852) 9106 4969 (Hong Kong)
SEKAYU KUTAI II
HULU BESAR
KUTAI WEST
KULUA KAMPAUS I

29
Disclaimer STATEMENTS CONCERNING SEKAYU PSC ESTIMATES 1. A Production Sharing Contract (PSC) between CBM Asia and its Partners and the Indonesian Government executed for Sekayu gives CBM Asia and its Partners the right to explore for coalbed methane. If a commercial discovery is made, CBM Asia and its Partners have the right to develop and produce from Sekayu. 2. The NSAI figures represent recoverable unrisked gross (100%) prospective gas resources for the Sekayu PSC as a whole and not CBM Asia’s participating interest therein. CBM Asia has the right to acquire, indirectly, a 12% participating interest in the Sekayu PSC, together with the exclusive right to secure financing, indirectly, on behalf of an additional 12% participating interest in the Sekayu PSC. 3. The NSAI prospective resources have been estimated using deterministic methods and are dependent on a CBM discovery being made. If a discovery is made and development undertaken, the approximate probability that the recoverable volumes will equal or exceed the unrisked estimated amounts is generally inferred to be 90% for the low estimate, at least 50% for the best estimate, and at least 10% for the high estimate. 4. Prospective resources are those quantities of petroleum estimated, as of a given date (being September 30, 2011), to be potentially recoverable from undiscovered accumulations by application of future development projects. Prospective resources have both an associated chance of discovery and a chance of development. The chance of commerciality is the product of these two risk components. There is no certainty that any portion of the prospective resources will be discovered. If a discovery is made, there is no certainty that it will be developed or, if it is developed, there is no certainty as to the timing of such development or that it will be commercially viable to produce any portion of the prospective resources. Prospective gas resources are undiscovered resources that indicate exploration opportunities and development potential in the event a commercial discovery is made and should not be construed as reserves or contingent discovered resources. 5. For a further discussion of the risks and uncertainties associated with the recovery of unrisked prospective resources and other significant factors relevant to the above estimates, please refer directly to NSAI’s technical report entitled “Estimates of Unrisked Gross (100 Percent) Prospective Gas Resources located in the Sekayu Block South Sumatra Basin, Indonesia as of September 30, 2011” filed on SEDAR at www.sedar.com and posted on the Company’s website at www.cbmasia.ca.

30
Disclaimer
6. The BOE (barrels of oil equivalent) figures for the Sekayu prospective resource estimates contained in this presentation have been derived by converting prospective resources of gas to oil in the ratio of six thousand cubic feet of gas to one barrel of oil (6 Mcf: 1 bbl). BOEs may be misleading, particularly if used in isolation. A BOE conversion ratio of 6 Mcf: 1 bbl is based on an energy equivalency conversion method primarily applicable to the burner tip and does not represent a value equivalency at the wellhead. TERMS OF USE AND DISCLAIMER - This presentation is being provided for the sole purpose of providing the recipients with background information about CBM Asia Development Corp. (“CBM Asia”). Other than disclosures relating to CBM Asia, the information contained in this presentation is based on current public information that we consider reliable. CBM Asia has made reasonable efforts to ensure that the information contained in this report is accurate as of the date hereof, however, there may be inadvertent or occasional errors. No representation, warranty or guarantee, express or implied, is made as to the fairness, accuracy, completeness or correctness of information contained in this presentation, including the accuracy, likelihood of achievement or reasonableness of any forecasts, prospects, returns or statements in relation to future matters contained in this presentation. The views and information provided herein are based on a number of estimates and assumptions that are subject to significant business, economic, regulatory and competitive uncertainties. See “Forward Looking Statements” below. CBM Asia is not liable to any recipient or third party for the use of or reliance on the information contained in this presentation. This presentation provides information in summary form only, is not intended to be complete and does not constitute an offer to sell or the solicitation of an offer to buy any security. It is not intended to be relied upon as advice to investors or potential investors and does not constitute a personal recommendation or take into account the investment objectives, financial situation or needs of any particular investor. CBM Asia is not acting as agent or advisor and encourages the use of independent consultants, as necessary, prior to entering into transactions.

31
FORWARD LOOKING STATEMENTS -. All statements set forth in this presentation, (other than statements of historical fact) including management's assessment of future plans and operations, are forward-looking statements. By their very nature, forward-looking statements are subject to numerous risks and uncertainties, some of which are beyond our control. Forward looking statements are based on the opinions and estimates of management at the date the statements are made, as well as a number of assumptions made by, and information currently available to, CBM Asia concerning, among other things, anticipated geological formations, well and financial performance, business prospects, strategies, regulatory developments and approvals, future commodity prices, the existence of future reserves and productions levels of CBM Asia’s assets, the ability to obtain financing on acceptable terms, the ability to acquire production and reserves through acquisition, development and exploration activities and that there will be no significant events occurring outside of CBM Asia’s normal course of business. Although CBM Asia considers these assumptions to be reasonable based on information currently available to it, they may prove to be incorrect. In addition, many of these assumptions are based on factors and events that are not within the control of CBM Asia and there is no assurance they will prove to be correct. Factors that could cause actual results to vary materially from results anticipated by such forward looking statements include the effect of and changes in general economic and market conditions, risks associated with coalbed methane exploration, development, production, marketing and transportation, loss of markets, industry conditions and competition, volatility of commodity prices, currency fluctuations, imprecision of resource and/or reserve estimates, environmental risks, changes in project parameters, the possibility of project cost overruns or unanticipated costs and expenses, labour disputes, competition from other industry participants, the ability to access qualified personnel and field services, failure of plant, equipment or processes to operate as anticipated, acquisitions not being completed or integrated successfully, decisions by regulators and the ability to access sufficient capital from internal and external sources, as well as those risk factors discussed or referred to in CBM Asia’s public filings with the securities regulatory authorities in those provinces of Canada in which CBM Asia is a reporting issuer and available at www.sedar.com. Although CBM Asia has attempted to identify important factors that could cause actual actions, events or results to differ materially from those described in forward looking statements, there may be other factors that cause actions, events or results not to be anticipated, estimated or intended. Readers are cautioned not to place undue reliance on the forward-looking statements as the assumptions used in the preparation of such information, although considered reasonable at the time of preparation, may prove to be imprecise and actual results, performance or achievements could materially differ from those expressed or implied in such forward-looking statements and accordingly, no assurance can be given that any of the plans, intentions, events or expectations anticipated by forward-looking statements will transpire or occur, or if any of them do so, what benefit CBM Asia will derive therefrom. Actual results will differ and the difference may be material and adverse. CBM Asia undertakes no obligation to update forward looking statements if circumstances or management’s estimates or opinions should change except as required by applicable securities laws.
Disclaimer
Related Documents


![H20youryou[2] · 2020. 9. 1. · 65 pdf pdf xml xsd jpgis pdf ( ) pdf ( ) txt pdf jmp2.0 pdf xml xsd jpgis pdf ( ) pdf pdf ( ) pdf ( ) txt pdf pdf jmp2.0 jmp2.0 pdf xml xsd](https://static.cupdf.com/doc/110x72/60af39aebf2201127e590ef7/h20youryou2-2020-9-1-65-pdf-pdf-xml-xsd-jpgis-pdf-pdf-txt-pdf-jmp20.jpg)


