1 23 Environmental Earth Sciences ISSN 1866-6280 Volume 66 Number 3 Environ Earth Sci (2012) 66:763-772 DOI 10.1007/s12665-011-1284-5 Case study: a 3D resistivity and induced polarization imaging from downstream a waste disposal site in Brazil Andréa Teixeira Ustra, Vagner Roberto Elis, Giulliana Mondelli, Lázaro Valentin Zuquette & Heraldo Luiz Giacheti

Welcome message from author
This document is posted to help you gain knowledge. Please leave a comment to let me know what you think about it! Share it to your friends and learn new things together.
Transcript
1 23
Environmental Earth Sciences ISSN 1866-6280Volume 66Number 3 Environ Earth Sci (2012) 66:763-772DOI 10.1007/s12665-011-1284-5
Case study: a 3D resistivity and inducedpolarization imaging from downstream awaste disposal site in Brazil
Andréa Teixeira Ustra, Vagner RobertoElis, Giulliana Mondelli, Lázaro ValentinZuquette & Heraldo Luiz Giacheti

1 23
Your article is protected by copyright and
all rights are held exclusively by Springer-
Verlag. This e-offprint is for personal use only
and shall not be self-archived in electronic
repositories. If you wish to self-archive your
work, please use the accepted author’s
version for posting to your own website or
your institution’s repository. You may further
deposit the accepted author’s version on a
funder’s repository at a funder’s request,
provided it is not made publicly available until
12 months after publication.
ORIGINAL ARTICLE
Case study: a 3D resistivity and induced polarization imagingfrom downstream a waste disposal site in Brazil
Andrea Teixeira Ustra • Vagner Roberto Elis •
Giulliana Mondelli • Lazaro Valentin Zuquette •
Heraldo Luiz Giacheti
Received: 8 December 2010 / Accepted: 28 July 2011 / Published online: 19 August 2011
� Springer-Verlag 2011
Abstract A contaminated site from a downstream muni-
cipal solid waste disposal site in Brazil was investigated by
using a 3D resistivity and induced polarization (IP) imaging
technique. This investigation purpose was to detect and
delineate contamination plume produced by wastes. The
area was selected based on previous geophysical investi-
gations, and chemical analyses carried out in the site, indi-
cating the presence of a contamination plume in the area.
Resistivity model has successfully imaged waste presence
(q\ 20 Xm), water table depth, and groundwater flow
direction. A conductive anomaly (q\ 20 Xm) outside
wastes placement was interpreted as a contamination plume.
Chargeability model was also able to imaging waste pres-
ence (m [ 31 mV/V), water table depth, and groundwater
flow direction. A higher chargeability zone (m [ 31 mV/V)
outside wastes placement and following conductive anom-
aly was interpreted as a contamination plume. Normalized
chargeability (MN = m/q) confirmed polarizable zone,
which could be an effect of a salinity increase (contamina-
tion plume), and the clay presence in the environment.
Keywords 3D inversion � Induced polarization �Resistivity � Chargeability � Normalized chargeability �Waste disposal site � Contamination plume
Introduction
Environmental impacts caused by urban waste disposal
sites are a world-wide concern. Environmental impacts
related to waste disposal are due to the environmental
contaminant migration, and subsequent soil and ground-
water contamination. Municipal waste disposal sites usu-
ally present high concentrations of heavy metals, nutrients,
and organic substances that can inflict health risk to both
population and natural environment. Environment pollu-
tion capacity depends on water quality and volume that
percolate through wastes, reaching aquifers. Contamination
plume of a waste disposal site is formed by this way, and it
is usually associated with high ion concentrations, and for
that reason low resistivity values. This makes electrical
imaging techniques an interesting tool for mapping con-
tamination plumes generated from waste disposal sites.
Application of resistivity imaging techniques to envi-
ronmental studies is widely reported in the literature
(Abu-Zeid et al. 2003; Adepelumi et al. 2008; Atekwana
et al. 2000, 2004; Chambers et al. 2002; Frohlich et al. 2008).
A. T. Ustra (&) � V. R. Elis
Institute of Astronomy, Geophysics, and Atmospheric Sciences,
Universidade de Sao Paulo, Secretaria de Geofısica.
Rua do Matao, 1226, Sao Paulo, SP 05508090, Brazil
e-mail: [email protected]
V. R. Elis
e-mail: [email protected]
G. Mondelli
Instituto de Pesquisas Tecnologicas do Estado de Sao Paulo,
Centro de Tecnologias Ambientais e Energeticas - CETAE,
Av. Prof. Almeida Prado, 532, Sao Paulo, SP 05508-901, Brazil
e-mail: [email protected]
L. V. Zuquette
Department of Geotechnical Engineering,
Universidade de Sao Paulo, Av. Trabalhador Sao Carlense,
400, Sao Carlos, SP 13566590, Brazil
e-mail: [email protected]
H. L. Giacheti
Department of Civil Engineering,
Universidade Estadual Paulista,
Av. Dr. Luiz Edmundo Carrijo Coube s/n,
Bauru, SP 17033360, Brazil
e-mail: [email protected]
123
Environ Earth Sci (2012) 66:763–772
DOI 10.1007/s12665-011-1284-5
Author's personal copy
Bernstone et al. (2000) surveyed landfill sites to test the
capability of resistivity method as a pre-characterization
technique. Authors observed that the usefulness of elec-
trical surveys is determined by data reliability, density of
measurements, and quality of interpretation. They have
obtained some important information from surveys, such as
leachate water pathways, and level of saturated waste.
Dahlin et al. (2002) investigated an old sludge disposal site
in Sweden, using a 3D resistivity imaging technique. The
survey was carried out with a roll-along technique for 3D
data acquisition that allows measurement of large true 3D
resistivity data sets. Results showed that this technique in
combination with 3D inversion has the means for being
very useful in engineering and environmental applications.
However, in complex areas, 2D techniques applied in
parallel lines, and possibly crossing lines are most likely
adequate and logistically simple, and can be inverted by
using 3D techniques. Bentley and Gharibi (2004) investi-
gated a contaminated site applying 2D and 3D imaging
techniques. Authors found that 2D electrical resistivity
imaging profiles can produce misleading images as a result
of out-of-plane resistivity anomalies, and 2D assumption
violation. 3D inversions were used in order to locate source
zones and high contaminant concentration zones.
Induced polarization (IP) use for the environmental
studies is seen as a very useful tool, and there are some
excellent examples of IP use for investigating organic
and/or inorganic compounds contamination (Abdel Aal
et al. 2006; Kemna et al. 2004; Martinho et al. 2006).
Aristodemou and Thomas-Betts (2000) reported good
results by using IP for monitoring contamination spread in
underlying aquifers caused by waste disposal site. High
apparent chargeability values on the top of disposal site
were interpreted as the presence of disseminated solid
metallic wastes or as high organic load of liquid wastes
disposed at the site. Chargeability anomalies from down-
stream disposal site were interpreted as possibly associated
with an organic waste contamination plume. Martinho and
Almeida (2006) investigated municipal landfills with IP
measurements and found high chargeability values asso-
ciated with contaminated areas. Sogade et al. (2006) have
surveyed an area mainly contaminated with benzene and
ethylene dibromide, where difference between chargeabil-
ity and gross spectral chargeability sections showed a
distribution of anomalies closely correlated with contami-
nant concentration anomalies of monitoring wells.
Slater and Sandberg (2000) have investigated the
applicability of IP measurements with resistivity for
detecting and monitoring aquifer salt transport. Authors
observed that in a highly saline environment, salinity
changes are not detectable with IP, when signal is attenu-
ated to the instrument noise level. Nevertheless, IP method
becomes valuable for detecting salt transport in lower
salinity environments. However, fluid salinity is expected
to reduce chargeability; Griffiths et al. (1981) have carried
out experimental studies with saturated clayey sandstones,
where polarization increased with salinity to a peak, and,
after that, started to decrease. In their experiments, IP peak
occurred at salinities corresponding to resistivity values in
the order of 0.5 Xm. Slater and Lesmes (2002) used nor-
malized chargeability (chargeability divided by resistivity)
to determine its dependence on salinity and clay content.
Normalized chargeability quantifies the magnitude of sur-
face polarization being closely related to lithology in
nonmetallic soils.
The objective of this work is to characterize in detail a
pre-indicated contamination plume located from down-
stream of a municipal solid waste (MSW) disposal site,
where previous geophysical surveys and chemical analyses
indicate the presence of inorganic contaminants. Resistivity
and IP surveys were carried out with several parallel profile
lines from downstream landfill. A 3D interpretation showed
good resolution images. Groundwater flow path was iden-
tified by lower resistivity values, and higher chargeability
values in surveyed area. Normalized chargeability values
suggest that high IP effect is caused by higher salinity in
groundwater flow path, which enhances clay content pres-
ent in the area.
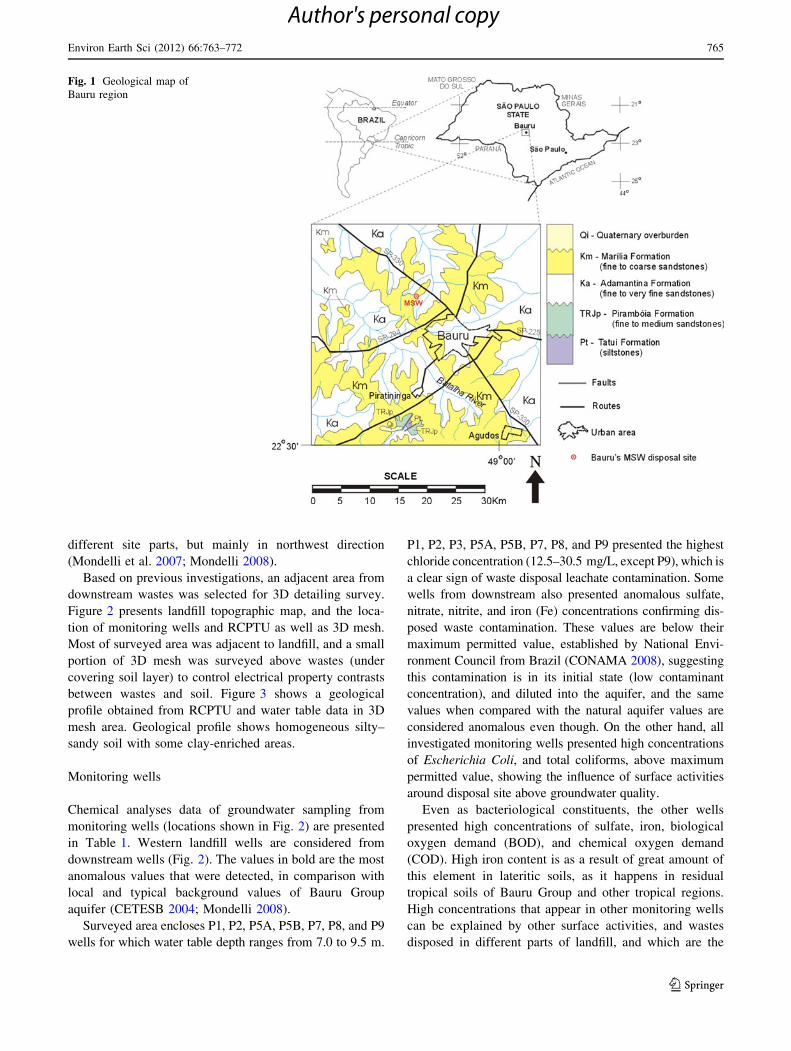
Study site
The study site is Bauru’s MSW Disposal Site, situated in
Bauru, Sao Paulo State, Brazil (Fig. 1). It is a controlled
dump, concept as landfill, located 15 km away from
downtown. Landfill has 268,985 square meters of extension
area, and operates since 1993. Wastes are disposed in three
layers of, approximately, 4 m height, and its bottom has an
asphalt emulsion layer above compacted local soil.
The area is located in Parana Sedimentary Basin, char-
acterized by Bauru Group, represented by Adamantina
(lower), and Marilia (upper) geological formations.
Locally, sandstone sediments are superposed by alluvium
and colluvium soils. Superficial soils consist of silty–
clayey sands. Under these soils are residual soils from
Bauru Group sandstone, characterized by very clayey
sands.
Previous geophysical investigation showed a conductive
anomaly developing in east-northwest direction suggesting
a contamination plume that surpasses wastes boundaries
(Lago 2004; Elis et al. 2007). This preferential path is in
good agreement with groundwater flow direction, estimated
from self-potential surveys. Some intrusive tests [resistivity
piezocone penetration tests (RCPTU), and chemical anal-
yses of water samples] carried out in locations in accor-
dance with geophysical results confirmed contamination in
764 Environ Earth Sci (2012) 66:763–772
123
Author's personal copy
different site parts, but mainly in northwest direction
(Mondelli et al. 2007; Mondelli 2008).
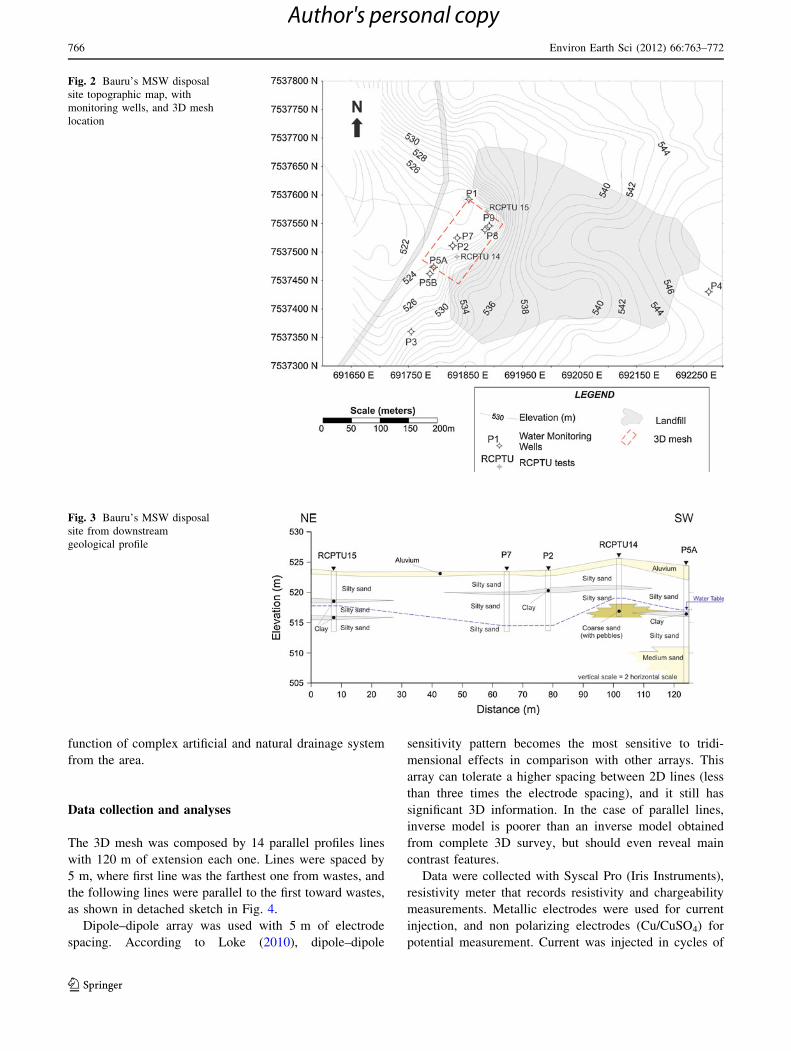
Based on previous investigations, an adjacent area from
downstream wastes was selected for 3D detailing survey.
Figure 2 presents landfill topographic map, and the loca-
tion of monitoring wells and RCPTU as well as 3D mesh.
Most of surveyed area was adjacent to landfill, and a small
portion of 3D mesh was surveyed above wastes (under
covering soil layer) to control electrical property contrasts
between wastes and soil. Figure 3 shows a geological
profile obtained from RCPTU and water table data in 3D
mesh area. Geological profile shows homogeneous silty–
sandy soil with some clay-enriched areas.
Monitoring wells
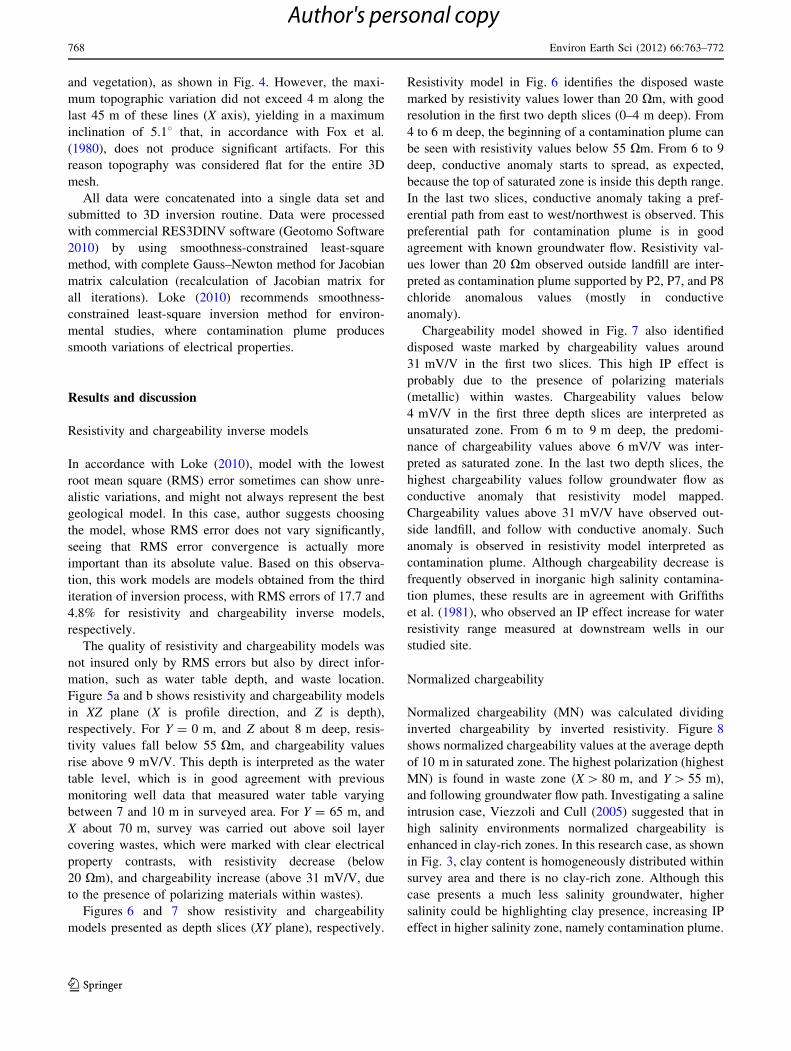
Chemical analyses data of groundwater sampling from
monitoring wells (locations shown in Fig. 2) are presented
in Table 1. Western landfill wells are considered from
downstream wells (Fig. 2). The values in bold are the most
anomalous values that were detected, in comparison with
local and typical background values of Bauru Group
aquifer (CETESB 2004; Mondelli 2008).
Surveyed area encloses P1, P2, P5A, P5B, P7, P8, and P9
wells for which water table depth ranges from 7.0 to 9.5 m.
P1, P2, P3, P5A, P5B, P7, P8, and P9 presented the highest
chloride concentration (12.5–30.5 mg/L, except P9), which is
a clear sign of waste disposal leachate contamination. Some
wells from downstream also presented anomalous sulfate,
nitrate, nitrite, and iron (Fe) concentrations confirming dis-
posed waste contamination. These values are below their
maximum permitted value, established by National Envi-
ronment Council from Brazil (CONAMA 2008), suggesting
this contamination is in its initial state (low contaminant
concentration), and diluted into the aquifer, and the same
values when compared with the natural aquifer values are
considered anomalous even though. On the other hand, all
investigated monitoring wells presented high concentrations
of Escherichia Coli, and total coliforms, above maximum
permitted value, showing the influence of surface activities
around disposal site above groundwater quality.
Even as bacteriological constituents, the other wells
presented high concentrations of sulfate, iron, biological
oxygen demand (BOD), and chemical oxygen demand
(COD). High iron content is as a result of great amount of
this element in lateritic soils, as it happens in residual
tropical soils of Bauru Group and other tropical regions.
High concentrations that appear in other monitoring wells
can be explained by other surface activities, and wastes
disposed in different parts of landfill, and which are the
Fig. 1 Geological map of
Bauru region
Environ Earth Sci (2012) 66:763–772 765
123
Author's personal copy
function of complex artificial and natural drainage system
from the area.
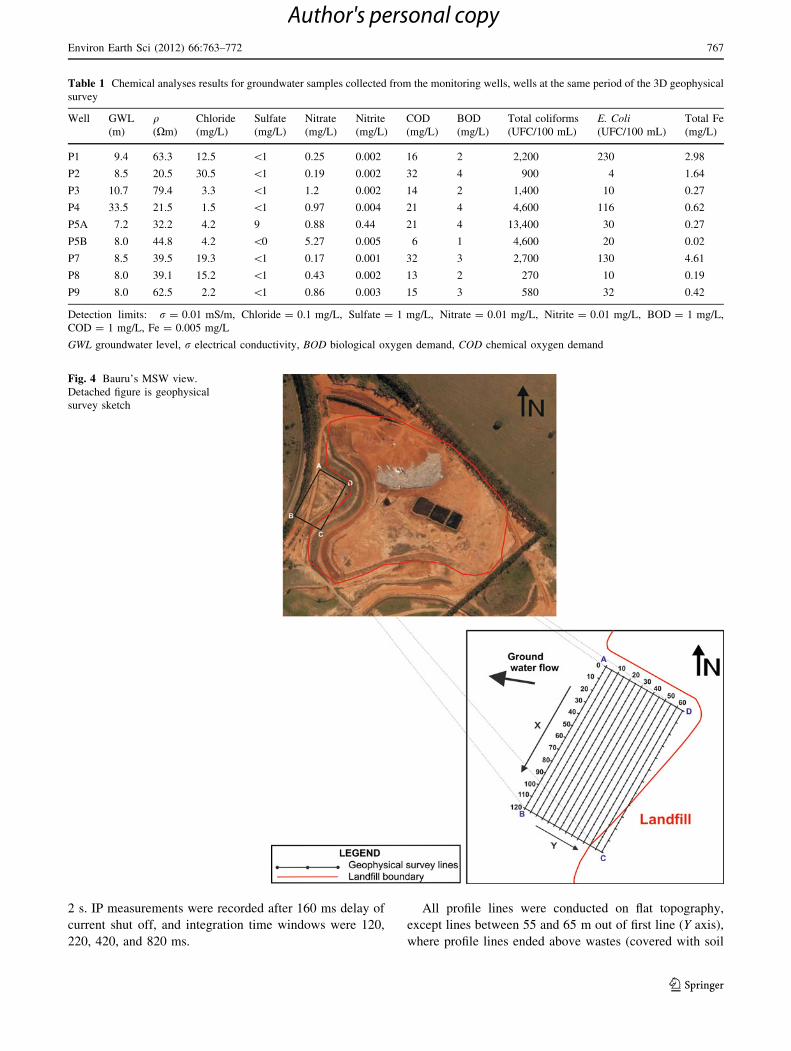
Data collection and analyses
The 3D mesh was composed by 14 parallel profiles lines
with 120 m of extension each one. Lines were spaced by
5 m, where first line was the farthest one from wastes, and
the following lines were parallel to the first toward wastes,
as shown in detached sketch in Fig. 4.
Dipole–dipole array was used with 5 m of electrode
spacing. According to Loke (2010), dipole–dipole
sensitivity pattern becomes the most sensitive to tridi-
mensional effects in comparison with other arrays. This
array can tolerate a higher spacing between 2D lines (less
than three times the electrode spacing), and it still has
significant 3D information. In the case of parallel lines,
inverse model is poorer than an inverse model obtained
from complete 3D survey, but should even reveal main
contrast features.
Data were collected with Syscal Pro (Iris Instruments),
resistivity meter that records resistivity and chargeability
measurements. Metallic electrodes were used for current
injection, and non polarizing electrodes (Cu/CuSO4) for
potential measurement. Current was injected in cycles of
Fig. 2 Bauru’s MSW disposal
site topographic map, with
monitoring wells, and 3D mesh
location
Fig. 3 Bauru’s MSW disposal
site from downstream
geological profile
766 Environ Earth Sci (2012) 66:763–772
123
Author's personal copy
2 s. IP measurements were recorded after 160 ms delay of
current shut off, and integration time windows were 120,
220, 420, and 820 ms.
All profile lines were conducted on flat topography,
except lines between 55 and 65 m out of first line (Y axis),
where profile lines ended above wastes (covered with soil
Table 1 Chemical analyses results for groundwater samples collected from the monitoring wells, wells at the same period of the 3D geophysical
survey
Well GWL
(m)
q(Xm)
Chloride
(mg/L)
Sulfate
(mg/L)
Nitrate
(mg/L)
Nitrite
(mg/L)
COD
(mg/L)
BOD
(mg/L)
Total coliforms
(UFC/100 mL)
E. Coli(UFC/100 mL)
Total Fe
(mg/L)
P1 9.4 63.3 12.5 \1 0.25 0.002 16 2 2,200 230 2.98
P2 8.5 20.5 30.5 \1 0.19 0.002 32 4 900 4 1.64
P3 10.7 79.4 3.3 \1 1.2 0.002 14 2 1,400 10 0.27
P4 33.5 21.5 1.5 \1 0.97 0.004 21 4 4,600 116 0.62
P5A 7.2 32.2 4.2 9 0.88 0.44 21 4 13,400 30 0.27
P5B 8.0 44.8 4.2 \0 5.27 0.005 6 1 4,600 20 0.02
P7 8.5 39.5 19.3 \1 0.17 0.001 32 3 2,700 130 4.61
P8 8.0 39.1 15.2 \1 0.43 0.002 13 2 270 10 0.19
P9 8.0 62.5 2.2 \1 0.86 0.003 15 3 580 32 0.42
Detection limits: r = 0.01 mS/m, Chloride = 0.1 mg/L, Sulfate = 1 mg/L, Nitrate = 0.01 mg/L, Nitrite = 0.01 mg/L, BOD = 1 mg/L,
COD = 1 mg/L, Fe = 0.005 mg/L
GWL groundwater level, r electrical conductivity, BOD biological oxygen demand, COD chemical oxygen demand
Fig. 4 Bauru’s MSW view.
Detached figure is geophysical
survey sketch
Environ Earth Sci (2012) 66:763–772 767
123
Author's personal copy
and vegetation), as shown in Fig. 4. However, the maxi-
mum topographic variation did not exceed 4 m along the
last 45 m of these lines (X axis), yielding in a maximum
inclination of 5.18 that, in accordance with Fox et al.
(1980), does not produce significant artifacts. For this
reason topography was considered flat for the entire 3D
mesh.
All data were concatenated into a single data set and
submitted to 3D inversion routine. Data were processed
with commercial RES3DINV software (Geotomo Software
2010) by using smoothness-constrained least-square
method, with complete Gauss–Newton method for Jacobian
matrix calculation (recalculation of Jacobian matrix for
all iterations). Loke (2010) recommends smoothness-
constrained least-square inversion method for environ-
mental studies, where contamination plume produces
smooth variations of electrical properties.
Results and discussion
Resistivity and chargeability inverse models
In accordance with Loke (2010), model with the lowest
root mean square (RMS) error sometimes can show unre-
alistic variations, and might not always represent the best
geological model. In this case, author suggests choosing
the model, whose RMS error does not vary significantly,
seeing that RMS error convergence is actually more
important than its absolute value. Based on this observa-
tion, this work models are models obtained from the third
iteration of inversion process, with RMS errors of 17.7 and
4.8% for resistivity and chargeability inverse models,
respectively.
The quality of resistivity and chargeability models was
not insured only by RMS errors but also by direct infor-
mation, such as water table depth, and waste location.
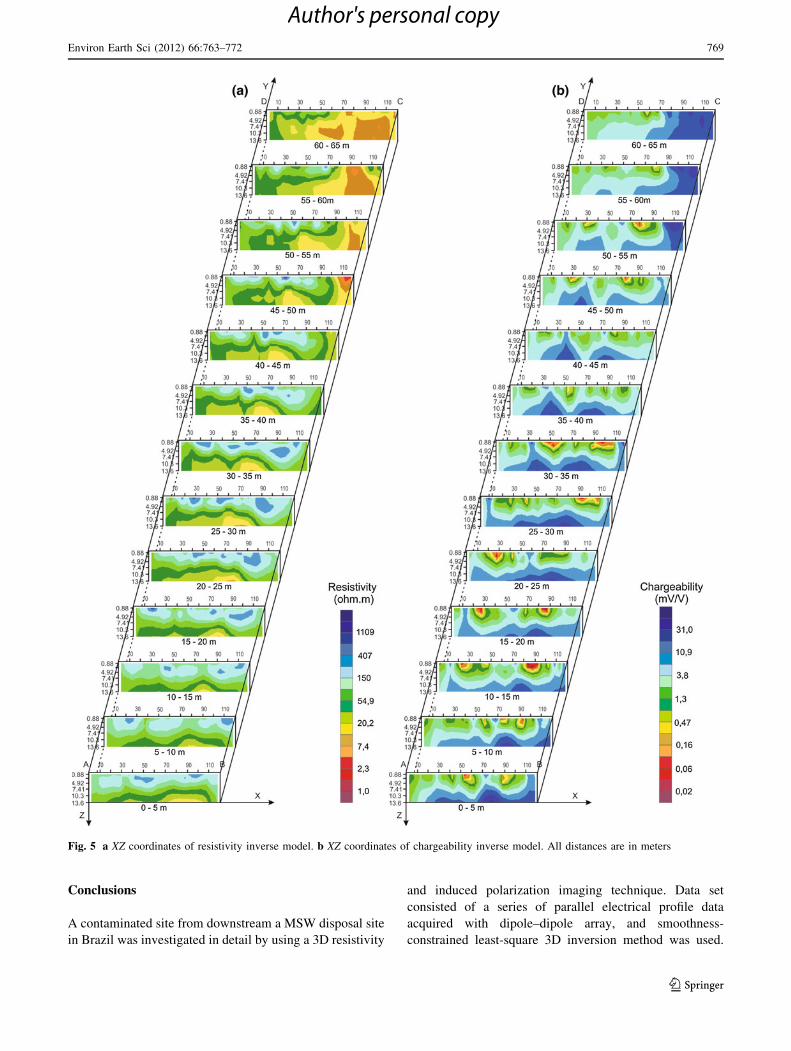
Figure 5a and b shows resistivity and chargeability models
in XZ plane (X is profile direction, and Z is depth),
respectively. For Y = 0 m, and Z about 8 m deep, resis-
tivity values fall below 55 Xm, and chargeability values
rise above 9 mV/V. This depth is interpreted as the water
table level, which is in good agreement with previous
monitoring well data that measured water table varying
between 7 and 10 m in surveyed area. For Y = 65 m, and
X about 70 m, survey was carried out above soil layer
covering wastes, which were marked with clear electrical
property contrasts, with resistivity decrease (below
20 Xm), and chargeability increase (above 31 mV/V, due
to the presence of polarizing materials within wastes).
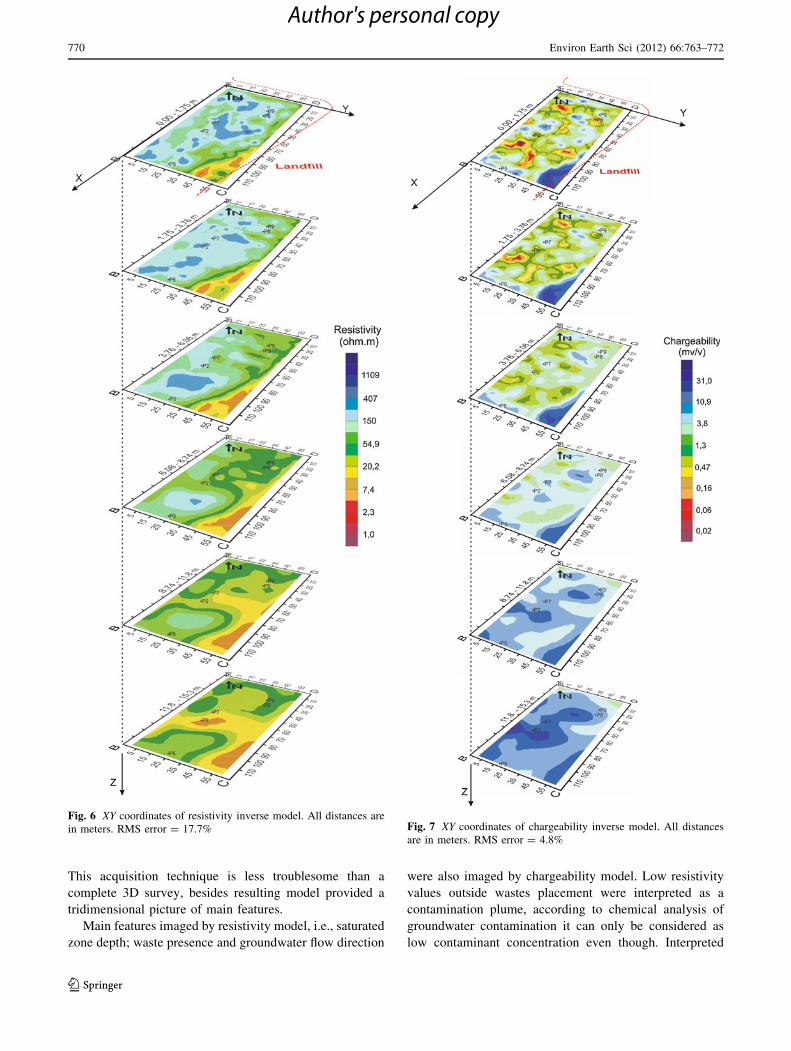
Figures 6 and 7 show resistivity and chargeability
models presented as depth slices (XY plane), respectively.
Resistivity model in Fig. 6 identifies the disposed waste
marked by resistivity values lower than 20 Xm, with good
resolution in the first two depth slices (0–4 m deep). From
4 to 6 m deep, the beginning of a contamination plume can
be seen with resistivity values below 55 Xm. From 6 to 9
deep, conductive anomaly starts to spread, as expected,
because the top of saturated zone is inside this depth range.
In the last two slices, conductive anomaly taking a pref-
erential path from east to west/northwest is observed. This
preferential path for contamination plume is in good
agreement with known groundwater flow. Resistivity val-
ues lower than 20 Xm observed outside landfill are inter-
preted as contamination plume supported by P2, P7, and P8
chloride anomalous values (mostly in conductive
anomaly).
Chargeability model showed in Fig. 7 also identified
disposed waste marked by chargeability values around
31 mV/V in the first two slices. This high IP effect is
probably due to the presence of polarizing materials
(metallic) within wastes. Chargeability values below
4 mV/V in the first three depth slices are interpreted as
unsaturated zone. From 6 m to 9 m deep, the predomi-
nance of chargeability values above 6 mV/V was inter-
preted as saturated zone. In the last two depth slices, the
highest chargeability values follow groundwater flow as
conductive anomaly that resistivity model mapped.
Chargeability values above 31 mV/V have observed out-
side landfill, and follow with conductive anomaly. Such
anomaly is observed in resistivity model interpreted as
contamination plume. Although chargeability decrease is
frequently observed in inorganic high salinity contamina-
tion plumes, these results are in agreement with Griffiths
et al. (1981), who observed an IP effect increase for water
resistivity range measured at downstream wells in our
studied site.
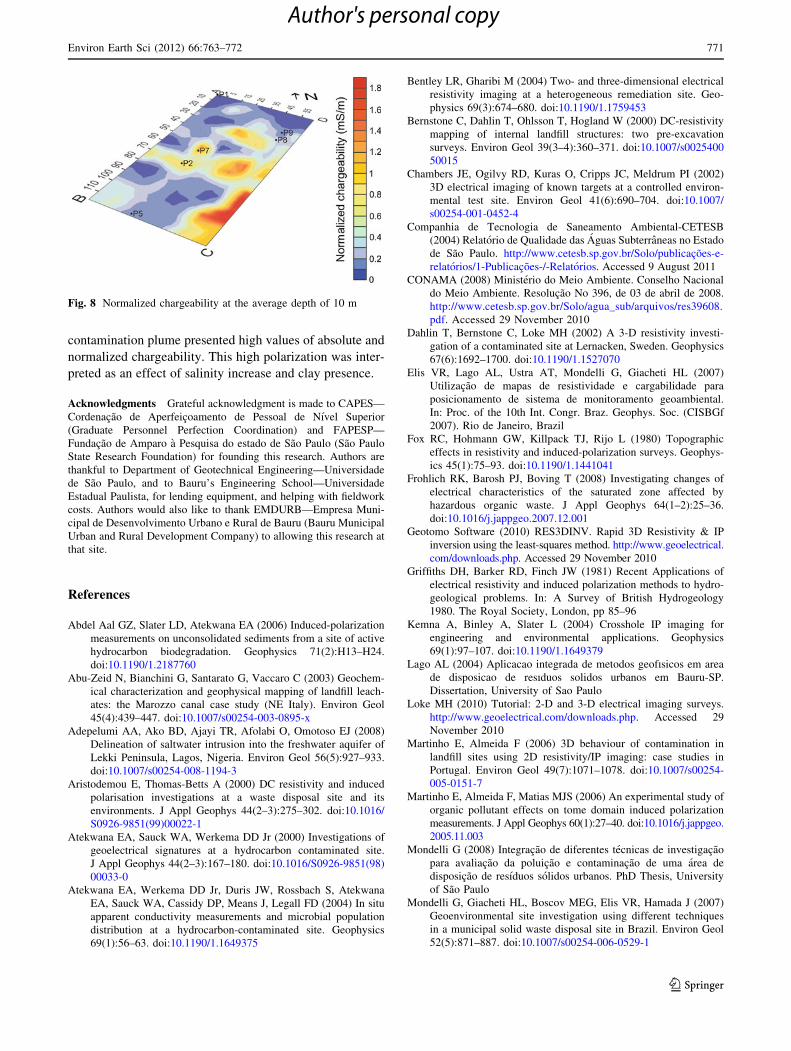
Normalized chargeability
Normalized chargeability (MN) was calculated dividing
inverted chargeability by inverted resistivity. Figure 8
shows normalized chargeability values at the average depth
of 10 m in saturated zone. The highest polarization (highest
MN) is found in waste zone (X [ 80 m, and Y [ 55 m),
and following groundwater flow path. Investigating a saline
intrusion case, Viezzoli and Cull (2005) suggested that in
high salinity environments normalized chargeability is
enhanced in clay-rich zones. In this research case, as shown
in Fig. 3, clay content is homogeneously distributed within
survey area and there is no clay-rich zone. Although this
case presents a much less salinity groundwater, higher
salinity could be highlighting clay presence, increasing IP
effect in higher salinity zone, namely contamination plume.
768 Environ Earth Sci (2012) 66:763–772
123
Author's personal copy
Conclusions
A contaminated site from downstream a MSW disposal site
in Brazil was investigated in detail by using a 3D resistivity
and induced polarization imaging technique. Data set
consisted of a series of parallel electrical profile data
acquired with dipole–dipole array, and smoothness-
constrained least-square 3D inversion method was used.
Fig. 5 a XZ coordinates of resistivity inverse model. b XZ coordinates of chargeability inverse model. All distances are in meters
Environ Earth Sci (2012) 66:763–772 769
123
Author's personal copy
This acquisition technique is less troublesome than a
complete 3D survey, besides resulting model provided a
tridimensional picture of main features.
Main features imaged by resistivity model, i.e., saturated
zone depth; waste presence and groundwater flow direction
were also imaged by chargeability model. Low resistivity
values outside wastes placement were interpreted as a
contamination plume, according to chemical analysis of
groundwater contamination it can only be considered as
low contaminant concentration even though. Interpreted
Fig. 6 XY coordinates of resistivity inverse model. All distances are
in meters. RMS error = 17.7% Fig. 7 XY coordinates of chargeability inverse model. All distances
are in meters. RMS error = 4.8%
770 Environ Earth Sci (2012) 66:763–772
123
Author's personal copy
contamination plume presented high values of absolute and
normalized chargeability. This high polarization was inter-
preted as an effect of salinity increase and clay presence.
Acknowledgments Grateful acknowledgment is made to CAPES—
Cordenacao de Aperfeicoamento de Pessoal de Nıvel Superior
(Graduate Personnel Perfection Coordination) and FAPESP—
Fundacao de Amparo a Pesquisa do estado de Sao Paulo (Sao Paulo
State Research Foundation) for founding this research. Authors are
thankful to Department of Geotechnical Engineering—Universidade
de Sao Paulo, and to Bauru’s Engineering School—Universidade
Estadual Paulista, for lending equipment, and helping with fieldwork
costs. Authors would also like to thank EMDURB—Empresa Muni-
cipal de Desenvolvimento Urbano e Rural de Bauru (Bauru Municipal
Urban and Rural Development Company) to allowing this research at
that site.
References
Abdel Aal GZ, Slater LD, Atekwana EA (2006) Induced-polarization
measurements on unconsolidated sediments from a site of active
hydrocarbon biodegradation. Geophysics 71(2):H13–H24.
doi:10.1190/1.2187760
Abu-Zeid N, Bianchini G, Santarato G, Vaccaro C (2003) Geochem-
ical characterization and geophysical mapping of landfill leach-
ates: the Marozzo canal case study (NE Italy). Environ Geol
45(4):439–447. doi:10.1007/s00254-003-0895-x
Adepelumi AA, Ako BD, Ajayi TR, Afolabi O, Omotoso EJ (2008)
Delineation of saltwater intrusion into the freshwater aquifer of
Lekki Peninsula, Lagos, Nigeria. Environ Geol 56(5):927–933.
doi:10.1007/s00254-008-1194-3
Aristodemou E, Thomas-Betts A (2000) DC resistivity and induced
polarisation investigations at a waste disposal site and its
environments. J Appl Geophys 44(2–3):275–302. doi:10.1016/
S0926-9851(99)00022-1
Atekwana EA, Sauck WA, Werkema DD Jr (2000) Investigations of
geoelectrical signatures at a hydrocarbon contaminated site.
J Appl Geophys 44(2–3):167–180. doi:10.1016/S0926-9851(98)
00033-0
Atekwana EA, Werkema DD Jr, Duris JW, Rossbach S, Atekwana
EA, Sauck WA, Cassidy DP, Means J, Legall FD (2004) In situ
apparent conductivity measurements and microbial population
distribution at a hydrocarbon-contaminated site. Geophysics
69(1):56–63. doi:10.1190/1.1649375
Bentley LR, Gharibi M (2004) Two- and three-dimensional electrical
resistivity imaging at a heterogeneous remediation site. Geo-
physics 69(3):674–680. doi:10.1190/1.1759453
Bernstone C, Dahlin T, Ohlsson T, Hogland W (2000) DC-resistivity
mapping of internal landfill structures: two pre-excavation
surveys. Environ Geol 39(3–4):360–371. doi:10.1007/s0025400
50015
Chambers JE, Ogilvy RD, Kuras O, Cripps JC, Meldrum PI (2002)
3D electrical imaging of known targets at a controlled environ-
mental test site. Environ Geol 41(6):690–704. doi:10.1007/
s00254-001-0452-4
Companhia de Tecnologia de Saneamento Ambiental-CETESB
(2004) Relatorio de Qualidade das Aguas Subterraneas no Estado
de Sao Paulo. http://www.cetesb.sp.gov.br/Solo/publicacoes-e-
relatorios/1-Publicacoes-/-Relatorios. Accessed 9 August 2011
CONAMA (2008) Ministerio do Meio Ambiente. Conselho Nacional
do Meio Ambiente. Resolucao No 396, de 03 de abril de 2008.
http://www.cetesb.sp.gov.br/Solo/agua_sub/arquivos/res39608.
pdf. Accessed 29 November 2010
Dahlin T, Bernstone C, Loke MH (2002) A 3-D resistivity investi-
gation of a contaminated site at Lernacken, Sweden. Geophysics
67(6):1692–1700. doi:10.1190/1.1527070
Elis VR, Lago AL, Ustra AT, Mondelli G, Giacheti HL (2007)
Utilizacao de mapas de resistividade e cargabilidade para
posicionamento de sistema de monitoramento geoambiental.
In: Proc. of the 10th Int. Congr. Braz. Geophys. Soc. (CISBGf
2007). Rio de Janeiro, Brazil
Fox RC, Hohmann GW, Killpack TJ, Rijo L (1980) Topographic
effects in resistivity and induced-polarization surveys. Geophys-
ics 45(1):75–93. doi:10.1190/1.1441041
Frohlich RK, Barosh PJ, Boving T (2008) Investigating changes of
electrical characteristics of the saturated zone affected by
hazardous organic waste. J Appl Geophys 64(1–2):25–36.
doi:10.1016/j.jappgeo.2007.12.001
Geotomo Software (2010) RES3DINV. Rapid 3D Resistivity & IP
inversion using the least-squares method. http://www.geoelectrical.
com/downloads.php. Accessed 29 November 2010
Griffiths DH, Barker RD, Finch JW (1981) Recent Applications of
electrical resistivity and induced polarization methods to hydro-
geological problems. In: A Survey of British Hydrogeology
1980. The Royal Society, London, pp 85–96
Kemna A, Binley A, Slater L (2004) Crosshole IP imaging for
engineering and environmental applications. Geophysics
69(1):97–107. doi:10.1190/1.1649379
Lago AL (2004) Aplicacao integrada de metodos geofısicos em area
de disposicao de resıduos solidos urbanos em Bauru-SP.
Dissertation, University of Sao Paulo
Loke MH (2010) Tutorial: 2-D and 3-D electrical imaging surveys.
http://www.geoelectrical.com/downloads.php. Accessed 29
November 2010
Martinho E, Almeida F (2006) 3D behaviour of contamination in
landfill sites using 2D resistivity/IP imaging: case studies in
Portugal. Environ Geol 49(7):1071–1078. doi:10.1007/s00254-
005-0151-7
Martinho E, Almeida F, Matias MJS (2006) An experimental study of
organic pollutant effects on tome domain induced polarization
measurements. J Appl Geophys 60(1):27–40. doi:10.1016/j.jappgeo.
2005.11.003
Mondelli G (2008) Integracao de diferentes tecnicas de investigacao
para avaliacao da poluicao e contaminacao de uma area de
disposicao de resıduos solidos urbanos. PhD Thesis, University
of Sao Paulo
Mondelli G, Giacheti HL, Boscov MEG, Elis VR, Hamada J (2007)
Geoenvironmental site investigation using different techniques
in a municipal solid waste disposal site in Brazil. Environ Geol
52(5):871–887. doi:10.1007/s00254-006-0529-1
Fig. 8 Normalized chargeability at the average depth of 10 m
Environ Earth Sci (2012) 66:763–772 771
123
Author's personal copy

Slater LD, Lesmes D (2002) IP interpretation in environmental
investigations. Geophysics 67(1):77–88. doi:10.1190/1.1451353
Slater LD, Sandberg SK (2000) Resistivity and induced polarization
monitoring of salt transport under natural hydraulic gradients.
Geophysics 65(2):408–420. doi:10.1190/1.1444735
Sogade JA, Scira-Scappuzzo F, Vichabian Y, Shi W, Rodi W, Lesmes
DP, Morgan FD (2006) Induced-polarization detection and
mapping of contaminant plumes. Geophysics 71(3):B75–B84.
doi:10.1190/1.2196873
Viezzoli A, Cull JP (2005) Electrical methods for detection and
discrimination of saline groundwater in clay-rich sediments in
northern Victoria. Exploration Geophys 31:294–300
772 Environ Earth Sci (2012) 66:763–772
123
Author's personal copy
Related Documents