Very important Extra information * Guyton corners, anything that is colored with grey is EXTRA explanation

Welcome message from author
This document is posted to help you gain knowledge. Please leave a comment to let me know what you think about it! Share it to your friends and learn new things together.
Transcript
Very important
Extra information
* Guyton corners, anything that is colored with grey is EXTRA explanation
2
Objectives :
Cardiac cycle 1
Contact us : [email protected]
• Main function of the heart.
• General principles of the cardiac cycle. • Function of the atria, ventricles & valves.
• Different events that occur during the cardiac cycle.
*we recommend studying the anatomy of the heart first.
3
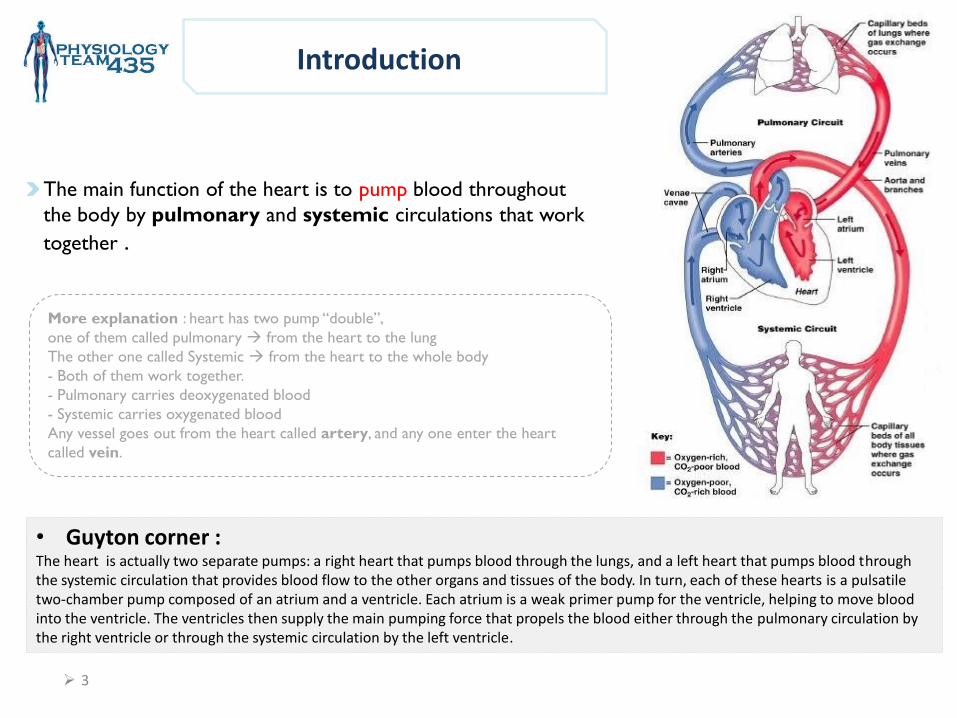
• Guyton corner : The heart is actually two separate pumps: a right heart that pumps blood through the lungs, and a left heart that pumps blood through the systemic circulation that provides blood flow to the other organs and tissues of the body. In turn, each of these hearts is a pulsatile two-chamber pump composed of an atrium and a ventricle. Each atrium is a weak primer pump for the ventricle, helping to move blood into the ventricle. The ventricles then supply the main pumping force that propels the blood either through the pulmonary circulation by the right ventricle or through the systemic circulation by the left ventricle.
The main function of the heart is to pump blood throughout
the body by pulmonary and systemic circulations that work
together .
More explanation : heart has two pump “double”,
one of them called pulmonary from the heart to the lung
The other one called Systemic from the heart to the whole body
- Both of them work together.
- Pulmonary carries deoxygenated blood
- Systemic carries oxygenated blood
Any vessel goes out from the heart called artery, and any one enter the heart
called vein.
Introduction
4
Valves of the heart
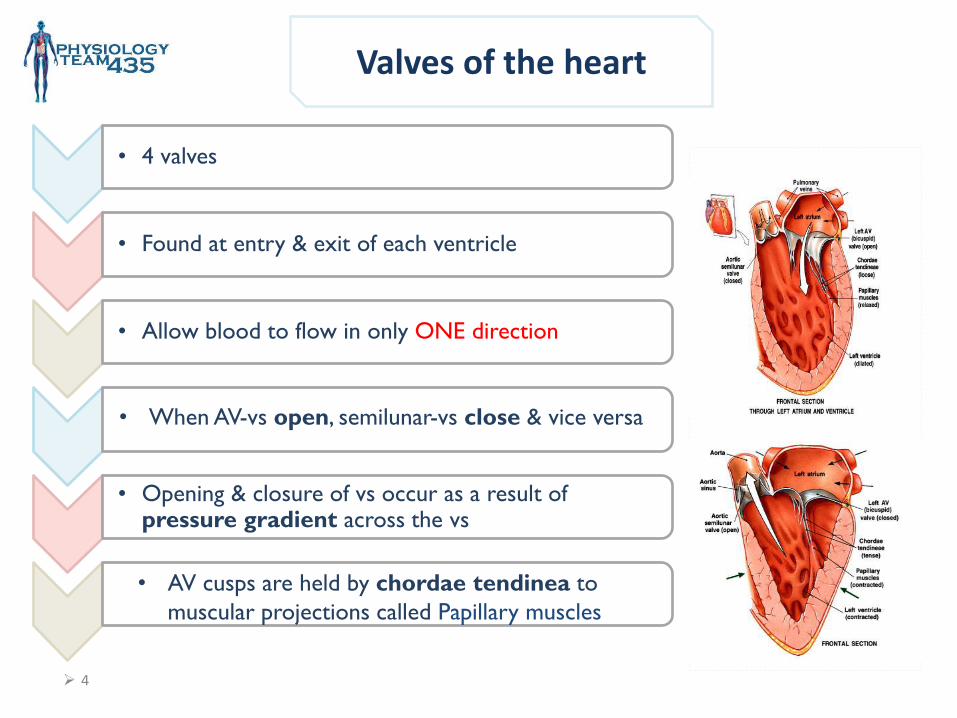
• 4 valves
• Found at entry & exit of each ventricle
• Allow blood to flow in only ONE direction
• Opening & closure of vs occur as a result of pressure gradient across the vs
• When AV-vs open, semilunar-vs close & vice versa
• AV cusps are held by chordae tendinea to
muscular projections called Papillary muscles
5
General Principles
Contraction of the heart generates pressure changes, & results in orderly blood movement.
(مما يعني أن كمية الدم التي ُتضخ يحددها االنقباض نفسه(
. pressure lowpressure to an area of highBlood flows from an area of -
(Pressure gradient controls the opening and closure of the cusps.)
Events in the right & left sides of the heart are the same, but with lower pressures in the right side.
6
Cardiac cycle
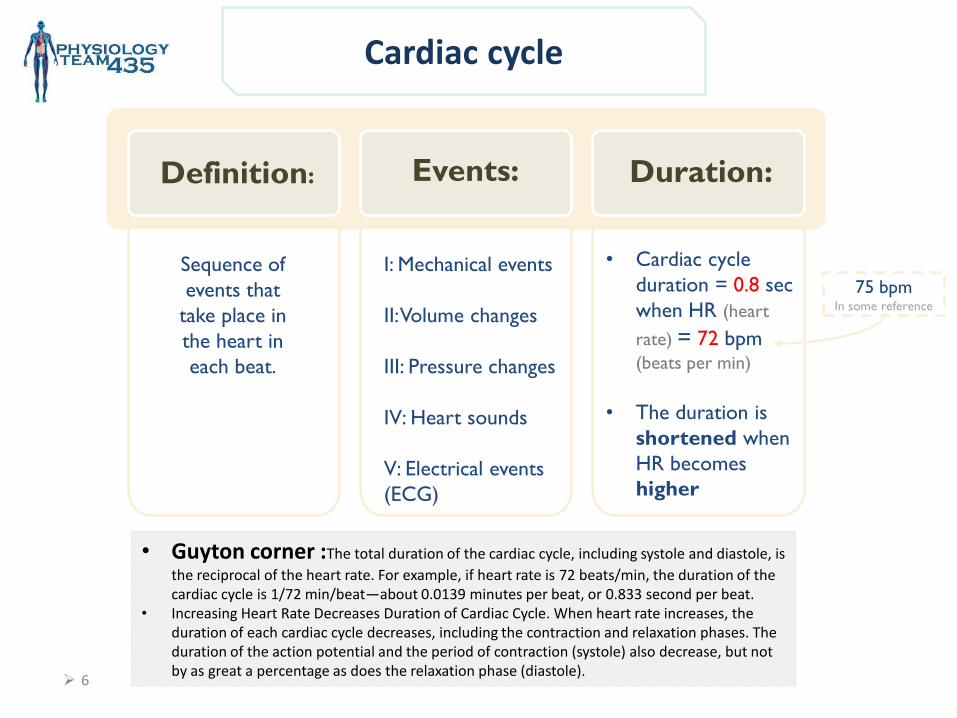
• Guyton corner :The total duration of the cardiac cycle, including systole and diastole, is
the reciprocal of the heart rate. For example, if heart rate is 72 beats/min, the duration of the cardiac cycle is 1/72 min/beat—about 0.0139 minutes per beat, or 0.833 second per beat.
• Increasing Heart Rate Decreases Duration of Cardiac Cycle. When heart rate increases, the duration of each cardiac cycle decreases, including the contraction and relaxation phases. The duration of the action potential and the period of contraction (systole) also decrease, but not by as great a percentage as does the relaxation phase (diastole).
Definition: Events: Duration:
Sequence of
events that
take place in
the heart in
each beat.
I: Mechanical events
II: Volume changes
III: Pressure changes
IV: Heart sounds
V: Electrical events
(ECG)
• Cardiac cycle
duration = 0.8 sec
when HR (heart
rate) = 72 bpm (beats per min)
• The duration is
shortened when
HR becomes
higher
75 bpm In some reference
7
I: Mechanical Events
Each heart beat consists of 2 major periods:
• Systole (contraction)
• Diastole (relaxation)
Systole and diastole happen on each chamber of the heart so there is:
• Atrial systole & diastole
• Ventricular systole & diastole
Mechanical events:
mechanical means movement itself which follow electrical signal “can’t happen by itself without stimulus”
Mechanical events’ periods
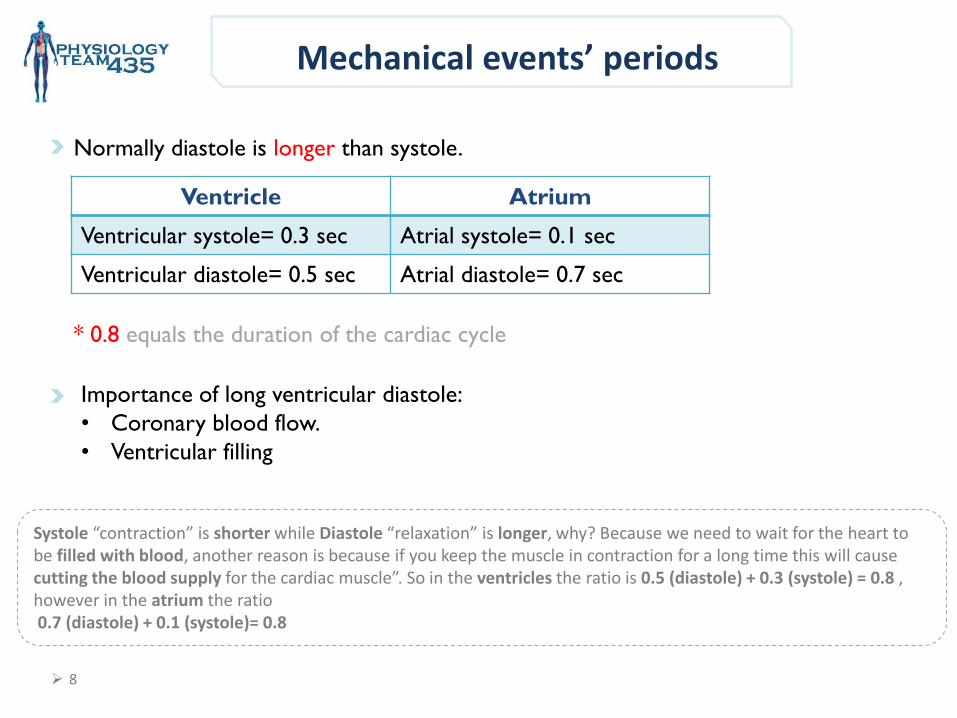
Ventricle Atrium
Ventricular systole= 0.3 sec Atrial systole= 0.1 sec
Ventricular diastole= 0.5 sec Atrial diastole= 0.7 sec
Importance of long ventricular diastole:
• Coronary blood flow.
• Ventricular filling
Normally diastole is longer than systole.
Systole “contraction” is shorter while Diastole “relaxation” is longer, why? Because we need to wait for the heart to be filled with blood, another reason is because if you keep the muscle in contraction for a long time this will cause cutting the blood supply for the cardiac muscle”. So in the ventricles the ratio is 0.5 (diastole) + 0.3 (systole) = 0.8 , however in the atrium the ratio 0.7 (diastole) + 0.1 (systole)= 0.8
* 0.8 equals the duration of the cardiac cycle
8
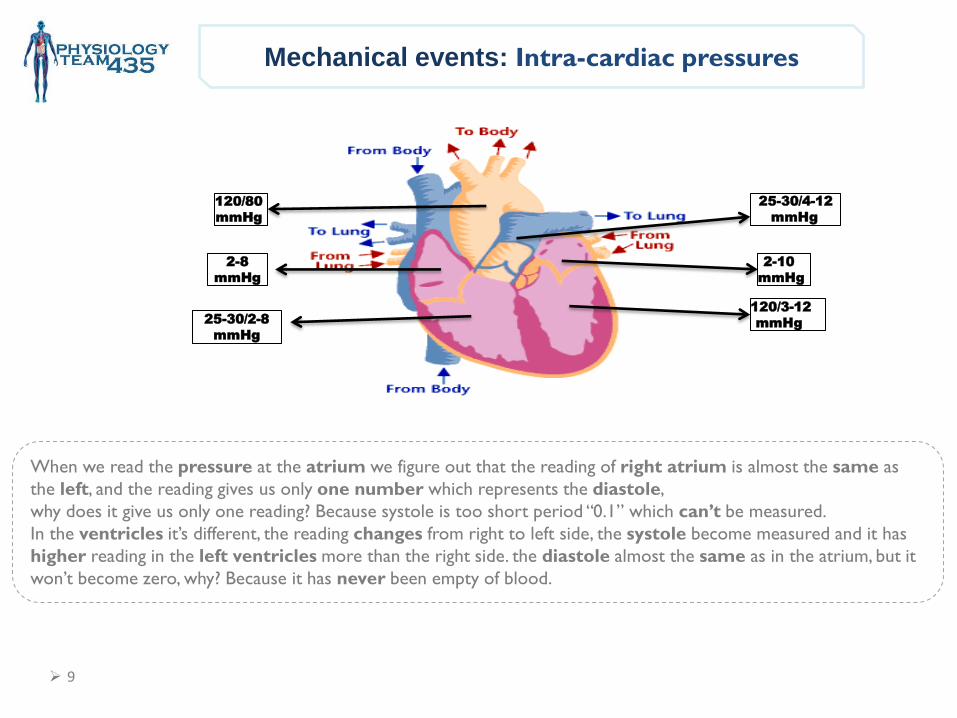
Mechanical events: Intra-cardiac pressures
120/80
mmHg
2-8
mmHg
25-30/4-12
mmHg
2-10
mmHg
120/3-12
mmHg 25-30/2-8
mmHg
When we read the pressure at the atrium we figure out that the reading of right atrium is almost the same as
the left, and the reading gives us only one number which represents the diastole,
why does it give us only one reading? Because systole is too short period “0.1” which can’t be measured.
In the ventricles it’s different, the reading changes from right to left side, the systole become measured and it has
higher reading in the left ventricles more than the right side. the diastole almost the same as in the atrium, but it
won’t become zero, why? Because it has never been empty of blood.
9
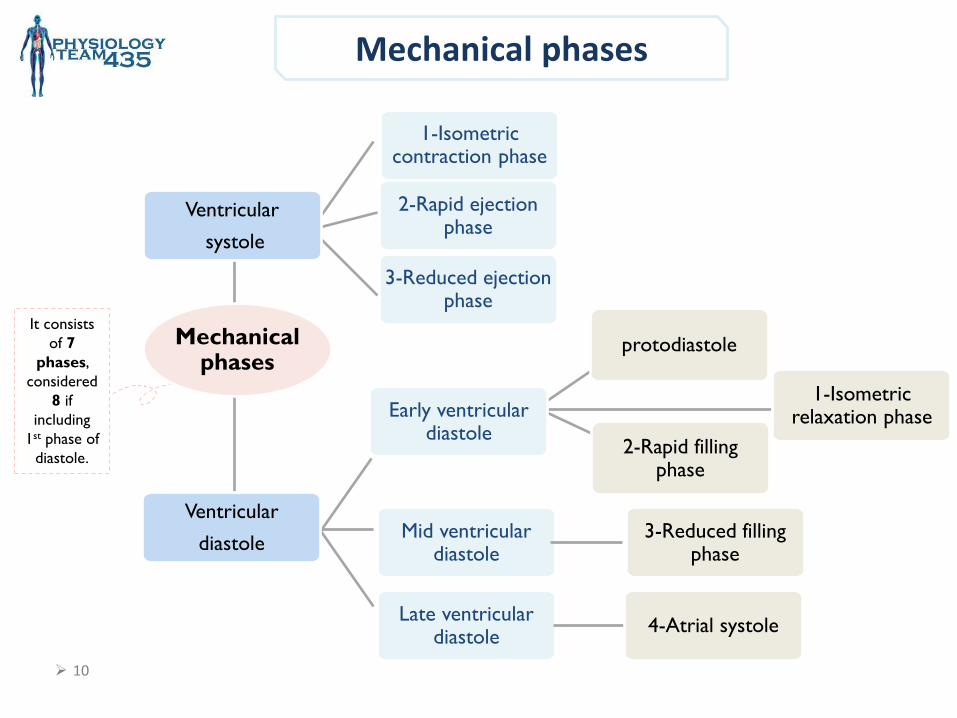
Mechanical phases
It consists
of 7
phases,
considered
8 if
including
1st phase of
diastole.
10
1-Isometric relaxation phase
Mid ventricular diastole
3-Reduced filling phase
Late ventricular diastole
4-Atrial systole
1-Isometric contraction phase
2-Rapid ejection phase
3-Reduced ejection phase
Ventricular
systole
Ventricular
diastole
Mechanical phases
Early ventricular diastole
protodiastole
2-Rapid filling phase
11
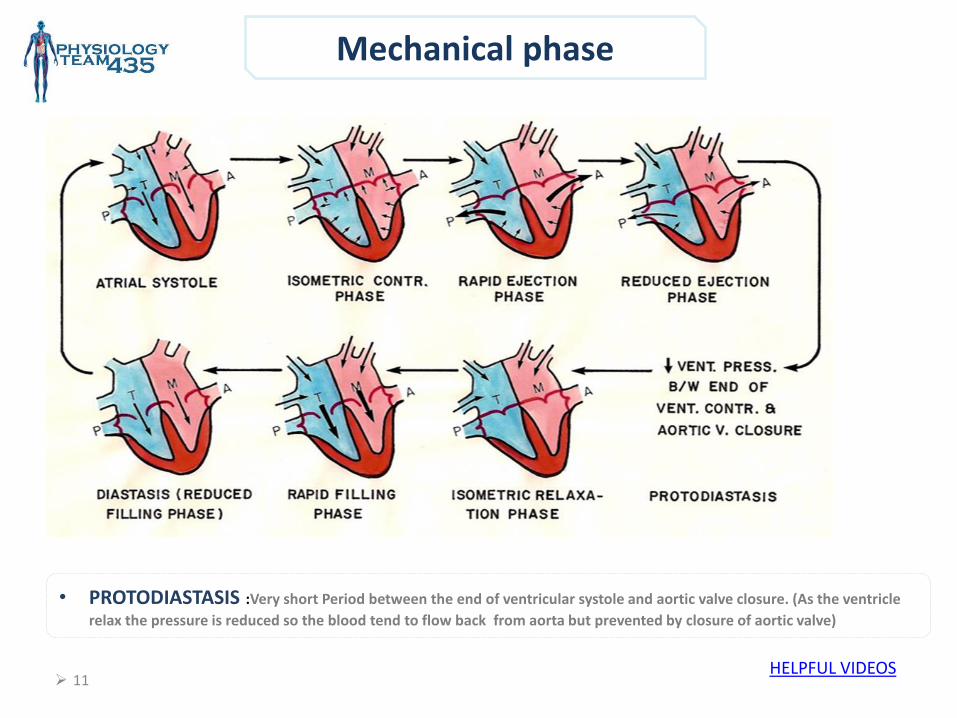
Mechanical phase
• PROTODIASTASIS :Very short Period between the end of ventricular systole and aortic valve closure. (As the ventricle
relax the pressure is reduced so the blood tend to flow back from aorta but prevented by closure of aortic valve)
HELPFUL VIDEOS
12
Mechanical phase
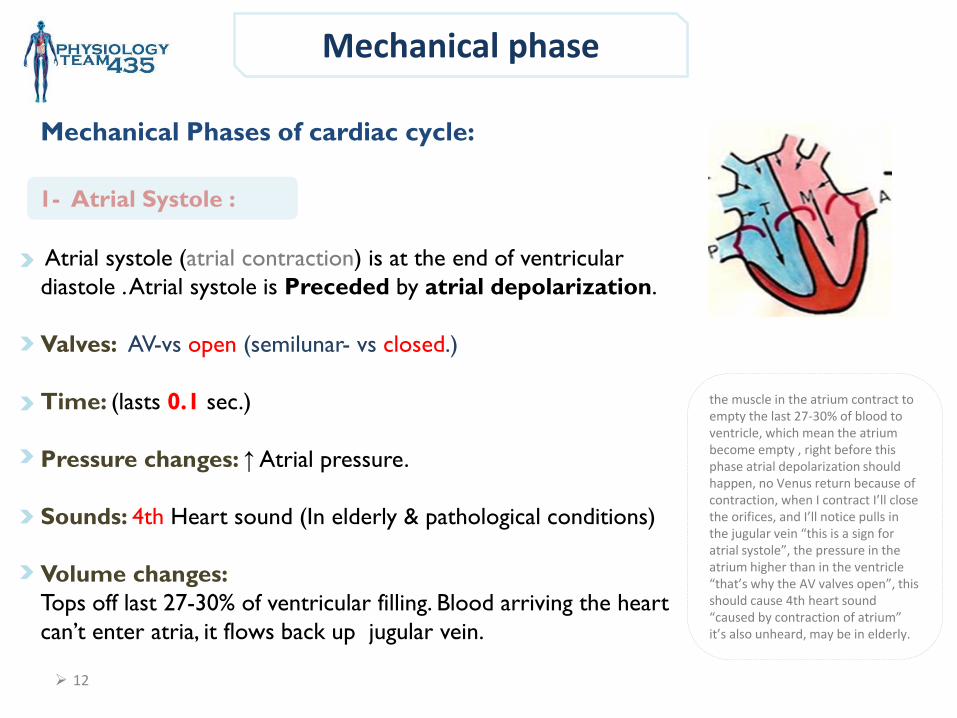
the muscle in the atrium contract to empty the last 27-30% of blood to ventricle, which mean the atrium become empty , right before this phase atrial depolarization should happen, no Venus return because of contraction, when I contract I’ll close the orifices, and I’ll notice pulls in the jugular vein “this is a sign for atrial systole”, the pressure in the atrium higher than in the ventricle “that’s why the AV valves open”, this should cause 4th heart sound “caused by contraction of atrium” it’s also unheard, may be in elderly.
Mechanical Phases of cardiac cycle:
Atrial systole (atrial contraction) is at the end of ventricular
diastole . Atrial systole is Preceded by atrial depolarization.
Valves: AV-vs open (semilunar- vs closed.)
Time: (lasts 0.1 sec.)
Pressure changes: ↑ Atrial pressure.
Sounds: 4th Heart sound (In elderly & pathological conditions)
Volume changes:
Tops off last 27-30% of ventricular filling. Blood arriving the heart
can’t enter atria, it flows back up jugular vein.
1- Atrial Systole :
13
Mechanical phase
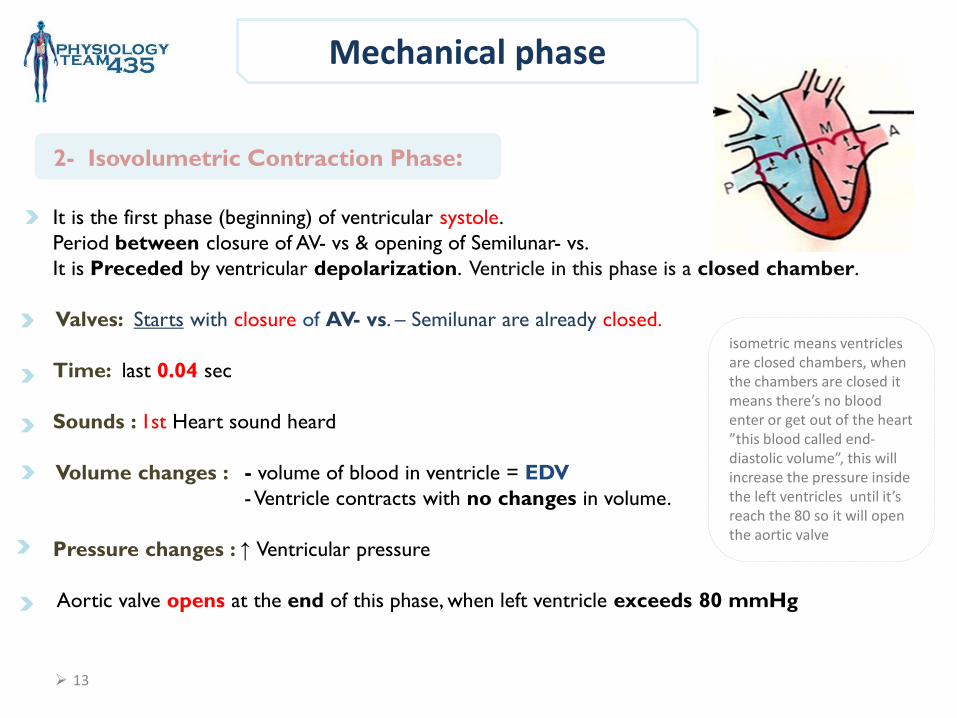
isometric means ventricles are closed chambers, when the chambers are closed it means there’s no blood enter or get out of the heart ”this blood called end-diastolic volume”, this will increase the pressure inside the left ventricles until it’s reach the 80 so it will open the aortic valve
It is the first phase (beginning) of ventricular systole.
Period between closure of AV- vs & opening of Semilunar- vs.
It is Preceded by ventricular depolarization. Ventricle in this phase is a closed chamber.
Valves: Starts with closure of AV- vs. – Semilunar are already closed.
Time: last 0.04 sec
Sounds : 1st Heart sound heard
Volume changes : - volume of blood in ventricle = EDV
- Ventricle contracts with no changes in volume.
Pressure changes : ↑ Ventricular pressure
Aortic valve opens at the end of this phase, when left ventricle exceeds 80 mmHg
2- Isovolumetric Contraction Phase:
14
Mechanical phase
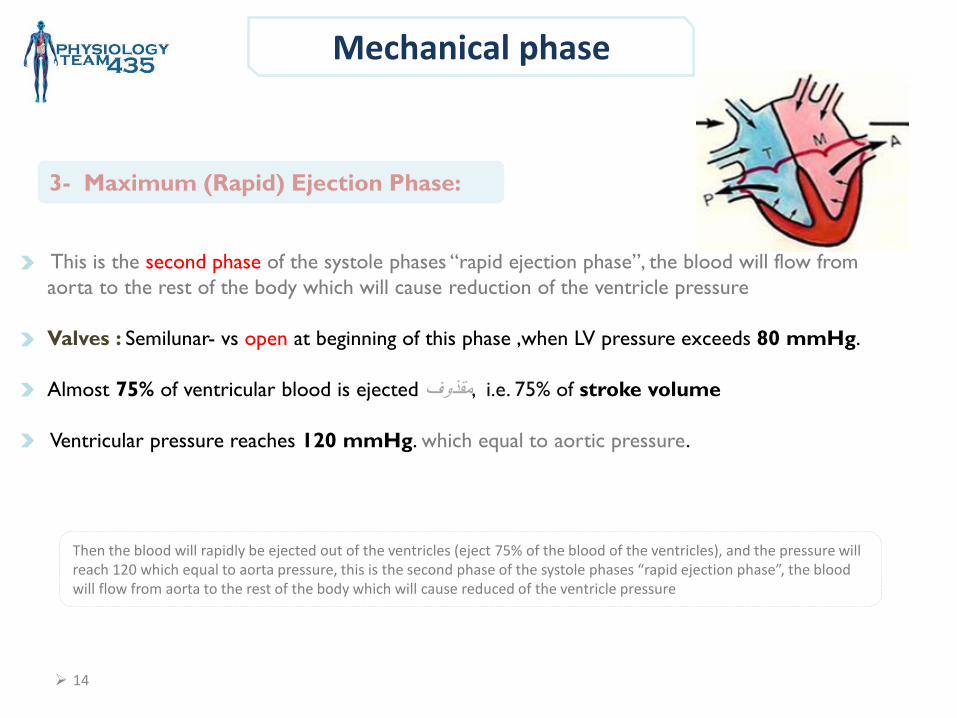
Then the blood will rapidly be ejected out of the ventricles (eject 75% of the blood of the ventricles), and the pressure will reach 120 which equal to aorta pressure, this is the second phase of the systole phases “rapid ejection phase”, the blood will flow from aorta to the rest of the body which will cause reduced of the ventricle pressure
This is the second phase of the systole phases “rapid ejection phase”, the blood will flow from
aorta to the rest of the body which will cause reduction of the ventricle pressure
Valves : Semilunar- vs open at beginning of this phase ,when LV pressure exceeds 80 mmHg.
Almost 75% of ventricular blood is ejected مقذوف, i.e. 75% of stroke volume
Ventricular pressure reaches 120 mmHg. which equal to aortic pressure.
3- Maximum (Rapid) Ejection Phase:
15
Mechanical phase
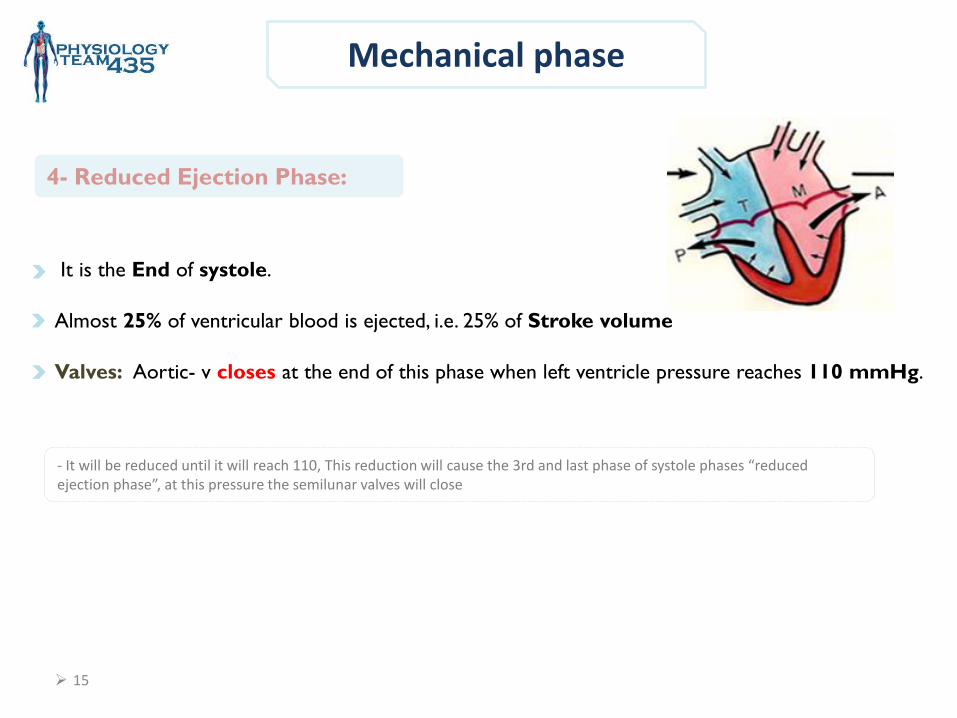
- It will be reduced until it will reach 110, This reduction will cause the 3rd and last phase of systole phases “reduced ejection phase”, at this pressure the semilunar valves will close
It is the End of systole.
Almost 25% of ventricular blood is ejected, i.e. 25% of Stroke volume
Valves: Aortic- v closes at the end of this phase when left ventricle pressure reaches 110 mmHg.
4- Reduced Ejection Phase:
16
Mechanical phase
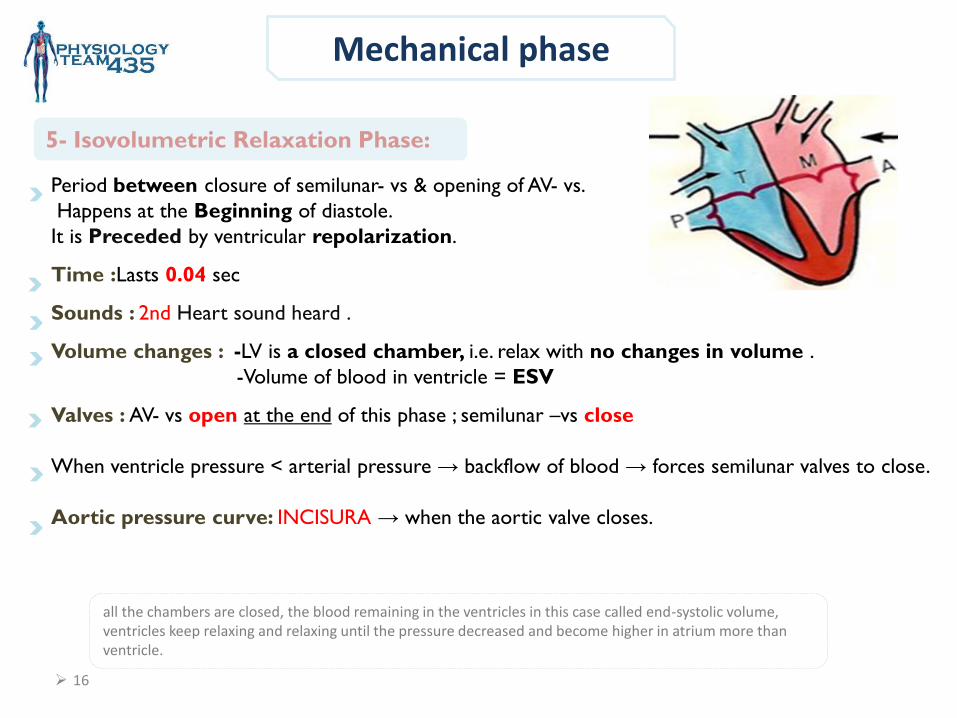
all the chambers are closed, the blood remaining in the ventricles in this case called end-systolic volume, ventricles keep relaxing and relaxing until the pressure decreased and become higher in atrium more than ventricle.
5- Isovolumetric Relaxation Phase:
Period between closure of semilunar- vs & opening of AV- vs.
Happens at the Beginning of diastole.
It is Preceded by ventricular repolarization.
Time :Lasts 0.04 sec
Sounds : 2nd Heart sound heard .
Volume changes : -LV is a closed chamber, i.e. relax with no changes in volume .
-Volume of blood in ventricle = ESV
Valves : AV- vs open at the end of this phase ; semilunar –vs close
When ventricle pressure < arterial pressure → backflow of blood → forces semilunar valves to close.
Aortic pressure curve: INCISURA → when the aortic valve closes.
17
Mechanical phase
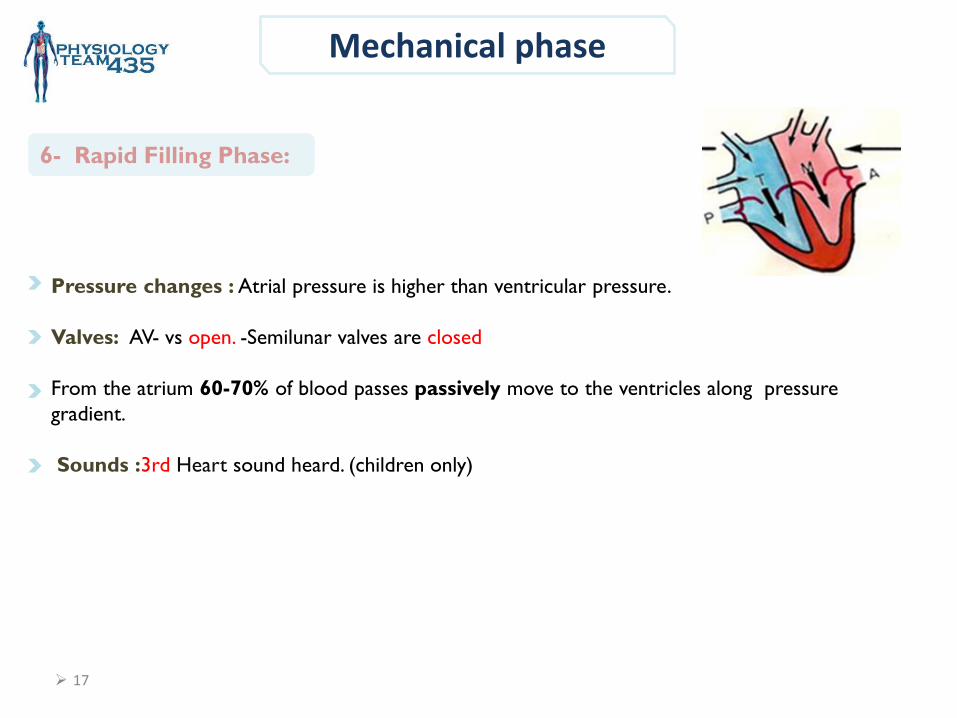
Pressure changes : Atrial pressure is higher than ventricular pressure.
Valves: AV- vs open. -Semilunar valves are closed
From the atrium 60-70% of blood passes passively move to the ventricles along pressure
gradient.
Sounds :3rd Heart sound heard. (children only)
6- Rapid Filling Phase:
18
Mechanical phase
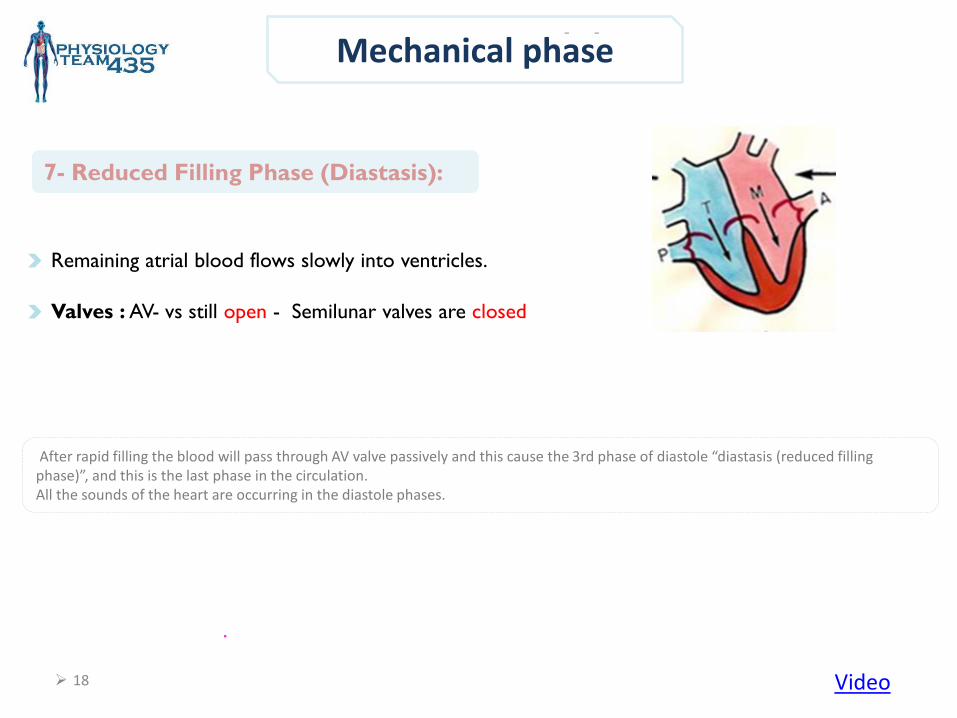
Remaining atrial blood flows slowly into ventricles.
Valves : AV- vs still open - Semilunar valves are closed
- -
.
After rapid filling the blood will pass through AV valve passively and this cause the 3rd phase of diastole “diastasis (reduced filling phase)”, and this is the last phase in the circulation. All the sounds of the heart are occurring in the diastole phases.
7- Reduced Filling Phase (Diastasis):
Video
19
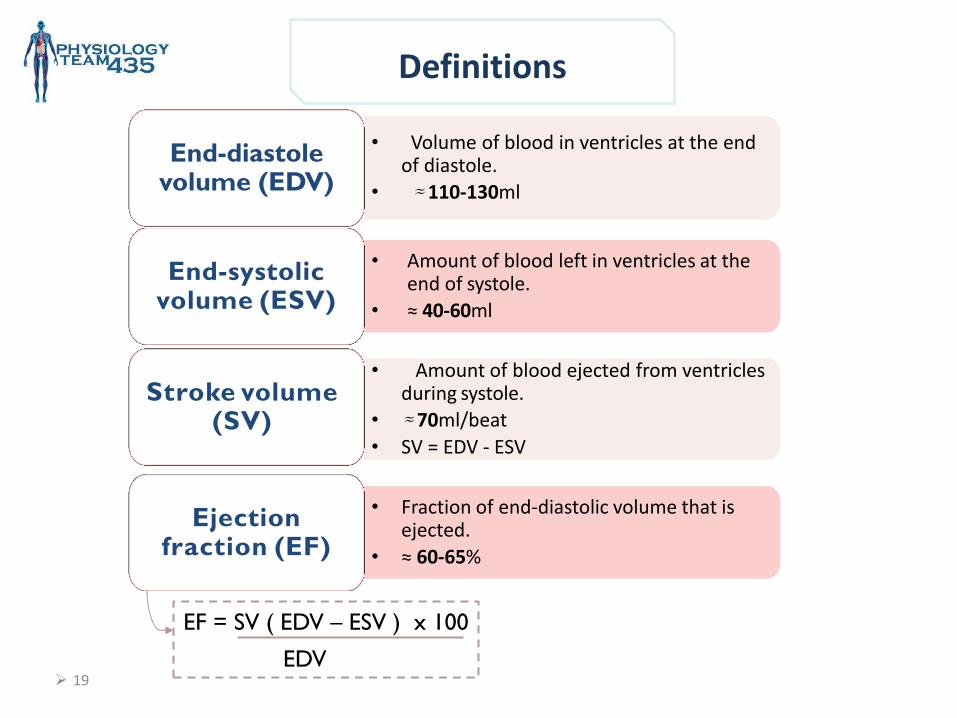
Definitions
• Volume of blood in ventricles at the end of diastole.
• ≈ 110-130ml
End-diastole volume (EDV)
• Amount of blood ejected from ventricles during systole.
• ≈ 70ml/beat
• SV = EDV - ESV
Stroke volume (SV)
• Amount of blood left in ventricles at the end of systole.
• ≈ 40-60ml
End-systolic volume (ESV)
• Fraction of end-diastolic volume that is ejected.
• ≈ 60-65%
Ejection fraction (EF)
EF = SV ( EDV – ESV ) x 100
EDV
20
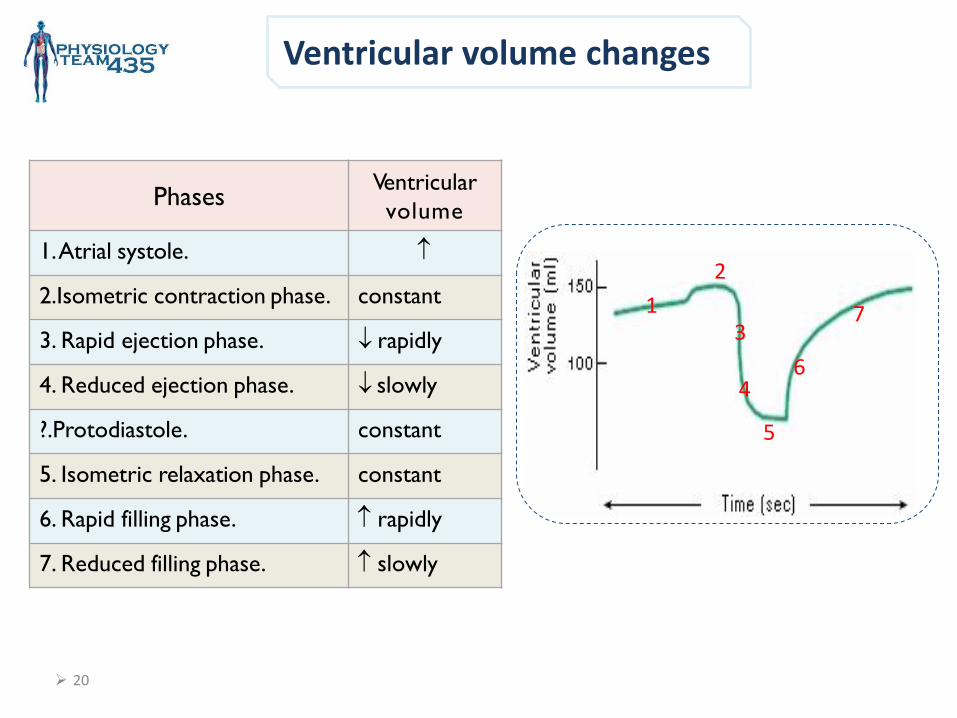
Ventricular volume changes
Ventricular
volume Phases
1. Atrial systole.
constant 2.Isometric contraction phase.
rapidly 3. Rapid ejection phase.
slowly 4. Reduced ejection phase.
constant ?.Protodiastole.
constant 5. Isometric relaxation phase.
rapidly 6. Rapid filling phase.
slowly 7. Reduced filling phase.
2
1
6 4
5
7 3
21
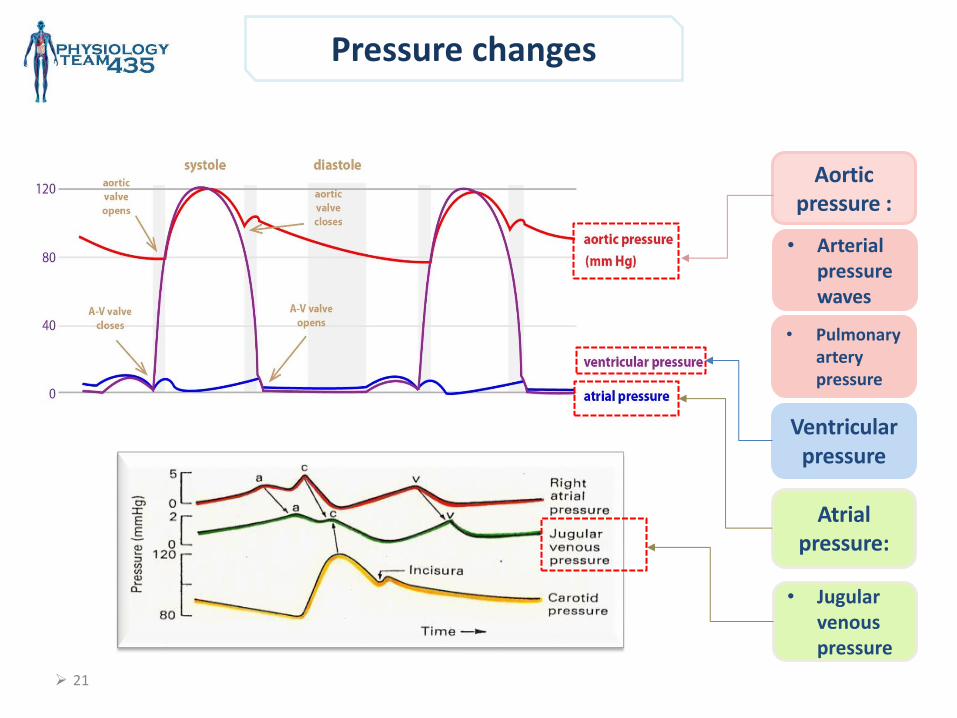
Pressure changes
Ventricular pressure
Aortic pressure :
Atrial pressure:
• Pulmonary artery pressure
• Arterial pressure waves
• Jugular venous pressure
22
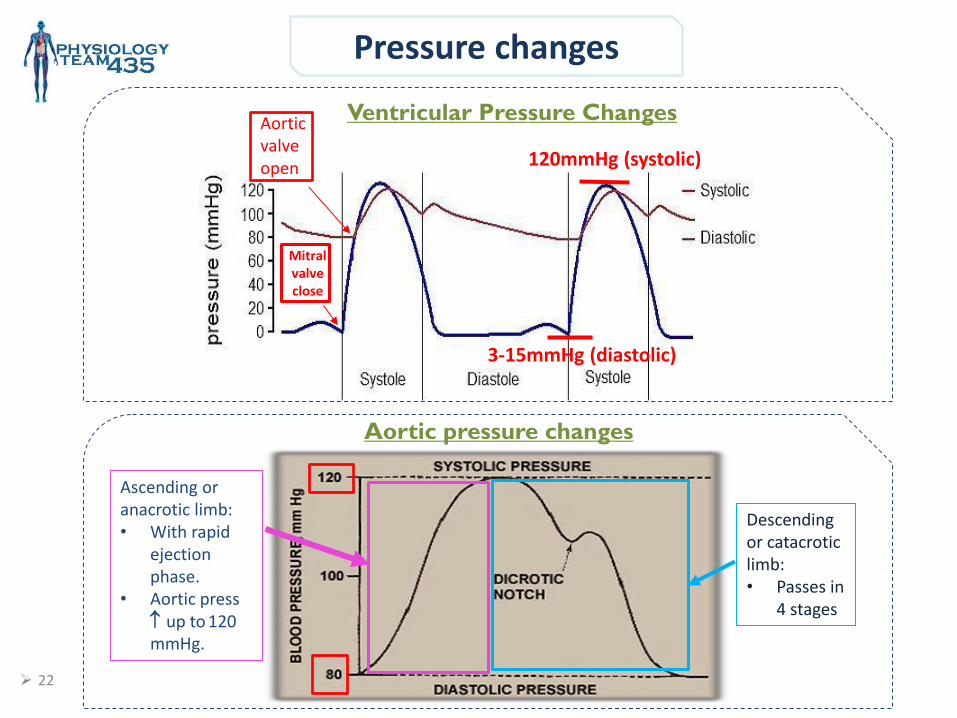
Pressure changes
Ventricular Pressure Changes
Mitral valve close
Aortic valve open 120mmHg (systolic)
3-15mmHg (diastolic)
Aortic pressure changes
Descending or catacrotic limb: • Passes in
4 stages
Ascending or anacrotic limb: • With rapid
ejection phase.
• Aortic press up to 120 mmHg.
23
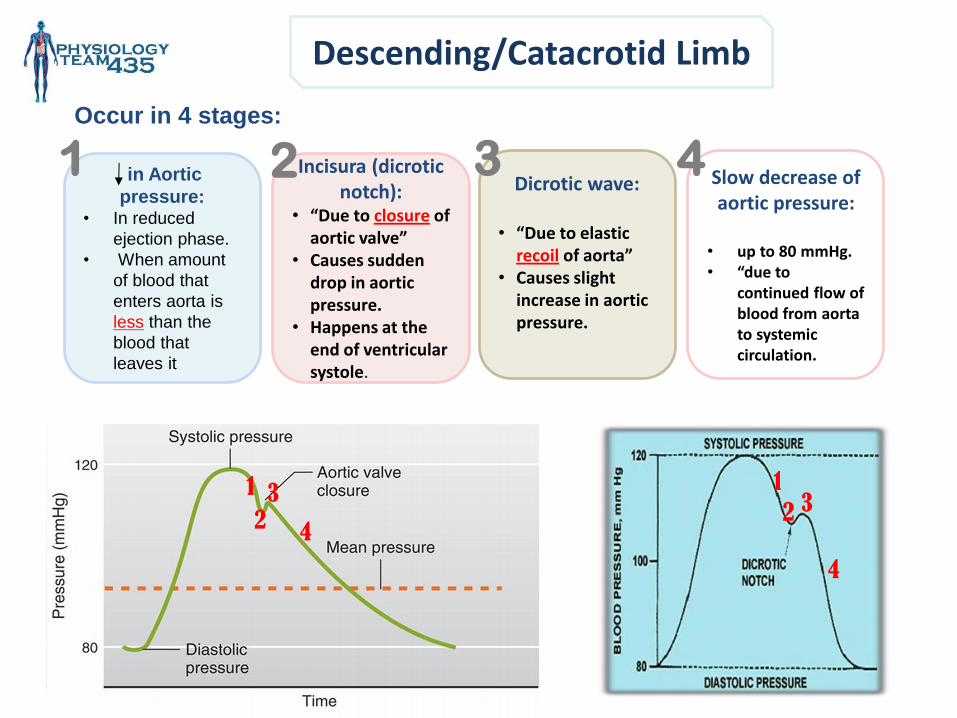
Descending/Catacrotid Limb
Occur in 4 stages:
in Aortic
pressure: • In reduced
ejection phase.
• When amount
of blood that
enters aorta is
less than the
blood that
leaves it
Slow decrease of aortic pressure:
• up to 80 mmHg. • “due to
continued flow of blood from aorta to systemic circulation.
Dicrotic wave:
• “Due to elastic
recoil of aorta” • Causes slight
increase in aortic pressure.
Incisura (dicrotic notch):
• “Due to closure of aortic valve”
• Causes sudden drop in aortic pressure.
• Happens at the end of ventricular systole.
1 2 4 3
1 3
4
4
2 3 1
2
24
Pressure changes
2/3
1
/3
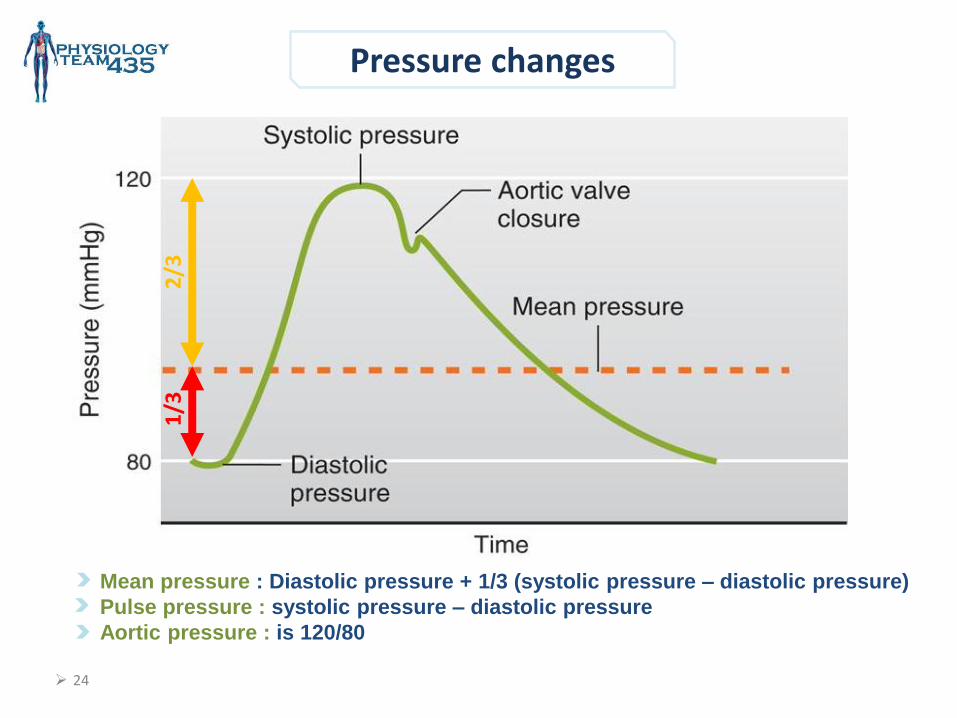
Mean pressure : Diastolic pressure + 1/3 (systolic pressure – diastolic pressure)
Pulse pressure : systolic pressure – diastolic pressure
Aortic pressure : is 120/80
25
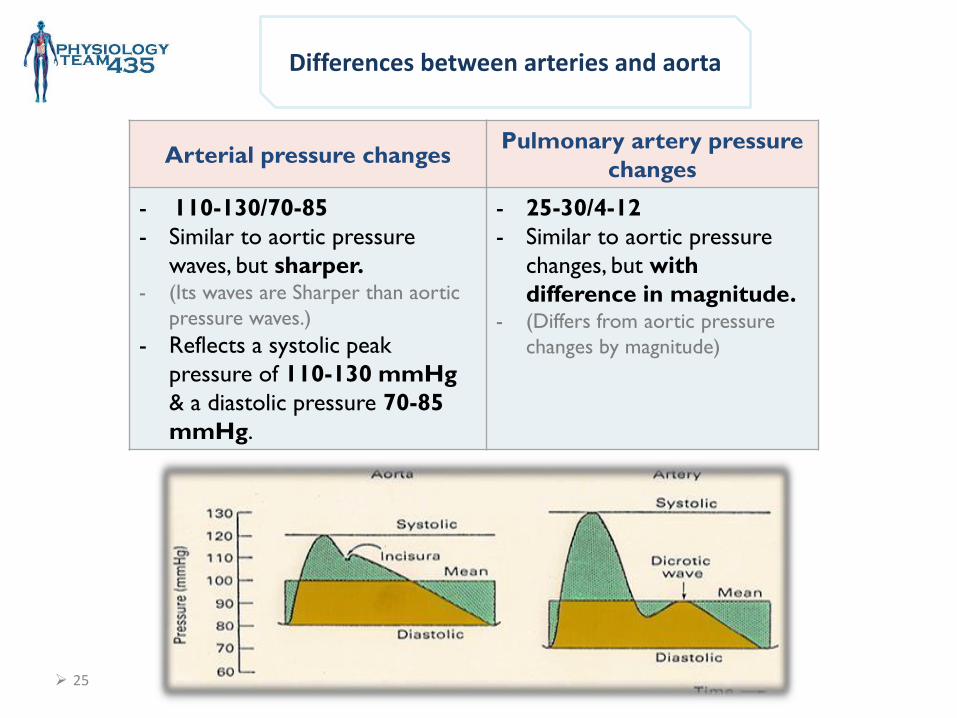
Differences between arteries and aorta
Arterial pressure changes Pulmonary artery pressure
changes
- 110-130/70-85
- Similar to aortic pressure
waves, but sharper. - (Its waves are Sharper than aortic
pressure waves.)
- Reflects a systolic peak
pressure of 110-130 mmHg
& a diastolic pressure 70-85
mmHg.
- 25-30/4-12
- Similar to aortic pressure
changes, but with
difference in magnitude. - (Differs from aortic pressure
changes by magnitude)
26
Atrial pressure changes
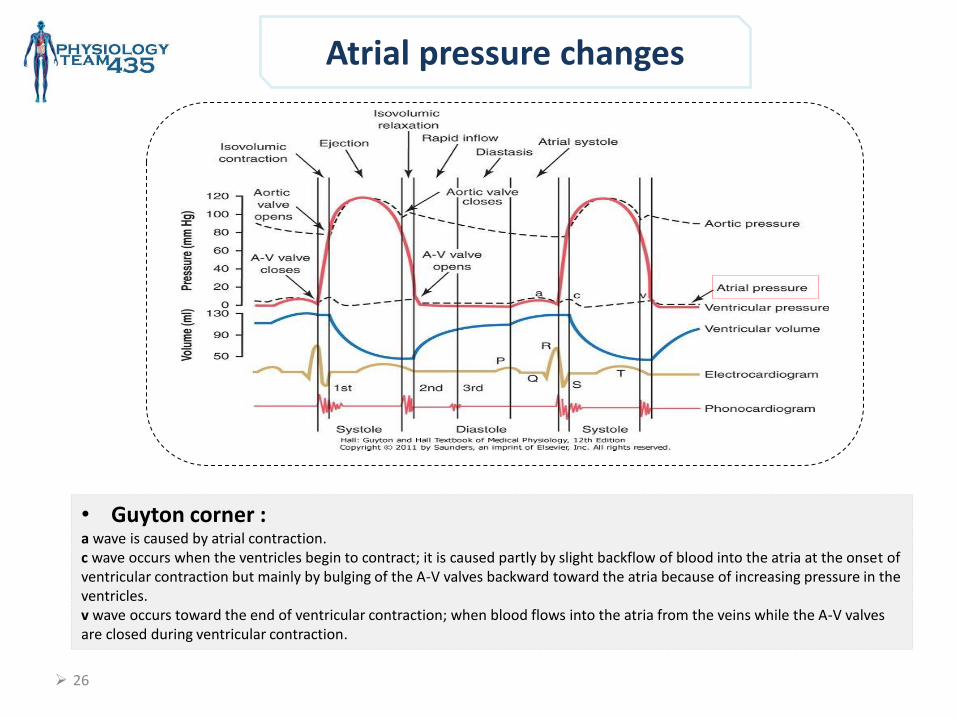
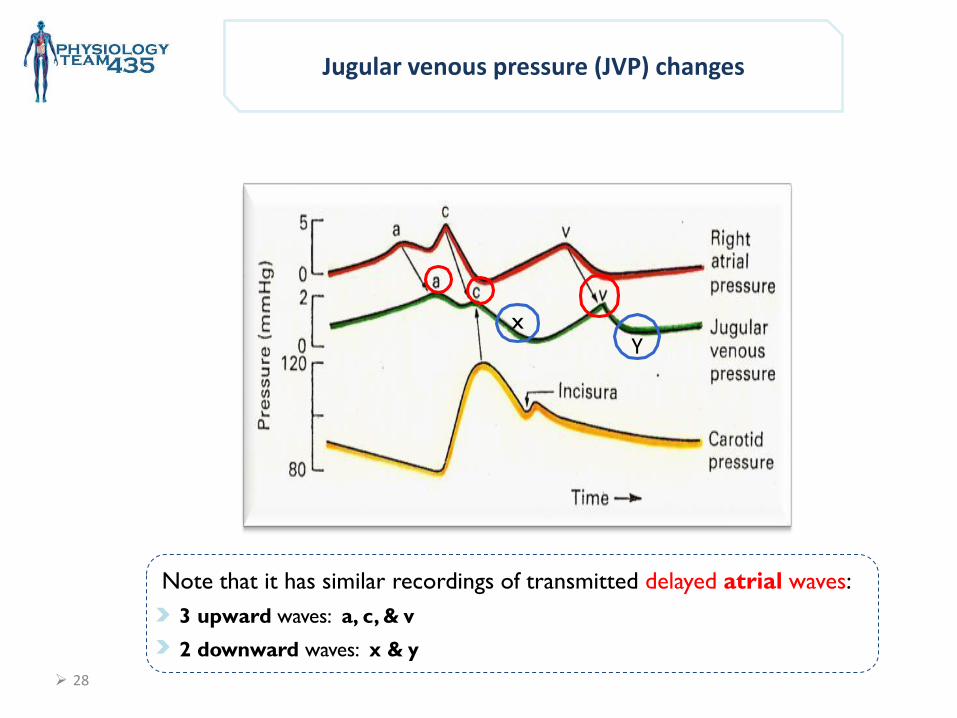
• Guyton corner : a wave is caused by atrial contraction. c wave occurs when the ventricles begin to contract; it is caused partly by slight backflow of blood into the atria at the onset of ventricular contraction but mainly by bulging of the A-V valves backward toward the atria because of increasing pressure in the ventricles. v wave occurs toward the end of ventricular contraction; when blood flows into the atria from the veins while the A-V valves are closed during ventricular contraction.
27
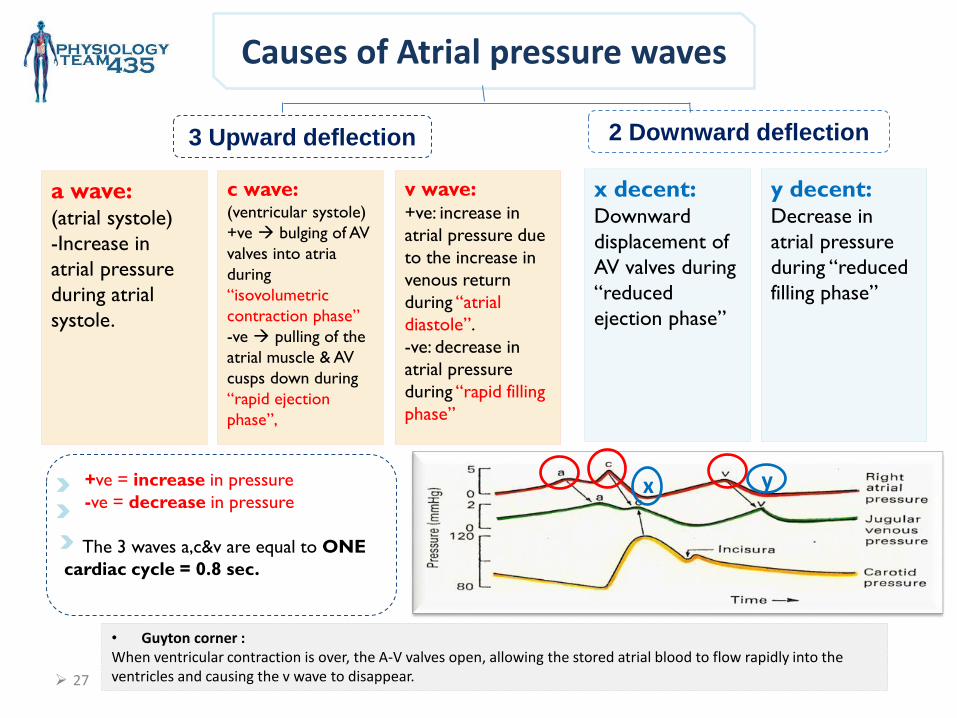
Causes of Atrial pressure waves
x y
3 Upward deflection 2 Downward deflection
a wave: (atrial systole)
-Increase in
atrial pressure
during atrial
systole.
y decent: Decrease in
atrial pressure
during “reduced
filling phase”
v wave: +ve: increase in
atrial pressure due
to the increase in
venous return
during “atrial
diastole”.
-ve: decrease in
atrial pressure
during “rapid filling
phase”
c wave: (ventricular systole)
+ve bulging of AV
valves into atria
during
“isovolumetric
contraction phase”
-ve pulling of the
atrial muscle & AV
cusps down during
“rapid ejection
phase”,
x decent: Downward
displacement of
AV valves during
“reduced
ejection phase”
+ve = increase in pressure
-ve = decrease in pressure
The 3 waves a,c&v are equal to ONE
cardiac cycle = 0.8 sec.
• Guyton corner : When ventricular contraction is over, the A-V valves open, allowing the stored atrial blood to flow rapidly into the ventricles and causing the v wave to disappear.
28
x Y
Note that it has similar recordings of transmitted delayed atrial waves:
3 upward waves: a, c, & v
2 downward waves: x & y
Jugular venous pressure (JVP) changes
29
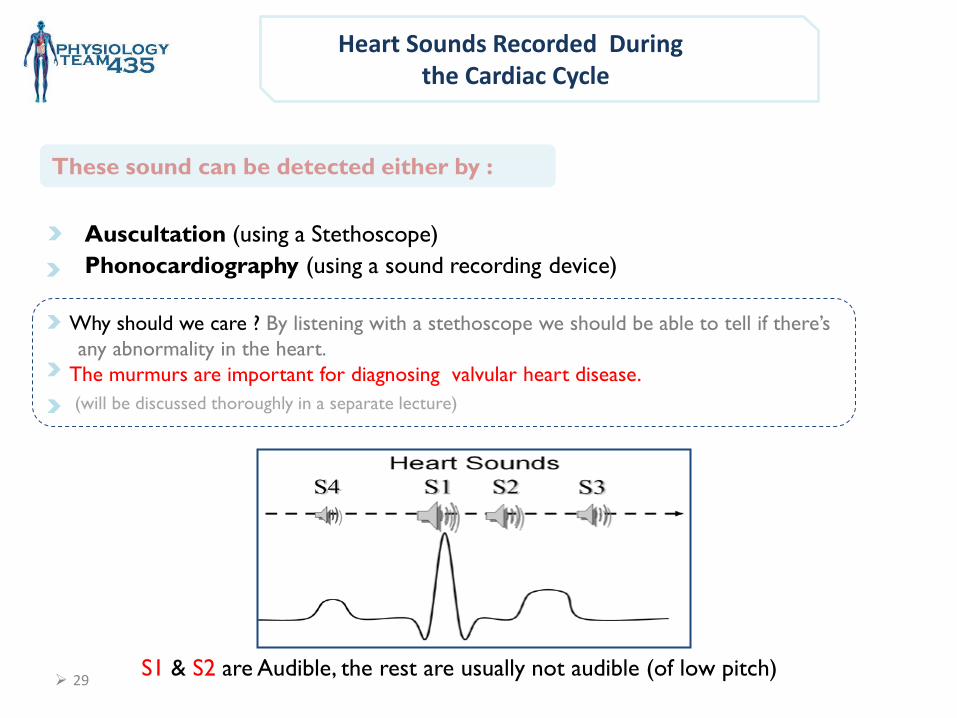
Heart Sounds Recorded During the Cardiac Cycle
Why should we care ? By listening with a stethoscope we should be able to tell if there’s
any abnormality in the heart.
The murmurs are important for diagnosing valvular heart disease.
(will be discussed thoroughly in a separate lecture)
Auscultation (using a Stethoscope)
Phonocardiography (using a sound recording device)
S1 & S2 are Audible, the rest are usually not audible (of low pitch)
These sound can be detected either by :
30
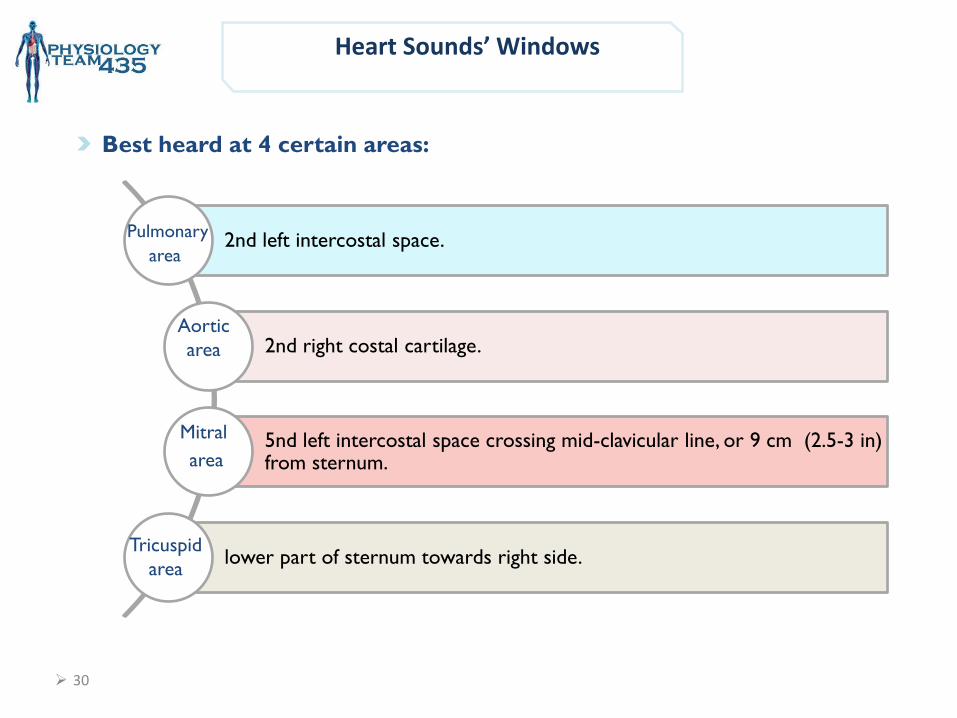
Heart Sounds’ Windows
2nd left intercostal space.
2nd right costal cartilage.
5nd left intercostal space crossing mid-clavicular line, or 9 cm (2.5-3 in) from sternum.
lower part of sternum towards right side.
Pulmonary
area
Aortic
area
Mitral
area
Tricuspid
area
Best heard at 4 certain areas:
31
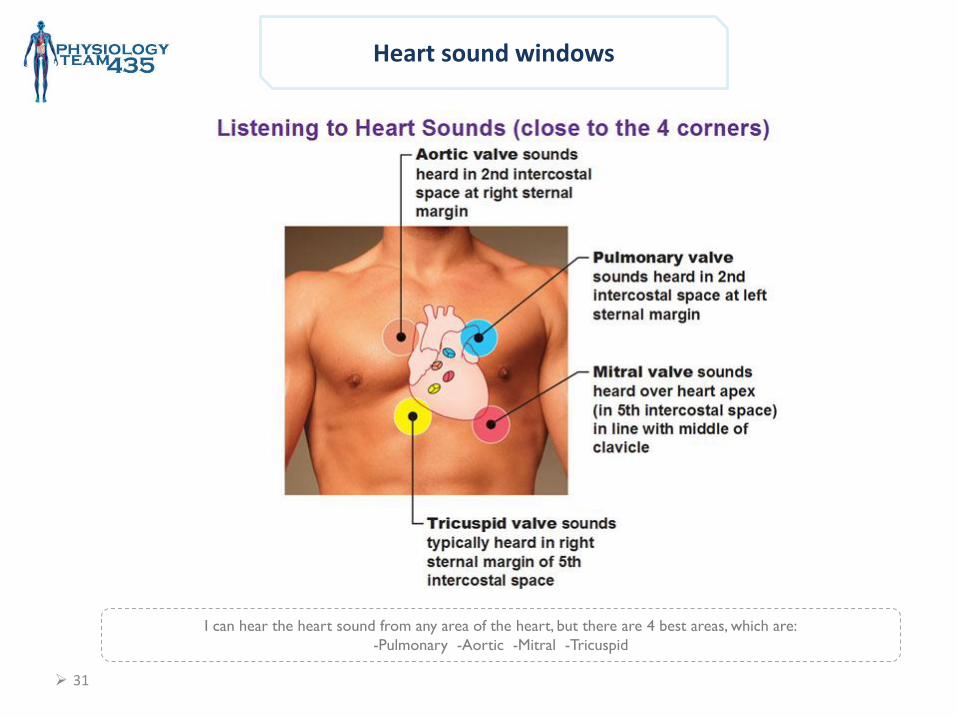
Heart sound windows
I can hear the heart sound from any area of the heart, but there are 4 best areas, which are:
-Pulmonary -Aortic -Mitral -Tricuspid
32
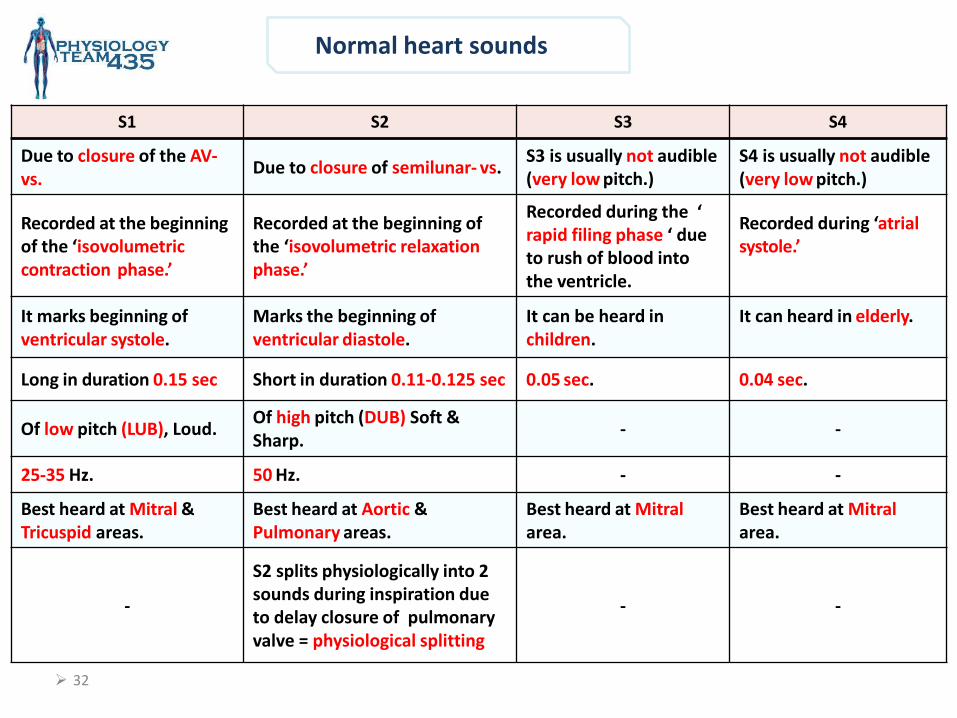
Normal heart sounds
S1 S2 S3 S4
Due to closure of the AV- vs.
Due to closure of semilunar- vs. S3 is usually not audible (very low pitch.)
S4 is usually not audible (very low pitch.)
Recorded at the beginning of the ‘isovolumetric contraction phase.’
Recorded at the beginning of the ‘isovolumetric relaxation phase.’
Recorded during the ‘ rapid filing phase ‘ due to rush of blood into the ventricle.
Recorded during ‘atrial systole.’
It marks beginning of ventricular systole.
Marks the beginning of ventricular diastole.
It can be heard in children.
It can heard in elderly.
Long in duration 0.15 sec Short in duration 0.11-0.125 sec 0.05 sec. 0.04 sec.
Of low pitch (LUB), Loud. Of high pitch (DUB) Soft & Sharp.
- -
25-35 Hz. 50 Hz. - -
Best heard at Mitral & Tricuspid areas.
Best heard at Aortic & Pulmonary areas.
Best heard at Mitral area.
Best heard at Mitral area.
-
S2 splits physiologically into 2 sounds during inspiration due to delay closure of pulmonary valve = physiological splitting
- -
33
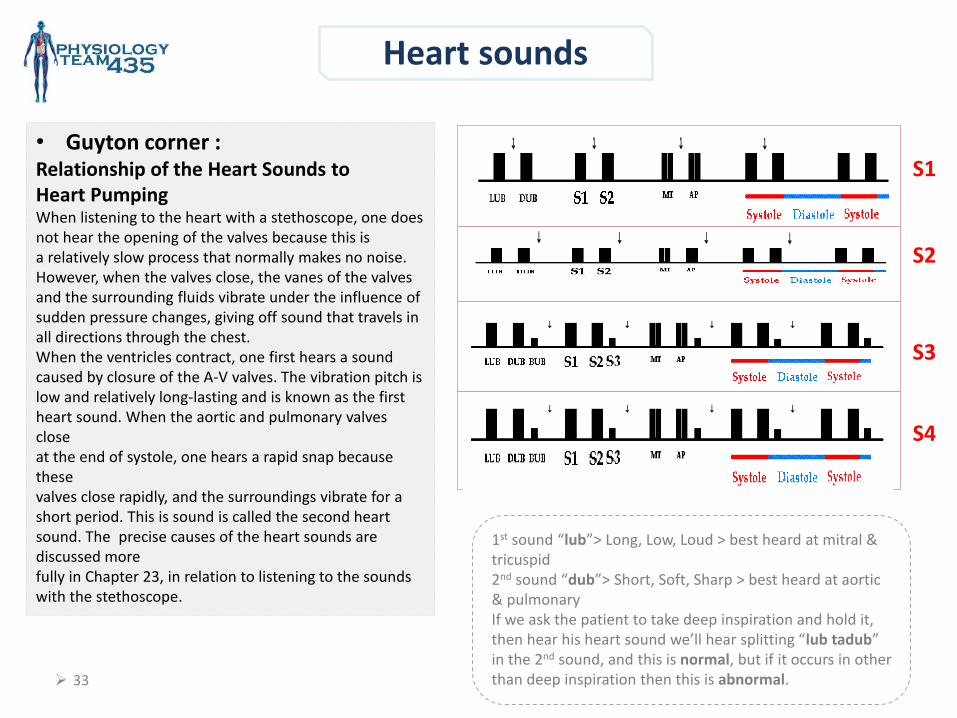
Heart sounds
• Guyton corner : Relationship of the Heart Sounds to Heart Pumping When listening to the heart with a stethoscope, one does not hear the opening of the valves because this is a relatively slow process that normally makes no noise. However, when the valves close, the vanes of the valves and the surrounding fluids vibrate under the influence of sudden pressure changes, giving off sound that travels in all directions through the chest. When the ventricles contract, one first hears a sound caused by closure of the A-V valves. The vibration pitch is low and relatively long-lasting and is known as the first heart sound. When the aortic and pulmonary valves close at the end of systole, one hears a rapid snap because these valves close rapidly, and the surroundings vibrate for a short period. This is sound is called the second heart sound. The precise causes of the heart sounds are discussed more fully in Chapter 23, in relation to listening to the sounds with the stethoscope.
1st sound “lub”> Long, Low, Loud > best heard at mitral & tricuspid 2nd sound “dub”> Short, Soft, Sharp > best heard at aortic & pulmonary If we ask the patient to take deep inspiration and hold it, then hear his heart sound we’ll hear splitting “lub tadub” in the 2nd sound, and this is normal, but if it occurs in other than deep inspiration then this is abnormal.
S1
S2
S3
S4
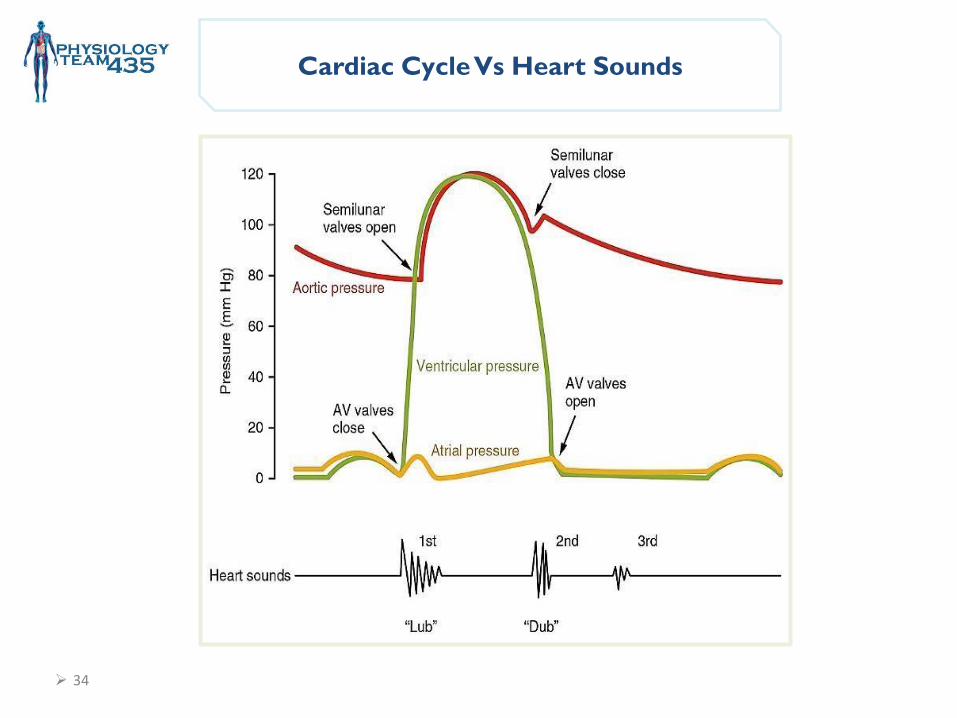
Cardiac Cycle Vs Heart Sounds
34
35
Objectives :
Cardiac Cycle 2
Contact us : [email protected]
• Electrical changes that occur in the cardiac cycle.
• Identify the systolic and diastolic period.
• Discuss the volume-pressure relationship in the left ventricle.
• Pressure Volume Curve and Pressure Volume loop.
36
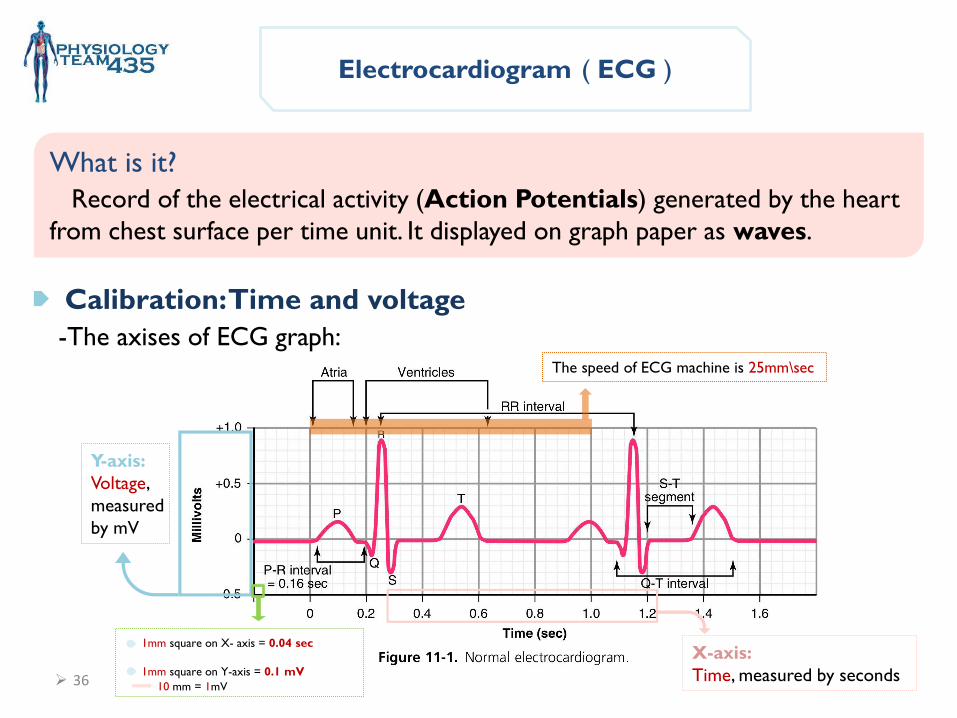
Electrocardiogram ( ECG )
What is it?
Record of the electrical activity (Action Potentials) generated by the heart
from chest surface per time unit. It displayed on graph paper as waves.
Calibration: Time and voltage
-The axises of ECG graph :
Y-axis:
Voltage,
measured
by mV
X-axis:
Time, measured by seconds
1mm square on X- axis = 0.04 sec
1mm square on Y-axis = 0.1 mV
The speed of ECG machine is 25mm\sec
10 mm = 1mV
37
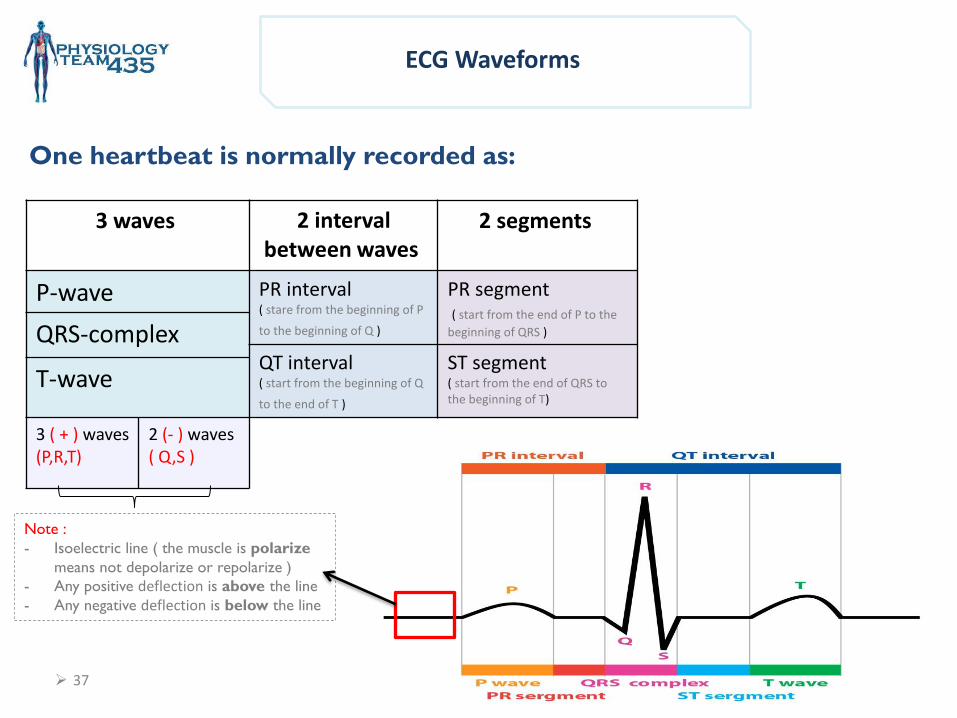
ECG Waveforms
One heartbeat is normally recorded as:
2 segments 2 interval between waves
3 waves
PR segment ( start from the end of P to the
beginning of QRS )
PR interval ( stare from the beginning of P
to the beginning of Q )
P-wave
QRS-complex ST segment ( start from the end of QRS to the beginning of T)
QT interval ( start from the beginning of Q
to the end of T ) T-wave
2 (- ) waves ( Q,S )
3 ( + ) waves (P,R,T)
Note :
- Isoelectric line ( the muscle is polarize
means not depolarize or repolarize )
- Any positive deflection is above the line
- Any negative deflection is below the line
38
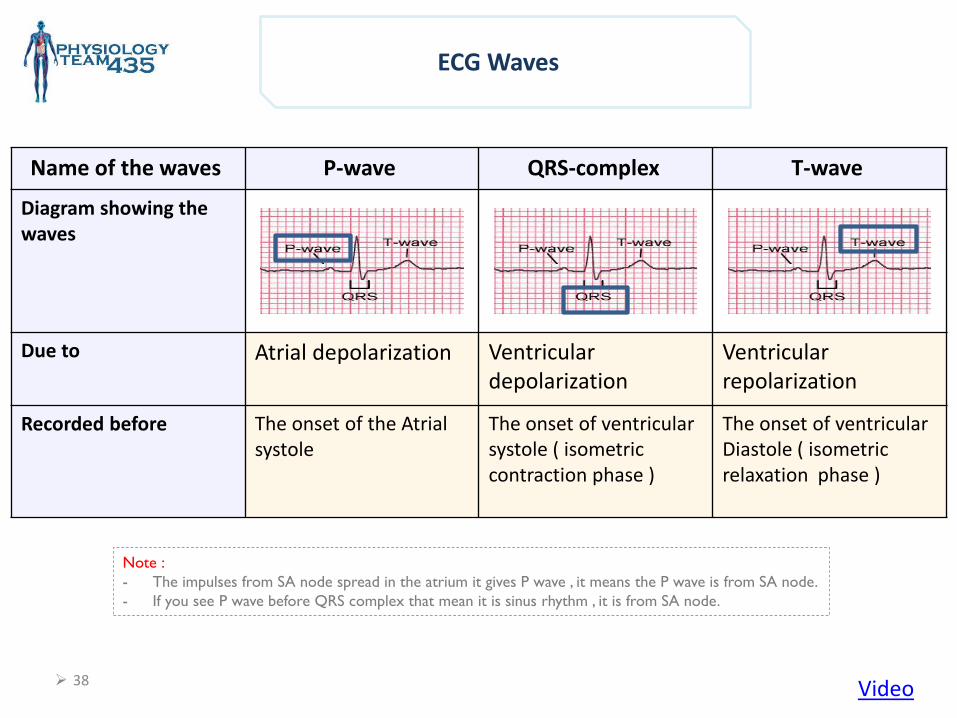
ECG Waves
T-wave QRS-complex P-wave Name of the waves
Diagram showing the waves
Ventricular repolarization
Ventricular depolarization
Atrial depolarization Due to
The onset of ventricular Diastole ( isometric relaxation phase )
The onset of ventricular systole ( isometric contraction phase )
The onset of the Atrial systole
Recorded before
Note :
- The impulses from SA node spread in the atrium it gives P wave , it means the P wave is from SA node.
- If you see P wave before QRS complex that mean it is sinus rhythm , it is from SA node.
Video
39
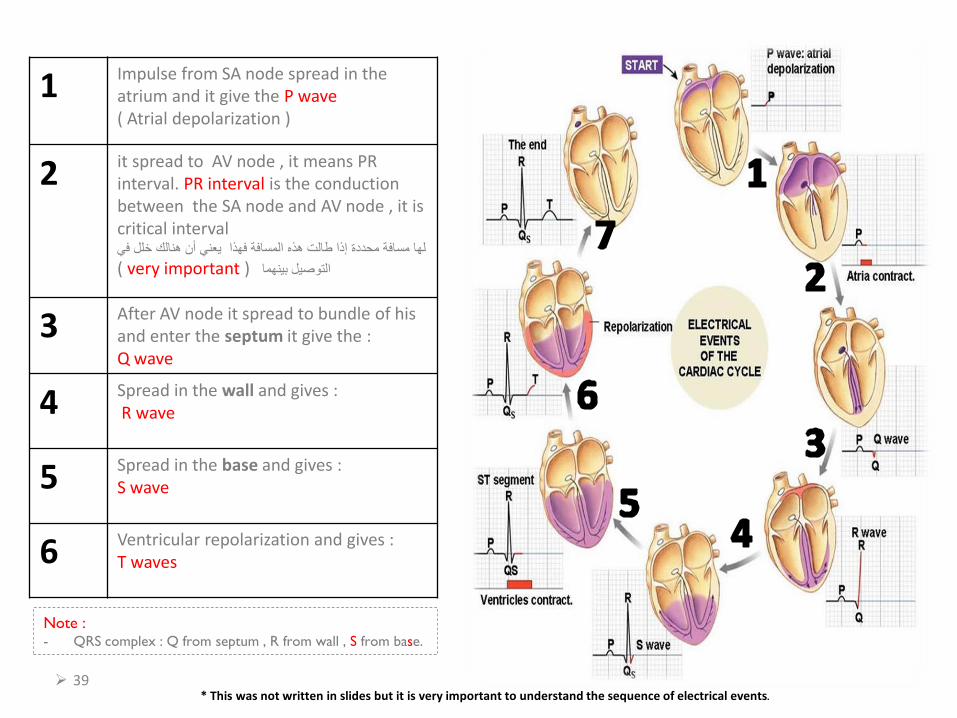
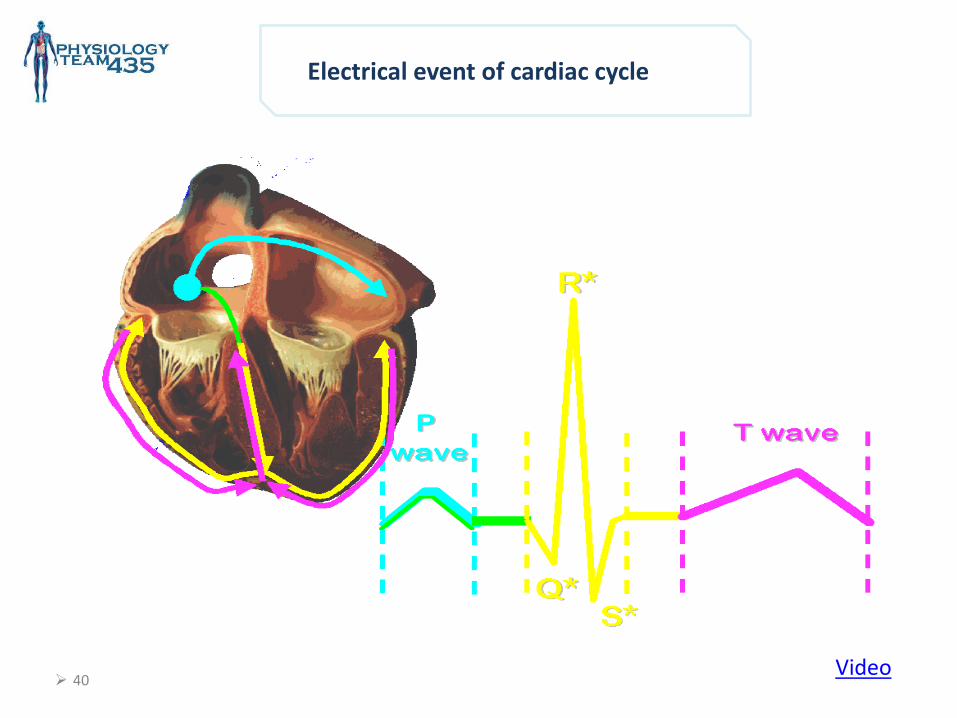
Impulse from SA node spread in the atrium and it give the P wave ( Atrial depolarization )
1
it spread to AV node , it means PR interval. PR interval is the conduction between the SA node and AV node , it is critical interval
لها مسافة محددة إذا طالت هذه المسافة فهذا يعني أن هنالك خلل في
( very important )التوصيل بينهما
2
After AV node it spread to bundle of his and enter the septum it give the : Q wave
3
Spread in the wall and gives : R wave 4
Spread in the base and gives : S wave 5
Ventricular repolarization and gives : T waves 6
Note : - QRS complex : Q from septum , R from wall , S from base.
* This was not written in slides but it is very important to understand the sequence of electrical events.
41
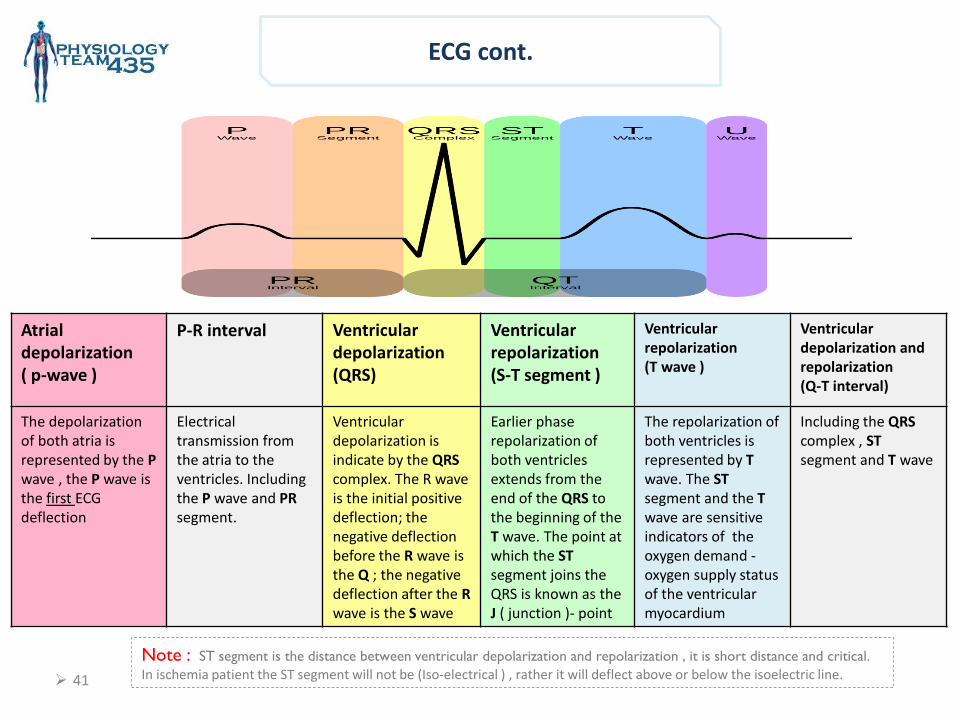
ECG cont.
Ventricular depolarization and repolarization (Q-T interval)
Ventricular repolarization (T wave )
Ventricular repolarization (S-T segment )
Ventricular depolarization (QRS)
P-R interval Atrial depolarization ( p-wave )
Including the QRS complex , ST segment and T wave
The repolarization of both ventricles is represented by T wave. The ST segment and the T wave are sensitive indicators of the oxygen demand -oxygen supply status of the ventricular myocardium
Earlier phase repolarization of both ventricles extends from the end of the QRS to the beginning of the T wave. The point at which the ST segment joins the QRS is known as the J ( junction )- point
Ventricular depolarization is indicate by the QRS complex. The R wave is the initial positive deflection; the negative deflection before the R wave is the Q ; the negative deflection after the R wave is the S wave
Electrical transmission from the atria to the ventricles. Including the P wave and PR segment.
The depolarization of both atria is represented by the P wave , the P wave is
ECG first the deflection
Note : ST segment is the distance between ventricular depolarization and repolarization , it is short distance and critical.
In ischemia patient the ST segment will not be (Iso-electrical ) , rather it will deflect above or below the isoelectric line.
42
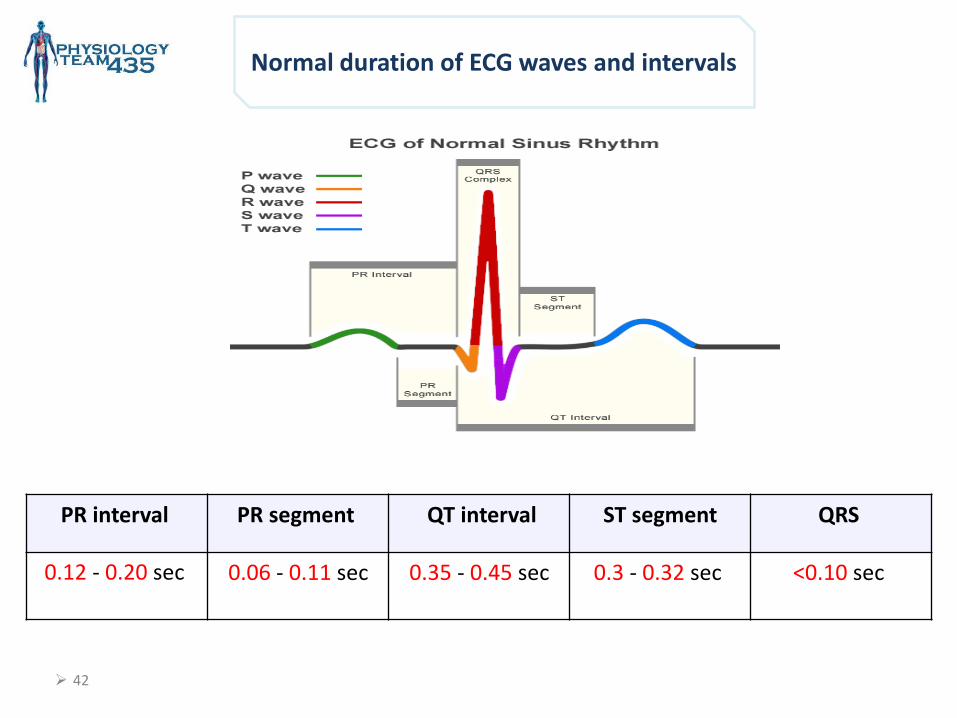
Normal duration of ECG waves and intervals
QRS ST segment QT interval PR segment PR interval
<0.10 sec 0.3 - 0.32 sec 0.35 - 0.45 sec
0.06 - 0.11 sec
0.12 - 0.20 sec
43
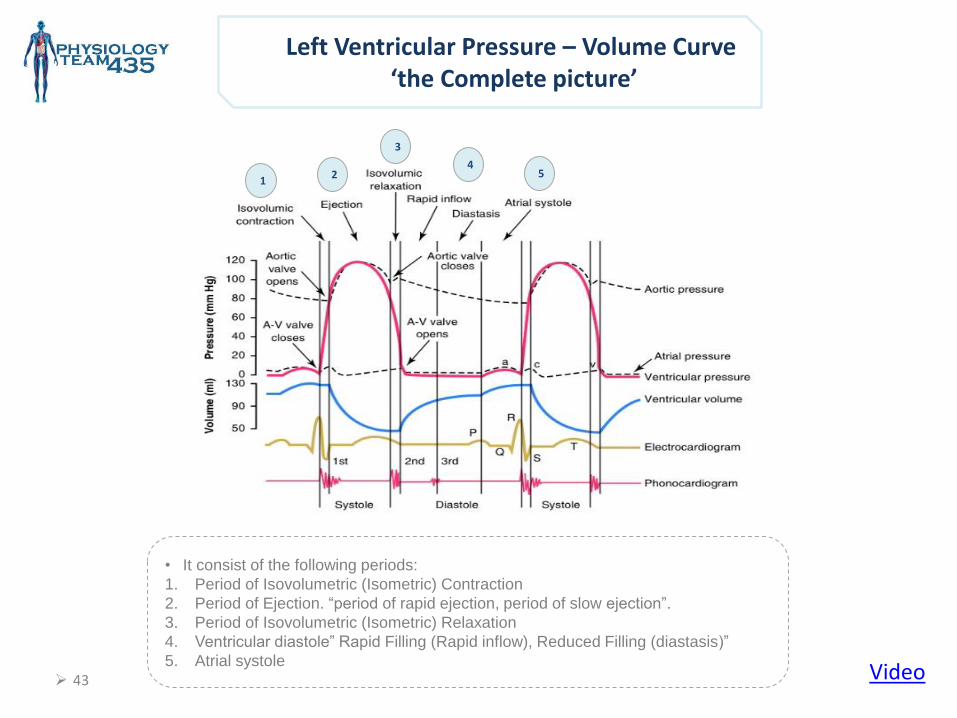
Left Ventricular Pressure – Volume Curve ‘the Complete picture’
• It consist of the following periods:
1. Period of Isovolumetric (Isometric) Contraction
2. Period of Ejection. “period of rapid ejection, period of slow ejection”.
3. Period of Isovolumetric (Isometric) Relaxation
4. Ventricular diastole” Rapid Filling (Rapid inflow), Reduced Filling (diastasis)”
5. Atrial systole Video
1
4
3
2 5
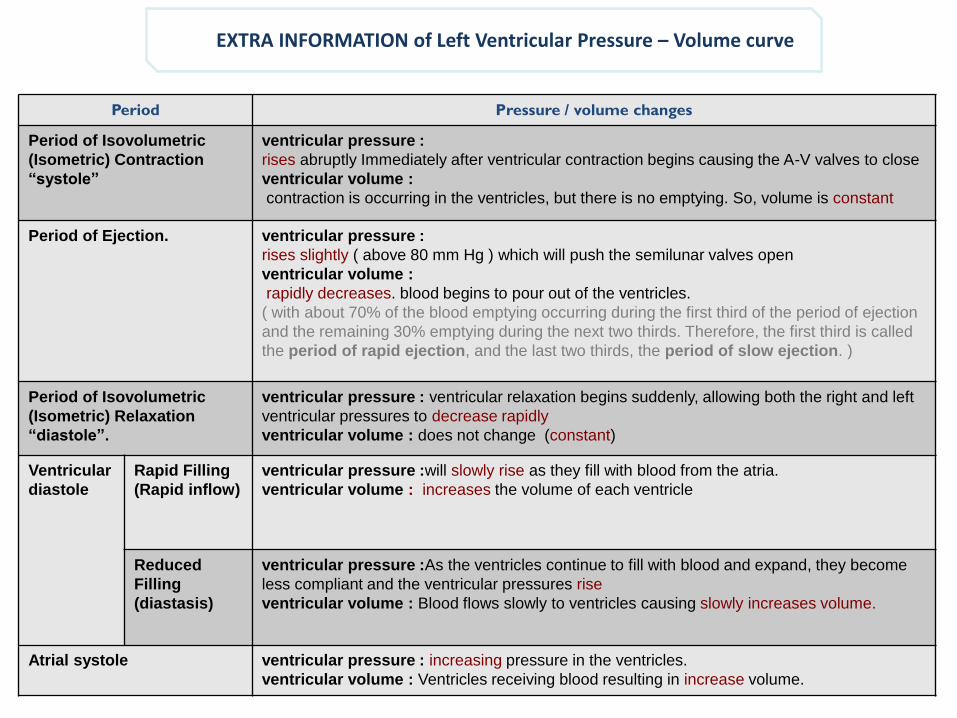
EXTRA INFORMATION of Left Ventricular Pressure – Volume curve
Period Pressure / volume changes
Period of Isovolumetric
(Isometric) Contraction
“systole”
ventricular pressure :
rises abruptly Immediately after ventricular contraction begins causing the A-V valves to close
ventricular volume :
contraction is occurring in the ventricles, but there is no emptying. So, volume is constant
Period of Ejection. ventricular pressure :
rises slightly ( above 80 mm Hg ) which will push the semilunar valves open
ventricular volume :
rapidly decreases. blood begins to pour out of the ventricles.
( with about 70% of the blood emptying occurring during the first third of the period of ejection
and the remaining 30% emptying during the next two thirds. Therefore, the first third is called
the period of rapid ejection, and the last two thirds, the period of slow ejection. )
Period of Isovolumetric
(Isometric) Relaxation
“diastole”.
ventricular pressure : ventricular relaxation begins suddenly, allowing both the right and left
ventricular pressures to decrease rapidly
ventricular volume : does not change (constant)
Ventricular
diastole
Rapid Filling
(Rapid inflow)
ventricular pressure :will slowly rise as they fill with blood from the atria.
ventricular volume : increases the volume of each ventricle
Reduced
Filling
(diastasis)
ventricular pressure :As the ventricles continue to fill with blood and expand, they become
less compliant and the ventricular pressures rise
ventricular volume : Blood flows slowly to ventricles causing slowly increases volume.
Atrial systole ventricular pressure : increasing pressure in the ventricles.
ventricular volume : Ventricles receiving blood resulting in increase volume.
45
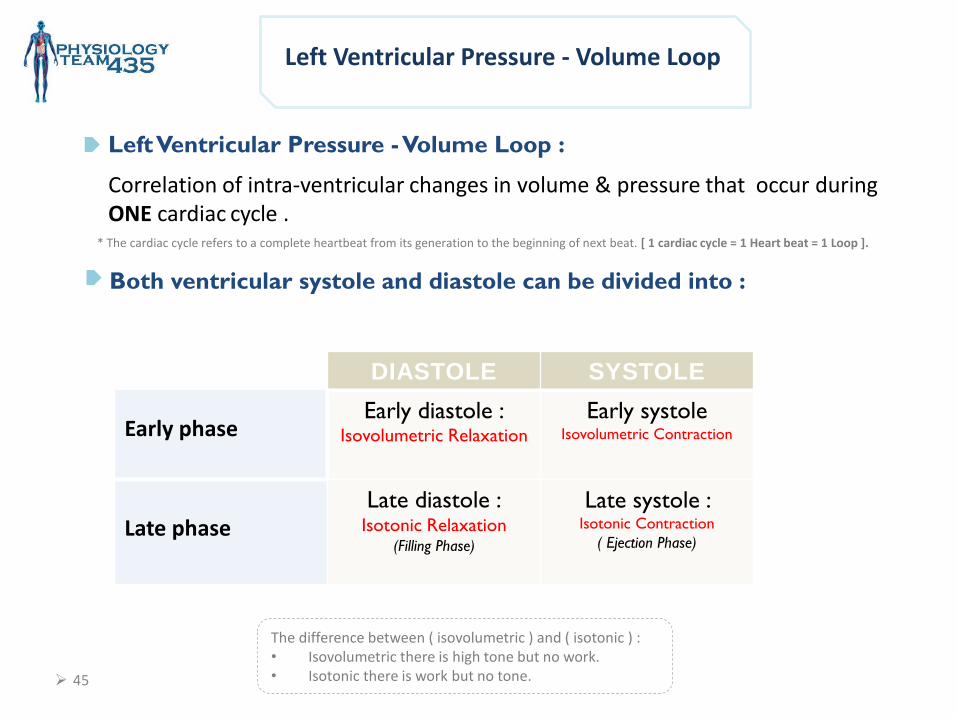
Left Ventricular Pressure - Volume Loop
Left Ventricular Pressure - Volume Loop :
Correlation of intra-ventricular changes in volume & pressure that occur during ONE cardiac cycle .
Both ventricular systole and diastole can be divided into :
Early phase
DIASTOLE SYSTOLE
Early diastole : Isovolumetric Relaxation
Early systole Isovolumetric Contraction
Late phase
Late diastole : Isotonic Relaxation
(Filling Phase)
Late systole : Isotonic Contraction
( Ejection Phase)
The difference between ( isovolumetric ) and ( isotonic ) : • Isovolumetric there is high tone but no work. • Isotonic there is work but no tone.
* The cardiac cycle refers to a complete heartbeat from its generation to the beginning of next beat. [ 1 cardiac cycle = 1 Heart beat = 1 Loop ].
46
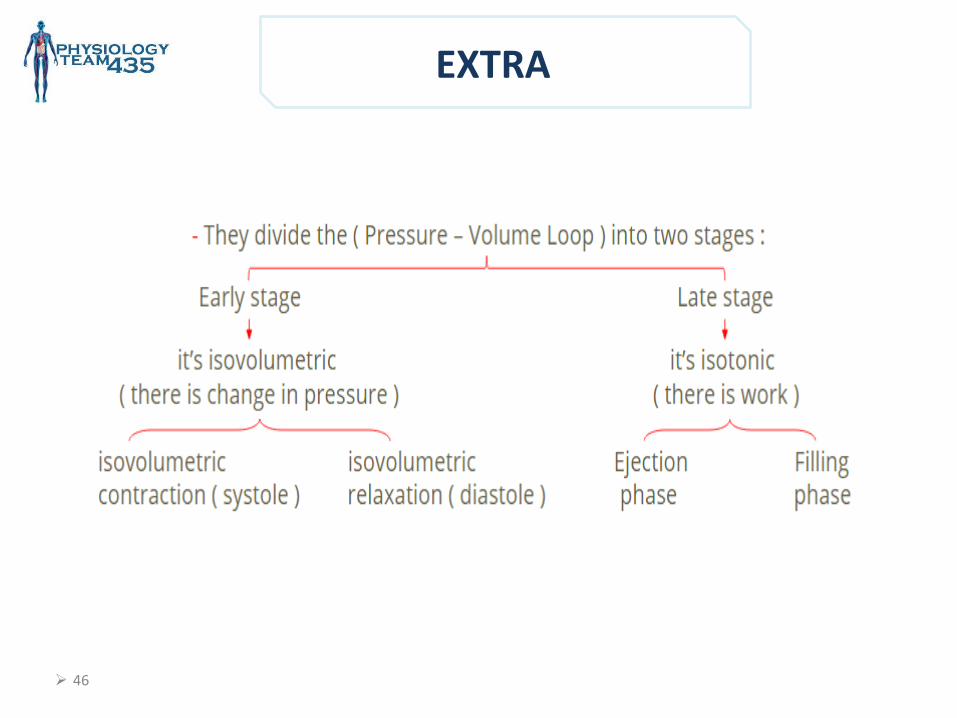
EXTRA
47
Early Systole
( isovolumetric contraction)
Early Diastole
(isovolumetric
relaxation)
Late systole
(Ejection phase)
Late Diastole
(Filling phase)
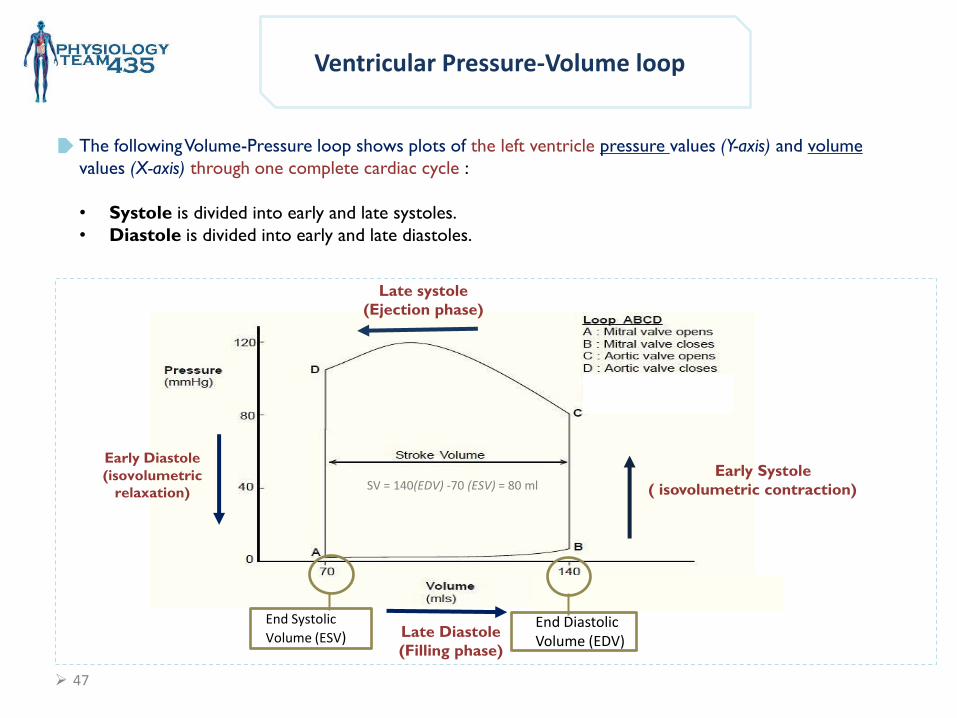
Ventricular Pressure-Volume loop
End Systolic
Volume (ESV) End Diastolic Volume (EDV)
The following Volume-Pressure loop shows plots of the left ventricle pressure values (Y-axis) and volume
values (X-axis) through one complete cardiac cycle :
• Systole is divided into early and late systoles.
• Diastole is divided into early and late diastoles.
SV = 140(EDV) -70 (ESV) = 80 ml
48
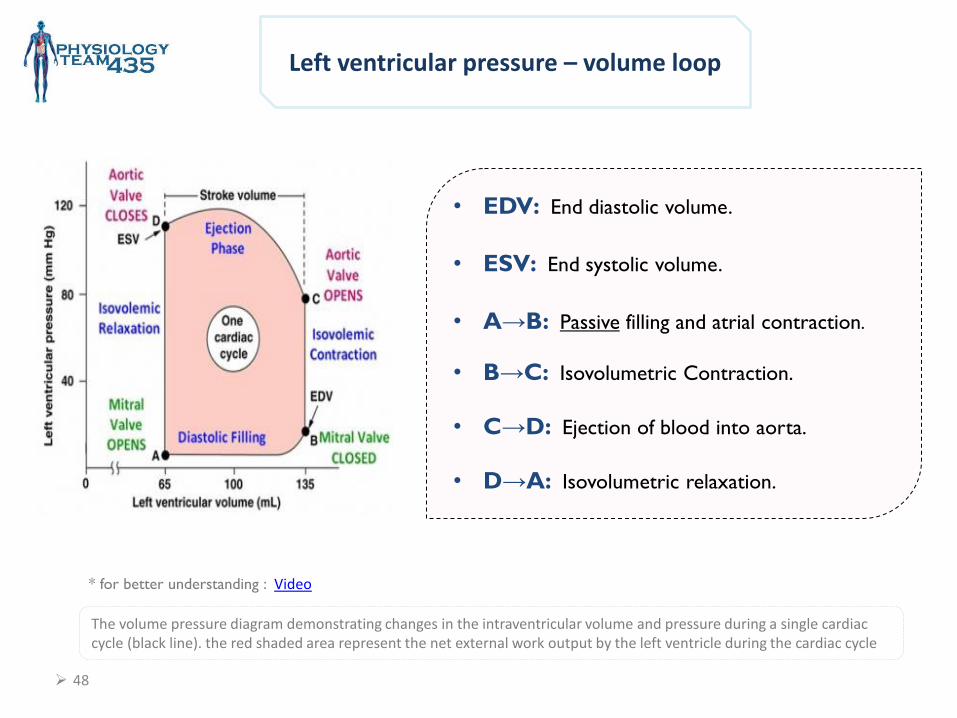
Left ventricular pressure – volume loop
The volume pressure diagram demonstrating changes in the intraventricular volume and pressure during a single cardiac cycle (black line). the red shaded area represent the net external work output by the left ventricle during the cardiac cycle
• EDV: End diastolic volume.
• ESV: End systolic volume.
• A→B: Passive filling and atrial contraction.
• B→C: Isovolumetric Contraction.
• C→D: Ejection of blood into aorta.
• D→A: Isovolumetric relaxation.
* for better understanding : Video
49
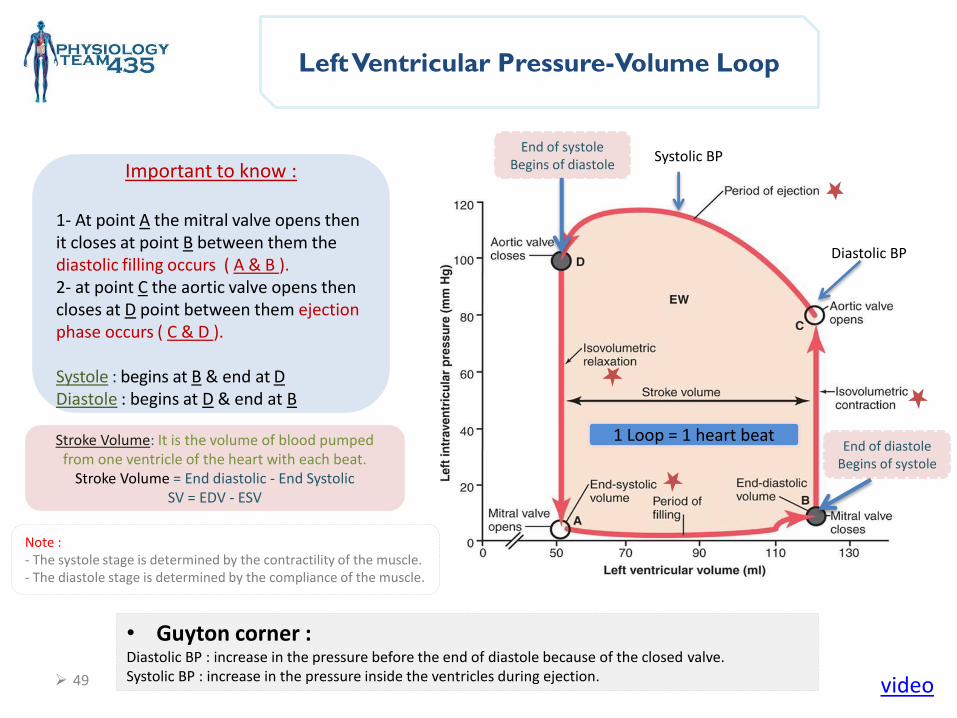
Left Ventricular Pressure-Volume Loop
• Guyton corner : Diastolic BP : increase in the pressure before the end of diastole because of the closed valve. Systolic BP : increase in the pressure inside the ventricles during ejection.
Important to know :
1- At point A the mitral valve opens then it closes at point B between them the diastolic filling occurs ( A & B ). 2- at point C the aortic valve opens then closes at D point between them ejection phase occurs ( C & D ). Systole : begins at B & end at D Diastole : begins at D & end at B
End of systole Begins of diastole
End of diastole Begins of systole
video
Stroke Volume: It is the volume of blood pumped from one ventricle of the heart with each beat.
Stroke Volume = End diastolic - End Systolic SV = EDV - ESV
1 Loop = 1 heart beat
Diastolic BP
Systolic BP
Note : - The systole stage is determined by the contractility of the muscle. - The diastole stage is determined by the compliance of the muscle.
Physiology Leaders : Khawla Alammari Nojood Alhaidri Rawaf Alrawaf
Girls team :
• Atheer Alnashwan • Asrar Batarfi • Afnan Almalki • Alhanouf Aljlaoud • Deema AlFaris • Elham Alzahrani • Johara Almalki • Lojain alsiwat • Malak Alsharif • Monirah Alsalouli • Monera Alayuni • Nurah Alqahtani • Nouf Alabdulkarim • Nora Albusayes • Nora Alsomali • Norah Alakeel • Reem Alageel • Rawan Aldhuwayhi • Reham Al-Obaidan • Samar AlOtaibi • Shamma Alsaad
Boys team :
• Abdullah Aljaafar • Omar Alotaibi • Abdulrahman Albarakah • Adel Alshehri • Abdulaziz Alghanaym • Abdulmajeed Alotaibi • Khalil Alduraibi • Hassan Albeladi • Omar Alshehri • Saleh Alshawi • Abdulaziz Alhammad • Faisal Alabdulatif • Abdulnasser Alwabel • Saad Almutairy
Related Documents