Carbonate Aggregate in Concrete Kejin Wang, Principal Investigator Department of Civil, Construction, Environmental Engineering Institute of Transportation Iowa State University May 2015 Research Project Final Report 2015-14

Welcome message from author
This document is posted to help you gain knowledge. Please leave a comment to let me know what you think about it! Share it to your friends and learn new things together.
Transcript

Carbonate Aggregate in Concrete
Kejin Wang, Principal InvestigatorDepartment of Civil, Construction, Environmental Engineering
Institute of Transportation Iowa State University
May 2015
Research ProjectFinal Report 2015-14

To request this document in an alternative format call 651-366-4718 or 1-800-657-3774 (Greater Minnesota) or email your request to [email protected]. Please request at least one week in advance.

Technical Report Documentation Page 1. Report No. 2. 3. Recipients Accession No.
MN/RC 2015-14 4. Title and Subtitle 5. Report Date
Carbonate Aggregate in Concrete May 2015 6.
7. Author(s) 8. Performing Organization Report No.
Fatih Bektas, Kejin Wang, and Jiaxi Ren 9. Performing Organization Name and Address 10. Project/Task/Work Unit No.
Institute for Transportation Iowa State University 2711 S. Loop Drive, Suite 4700 Ames, Iowa 50011-8664
11. Contract (C) or Grant (G) No.
(c) 99004 (wo) 4 12. Sponsoring Organization Name and Address 13. Type of Report and Period Covered
Minnesota Department of Transportation Research Services & Library 395 John Ireland Boulevard, MS 330 St. Paul, Minnesota 55155-1899
Final Report 14. Sponsoring Agency Code
15. Supplementary Notes
http://www.lrrb.org/pdf/201514.pdf 16. Abstract (Limit: 250 words)
The current Minnesota Department of Transportation specification for coarse aggregate to be used in concrete pavements is based on either a maximum absorption of 1.75% (for Class B aggregate) or a maximum carbonate content of 30% by weight (for Class C aggregate). There is a concern that these specified limitations may reject potentially acceptable aggregates. This study is designed to evaluate the available methods for effectively characterizing the freeze-thaw (F-T) durability of aggregates. In this study, aggregates from 15 different sources in Minnesota were investigated. The experimental program included measuring the carbonate content, absorption, desorption, specific gravity, Iowa pore indices (i.e., primary pore index [PPI] and secondary pore index [SPI]), and pore size distribution of the carbonate and non-carbonate fractions. The results indicate that carbonate aggregates generally have higher absorption, lower specific gravity, and higher PPI and SPI than non-carbonate aggregates. Although there is no direct correlation between absorption, carbonate content, and SPI, a combination of high specific gravity (>2.60) and low absorption (<1.75%) often indicates a low SPI value. Carbonate aggregates generally have a much finer pore structure than non-carbonate aggregates, and the characteristics of their pore size distributions are clearly different. PPI correlates well with pores in the size range of 0.1–100 µm, and SPI correlates well with pores in the size range of 0.01–1 µm. Further reshas the most significant effect on aggregate F-T which an aggregate will be truly F-T durable.
ed
arch is necessary to identify the critical pore size range that urability and to determine the critical SPI value below
17. Document Analysis/Descriptors 18. Availability Statement
Aggregate tests, Aggregates, Freeze thaw durability, Gravel roads, Low volume roads, Surface treating
No restrictions. Document available from: National Technical Information Services, Alexandria, Virginia 22312
19. Security Class (this report) 20. Security Class (this page) 21. No. of Pages 22. Price
Unclassified Unclassified 66

Carbonate Aggregate in Concrete
Final Report
Prepared by: Fatih Bektas Kejin Wang
Jiaxi Ren Department of Civil, Construction, and Environmental Engineering
Institute for Transportation Iowa State University
May 2015
Published by: Minnesota Department of Transportation
Research Services & Library 395 John Ireland Boulevard, MS 330
St. Paul, Minnesota 55155-1899
This report represents the results of research conducted by the authors and does not necessarily represent the views or policies of the Minnesota Department of Transportation and Iowa State University. This report does not contain a standard or specified technique.
The authors and the Minnesota Department of Transportation and Iowa State University do not endorse products or manufacturers. Any trade or manufacturers’ names that may appear herein do so solely because they are considered essential to this report.

Acknowledgments
The researchers would like to acknowledge the Minnesota Department of Transportation (MnDOT) for sponsoring this project. The authors would like to express their sincere appreciation to the project manager, technical advisory panel (TAP) members, and the various county personnel in Minnesota who assisted on this project.
The research was carried out at Iowa State University (ISU). Special thanks are given to the Iowa Department of Transportation for providing the Iowa Pore Index device, to student Qizhe Quo for his involvement in aggregate sorting, to student Xin Wang for helping on the pore structure data analysis, and finally to the laboratory manager, Bob Steffes, for his assistance in the ISU concrete research lab.

Table of Contents
CHAPTER 1 INTRODUCTION .....................................................................................................1
CHAPTER 2 LITERATURE REVIEW ..........................................................................................3
Deterioration Mechanism and Stresses Generated in Aggregate and Paste ........................3Conditions Required for Aggregate-Related F-T Damage ..................................................5
Effects of Aggregate Properties on Frost Resistance ...........................................................5
Commonly Used Test Methods for Concrete Aggregate .....................................................7
Iowa Test Methods for Aggregate F-T Durability .............................................................13
Acceptance Criteria for F-T–Durable Aggregate ..............................................................17
Concluding Remarks ..........................................................................................................19
CHAPTER 3 TEST METHODS AND EXPERIMENTAL DESIGN ..........................................21
Aggregates .........................................................................................................................21Carbonate Particle Content ................................................................................................22
Specific Gravity (Relative Density) and Absorption .........................................................23Iowa Pore Index ................................................................
................................ .................24Mercury Intrusion Porosimetry ..........................................................................................24
CHAPTER 4 TEST RESULTS AND ANALYSIS .......................................................................26
Carbonate Content .............................................................................................................27Absorption..........................................................................................................................27
Iowa Pore Index Test Results ............................................................................................31
Relationship between Aggregate Properties and Iowa Pore Index Parameters .................33
CHAPTER 5 MERCURY INTRUSION POROSIMETRY DATA AND ANALYSIS ...............38
CHAPTER 6 SUMMARY, CONCLUSIONS, AND RECOMMENDATIONS ..........................50
REFERENCES ..............................................................................................................................53

List of Figures
Figure 2.1. Frost Damage Associated with Concrete Aggregate: D-cracking at a Pavement Joint Intersection (left) and Fractured Carbonate Aggregate (right) (Koubaa et al. 1997) .............................................................................................................3
Figure 2.2. Degree of Saturation Attained by Different Aggregates at Various Humidities (Verbeck and Landgree 1960) .............................................................................................7
Figure 2.3. Iowa Pore Index Apparatus and Control Panel ...........................................................13Figure 2.4. Dolomite Peak Shift Identified by XRD (Dawson 2011) ............................................15
Figure 2.5. Relationship between Aggregate Quality Number and Alumina (Dawson 2011) ......16
Figure 3.1. Origins of the Aggregates Investigated in the Study ...................................................21
Figure 3.2. Light-Colored Particles are Hand Picked ....................................................................23
Figure 3.3. Carbonates React with Acid Solution..........................................................................23
Figure 3.4. Cross-Sectional View of a Mercury Penetrometer (Micromeritics 2015) ...................25
Figure 4.1. Carbonate Percentage of the Aggregate Sources Tested .............................................27
Figure 4.2. Water Absorption of the Bulk Aggregates Tested ......................................................28
Figure 4.3. Water Absorption of the Sorted Aggregates ...............................................................28
Figure 4.4. Absorption Curves of Carbonate Aggregates ..............................................................30
Figure 4.5. Absorption Curves of Non-Carbonate Aggregate .......................................................30
Figure 4.6. Desorption Curves of Carbonate Aggregate ................................................................31
Figure 4.7. Desorption Curves of Non-Carbonate Aggregate .......................................................31
Figure 4.8. Results of the Iowa Pore Index Test—Primary Pore Index ........................................32
Figure 4.9. Results of the Iowa Pore Index Test—Secondary Pore Index ....................................32
Figure 4.10. Relationship between Total Loading (PPI+SPI) and Absorption .............................33
Figure 4.11. Relationship between PPI and Absorption ................................................................34
Figure 4.12. Relationship between SPI and Absorption ................................................................34
Figure 4.13. Relationship between SPI and Absorption with Data from Literature ......................35
Figure 4.14. Relationship between Absorption, Specific Gravity and SPI (as marked) from
the Present Study................................................................................................................36
Figure 4.15. Relationship between Absorption, Specific Gravity and SPI (as marked) from Literature ............................................................................................................................37
Figure 5.1. Cumulative Intrusion versus Pore Size (Specimen 56192-Carbonate) .......................38Figure 5.2. Incremental Intrusion versus Pore Size (Specimen 56192-Carbonate) .......................39
Figure 5.3. Pore Volume by MIP versus Aggregate Absorption by ASTM C 127 .......................42
Figure 5.4. Pore Volume versus Pore Area....................................................................................43
Figure 5.5. Pore Size Distribution of Aggregates Studied (C: Carbonate, NC: Non-
Carbonate) ..........................................................................................................................44Figure 5.6. Comparison of Pore Size Distributions (C: Carbonate, NC: Non-Carbonate) ............45Figure 5.7 Coefficient of Determinations Correlating the Pore Size and Iowa Pore Indices ........47
Figure 5.8. Comparison of Trends of Pore Size Distributions and Iowa Pore Index with
Pore Size Volumes of Non-Carbonates (left) and Iowa Pore Indices of Non-
Carbonates (right) ..............................................................................................................48Figure 5.9. Expected Durability Factor versus SPI........................................................................49
List of Tables
Table 2.1. Environmental simulation methods for evaluating aggregate F-T durability. ................8Table 2.2. Pore structure–related methods for evaluating aggregate F-T durability. ....................10Table 2.3. Mechanical tests for evaluating aggregate F-T durability. ...........................................11
Table 2.4. Chemistry/mineralogy tests for evaluating aggregate F-T durability. ..........................11
Table 2.5. Aggregate performance history evaluation from State DOTs (McLeod 2012). ...........18
Table 2.6. KDOT specifications limits for limestone aggregate in concrete (McLeod 2012). ......18
Table 2.7. WisDOT specification limits for aggregate in concrete (Williamson 2005). ...............19
Table 3.1. Aggregate sources with identification numbers designated by MnDOT. .....................22
Table 4.1. Specific gravity, water absorption, and pore index results. ..........................................26
Table 5.1. Aggregate pore surface area and porosity. ....................................................................40
Table 5.2. Aggregate pore size distribution. ..................................................................................41
Table 5.3. Critical aggregate pore size for F-T durability. ............................................................46
Executive Summary
The high-quality aggregate resources in Minnesota are being depleted rapidly. Natural aggregate (e.g., sand and gravel mined from glacial or alluvial deposits) identified as Class C aggregate constitutes the largest fraction of Minnesota’s reserves. The Minnesota Department of Transportation (MnDOT) specifies that coarse aggregate used for concrete pavement shall conform to one of the following classifications:
• Class A aggregate (i.e., crushed quarry or mine trap rock such as basalt, diabase, gabbro or related igneous rock types, quartzite, gneiss, or granite)
• Class B aggregate (i.e., crushed quarry or mine rock such as carbonates, rhyolite, schist) with a maximum absorption of 1.75%
• Class C aggregate (i.e., natural or partly crushed natural gravel) with a maximum carbonate content by weight of 30% (MnDOT 2014)
Although ensuring good concrete performance, these criteria, or specified limitations, may reject potentially acceptable aggregates. The specific objectives of this study are as follows:
• To characterize Minnesota’s aggregates having a range of carbonate contents using a simple, rapid test, such as the Iowa pore index test
• To relate the Iowa pore index values to other aggregate properties (e.g., pore structure, absorption) that are known to affect freeze-thaw (F-T) durability
• To reevaluate the current MnDOT specification limits on Class B and Class C aggregates to allow more sources of aggregate to be used in concrete construction
A literature search and various experiments were performed for this study. The literature review showed that various tests have been developed for the evaluation of concrete aggregate F-T durability, including (a) testing aggregate soundness under simulated environmental conditions, (b) assessing aggregate pore structure, (c) measuring aggregate mechanical properties, and (d) examining the chemical and mineralogical properties of aggregates. However, there is no single existing laboratory test that can adequately relate its results to the aggregate’s field performance. Use of combined test results, together with a history of field performance, to evaluate aggregate F-T durability is a common practice.
Iowa test methods for assessing aggregate F-T durability include the Iowa pore index test for pore structure, X-ray diffraction (XRD) and thermo-gravimetric analysis (TGA) tests for aggregate quality (grain size and calcite-dolomite transition), and the X-ray fluorescence (XRF) test for elemental components of carbonate aggregate (e.g., phosphorous and clay content). A combination of these test results is used to form a quality number for evaluation of the overall quality of an aggregate.
Fifteen aggregate sources from Minnesota were investigated: three were crushed carbonate rocks (i.e., 100% carbonate content), and the rest were crushed gravel with varying carbonate percentages. The experiments included measuring the carbonate content, absorption, desorption,

specific gravity, Iowa pore indices, and pore size distribution of the aggregates. The key findings are summarized as follows:
• Among the three 100% carbonate aggregates studied, only one bulk aggregate (ID 70006) had an absorption (3.2%) higher than the MnDOT-specified limit of 1.75%. The two other carbonate aggregates (ID 82002 and 79091) had lower absorption, primary pore index (PPI), and secondary pore index (SPI) values than natural gravel.
• Among all aggregates containing carbonate and non-carbonate fractions, two aggregates (ID 34002 and 56192) had carbonate contents higher than the MnDOT specified limit of 30%. Comparing carbonate and non-carbonate fractions, the carbonates always had higher absorption, lower specific gravity, higher PPI, and higher SPI values than non-carbonates.
• Except for aggregate source 70006, which is 100% carbonate, all the bulk aggregates studied had SPI values lower than 25, which indicates that these aggregates can be classified as having Class 3 durability (i.e., the aggregates will produce no deterioration in pavements on non-Interstate segments of the road system after 20 years and less than 5% deterioration of the joints after 25 years), according to the Iowa Department of Transportation materials specification for SPI values.
• There was a fairly good correlation between absorption and specific gravity, a very good correlation between absorption and the sum of PPI and SPI (R2=0.95, N=27), a good correlation between absorption and PPI (R2=0.93, N=27), and a fair correlation between absorption and SPI (R2=0.77, N=27). However, this absorption-SPI correlation deteriorates (R2=0.31, N=15) when the carbonate aggregates are analyzed in a separate group.
• There was no correlation between carbonate content and absorption/PPI/SPI of bulk aggregates, indicating that the use of an absorption limit as an aggregate acceptance criterion does not provide information on the amount of large or small pores. However, a combination of low absorption (<1.75%) and high specific gravity (i.e., >2.60) suggests a low SPI value, and it may indicate good durability performance.
• There were very good correlations between the total pore volumes measured by mercury intrusion porosimetry (MIP) and absorption/the sum of PPI and SPI. PPI correlates well with pores in the size range of 0.1–100 µm, and SPI correlates well with pores in the size range of 0.01–1 µm. (Note that the overlapping pore size range, 0.1–1 µm, might be caused by the water pressure, 35 psi, used in the current Iowa pore index test.)
• Carbonate aggregates generally had a much finer pore structure than non-carbonate aggregates, which was evidenced by a higher pore surface area for a given mercury intrusion volume and by a much higher volume of finer pores (0.01–10 µm) than non-carbonate aggregates.
• For carbonate aggregates, the most significant pore volume consisted of pores in the size range of 0.1–1µm. Pores in this size range often form a hump in the pore size distribution curve. Such a hump may have substantial effects on the aggregate’s F-T durability. For non-carbonate aggregate, the most significant pore volume consisted of pores >100 µm; the volumes of other pores were much less significant.

The following major recommendations are proposed based on the above findings:
• The Iowa pore index test is a simple, rapid, and effective test method, and it can be used for estimating the pore structure of aggregates. A high PPI value indicates a larger amount of large pores (0.1–100 µm), and a high SPI value indicates a larger amount of small pores (0.01–1 µm) in the tested aggregate. As a result, the Iowa pore index test can be used as a screening test for an initial evaluation of aggregate quality.
• The properties of the carbonate aggregates studied varied considerably. The quality of these carbonate portion aggregates may significantly affect their F-T performance in concrete. Therefore, the 30% carbonate content limit should be reevaluated in light of the performance of the carbonate fraction aggregates. That is, the aggregate containing more than a 30% carbonate portion might be used to produce F-T durable pavement if the carbonate portion aggregate has a good pore structure, low absorption, high specific gravity, and low SPI values. On the other hand, aggregate with less than a 30% carbonate portion might still be detrimental if the carbonate portion aggregate has a poor pore structure, high absorption, low specific gravity, and high SPI.
• A combination of high specific gravity (i.e., >2.60) and low absorption (<1.75%) indicates a low SPI value, and such a quadrant system may be used for assessing the F-T durability of aggregate after the relationship between SPI and F-T durability is further confirmed.
• Although the present study has confirmed that PPI/SPI measurements are related to the amount of large/small pores in the tested aggregates, it is still not clear which range of pore sizes may have the most significant effect on aggregate F-T durability. It is not certain whether an aggregate having high a SPI value is truly non-durable, and vice versa. Therefore, further F-T durability tests should be conducted for the same aggregates investigated in the present study so as to identify the critical pore size range that has the most significant effect on aggregate F-T durability, to confirm whether an aggregate having a high SPI value is truly non-durable, and to determine the critical SPI value below which an aggregate will be F-T durable.
1
Chapter 1 Introduction
The high-quality aggregate resources in Minnesota are being depleted rapidly. According to a report from the Minnesota Geological Survey (MGS), aggregate supplies for construction that meet present-day standards may be exhausted by 2029 (Southwick et al. 2000).
The aggregate industry in Minnesota mines materials of three types, given as follows:
• Crushed “crystalline” rock (e.g., chiefly granite, gneiss, quartzite, and basalt or trap rock), in the central, western, and northern parts of Minnesota, identified by the Minnesota Department of Transportation (MnDOT) as Class A coarse aggregate
• Crushed carbonate rock (e.g., limestone and dolomite), mainly in the metropolitan area and in southeastern Minnesota, identified by MnDOT as Class B coarse aggregate
• Natural aggregate (e.g., sand and gravel mined from glacial or alluvial deposits), identified by MnDOT as Class C aggregate, widespread across the state (Southwick et al. 2000)
Of these three aggregates, natural aggregate constitutes the largest fraction. Unfortunately, much of the natural aggregate in Minnesota is not accepted for use in pavements or superstructure because it contains a large portion of carbonate particles, which makes concrete susceptible to freeze-thaw (F-T) deterioration. MnDOT specifies that all fractions of the coarse aggregate used for concrete pavement shall meet one of the following requirements:
• Class A aggregate (i.e., crushed quarry or mine trap rock such as basalt, diabase, gabbro or related igneous rock types, quartzite, gneiss, or granite)
• Class B aggregate (i.e., crushed quarry or mine rock such as carbonates, rhyolite, schist) with a maximum absorption of 1.75%
• Class C aggregate (i.e., natural or partly crushed natural gravel) with a maximum carbonate by weight of 30% (MnDOT 2014)
Although ensuring good concrete performance, these criteria, or specified limitations, may have rejected potentially acceptable quality aggregates.
As aggregate resources decrease rapidly in Minnesota, it is now necessary for MnDOT to re-evaluate its aggregate acceptance criteria and to consider allowing more sources of aggregate to be used in concrete construction. Therefore, MnDOT is seeking a quick, reliable test method to effectively evaluate the F-T durability of aggregate, particularly crushed carbonate and natural gravel aggregates. The present research project was designed to reach this goal.
The specific objectives of this study are as follows:
• To characterize Minnesota’s aggregates with a range of carbonate content using the Iowa pore index test

2
• To relate Iowa pore index values and other aggregate properties (e.g., pore structure, absorption) that are known to affect F-T durability
• To re-evaluate the current MnDOT specification limits on Class B and Class C aggregates to allow more sources of aggregate to be used in concrete construction
This project report is organized as follows:
• Chapter 1 outlines the research problem with a brief background and defines the research objectives.
• Chapter 2 includes a literature review on aggregate-related F-T damage and test methods. • Chapter 3 presents information on the aggregate sources investigated and the test methods
used in the study. • Chapter 4 provides the test results of aggregate properties (e.g., specific gravity, absorption)
and the Iowa pore index method. The correlations between the pore index results and aggregate properties are discussed.
• Chapter 5 shows the test results of mercury intrusion porosimetry (MIP) and discusses the pore structure in relation to Iowa pore indices.
• Chapter 6 states the conclusions of this study and recommendations for future study.
Chapter 2 Literature Review
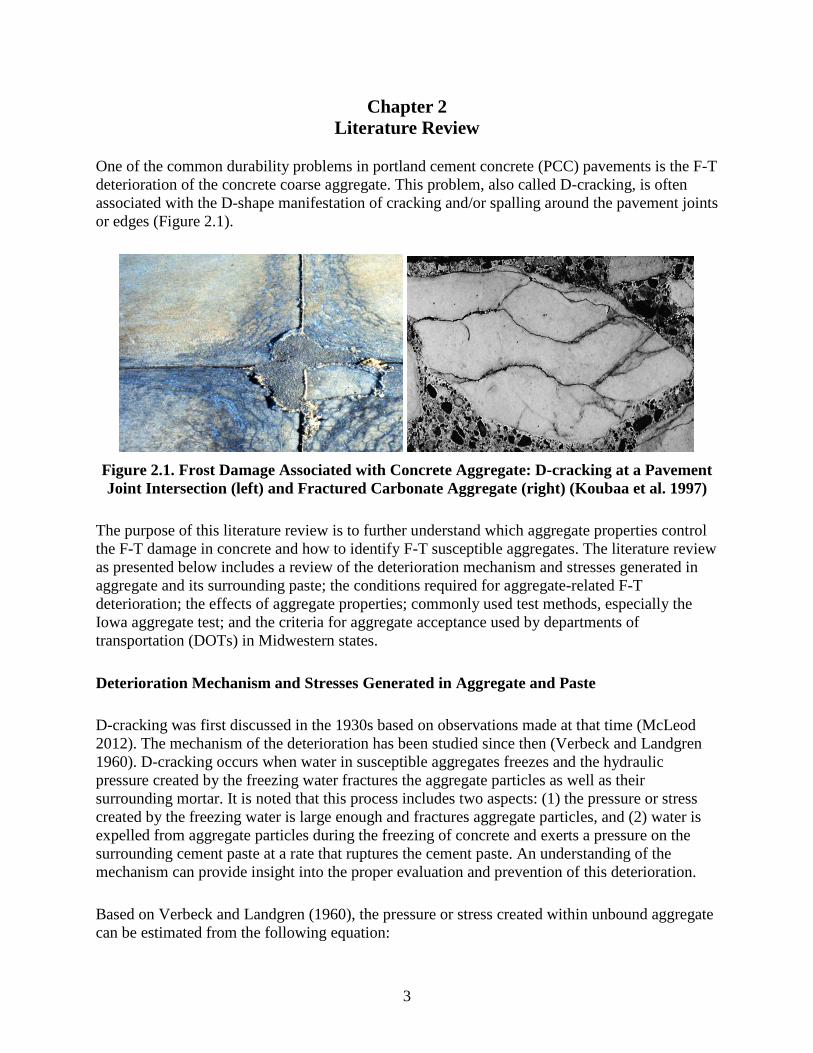
One of the common durability problems in portland cement concrete (PCC) pavements is the F-T deterioration of the concrete coarse aggregate. This problem, also called D-cracking, is often associated with the D-shape manifestation of cracking and/or spalling around the pavement joints or edges (Figure 2.1).
3
Figure 2.1. Frost Damage Associated with Concrete Aggregate: D-cracking at a Pavement Joint Intersection (left) and Fractured Carbonate Aggregate (right) (Koubaa et al. 1997)
The purpose of this literature review is to further understand which aggregate properties control the F-T damage in concrete and how to identify F-T susceptible aggregates. The literature review as presented below includes a review of the deterioration mechanism and stresses generated in aggregate and its surrounding paste; the conditions required for aggregate-related F-T deterioration; the effects of aggregate properties; commonly used test methods, especially the Iowa aggregate test; and the criteria for aggregate acceptance used by departments of transportation (DOTs) in Midwestern states.
Deterioration Mechanism and Stresses Generated in Aggregate and Paste
D-cracking was first discussed in the 1930s based on observations made at that time (McLeod 2012). The mechanism of the deterioration has been studied since then (Verbeck and Landgren 1960). D-cracking occurs when water in susceptible aggregates freezes and the hydraulic pressure created by the freezing water fractures the aggregate particles as well as their surrounding mortar. It is noted that this process includes two aspects: (1) the pressure or stress created by the freezing water is large enough and fractures aggregate particles, and (2) water is expelled from aggregate particles during the freezing of concrete and exerts a pressure on the surrounding cement paste at a rate that ruptures the cement paste. An understanding of the mechanism can provide insight into the proper evaluation and prevention of this deterioration.
Based on Verbeck and Landgren (1960), the pressure or stress created within unbound aggregate can be estimated from the following equation:
4
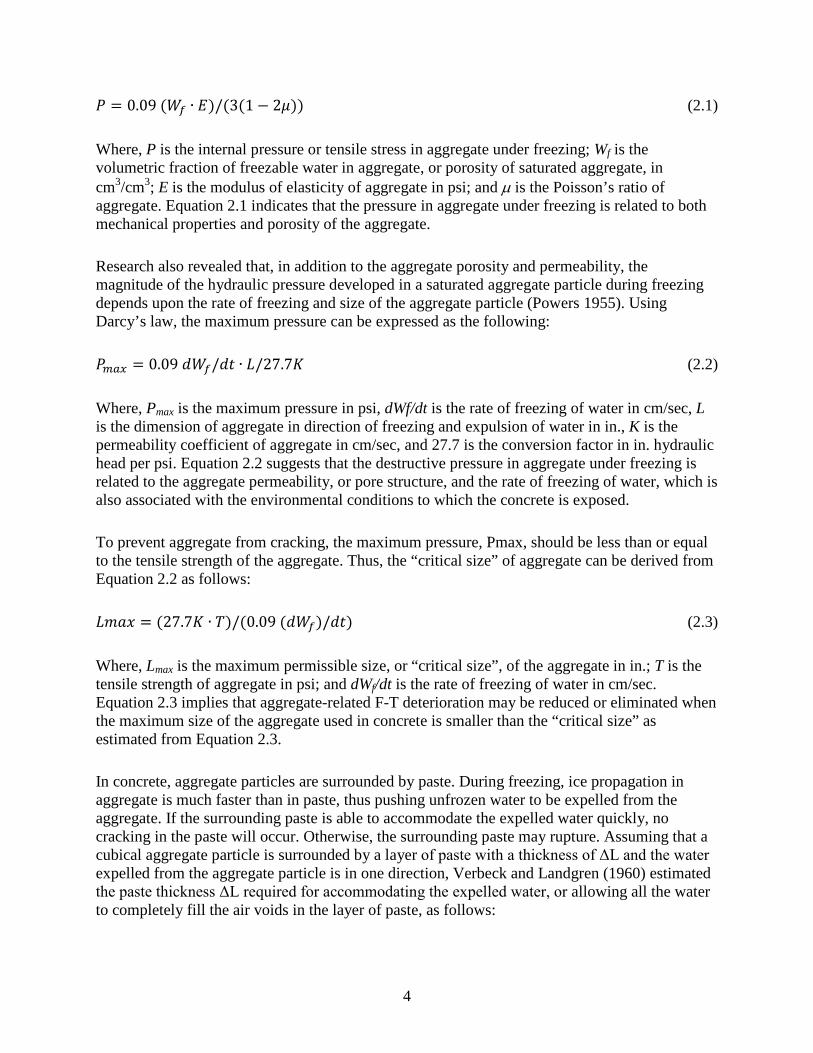
𝑃 = 0.09 (𝑊𝑓 ∙ 𝐸)/(3(1− 2𝜇)) (2.1)
Where, P is the internal pressure or tensile stress in aggregate under freezing; Wf is the volumetric fraction of freezable water in aggregate, or porosity of saturated aggregate, in cm3/cm3; E is the modulus of elasticity of aggregate in psi; and µ is the Poisson’s ratio of aggregate. Equation 2.1 indicates that the pressure in aggregate under freezing is related to both mechanical properties and porosity of the aggregate.
Research also revealed that, in addition to the aggregate porosity and permeability, the magnitude of the hydraulic pressure developed in a saturated aggregate particle during freezing depends upon the rate of freezing and size of the aggregate particle (Powers 1955). Using Darcy’s law, the maximum pressure can be expressed as the following:
𝑃𝑚𝑎𝑥 = 0.09 𝑑𝑊𝑓/𝑑𝑡 ∙ 𝐿/27.7𝐾 (2.2)
Where, Pmax is the maximum pressure in psi, dWf/dt is the rate of freezing of water in cm/sec, L is the dimension of aggregate in direction of freezing and expulsion of water in in., K is the permeability coefficient of aggregate in cm/sec, and 27.7 is the conversion factor in in. hydraulic head per psi. Equation 2.2 suggests that the destructive pressure in aggregate under freezing is related to the aggregate permeability, or pore structure, and the rate of freezing of water, which is also associated with the environmental conditions to which the concrete is exposed.
To prevent aggregate from cracking, the maximum pressure, Pmax, should be less than or equal to the tensile strength of the aggregate. Thus, the “critical size” of aggregate can be derived from Equation 2.2 as follows:
𝐿𝑚𝑎𝑥 = (27.7𝐾 ∙ 𝑇)/(0.09 (𝑑𝑊𝑓)/𝑑𝑡) (2.3)
Where, Lmax is the maximum permissible size, or “critical size”, of the aggregate in in.; T is the tensile strength of aggregate in psi; and dWf/dt is the rate of freezing of water in cm/sec. Equation 2.3 implies that aggregate-related F-T deterioration may be reduced or eliminated when the maximum size of the aggregate used in concrete is smaller than the “critical size” as estimated from Equation 2.3.
In concrete, aggregate particles are surrounded by paste. During freezing, ice propagation in aggregate is much faster than in paste, thus pushing unfrozen water to be expelled from the aggregate. If the surrounding paste is able to accommodate the expelled water quickly, no cracking in the paste will occur. Otherwise, the surrounding paste may rupture. Assuming that a cubical aggregate particle is surrounded by a layer of paste with a thickness of ΔL and the water expelled from the aggregate particle is in one direction, Verbeck and Landgren (1960) estimated the paste thickness ΔL required for accommodating the expelled water, or allowing all the water to completely fill the air voids in the layer of paste, as follows:

∆𝐿 𝑓 (2.4)
Wh
=
ere,
0
.
ΔL
09
(
is
𝑊
the
∙
di
𝐿)
s
/
t
5
anc
𝐴
e required for volumetric accommodation of expelled water in in., L is the dimension of aggregate cube in in., Wf is the volumetric fraction of freezable water in aggregate in cm3/cm3, and A is the air content of paste. Equation 2.4 implies that the paste failure is controlled by not only the size and porosity of the aggregate but also the amount/thickness and air content of the paste in concrete.
Conditions Required for Aggregate-Related F-T Damage
Existence of Susceptible Aggregate
As described in the next section, the key factors that determine the D-cracking susceptibility of aggregate are mineralogy, pore structure, and maximum size. Not all aggregates are detrimental. Concrete must contain a certain amount of accessible aggregate particles for D-cracking to be observed. Otherwise, localized pop-outs may be observed.
Critical Degree of Saturation
Concrete must be exposed to sufficient moisture to have F-T damage. Based on (Verbeck and Landgren 1960), the aggregate particle must reach critical saturation, 91.7%. A pavement slab is well exposed to moisture at the joints and at the bottom, especially when the drainage is not appropriately designed. Bottom-up cracking is commonly seen in concrete pavements, and the surface manifestation usually starts at the intersection of transverse and longitudinal joints because free moisture is mostly available there.
F-T Cycling
A critically saturated concrete must undergo repeated F-T cycles to show cracking. Schwartz (1987) reported that 5–10 years or longer may be required for visible D-cracking to form in concrete. The degree of F-T damage is often not only related to the number of F-T cycles, but also to the rate of freezing, the latter of which becomes more accentuated as the capillary pore size of aggregate decreases.
Effects of Aggregate Properties on Frost Resistance
Koubaa et al. (1997) and Davis (2011) have summarized the properties that are effective in the frost resistance of the aggregate, as follows:
• Particle Size: As presented previously, a large aggregate may be subjected to frost damage, but smaller particles of the same aggregate may not. This is because when concrete is under a freezing condition, the unfrozen water in the small particles can be expelled quickly without developing damage pressure. Reducing the maximum aggregate size is known to limit or
5

6
eliminate the frost damage (Janssen and Snyder 1994). However, it should be noted that there is no single “critical size” for an aggregate type because the F-T damage is dependent upon freezing rate, degree of saturation, and permeability of the aggregate.
• Pore Structure: Pore structure, including pore size, shape, and distribution, has been identified as the most influential property affecting the durability of all construction materials. Pores “significantly affect the strength of any material, and also determine absorption and permeability” (Rhodes and Mielenz 1946). Pore structure also dictates whether the aggregate can become critically saturated in drained and undrained conditions, thus controlling the aggregate’s D-cracking susceptibility. Verbeck and Landgree (1960) classified aggregates into three categories:
(i) Low-permeability aggregates – These aggregates, usually having low porosity (≤ 0.3%), are strong enough to sustain the stress resulting from freezing water within their elastic limit, thus causing no fracture.
(ii) Intermediate-permeability aggregates – These often have a significant portion of small pores (≤ 500 nanometers). The capillary forces in such small pores can cause the aggregates to get saturated easily and to hold water. At a certain rate of freezing, the water in the pores is difficult to move out, thus developing pressure and causing the aggregate particles to fracture.
(iii) High-permeability aggregates – These generally contain a large number of big pores, which permit easy entry and expulsion of water. During freezing, water is expelled from the aggregate without generating pressure inside of the aggregate.
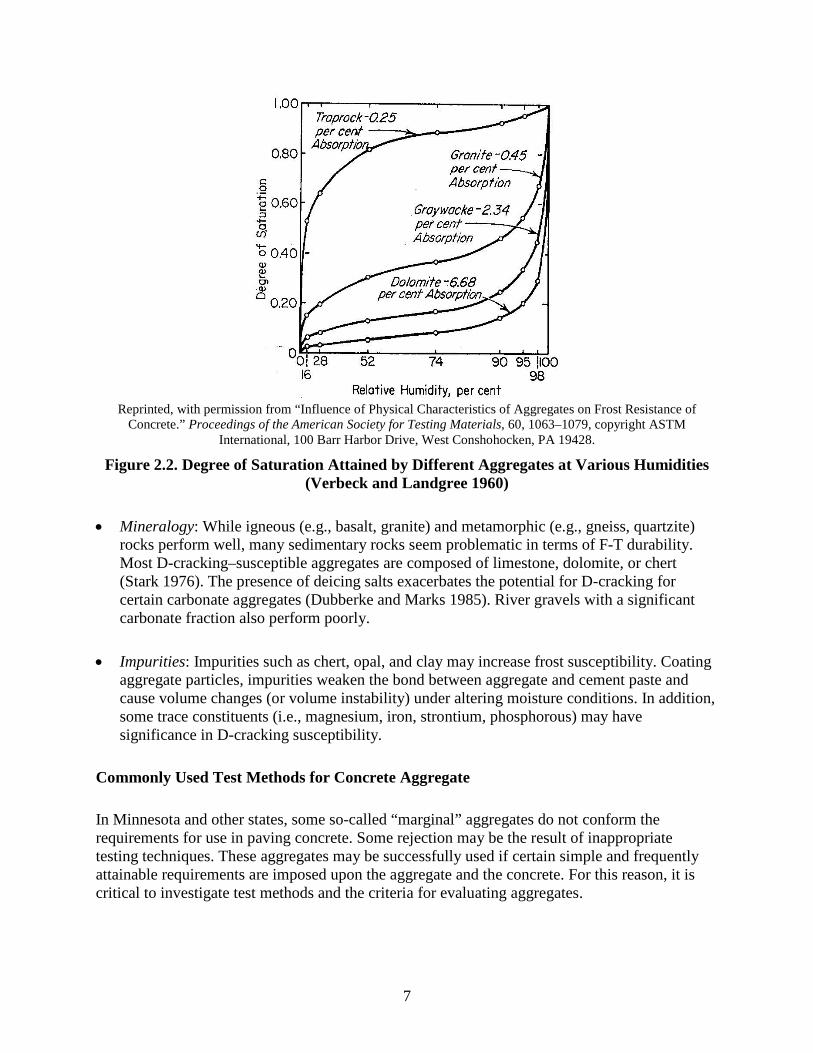
• Absorption: Absorption measurement is often used to provide insight into the pore structure or permeability of aggregate. Low absorption is a sign of low permeability, and these aggregates are generally F-T–resistant. As mentioned previously, high-absorption or high-permeability aggregates may also not be subjected to F-T damage due to quick water repelling. It is the fine pores, which absorb water more quickly and dry out more slowly, that often make the aggregate reach and stay in a critical saturation condition (Figure 2.2). It should be noted that different degrees of absorption reflect different pore structures of aggregates. An aggregate with a fine pore structure similar to trap rock would reach a high degree of saturation much more rapidly than an aggregate with the coarse pore structure of dolomite, even if the aggregates had the same porosity. That is, not only the absorption but also the rate of absorption/desorption may play a vital role in the aggregate-related F-T damage.
7
Reprinted, with permission from “Influence of Physical Characteristics of Aggregates on Frost Resistance of
Concrete.” Proceedings of the American Society for Testing Materials, 60, 1063–1079, copyright ASTM International, 100 Barr Harbor Drive, West Conshohocken, PA 19428.
Figure 2.2. Degree of Saturation Attained by Different Aggregates at Various Humidities (Verbeck and Landgree 1960)
• Mineralogy: While igneous (e.g., basalt, granite) and metamorphic (e.g., gneiss, quartzite) rocks perform well, many sedimentary rocks seem problematic in terms of F-T durability. Most D-cracking–susceptible aggregates are composed of limestone, dolomite, or chert (Stark 1976). The presence of deicing salts exacerbates the potential for D-cracking for certain carbonate aggregates (Dubberke and Marks 1985). River gravels with a significant carbonate fraction also perform poorly.
• Impurities: Impurities such as chert, opal, and clay may increase frost susceptibility. Coating aggregate particles, impurities weaken the bond between aggregate and cement paste and cause volume changes (or volume instability) under altering moisture conditions. In addition, some trace constituents (i.e., magnesium, iron, strontium, phosphorous) may have significance in D-cracking susceptibility.
Commonly Used Test Methods for Concrete Aggregate
In Minnesota and other states, some so-called “marginal” aggregates do not conform the requirements for use in paving concrete. Some rejection may be the result of inappropriate testing techniques. These aggregates may be successfully used if certain simple and frequently attainable requirements are imposed upon the aggregate and the concrete. For this reason, it is critical to investigate test methods and the criteria for evaluating aggregates.

8
Many researchers have reviewed the test methods for evaluating the F-T resistance of concrete aggregate (Koubaa 1997, Williamson 2005, Fowler et al. 2006, Dubberke 2012). The commonly used evaluation methods for aggregate F-T durability can be grouped into four categories, as follows:
• Environmental simulation (Table 2.1) • Pore structure–related methods (Table 2.2) • Mechanical tests (Table 2.3) • Chemistry and/or mineralogy tests (Table 2.4)
Table 2.1. Environmental simulation methods for evaluating aggregate F-T durability. Method (Specification)
Description Advantage Disadvantage
Soundness of F-T cycles are simulated by This is a simple and The pressure Aggregate (ASTM C immersing aggregate in sulfate quick test. It directly developed in 88, AASHTO T 104) solution at 70 ° F, drying the
aggregate at 230 ° F, and then reimmersing the aggregate in the sulfate solution. After required cycles are completed, the amount of aggregate lost is determined. Typical limits are 12% and 18% loss for sodium and magnesium sulfate, respectively.
tests aggregate and requires little sample preparation and test equipment.
aggregate results from expansion of salt crystallization, rather than F-T. The test results do not reflect the pore structure of the aggregate, and they are therefore used as an indicator only.
Unconfined 50 cycles of F-T with the aggregate The test serves as a The test is more time Aggregate F-T Test soaked for 24 hours; 25 cycles with good indicator for consuming than (AASHTO T103) the aggregate vacuum saturated with
water; and 16 cycles with the aggregate vacuum saturated with ethyl alcohol.
aggregate F-T durability.
sulfate soundness. The test condition is hard to control and the results are less reproducible.
Unconfined Aggregate is soaked in a 3% sodium The test has better Calcium and Aggregate F-T Test chloride solution for 24 hours prior precision and magnesium chloride (CSA A.23.2–24A) to testing, then drained and put
through 5 F-T cycles. correlation with field performance.
deicing salts may be significantly more aggressive than sodium chloride on specific rock types.
Rapid F-T Test Concrete beams made with the This is the most It may take (ASTM C 666, aggregate in question are subjected commonly used test for approximately two to AASHTO T 161) to F-T cycling between 40 ° F to 0 °
F. Specimen length change, material determining the F-T resistance of aggregates
five months to complete one test. The
Procedure A: in loss, and durability factor calculated in concrete. It is a direct F-T cycling condition water from relative dynamic modulus of
elasticity (ASTM C215) are determined.
F-T test and relates best to field performance of aggregates in PCC pavements.
used in the test is much more severe than many field conditions.
9
Method (Specification)
Description Advantage Disadvantage
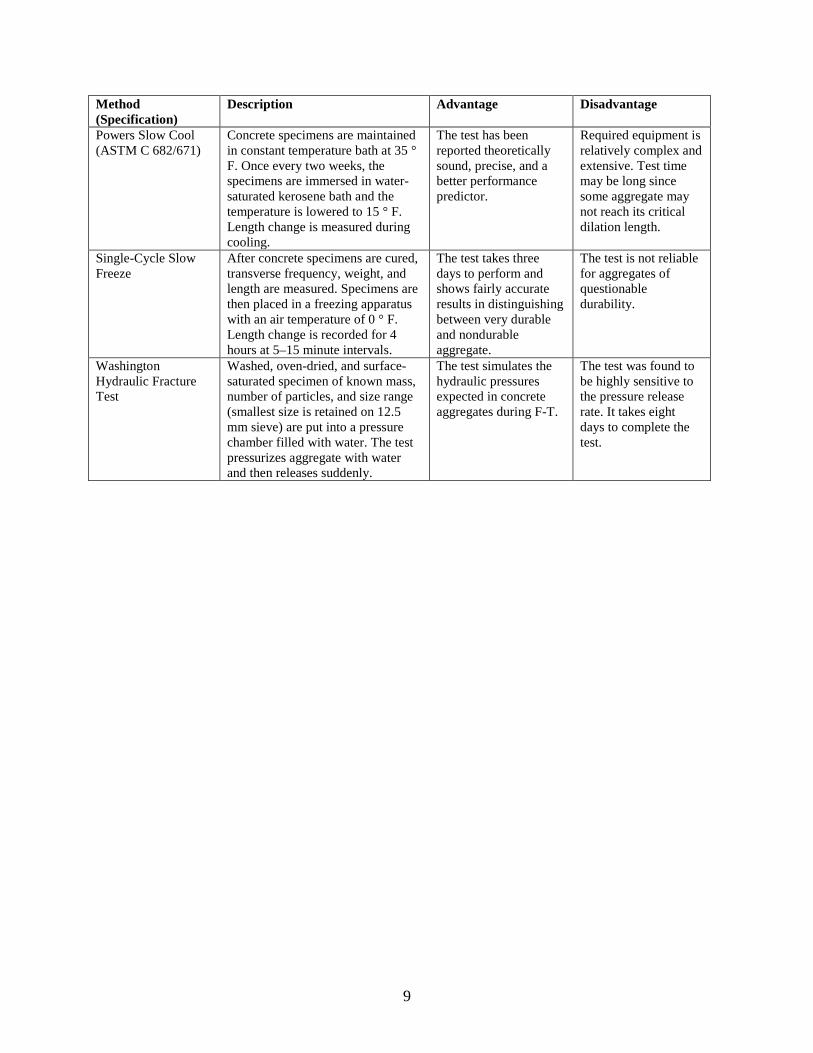
Powers Slow Cool (ASTM C 682/671)
Concrete specimens are maintained in constant temperature bath at 35 ° F. Once every two weeks, the specimens are immersed in water-saturated kerosene bath and the temperature is lowered to 15 ° F. Length change is measured during cooling.
The test has been reported theoretically sound, precise, and a better performance predictor.
Required equipment is relatively complex and extensive. Test time may be long since some aggregate may not reach its critical dilation length.
Single-Cycle Slow After concrete specimens are cured, The test takes three The test is not reliable Freeze transverse frequency, weight, and
length are measured. Specimens are then placed in a freezing apparatus with an air temperature of 0 ° F. Length change is recorded for 4 hours at 5–15 minute intervals.
days to perform and shows fairly accurate results in distinguishing between very durable and nondurable aggregate.
for aggregates of questionable durability.
Washington Hydraulic Fracture Test
Washed, oven-dried, and surface-saturated specimen of known mass, number of particles, and size range (smallest size is retained on 12.5 mm sieve) are put into a pressure chamber filled with water. The test pressurizes aggregate with water and then releases suddenly.
The test simulates the hydraulic pressures expected in concrete aggregates during F-T.
The test was found to be highly sensitive to the pressure release rate. It takes eight days to complete the test.

10
Table 2.2. Pore structure–related methods for evaluating aggregate F-T durability. Method (Specification) Description Advantage Disadvantage Iowa Pore Index Test Water is injected into the
aggregate with pressure, and the water absorbed in 15 minutes after the first minute is recorded. The result is considered to represent the water absorbed in the micropores.
The test provides a good indication of micropores in aggregate, which would be deleterious. The test is simple and quick.
The single test result doesn’t ensure the aggregate field performance.
Absorption (ASTM C 128)
The test measures the amount of water (in percentage) absorbed by aggregate from dry condition to saturated surface dry (SSD) condition.
The test provides a good indication of aggregate porosity and water retaining ability.
The test doesn't capture the characteristics of capillary pores, and the results tend to be overly conservative in identifying durable and potentially nondurable aggregates.
Absorption -desorption Test (PCA Method)
The absorption is measured by the difference between SSD and oven-dry weights of 32 mm aggregate slices. The adsorption is the weight gain obtained from 1.6 mm aggregate slices that are vacuum-oven-dried and then subjected to a 92% rehydration (RH) for one day. The results are presented in the percentage of the oven-dry weight.
The test provides a good indication of aggregate structure (size and connectivity) and permeability.
The test doesn't capture the rate of absorption/desorption of aggregate. It also doesn't directly measure pore structure.
Tube Suction Test The test monitors the capillary rise of moisture in a cylinder of compacted aggregate. A probe is used to measure the dielectric constant at the surface of the sample. The measurement is related to the unbound water in the sample. The amount of unbound water present is used to predict the F-T performance of the aggregate tested.
The measure of the unbound water in the aggregate sample. The amount of unbound water present is used to predict the freezing and thawing performance of the aggregate tested.
The test is limited to marginal aggregates only. It doesn't directly measure the F-T performance of aggregate but measures dielectric value of the tested sample. The test results are greatly affected by environmental conditions, such as pressure and temperature.

11
Table 2.3. Mechanical tests for evaluating aggregate F-T durability. Method (Specification) Description Advantage Disadvantage Los Angeles Abrasion Test (ASMT C 131)
The test consists of placing an aggregate sample in a steel drum along with 6–12 steel spheres weighing approximately 420 g each. The steel drum is then rotated for 500 revolutions. The weight loss of the sample is measured before and after the abrasion.
The test result may be closely related to mineral and mechanical properties (such as grain size, porosity, strength, and crushability) of the aggregate. It is a good indicator of overall aggregate quality (Kahraman and Toraman 2008).
The test can only be used with coarse, dry aggregate. The test is simple but time consuming. It doesn't directly measure F-T performance of aggregates.
Aggregate Crushing Values (British Standard 812-110)
Aggregate strength needs to be assessed for aggregates that are to be used in high-strength concrete.
The test has been used extensively to determine the relative strength of graded concrete aggregates.
The test may not always reflect the strength of the concrete in which the aggregate is placed.
Table 2.4. Chemistry/mineralogy tests for evaluating aggregate F-T durability. Method (Specification) Description Advantage Disadvantage Petrographic Examination of Aggregates for Concrete (ASTM C 295)
It can provide information concerning the physical and chemical characteristics of the aggregate as well as the relative amounts of the aggregate’s constituents, including deleterious constituents, such as clay, dirt, etc.
It is useful for examining vital aggregate characteristics relating to durability, especially those associated with alkali-aggregate reactivity (AAR).
The test operation requires skill and experience. The results are affected by personal interpretation.
Thermo-gravimetric Analysis (TGA)
The test measures weight changes of a sample due to its chemical structure decomposition under an increasing temperature in a controlled atmosphere.
It is a rapid testing method for tracking some specific minerals, such as calcite and magnesium, and for identifying faulty carbonates in gravels susceptible to salt.
Requirements for equipment and operation experience are high, and it is relatively expensive.
X-Ray Fluorescence (XRF) and X-Ray Diffraction (XRD)
XRF is an elemental analysis that determines the bulk composition of a material. XRD determines the mineral composition of aggregate based on the spacing of atoms in the aggregate.
The test provides reliable information on particular compositions in aggregate, which help identify undesirable constituents, such as clay by alumina and dolomite quality by XRD peak shift.
Requirements for equipment and operation experience are high, and it is relatively expensive.
12
In Tables 2.1 through 2.4, the advantages and disadvantages of these test methods are summarized. The following should be noted:
• The sulfate soundness test is one of the most widely used aggregate qualification tests in North America. Thirty of 43 states reported using the AASHTO T 104 version of this test (Hanna et al. 2003). Many researchers have shown that the sulfate soundness test provides a good indicator of aggregate performance, while others reported that the test does not necessarily reflect field performance because it does not adequately model the actual field conditions of aggregate (Bloem 1966, Senior and Rogers 1991). Some researchers have suggested that the soundness tests can be used for accepting but not for rejecting aggregate (Bloem 1966).
• The absorption test is a very commonly used simple and quick test that reflects the pore structure of aggregate. Research has shown that 82% of aggregates with 2% or higher absorption were unsound according to sodium sulfate soundness results, and 100% of aggregates with an absorption value of 4% were unsound according to sodium sulfate soundness results (Woolf 1927, Fowler et al. 2006). However, there is no clear correlation between absorption and the sodium sulfate soundness test. The absorption test is not sufficient to capture the characteristics (such as size and distribution) of capillary pores that are important for deicing chemical reaction and F-T deterioration. The test results are usually used only as aggregate F-T durability indicators.
• The Iowa pore index test provides insight into aggregate pore structure. It especially evaluates the fine pores that are closely related to aggregate F-T durability. The test is relatively simple and quick, and the device is relatively cheap. Many researchers/engineers have found a good relationship between the test results and aggregate field performance, while some do not. Although considering it a good test, Iowa doesn’t judge aggregate performance based on the single test result but combines the test with other tests, such as aggregate chemistry and mineralogy analyses. (Detailed information on Iowa aggregate test methods is presented in the following section.)
• The rapid F-T test (ASTM C 666 or AASHTO T 161) is another commonly used test for determining the F-T resistance of aggregates in concrete. Although this test better simulates the confining nature of mortar on aggregate, the F-T cycle is much more severe than field F-T conditions, and the aggregate evaluations may take nearly five months to complete. The test requires specific equipment to perform. More importantly, no criteria have been established for the acceptance or rejection of aggregates in the ASTM or AASHTO standards.
• The chemistry and mineralogy analyses can greatly help identify the impurities and specific minerals that may be susceptible to F-T cycles in the presence of salts. The Iowa Department of Transportation (Iowa DOT) recommends that such tests be performed together with the Iowa pore index test.

13
Iowa Test Methods for Aggregate F-T Durability
Types of aggregate that are common to Iowa and attract attention in terms of F-T durability are limestone (CaCO3), dolomite (CaMg(CO3)2), and gravel with a carbonate fraction. F-T deterioration associated with these aggregates has been observed starting as joint staining and progressing as fractures at the transverse joints. Research has suggested that the F-T damage is related to the pore system and clay content of the aggregate and chemical reactions due to deicing salts. The Iowa DOT uses an overall quality number that combines the results of the Iowa pore index test, which measures the pore system; XRF, which determines chemistry; and XRD, which provides information on mineralogy (Dawson 2011).
Iowa Pore Index Test
D-cracking of portland cement concrete pavement in Iowa has been recognized since the late 1950s. The problem had been linked to limestone coarse aggregates but could not be identified by any test available at that time. ASTM C 666 Method B failed to identify some problematic aggregates and in some cases gave false negatives where good field performance existed. In the 1970s, Dubberke developed a simple aggregate test (i.e., Iowa pore index test) to evaluate the aggregate pore system (Figure 2.3).
Figure 2.3. Iowa Pore Index Apparatus and Control Panel

14
This test was intended to model the water absorbed in the micropores. In this test, water is pushed into aggregate under 35 psi pressure. The amount of water that fills the larger voids (i.e., macropores) in the aggregate during a very brief interval (1 minute) from the start of the test is termed the “primary load”. Then the water absorbed in the next 15 minutes is recorded. The water absorbed during this time, termed the “secondary load”, represents the water absorbed in the micropores, which are closely associated with F-T durability (Myers and Dubberke 1980). Aggregates having a secondary load greater than 27 mL are believed to have poor F-T durability or have D-cracking susceptibility. The test is quick and simple. After testing aggregates with 10 or more years of service life, Myers and Dubberke (1980) concluded that the pore index test is sufficiently reliable to determine the D-cracking potential of limestone aggregates in all but a few cases where marginal results are obtained.
Since the Iowa pore index method was developed, some states have adopted (i.e., Kentucky, Michigan) or seriously evaluated (i.e., Illinois, Missouri, Minnesota) it. Thompson et al. (1980) reported that there was a strong correlation between Iowa pore index test results and aggregate performance in Illinois. Furthermore, the same group modified the Iowa pore index test and determined the degrees of saturation for varying pressures from the total aggregate porosity and the total amount of water penetrating the aggregates at each pressure; the researchers claimed that this critical degree of saturation might be a better indexing. They also suggested a supplementary strength test that could be used in conjunction with the pore index test in order to better identify durable aggregates (Olsen et al. 1983).
Shakoor and Scholer (1985) tested 30 aggregate samples using the Iowa pore index test and, based on the aggregate field performances, found that the test was reliable. Koubaa and Snyder (1996) examined a variety of pavement sections for D-cracking performance and tested the coarse aggregates used in those sections in the laboratory employing the Iowa pore index test and found a strong correlation between the test results and field performance for carbonate aggregates. The authors also tested two gravel sources with a carbonate fraction and found the following: while the total aggregates passed the test, matching their field performance, the carbonate fractions failed the 27 mL secondary load criterion. Richardson (2009) developed regression models for F-T durability, including Iowa pore index value as one of the variables. He found that an Iowa pore index value of 29 was needed to achieve a durability factor of 75 obtained from ASTM C 666 and proposed a limit that coincides with the historical limit.
In recently published work, Davis (2011) studied the effect of particle size and sample preparation on the Iowa pore index test in order to reduce the inconsistencies in the test results when predicting the F-T durability of an aggregate. A constant water fill time and agitation of the pot have been proposed. Furthermore, a size correction factor has been proposed so that actual aggregate size could be tested. It was also concluded that the same sample could be re-dried and re-tested.
X-Ray Diffraction
The pore size of carbonate aggregate strongly correlates with its grain size (Dubberke 1997). A fine-grained (approximately 25 µm diameter) carbonate aggregate generally has short crystal

15
interlock between its pores (10–15 µm). Crystallites and crystals in fine-grained carbonate aggregates can completely lose their interlock (particularly when deicing salts are used) and then become F-T–susceptible. Deicing salts have an extremely deleterious effect on these carbonates, and they increase the osmotic pressure, which results in expansion and the breakdown of aggregate particles (Koubaa et al. 1997).
The X-ray diffraction (XRD) is an easy, fast, and convenient test for determining the major and minor compounds of an aggregate sample by measuring the spacing of the crystallographic planes. XRD was used earlier by Mayo (1978) to determine the amounts of dolomite, limestone, and quartz and the calcite-dolomite ratio. Dubberke and Marks (1989) reported that dolomitic aggregates that yield a d-spacing greater than 2.899 are generally nondurable. Figure 2.4 shows the dolomite peak shift identified by XRD.
Figure 2.4. Dolomite Peak Shift Identified by XRD (Dawson 2011)
Currently, the Iowa DOT performs XRD tests for aggregate quality evaluation. Based on Dawson (2011), dolomite quality is determined by XRD peak shifts of 2.900 or greater. The greater the peak shift, the lower the quality (less stable) the dolomite mineralogy. Elevated sulfur levels resulting from microcrystalline pyrite (FeS2) are extremely significant in aggregates with high dolomite fraction percentages. The more sulfur, the lower the quality.

16
X-Ray Fluorescence
X-ray fluorescence (XRF) is used to determine the elemental components of carbonate aggregates. It can also be used to quantify the minor, major, and selected trace elements present in aggregate samples. Dubberke and Marks (1985) concluded that Iowa limestone aggregates with large, open pore structures and aggregates with a strontium content below 0.013% and a phosphorous content below 0.010% are not susceptible to D-cracking. Limestone with a strontium content of more than 0.050% is expected to perform poorly. Dubberke and Marks (1985) related F-T deterioration to the presence of these trace elements, which might contribute to chemical reactions that alter and weaken the crystalline structure of the carbonate aggregate and the cement paste.
Besides aggregate mineralogical features, the amount of clay in aggregate also significantly affects the aggregate durability. While coating the aggregate surfaces, the fine clay particles not only reduce the bond between aggregate particles and cement paste but also alter the chemistry of the concrete system, which in turn adversely influences cement hydration and concrete durability. Clay content in aggregate can also be estimated based on the alumina content obtained from an XRF test. As shown in Figure 2.5, the Iowa DOT has established a relationship between aggregate quality number and alumina content in aggregate. The higher the alumina content, the higher aggregate quality number, which suggests a lower F-T resistance for the aggregate.
Figure 2.5. Relationship between Aggregate Quality Number and Alumina (Dawson 2011)
Thermo-Gravimetric Analysis
Dubberke and Marks (1994) investigated whether thermo-gravimetric analysis (TGA) can be used to predict the F-T durability of carbonate aggregates. They tested 800 specimens, 49 of which had field records at that time. The authors found that the TGA slopes prior to the calcite and dolomite transition yield a good correlation with field performance of carbonate aggregates.

17
The dolomite pre-transition slope could be used for characterizing dolomites. The calcite pre-transition slope and/or percent non-carbonate could be used to characterize the calcites. However, Koubaa et al. (1997) pointed out that TGA does not consider the particle strength, the effects of different aggregate types in one sample, or the effects on the mortar-aggregate system.
Quality Number for Aggregate F-T Durability
Dawson (2011) states that the key factors for aggregate durability include (a) stability of minerals that form the aggregate, (b) clay content of the aggregate, and (c) capillary pores available for chemical reaction and F-T deterioration. The Iowa DOT currently evaluates these three factors through the following:
• Examining the limestone and dolomite fractions for chemistry and mineralogy using XRD/TGA
• Measuring the clay content of the aggregate using XRF (alumina quality number) • Determining the pore structure (pore size and volume) using the Iowa pore index test (pore
index quality number)
Then, these three quality numbers are combined to generate an overall quality number. The combination is not based on straight percentages but rather on how dolomitic the aggregate is, because experience has shown that the deterioration occurs in intermediate dolomites. Pure limestone is evaluated based on 50% pore index and 50% alumina quality numbers; intermediate dolomites are evaluated on 50% XRF-XRD, 25% pore index, and 25% alumina quality numbers; and for pure dolomites all three factors are weighted equally (Dawson 2011).
Acceptance Criteria for F-T–Durable Aggregate
McLeod (2012) has reviewed the acceptance criteria for coarse aggregate in 13 state DOTs in the Midwest. As shown in Table 2.5, five states use the performance history of an aggregate source in concrete pavements as an acceptance criterion.
Four of the five states (Indiana, Minnesota, Nebraska, and Wisconsin) allow the rejection of aggregates based on pavement performance, including test results, the nature of the deposit, and the behavior of the rock under natural exposure conditions. Iowa uses performance history as the primary criterion for the acceptance of aggregate in PCC pavements.

18
Table 2.5. Aggregate performance history evaluation from State DOTs (McLeod 2012).
State Specification
Number Performance History Evaluation Statement Colorado 703.02 No Illinois 1004.02 No Indiana 904.03 Coarse aggregate may be rejected based on previous performance service
record. Iowa 4115.01
Materials IM 409
Approval by service history: aggregate will be considered durable when it does not contribute to the premature deterioration in concrete. Durability classes will be assigned on the basis of qualifying performance in air-entrained pavements of appropriate age.
Michigan 902.03 No Minnesota 3137 To determine the suitability of any aggregate, the engineer may consider the
results of laboratory tests, the behavior of the rock under natural exposure conditions, the behavior of portland cement concrete in which aggregate from the same or similar geological formations or deposits has been used, or such other tests or criteria as may be deemed appropriate.
Missouri 1005 No Nebraska 1033.02 Aggregate shall be evaluated based upon its past performance in concrete
pavement and in laboratory test results. North Dakota 816.02 No Ohio 703.02 No Oklahoma 701.06 No South Dakota 820.1 No Wisconsin 501.2.5.4.3 The department may prohibit using crushed stone from limestone/dolomite
deposits having thinly bedded strata, or strata of a shale nature; it may also prohibit using aggregates from deposits or formations known to produce unsound material.
The Kansas Department of Transportation (KDOT) aggregate durability specifications (McLeod 2012) are based on initial inspection of the quarry by geologists and sampling and testing of aggregate materials for prequalification. The tests required for evaluating aggregate durability are KTMR-21 Soundness and Modified Soundness of Aggregate by Freezing and Thawing, and KTMR-22 Resistance of Concrete to Freezing and Thawing where concrete beams are subjected to 300 cycles of F-T similarly to ASTM C 666. KDOT specifications define Class 1 and Class 2 aggregates as those that meet the criteria as indicated in Table 2.6. Once approved, production samples are regularly tested and must meet the testing requirements. All on-grade concrete is constructed using only Class 1 or Class 2 aggregate.
Table 2.6. KDOT specifications limits for limestone aggregate in concrete (McLeod 2012). Class 1 Class 2 Durability Factor (min.) 95 97 % Expansion (max.) 0.025 0.015 Modified Soundness (min.) 0.85 0.85
The Nebraska Department of Roads (NDOR) specifies that all classes of concrete with the exception of PR1 (Repair) and PR3 (Repair) shall have a durability factor not less than 70 and a
19
mass loss not greater than 5% after 300 F-T when tested in accordance with ASTM C 666, Procedure A.
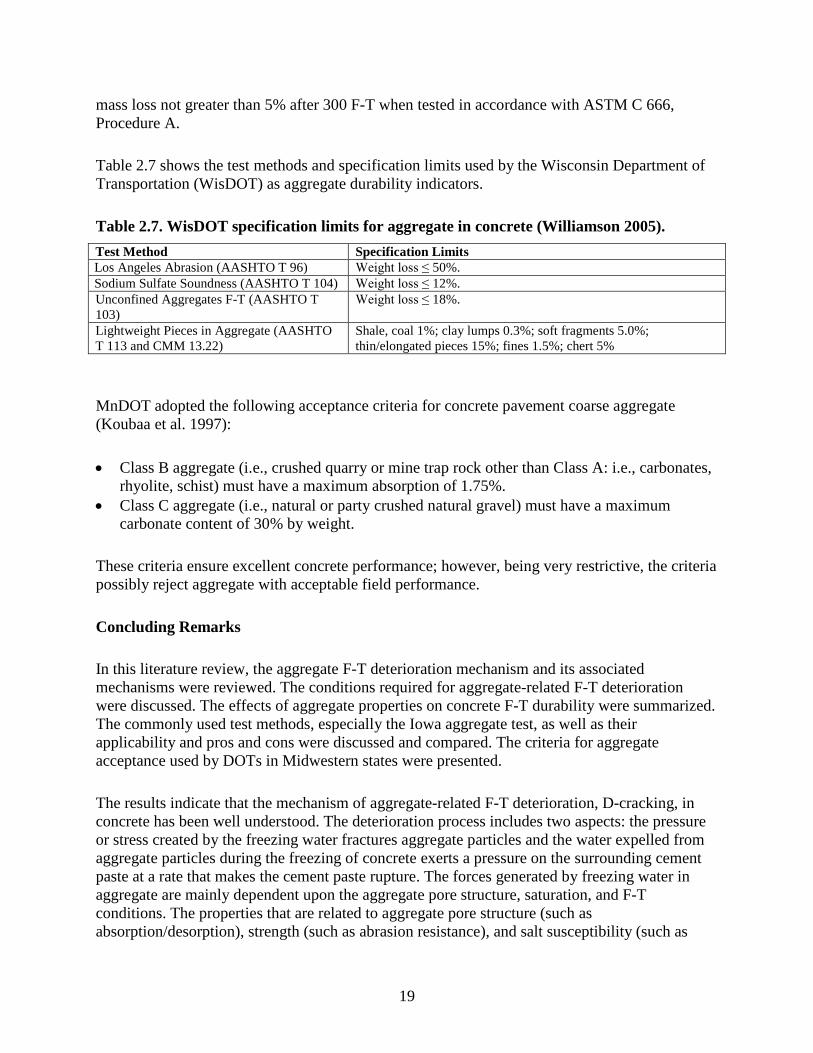
Table 2.7 shows the test methods and specification limits used by the Wisconsin Department of Transportation (WisDOT) as aggregate durability indicators.
Table 2.7. WisDOT specification limits for aggregate in concrete (Williamson 2005). Test Method Specification Limits Los Angeles Abrasion (AASHTO T 96) Weight loss ≤ 50%. Sodium Sulfate Soundness (AASHTO T 104) Weight loss ≤ 12%. Unconfined Aggregates F-T (AASHTO T 103)
Weight loss ≤ 18%.
Lightweight Pieces in Aggregate (AASHTO T 113 and CMM 13.22)
Shale, coal 1%; clay lumps 0.3%; soft fragments 5.0%; thin/elongated pieces 15%; fines 1.5%; chert 5%
MnDOT adopted the following acceptance criteria for concrete pavement coarse aggregate (Koubaa et al. 1997):
• Class B aggregate (i.e., crushed quarry or mine trap rock other than Class A: i.e., carbonates, rhyolite, schist) must have a maximum absorption of 1.75%.
• Class C aggregate (i.e., natural or party crushed natural gravel) must have a maximum carbonate content of 30% by weight.
These criteria ensure excellent concrete performance; however, being very restrictive, the criteria possibly reject aggregate with acceptable field performance.
Concluding Remarks
In this literature review, the aggregate F-T deterioration mechanism and its associated mechanisms were reviewed. The conditions required for aggregate-related F-T deterioration were discussed. The effects of aggregate properties on concrete F-T durability were summarized. The commonly used test methods, especially the Iowa aggregate test, as well as their applicability and pros and cons were discussed and compared. The criteria for aggregate acceptance used by DOTs in Midwestern states were presented.
The results indicate that the mechanism of aggregate-related F-T deterioration, D-cracking, in concrete has been well understood. The deterioration process includes two aspects: the pressure or stress created by the freezing water fractures aggregate particles and the water expelled from aggregate particles during the freezing of concrete exerts a pressure on the surrounding cement paste at a rate that makes the cement paste rupture. The forces generated by freezing water in aggregate are mainly dependent upon the aggregate pore structure, saturation, and F-T conditions. The properties that are related to aggregate pore structure (such as absorption/desorption), strength (such as abrasion resistance), and salt susceptibility (such as
20
chemical composition and mineralogy) directly affect the aggregate F-T resistance. Detailed pore structure identification can be done using mercury intrusion porosimetry which may not be cost effective in routine characterization testing. Iowa pore index test provides a simple estimation for aggregate pore structure that can be used as an indicator for aggregate F-T durability.

21
Chapter 3 Test Methods and Experimental Design
Aggregates
Aggregates from 15 sources were collected by MnDOT and transported to Iowa State University for testing. The geographic locations and the names of the sources are given in Figure 3.1 and Table 3.1, respectively. Aggregates designated with source numbers 70006, 79091, and 82002 are comprised of 100% crushed carbonate rocks, whereas the rest are crushed gravel with varying carbonate percentage.
Figure 3.1. Origins of the Aggregates Investigated in the Study

22
Table 3.1. Aggregate sources with identification numbers designated by MnDOT. Source ID No. Source Name 03081 Rollag Pit 03090 Rock Ridge 14074 Glyndon 19001 Fischer S&G 19109 Cemstone So. 34002 New London 56003 Mark S&G 56192 Morrell Pit 67001 Northern Con 70006 Bryan Rock 70008 Prior Lake S&G 79091 Hammons-Milestone 82001 Agg Ind - Nelson 82002 Larson - Gray Cloud 86001 South Haven
Carbonate Particle Content
Aggregates were sieved to collect the particles passing ¾” sieve and retaining on ½” sieve. It should be noted that all the tests (e.g., absorption, specific gravity, Iowa pore index) were performed on aggregate particles within this size range unless otherwise stated. The aggregates were then washed and dried for the sorting process. The sorting process includes three stages, as follows:
• Whitish-colored particles, possible carbonates, are separated visually (Figure 3.2). • Whitish-colored particles are first subjected to a hardness test: carbonate is a soft mineral and
a steel knife can easily scratch the rock. • The marginal/borderline particles are subjected to further testing (i.e., Fizz test). A weak
acidic solution makes carbonates bubble and fizz, because of the release of carbon dioxide as the carbonate dissolves. A 10% hydrochloric acid solution was used to further decide on the suspected particles (Figure 3.3.).

23
Figure 3.2. Light-Colored Particles are Hand Picked
Figure 3.3. Carbonates React with Acid Solution
Specific Gravity (Relative Density) and Absorption
Specific gravity and absorption of the aggregates (i.e., carbonates, non-carbonates, and bulk) were determined in accordance with ASTM C 127, Standard Test Method for Density, Relative Density (Specific Gravity), and Absorption of Coarse Aggregate. In addition to the standard procedure, absorption and desorption curves were plotted for a 24 hour period. For the former, dry aggregates were soaked in water, and moisture intake was plotted up to 24 hours; for the latter, surface-saturated dry aggregates were put in an oven at 105 ° C for drying, and moisture loss was recorded for 24 hours.

24
Iowa Pore Index
The Iowa pore index test was performed in accordance with Iowa 219-D, Method of Test for Determining the Pore Index of Aggregates (Iowa DOT 2000). The test was run for carbonate and non-carbonate fractions as well as for the bulk aggregate. The pore index apparatus is shown in Figure 2.3. The test method is summarized as follows:
• A sample of 4500 grams of oven-dried aggregate is placed in the sample pot and the pot is closed tightly.
• The three graduated cylinders are filled with water to the zero mark on the apparatus. The cylinder represents the primary load, secondary load, and system check.
• The test is started by the flow of water to the pot. The water pressure is 35 psi. The system runs automatically.
• After one minute, the valve of the primary graduated cylinder shuts off and the valve of the secondary graduated cylinder opens. After 14 minutes, secondary loading is completed and the valve of the third graduated cylinder opens. The system runs for another 15 minutes for checking. The water levels in each graduated cylinder are recorded in mL.
• The water is drained and the sample is taken out. • The reference pot expansion used in the calculations is determined by running the system
without aggregate in advance. •
𝑃
𝑟𝑖𝑚
The
𝑎𝑟
por
𝑦 𝑃
e
𝑜𝑟
in
𝑒
dex parameters are calculated as follows:
𝑠𝑎𝑚𝑝𝑙𝑒 𝑤𝑒𝑖𝑔ℎ𝑡 𝐼)𝑛𝑑 𝑒𝑥 (𝑃𝑃𝐼) = (1 𝑚𝑖𝑛𝑢𝑡𝑒 𝑟𝑒𝑎𝑑𝑖𝑛𝑔 − 𝑝
𝑜𝑡 𝑒𝑥𝑝𝑎𝑛𝑠𝑖𝑜𝑛) × (9000 ÷
𝑆
Mer
𝑒𝑐𝑜
cu
𝑛𝑑𝑎
ry
𝑟
I
𝑦
n
t
𝑃
ru
𝑜𝑟
s
𝑒
io
𝐼
n
𝑛𝑑
Po
𝑒
r
𝑥
o
(
s
𝑆
im
𝑃𝐼
e
)
try
=
(14 𝑚𝑖𝑛𝑢𝑡𝑒 𝑟𝑒𝑎𝑑𝑖𝑛𝑔) × (9000 ÷ 𝑠𝑎𝑚𝑝𝑙𝑒 𝑤𝑒𝑖𝑔ℎ𝑡)
(3.1)
(3.2)
The pore structure of the aggregates was determined using the MIP technique. A total of 27 samples (i.e., 15 carbonates and 12 non-carbonates) was tested. MIP uses only 5–15 grams of each specimen; therefore, the aggregates were crushed to pass the #4 sieve, and the fraction retained on the #8 sieve was utilized in testing.
Mercury porosimetry analysis is the progressive intrusion of mercury into a porous material (i.e., rock) under controlled pressures. Because mercury does not wet the aggregate and will not spontaneously penetrate pores by capillary action, it is forced into the pores by external pressure. The required equilibrated pressure is inversely proportional to the size of the pores: only slight pressure is required to intrude mercury into large macropores, whereas much greater pressures are required to force mercury into small pores (Micromeritics 2015). A cross-sectional view of a mercury penetrometer is given in Figure 3.4.

25
Figure 3.4. Cross-Sectional View of a Mercury Penetrometer (Micromeritics 2015)
26
Chapter 4 Test Results and Analysis
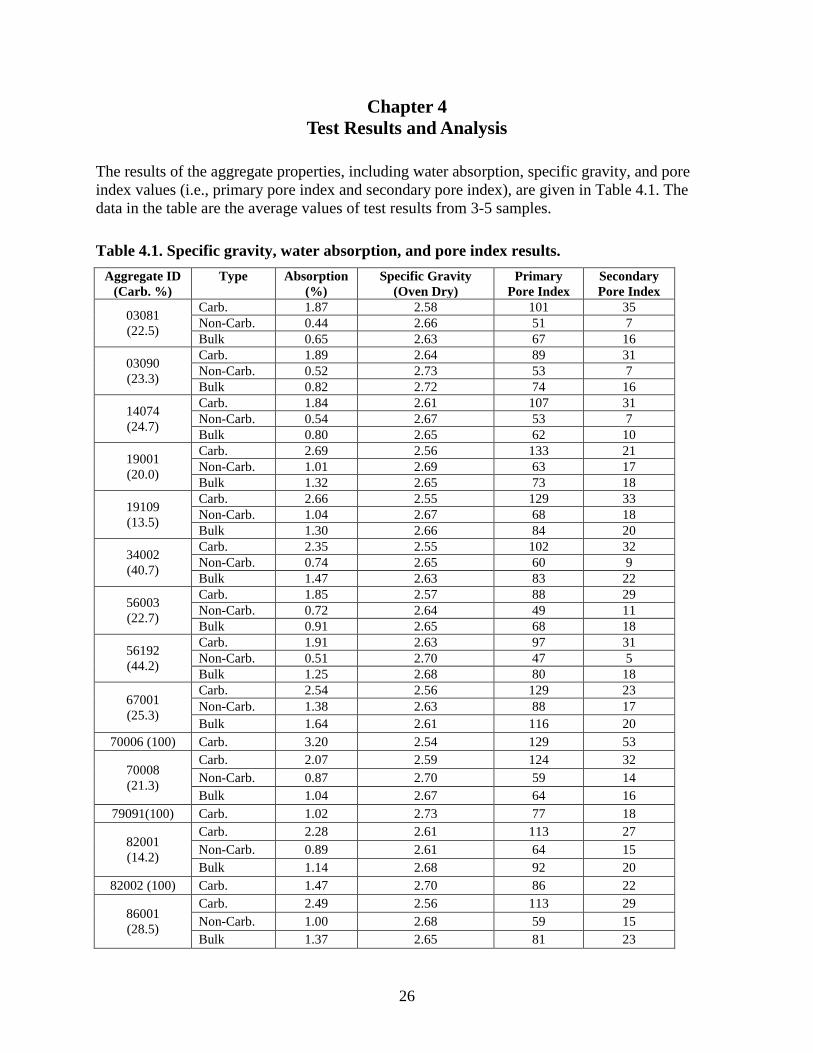
The results of the aggregate properties, including water absorption, specific gravity, and pore index values (i.e., primary pore index and secondary pore index), are given in Table 4.1. The data in the table are the average values of test results from 3-5 samples.
Table 4.1. Specific gravity, water absorption, and pore index results. Aggregate ID
(Carb. %) Type Absorption
(%) Specific Gravity
(Oven Dry) Primary
Pore Index Secondary Pore Index
03081 (22.5)
Carb. 1.87 2.58 101 35 Non-Carb. 0.44 2.66 51 7 Bulk 0.65 2.63 67 16
03090 (23.3)
Carb. 1.89 2.64 89 31 Non-Carb. 0.52 2.73 53 7 Bulk 0.82 2.72 74 16
14074 (24.7)
Carb. 1.84 2.61 107 31 Non-Carb. 0.54 2.67 53 7 Bulk 0.80 2.65 62 10
19001 (20.0)
Carb. 2.69 2.56 133 21 Non-Carb. 1.01 2.69 63 17 Bulk 1.32 2.65 73 18
19109 (13.5)
Carb. 2.66 2.55 129 33 Non-Carb. 1.04 2.67 68 18 Bulk 1.30 2.66 84 20
34002 (40.7)
Carb. 2.35 2.55 102 32 Non-Carb. 0.74 2.65 60 9 Bulk 1.47 2.63 83 22
56003 (22.7)
Carb. 1.85 2.57 88 29 Non-Carb. 0.72 2.64 49 11 Bulk 0.91 2.65 68 18
56192 (44.2)
Carb. 1.91 2.63 97 31 Non-Carb. 0.51 2.70 47 5 Bulk 1.25 2.68 80 18
67001 (25.3)
Carb. 2.54 2.56 129 23 Non-Carb. 1.38 2.63 88 17 Bulk 1.64 2.61 116 20
70006 (100) Carb. 3.20 2.54 129 53
70008 (21.3)
Carb. 2.07 2.59 124 32 Non-Carb. 0.87 2.70 59 14 Bulk 1.04 2.67 64 16
79091(100) Carb. 1.02 2.73 77 18
82001 (14.2)
Carb. 2.28 2.61 113 27 Non-Carb. 0.89 2.61 64 15 Bulk 1.14 2.68 92 20
82002 (100) Carb. 1.47 2.70 86 22
86001 (28.5)
Carb. 2.49 2.56 113 29 Non-Carb. 1.00 2.68 59 15 Bulk 1.37 2.65 81 23

27
Carbonate Content
Figure 4.1 shows the carbonate percentages of the aggregates studied. Having over 30% carbonates, two aggregate sources, 34002 and 56192, do not comply with the MnDOT specification for Class C aggregate (i.e., natural or partly crushed natural gravel) for paving concrete (MnDOT 2014).
Absorption
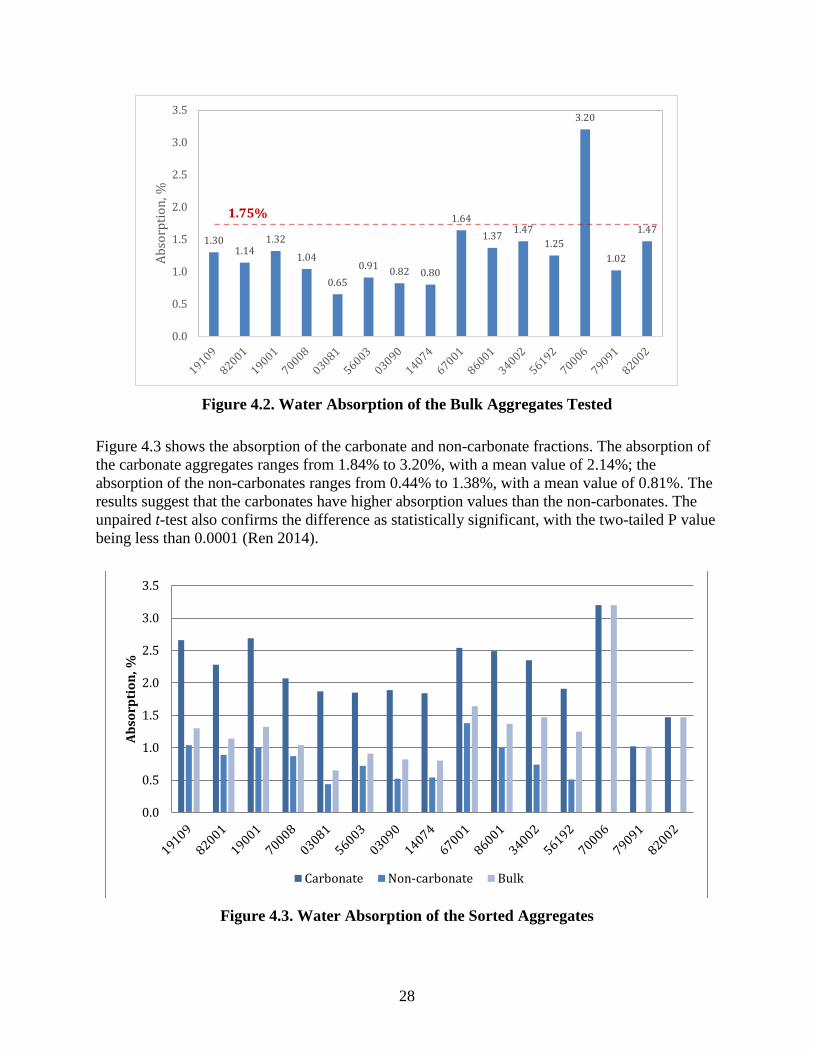
Figure 4.2 shows the absorption of all bulk aggregates studied. In the figure, carbonate content increases from the left to right of the x-axis. It is noted that having over 1.75% absorption, aggregate 70006 does not comply with the MnDOT specification for Class B aggregate (i.e., crushed quarry or mine rock such as carbonates, rhyolite, schist) for paving concrete (MnDOT 2014). It is worth noting that the aggregates tested in the present study have a size ranging from 1/2 in. to 3/4 in. only, which is required for Iowa Pore Index tests. Some test results, such as absorption and carbonate content, of this size range of aggregates may be slightly different from those obtained from the full size range (such as from #4 sieve size to 1 in.) of the corresponding aggregates.
There is no direct correlation between the carbonate aggregate percentage and the absorption of the bulk (i.e., unsorted) aggregate. It is prudent to say that each carbonate fraction has a different absorption behavior. Moreover, by its nature gravel aggregate is a mixture of rocks from varying origins.
30%
13.5 14.2 20.0 21.3 22.5 22.7 23.3 24.7 25.3
28.5
40.7 44.2
100 100 100
0
10
20
30
40
50
60
70
80
90
100
Carb
onat
e Co
nten
t, %
Figure 4.1. Carbonate Percentage of the Aggregate Sources Tested
28
1.30 1.14
1.32
1.04
0.65 0.91 0.82 0.80
1.64 1.37 1.47
1.25
3.20
1.02
1.47
0.0
0.5
1.0
1.5
2.0
2.5
3.0
3.5
Abso
rptio
n, %
Figure 4.2. Water Absorption of the Bulk Aggregates Tested
Figure 4.3 shows the absorption of the carbonate and non-carbonate fractions. The absorption of the carbonate aggregates ranges from 1.84% to 3.20%, with a mean value of 2.14%; the absorption of the non-carbonates ranges from 0.44% to 1.38%, with a mean value of 0.81%. The results suggest that the carbonates have higher absorption values than the non-carbonates. The unpaired t-test also confirms the difference as statistically significant, with the two-tailed P value being less than 0.0001 (Ren 2014).
1.75%
0.0
0.5
1.0
1.5
2.0
2.5
3.0
3.5
Abso
rpti
on, %
Carbonate Non-carbonate Bulk
Figure 4.3. Water Absorption of the Sorted Aggregates

29
Porosity directly measured as moisture absorption is somewhat related to the F-T durability of aggregate in concrete: high porosity is considered to be potentially nondurable. Absorption values less than 1.5% indicate durability factors greater than 80, while absorptions greater than 2% are associated with durability factors less than 60. On the other hand, there has been no direct correlation between the absorption and F-T durability, and a more accurate assessment can be done considering absorption and pore structure (Koubaa and Snyder 1996).
Figures 4.4–4.7 show the time-dependent moisture behavior (i.e., absorption or desorption) of the carbonate and non-carbonate portions of the aggregates tested. The observations are as follows:
• For most carbonate aggregate (Figure 4.4), most absorption (~90%) is completed in the first 15 minutes after the tested aggregate is soaked in water. The rate of absorption is high for these aggregates in the first 15 minutes, but it is low for all aggregates after 60 minutes of soaking (i.e., slope of the curve between 1 and 24 hours is low). There is little transition between the above two stages as the curve levels off.
• For majority of non-carbonate aggregate (Figure 4.5), most absorption (~90%) is completed in the first 15 minutes, but a quite few aggregates (e.g., ID 7008, 19001, and 82001) completed ~90% absorption in about 5 hours after the tested aggregate is soaked in water, and there is a clear transition observed from their test results. The rates of desorption of all aggregates are much lower the rates of absorption of the corresponding aggregates (Figures 4.6 and 4.7). This suggests that water is easier to get into than to get out of the aggregates.
• For most aggregate, the rates of desorption are high during the first 140 minutes after the aggregates are soaked into water, but the rates are low after 240 minutes of soaking (i.e., between 4 and 24 hours)
• There is a clear transition zone between the above two stages as the slope decreases before it levels off in almost all desorption curves obtained. The slope of this transition zone may be related the smaller size of pores in the aggregate.

30
0.00
0.50
1.00
1.50
2.00
2.50
3.00
0 5 10 15 20 25
Moi
stur
e Ga
in, %
Time, hrs
03081
03090
14074
19001
19109
34002
56003
56192
67001
70006
70008
79091
82001
82002
86001
Figure 4.4. Absorption Curves of Carbonate Aggregates
0.00
0.20
0.40
0.60
0.80
1.00
1.20
1.40
1.60
0 5 10 15 20 25
Moi
stur
e Ga
in, %
Time, hrs
03081
03090
14074
19001
19109
34002
56003
56192
67001
70008
82001
86001
Figure 4.5. Absorption Curves of Non-Carbonate Aggregate

31
Moi
stur
e Lo
ss, %
0.00
0.50
1.00
1.50
2.00
2.50
3.00
3.50
0 5 10 15 20 25Time, hrs
03081
03090
14074
19001
19109
34002
56003
56192
67001
70006
70008
79091
82001
82002
86001
Figure 4.6. Desorption Curves of Carbonate Aggregate
0.00
0.20
0.40
0.60
0.80
1.00
1.20
1.40
1.60
0 5 10 15 20 25
Moi
stur
e Lo
ss, %
Time, hrs
03081
03090
14074
19001
19109
34002
56003
56192
67001
70008
82001
86001
Figure 4.7. Desorption Curves of Non-Carbonate Aggregate
Iowa Pore Index Test Results
Figures 4.8 and 4.9 show the results of the Iowa pore index test. The former gives the primary pore index (PPI), and the latter shows the secondary pore index (SPI). PPI is the pressure drop after one minute of loading, and SPI is the drop between minute 1 and minute 15. The PPI of the

32
carbonates ranges from 88 to 133, with a mean value of 108; the absorption of the non-carbonates ranges from 47 to 88, with a mean value of 60. Similarly, the SPI of the carbonates ranges from 18 to 53, with a mean value of 30; the absorption of the non-carbonates ranges from 5 to 18, with a mean value of 12. Both the PPI and SPI values of the carbonates are higher than those of the non-carbonates. Based on the t-test, the differences in the means are statistically significant, with P-values less than 0.0001 (Ren 2014).
27
0
20
40
60
80
100
120
140
Prim
ary
Pore
Inde
x (P
PI)
Carb PPI Non-Carb PPI Bulk PPI
Figure 4.8. Results of the Iowa Pore Index Test—Primary Pore Index
0
10
20
30
40
50
60
Seco
ndar
y Po
re In
dex
(SPI
)
Carb SPI Non-Carb SPI Bulk SPI
Figure 4.9. Results of the Iowa Pore Index Test—Secondary Pore Index
SPI is considered to be the F-T durability indicator of the coarse aggregate. According to Iowa 219-D, a secondary load of 27 or greater indicates an inability of the aggregate to withstand saturated freeze-thaw pressures. Based on this criterion, all the aggregates (i.e., in bulk) except 70006, with an SPI of 53, are considered durable. However, the carbonate portions of all the

33
gravels except 67001 have SPI values equal or greater than 27. It is questionable whether these gravels would perform well. Myers and Dubberke (1980) have suggested the removal of low-durability material if composite aggregates show intermediate pore index results (i.e., between 20 and 35). Marks and Dubberke (1982) reported that when 15% or more of the coarse aggregate particles were not durable, the pavement would probably exhibit D-cracking. Furthermore, Muethel (1992) concluded that the deleterious aggregate fraction in gravel should be diluted to 5% through blending in order to achieve a substantial increase in F-T durability. It is evident that the durability of the gravel depends on the characteristics of the poor material (e.g., carbonate) and the desired durability level.
Relationship between Aggregate Properties and Iowa Pore Index Parameters
Figures 4.10–4.12 show the relationship between the pore index parameters and the aggregate absorption. PPI is the pressure drop in the first minute, and SPI is the drop between the first and the fifteenth minutes. PPI and SPI are indicators of large/macro and small/micro pores, respectively.
R² = 0.95
0
50
100
150
200
250
0.00 1.00 2.00 3.00 4.00
(PPI
+SPI
)
Absorption, %
Carbonate Non-carbonate
Figure 4.10. Relationship between Total Loading (PPI+SPI) and Absorption

34
R² = 0.93
0
20
40
60
80
100
120
140
160
0.00 1.00 2.00 3.00 4.00
PPI
Absorption, %
Carbonate Non-carbonate
Figure 4.11. Relationship between PPI and Absorption
R² = 0.77
R² = 0.31
R² = 0.85
0
10
20
30
40
50
60
0.00 1.00 2.00 3.00 4.00
SPI
Absorption, %
Carbonate Non-carbonate
Figure 4.12. Relationship between SPI and Absorption
As expected, the absorption shows better correlation to the primary load (i.e., PPI) and the total load (i.e., PPI + SPI). The correlation is still fairly good with the secondary load (i.e., SPI); however, if the data is further analyzed between two groups, carbonate and non-carbonate, it is seen that the correlation between SPI and absorption deteriorates for the carbonate group: the

35
coefficients are 0.85 and 0.31 for the non-carbonate and carbonate aggregates, respectively. This might be due to the pore distribution characteristics. The literature is also in agreement with the findings of the current study that the absorption and SPI correlation is not high (Figure 4.13). Further methods are necessary to relate SPI to pore structure.
R² = 0.49
0
10
20
30
40
50
60
70
80
90
100
110
0 1 2 3 4 5 6
SPI
Absorption, %
Hunsucker, 1988
Muethel, 1992
Kouba et al, 1997
Richardson, 2009
Note: Five aggregate sources with high absorption values, >6%, are not included in the analysis
Figure 4.13. Relationship between SPI and Absorption with Data from Literature
It has been reported that unsound coarse aggregates can be characterized by a low specific gravity, a high absorption, and a high degree of saturation (Kaneuji 1978). Figure 4.14 shows the relationship between absorption and specific gravity, where data points are also marked with the corresponding SPI values. The plot is divided into four quadrants, with lines drawn where specific gravity is equal to 2.60 and absorption is equal to 1.75%. Quadrant I represents high absorption and low specific gravity, indicating poor performance, and quadrant III represents low absorption and high specific gravity, indicating high performance. When the data sets are investigated in relation to the SPI values, it is evident that the aggregates in quadrant III have SPI values lower than 27, 7 out of 9 values in quadrant I are greater than 27, and four values in quadrant III have SPI values equal to or greater than 27. All the non-carbonate aggregates fall in quadrant I, whereas only 2 out of 15 carbonates are in quadrant I.
The data from the literature is plotted in Figure 4.15, and the findings are similar: there is a good relationship between aggregate absorption, density, and SPI. Low density (i.e., < 2.60) together

36
with high absorption (i.e., > 1.75%) may be indicators for poor F-T performance, because such aggregate in general has high SPI (i.e., > 27).
0.00
0.50
1.00
1.50
2.00
2.50
3.00
3.50
2.50 2.55 2.60 2.65 2.70 2.75
Abso
rpti
on, %
Specific Gravity (Dry)
Carbonate
Non-carbonate
18 (ID79091)
22 (ID82002)
15
29 23
33
SPI=53 (ID70006)
32 35 29 31
27
31
32
17
11
17 15
7
18
7 5
14
7 9
31
21
I II
III IV
Note: Quadrant I indicates potentially poor performance; quadrant III indicates potentially good performance.
Figure 4.14. Relationship between Absorption, Specific Gravity and SPI (as marked) from the Present Study

37
[CELLRANGE]
[CELLRANGE]
[CELLRANGE]
[CELLRANGE]
[CELLRANGE] [CELLRANGE]
[CELLRANGE]
[CELLRANGE]
[CELLRANGE]
[CELLRANGE]
[CELLRANGE]
[CELLRANGE]
[CELLRANGE]
[CELLRANGE]
[CELLRANGE]
[CELLRANGE]
[CELLRANGE]
[CELLRANGE]
[CELLRANGE]
[CELLRANGE] [CELLRANGE]
[CELLRANGE]
[CELLRANGE]
[CELLRANGE] [CELLRANGE]
[CELLRANGE]
[CELLRANGE]
[CELLRANGE]
[CELLRANGE] [CELLRANGE]
[CELLRANGE] [CELLRANGE]
[CELLRANGE]
[CELLRANGE]
[CELLRANGE]
[CELLRANGE]
[CELLRANGE] [CELLRANGE]
[CELLRANGE]
[CELLRANGE]
[CELLRANGE]
[CELLRANGE]
[CELLRANGE]
[CELLRANGE]
[CELLRANGE]
[CELLRANGE] [CELLRANGE]
[CELLRANGE]
[CELLRANGE]
0.00
0.25
0.50
0.75
1.00
1.25
1.50
1.75
2.00
2.25
2.50
2.75
3.00
3.25
3.50
3.75
4.00
4.25
4.50
2.30 2.40 2.50 2.60 2.70 2.80 2.90 3.00
Abso
rptio
n, %
Specific Gravity (Oven Dry)
Richardson, 2009
Muethel, 1992
Koubaa et al, 1997
I
IV III
II
Note: Quadrant I indicates potentially poor performance; quadrant III indicates potentially good performance
Figure 4.15. Relationship between Absorption, Specific Gravity and SPI (as marked) from Literature
It shall be noted that although Figures 4.14 and 4.15 can be or have already been used for estimating performance of given aggregates, the parameters in the figures are neither directly related to the aggregate pore structure nor to aggregate F-T performance. In order to confidently use this relationship, the relationship between SPI and aggregate pore size distribution is investigated and the results are presented in the following chapter.

38
Chapter 5 Mercury Intrusion Porosimetry Data and Analysis
Mercury intrusion porosimetry (MIP) tests were conducted for both carbonate and non-carbonate portion of all aggregates received so as to identify the features of the pore structure of the aggregates and to relate Iowa pore index test parameters to the aggregate pore size distributions. Total pore volume, pore area, total porosity, and pore size distribution are obtained from the MIP tests. Typical outputs are shown in Figures 5.1 and 5.2.
Figure 5.1. Cumulative Intrusion versus Pore Size (Specimen 56192-Carbonate)

39
Figure 5.2. Incremental Intrusion versus Pore Size (Specimen 56192-Carbonate)
The results for each aggregate are given in Tables 5.1 and 5.2.

40
Table 5.1. Aggregate pore surface area and porosity.
Aggregate ID Type Mercury Intrusion, mL/g Pore Area, m2/g Porosity, %
03081 Carb. 0.0337 0.886 8.70 Non-Carb. 0.0108 0.027 2.78
03090 Carb. 0.0369 0.907 9.17 Non-Carb. 0.0130 0.064 3.44
14074 Carb. 0.0401 1.636 10.03 Non-Carb. 0.0224 1.203 5.76
19001 Carb. 0.0415 0.755 10.37 Non-Carb. 0.0195 0.687 5.04
19109 Carb. 0.0403 1.158 9.90 Non-Carb. 0.0214 0.685 5.46
34002 Carb. 0.0397 1.222 9.94 Non-Carb. 0.0147 0.216 3.81
56003 Carb. 0.0358 1.064 8.95 Non-Carb. 0.0142 0.108 3.63
56192 Carb. 0.0343 1.118 8.58 Non-Carb. 0.0154 0.248 4.03
67001 Carb. 0.0436 0.984 10.67 Non-Carb. 0.0238 0.764 6.11
70006 Carb. 0.0489 1.968 11.94
70008 Carb. 0.0424 1.173 10.65 Non-Carb. 0.0181 0.734 4.77
79091 Carb. 0.0284 0.606 7.26
82001 Carb. 0.0442 1.496 10.83 Non-Carb. 0.0192 0.84 4.97
82002 Carb. 0.0272 0.519 7.16
86001 Carb. 0.0448 1.235 11.08 Non-Carb. 0.0212 1.527 5.40

41
Table 5.2. Aggregate pore size distribution.
Aggregate ID Type
Mercury Intrusion, mL/g > 100 µ 100–10 µ 10–1 µ 1–0.1 µ 0.1–0.01 µ < 0.01 µ
03081 Carb. 0.0091 0.0034 0.0046 0.0119 0.0043 0.0004 Non-Carb. 0.0059 0.0022 0.0016 0.0009 0.0002 0.0000
03090 Carb. 0.0090 0.0030 0.0065 0.0125 0.0045 0.0004 Non-Carb. 0.0068 0.0025 0.0017 0.0016 0.0004 0.0000
14074 Carb. 0.0103 0.0038 0.0065 0.0125 0.0054 0.0016 Non-Carb. 0.0100 0.0026 0.0018 0.0031 0.0040 0.0009
19001 Carb. 0.0122 0.0037 0.0075 0.0141 0.0037 0.0003 Non-Carb. 0.0100 0.0026 0.0015 0.0022 0.0028 0.0004
19109 Carb. 0.0084 0.0051 0.0076 0.0136 0.0051 0.0005 Non-Carb. 0.0105 0.0032 0.0021 0.0030 0.0020 0.0006
34002 Carb. 0.0110 0.0036 0.0044 0.0134 0.0071 0.0002 Non-Carb. 0.0079 0.0025 0.0015 0.0016 0.0011 0.0001
56003 Carb. 0.0071 0.0029 0.0063 0.0129 0.0063 0.0003 Non-Carb. 0.0068 0.0026 0.0019 0.0022 0.0006 0.0001
56192 Carb. 0.0074 0.0031 0.0041 0.0132 0.0061 0.0004 Non-Carb. 0.0090 0.0027 0.0016 0.0012 0.0006 0.0003
67001 Carb. 0.0122 0.0038 0.0064 0.0153 0.0057 0.0002 Non-Carb. 0.0072 0.0028 0.0021 0.0081 0.0031 0.0005
70006 Carb. 0.0127 0.0048 0.0052 0.0166 0.0087 0.0009
70008 Carb. 0.0101 0.0055 0.0066 0.0141 0.0056 0.0005 Non-Carb. 0.0080 0.0024 0.0015 0.0030 0.0027 0.0005
79091 Carb. 0.0109 0.0028 0.0037 0.0068 0.0041 0.0001
82001 Carb. 0.0108 0.0042 0.0074 0.0143 0.0067 0.0008 Non-Carb. 0.0064 0.0030 0.0026 0.0032 0.0034 0.0006
82002 Carb. 0.0110 0.0038 0.0026 0.0060 0.0036 0.0004
86001 Carb. 0.0104 0.0042 0.0078 0.0161 0.0059 0.0004 Non-Carb. 0.0089 0.0031 0.0019 0.0017 0.0041 0.0015
Figure 5.3 shows the relationship between total pore volume from MIP and aggregate absorption tests. The two tests are in good agreement. Carbonate aggregates have distinctively higher porosity compared to non-carbonate ones.

42
R² = 0.91
0
0.01
0.02
0.03
0.04
0.05
0.06
0.00 0.50 1.00 1.50 2.00 2.50 3.00 3.50
Tota
l mer
cury
intr
usio
n (p
ore
volu
me)
, mL/
g
Aggregate absorption, %
Carbonate Non-carbonate
Figure 5.3. Pore Volume by MIP versus Aggregate Absorption by ASTM C 127
Figure 5.4 shows the relationship between total pore volume and total pore area. The difference between the carbonate and non-carbonate pore structure is seen from the plot: carbonates have finer pore structure. For the same total mercury intrusion volume, carbonates have a higher pore surface area, indicating a large volume of small pores.

43
0
0.5
1
1.5
2
2.5
0 0.01 0.02 0.03 0.04 0.05 0.06
Tota
l Int
rusi
on, m
L/g
Total pore area, m2/g
Carbonate Non-carbonate
Figure 5.4. Pore Volume versus Pore Area
Figures 5.5 and 5.6 show the mercury intrusions broken into six pore size fractions: >100, 100–10, 10–1, 1–0.1, 0.1–0.01, and < 0.01µm.

44
0.000
0.005
0.010
0.015
0.020
>100 10-100 1-10 0.1-1 0.01-0.1 <0.01
Mer
ucy
intr
usio
n (m
L/g)
Pore diameter (um)
03090-NC03090-C
0.000
0.005
0.010
0.015
0.020
>100 10-100 1-10 0.1-1 0.01-0.1 <0.01
Mer
ucy
intr
usio
n (m
L/g)
Pore diameter (um)
03081-NC03081-C
0.000
0.005
0.010
0.015
0.020
>100 10-100 1-10 0.1-1 0.01-0.1 <0.01
Mer
ucy
intr
usio
n (m
L/g)
Pore diameter (um)
14074-NC14074-C
0.000
0.005
0.010
0.015
0.020
>100 10-100 1-10 0.1-1 0.01-0.1 <0.01
Mer
ucy
intr
usio
n (m
L/g)
Pore diameter (um)
19001-NC19001-C
0.000
0.005
0.010
0.015
0.020
>100 10-100 1-10 0.1-1 0.01-0.1 <0.01
Mer
ucy
intr
usio
n (m
L/g)
Pore diameter (um)
19109-NC19109-C
0.000
0.005
0.010
0.015
0.020
>100 10-100 1-10 0.1-1 0.01-0.1 <0.01
Mer
ucy
intr
usio
n (m
L/g)
Pore diameter (um)
34002-NC34002-C
0.000
0.005
0.010
0.015
0.020
>100 10-100 1-10 0.1-1 0.01-0.1 <0.01
Mer
ucy
intr
usio
n (m
L/g)
Pore diameter (um)
56003-NC56003-C
0.000
0.005
0.010
0.015
0.020
>100 10-100 1-10 0.1-1 0.01-0.1 <0.01
Mer
ucy
intr
usio
n (m
L/g)
Pore diameter (um)
56192-NC56192-C
0.000
0.005
0.010
0.015
0.020
>100 10-100 1-10 0.1-1 0.01-0.1 <0.01
Mer
ucy
intr
usio
n (m
L/g)
Pore diameter (um)
67001-NC67001-C
0.000
0.005
0.010
0.015
0.020
>100 10-100 1-10 0.1-1 0.01-0.1 <0.01
Mer
ucy
intr
usio
n (m
L/g)
Pore diameter (um)
70008-NC70008-C
0.000
0.005
0.010
0.015
0.020
>100 10-100 1-10 0.1-1 0.01-0.1 <0.01
Mer
ucy
intr
usio
n (m
L/g)
Pore diameter (um)
82001-NC82001-C
0.000
0.005
0.010
0.015
0.020
>100 10-100 1-10 0.1-1 0.01-0.1 <0.01
Mer
ucy
intr
usio
n (m
L/g)
Pore diameter (um)
86001-NC86001-C
0.000
0.005
0.010
0.015
0.020
>100 10-100 1-10 0.1-1 0.01-0.1 <0.01
Mer
ucy
intr
usio
n (m
L/g)
Pore diameter (um)
70006-C
0.000
0.005
0.010
0.015
0.020
>100 10-100 1-10 0.1-1 0.01-0.1 <0.01
Mer
ucy
intr
usio
n (m
L/g)
Pore diameter (um)
79091-C
0.000
0.005
0.010
0.015
0.020
>100 10-100 1-10 0.1-1 0.01-0.1 <0.01
Mer
ucy
intr
usio
n (m
L/g)
Pore diameter (um)
82002-C
Figure 5.5. Pore Size Distribution of Aggregates Studied (C: Carbonate, NC: Non-Carbonate)
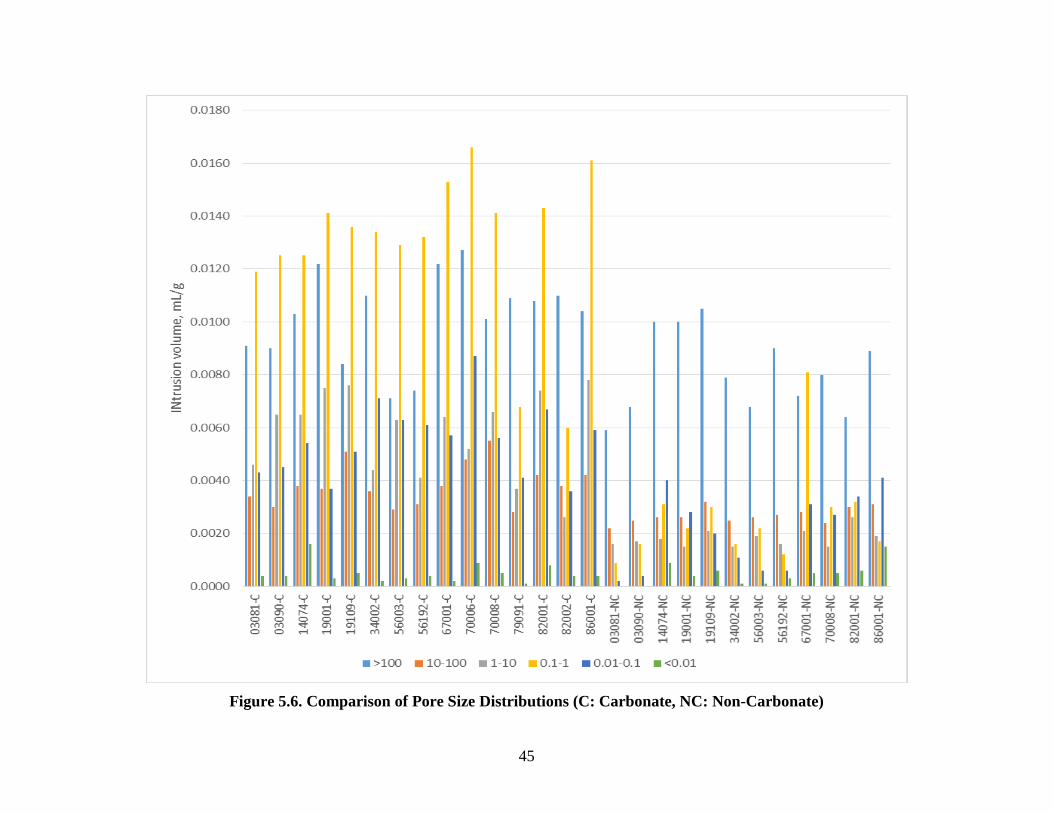
45
Figure 5.6. Comparison of Pore Size Distributions (C: Carbonate, NC: Non-Carbonate)

46
As seen in Figure 5.5, for almost all non-carbonate portion aggregates (except for ID 67001-NC), the volume of pores >100µm, indicated by the amount of mercury intrusion, dominates the pore structure, and the volumes of other pores are much less significant. For carbonate portion aggregates, there are two significant ranges of pore volumes, one is the volume of pores >100µm and the other is the volume of pores within a size range of 0.1-1µm. The volume of pores ranging from 0.1-1µm is the topmost high, forming a hump in the pore size distribution curve. Such a hump may have substantial effects on the aggregate F-T durability. Among three 100% carbonate aggregates (Figure 5.5), ID 70006 has a trend of pore size distribution very similar to that of most carbonate portion aggregates, i.e., having two peaks of pore volumes: one is for pores >100µm and the other is topmost and within a size range of 0.1-1µm, which may be account for its high absorption (3.2) and high SPI (53). Differently, the other two 100% carbonate aggregates (ID 79091 and 82002) have a trend of pore size distribution more similar to that of non-carbonate portion aggregates, i. e., the volume of pores >100µm dominates the pore structure and the volume of pores within a size range of 0.1-1µm is much smaller, which may account for their low absorption (1.02 and 1.47) and relatively low SPI (18 and 22, respectively).
Figure 5.6 shows clear drops in the average volumes of different sizes of pores between the carbonate and non-carbonate aggregates. The biggest drop occurs in the pore size range of 0.1-1µm, and it once again highlights the significant differences in pore structures between the carbonate and non-carbonate aggregates.
Aggregate pore structure has a significant effect on F-T performance. Porosity and pore size distribution determines the saturation level: an aggregate with smaller pores would attain and retain a higher degree of saturation and, hence, is most likely to fail (Verbeck and Landgren 1960). Kaneuji (1978) concluded that larger pore volumes and smaller pore sizes make for poor durability. Richardson (2009) postulated that water in pores of the 0.1 to 10 µm range has difficulty escaping. Conversely, for large pores (>1 µm), the larger the pore, the less susceptible the aggregate is to damage, and aggregates are frost-resistant above 10 µm. Table 5.3 summarizes the critical aggregate pore sizes suggested by various studies.
Table 5.3. Critical aggregate pore size for F-T durability. Critical aggregate
pore size (µm) Sweet 1948 < 5 Blanks 1949 < 4 Walker and Hsieh 1968 < 8 Litvan 1973 0.004–0.03 Kaneuji 1978 0.0045–1 Shakoor 1982 0.01–10 Salcedo 1984 0.045–10 Dubberke and Marks 1985 0.04–0.2 Mehta and Monterio 1993 < 1
The correlations between each pore size fraction and the pore index parameters, PPI and SPI, were analyzed: Figure 5.7 summarizes the coefficient of determinations, R2.

47
>100 10-100 1-10 0.1-1 0.01-0.1 <0.01PPI 0.36 0.72 0.79 0.89 0.61 0.02SPI 0.22 0.56 0.51 0.74 0.75 0.07
0.00
0.10
0.20
0.30
0.40
0.50
0.60
0.70
0.80
0.90
1.00
R2 (s
ampl
e si
ze:2
7)
Pore size, um.
Figure 5.7 Coefficient of Determinations Correlating the Pore Size and Iowa Pore Indices
The “Notes” section of Iowa 219-D, Method of Test for Determining the Pore Index of Aggregates, states that the secondary pore index number represents the amount of water injected into the aggregate capillary pore system, which is given as the pore fraction from 0.01 to 0.1 µm. The results of this study show a good correlation between SPI and not only the 0.1–0.01 µm but also the 0.1–1 µm sizes. Moreover, the results suggests a good correlation between PPI and the 0.1–100 µm range. This finding shows that the pressure, 35 psi, is able to push water into small pores such as those in the 0.1–1 µm range. This fact can be further verified by a closer look to the mercury porosimetry results. Figure 5.8 shows the non-carbonate aggregate MIP and Iowa pore index results. The relatively high PPI value of 67001-NC is due to the fact that it has a relatively high volume of 0.1–1 µm pores.
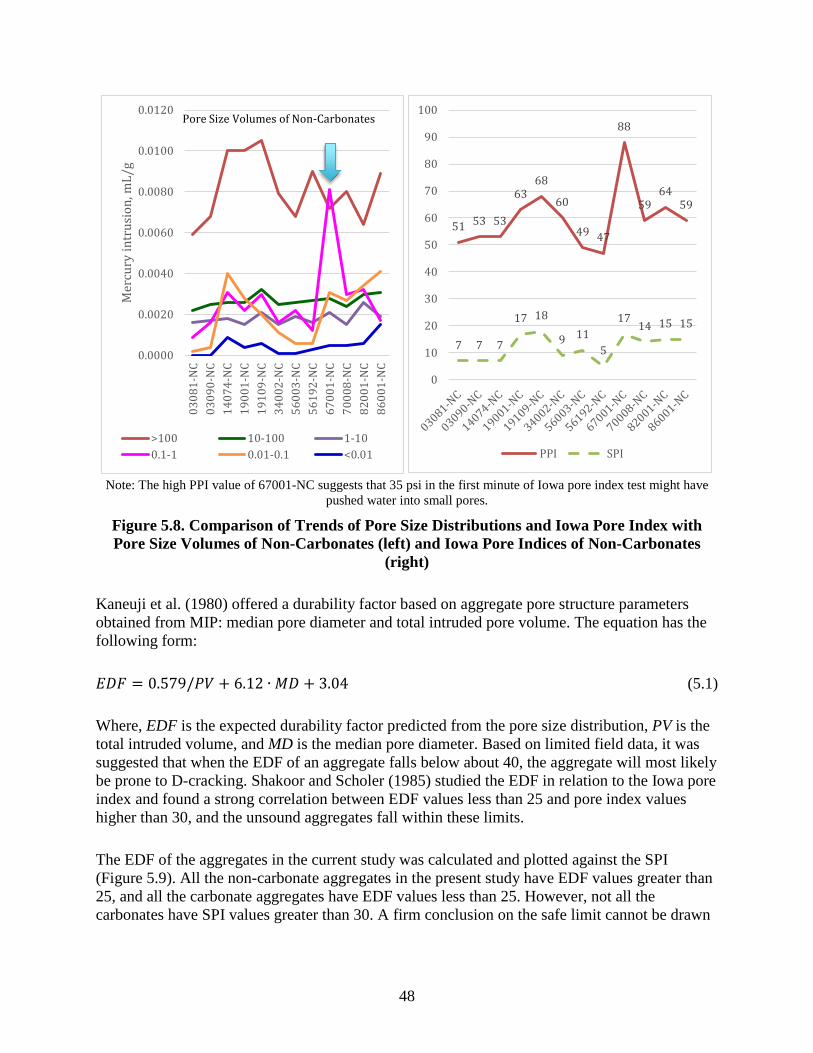
48
0.0000
0.0020
0.0040
0.0060
0.0080
0.0100
0.0120
0308
1-N
C03
090-
NC
1407
4-N
C19
001-
NC
1910
9-N
C34
002-
NC
5600
3-N
C56
192-
NC
6700
1-N
C70
008-
NC
8200
1-N
C86
001-
NC
Pore Size Volumes of Non-Carbonates Iowa Pore Indices of Non-Carbonates
Mer
cury
intr
usio
n, m
L/g
>100 10-100 1-100.1-1 0.01-0.1 <0.01
51 53 53
63 68
60
49 47
88
59 64
59
7 7 7
17 18
9 11 5
17 14 15 15
0
10
20
30
40
50
60
70
80
90
100
PPI SPI
Note: The high PPI value of 67001-NC suggests that 35 psi in the first minute of Iowa pore index test might have pushed water into small pores.
Figure 5.8. Comparison of Trends of Pore Size Distributions and Iowa Pore Index with Pore Size Volumes of Non-Carbonates (left) and Iowa Pore Indices of Non-Carbonates
(right)
Kaneuji et al. (1980) offered a durability factor based on aggregate pore structure parameters obtained from MIP: median pore diameter and total intruded pore volume. The equation has the following form:
𝐸𝐷𝐹 = 0.579/𝑃𝑉 + 6.12 ∙ 𝑀𝐷 + 3.04 (5.1)
Where, EDF is the expected durability factor predicted from the pore size distribution, PV is the total intruded volume, and MD is the median pore diameter. Based on limited field data, it was suggested that when the EDF of an aggregate falls below about 40, the aggregate will most likely be prone to D-cracking. Shakoor and Scholer (1985) studied the EDF in relation to the Iowa pore index and found a strong correlation between EDF values less than 25 and pore index values higher than 30, and the unsound aggregates fall within these limits.
The EDF of the aggregates in the current study was calculated and plotted against the SPI (Figure 5.9). All the non-carbonate aggregates in the present study have EDF values greater than 25, and all the carbonate aggregates have EDF values less than 25. However, not all the carbonates have SPI values greater than 30. A firm conclusion on the safe limit cannot be drawn
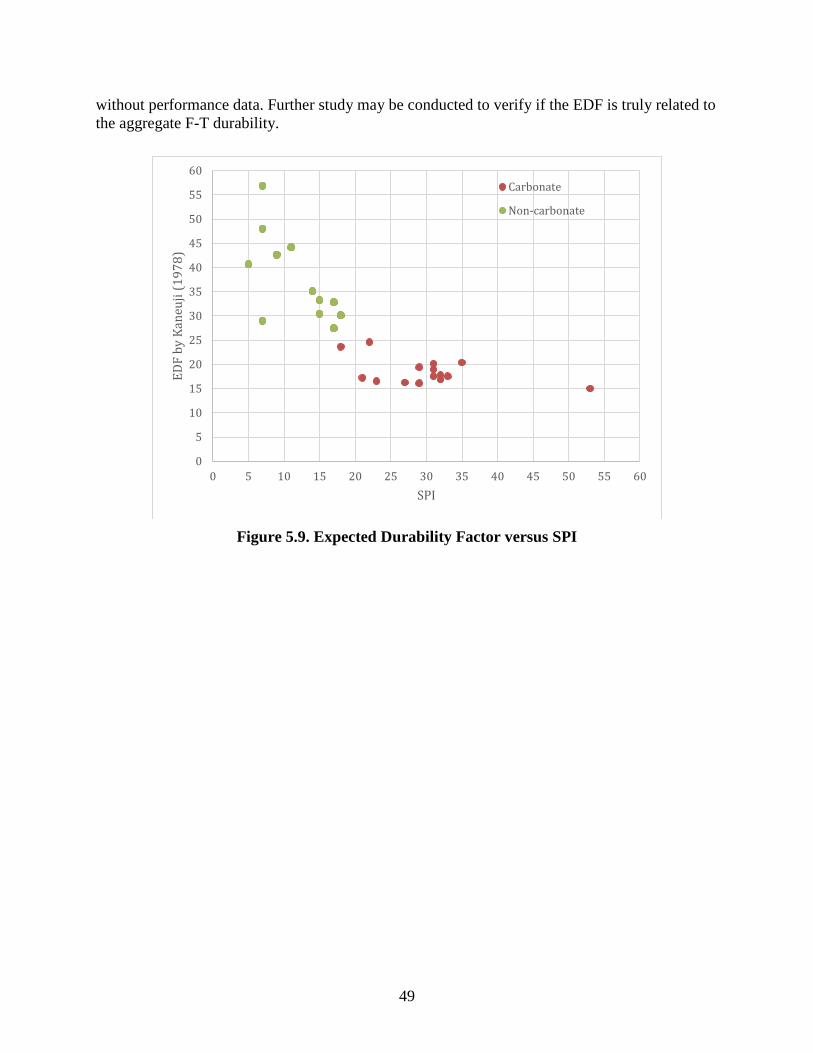
49
without performance data. Further study may be conducted to verify if the EDF is truly related to the aggregate F-T durability.
Unsound aggregate region (Shakoor and Scoeler 1985)
0
5
10
15
20
25
30
35
40
45
50
55
60
0 5 10 15 20 25 30 35 40 45 50 55 60
EDF
by K
aneu
ji (1
978)
SPI
Carbonate
Non-carbonate
Figure 5.9. Expected Durability Factor versus SPI

50
Chapter 6 Summary, Conclusions, and Recommendations
The main objective of the present study was to evaluate available, simple, and rapid test methods for effectively characterizing the F-T durability of Minnesota’s aggregates. A literature search and various experiments were performed for this study. The experiments, including measuring carbonate content, absorption, desorption, specific gravity, Iowa pore indices, and pore size distribution, were performed on aggregates collected from 15 different sources in Minnesota. The following observations and conclusions can be drawn from the results:
(1) Results from the literature review • Various tests have been developed for the evaluation of concrete aggregate F-T durability,
including (a) testing aggregate soundness under simulated environmental conditions, (b) assessing aggregate pore structure, (c) measuring aggregate mechanical properties, and (d) examining the chemical and mineralogical properties of aggregates. However, there is no single existing laboratory test that can adequately relate its results to aggregate field performance. Use of combined test results, together with a history of field performance, to evaluate aggregate F-T durability is a common practice.
• Iowa test methods for assessing aggregate F-T durability include the Iowa pore index test for pore structure, XRD and TGA tests for aggregate quality (grain size and calcite-dolomite transition), and the XRF test for elemental components of carbonate aggregate (e.g., phosphorous and clay content). A combination of these test results is used to form a quality number for evaluation of the overall quality of an aggregate.
(2) Results from carbonate content, absorption, desorption, and specific gravity tests • Among all aggregate sources received, in addition to the 100% carbonate aggregates, two
aggregate sources (i.e., ID 34002 and 56192) have carbonate percentages higher than the MnDOT-specified limit of 30%.
• Only one aggregate source (i.e., ID 70006, crushed carbonate) has an absorption (i.e., 3.2%) higher than the MnDOT specified limit of 1.75%.
• Comparing carbonate and non-carbonate fractions, the carbonates always have a higher absorption and lower specific gravity than non-carbonates.
• For given aggregates, the rates of deportation are significantly lower than the rates of absorption, indicating that water is easier to get into than out of the aggregates.
• There is a fairly good correlation between absorption and specific gravity, but there is no correlation between carbonate content and absorption of bulk aggregates.
(3) Results from Iowa pore index tests • Comparing carbonate and non-carbonate portions, the carbonates always have higher PPI and
higher SPI values than the non-carbonates. • Except for aggregate source 70006, which is 100% carbonate, all the bulk aggregates studied
have SPI values lower than 25, which indicates that these aggregates can be classified as having Class 3 durability (i.e., the aggregates will produce no deterioration in pavements on

51
non-Interstate segments of the road system after 20 years and less than 5% deterioration of the joints after 25 years), according to the Iowa DOT materials specification.
• There is no significant relationship between carbonate content and PPI/SPI. Some 100% carbonate aggregates (e.g., ID 82002 and 79091) had lower absorption, PPI, and SPI values than natural gravel. From the perspective of pore structure, for some aggregates that have a good pore system, the limit of 30% carbonate content may not be necessary, while for other aggregates (e.g., ID 03081) such a carbonate content limit may not guarantee good F-T durability performance for Class C aggregate.
• There is a very good correlation (R2=0.95, N=27) between absorption and the sum of the PPI and SPI values for all aggregates studied. The correlation between absorption and PPI is very good (i.e., R2=0.93, N=27), while the correlation between absorption and SPI is fair (i.e., R2=0.77, N=27). However, the correlation deteriorates (i.e., R2=0.31, N=15) when the carbonates are analyzed as a separate group. Therefore, the use of an absorption limit as an aggregate acceptance criterion does not provide information on the amount of large or small pores.
• A combination of high specific gravity (i.e., >2.60) and low absorption (<1.75%) suggests a low SPI value (see Figures 4.14 and 4.15), and it may indicate good durability performance.
(4) Results from MIP tests • Carbonate aggregates generally have a much finer pore structure than non-carbonate
aggregates, which is evidenced by a higher pore surface area for a given mercury intrusion volume (Figure 5.4) and by a much higher volume of finer pores (0.01–10 µm) than non-carbonate aggregates (Figure 5.6).
• For carbonate aggregates, the most significant pore volume consists of pores in the size range of 0.1–1 µm. Pores in this size range often form a hump in the pore size distribution curve. Such a hump may have substantial effects on the aggregate’s F-T durability. For non-carbonate aggregate, the most significant pore volume consists of pores >100 µm, and the volumes of other pores are much less significant.
• PPI correlates well with pores in the size range of 0.1–100 µm, and SPI correlates well with pores in the size range of 0.01–1 µm. (Note that the overlapping pore size range, 0.1–1 µm, might be caused by the water pressure, 35 psi, used in the current Iowa pore index test. Appropriately reducing the water pressure in the test might help eliminate the overlap.)
• There are very good correlations between the total pore volume measured by MIP, absorption, and the sum of PPI and SPI.
• Based on the equation proposed by Kaneuji et al. (Equation 5.1), the expected durability factor (EDF) was calculated from the total intruded volume and the median pore diameter for all of the Minnesota aggregates studied. A close relationship was found between EDF and SPI (that is, EDF decreases with increased SPI) for SPI values less than 25. There is no relationship between EDF and SPI for SPI values greater than 25.
52
The following recommendations are based on the results of the present study:
• The Iowa pore index test is a simple, rapid, and effective test method, and it can be used for estimating the pore structure of aggregates. A high PPI value indicates a larger amount of large pores (0.1–100 µm), and a high SPI value indicates a larger amount of small pores (0.01–1 µm) in the tested aggregate. As a result, the Iowa pore index test can be used as a screening test for an initial evaluation of aggregate quality.
• The present study has shown that the properties of carbonate aggregates vary considerably. The quality of these carbonate portion aggregates may significantly affect their F-T durability performance in concrete. Therefore, the 30% carbonate content limit should be reevaluated in the light of performance data.
• Although the present study has confirmed that PPI/SPI measurements are related to the amount of large/small pores in the tested aggregates, it is still not clear which range of pore sizes may have the most significant effect on aggregate F-T durability. It is not certain whether an aggregate having a high SPI value is truly non-durable, and vice versa. Therefore, further F-T durability tests should be conducted for the same aggregates investigated in the present study so as to identify the critical pore size range that has the most significant effect on aggregate F-T durability, to confirm whether an aggregate having a high SPI value is truly non-durable, and to determine the critical SPI value below which an aggregate will be F-T durable.
• Figures 4.14 and 4.15 show that a combination of high specific gravity (i.e., >2.60) and low absorption (<1.75%) indicates a low SPI value, and such a quadrant system may be used for assessing aggregate F-T durability after the relationship between SPI and F-T durability is further confirmed.
• It is noted that PPI and SPI may measure an overlapping pore size range, 0.1–1 µm, which is possibly caused by the water pressure, 35 psi, used in the current Iowa pore index test. Further study can be conducted to investigate the effect of reduced water pressures (<35 psi) on the Iowa pore index test results.
• A close relationship was found between EDF and SPI for SPI values less than 25. Further study may be conducted to verify whether EDF is truly related to aggregate F-T durability.

53
References
Blanks, R. F. (1949). “Modern Concepts Applied to Concrete Aggregate.” Proceedings of ASCE, Vol. 75, p. 441.
Bloem, D. L. (1966). “Soundness and Deleterious Substances.” In Significance of Tests and Properties of Concrete and Concrete Making Materials, ASTM STP 169A, West Conshohocken, PA: ASTM International, 497–512.
Davis, S. P. (2011). “Influence of Particle Size and Sample Preparation on the Iowa Pore Index.” MS Thesis, Missouri University of Science and Technology, Rolla, MO.
Dawson, R. (2011). “A Method to Rapidly Predict Service Life and Susceptibility to Deicing Salt Deterioration of Aggregates Used in Portland Cement Concrete.” Presentation at the Mid-Continent Transportation Research Symposium, Ames, IA. August 18-19, 2011.
Dubberke, W., and Marks, V. J. (1985). “The Effect of Salt on Aggregate Durability.” Transportation Research Record, 1031, 27–34.
Dubberke, W., and Marks, V. J. (1989). Evaluation of Aggregate Using X-Ray Analysis. Report HR-266, Iowa Department of Transportation, Ames, IA.
Dubberke, W., and Marks, V. J. (1994). Thermogravimetric Analysis of Carbonate Aggregate. Report HR-336, Iowa Department of Transportation, Ames, IA.
Dubberke, W. (2012). Evaluating Aggregate for PCC; Observations, Comments and Opinion. Last accessed Nov. 2014. www.angelfire.com/ia/concrete/page10.html.
Fowler, D. W., Allen, J. J., Lange, A., and Range, P. (2006). The Prediction of Coarse Aggregate Performance by Micro-Deval and Other Aggregate Tests. Report ICAR 507-1F, International Center for Aggregates Research, Austin, TX.
Hanna, A., Folliard, K., and Smith, K. (2003). “Aggregate Tests for Portland Cement Concrete Pavements: Review and Recommendations.” Research Results Digest No. 281, NCHRP 4-20C, Transportation Research Board of National Academies, Washington, DC.
Hunsucker, D. Q. (1988). Evaluation of Procedures for Testing Aggregates. Report UKTRP-8-11, Kentucky Transportation Center, Lexington, KY.
Janssen, D. J., and Snyder, M. B. (1994). Resistance of Concrete to Freezing and Thawing. Report SHRP-C, Strategic Highway Research Program, National Research Council, Washington, DC.
Iowa Department of Transportation (DOT) (2000). “Test Method Iowa 219-D, Method of Test for Determining the Pore Index of Aggregates.” Last accessed April 2015. www.iowadot.gov.
Kahraman, S., and Toraman, O. Y. (2008). “Predicting Los Angeles abrasion loss of rock aggregates from crushability index.” Bulletin of Material Science, 31(2), 173–177.
Kaneuji, M. (1978). Correlation between Pore Size Distribution and Freeze-Thaw Durability of Coarse Aggregate in Concrete. Report JHRP-78-15, Indiana State Highway Commission, Indianapolis, IN.
Kaneuji, M., Winslow, D. N., and Dolch, W. L. (1980). “The relationship between an aggregate’s pore size distribution and its freeze thaw durability in concrete.” Cement and Concrete Research, 10(2), 433–441.
Koubaa, A., and Snyder, M. B. (1996). “Evaluation of Frost Resistance Tests for Carbonate Aggregates.” Transportation Research Record, 1547, 35–45.
54
Koubaa, A., Snyder, M. B., and Peterson, M. K. (1997). Mitigating Concrete Aggregate Problems in Minnesota. Report MN/RC 2004-46, Minnesota Department of Transportation, St. Paul, MN.
Litvan, C. G. (1973). “Pore Structure and Frost Susceptibility of Building Materials.” Proceedings of RILEM/IUPAC Conference on Pore Structure and Properties of Materials, Prague, Czech Republic. Vol. 2, p. 988.
Marks, V., and Dubberke, W. (1982). “Durability of Concrete and the Iowa Pore Index Test.” Transportation Research Record, 853, 25–30.
Mayo, G. D. (1978). Correlation of the Properties and Freeze Thaw Testing of Some Tennessee Aggregates. MS Thesis, Memphis State University, Memphis, TN.
McLeod, H. (2012). D-Cracking Field Performance of Portland Cement Concrete Pavements Containing Limestone in Kansas: Phase 1. Report KS-12-3, Kansas Department of Transportation, Topeka, KS.
Mehta, P. K., and P. J. M. Montiero (1993) Concrete: Structure, Properties, and Materials. Englewood Cliffs, NJ: Prentice Hall.
Micromeritics (2015). Mercury Intrusion Porsimetry Theory. Last accessed April 2015. www.micromeritics.com/Repository/Files/Mercury_Porosemitry_Theory_poster_.pdf.
Minnesota Department of Transportation (MnDOT) (2014). “Standard Specifications for Construction: 3137–Coarse Aggregate for Portland Cement Concrete.” Last accessed April 2015. www.dot.state.mn.us.
Muethel, R. W. (1992). Freeze-Thaw Durability and Pore Characteristics of the Major Rock Constituents in Glacial Gravel. Report R-1311, Michigan Department of Transportation, Lansing, MI.
Myers, J. D., and Dubberke, W. (1980). Iowa Pore Index Test. Report MLR-80-2, Iowa Department of Transportation, Ames, IA.
Powers, T. C. (1955). “Basic Considerations Pertaining to Freezing and Thawing Tests.” Proceedings of ASTM, 55, 1132.
Ren, J. (2014). Laboratory Evaluation of Freezing-Thawing Resistance of Aggregate for Concrete Pavement using Pore Structure Tests. MS Thesis (in preparation), Iowa State University, Ames, IA.
Richardson, D. N. (2009). Quick Test for Durability Factor Estimation. Report OR09-020, Missouri University of Science and Technology, Rolla, MO.
Salcedo, M. A. (1984). Identification of Frost Susceptible Aggregate and Their Use in Concrete or Bituminous Pavements. Report FHWA/IN/JHRP-84/23, Indiana Department of Transportation and Purdue University, West Lafayette, IN.
Schwartz, D. R. (1987). “D-Cracking of Concrete Pavements.” NCHRP Synthesis 134, Transportation Research Board of the National Academies, Washington, DC.
Senior, S. A., and Rogers, C. A. (1991). “Laboratory Tests for Predicting Coarse Aggregate Performance in Ontario.” Transportation Research Record, 1301, 97–106.
Shakoor, A. (1982). Evaluation of Methods for Predicting Durability Characteristics of Argillaceous Carbonate Aggregates for Highway Pavements. Report FHWA/IN/JHRP-82/10, Indiana Department of Transportation and Purdue University, West Lafayette, IN.
Shakoor, A., and Scholer, C. F. (1985). “Comparison of aggregate pore characteristics as measured by mercury intrusion porosimeter and Iowa pore index tests.” ACI Materials Journal, 82(4), 453–458.

55
Stark, D. (1976). “Characteristics and Utilization of Coarse Aggregates Associated with D-Cracking.” Bulletin RD047.01P, Portland Cement Association, Skokie, IL.
Southwick, D. L., Jouseau, M., Meyer, G. N., Mossler J. H., and Wahl, T. E. (2000). Aggregate Resources Inventory of the Seven-County Metropolitan Area, Minnesota. Information Circular 46, Minnesota Geological Survey, St. Paul, MN.
Sweet, H. (1948). “Research on Concrete Durability as Affected by Coarse Aggregate.” Proceedings of ASTM, Vol. 48, p. 988.
Thompson, S. R., Olsen, M. P., and Dempsey B. J. (1980). D-Cracking in Portland Cement Concrete Pavements. Report UILI-ENG-80-2014, Illinois Department of Transportation, Springfield, IL.
Verbeck, G., and Landgren, R. (1960). “Influence of Physical Characteristics of Aggregates on Frost Resistance of Concrete.” Proceedings of the American Society for Testing Materials, 60, 1063–1079.
Woolf, D. O. (1927). “Relation between Sodium Sulfate Soundness Tests and Absorption of Sedimentary Rock.” Public Roads, 225.
Walker, R. D., and Hsieh, T. (1968). “Relationship between Aggregate Pore Characteristics and Durability of Concrete Exposed to Freezing and Thawing.” Highway Research Record, 226, 41.
Williamson, G. S. (2005). “Investigation of Testing Methods to Determine Long-Term Durability of Wisconsin Aggregate Resources Including Natural Materials, Industrial By-Products, and Recycled/Reclaimed Materials.” MS Thesis, Virginia Polytechnic Institute and State University, Blacksburg, VA.
Related Documents