Springer Tracts in Civil Engineering Recycled Aggregate Concrete Structures Jianzhuang Xiao

Welcome message from author
This document is posted to help you gain knowledge. Please leave a comment to let me know what you think about it! Share it to your friends and learn new things together.
Transcript
Springer Tracts in Civil Engineering
Recycled Aggregate Concrete Structures
Jianzhuang Xiao

Springer Tracts in Civil Engineering

Springer Tracts in Civil Engineering (STCE) publishes the latest developmentsin Civil Engineering—quickly, informally and in top quality. The series scopeincludes monographs, professional books, graduate textbooks and edited volumes,as well as outstanding Ph.D. theses. Its goal is to cover all the main branches of civilengineering, both theoretical and applied, including:
Construction and Structural MechanicsBuilding MaterialsConcrete, Steel and Timber StructuresGeotechnical EngineeringEarthquake EngineeringCoastal EngineeringHydraulics, Hydrology and Water Resources EngineeringEnvironmental Engineering and SustainabilityStructural Health and MonitoringSurveying and Geographical Information SystemsHeating, Ventilation and Air Conditioning (HVAC)Transportation and TrafficRisk AnalysisSafety and SecurityTo submit a proposal or request further information, please contact: Pierpaolo Rivaat [email protected], or Li Shen at [email protected]
More information about this series at http://www.springer.com/series/15088
Jianzhuang Xiao
Recycled AggregateConcrete Structures
123

Jianzhuang XiaoCollege of Civil EngineeringTongji UniversityShanghaiChina
ISSN 2366-259X ISSN 2366-2603 (electronic)Springer Tracts in Civil EngineeringISBN 978-3-662-53985-9 ISBN 978-3-662-53987-3 (eBook)https://doi.org/10.1007/978-3-662-53987-3
Library of Congress Control Number: 2017932433
© Springer-Verlag GmbH Germany 2018This work is subject to copyright. All rights are reserved by the Publisher, whether the whole or partof the material is concerned, specifically the rights of translation, reprinting, reuse of illustrations,recitation, broadcasting, reproduction on microfilms or in any other physical way, and transmissionor information storage and retrieval, electronic adaptation, computer software, or by similar or dissimilarmethodology now known or hereafter developed.The use of general descriptive names, registered names, trademarks, service marks, etc. in thispublication does not imply, even in the absence of a specific statement, that such names are exempt fromthe relevant protective laws and regulations and therefore free for general use.The publisher, the authors and the editors are safe to assume that the advice and information in thisbook are believed to be true and accurate at the date of publication. Neither the publisher nor theauthors or the editors give a warranty, express or implied, with respect to the material contained herein orfor any errors or omissions that may have been made. The publisher remains neutral with regard tojurisdictional claims in published maps and institutional affiliations.
Printed on acid-free paper
This Springer imprint is published by Springer NatureThe registered company is Springer-Verlag GmbH GermanyThe registered company address is: Heidelberger Platz 3, 14197 Berlin, Germany
Preface
The re-use and recycling of building waste have been very important in helping torealize the saving of building materials, economic and sustainable development inthe building industry. In recent years, the Chinese building industry has seenrevitalization in rapid growth, and it also has strengthened the requirements forreduction in Construction and Demolition Waste emissions.
This has enabled the author to conduct systematic research and make someachievements in the research on recycled concrete materials, structures and appli-cations. This book contains the initial and advanced research achievements by theauthor’s research group on recycled concrete materials, structures and actualapplications in engineering projects. The author with a very good understandingof the Chinese building industry (including the amount of cement used in con-struction, the amount of construction and demolition waste) and its influence on theenvironment, has been searching for ways in which to tackle all these issues. Therecycled concrete research has helped solve these issues to a greater extent. Thegovernment has also been involved in editing guidelines to enable proper conductby various parties in society, thereby having a set of rules to follow in the handlingof building construction and demolition waste in general, and waste concrete inparticular.
This book contains 15 chapters, which are the introduction, reclaim of wasteconcrete, recycled aggregates, recycled aggregate concrete, modeled recycledaggregate concrete, strength of recycled aggregate concrete, constitutive relation-ship of recycled aggregate concrete, long-term properties of recycled aggregateconcrete, bond-slip between recycled aggregate concrete and rebars, structuralbehavior of recycled aggregate concrete elements, seismic performance of recycledaggregate concrete columns, seismic performance of recycled aggregate concretestructures, seismic performance of recycled aggregate concrete block structures,products and constructions with recycled aggregate concrete and lastly the guide-lines for recycled aggregate concrete materials and structures.
It is the author’s hope that after the reader has read this book, not only willhe/she have an understanding of recycled concrete, but will also understand theimportance of its application in modern and sustainable society.
v

The author may have omitted some content or due to the limited knowledge oncertain aspects, the readers are welcome to point out the errors they may comeacross in the book, and the author is hereby thankful in advance.
Shanghai, China Jianzhuang XiaoMay 2017
vi Preface

Acknowledgements
The author has received following research grants to sponsor the related researchprograms:
• National Natural Science Foundation for Distinguished Young Scholars ofChina (No. 51325802).
• National Natural Science Foundation of China (No. 51178340);• National Natural Science Foundation of China (No. 51438007);• National Natural Science Foundation of China (No. 5161101205);• NSFC Research Fund for International Young Scientist (No. 51250110074;
51550110234);• China-Japanese Research Cooperative Program sponsored by Ministry of
Science and technology in China (No. 2016YFE0118200);• China Key Projects in the National Science & Technology Pillar Program
(No. 2008BAK48B03; 2006BAK13B07);• Shanghai Science and Technology Committee (No. 02DZ12104;
No. 04DZ05044; No. 10231202000; No. 14231201300);• China New Century Excellent Talents in University by Chinese Education
Ministry (No. NCET-06-0383);• German Academic Exchange Service (DAAD);• German Research Foundation (DFG, Project-No. ZH 15/18-1);• Alexander von Humboldt Foundation (AvH, No. 1072862);
Graduate students in the author’s research group contributed a great deal to theresearch work and completion of this book, they included Dr. Bin Lei, Dr. YuedongSun, Dr. Qiong Liu, Dr. Changqing Wang, Dr. Jingwei Ying, Dr. Wengui Li, Dr.Yuhui Fan, Dr. Yijie Huang, Dr. M.M Tawana, Dr. Loan T Pham, Dr. Long Li,Dr. Chang Sun, Dr. Kaijian Zhang, Dr. Chunhui Wang, Dr. Tao Ding and Dr.Amardeep Singh, Dr. Tan Li and Mr. Jiabin Li, Mr. Yang Lan, Mr. Xiaohui Zhu,Mr. Junlong Wang, Mr. Pisheng Li, Mr. Xin Wang, Mr. Yungang Chen, Mr.Yunbiao Huang, Mr. Jian Huang, Mr. Hongda Zhang, Mr. Biao Yuan, Mr. JiangtaoDu, Ms. Jie Yang, Mr. Xiao Huang, Mr. Jiangde Huang, Mr. He Xie, Mr. Feng
vii
Zhang, Mr. Ge Gao, Mr. Junqiang Yuan, Mr. Jie Pu, Mr. Xinghan Jiang,Mr. Zhuangbin Lin, Mr. Deng Lu, Mr. Guanzhen Zhang, Mr. Zhengjiu Zhou, et al.
The author would like to extend his gratitude to all the people who have helpedin various researches and also in the compilation of this book.
Special thanks to Production Editors, Ms. Parvathidevi and Mr. Parimelazhaganas they did much of the edit work during all the compilation of this book.
There have been many difficulties encountered during the research work, thanksto Prof. Surendra P. Shah, Prof. David A. Lange, Prof. Chuanzeng Zhang, Prof. CSPoon, Prof. Jie Li, Prof. Zhenping Sun, Prof. Yamei Zhang, Prof. ZH Sun, Prof.Vivian WY Tam, Prof. LM Shen, Dr. Ali Akbar Nezhad and Prof. ShengdongZhang for their kind help and insights on the overall research work. Of course, itmay not be possible to list all the people who have helped both in various researchand writing of this book, the author would like to thank them for their efforts andinputs.
May 2017 Jianzhuang Xiao
viii Acknowledgements
Contents
1 Introduction . . . . . . . . . . . . . . . . . . . . . . . . . . . . . . . . . . . . . . . . . . . . . 11.1 Sustainable Development of Building Industry . . . . . . . . . . . . . . 1
1.1.1 The Consumption of Energy and Resourcesin Building Industry . . . . . . . . . . . . . . . . . . . . . . . . . . . 1
1.1.2 New Strategies for Sustainable Developmentin Building Industry . . . . . . . . . . . . . . . . . . . . . . . . . . . 2
1.1.3 The Significant Role of Concrete Industryin Implementing “Sustainable Development”Strategies . . . . . . . . . . . . . . . . . . . . . . . . . . . . . . . . . . . . 4
1.2 Concrete Recycling and Reusing . . . . . . . . . . . . . . . . . . . . . . . . 51.2.1 The Life Cycle and Extension of Concrete
Structures . . . . . . . . . . . . . . . . . . . . . . . . . . . . . . . . . . . 51.2.2 Waste Concrete . . . . . . . . . . . . . . . . . . . . . . . . . . . . . . . 61.2.3 Recycled Aggregate Concrete . . . . . . . . . . . . . . . . . . . . 7
1.3 An Overview on the Worldwide and China’s Waste ConcreteRecycling Techniques . . . . . . . . . . . . . . . . . . . . . . . . . . . . . . . . . 81.3.1 Worldwide Waste Concrete Recycling Techniques . . . . 81.3.2 The Development of RAC Technology in China. . . . . . 10
1.4 Problems to Research RAC and Forecast of DevelopingTrend . . . . . . . . . . . . . . . . . . . . . . . . . . . . . . . . . . . . . . . . . . . . . 111.4.1 Primary Problems . . . . . . . . . . . . . . . . . . . . . . . . . . . . . 111.4.2 Forecast of Developing Trend . . . . . . . . . . . . . . . . . . . . 11
1.5 Scientific Subject Chain in Civil Engineering . . . . . . . . . . . . . . . 121.6 Book’s Outline . . . . . . . . . . . . . . . . . . . . . . . . . . . . . . . . . . . . . . 12References. . . . . . . . . . . . . . . . . . . . . . . . . . . . . . . . . . . . . . . . . . . . . . . 13
2 Reclaim of Waste Concrete. . . . . . . . . . . . . . . . . . . . . . . . . . . . . . . . . 152.1 Introduction . . . . . . . . . . . . . . . . . . . . . . . . . . . . . . . . . . . . . . . . 152.2 Source of Waste Concrete . . . . . . . . . . . . . . . . . . . . . . . . . . . . . 15
ix

2.2.1 General Sources—Pavement, Buildings, Bridgesand Other Types of Constructions . . . . . . . . . . . . . . . . . 15
2.2.2 Disasters . . . . . . . . . . . . . . . . . . . . . . . . . . . . . . . . . . . . 172.3 Quantity of Waste Concrete . . . . . . . . . . . . . . . . . . . . . . . . . . . . 19
2.3.1 Quantity in China . . . . . . . . . . . . . . . . . . . . . . . . . . . . . 192.3.2 Future Tendency Forecast . . . . . . . . . . . . . . . . . . . . . . . 23
2.4 Classification of Waste Concrete . . . . . . . . . . . . . . . . . . . . . . . . 252.4.1 Standard . . . . . . . . . . . . . . . . . . . . . . . . . . . . . . . . . . . . 252.4.2 Classification . . . . . . . . . . . . . . . . . . . . . . . . . . . . . . . . . 26
2.5 Reduce Principle and Methods . . . . . . . . . . . . . . . . . . . . . . . . . . 282.5.1 Reasonable Plan . . . . . . . . . . . . . . . . . . . . . . . . . . . . . . 282.5.2 Elaborate Design . . . . . . . . . . . . . . . . . . . . . . . . . . . . . . 292.5.3 Ecological Materials . . . . . . . . . . . . . . . . . . . . . . . . . . . 302.5.4 Green Construction . . . . . . . . . . . . . . . . . . . . . . . . . . . . 30
2.6 Reuse Materials and Elements . . . . . . . . . . . . . . . . . . . . . . . . . . 312.6.1 Recycled Blocks . . . . . . . . . . . . . . . . . . . . . . . . . . . . . . 322.6.2 Reuse Elements . . . . . . . . . . . . . . . . . . . . . . . . . . . . . . . 32
2.7 Recycling . . . . . . . . . . . . . . . . . . . . . . . . . . . . . . . . . . . . . . . . . . 332.7.1 Low-Grade Recycling . . . . . . . . . . . . . . . . . . . . . . . . . . 342.7.2 High-Grade Recycling . . . . . . . . . . . . . . . . . . . . . . . . . . 35
2.8 Concluding Remarks. . . . . . . . . . . . . . . . . . . . . . . . . . . . . . . . . . 35References. . . . . . . . . . . . . . . . . . . . . . . . . . . . . . . . . . . . . . . . . . . . . . . 36
3 Recycled Aggregates . . . . . . . . . . . . . . . . . . . . . . . . . . . . . . . . . . . . . . 393.1 Crushing and Sieving Techniques. . . . . . . . . . . . . . . . . . . . . . . . 39
3.1.1 Worldwide Waste Concrete Crushing Techniques . . . . . 393.1.2 China’s Waste Concrete Crushing Techniques . . . . . . . 413.1.3 Crushing Equipment . . . . . . . . . . . . . . . . . . . . . . . . . . . 44
3.2 Recycled Fine Aggregates . . . . . . . . . . . . . . . . . . . . . . . . . . . . . 463.2.1 Properties . . . . . . . . . . . . . . . . . . . . . . . . . . . . . . . . . . . 463.2.2 Classification . . . . . . . . . . . . . . . . . . . . . . . . . . . . . . . . . 463.2.3 Testing Method . . . . . . . . . . . . . . . . . . . . . . . . . . . . . . . 48
3.3 Recycled Coarse Aggregates. . . . . . . . . . . . . . . . . . . . . . . . . . . . 483.3.1 Single Source of RCA. . . . . . . . . . . . . . . . . . . . . . . . . . 483.3.2 Multi Source of RCA . . . . . . . . . . . . . . . . . . . . . . . . . . 53
3.4 Method of Classifying and Testing for RCA . . . . . . . . . . . . . . . 553.4.1 Study on RCA Classification . . . . . . . . . . . . . . . . . . . . . 553.4.2 Testing Methods . . . . . . . . . . . . . . . . . . . . . . . . . . . . . . 58
3.5 Pre-treating and Enhancement. . . . . . . . . . . . . . . . . . . . . . . . . . . 593.5.1 Adjusting Mix Proportion . . . . . . . . . . . . . . . . . . . . . . . 593.5.2 Chemical Method . . . . . . . . . . . . . . . . . . . . . . . . . . . . . 603.5.3 Physical Method . . . . . . . . . . . . . . . . . . . . . . . . . . . . . . 60
3.6 Concluding Remarks. . . . . . . . . . . . . . . . . . . . . . . . . . . . . . . . . . 61References. . . . . . . . . . . . . . . . . . . . . . . . . . . . . . . . . . . . . . . . . . . . . . . 61
x Contents
4 Recycled Aggregate Concrete . . . . . . . . . . . . . . . . . . . . . . . . . . . . . . . 654.1 Requirement for Mix Proportion Design. . . . . . . . . . . . . . . . . . . 65
4.1.1 General Points . . . . . . . . . . . . . . . . . . . . . . . . . . . . . . . . 654.1.2 Cementitious Material . . . . . . . . . . . . . . . . . . . . . . . . . . 664.1.3 Aggregates. . . . . . . . . . . . . . . . . . . . . . . . . . . . . . . . . . . 674.1.4 Admixtures . . . . . . . . . . . . . . . . . . . . . . . . . . . . . . . . . . 674.1.5 Chemical Admixtures . . . . . . . . . . . . . . . . . . . . . . . . . . 67
4.2 Compressive Strength-Based Mix Proportion DesignMethod . . . . . . . . . . . . . . . . . . . . . . . . . . . . . . . . . . . . . . . . . . . . 684.2.1 Review Points . . . . . . . . . . . . . . . . . . . . . . . . . . . . . . . . 684.2.2 Calculation Steps . . . . . . . . . . . . . . . . . . . . . . . . . . . . . . 68
4.3 Durability-Based Mix Proportion Design Method. . . . . . . . . . . . 734.3.1 Review . . . . . . . . . . . . . . . . . . . . . . . . . . . . . . . . . . . . . 734.3.2 Design Program. . . . . . . . . . . . . . . . . . . . . . . . . . . . . . . 74
4.4 Other Mix Proportion Design Methods. . . . . . . . . . . . . . . . . . . . 764.4.1 Volumetric Design Method . . . . . . . . . . . . . . . . . . . . . . 764.4.2 Application of Computers in the Design of the Mix
Proportion . . . . . . . . . . . . . . . . . . . . . . . . . . . . . . . . . . . 774.4.3 Application of Artificial Neural Network. . . . . . . . . . . . 774.4.4 Application of Artificial Neural Network Expert
System. . . . . . . . . . . . . . . . . . . . . . . . . . . . . . . . . . . . . . 774.5 Microstructure of RAC . . . . . . . . . . . . . . . . . . . . . . . . . . . . . . . . 78
4.5.1 Micro-Composition of RAC . . . . . . . . . . . . . . . . . . . . . 784.5.2 SEM Testing . . . . . . . . . . . . . . . . . . . . . . . . . . . . . . . . . 794.5.3 Pore Structure Testing . . . . . . . . . . . . . . . . . . . . . . . . . . 80
4.6 ITZ Nanoindention . . . . . . . . . . . . . . . . . . . . . . . . . . . . . . . . . . . 824.6.1 Testing Preparation . . . . . . . . . . . . . . . . . . . . . . . . . . . . 824.6.2 Grid Nanoindentation Results . . . . . . . . . . . . . . . . . . . . 874.6.3 Grid Nanoindentation on Paste Matrix . . . . . . . . . . . . . 904.6.4 Imaging Nanoindentation Result . . . . . . . . . . . . . . . . . . 91
4.7 Damage of RAC. . . . . . . . . . . . . . . . . . . . . . . . . . . . . . . . . . . . . 924.7.1 Initial Damage of RAC . . . . . . . . . . . . . . . . . . . . . . . . . 934.7.2 Damage Evolution of RAC . . . . . . . . . . . . . . . . . . . . . . 93
4.8 Improvements of RAC . . . . . . . . . . . . . . . . . . . . . . . . . . . . . . . . 954.8.1 ITZ Improvements—Physical and Chemical . . . . . . . . . 954.8.2 Two-Stage Mixing Approach. . . . . . . . . . . . . . . . . . . . . 96
4.9 Concluding Remarks. . . . . . . . . . . . . . . . . . . . . . . . . . . . . . . . . . 97References. . . . . . . . . . . . . . . . . . . . . . . . . . . . . . . . . . . . . . . . . . . . . . . 97
5 Modeled Recycled Aggregate Concrete . . . . . . . . . . . . . . . . . . . . . . . 995.1 Concept and Realization . . . . . . . . . . . . . . . . . . . . . . . . . . . . . . . 99
5.1.1 Philosophy. . . . . . . . . . . . . . . . . . . . . . . . . . . . . . . . . . . 995.1.2 Method . . . . . . . . . . . . . . . . . . . . . . . . . . . . . . . . . . . . . 100
5.2 Cracking Propagation of MRAC. . . . . . . . . . . . . . . . . . . . . . . . . 103
Contents xi

5.2.1 Digital Image Correlation Technique . . . . . . . . . . . . . . . 1035.2.2 Loading System. . . . . . . . . . . . . . . . . . . . . . . . . . . . . . . 1035.2.3 Crack Pattern and Failure Mode . . . . . . . . . . . . . . . . . . 104
5.3 Stress Distribution in MRAC . . . . . . . . . . . . . . . . . . . . . . . . . . . 1075.3.1 Analytical Procedures . . . . . . . . . . . . . . . . . . . . . . . . . . 1075.3.2 Simulation and Test Verification . . . . . . . . . . . . . . . . . . 1095.3.3 Effects of Relative Properties of ITZs . . . . . . . . . . . . . . 112
5.4 Modification of Modeled Recycled Aggregate Concreteby Carbonation . . . . . . . . . . . . . . . . . . . . . . . . . . . . . . . . . . . . . . 1155.4.1 Experimental Program . . . . . . . . . . . . . . . . . . . . . . . . . . 1155.4.2 Experimental Results and Discussions . . . . . . . . . . . . . . 1185.4.3 Summary . . . . . . . . . . . . . . . . . . . . . . . . . . . . . . . . . . . . 124
5.5 Chloride Diffusion in Modeled Recycled AggregateConcrete . . . . . . . . . . . . . . . . . . . . . . . . . . . . . . . . . . . . . . . . . . . 1255.5.1 Specimen Design. . . . . . . . . . . . . . . . . . . . . . . . . . . . . . 1255.5.2 Simulation Procedure. . . . . . . . . . . . . . . . . . . . . . . . . . . 1265.5.3 Parametric Study . . . . . . . . . . . . . . . . . . . . . . . . . . . . . . 1275.5.4 Results and Discussions. . . . . . . . . . . . . . . . . . . . . . . . . 129
5.6 Concluding Remarks. . . . . . . . . . . . . . . . . . . . . . . . . . . . . . . . . . 141References. . . . . . . . . . . . . . . . . . . . . . . . . . . . . . . . . . . . . . . . . . . . . . . 142
6 Strength of Recycled Aggregate Concrete . . . . . . . . . . . . . . . . . . . . . 1436.1 Compressive Strength . . . . . . . . . . . . . . . . . . . . . . . . . . . . . . . . . 143
6.1.1 The Characteristics of Cube Compressive Strength . . . . 1446.1.2 Factors Influencing the Cube Compressive Strength . . . 145
6.2 Distribution of the Compressive Strength . . . . . . . . . . . . . . . . . . 1466.2.1 The Histogram of the Compressive Strength . . . . . . . . . 1466.2.2 Examining the Distribution Characteristics
of the Compressive Strength . . . . . . . . . . . . . . . . . . . . . 1486.2.3 Simulation of the Compressive Strength
Distribution . . . . . . . . . . . . . . . . . . . . . . . . . . . . . . . . . . 1486.2.4 Strength Index Value. . . . . . . . . . . . . . . . . . . . . . . . . . . 150
6.3 Tensile Strength and Flexural Strength . . . . . . . . . . . . . . . . . . . . 1516.3.1 Tensile Strength. . . . . . . . . . . . . . . . . . . . . . . . . . . . . . . 1516.3.2 Flexural Properties. . . . . . . . . . . . . . . . . . . . . . . . . . . . . 152
6.4 The Relationship of Mechanical Indexes . . . . . . . . . . . . . . . . . . 1536.4.1 Cube Compressive Strength and Prism Compressive
Strength . . . . . . . . . . . . . . . . . . . . . . . . . . . . . . . . . . . . . 1536.4.2 Splitting Tensile Strength and Cube Compressive
Strength . . . . . . . . . . . . . . . . . . . . . . . . . . . . . . . . . . . . . 1546.4.3 Flexural Strength and Cube Compressive Strength . . . . 155
6.5 Effects of Elevated Temperatures on Strength. . . . . . . . . . . . . . . 1566.5.1 Residual Compressive Strength . . . . . . . . . . . . . . . . . . . 1566.5.2 Residual Flexure Strength . . . . . . . . . . . . . . . . . . . . . . . 160
xii Contents

6.5.3 Comparisons Between Residual Compressiveand Flexural Strength of RAC. . . . . . . . . . . . . . . . . . . . 162
6.6 Concluding Remarks. . . . . . . . . . . . . . . . . . . . . . . . . . . . . . . . . . 163References. . . . . . . . . . . . . . . . . . . . . . . . . . . . . . . . . . . . . . . . . . . . . . . 164
7 Constitutive Relationship of Recycled Aggregate Concrete . . . . . . . 1677.1 Stress–Strain Relationship Under Axial Compressive
Loading . . . . . . . . . . . . . . . . . . . . . . . . . . . . . . . . . . . . . . . . . . . 1677.1.1 Test . . . . . . . . . . . . . . . . . . . . . . . . . . . . . . . . . . . . . . . . 1677.1.2 Curves of the Stress–Strain Relationship of RAC . . . . . 1697.1.3 Peak Stress . . . . . . . . . . . . . . . . . . . . . . . . . . . . . . . . . . 1727.1.4 Peak Strain . . . . . . . . . . . . . . . . . . . . . . . . . . . . . . . . . . 1727.1.5 Ultimate Strain . . . . . . . . . . . . . . . . . . . . . . . . . . . . . . . 1737.1.6 Elastic Modulus. . . . . . . . . . . . . . . . . . . . . . . . . . . . . . . 1737.1.7 Poisson’s Ratio . . . . . . . . . . . . . . . . . . . . . . . . . . . . . . . 174
7.2 Variation Evaluation of Stress–Strain Relationship for RAC . . . 1747.2.1 Experimental Programs . . . . . . . . . . . . . . . . . . . . . . . . . 1747.2.2 Experimental Results . . . . . . . . . . . . . . . . . . . . . . . . . . . 1777.2.3 Summary . . . . . . . . . . . . . . . . . . . . . . . . . . . . . . . . . . . . 178
7.3 Stress–Strain Relationship Under Axial Tensile Loading . . . . . . 1817.3.1 Experimental Descriptions . . . . . . . . . . . . . . . . . . . . . . . 1817.3.2 Results and Discussion . . . . . . . . . . . . . . . . . . . . . . . . . 1847.3.3 Simulation with Lattice Model . . . . . . . . . . . . . . . . . . . 191
7.4 Stress–Strain Relationship Under Confinements . . . . . . . . . . . . . 1967.4.1 Test . . . . . . . . . . . . . . . . . . . . . . . . . . . . . . . . . . . . . . . . 1967.4.2 Analysis. . . . . . . . . . . . . . . . . . . . . . . . . . . . . . . . . . . . . 2037.4.3 Theoretical Analysis . . . . . . . . . . . . . . . . . . . . . . . . . . . 2087.4.4 Stress–Strain Relation of RCFS. . . . . . . . . . . . . . . . . . . 2107.4.5 Stress–Strain Relation of RCFF. . . . . . . . . . . . . . . . . . . 213
7.5 Shear Stress–Slip Relationship Under Shear Loading . . . . . . . . . 2157.5.1 Test . . . . . . . . . . . . . . . . . . . . . . . . . . . . . . . . . . . . . . . . 2157.5.2 Analysis of Test Results . . . . . . . . . . . . . . . . . . . . . . . . 224
7.6 Compressive Behavior Under Impact Loading . . . . . . . . . . . . . . 2327.6.1 Experimental Program . . . . . . . . . . . . . . . . . . . . . . . . . . 2327.6.2 Test Results . . . . . . . . . . . . . . . . . . . . . . . . . . . . . . . . . . 2367.6.3 Test Analysis and Discussion . . . . . . . . . . . . . . . . . . . . 239
7.7 Concluding Remarks. . . . . . . . . . . . . . . . . . . . . . . . . . . . . . . . . . 246References. . . . . . . . . . . . . . . . . . . . . . . . . . . . . . . . . . . . . . . . . . . . . . . 248
8 Long-Term Property of Recycled Aggregate Concrete . . . . . . . . . . . 2518.1 Shrinkage and Creep Characteristics . . . . . . . . . . . . . . . . . . . . . . 251
8.1.1 Experimental Programme. . . . . . . . . . . . . . . . . . . . . . . . 2518.1.2 Experimental Results . . . . . . . . . . . . . . . . . . . . . . . . . . . 254
Contents xiii

8.2 Carbonation Resistance Performance . . . . . . . . . . . . . . . . . . . . . 2588.2.1 Existing Prediction Models of Carbonation Depth. . . . . 2588.2.2 Carbonation Test of RAC . . . . . . . . . . . . . . . . . . . . . . . 261
8.3 Chloride Diffusion Resistance Performance . . . . . . . . . . . . . . . . 2708.3.1 Rapid Chloride Test (RCT) . . . . . . . . . . . . . . . . . . . . . . 2708.3.2 Rapid Chloride Migration (RCM) Test . . . . . . . . . . . . . 280
8.4 Fatigue Behavior. . . . . . . . . . . . . . . . . . . . . . . . . . . . . . . . . . . . . 2868.4.1 Fatigue Testing . . . . . . . . . . . . . . . . . . . . . . . . . . . . . . . 2868.4.2 Compressive Fatigue Test Results and Analysis . . . . . . 2878.4.3 Bending Fatigue Test Results and Analysis . . . . . . . . . . 292
8.5 Concluding Remarks. . . . . . . . . . . . . . . . . . . . . . . . . . . . . . . . . . 294References. . . . . . . . . . . . . . . . . . . . . . . . . . . . . . . . . . . . . . . . . . . . . . . 295
9 Bond–Slip Between Recycled Aggregate Concrete and Rebars . . . .. . . . 2999.1 Bond Between RAC and Normal Rebars . . . . . . . . . . . . . . . . . . 299
9.1.1 Test . . . . . . . . . . . . . . . . . . . . . . . . . . . . . . . . . . . . . . . . 2999.1.2 Analysis. . . . . . . . . . . . . . . . . . . . . . . . . . . . . . . . . . . . . 302
9.2 Bond Between RAC and Eroded Rebars . . . . . . . . . . . . . . . . . . 3089.2.1 Test . . . . . . . . . . . . . . . . . . . . . . . . . . . . . . . . . . . . . . . . 3089.2.2 Analysis. . . . . . . . . . . . . . . . . . . . . . . . . . . . . . . . . . . . . 311
9.3 Concluding Remarks. . . . . . . . . . . . . . . . . . . . . . . . . . . . . . . . . . 316References. . . . . . . . . . . . . . . . . . . . . . . . . . . . . . . . . . . . . . . . . . . . . . . 318
10 Structural Behavior of Recycled Aggregate Concrete Elements. . . .. . . . 32110.1 RAC Beams . . . . . . . . . . . . . . . . . . . . . . . . . . . . . . . . . . . . . . . . 321
10.1.1 Flexural Behavior of RAC Beams . . . . . . . . . . . . . . . . . 32110.1.2 Shear Behavior of RAC Beams . . . . . . . . . . . . . . . . . . . 331
10.2 RAC Semi-precast Beams. . . . . . . . . . . . . . . . . . . . . . . . . . . . . . 33710.2.1 Design of RAC Semi-precast Beams . . . . . . . . . . . . . . . 33810.2.2 Flexural Behavior of RAC Semi-precast Beams . . . . . . 34210.2.3 Shear Behavior of RAC Semi-precast Beams . . . . . . . . 346
10.3 RAC Slabs . . . . . . . . . . . . . . . . . . . . . . . . . . . . . . . . . . . . . . . . . 35210.3.1 Flexural Behavior of RAC Gradient Slabs. . . . . . . . . . . 35210.3.2 Punching Shear Behavior of RAC Slabs . . . . . . . . . . . . 365
10.4 RAC Columns . . . . . . . . . . . . . . . . . . . . . . . . . . . . . . . . . . . . . . 38110.4.1 Design of RAC Columns. . . . . . . . . . . . . . . . . . . . . . . . 38110.4.2 Analysis of RAC Columns . . . . . . . . . . . . . . . . . . . . . . 38110.4.3 Reliability Analysis of RAC Columns. . . . . . . . . . . . . . 385
10.5 Concluding Remarks. . . . . . . . . . . . . . . . . . . . . . . . . . . . . . . . . . 391References. . . . . . . . . . . . . . . . . . . . . . . . . . . . . . . . . . . . . . . . . . . . . . . 392
11 Seismic Performance of Recycled Aggregate ConcreteColumns . . . . . . . . . . . . . . . . . . . . . . . . . . . . . . . . . . . . . . . . . . . . . . . . 39511.1 Introduction . . . . . . . . . . . . . . . . . . . . . . . . . . . . . . . . . . . . . . . . 39511.2 Low-Frequency Reversed Loading of Semi-Precast Columns . . . 397
xiv Contents

11.2.1 Experimental Program . . . . . . . . . . . . . . . . . . . . . . . . . . 39711.2.2 Test Analysis. . . . . . . . . . . . . . . . . . . . . . . . . . . . . . . . . 403
11.3 Low-Frequency Reversed Loading on Tube-ConfinedColumns . . . . . . . . . . . . . . . . . . . . . . . . . . . . . . . . . . . . . . . . . . . 41411.3.1 Experimental Program . . . . . . . . . . . . . . . . . . . . . . . . . . 41411.3.2 Test Analysis. . . . . . . . . . . . . . . . . . . . . . . . . . . . . . . . . 418
11.4 Concluding Remarks. . . . . . . . . . . . . . . . . . . . . . . . . . . . . . . . . . 428References. . . . . . . . . . . . . . . . . . . . . . . . . . . . . . . . . . . . . . . . . . . . . . . 431
12 Seismic Performance of Recycled Aggregate ConcreteStructures. . . . . . . . . . . . . . . . . . . . . . . . . . . . . . . . . . . . . . . . . . . . . . . 43312.1 Introduction . . . . . . . . . . . . . . . . . . . . . . . . . . . . . . . . . . . . . . . . 43312.2 Low-Frequency Reversed Loading on Frame Joints . . . . . . . . . . 433
12.2.1 Experimental Program . . . . . . . . . . . . . . . . . . . . . . . . . . 43312.2.2 Test Result . . . . . . . . . . . . . . . . . . . . . . . . . . . . . . . . . . 43612.2.3 Test Analysis. . . . . . . . . . . . . . . . . . . . . . . . . . . . . . . . . 43712.2.4 Nonlinear Analysis . . . . . . . . . . . . . . . . . . . . . . . . . . . . 440
12.3 Low-Frequency Reversed Loading on Plane Frame . . . . . . . . . . 44412.3.1 Experimental Program . . . . . . . . . . . . . . . . . . . . . . . . . . 44412.3.2 Test Analysis. . . . . . . . . . . . . . . . . . . . . . . . . . . . . . . . . 447
12.4 Shaking Table Test on Cast-in-Situ Space Frame . . . . . . . . . . . . 45312.4.1 Experimental Program . . . . . . . . . . . . . . . . . . . . . . . . . . 45312.4.2 Test Analysis. . . . . . . . . . . . . . . . . . . . . . . . . . . . . . . . . 45712.4.3 Nonlinear Analysis . . . . . . . . . . . . . . . . . . . . . . . . . . . . 465
12.5 Shaking Table Test on Precast Space Frame. . . . . . . . . . . . . . . . 48412.5.1 Experimental Program . . . . . . . . . . . . . . . . . . . . . . . . . . 48412.5.2 Test Results and Analysis . . . . . . . . . . . . . . . . . . . . . . . 49012.5.3 Simulation Modeling . . . . . . . . . . . . . . . . . . . . . . . . . . . 50412.5.4 Simulated Results and Validation . . . . . . . . . . . . . . . . . 50712.5.5 Parametric Study . . . . . . . . . . . . . . . . . . . . . . . . . . . . . . 518
12.6 Concluding Remarks. . . . . . . . . . . . . . . . . . . . . . . . . . . . . . . . . . 522References. . . . . . . . . . . . . . . . . . . . . . . . . . . . . . . . . . . . . . . . . . . . . . . 523
13 Seismic Performance of Recycled Aggregate Concrete BlockStructures. . . . . . . . . . . . . . . . . . . . . . . . . . . . . . . . . . . . . . . . . . . . . . . 52513.1 Design of the RAC Hollow Block Walls . . . . . . . . . . . . . . . . . . 525
13.1.1 Test Specimens . . . . . . . . . . . . . . . . . . . . . . . . . . . . . . . 52513.1.2 Test Set-up, Instruments, and Procedure . . . . . . . . . . . . 527
13.2 Test Results of the RAC Hollow Block Walls . . . . . . . . . . . . . . 52813.2.1 Failure Patterns . . . . . . . . . . . . . . . . . . . . . . . . . . . . . . . 52813.2.2 The Role of Tie Column . . . . . . . . . . . . . . . . . . . . . . . . 53013.2.3 Main Results . . . . . . . . . . . . . . . . . . . . . . . . . . . . . . . . . 530
13.3 Seismic Performance Analysis . . . . . . . . . . . . . . . . . . . . . . . . . . 530
Contents xv
13.3.1 Hysteresis Curve . . . . . . . . . . . . . . . . . . . . . . . . . . . . . . 53013.3.2 Skeleton Curve . . . . . . . . . . . . . . . . . . . . . . . . . . . . . . . 53113.3.3 Ductility Analysis . . . . . . . . . . . . . . . . . . . . . . . . . . . . . 53213.3.4 Energy Dissipation Capacity . . . . . . . . . . . . . . . . . . . . . 53413.3.5 Stiffness Degradation. . . . . . . . . . . . . . . . . . . . . . . . . . . 53513.3.6 Overall Deformation . . . . . . . . . . . . . . . . . . . . . . . . . . . 53613.3.7 Steel Strain . . . . . . . . . . . . . . . . . . . . . . . . . . . . . . . . . . 537
13.4 Verification of Shear Bearing Capacity Formula for HollowBlock Walls . . . . . . . . . . . . . . . . . . . . . . . . . . . . . . . . . . . . . . . . 537
13.5 Design of the RAC Block Masonry Building . . . . . . . . . . . . . . . 54213.5.1 Materials . . . . . . . . . . . . . . . . . . . . . . . . . . . . . . . . . . . . 54213.5.2 Construction . . . . . . . . . . . . . . . . . . . . . . . . . . . . . . . . . 543
13.6 Shake Table Tests. . . . . . . . . . . . . . . . . . . . . . . . . . . . . . . . . . . . 54313.6.1 Description of Shake Table . . . . . . . . . . . . . . . . . . . . . . 54313.6.2 Seismic Wave Selection and Arrangement of
Instruments . . . . . . . . . . . . . . . . . . . . . . . . . . . . . . . . . . 54413.6.3 Loading Program. . . . . . . . . . . . . . . . . . . . . . . . . . . . . . 54813.6.4 Cracking and Failure Pattern . . . . . . . . . . . . . . . . . . . . . 550
13.7 Earthquake Response Analysis of the RAC Block MasonryBuilding . . . . . . . . . . . . . . . . . . . . . . . . . . . . . . . . . . . . . . . . . . . 55213.7.1 Dynamic Characteristics of the Structure . . . . . . . . . . . . 55213.7.2 Acceleration Response. . . . . . . . . . . . . . . . . . . . . . . . . . 55613.7.3 Earthquake Action . . . . . . . . . . . . . . . . . . . . . . . . . . . . . 55813.7.4 Displacement Response . . . . . . . . . . . . . . . . . . . . . . . . . 55913.7.5 Inter-storey Shear Response. . . . . . . . . . . . . . . . . . . . . . 56013.7.6 Fragility Curves for RAC Block Masonry Building . . . 564
13.8 Concluding Remarks. . . . . . . . . . . . . . . . . . . . . . . . . . . . . . . . . . 566References. . . . . . . . . . . . . . . . . . . . . . . . . . . . . . . . . . . . . . . . . . . . . . . 567
14 Products and Constructions with Recycled AggregateConcrete . . . . . . . . . . . . . . . . . . . . . . . . . . . . . . . . . . . . . . . . . . . . . . . . 56914.1 Premix . . . . . . . . . . . . . . . . . . . . . . . . . . . . . . . . . . . . . . . . . . . . 569
14.1.1 Premix Recycled Concrete. . . . . . . . . . . . . . . . . . . . . . . 57014.1.2 RA Mortar. . . . . . . . . . . . . . . . . . . . . . . . . . . . . . . . . . . 57214.1.3 Cement Stabilizing RA . . . . . . . . . . . . . . . . . . . . . . . . . 572
14.2 Precast . . . . . . . . . . . . . . . . . . . . . . . . . . . . . . . . . . . . . . . . . . . . 57314.2.1 Brick and Block . . . . . . . . . . . . . . . . . . . . . . . . . . . . . . 57314.2.2 Recycled Concrete Hollow Block Masonry . . . . . . . . . . 57714.2.3 RAC Panel . . . . . . . . . . . . . . . . . . . . . . . . . . . . . . . . . . 580
14.3 Quality Control by Nondestructive Inspection . . . . . . . . . . . . . . 58214.3.1 Rebound Hammer Test . . . . . . . . . . . . . . . . . . . . . . . . . 58214.3.2 Ultrasonic Pulse Velocity Test (UPV) . . . . . . . . . . . . . . 583
xvi Contents

14.4 Case Study . . . . . . . . . . . . . . . . . . . . . . . . . . . . . . . . . . . . . . . . . 58314.4.1 Pavements—In China . . . . . . . . . . . . . . . . . . . . . . . . . . 58314.4.2 Cast-in-situ RAC Frame Structure . . . . . . . . . . . . . . . . . 58914.4.3 Precast RAC Frame Structure . . . . . . . . . . . . . . . . . . . . 59014.4.4 RAC Masonry and Other Structures . . . . . . . . . . . . . . . 59114.4.5 RAC Frame-Shear Wall Structure . . . . . . . . . . . . . . . . . 59114.4.6 Steel Frame Filled with RA Bricks . . . . . . . . . . . . . . . . 594
14.5 Efficiency Analysis . . . . . . . . . . . . . . . . . . . . . . . . . . . . . . . . . . . 59614.5.1 Introduction . . . . . . . . . . . . . . . . . . . . . . . . . . . . . . . . . . 59614.5.2 Economic Benefits. . . . . . . . . . . . . . . . . . . . . . . . . . . . . 59614.5.3 Overall Environmental Benefits . . . . . . . . . . . . . . . . . . . 598
14.6 Management Strategies . . . . . . . . . . . . . . . . . . . . . . . . . . . . . . . . 60114.6.1 The Recycled Concrete Industry Chain . . . . . . . . . . . . . 60214.6.2 Management Strategies of RAC . . . . . . . . . . . . . . . . . . 60414.6.3 The Application of Computer Technology in RAC
Production Management . . . . . . . . . . . . . . . . . . . . . . . . 60714.7 Concluding Remarks. . . . . . . . . . . . . . . . . . . . . . . . . . . . . . . . . . 609References. . . . . . . . . . . . . . . . . . . . . . . . . . . . . . . . . . . . . . . . . . . . . . . 610
15 Guidelines for Recycled Aggregate Concrete Materialsand Structures . . . . . . . . . . . . . . . . . . . . . . . . . . . . . . . . . . . . . . . . . . . 61115.1 Waste Concrete. . . . . . . . . . . . . . . . . . . . . . . . . . . . . . . . . . . . . . 61115.2 Crush and Sieving . . . . . . . . . . . . . . . . . . . . . . . . . . . . . . . . . . . 612
15.2.1 Processing and Grading of Recycled Aggregates. . . . . . 61215.2.2 Quality Standard for Recycled Aggregates . . . . . . . . . . 61315.2.3 Testing Methods for Recycled Aggregates . . . . . . . . . . 61315.2.4 Regulations for Inspection of Recycled Aggregates. . . . 61415.2.5 Production and Management of Recycled Coarse
Aggregates. . . . . . . . . . . . . . . . . . . . . . . . . . . . . . . . . . . 61515.2.6 Application of Recycled Fine Aggregates . . . . . . . . . . . 616
15.3 Mix Proportion . . . . . . . . . . . . . . . . . . . . . . . . . . . . . . . . . . . . . . 61615.3.1 Methods for the Design of the Mix Proportion . . . . . . . 61615.3.2 Preparation and Transportation . . . . . . . . . . . . . . . . . . . 616
15.4 Materials. . . . . . . . . . . . . . . . . . . . . . . . . . . . . . . . . . . . . . . . . . . 61915.4.1 General Regulations . . . . . . . . . . . . . . . . . . . . . . . . . . . 61915.4.2 Mechanical Properties . . . . . . . . . . . . . . . . . . . . . . . . . . 62015.4.3 Suggestions on the Design of Recycled Concrete
Blocks . . . . . . . . . . . . . . . . . . . . . . . . . . . . . . . . . . . . . . 62315.5 Infrastructure. . . . . . . . . . . . . . . . . . . . . . . . . . . . . . . . . . . . . . . . 626
15.5.1 Design Suggestions for Recycled ConcretePavements . . . . . . . . . . . . . . . . . . . . . . . . . . . . . . . . . . . 626
15.5.2 Suggestions on the Design of Recycled ConcreteStructural Components . . . . . . . . . . . . . . . . . . . . . . . . . 627
Contents xvii

15.6 Construction . . . . . . . . . . . . . . . . . . . . . . . . . . . . . . . . . . . . . . . . 63015.6.1 Casting and Molding . . . . . . . . . . . . . . . . . . . . . . . . . . . 63015.6.2 Concrete Curing . . . . . . . . . . . . . . . . . . . . . . . . . . . . . . 63015.6.3 Quality Inspection . . . . . . . . . . . . . . . . . . . . . . . . . . . . . 631
References. . . . . . . . . . . . . . . . . . . . . . . . . . . . . . . . . . . . . . . . . . . . . . . 632
xviii Contents
About the Author
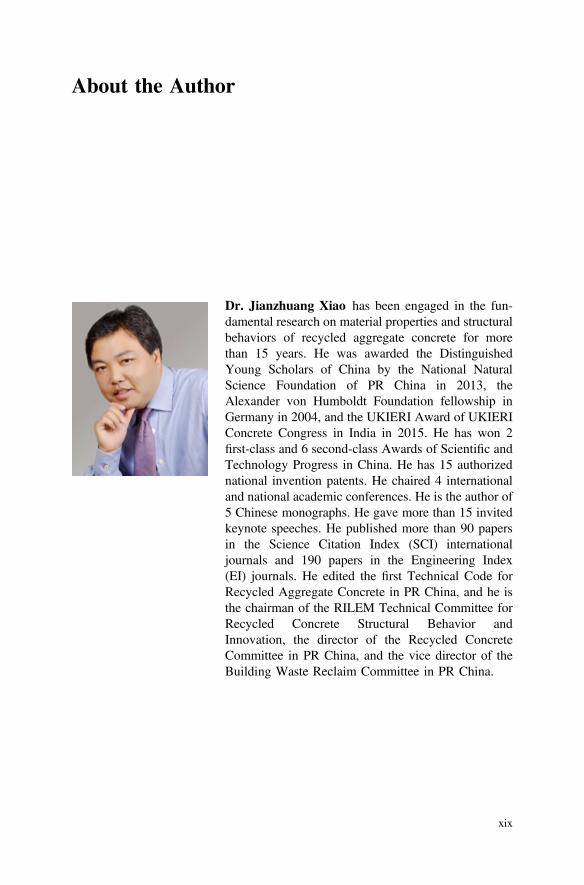
Dr. Jianzhuang Xiao has been engaged in the fun-damental research on material properties and structuralbehaviors of recycled aggregate concrete for morethan 15 years. He was awarded the DistinguishedYoung Scholars of China by the National NaturalScience Foundation of PR China in 2013, theAlexander von Humboldt Foundation fellowship inGermany in 2004, and the UKIERI Award of UKIERIConcrete Congress in India in 2015. He has won 2first-class and 6 second-class Awards of Scientific andTechnology Progress in China. He has 15 authorizednational invention patents. He chaired 4 internationaland national academic conferences. He is the author of5 Chinese monographs. He gave more than 15 invitedkeynote speeches. He published more than 90 papersin the Science Citation Index (SCI) internationaljournals and 190 papers in the Engineering Index(EI) journals. He edited the first Technical Code forRecycled Aggregate Concrete in PR China, and he isthe chairman of the RILEM Technical Committee forRecycled Concrete Structural Behavior andInnovation, the director of the Recycled ConcreteCommittee in PR China, and the vice director of theBuilding Waste Reclaim Committee in PR China.
xix
List of Figures
Figure 1.1 Strategy for sustainability of construction industry . . . . . . . . 3Figure 1.2 Basic procedure for the sustainable development of
building industry . . . . . . . . . . . . . . . . . . . . . . . . . . . . . . . . . . 4Figure 1.3 General model for concrete structure’s life cycle . . . . . . . . . 6Figure 1.4 C and D wastes in China in past 24 years . . . . . . . . . . . . . . 7Figure 1.5 Concept of scientific subject chain in civil engineering. . . . . 13Figure 2.1 Building waste caused by earthquakes . . . . . . . . . . . . . . . . . 18Figure 2.2 A view of building waste in Hanwang town . . . . . . . . . . . . . 24Figure 2.3 Percentage of building waste versus the actual
seismic intensity . . . . . . . . . . . . . . . . . . . . . . . . . . . . . . . . . . 25Figure 2.4 Statistics on the amount of building waste
(classified by damage status of buildings) . . . . . . . . . . . . . . . 27Figure 2.5 Statistics on the amount of building waste
(classified by building materials) . . . . . . . . . . . . . . . . . . . . . . 27Figure 2.6 Statistics on the amount of building waste
(classified by structure types) . . . . . . . . . . . . . . . . . . . . . . . . 28Figure 2.7 Structures using ecological materials . . . . . . . . . . . . . . . . . . . 31Figure 2.8 The waste bricks and reuse . . . . . . . . . . . . . . . . . . . . . . . . . . 32Figure 2.9 Recycling of waste concrete . . . . . . . . . . . . . . . . . . . . . . . . . 33Figure 2.10 Recycled bricks and blocks in Dujiangyan, PR China. . . . . . 35Figure 3.1 Waste concrete recycling technique in Russia . . . . . . . . . . . . 40Figure 3.2 Waste concrete recycling technique in Germany . . . . . . . . . . 41Figure 3.3 Waste concrete recycling process in Japan . . . . . . . . . . . . . . 42Figure 3.4 RA production technique in Taiwan, China . . . . . . . . . . . . . 42Figure 3.5 RA production technique proposed by the author . . . . . . . . . 43Figure 3.6 RA production equipment used in the proposed
technique. . . . . . . . . . . . . . . . . . . . . . . . . . . . . . . . . . . . . . . . 44Figure 3.7 Diagram of a mobile crushing machine. . . . . . . . . . . . . . . . . 44Figure 3.8 Large-scale towed mobile crusher . . . . . . . . . . . . . . . . . . . . . 45Figure 3.9 Medium-scale crawler mobile crusher . . . . . . . . . . . . . . . . . . 45Figure 3.10 Small-scale mobile crusher . . . . . . . . . . . . . . . . . . . . . . . . . . 46
xxi
Figure 3.11 Recycled aggregates . . . . . . . . . . . . . . . . . . . . . . . . . . . . . . . 47Figure 3.12 Gradation curves of NCA and RCA . . . . . . . . . . . . . . . . . . . 49Figure 3.13 Gradation curves of RCA from different parent concrete . . . 53Figure 3.14 The relationship between apparent density and water
absorption of RCA . . . . . . . . . . . . . . . . . . . . . . . . . . . . . . . . 55Figure 4.1 Demonstration of the micro-structure of recycled
concrete. . . . . . . . . . . . . . . . . . . . . . . . . . . . . . . . . . . . . . . . . 79Figure 4.2 Concrete specimens. . . . . . . . . . . . . . . . . . . . . . . . . . . . . . . . 81Figure 4.3 Cross-sectional view with different r . . . . . . . . . . . . . . . . . . . 81Figure 4.4 MIP instrument . . . . . . . . . . . . . . . . . . . . . . . . . . . . . . . . . . . 82Figure 4.5 Distribution of pore structures . . . . . . . . . . . . . . . . . . . . . . . . 82Figure 4.6 Schematic diagram of old and new ITZs in RAC . . . . . . . . . 83Figure 4.7 Optical microscopic images of RAC ITZs
after polishing . . . . . . . . . . . . . . . . . . . . . . . . . . . . . . . . . . . . 85Figure 4.8 Typical indentation in ITZs of RAC . . . . . . . . . . . . . . . . . . . 85Figure 4.9 Schematic view of indented area of old ITZ
and new ITZ in RAC . . . . . . . . . . . . . . . . . . . . . . . . . . . . . . 87Figure 4.10 Grid indentation modulus on ITZs of RAC I at 90 days. . . . 88Figure 4.11 Grid indentation hardness on ITZs of RAC I at 90 days. . . . 89Figure 4.12 Indentation modulus in old and new paste matrices in
RAC I at 90 days . . . . . . . . . . . . . . . . . . . . . . . . . . . . . . . . . 90Figure 4.13 Imaging indentation on old ITZ of RAC I at 90 days . . . . . . 91Figure 4.14 Imaging indentation on new ITZ of RAC I at 90 days . . . . . 92Figure 4.15 Micro-cracks of RCA . . . . . . . . . . . . . . . . . . . . . . . . . . . . . . 93Figure 4.16 Scanning electron microscope images showing
the ITZ of RAC . . . . . . . . . . . . . . . . . . . . . . . . . . . . . . . . . . 94Figure 5.1 Cylindrical aggregate . . . . . . . . . . . . . . . . . . . . . . . . . . . . . . 100Figure 5.2 Geometric dimensions and steel mold of MRAC . . . . . . . . . 101Figure 5.3 Prepared specimens . . . . . . . . . . . . . . . . . . . . . . . . . . . . . . . . 102Figure 5.4 Test setup at the testing site . . . . . . . . . . . . . . . . . . . . . . . . . 103Figure 5.5 Block diagram highlighting details of testing scheme . . . . . . 104Figure 5.6 Gray-scale maps for typical horizontal field
displacement for MRAC . . . . . . . . . . . . . . . . . . . . . . . . . . . . 105Figure 5.7 Gray-scale maps for typical horizontal field strain
for MRAC. . . . . . . . . . . . . . . . . . . . . . . . . . . . . . . . . . . . . . . 106Figure 5.8 Cracks pattern of MRAC specimens . . . . . . . . . . . . . . . . . . . 107Figure 5.9 FEM of MRAC. . . . . . . . . . . . . . . . . . . . . . . . . . . . . . . . . . . 108Figure 5.10 The locations of cross section and ITZs
in MRAC model . . . . . . . . . . . . . . . . . . . . . . . . . . . . . . . . . . 109Figure 5.11 MRAC specimen for uniaxial compressive testing . . . . . . . . 110Figure 5.12 Stress distribution in MRAC under
uniaxial compression. . . . . . . . . . . . . . . . . . . . . . . . . . . . . . . 111Figure 5.13 Stress concentration distribution in the MRAC under
uniaxial compression. . . . . . . . . . . . . . . . . . . . . . . . . . . . . . . 111
xxii List of Figures
Figure 5.14 Testing results on the MRAC under uniaxialloading by DIC . . . . . . . . . . . . . . . . . . . . . . . . . . . . . . . . . . . 112
Figure 5.15 Elastic stress distribution for section A-A for differentEOITZ and ENITZ . . . . . . . . . . . . . . . . . . . . . . . . . . . . . . . . . . 113
Figure 5.16 Elastic stress distribution for old ITZ-B and new ITZ-Cfor different EOITZ and ENITZ . . . . . . . . . . . . . . . . . . . . . . . . 114
Figure 5.17 Geometric dimensions of specimens . . . . . . . . . . . . . . . . . . . 116Figure 5.18 The accelerated carbonation testing apparatus . . . . . . . . . . . . 117Figure 5.19 ITZ in MRAC. . . . . . . . . . . . . . . . . . . . . . . . . . . . . . . . . . . . 118Figure 5.20 Push-out test device . . . . . . . . . . . . . . . . . . . . . . . . . . . . . . . 118Figure 5.21 Type I Cracks . . . . . . . . . . . . . . . . . . . . . . . . . . . . . . . . . . . . 119Figure 5.22 Type II Cracks . . . . . . . . . . . . . . . . . . . . . . . . . . . . . . . . . . . 119Figure 5.23 Type III Cracks . . . . . . . . . . . . . . . . . . . . . . . . . . . . . . . . . . . 119Figure 5.24 Type IV Cracks. . . . . . . . . . . . . . . . . . . . . . . . . . . . . . . . . . . 119Figure 5.25 Influence of carbonation modification on
load-displacement curves. . . . . . . . . . . . . . . . . . . . . . . . . . . . 120Figure 5.26 Simplified model load-displacement curves . . . . . . . . . . . . . . 121Figure 5.27 Load-displacement curves with different w/c of NHM . . . . . 121Figure 5.28 Influence of w/c for NHM on peak load . . . . . . . . . . . . . . . . 122Figure 5.29 Influence of w/c for NHM on peak displacement . . . . . . . . . 122Figure 5.30 Push-out curves with different OHM w/c . . . . . . . . . . . . . . . 123Figure 5.31 Influence of OHM w/c on peak load. . . . . . . . . . . . . . . . . . . 123Figure 5.32 Influence of OHM w/c on peak displacement . . . . . . . . . . . . 124Figure 5.33 Five-phase composite sphere model . . . . . . . . . . . . . . . . . . . 125Figure 5.34 Modeled RAC for simulation . . . . . . . . . . . . . . . . . . . . . . . . 126Figure 5.35 Details in modeled RAC by FEM. . . . . . . . . . . . . . . . . . . . . 127Figure 5.36 The Chloride ion flow in concrete. . . . . . . . . . . . . . . . . . . . . 128Figure 5.37 The variation of surface chloride concentration
along the boundary edge . . . . . . . . . . . . . . . . . . . . . . . . . . . . 128Figure 5.38 Chloride ion concentration (10−1 mg/mm3) distribution
in MRAC with round aggregate . . . . . . . . . . . . . . . . . . . . . . 130Figure 5.39 Concentration profiles along the diffusion depth . . . . . . . . . . 131Figure 5.40 Concentration profiles along the diffusion transverse line . . . 132Figure 5.41 Chloride ion concentration on the surface as X = 5 mm . . . . 132Figure 5.42 The variation of total chloride ion amount and diffusivity
on the surface where X = 5 mm with Fra . . . . . . . . . . . . . . . 133Figure 5.43 Chloride ion concentration (10−1 mg/mm3) distribution
in MRAC with square aggregate . . . . . . . . . . . . . . . . . . . . . . 133Figure 5.44 Chloride ion concentration (10−1 mg/mm3) distribution
in MRAC with regular pentagon aggregate . . . . . . . . . . . . . . 134Figure 5.45 Chloride ion concentration (10−1 mg/mm3) distribution
in MRAC regular hexagon aggregate . . . . . . . . . . . . . . . . . . 134Figure 5.46 Chloride ion concentration (10−1 mg/mm3) distribution
MRAC with round aggregate . . . . . . . . . . . . . . . . . . . . . . . . 135
List of Figures xxiii

Figure 5.47 Chloride ion concentration at X = 5 mm. . . . . . . . . . . . . . . . 135Figure 5.48 The variation of total chloride ion amount
and diffusivity on the surface where X = 5 mmwith recycled aggregates shapes . . . . . . . . . . . . . . . . . . . . . . 136
Figure 5.49 Chloride ion concentration on the surfaceas X = 5 mm or Y = ±5 mm . . . . . . . . . . . . . . . . . . . . . . . . 136
Figure 5.50 The variation of total chloride ion amount and diffusivitywith chloride ion concentration boundary location . . . . . . . . 136
Figure 5.51 Chloride ion concentration (10−1 mg/mm3) distributionwith concave boundary . . . . . . . . . . . . . . . . . . . . . . . . . . . . . 137
Figure 5.52 Chloride ion concentration (10−1 mg/mm3) distributionwith bulge boundary . . . . . . . . . . . . . . . . . . . . . . . . . . . . . . . 137
Figure 5.53 Chloride ion concentration on the surface as X = 5 mm . . . . 138Figure 5.54 Chloride ion concentration (10−1 mg/mm3) distribution
in round MRAC for Rrm = 0.12 mm. . . . . . . . . . . . . . . . . . . 138Figure 5.55 Chloride ion concentration at the place X = 5 mm . . . . . . . . 139Figure 5.56 The variation of total chloride ion amount and diffusivity at
the place X = 5 mm with Rrm . . . . . . . . . . . . . . . . . . . . . . . . 139Figure 5.57 Chloride ion concentration on the surface
at X = −5 mm. . . . . . . . . . . . . . . . . . . . . . . . . . . . . . . . . . . . 140Figure 5.58 The variation of total chloride ion amount and diffusivity
on the surface at X = 5 mm with TITZ. . . . . . . . . . . . . . . . . . 140Figure 6.1 Different effects of the replacement percentage on the
development of the compressive strength of the RAC. . . . . . 145Figure 6.2 Histograms for the distribution of the compressive
strength . . . . . . . . . . . . . . . . . . . . . . . . . . . . . . . . . . . . . . . . . 147Figure 6.3 Comparison of the results of the compressive strength
distribution model and the test results . . . . . . . . . . . . . . . . . . 149Figure 6.4 RAC flexural strength . . . . . . . . . . . . . . . . . . . . . . . . . . . . . . 153Figure 6.5 Relationship between splitting tensile strength and cube
compressive strength of RAC . . . . . . . . . . . . . . . . . . . . . . . . 154Figure 6.6 Relationship between flexural strength and cube
compressive strength of RAC . . . . . . . . . . . . . . . . . . . . . . . . 155Figure 6.7 Comparison of residual compressive strength of RAC
with different RCA replacement percentages. . . . . . . . . . . . . 157Figure 6.8 Comparison between concretes with different kinds
of coarse aggregates . . . . . . . . . . . . . . . . . . . . . . . . . . . . . . . 158Figure 6.9 Regress for the test results of RAC. . . . . . . . . . . . . . . . . . . . 159Figure 6.10 Loading sketch for the flexural strength . . . . . . . . . . . . . . . . 160Figure 6.11 Comparison of the residual flexural strength of RAC
with different RCA replacement percentages. . . . . . . . . . . . . 161Figure 6.12 Regression on the relationship between the residual
flexural strength and elevated temperatures . . . . . . . . . . . . . . 162
xxiv List of Figures

Figure 6.13 Ratios of the residual flexural to the compressivestrength of RAC . . . . . . . . . . . . . . . . . . . . . . . . . . . . . . . . . . 162
Figure 7.1 Test setup for the stress-strain curve . . . . . . . . . . . . . . . . . . . 169Figure 7.2 Normalization of recycled concrete stress–strain curves . . . . 170Figure 7.3 Comparison of the test results and predicted curves . . . . . . . 171Figure 7.4 Peak strain of RAC vs Replacement percentage (r). . . . . . . . 173Figure 7.5 Ultimate strain of RAC vs Replacement percentage (r) . . . . . 173Figure 7.6 Elastic modulus of RAC vs Replacement percentage (r) . . . . 174Figure 7.7 Grading curves of aggregates . . . . . . . . . . . . . . . . . . . . . . . . 175Figure 7.8 Bulk density of aggregates . . . . . . . . . . . . . . . . . . . . . . . . . . 175Figure 7.9 Test setup . . . . . . . . . . . . . . . . . . . . . . . . . . . . . . . . . . . . . . . 177Figure 7.10 Failure pattern of prism specimens . . . . . . . . . . . . . . . . . . . . 178Figure 7.11 Stress–strain curves of specimens . . . . . . . . . . . . . . . . . . . . . 179Figure 7.12 Mean and standard deviation of stress–strain curves . . . . . . . 180Figure 7.13 Mean stress-strain curves for different RAC series . . . . . . . . 181Figure 7.14 COV of different RAC series . . . . . . . . . . . . . . . . . . . . . . . . 181Figure 7.15 Tensile specimen (mm) . . . . . . . . . . . . . . . . . . . . . . . . . . . . . 183Figure 7.16 ITZ simulation tensile specimen . . . . . . . . . . . . . . . . . . . . . . 183Figure 7.17 Test method . . . . . . . . . . . . . . . . . . . . . . . . . . . . . . . . . . . . . 184Figure 7.18 Cut section of parent concrete. . . . . . . . . . . . . . . . . . . . . . . . 185Figure 7.19 Cut section of recycled concrete . . . . . . . . . . . . . . . . . . . . . . 185Figure 7.20 Density of parent concrete and old mortar . . . . . . . . . . . . . . 186Figure 7.21 Density of RC and new mortar . . . . . . . . . . . . . . . . . . . . . . . 186Figure 7.22 Strength of parent concrete and old mortar . . . . . . . . . . . . . . 187Figure 7.23 Young’s modulus of parent concrete and old mortar. . . . . . . 187Figure 7.24 Peak strain of parent concrete and old mortar . . . . . . . . . . . . 188Figure 7.25 Strength of RC and new mortar . . . . . . . . . . . . . . . . . . . . . . 189Figure 7.26 Young’s modulus of RC and new mortar . . . . . . . . . . . . . . . 189Figure 7.27 Peak strain of RC and new mortar . . . . . . . . . . . . . . . . . . . . 190Figure 7.28 Tensile break section of recycled concrete . . . . . . . . . . . . . . 190Figure 7.29 Lattice model . . . . . . . . . . . . . . . . . . . . . . . . . . . . . . . . . . . . 191Figure 7.30 Simplified recycled concrete . . . . . . . . . . . . . . . . . . . . . . . . . 193Figure 7.31 Random aggregate model . . . . . . . . . . . . . . . . . . . . . . . . . . . 194Figure 7.32 Lattice model defined respective properties . . . . . . . . . . . . . . 194Figure 7.33 Program flowchart of lattice model . . . . . . . . . . . . . . . . . . . . 195Figure 7.34 NC failure process by simulation . . . . . . . . . . . . . . . . . . . . . 196Figure 7.35 RC failure process by simulation . . . . . . . . . . . . . . . . . . . . . 197Figure 7.36 Strain–stress curves under tensile loading . . . . . . . . . . . . . . . 198Figure 7.37 Loading setup . . . . . . . . . . . . . . . . . . . . . . . . . . . . . . . . . . . . 201Figure 7.38 Arrangement of strain gauges . . . . . . . . . . . . . . . . . . . . . . . . 201Figure 7.39 Failure phenomena of RAC-filled steel tubes . . . . . . . . . . . . 202Figure 7.40 Failure phenomena of RAC-filled GFRP tubes . . . . . . . . . . . 203Figure 7.41 Effect of RCA replacement percentage . . . . . . . . . . . . . . . . . 205Figure 7.42 Strength index . . . . . . . . . . . . . . . . . . . . . . . . . . . . . . . . . . . . 206
List of Figures xxv
Figure 7.43 Load versus axial strain of specimens . . . . . . . . . . . . . . . . . . 206Figure 7.44 Lateral deformation coefficient . . . . . . . . . . . . . . . . . . . . . . . 209Figure 7.45 Load–strain curves of RCFS . . . . . . . . . . . . . . . . . . . . . . . . . 214Figure 7.46 Load–strain curves of RCFF . . . . . . . . . . . . . . . . . . . . . . . . . 215Figure 7.47 Geometry and dimensions of the shear push-off
specimens . . . . . . . . . . . . . . . . . . . . . . . . . . . . . . . . . . . . . . . 218Figure 7.48 Reinforcement in the specimens . . . . . . . . . . . . . . . . . . . . . . 218Figure 7.49 Photographs for test setup . . . . . . . . . . . . . . . . . . . . . . . . . . . 219Figure 7.50 Displacement transducer arrangement schematic . . . . . . . . . . 220Figure 7.51 Distribution of strain gauges . . . . . . . . . . . . . . . . . . . . . . . . . 220Figure 7.52 Representative crack patterns of push-off specimens . . . . . . . 221Figure 7.53 Typical shear stress–shear displacement curves . . . . . . . . . . . 223Figure 7.54 Typical crack opening curve . . . . . . . . . . . . . . . . . . . . . . . . . 225Figure 7.55 Effects of constraint stiffness on shear stress–shear
displacement curves . . . . . . . . . . . . . . . . . . . . . . . . . . . . . . . 226Figure 7.56 Effects of concrete strength on shear stress–shear
displacement curves . . . . . . . . . . . . . . . . . . . . . . . . . . . . . . . 227Figure 7.57 Effects of RCA replacement percentage on the ultimate
shear load . . . . . . . . . . . . . . . . . . . . . . . . . . . . . . . . . . . . . . . 227Figure 7.58 Effects of RCA replacement percentage on shear
stress–slip curves. . . . . . . . . . . . . . . . . . . . . . . . . . . . . . . . . . 228Figure 7.59 Shear stress–slip curve with same mix proportions . . . . . . . . 229Figure 7.60 Comparisons between tested value
and empirical formula . . . . . . . . . . . . . . . . . . . . . . . . . . . . . . 231Figure 7.61 Mm–diameter conic variable cross-sectional SHPB. . . . . . . . 234Figure 7.62 Typical signals recorded from strain gauges . . . . . . . . . . . . . 235Figure 7.63 Representative strain rate of the average stress–strain
curve under strain rate in Group 1 . . . . . . . . . . . . . . . . . . . . 236Figure 7.64 Failure patterns under static loading . . . . . . . . . . . . . . . . . . . 237Figure 7.65 Quasi-static compressive strength of RAC with different
RCA replacement percentages. . . . . . . . . . . . . . . . . . . . . . . . 237Figure 7.66 Failure patterns of RAC specimens under
impact loadings . . . . . . . . . . . . . . . . . . . . . . . . . . . . . . . . . . . 238Figure 7.67 Average stress–strain curves of RAC specimens under
different strain rates. . . . . . . . . . . . . . . . . . . . . . . . . . . . . . . . 240Figure 7.68 Average stress–strain curves of different RAC specimens
under similar strain rates . . . . . . . . . . . . . . . . . . . . . . . . . . . . 241Figure 7.69 Effect of strain rates on the dynamic compressive
strength of RAC specimens. . . . . . . . . . . . . . . . . . . . . . . . . . 241Figure 7.70 Dynamic increase factor of RAC specimens . . . . . . . . . . . . . 242Figure 7.71 Average compressive strength of RAC specimens in
different strain rate groups. . . . . . . . . . . . . . . . . . . . . . . . . . . 242Figure 7.72 Average DIF of RAC specimens in different strain
rate groups . . . . . . . . . . . . . . . . . . . . . . . . . . . . . . . . . . . . . . 243
xxvi List of Figures

Figure 7.73 Simplified features of crack patterns of RAC-100and NAC under static loading . . . . . . . . . . . . . . . . . . . . . . . . 243
Figure 7.74 Simplified features of crack patterns of RAC-100 and NACunder impact loading. . . . . . . . . . . . . . . . . . . . . . . . . . . . . . . 244
Figure 7.75 Initial elastic modulus of RAC specimens under differentstrain rates. . . . . . . . . . . . . . . . . . . . . . . . . . . . . . . . . . . . . . . 244
Figure 7.76 Peak strain of RAC specimens under different strain rates . . 245Figure 7.77 Compressive strength of RAC-100 and NAC in naturally
dried and wet states in different strain rate groups . . . . . . . . 245Figure 7.78 DIF of RAC-100 and NAC in naturally dried and
wet states in different strain rate groups . . . . . . . . . . . . . . . . 246Figure 8.1 Gradation curve. . . . . . . . . . . . . . . . . . . . . . . . . . . . . . . . . . . 252Figure 8.2 Sketch of creep test for RAC and mortar . . . . . . . . . . . . . . . 254Figure 8.3 Comparison between calculated values and test values
for elastic modulus of RAC . . . . . . . . . . . . . . . . . . . . . . . . . 255Figure 8.4 RAC shrinkage curves . . . . . . . . . . . . . . . . . . . . . . . . . . . . . 256Figure 8.5 Mortar shrinkage curves . . . . . . . . . . . . . . . . . . . . . . . . . . . . 256Figure 8.6 Temperature and relative humidity records . . . . . . . . . . . . . . 256Figure 8.7 Specific creep curves for RAC . . . . . . . . . . . . . . . . . . . . . . . 257Figure 8.8 Specific creep curve for mortar . . . . . . . . . . . . . . . . . . . . . . . 257Figure 8.9 Concrete carbonation test equipment . . . . . . . . . . . . . . . . . . . 263Figure 8.10 Testing of the carbonation depth . . . . . . . . . . . . . . . . . . . . . . 263Figure 8.11 Influence of the w/c ratio on the carbonation depth . . . . . . . 264Figure 8.12 Influence of the cement on the carbonation depth . . . . . . . . . 265Figure 8.13 Influence of the RCA replacement percentage on the
carbonation resistance of RAC . . . . . . . . . . . . . . . . . . . . . . . 265Figure 8.14 Influence of the parent concrete strength on the carbonation
resistance of RAC . . . . . . . . . . . . . . . . . . . . . . . . . . . . . . . . . 266Figure 8.15 Influence of RAC strength on the carbonation resistance
of RAC . . . . . . . . . . . . . . . . . . . . . . . . . . . . . . . . . . . . . . . . . 266Figure 8.16 Change of the carbonation depth of RAC with time . . . . . . . 267Figure 8.17 Change of the rate of carbonation of RAC with time . . . . . . 267Figure 8.18 Loading set up of the specimen for flexural tensile test . . . . 267Figure 8.19 Influence of the stress level on the carbonation depth . . . . . . 268Figure 8.20 Influence of the mineral admixtures on the
carbonation depth . . . . . . . . . . . . . . . . . . . . . . . . . . . . . . . . . 269Figure 8.21 Influence of the RCA on the carbonation depth standard
deviation . . . . . . . . . . . . . . . . . . . . . . . . . . . . . . . . . . . . . . . . 269Figure 8.22 Apparatus for drilling the specimens . . . . . . . . . . . . . . . . . . . 271Figure 8.23 Process of specimens immersed in chloride ion solution. . . . 272Figure 8.24 Chloride ion concentration test process by RCT . . . . . . . . . . 273Figure 8.25 Variation of Ct0 along the diffusion depth. . . . . . . . . . . . . . . 274Figure 8.26 Variation of Cf0 along the diffusion depth. . . . . . . . . . . . . . . 274Figure 8.27 Variation of Cb0 along the diffusion depth . . . . . . . . . . . . . . 275
List of Figures xxvii

Figure 8.28 Variation of Ct0 with r = 34, 67 and 100% relativeto that with r = 0% . . . . . . . . . . . . . . . . . . . . . . . . . . . . . . . . 275
Figure 8.29 Variation of Cf0 with r = 34, 67 and 100% relativeto that with r = 0% . . . . . . . . . . . . . . . . . . . . . . . . . . . . . . . . 275
Figure 8.30 Variation of Cb0 with r = 34, 67 and 100% relativeto that with r = 0% . . . . . . . . . . . . . . . . . . . . . . . . . . . . . . . . 276
Figure 8.31 Chloride ion binding capability of RAC . . . . . . . . . . . . . . . . 277Figure 8.32 Three types of chloride ion concentration distribution
in the concrete. . . . . . . . . . . . . . . . . . . . . . . . . . . . . . . . . . . . 278Figure 8.33 Fitting curve of free chloride ion concentration . . . . . . . . . . . 279Figure 8.34 Three types of chloride ion concentration distribution
in the concrete. . . . . . . . . . . . . . . . . . . . . . . . . . . . . . . . . . . . 280Figure 8.35 Modeled RAC containing modeled RCA and NCA . . . . . . . 281Figure 8.36 Modeled RAC production process. . . . . . . . . . . . . . . . . . . . . 282Figure 8.37 RCM testing . . . . . . . . . . . . . . . . . . . . . . . . . . . . . . . . . . . . . 283Figure 8.38 Chloride ion concentration distribution for different
aggregate combinations . . . . . . . . . . . . . . . . . . . . . . . . . . . . . 285Figure 8.39 Compressive fatigue tests . . . . . . . . . . . . . . . . . . . . . . . . . . . 287Figure 8.40 S–N results under cyclic compression . . . . . . . . . . . . . . . . . . 288Figure 8.41 Residual strain variation under cyclic compression . . . . . . . . 288Figure 8.42 Fatigue strain variation under cyclic compression . . . . . . . . . 289Figure 8.43 Fatigue modulus degradation under cyclic compression . . . . 290Figure 8.44 Fatigue damage evolution under cyclic compression . . . . . . . 290Figure 8.45 Fatigue stress–strain relationship for specimen fp-b1
with S = 0.8 under cyclic compression . . . . . . . . . . . . . . . . . 291Figure 8.46 Static stress–strain relationship for specimen fp-b1
with fmax = 36.8 MPa after cyclic compression . . . . . . . . . . . 291Figure 8.47 Axial stress–transverse strain curves under cyclic
compression . . . . . . . . . . . . . . . . . . . . . . . . . . . . . . . . . . . . . 291Figure 8.48 Axial stress–volumetric strain curves under cyclic
compression . . . . . . . . . . . . . . . . . . . . . . . . . . . . . . . . . . . . . 292Figure 8.49 Axial stress–Poisson’s ratio curves under cyclic
compression . . . . . . . . . . . . . . . . . . . . . . . . . . . . . . . . . . . . . 292Figure 8.50 Bending fatigue tests . . . . . . . . . . . . . . . . . . . . . . . . . . . . . . . 293Figure 8.51 S–N results under cyclic bending . . . . . . . . . . . . . . . . . . . . . 293Figure 8.52 Load–strain curves under cyclic bending (N = 1) . . . . . . . . . 294Figure 8.53 Load–strain curves under cyclic bending (N = 64,000) . . . . . 294Figure 9.1 Details of pull-out specimens . . . . . . . . . . . . . . . . . . . . . . . . 301Figure 9.2 Photograph of test setup . . . . . . . . . . . . . . . . . . . . . . . . . . . . 302Figure 9.3 Test curves of load versus slip . . . . . . . . . . . . . . . . . . . . . . . 303Figure 9.4 Comparison between the mean value of bond strength . . . . . 304Figure 9.5 Comparisons of predicted bond–slip relationship with
test results . . . . . . . . . . . . . . . . . . . . . . . . . . . . . . . . . . . . . . . 307Figure 9.6 Sketch of pullout specimens . . . . . . . . . . . . . . . . . . . . . . . . . 309
xxviii List of Figures
Figure 9.7 Pullout specimens after casting . . . . . . . . . . . . . . . . . . . . . . . 310Figure 9.8 Setup for accelerated corrosion of steel rebars . . . . . . . . . . . 310Figure 9.9 The failed specimen of steel bar pullout . . . . . . . . . . . . . . . . 311Figure 9.10 Cross-sectional view of concrete after the bar pull
out test . . . . . . . . . . . . . . . . . . . . . . . . . . . . . . . . . . . . . . . . . 312Figure 9.11 Test curve of load versus slip . . . . . . . . . . . . . . . . . . . . . . . . 313Figure 9.12 Reduction coefficient of bond strength versus corrosion
rate of steel bars . . . . . . . . . . . . . . . . . . . . . . . . . . . . . . . . . . 314Figure 9.13 The value of b2 changes with increase in corrosion rate
of steel bars. . . . . . . . . . . . . . . . . . . . . . . . . . . . . . . . . . . . . . 316Figure 9.14 Comparisons between average test results and predicted
bond–slip curve. . . . . . . . . . . . . . . . . . . . . . . . . . . . . . . . . . . 317Figure 10.1 Diagram of the beam specimen . . . . . . . . . . . . . . . . . . . . . . . 322Figure 10.2 Test set-up diagram. . . . . . . . . . . . . . . . . . . . . . . . . . . . . . . . 322Figure 10.3 Overview of test site . . . . . . . . . . . . . . . . . . . . . . . . . . . . . . . 323Figure 10.4 Distribution of the deformation along the plane section
at different loads . . . . . . . . . . . . . . . . . . . . . . . . . . . . . . . . . . 324Figure 10.5 Load–span deflection of the beam. . . . . . . . . . . . . . . . . . . . . 324Figure 10.6 Load–span reinforcement strain relationship of the beam . . . 325Figure 10.7 Cracking pattern of tested beams at failure . . . . . . . . . . . . . . 325Figure 10.8 Comparison between the test and calculated value
for RAC bending moment resistance capacity. . . . . . . . . . . . 327Figure 10.9 Comparison between the test and calculated value for the
ordinary concrete bending moment resistance capacity . . . . . 327Figure 10.10 RAC stress–strain curves. . . . . . . . . . . . . . . . . . . . . . . . . . . . 328Figure 10.11 Influence of the type of load on the reliability index of
ordinary concrete beam . . . . . . . . . . . . . . . . . . . . . . . . . . . . . 329Figure 10.12 Comparison between the bending moment reliability of
ordinary concrete and RAC. . . . . . . . . . . . . . . . . . . . . . . . . . 330Figure 10.13 Influence of the resistance unstable factor on RAC beam
flexural capacity reliability . . . . . . . . . . . . . . . . . . . . . . . . . . 330Figure 10.14 Influence of RAC materials partial factor on RAC beam
flexural capacity reliability . . . . . . . . . . . . . . . . . . . . . . . . . . 330Figure 10.15 Diagram of the beam specimen . . . . . . . . . . . . . . . . . . . . . . . 331Figure 10.16 Test set-up diagram. . . . . . . . . . . . . . . . . . . . . . . . . . . . . . . . 332Figure 10.17 Load-displacement diagram at mid span of beam . . . . . . . . . 332Figure 10.18 Load–stirrup strain diagram of the beam. . . . . . . . . . . . . . . . 333Figure 10.19 Load–average width of diagonal cracks curve. . . . . . . . . . . . 333Figure 10.20 Diagram of the cracks at beam failure. . . . . . . . . . . . . . . . . . 334Figure 10.21 Masaru’s different concrete strength grades test . . . . . . . . . . 335Figure 10.22 Han’s different shear span ratio RAC beam shear capacity
test result. . . . . . . . . . . . . . . . . . . . . . . . . . . . . . . . . . . . . . . . 335Figure 10.23 Relationship between the shear capacity and
the reinforcement . . . . . . . . . . . . . . . . . . . . . . . . . . . . . . . . . 335
List of Figures xxix

Figure 10.24 Average value for the test value/calculated value and thestandard deviation of the beam without stirrups . . . . . . . . . . 336
Figure 10.25 Average value for the test value/calculated value and thestandard deviation of the beam with stirrups . . . . . . . . . . . . . 336
Figure 10.26 Beam configurations and reinforcements . . . . . . . . . . . . . . . . 340Figure 10.27 Precast part of beams after casting . . . . . . . . . . . . . . . . . . . . 340Figure 10.28 Arrangement of measuring instruments . . . . . . . . . . . . . . . . . 341Figure 10.29 Strain distributions on the cross section of beams
in elastic stage. . . . . . . . . . . . . . . . . . . . . . . . . . . . . . . . . . . . 342Figure 10.30 Strain distributions on the cross section of beam RF
in post-elastic stage . . . . . . . . . . . . . . . . . . . . . . . . . . . . . . . . 343Figure 10.31 Strain distributions on the cross section of beam UF-3
in post-elastic stage . . . . . . . . . . . . . . . . . . . . . . . . . . . . . . . . 343Figure 10.32 Load–deflection curves for flexural test on beams. . . . . . . . . 344Figure 10.33 Failure pattern of the shear test beams . . . . . . . . . . . . . . . . . 347Figure 10.34 Load–deflection curves of the shear test beams. . . . . . . . . . . 348Figure 10.35 Measurements of strains and reference axes . . . . . . . . . . . . . 348Figure 10.36 Exposed cracks of failed shear test beams. . . . . . . . . . . . . . . 351Figure 10.37 Variation of load-carrying capacities of reinforced concrete
beams plotted against shear span-to-depth ratio. . . . . . . . . . . 353Figure 10.38 Elastic modulus and compressive strength as a function
of RCA replacement percentage . . . . . . . . . . . . . . . . . . . . . . 353Figure 10.39 Gradient slab with RAC . . . . . . . . . . . . . . . . . . . . . . . . . . . . 354Figure 10.40 Simplified gradient slab with RAC . . . . . . . . . . . . . . . . . . . . 354Figure 10.41 Strain curves for load on top surface of concrete slab. . . . . . 357Figure 10.42 Strain along the section height at all load levels . . . . . . . . . . 358Figure 10.43 Crack distribution of gradient slabs with RAC . . . . . . . . . . . 359Figure 10.44 Test slab’s load–deflection curves . . . . . . . . . . . . . . . . . . . . . 360Figure 10.45 Load–deflection curves of the slabs with the same
reinforcement ratio . . . . . . . . . . . . . . . . . . . . . . . . . . . . . . . . 360Figure 10.46 Load–longitudinal reinforcement strain curves . . . . . . . . . . . 361Figure 10.47 Cross-sectional moment curvature curves . . . . . . . . . . . . . . . 362Figure 10.48 The RAC stress–inelastic strain relationship curves. . . . . . . . 363Figure 10.49 Load–deflection curves by ABAQUS . . . . . . . . . . . . . . . . . . 365Figure 10.50 RCA particle size distribution . . . . . . . . . . . . . . . . . . . . . . . . 366Figure 10.51 Slab dimensions . . . . . . . . . . . . . . . . . . . . . . . . . . . . . . . . . . 368Figure 10.52 Schematic diagram of reinforcement . . . . . . . . . . . . . . . . . . . 368Figure 10.53 Loading setup . . . . . . . . . . . . . . . . . . . . . . . . . . . . . . . . . . . . 369Figure 10.54 Arrangement of strain gauges . . . . . . . . . . . . . . . . . . . . . . . . 370Figure 10.55 Arrangement of LVDTs . . . . . . . . . . . . . . . . . . . . . . . . . . . . 371Figure 10.56 Punching failure of concrete slabs. . . . . . . . . . . . . . . . . . . . . 372Figure 10.57 Relationship between slab load and reinforcement strain . . . 373Figure 10.58 P�D curves . . . . . . . . . . . . . . . . . . . . . . . . . . . . . . . . . . . . . 376Figure 10.59 P�D curve and “equivalent ductility” line . . . . . . . . . . . . . . 378
xxx List of Figures
Figure 10.60 Deformation and failure pattern for the eccentricityof 0 mm . . . . . . . . . . . . . . . . . . . . . . . . . . . . . . . . . . . . . . . . 382
Figure 10.61 Deformation and failure pattern for the eccentricityof 30 mm . . . . . . . . . . . . . . . . . . . . . . . . . . . . . . . . . . . . . . . 382
Figure 10.62 Deformation and failure pattern for the eccentricityof 82 mm . . . . . . . . . . . . . . . . . . . . . . . . . . . . . . . . . . . . . . . 383
Figure 10.63 Strain and failure mechanism of eccentricity at 100 mm. . . . 384Figure 10.64 N–M test-related curves for different RCA replacement
percentages . . . . . . . . . . . . . . . . . . . . . . . . . . . . . . . . . . . . . . 385Figure 10.65 Influence of the reinforcement ratio q and standard
deviations r on the reliability index b at the characteristiccompressive strength of 20.1 MPa . . . . . . . . . . . . . . . . . . . . 386
Figure 10.66 Influence of the reinforcement ratio q and standarddeviation r on the reliability index b at the same averagecompressive strength of 25.6 MPa . . . . . . . . . . . . . . . . . . . . 386
Figure 10.67 Influence of the reinforcement ratio q and compressivestrength on the reliability index b at the same standarddeviation r value of 6 MPa . . . . . . . . . . . . . . . . . . . . . . . . . 387
Figure 10.68 Influence of the reinforcement ratio q and compressivestrength on the reliability index b at the same standarddeviation r value of 7 MPa . . . . . . . . . . . . . . . . . . . . . . . . . 387
Figure 10.69 Influence of the reinforcement ratio q and standarddeviation r on the reliability index b at the samecharacteristic compressive strength of 20.1 MPa . . . . . . . . . . 389
Figure 10.70 Influence of the reinforcement ratio q and standarddeviation r on the reliability index b at different relativeheight of compression zone n under the same averagecompressive strength of 25.6 MPa . . . . . . . . . . . . . . . . . . . . 389
Figure 10.71 Influence of the reinforcement ratio q and compressivestrength on the reliability index b at different relativeheight of compression zone n under the same standarddeviation r of 6 MPa . . . . . . . . . . . . . . . . . . . . . . . . . . . . . . 390
Figure 10.72 Influence of the reinforcement ratio q and compressivestrength on the reliability index b at different relativeheight of compression zone n under the same standarddeviation r of 7 MPa . . . . . . . . . . . . . . . . . . . . . . . . . . . . . . 390
Figure 11.1 Reinforcement diagram of specimens . . . . . . . . . . . . . . . . . . 400Figure 11.2 Construction steps of the semi-precast columns . . . . . . . . . . 401Figure 11.3 Experimental setup . . . . . . . . . . . . . . . . . . . . . . . . . . . . . . . . 401Figure 11.4 Schematic drawing of the positions for the displacement
gauges . . . . . . . . . . . . . . . . . . . . . . . . . . . . . . . . . . . . . . . . . . 402Figure 11.5 Schematic drawing of the positions for the strain gauges . . . 402Figure 11.6 Schematic of the load-controlled and
displacement-controlled loading programs. . . . . . . . . . . . . . . 403
List of Figures xxxi
Figure 11.7 Failure patterns of the specimens . . . . . . . . . . . . . . . . . . . . . 404Figure 11.8 Comparisons between the failure patterns of the integrated
and semi-precast columns . . . . . . . . . . . . . . . . . . . . . . . . . . . 404Figure 11.9 Contact surface between the precast and cast-in-situ
concrete in RCCC-6 after failure. . . . . . . . . . . . . . . . . . . . . . 405Figure 11.10 Lateral displacement distribution along
the column height . . . . . . . . . . . . . . . . . . . . . . . . . . . . . . . . . 406Figure 11.11 P-D hysteresis loop . . . . . . . . . . . . . . . . . . . . . . . . . . . . . . . . 408Figure 11.12 Comparisons between skeleton curves. . . . . . . . . . . . . . . . . . 409Figure 11.13 Triple linear skeleton curve . . . . . . . . . . . . . . . . . . . . . . . . . . 410Figure 11.14 Comparison between secant stiffness. . . . . . . . . . . . . . . . . . . 412Figure 11.15 Definition of energy consumption . . . . . . . . . . . . . . . . . . . . . 413Figure 11.16 Test setup . . . . . . . . . . . . . . . . . . . . . . . . . . . . . . . . . . . . . . . 418Figure 11.17 Hysteresis curves of RCFS columns . . . . . . . . . . . . . . . . . . . 419Figure 11.18 Hysteresis curves of RCFF columns . . . . . . . . . . . . . . . . . . . 422Figure 11.19 Skeleton curves . . . . . . . . . . . . . . . . . . . . . . . . . . . . . . . . . . . 425Figure 11.20 Stiffness degeneration curves. . . . . . . . . . . . . . . . . . . . . . . . . 426Figure 11.21 Energy dissipation curves . . . . . . . . . . . . . . . . . . . . . . . . . . . 428Figure 11.22 Strain variations of RCFS . . . . . . . . . . . . . . . . . . . . . . . . . . . 429Figure 11.23 Strain variations of RCFF . . . . . . . . . . . . . . . . . . . . . . . . . . . 430Figure 12.1 Specimen dimensions and reinforcement diagram . . . . . . . . . 434Figure 12.2 Test loading system. . . . . . . . . . . . . . . . . . . . . . . . . . . . . . . . 435Figure 12.3 Loading pattern . . . . . . . . . . . . . . . . . . . . . . . . . . . . . . . . . . . 435Figure 12.4 The state of the crack and crack distribution at yielding . . . . 436Figure 12.5 Hysteresis curves and capacity curves . . . . . . . . . . . . . . . . . . 438Figure 12.6 The whole energy consumption process diagram
of the specimens . . . . . . . . . . . . . . . . . . . . . . . . . . . . . . . . . . 438Figure 12.7 The shear stress (s)–shear deformation (c) curves
of RAC joint core area . . . . . . . . . . . . . . . . . . . . . . . . . . . . . 439Figure 12.8 Recycled concrete frame joint simulation models . . . . . . . . . 442Figure 12.9 Loading pattern . . . . . . . . . . . . . . . . . . . . . . . . . . . . . . . . . . . 443Figure 12.10 The experiment skeleton curves and the simulating ones . . . 443Figure 12.11 Specimen configuration and reinforcements . . . . . . . . . . . . . 445Figure 12.12 Test setup . . . . . . . . . . . . . . . . . . . . . . . . . . . . . . . . . . . . . . . 446Figure 12.13 Loading pattern . . . . . . . . . . . . . . . . . . . . . . . . . . . . . . . . . . . 447Figure 12.14 Typical failure pattern of FRAC-100. . . . . . . . . . . . . . . . . . . 448Figure 12.15 Hysteresis curves. . . . . . . . . . . . . . . . . . . . . . . . . . . . . . . . . . 450Figure 12.16 Skeleton curves . . . . . . . . . . . . . . . . . . . . . . . . . . . . . . . . . . . 450Figure 12.17 Stiffness degradation . . . . . . . . . . . . . . . . . . . . . . . . . . . . . . . 451Figure 12.18 Energy dissipation. . . . . . . . . . . . . . . . . . . . . . . . . . . . . . . . . 452Figure 12.19 Frame model configuration and reinforcements . . . . . . . . . . . 455Figure 12.20 Time history and frequency spectrum
of WCW and ELW . . . . . . . . . . . . . . . . . . . . . . . . . . . . . . . . 456Figure 12.21 General view of the RAC frame model. . . . . . . . . . . . . . . . . 457
xxxii List of Figures

Figure 12.22 Photos for typical failure pattern . . . . . . . . . . . . . . . . . . . . . . 458Figure 12.23 Variation of the vibration modes in the X-direction . . . . . . . 459Figure 12.24 Distribution of acceleration amplification factor
in X-direction . . . . . . . . . . . . . . . . . . . . . . . . . . . . . . . . . . . . 459Figure 12.25 Distribution of seismic force in the X-direction . . . . . . . . . . . 460Figure 12.26 Maximum story displacement . . . . . . . . . . . . . . . . . . . . . . . . 461Figure 12.27 Distribution of inter-story shear force in X-direction . . . . . . . 462Figure 12.28 Hysteresis curves in the X-direction . . . . . . . . . . . . . . . . . . . 463Figure 12.29 Capacity curves. . . . . . . . . . . . . . . . . . . . . . . . . . . . . . . . . . . 464Figure 12.30 Definition of ductility coefficient . . . . . . . . . . . . . . . . . . . . . . 465Figure 12.31 Stiffness degradation . . . . . . . . . . . . . . . . . . . . . . . . . . . . . . . 465Figure 12.32 RAC space frame numerical model. . . . . . . . . . . . . . . . . . . . 466Figure 12.33 Fiber section discretization . . . . . . . . . . . . . . . . . . . . . . . . . . 467Figure 12.34 Kent–Scott–Park model for concrete . . . . . . . . . . . . . . . . . . . 467Figure 12.35 Hysteresis material model for steel reinforcement . . . . . . . . . 470Figure 12.36 Comparisons between tested and calculated frequency
under different inputs . . . . . . . . . . . . . . . . . . . . . . . . . . . . . . 473Figure 12.37 Vibration mode comparison between calculated and tested
results under the initial test phase . . . . . . . . . . . . . . . . . . . . . 475Figure 12.38 Acceleration amplification factor comparison between
calculated and tested results . . . . . . . . . . . . . . . . . . . . . . . . . 476Figure 12.39 Floor displacement comparison between the calculated
and tested results. . . . . . . . . . . . . . . . . . . . . . . . . . . . . . . . . . 477Figure 12.40 Inter-story drift comparison between calculated and tested
results . . . . . . . . . . . . . . . . . . . . . . . . . . . . . . . . . . . . . . . . . . 480Figure 12.41 Acceleration amplification factor distribution of RAC
and NAC space frame . . . . . . . . . . . . . . . . . . . . . . . . . . . . . . 481Figure 12.42 Maximum floor displacement comparison between RAC
and NAC space frames . . . . . . . . . . . . . . . . . . . . . . . . . . . . . 482Figure 12.43 Maximum inter-story drift ratios comparison between RAC
and NAC space frames . . . . . . . . . . . . . . . . . . . . . . . . . . . . . 484Figure 12.44 Configuration and reinforcement of the model . . . . . . . . . . . 487Figure 12.45 Process of fabrication precast elements . . . . . . . . . . . . . . . . . 488Figure 12.46 Configuration of joints assembled . . . . . . . . . . . . . . . . . . . . . 488Figure 12.47 Process of construction . . . . . . . . . . . . . . . . . . . . . . . . . . . . . 488Figure 12.48 Arrangement of accelerometers and displacement
LVDTs . . . . . . . . . . . . . . . . . . . . . . . . . . . . . . . . . . . . . . . . . 489Figure 12.49 General view of precast RAC frame model. . . . . . . . . . . . . . 489Figure 12.50 Earthquake input motions . . . . . . . . . . . . . . . . . . . . . . . . . . . 490Figure 12.51 Typical crack pattern of the precast RAC frame . . . . . . . . . . 492Figure 12.52 Typical crack pattern of the precast NAC frame . . . . . . . . . . 493Figure 12.53 Variation of the first and second natural frequency . . . . . . . . 493Figure 12.54 Damping and stiffness ratio versus frequency
in X-direction . . . . . . . . . . . . . . . . . . . . . . . . . . . . . . . . . . . . 494
List of Figures xxxiii

Figure 12.55 First and second mode shapes in X-direction . . . . . . . . . . . . 495Figure 12.56 Distribution of acceleration amplifying coefficient in
X-direction . . . . . . . . . . . . . . . . . . . . . . . . . . . . . . . . . . . . . . 496Figure 12.57 Distribution of seismic force in X-direction . . . . . . . . . . . . . 497Figure 12.58 Distribution of story shear force in X-direction. . . . . . . . . . . 498Figure 12.59 Variation of shear amplification factor . . . . . . . . . . . . . . . . . 499Figure 12.60 Maximum story displacement of the precast RAC model
in X-direction . . . . . . . . . . . . . . . . . . . . . . . . . . . . . . . . . . . . 500Figure 12.61 Maximum inter-story drift of the precast RAC model
in X-direction . . . . . . . . . . . . . . . . . . . . . . . . . . . . . . . . . . . . 501Figure 12.62 Hysteretic curves of the precast RAC model. . . . . . . . . . . . . 502Figure 12.63 Capacity curve of the precast RAC model . . . . . . . . . . . . . . 502Figure 12.64 Definition of feature points on capacity curve . . . . . . . . . . . . 503Figure 12.65 Hysteresis material model for steel reinforcement . . . . . . . . . 506Figure 12.66 Simulated model . . . . . . . . . . . . . . . . . . . . . . . . . . . . . . . . . . 507Figure 12.67 Simulated and tested natural frequency . . . . . . . . . . . . . . . . . 509Figure 12.68 Simulated and tested mode shapes . . . . . . . . . . . . . . . . . . . . 510Figure 12.69 Simulated and tested acceleration amplification factors
versus input motions . . . . . . . . . . . . . . . . . . . . . . . . . . . . . . . 512Figure 12.70 Simulated and tested maximum displacement of precast
RAC model . . . . . . . . . . . . . . . . . . . . . . . . . . . . . . . . . . . . . . 514Figure 12.71 Comparisons between simulated and tested roof
displacement time histories . . . . . . . . . . . . . . . . . . . . . . . . . . 515Figure 12.72 Simulated and tested maximum inter-story drift of precast
RAC model . . . . . . . . . . . . . . . . . . . . . . . . . . . . . . . . . . . . . . 517Figure 12.73 Simulated and tested capacity curves . . . . . . . . . . . . . . . . . . 519Figure 12.74 Capacity curves of two simulated models . . . . . . . . . . . . . . . 521Figure 13.1 Sections and reinforcement details of the specimens . . . . . . . 526Figure 13.2 RAC hollow block . . . . . . . . . . . . . . . . . . . . . . . . . . . . . . . . 526Figure 13.3 Test setup . . . . . . . . . . . . . . . . . . . . . . . . . . . . . . . . . . . . . . . 528Figure 13.4 Loading procedure . . . . . . . . . . . . . . . . . . . . . . . . . . . . . . . . 528Figure 13.5 Cracking patterns of the specimens . . . . . . . . . . . . . . . . . . . . 529Figure 13.6 Hysteresis curves of specimens . . . . . . . . . . . . . . . . . . . . . . . 531Figure 13.7 Skeleton curves of specimens . . . . . . . . . . . . . . . . . . . . . . . . 532Figure 13.8 Definition of equivalent yielding point . . . . . . . . . . . . . . . . . 533Figure 13.9 Definition of the coefficient of the equivalent
viscous damping . . . . . . . . . . . . . . . . . . . . . . . . . . . . . . . . . . 534Figure 13.10 Stiffness degradation curves of specimens. . . . . . . . . . . . . . . 536Figure 13.11 Deformation characterstics of overall lateral displacement
curves . . . . . . . . . . . . . . . . . . . . . . . . . . . . . . . . . . . . . . . . . . 537Figure 13.12 Overall lateral displacement curves of specimens . . . . . . . . . 538Figure 13.13 Strain developments of steel rebars in tie columns . . . . . . . . 540Figure 13.14 Appearance of the RAC block . . . . . . . . . . . . . . . . . . . . . . . 542
xxxiv List of Figures

Figure 13.15 Plane layout and elevation detail and structural memberdetail drawing . . . . . . . . . . . . . . . . . . . . . . . . . . . . . . . . . . . . 544
Figure 13.16 RAC block masonry model construction . . . . . . . . . . . . . . . . 545Figure 13.17 Time history and frequency spectrum of WCW
(E–W component) . . . . . . . . . . . . . . . . . . . . . . . . . . . . . . . . . 546Figure 13.18 Arrangement of accelerometers, displacement gauges . . . . . . 547Figure 13.19 General view of the RAC block masonry model. . . . . . . . . . 548Figure 13.20 Failure pattern of the RAC block masonry . . . . . . . . . . . . . . 550Figure 13.21 Crack distribution on wall elements . . . . . . . . . . . . . . . . . . . 552Figure 13.22 Time history of shake table motion under WCW . . . . . . . . . 553Figure 13.23 Variation of the first two natural frequencies . . . . . . . . . . . . 554Figure 13.24 Stiffness degradation . . . . . . . . . . . . . . . . . . . . . . . . . . . . . . . 555Figure 13.25 Variation of the damping ratio in direction X and Y. . . . . . . 556Figure 13.26 Distribution of acceleration amplifying coefficient
in the X and Y directions . . . . . . . . . . . . . . . . . . . . . . . . . . . 557Figure 13.27 Distribution of seismic force . . . . . . . . . . . . . . . . . . . . . . . . . 558Figure 13.28 Time history of displacement at roof level under WCW . . . . 560Figure 13.29 Maximum roof displacement under different test phases . . . . 561Figure 13.30 Distribution of maximum base shear under different
test phase . . . . . . . . . . . . . . . . . . . . . . . . . . . . . . . . . . . . . . . 562Figure 13.31 Distribution of shear coefficient under different
test phase . . . . . . . . . . . . . . . . . . . . . . . . . . . . . . . . . . . . . . . 563Figure 13.32 Fragility curves for qualifying the performance
of the RCA masonry building . . . . . . . . . . . . . . . . . . . . . . . . 565Figure 14.1 Hollow bricks production line . . . . . . . . . . . . . . . . . . . . . . . . 574Figure 14.2 Demonstration project of hollow bricks . . . . . . . . . . . . . . . . 574Figure 14.3 RAC road brick tiles . . . . . . . . . . . . . . . . . . . . . . . . . . . . . . . 575Figure 14.4 The influence of the amount of recycled fine aggregates
on the compressive strength of hollow bricks . . . . . . . . . . . . 576Figure 14.5 Hollow bricks . . . . . . . . . . . . . . . . . . . . . . . . . . . . . . . . . . . . 577Figure 14.6 Hollow brick column . . . . . . . . . . . . . . . . . . . . . . . . . . . . . . 578Figure 14.7 Recycled concrete hollow brick building. . . . . . . . . . . . . . . . 579Figure 14.8 Recycled concrete panel walls. . . . . . . . . . . . . . . . . . . . . . . . 582Figure 14.9 A view of road in Tongji University constructed
using RA. . . . . . . . . . . . . . . . . . . . . . . . . . . . . . . . . . . . . . . . 584Figure 14.10 A view of construction in progress of road with RA in
Fudan University. . . . . . . . . . . . . . . . . . . . . . . . . . . . . . . . . . 584Figure 14.11 “Shanghai Eco-House” located in Shanghai
World Expo Park . . . . . . . . . . . . . . . . . . . . . . . . . . . . . . . . . 589Figure 14.12 Construction of a Shanghai Urban RAC structure
as a test building with concrete made of 50% RA . . . . . . . . 590Figure 14.13 Demonstration project with RAC in Dujiangyan . . . . . . . . . . 591Figure 14.14 A test building in Beijing University of Civil Engineering
and Architecture . . . . . . . . . . . . . . . . . . . . . . . . . . . . . . . . . . 592
List of Figures xxxv
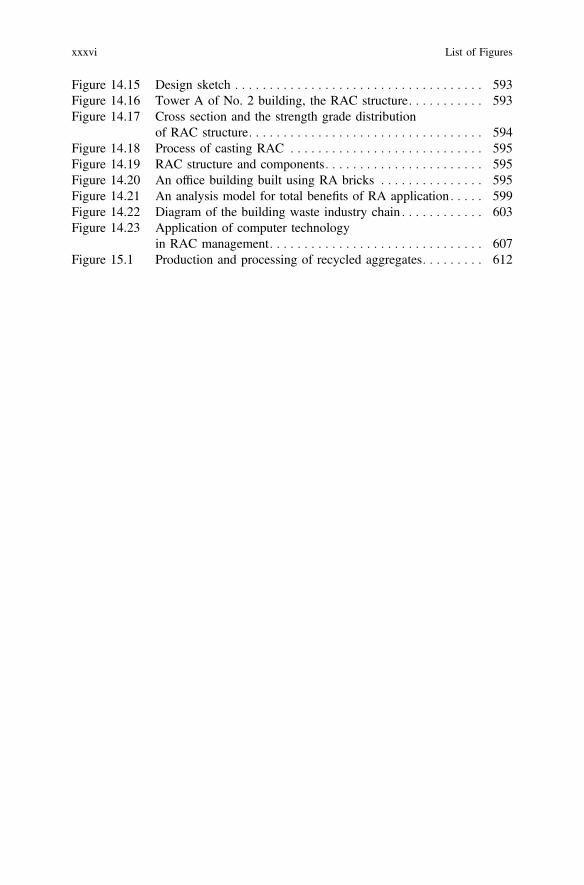
Figure 14.15 Design sketch . . . . . . . . . . . . . . . . . . . . . . . . . . . . . . . . . . . . 593Figure 14.16 Tower A of No. 2 building, the RAC structure. . . . . . . . . . . 593Figure 14.17 Cross section and the strength grade distribution
of RAC structure. . . . . . . . . . . . . . . . . . . . . . . . . . . . . . . . . . 594Figure 14.18 Process of casting RAC . . . . . . . . . . . . . . . . . . . . . . . . . . . . 595Figure 14.19 RAC structure and components. . . . . . . . . . . . . . . . . . . . . . . 595Figure 14.20 An office building built using RA bricks . . . . . . . . . . . . . . . 595Figure 14.21 An analysis model for total benefits of RA application . . . . . 599Figure 14.22 Diagram of the building waste industry chain . . . . . . . . . . . . 603Figure 14.23 Application of computer technology
in RAC management. . . . . . . . . . . . . . . . . . . . . . . . . . . . . . . 607Figure 15.1 Production and processing of recycled aggregates. . . . . . . . . 612
xxxvi List of Figures

List of Tables
Table 2.1 Building waste produced from demolition of oldbuildings. . . . . . . . . . . . . . . . . . . . . . . . . . . . . . . . . . . . . . . . . 16
Table 2.2 Amount of building waste produced during construction . . . . 17Table 2.3 Statistics on damage of buildings . . . . . . . . . . . . . . . . . . . . . . 19Table 2.4 Statistics on building damage of different structures. . . . . . . . 20Table 2.5 The experienced amount of demolition waste
in old buildings . . . . . . . . . . . . . . . . . . . . . . . . . . . . . . . . . . . 22Table 2.6 The mass of building waste per m2 generated by demolished
buildings. . . . . . . . . . . . . . . . . . . . . . . . . . . . . . . . . . . . . . . . . 22Table 2.7 Statistics on buildings under different damage status . . . . . . . 22Table 2.8 Statistical overview of building waste in the
disaster area . . . . . . . . . . . . . . . . . . . . . . . . . . . . . . . . . . . . . . 24Table 2.9 Proposed classification of recycled aggregates . . . . . . . . . . . . 34Table 3.1 Comparison of properties between NFA and RFA . . . . . . . . . 47Table 3.2 The RFA classification in Japan . . . . . . . . . . . . . . . . . . . . . . . 47Table 3.3 The RFA classification method. . . . . . . . . . . . . . . . . . . . . . . . 47Table 3.4 Density of NCA and RCA . . . . . . . . . . . . . . . . . . . . . . . . . . . 50Table 3.5 Water absorption rate of NCA and RCA . . . . . . . . . . . . . . . . 50Table 3.6 Porosity of NCA and RCA. . . . . . . . . . . . . . . . . . . . . . . . . . . 51Table 3.7 Crush value of NCA and RCA. . . . . . . . . . . . . . . . . . . . . . . . 51Table 3.8 Mass loss for NCA and RCA. . . . . . . . . . . . . . . . . . . . . . . . . 52Table 3.9 Content of elongated and flaky particle of NCA
and RCA . . . . . . . . . . . . . . . . . . . . . . . . . . . . . . . . . . . . . . . . 52Table 3.10 Content of clay for NCA and RCA . . . . . . . . . . . . . . . . . . . . 52Table 3.11 Apparent density under saturation surface dry condition
of RCA . . . . . . . . . . . . . . . . . . . . . . . . . . . . . . . . . . . . . . . . . 53Table 3.12 Water absorption of RCA. . . . . . . . . . . . . . . . . . . . . . . . . . . . 54Table 3.13 Content of adhered mortar of RCA . . . . . . . . . . . . . . . . . . . . 54Table 3.14 The requirements of RCA according to Hong Kong
civil engineering specification. . . . . . . . . . . . . . . . . . . . . . . . . 56Table 3.15 The requirements of RCA by RILEM . . . . . . . . . . . . . . . . . . 57
xxxvii

Table 3.16 The classification of RCA in Japanese regulations . . . . . . . . . 57Table 3.17 The classification of RCA in British standards . . . . . . . . . . . . 57Table 3.18 The requirements of RCA by other countries . . . . . . . . . . . . . 58Table 3.19 The classification of RCA in China . . . . . . . . . . . . . . . . . . . . 58Table 4.1 Adopted values for r . . . . . . . . . . . . . . . . . . . . . . . . . . . . . . . 69Table 4.2 Net water content for RAC . . . . . . . . . . . . . . . . . . . . . . . . . . 71Table 4.3 Sand amount in recycled aggregate concrete . . . . . . . . . . . . . 72Table 4.4 Recommended water–binder ratio
for high-performance RAC. . . . . . . . . . . . . . . . . . . . . . . . . . . 74Table 4.5 Recommended sand content for high-performance RAC . . . . 75Table 4.6 Mix proportions of RAC I and RAC II . . . . . . . . . . . . . . . . . 83Table 5.1 Mixture proportions of mortar in MRAC . . . . . . . . . . . . . . . . 101Table 5.2 Physical properties of RCA . . . . . . . . . . . . . . . . . . . . . . . . . . 102Table 5.3 Mixture proportion details of RAC. . . . . . . . . . . . . . . . . . . . . 102Table 5.4 Mechanical parameters of each phase in MRAC
in the parametric analysis . . . . . . . . . . . . . . . . . . . . . . . . . . . . 109Table 5.5 Mechanical properties of MRAC for different elastic
modulus of old ITZ and new ITZ. . . . . . . . . . . . . . . . . . . . . . 112Table 5.6 Stress characteristics of MRAC for different elastic modulus
of old ITZ and new ITZ. . . . . . . . . . . . . . . . . . . . . . . . . . . . . 113Table 5.7 Mix proportion of mortar . . . . . . . . . . . . . . . . . . . . . . . . . . . . 116Table 5.8 MRCA and corresponding MRAC specimens . . . . . . . . . . . . 117Table 5.9 The parameters in the FEM simulations . . . . . . . . . . . . . . . . . 129Table 5.10 Parameters used in the FEM simulations . . . . . . . . . . . . . . . . 130Table 6.1 Relative cube compressive strength of RAC with the
different w/c ratio and the curing age . . . . . . . . . . . . . . . . . . . 145Table 6.2 Statistical parameters of all the recycled aggregate
replacement groups’ compressive strength . . . . . . . . . . . . . . . 147Table 6.3 Normal distribution v2 examining procedure
of compressive strength for RAC with RCA replacementpercentage “r” at 100% . . . . . . . . . . . . . . . . . . . . . . . . . . . . . 148
Table 6.4 Distribution v2 examining results of RACcompressive strength . . . . . . . . . . . . . . . . . . . . . . . . . . . . . . . 148
Table 6.5 Bayes estimation results of the standard deviation for RACcompressive strength . . . . . . . . . . . . . . . . . . . . . . . . . . . . . . . 151
Table 6.6 Main test results chart . . . . . . . . . . . . . . . . . . . . . . . . . . . . . . 151Table 6.7 Ratio of RAC flexural strength to cube
compressive strength . . . . . . . . . . . . . . . . . . . . . . . . . . . . . . . 153Table 6.8 Prism and cube compressive strength of RAC . . . . . . . . . . . . 154Table 6.9 Mean values of the residual flexural strength of RAC . . . . . . 160Table 7.1 Physical properties of NCA and RCA . . . . . . . . . . . . . . . . . . 168Table 7.2 Mix proportions of concrete . . . . . . . . . . . . . . . . . . . . . . . . . . 168Table 7.3 Parameters a and b . . . . . . . . . . . . . . . . . . . . . . . . . . . . . . . . . 171Table 7.4 Compressive strengths of RAC. . . . . . . . . . . . . . . . . . . . . . . . 172
xxxviii List of Tables

Table 7.5 Physical properties of NCA and RCA . . . . . . . . . . . . . . . . . . 175Table 7.6 Mix proportions . . . . . . . . . . . . . . . . . . . . . . . . . . . . . . . . . . . 176Table 7.7 Mix proportions of the concrete . . . . . . . . . . . . . . . . . . . . . . . 181Table 7.8 Gradation of the NCA . . . . . . . . . . . . . . . . . . . . . . . . . . . . . . 182Table 7.9 Gradation of the RCA . . . . . . . . . . . . . . . . . . . . . . . . . . . . . . 182Table 7.10 Physical properties of natural aggregate
and recycled aggregate . . . . . . . . . . . . . . . . . . . . . . . . . . . . . . 186Table 7.11 Basic parameters of the lattice . . . . . . . . . . . . . . . . . . . . . . . . 192Table 7.12 Quantity of coarse aggregate of different particle size . . . . . . 193Table 7.13 Mechanical parameters of elements from the experiment . . . . 194Table 7.14 Chemical composition of cement . . . . . . . . . . . . . . . . . . . . . . 198Table 7.15 Basic properties of RCA and natural coarse aggregate . . . . . . 199Table 7.16 Twenty-eight-day compressive strength and elastic
modulus of RAC . . . . . . . . . . . . . . . . . . . . . . . . . . . . . . . . . . 200Table 7.17 Member bearing capacities . . . . . . . . . . . . . . . . . . . . . . . . . . . 204Table 7.18 Initial modulus and peak strain of confined RAC. . . . . . . . . . 207Table 7.19 Comparisons between calculated and experimental
peak load . . . . . . . . . . . . . . . . . . . . . . . . . . . . . . . . . . . . . . . . 211Table 7.20 Comparisons between calculated and experimental
peak load . . . . . . . . . . . . . . . . . . . . . . . . . . . . . . . . . . . . . . . . 212Table 7.21 Grading of RCA: mesh analysis and calculation . . . . . . . . . . 215Table 7.22 Basic property of coarse aggregates . . . . . . . . . . . . . . . . . . . . 216Table 7.23 Mechanical properties of steel . . . . . . . . . . . . . . . . . . . . . . . . 216Table 7.24 Mixture proportions of RAC . . . . . . . . . . . . . . . . . . . . . . . . . 217Table 7.25 A summary of specimens and their details . . . . . . . . . . . . . . . 219Table 7.26 List of main test results . . . . . . . . . . . . . . . . . . . . . . . . . . . . . 222Table 7.27 Effect of compressive strength to the ultimate shear load . . . . 227Table 7.28 Shear strength su from the test and codes. . . . . . . . . . . . . . . . 230Table 7.29 Physical properties of NCA and RCA . . . . . . . . . . . . . . . . . . 232Table 7.30 Mix proportions of concretes . . . . . . . . . . . . . . . . . . . . . . . . . 233Table 7.31 Values of parameters a and b in different
RAC specimens . . . . . . . . . . . . . . . . . . . . . . . . . . . . . . . . . . . 242Table 8.1 Chemical composition and physical properties of Portland
cement used . . . . . . . . . . . . . . . . . . . . . . . . . . . . . . . . . . . . . . 252Table 8.2 Physical properties of NCA and RCA . . . . . . . . . . . . . . . . . . 252Table 8.3 RAC mix proportions . . . . . . . . . . . . . . . . . . . . . . . . . . . . . . . 253Table 8.4 Physical and mechanical properties of RAC and mortar. . . . . 255Table 8.5 Value of instantaneous elastic strain, elastic strain and
0.1-day strain of RAC . . . . . . . . . . . . . . . . . . . . . . . . . . . . . . 258Table 8.6 Quantification of R�1
ACC;0 (adopted from fib Bulletin 34) . . . . . 259Table 8.7 Mostly considered factors in the existing models . . . . . . . . . . 261Table 8.8 The property of RCA . . . . . . . . . . . . . . . . . . . . . . . . . . . . . . . 261Table 8.9 A–F carbonation specimens . . . . . . . . . . . . . . . . . . . . . . . . . . 262
List of Tables xxxix

Table 8.10 The recycled aggregate concrete carbonation and the 28-dcompressive strength . . . . . . . . . . . . . . . . . . . . . . . . . . . . . . . 264
Table 8.11 The tensile status of the concrete specimen with actualapplied load . . . . . . . . . . . . . . . . . . . . . . . . . . . . . . . . . . . . . . 268
Table 8.12 Data of the total chloride concentration in concrete . . . . . . . . 273Table 8.13 Data of the concrete free chloride concentration. . . . . . . . . . . 274Table 8.14 The new and old mortar proportions . . . . . . . . . . . . . . . . . . . 281Table 8.15 The chloride diffusivity by the RCM . . . . . . . . . . . . . . . . . . . 284Table 8.16 Results of compression fatigue tests . . . . . . . . . . . . . . . . . . . . 287Table 8.17 Results of bending fatigue tests . . . . . . . . . . . . . . . . . . . . . . . 292Table 9.1 Physical properties of NCA and RCA . . . . . . . . . . . . . . . . . . 300Table 9.2 Surface characteristics of the rebars . . . . . . . . . . . . . . . . . . . . 300Table 9.3 Mix proportions of concrete . . . . . . . . . . . . . . . . . . . . . . . . . . 300Table 9.4 Description of the pullout specimens . . . . . . . . . . . . . . . . . . . 301Table 9.5 The summary of the bond strength. . . . . . . . . . . . . . . . . . . . . 304Table 9.6 List of relative bond strength . . . . . . . . . . . . . . . . . . . . . . . . . 305Table 9.7 Regress parameter of b1 . . . . . . . . . . . . . . . . . . . . . . . . . . . . . 306Table 9.8 Physical properties of RCA . . . . . . . . . . . . . . . . . . . . . . . . . . 308Table 9.9 The mix proportion and compressive strength of RAC. . . . . . 309Table 9.10 The corrosion percentage of the steel bar embedded
in the pullout test specimens . . . . . . . . . . . . . . . . . . . . . . . . . 311Table 9.11 Pullout test results of bonding behavior between recycled
concrete and corroded steel bars. . . . . . . . . . . . . . . . . . . . . . . 315Table 9.12 The value of parameter b2 . . . . . . . . . . . . . . . . . . . . . . . . . . . 316Table 10.1 Test results . . . . . . . . . . . . . . . . . . . . . . . . . . . . . . . . . . . . . . . 326Table 10.2 Parameter values for RAC stress–strain curves. . . . . . . . . . . . 328Table 10.3 Ratio of the statistical results of the calculated values
obtained by assumptions 1–4 and values obtained by theformula in Chinese code. . . . . . . . . . . . . . . . . . . . . . . . . . . . . 329
Table 10.4 Statistical results of compressive strengthand model error . . . . . . . . . . . . . . . . . . . . . . . . . . . . . . . . . . . 330
Table 10.5 Test results . . . . . . . . . . . . . . . . . . . . . . . . . . . . . . . . . . . . . . . 334Table 10.6 Approximate calculation model of coefficient . . . . . . . . . . . . . 337Table 10.7 Properties of the coarse aggregate . . . . . . . . . . . . . . . . . . . . . 338Table 10.8 Mix proportions of concrete . . . . . . . . . . . . . . . . . . . . . . . . . . 338Table 10.9 Mechanical properties of reinforcements . . . . . . . . . . . . . . . . 339Table 10.10 Details of specimens. . . . . . . . . . . . . . . . . . . . . . . . . . . . . . . . 339Table 10.11 Ductility ratio and bending stiffness . . . . . . . . . . . . . . . . . . . . 345Table 10.12 Flexural capacity . . . . . . . . . . . . . . . . . . . . . . . . . . . . . . . . . . 346Table 10.13 Mechanical properties of RAC . . . . . . . . . . . . . . . . . . . . . . . . 350Table 10.14 Principal tensile stress at point of attached strain gauges . . . . 351Table 10.15 RCA properties. . . . . . . . . . . . . . . . . . . . . . . . . . . . . . . . . . . . 354Table 10.16 Mix proportion of concrete. . . . . . . . . . . . . . . . . . . . . . . . . . . 355
xl List of Tables

Table 10.17 Compressive strength and elastic modulus of concreteat 28 days. . . . . . . . . . . . . . . . . . . . . . . . . . . . . . . . . . . . . . . . 355
Table 10.18 Mechanical properties of the reinforcement bars. . . . . . . . . . . 355Table 10.19 Construction details of the slabs . . . . . . . . . . . . . . . . . . . . . . . 356Table 10.20 Parameters about RAC compressive stress–strain . . . . . . . . . . 363Table 10.21 Parameter a . . . . . . . . . . . . . . . . . . . . . . . . . . . . . . . . . . . . . . 363Table 10.22 The properties of fine aggregates (medium sand) . . . . . . . . . . 366Table 10.23 Particle size distributions of RCA . . . . . . . . . . . . . . . . . . . . . 366Table 10.24 Properties of RCA . . . . . . . . . . . . . . . . . . . . . . . . . . . . . . . . . 367Table 10.25 Concrete mix proportion. . . . . . . . . . . . . . . . . . . . . . . . . . . . . 367Table 10.26 28d cube compressive strength and the elastic modulus
of concrete . . . . . . . . . . . . . . . . . . . . . . . . . . . . . . . . . . . . . . . 367Table 10.27 Tensile properties of steel /12 . . . . . . . . . . . . . . . . . . . . . . . . 368Table 10.28 Load and deflection of the slabs at punching failure . . . . . . . 372Table 10.29 Displacement ductility coefficient and energy absorption . . . . 378Table 10.30 Punching calculations of the steel fibers reinforced recycled
concrete slab. . . . . . . . . . . . . . . . . . . . . . . . . . . . . . . . . . . . . . 379Table 10.31 Column specimen markings . . . . . . . . . . . . . . . . . . . . . . . . . . 381Table 10.32 Test values and theoretical values of the bearing capacity . . . 384Table 10.33 Influence of the related cross-sectional area dimensions on
the column reliability . . . . . . . . . . . . . . . . . . . . . . . . . . . . . . . 388Table 11.1 Basic properties of the coarse aggregates . . . . . . . . . . . . . . . . 397Table 11.2 Mix proportion of concrete. . . . . . . . . . . . . . . . . . . . . . . . . . . 398Table 11.3 Compressive strength and elastic modulus of concrete after
28 days of curing age. . . . . . . . . . . . . . . . . . . . . . . . . . . . . . . 399Table 11.4 Mechanical properties of the reinforcement bars. . . . . . . . . . . 399Table 11.5 Construction details of the semi-precast columns . . . . . . . . . . 400Table 11.6 Characteristic loads of the specimens . . . . . . . . . . . . . . . . . . . 407Table 11.7 Characteristic displacements and ductility
of the specimens. . . . . . . . . . . . . . . . . . . . . . . . . . . . . . . . . . . 411Table 11.8 Equivalent viscous damping ratios of each specimen
at the critical states . . . . . . . . . . . . . . . . . . . . . . . . . . . . . . . . . 413Table 11.9 Comparison between the measured and calculated values . . . 414Table 11.10 Physical properties of recycled coarse aggregates and
natural coarse aggregates . . . . . . . . . . . . . . . . . . . . . . . . . . . . 415Table 11.11 Concrete mix proportion. . . . . . . . . . . . . . . . . . . . . . . . . . . . . 416Table 11.12 The 28-day compressive strength of RAC . . . . . . . . . . . . . . . 417Table 11.13 Test results . . . . . . . . . . . . . . . . . . . . . . . . . . . . . . . . . . . . . . . 417Table 12.1 Mix proportion of concrete. . . . . . . . . . . . . . . . . . . . . . . . . . . 434Table 12.2 Mechanical properties of steel . . . . . . . . . . . . . . . . . . . . . . . . 435Table 12.3 Test results . . . . . . . . . . . . . . . . . . . . . . . . . . . . . . . . . . . . . . . 437Table 12.4 Joint’s ductility coefficient . . . . . . . . . . . . . . . . . . . . . . . . . . . 439Table 12.5 Comparison between calculated and actual measured
shear-resisting capacity . . . . . . . . . . . . . . . . . . . . . . . . . . . . . . 440
List of Tables xli
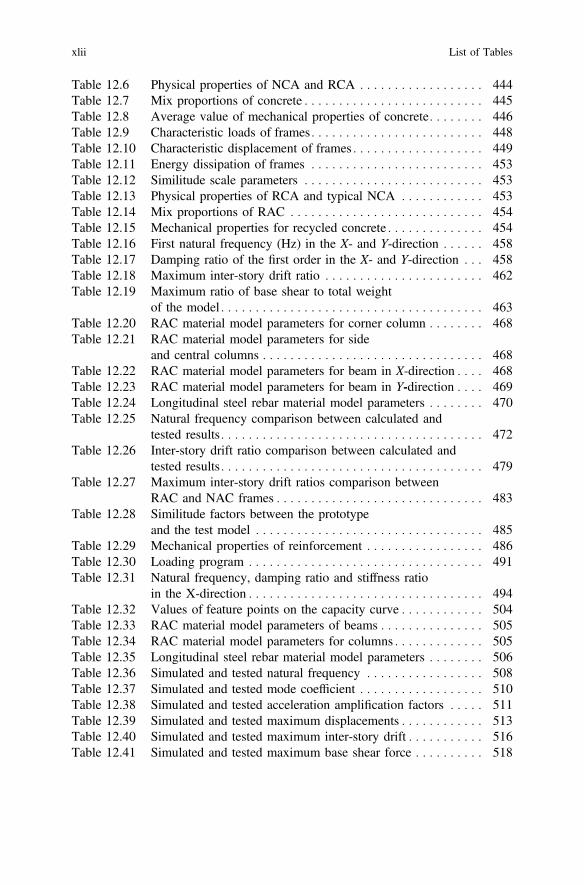
Table 12.6 Physical properties of NCA and RCA . . . . . . . . . . . . . . . . . . 444Table 12.7 Mix proportions of concrete . . . . . . . . . . . . . . . . . . . . . . . . . . 445Table 12.8 Average value of mechanical properties of concrete. . . . . . . . 446Table 12.9 Characteristic loads of frames . . . . . . . . . . . . . . . . . . . . . . . . . 448Table 12.10 Characteristic displacement of frames . . . . . . . . . . . . . . . . . . . 449Table 12.11 Energy dissipation of frames . . . . . . . . . . . . . . . . . . . . . . . . . 453Table 12.12 Similitude scale parameters . . . . . . . . . . . . . . . . . . . . . . . . . . 453Table 12.13 Physical properties of RCA and typical NCA . . . . . . . . . . . . 453Table 12.14 Mix proportions of RAC . . . . . . . . . . . . . . . . . . . . . . . . . . . . 454Table 12.15 Mechanical properties for recycled concrete . . . . . . . . . . . . . . 454Table 12.16 First natural frequency (Hz) in the X- and Y-direction . . . . . . 458Table 12.17 Damping ratio of the first order in the X- and Y-direction . . . 458Table 12.18 Maximum inter-story drift ratio . . . . . . . . . . . . . . . . . . . . . . . 462Table 12.19 Maximum ratio of base shear to total weight
of the model . . . . . . . . . . . . . . . . . . . . . . . . . . . . . . . . . . . . . . 463Table 12.20 RAC material model parameters for corner column . . . . . . . . 468Table 12.21 RAC material model parameters for side
and central columns . . . . . . . . . . . . . . . . . . . . . . . . . . . . . . . . 468Table 12.22 RAC material model parameters for beam in X-direction . . . . 468Table 12.23 RAC material model parameters for beam in Y-direction . . . . 469Table 12.24 Longitudinal steel rebar material model parameters . . . . . . . . 470Table 12.25 Natural frequency comparison between calculated and
tested results . . . . . . . . . . . . . . . . . . . . . . . . . . . . . . . . . . . . . . 472Table 12.26 Inter-story drift ratio comparison between calculated and
tested results . . . . . . . . . . . . . . . . . . . . . . . . . . . . . . . . . . . . . . 479Table 12.27 Maximum inter-story drift ratios comparison between
RAC and NAC frames . . . . . . . . . . . . . . . . . . . . . . . . . . . . . . 483Table 12.28 Similitude factors between the prototype
and the test model . . . . . . . . . . . . . . . . . . . . . . . . . . . . . . . . . 485Table 12.29 Mechanical properties of reinforcement . . . . . . . . . . . . . . . . . 486Table 12.30 Loading program . . . . . . . . . . . . . . . . . . . . . . . . . . . . . . . . . . 491Table 12.31 Natural frequency, damping ratio and stiffness ratio
in the X-direction . . . . . . . . . . . . . . . . . . . . . . . . . . . . . . . . . . 494Table 12.32 Values of feature points on the capacity curve . . . . . . . . . . . . 504Table 12.33 RAC material model parameters of beams . . . . . . . . . . . . . . . 505Table 12.34 RAC material model parameters for columns . . . . . . . . . . . . . 505Table 12.35 Longitudinal steel rebar material model parameters . . . . . . . . 506Table 12.36 Simulated and tested natural frequency . . . . . . . . . . . . . . . . . 508Table 12.37 Simulated and tested mode coefficient . . . . . . . . . . . . . . . . . . 510Table 12.38 Simulated and tested acceleration amplification factors . . . . . 511Table 12.39 Simulated and tested maximum displacements . . . . . . . . . . . . 513Table 12.40 Simulated and tested maximum inter-story drift . . . . . . . . . . . 516Table 12.41 Simulated and tested maximum base shear force . . . . . . . . . . 518
xlii List of Tables

Table 12.42 Feature points on the simulated and testedcapacity curves . . . . . . . . . . . . . . . . . . . . . . . . . . . . . . . . . . . . 519
Table 12.43 Parameters of RAC50 material model for beams . . . . . . . . . . 520Table 12.44 Parameters of RAC50 material model for columns. . . . . . . . . 520Table 12.45 Natural frequencies of model RAC100 and RAC50 . . . . . . . . 520Table 12.46 Maximum base shear force of model RAC100
and RAC50 . . . . . . . . . . . . . . . . . . . . . . . . . . . . . . . . . . . . . . 521Table 12.47 Feature points on capacity curves of two
simulated models . . . . . . . . . . . . . . . . . . . . . . . . . . . . . . . . . . 521Table 13.1 Details of the RAC hollow block . . . . . . . . . . . . . . . . . . . . . . 527Table 13.2 Measured properties of the RAC hollow block. . . . . . . . . . . . 527Table 13.3 Details of the RAC. . . . . . . . . . . . . . . . . . . . . . . . . . . . . . . . . 527Table 13.4 Measured mechanical properties of the rebars . . . . . . . . . . . . 527Table 13.5 Average load and displacement of specimens. . . . . . . . . . . . . 530Table 13.6 Displacement ductility coefficient calculated
by (a) or (b) method. . . . . . . . . . . . . . . . . . . . . . . . . . . . . . . . 533Table 13.7 Seismic test results of the NAC block walls confined by tie
column-beam . . . . . . . . . . . . . . . . . . . . . . . . . . . . . . . . . . . . . 534Table 13.8 Equivalent viscous damping ratios of specimens . . . . . . . . . . 535Table 13.9 Characteristic secant stiffness of specimens . . . . . . . . . . . . . . 535Table 13.10 Comparison between test values and calculated values. . . . . . 541Table 13.11 Mechanical properties for RAC block . . . . . . . . . . . . . . . . . . 542Table 13.12 Mix design for RAC . . . . . . . . . . . . . . . . . . . . . . . . . . . . . . . 543Table 13.13 Test program . . . . . . . . . . . . . . . . . . . . . . . . . . . . . . . . . . . . . 549Table 13.14 The dynamic properties of the RAC block
masonry model . . . . . . . . . . . . . . . . . . . . . . . . . . . . . . . . . . . . 551Table 13.15 Variations of damping ratio under different earthquake
wave excitations . . . . . . . . . . . . . . . . . . . . . . . . . . . . . . . . . . . 556Table 13.16 Acceleration amplifying coefficient in
the X- and Y-directions . . . . . . . . . . . . . . . . . . . . . . . . . . . . . 557Table 13.17 Maximum value of the roof displacement and the total
displacement/height . . . . . . . . . . . . . . . . . . . . . . . . . . . . . . . . 561Table 13.18 Ratio of average base shear to total weight of the model . . . . 563Table 13.19 Description of damage and post-earthquake utility . . . . . . . . . 564Table 13.20 Structural performance levels and drift ratio limits . . . . . . . . . 564Table 14.1 Mix-proportions of RAC hollow blocks . . . . . . . . . . . . . . . . . 575Table 14.2 Compressive strength of different mix-proportions
(mix ratios) of RAC hollow bricks . . . . . . . . . . . . . . . . . . . . . 575Table 14.3 A comparison of economic index for different types
of wall materials. . . . . . . . . . . . . . . . . . . . . . . . . . . . . . . . . . . 580Table 14.4 A comparison and analysis of wall materials . . . . . . . . . . . . . 580Table 14.5 A comparison of properties between recycled concrete
panels and other wall materials . . . . . . . . . . . . . . . . . . . . . . . 581Table 14.6 Dual stable RAs mix-proportion . . . . . . . . . . . . . . . . . . . . . . . 585
List of Tables xliii
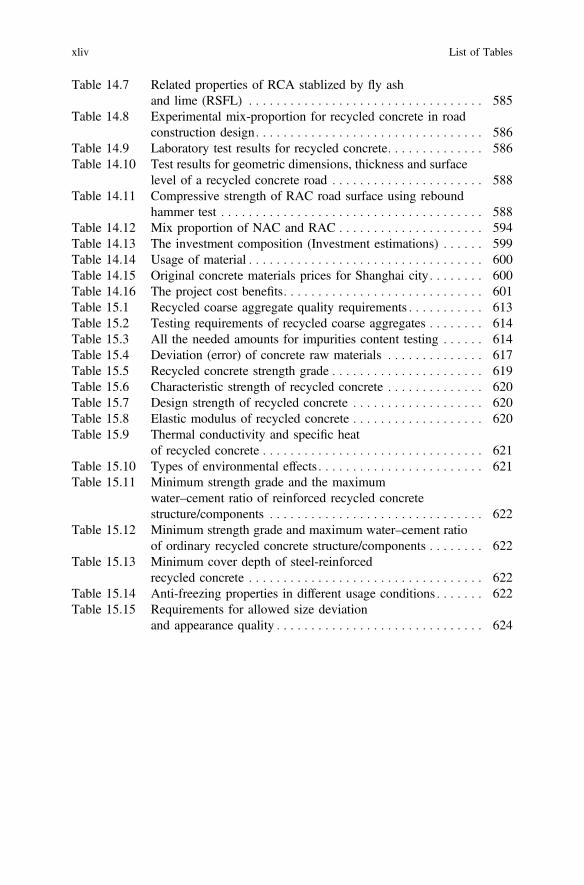
Table 14.7 Related properties of RCA stablized by fly ashand lime (RSFL) . . . . . . . . . . . . . . . . . . . . . . . . . . . . . . . . . . 585
Table 14.8 Experimental mix-proportion for recycled concrete in roadconstruction design. . . . . . . . . . . . . . . . . . . . . . . . . . . . . . . . . 586
Table 14.9 Laboratory test results for recycled concrete. . . . . . . . . . . . . . 586Table 14.10 Test results for geometric dimensions, thickness and surface
level of a recycled concrete road . . . . . . . . . . . . . . . . . . . . . . 588Table 14.11 Compressive strength of RAC road surface using rebound
hammer test . . . . . . . . . . . . . . . . . . . . . . . . . . . . . . . . . . . . . . 588Table 14.12 Mix proportion of NAC and RAC . . . . . . . . . . . . . . . . . . . . . 594Table 14.13 The investment composition (Investment estimations) . . . . . . 599Table 14.14 Usage of material . . . . . . . . . . . . . . . . . . . . . . . . . . . . . . . . . . 600Table 14.15 Original concrete materials prices for Shanghai city . . . . . . . . 600Table 14.16 The project cost benefits. . . . . . . . . . . . . . . . . . . . . . . . . . . . . 601Table 15.1 Recycled coarse aggregate quality requirements . . . . . . . . . . . 613Table 15.2 Testing requirements of recycled coarse aggregates . . . . . . . . 614Table 15.3 All the needed amounts for impurities content testing . . . . . . 614Table 15.4 Deviation (error) of concrete raw materials . . . . . . . . . . . . . . 617Table 15.5 Recycled concrete strength grade . . . . . . . . . . . . . . . . . . . . . . 619Table 15.6 Characteristic strength of recycled concrete . . . . . . . . . . . . . . 620Table 15.7 Design strength of recycled concrete . . . . . . . . . . . . . . . . . . . 620Table 15.8 Elastic modulus of recycled concrete . . . . . . . . . . . . . . . . . . . 620Table 15.9 Thermal conductivity and specific heat
of recycled concrete . . . . . . . . . . . . . . . . . . . . . . . . . . . . . . . . 621Table 15.10 Types of environmental effects . . . . . . . . . . . . . . . . . . . . . . . . 621Table 15.11 Minimum strength grade and the maximum
water–cement ratio of reinforced recycled concretestructure/components . . . . . . . . . . . . . . . . . . . . . . . . . . . . . . . 622
Table 15.12 Minimum strength grade and maximum water–cement ratioof ordinary recycled concrete structure/components . . . . . . . . 622
Table 15.13 Minimum cover depth of steel-reinforcedrecycled concrete . . . . . . . . . . . . . . . . . . . . . . . . . . . . . . . . . . 622
Table 15.14 Anti-freezing properties in different usage conditions . . . . . . . 622Table 15.15 Requirements for allowed size deviation
and appearance quality . . . . . . . . . . . . . . . . . . . . . . . . . . . . . . 624
xliv List of Tables
Chapter 1Introduction
Abstract This chapter introduces the basic strategy and possible procedure forrecycled aggregate concrete (RAC) from a viewpoint of sustainable development ofbuilding industry. It then follows the advancement of the concrete recycling ideawhich is based on literature review. The outline of this book is also described at theend of this chapter.
1.1 Sustainable Development of Building Industry
1.1.1 The Consumption of Energy and Resourcesin Building Industry
The twentieth century has been the most active century throughout the history ofhuman civilization. 8% of human achievements in science and technology weremade within the last 100 years. During this period, the world population growthrate is unprecedented. At the beginning of the twentieth century, the world’spopulation was 1500 million, and by the year 2016, it reached 7300 million. Anincrease in the world population has also seen a rise in migration to cities and theadvancement of the building industry.
In theUSA,FranklinAssociates [1] estimated the building-related construction anddemolition (C andD)waste generatedwas 136million tonnes in 1996, andUSEPA [2]concluded the total building-related C and D waste was almost 170 million tonnes in2003, with 39% coming from residential and 61% from non-residential sources.
In Europe, Bossink and Brouwers [3] firstly quantified the waste generationduring several residential construction projects in the Netherlands. The researchdata indicates that 9% of the totally purchased materials end up as waste. From 1 to10% of every single purchased construction material leaves the construction site assolid waste. Sáez et al. [4] reported that Europe generated around 890 milliontonnes of C and D waste.
In Asia, Seo and Hwang [5] estimated that the amount of C and D waste in Seoul,the capital city of South Korea, was about 8.63 million tonnes in the year 1999 and
© Springer-Verlag GmbH Germany 2018J. Xiao, Recycled Aggregate Concrete Structures,Springer Tracts in Civil Engineering, https://doi.org/10.1007/978-3-662-53987-3_1
1

would follow an increasing trend in the later years. In China, Li et al. [6] found thatwaste generation rates ranged from 3.275 to 8.791 kg/m2, and among those mis-cellaneous waste, timber and concrete were the three largest components. In themainland of China, the amount of C and D waste reached 3000 million tonnes.
All along, the development of the building industry has not escaped the disadvan-tages of high energy consumption, overconsumption of resources, and environmentalpollution. Take the concrete industry as an example: from 10 million tonnes [7] ofcement consumption in 1900 to 3900 million tonnes in 2012. In terms of mix pro-portion of concrete; 12% cement, 8% water and 80% aggregate which means that26,000million tonnesofstoneandsand,2600million tonnesofwater isused tomakeup28,600million tonnes. Besides, 7471million tonnes of rawmaterial is used to produce3900million tonnes of cement annually. Therefore, it can be deduced that the concreteindustry consumes 36,071 million tonnes of solid and liquid materials altogether.Digging, crushing, and transportation of rawmaterials, as well as concrete productionand processing, all consume energy. According to statistics, the production of 28,600million tonnes of concrete consumes 3.93 � 1012 kWh of electricity, while 3900million tonnes of cement production generates and releases about 3361million tonnesof CO2, 1692million tonnes offly ash, 11.7million tonnes of SO2, 7.80million tonnesof NOx. In addition, a colossal quantity of C and D wastes are generated through thewhole life cycle of a building. The following data show how serious is the impact ofbuilding industry on environment.
• Building industry energy consumption is 25–40% of the total world energyconsumption.
• Building waste occupies 20–40% of the city’s total waste.• Noise created by building construction sites makes up one-third of the city’s
noise.• Carbon dioxide emissions from cement production make up 7% of the total CO2
emissions.
1.1.2 New Strategies for Sustainable Developmentin Building Industry
According to the World Energy Council, “sustainable growth is no longer an option—it is a necessity” [8]. The production system of building industry has had thecharacteristics of high investment, high pollution and less efficiency all along, andthis has been its development strategy, as illustrated in Fig. 1.1. In tradition, a lifecycle of a concrete structure begins from digging natural resources to raw materialsprocessing, building construction, until the service and maintenance, and ends at thedemolition of the building, with a little amount of recyclable building waste left toreuse. Meanwhile, a majority of C and D wastes are abandoned directly and causeencroachment of land as well as potential soil damage. Considerations being paid toresource consumption and environmental impact is indeed limited.
2 1 Introduction

With the development of society and economy as well as consciousness ofenvironmental protection, problems of resources and environment have been raisingmore and more attention. Since the 1980s, the transition to a moreenvironment-friendly, harmony with nature and sustainable building industry hasbecome an essential project, which arrests attention around the world, includingChina. Energy Conservation Law of the People’s Republic of China has beenformulated to promote the comprehensive and coordinated sustainable developmentof economy and society. In future, the building industry will inevitably transit tomeet the needs of modern people and also take into consideration reducing envi-ronmental impact and keeping resources, power consumption and ecology in bal-ance. The concept of sustainable development of the environment was first broughtup during 1980s. In brief, it means “meeting the needs of present without com-promising the ability of future generations to meet their own needs.” In November1994, the first session of the world sustainable development conference convened inFlorida, USA which discussed the building industry’s sustainable development. Itwas accepted that the building industry should take responsibilities towards thehuman sustainable development and this is the only way for building industry toprosper sustainably in 21st century.
Challis Guilbert, a professor at Florida University, proposed the six standardprinciples of sustainable development: smallest resources consumption, reusinglarge amounts of resources, using renewable resources, protecting natural envi-ronment, creating a healthy non-toxic environment and pursuing quality of con-struction environment. These six principles have represented the relations betweenthe building industry and the environment.
It is necessary and meanwhile inevitable that effective techniques that consumethe fewest resources and can keep a balance between production and ecologyshould be investigated preferentially, such as techniques that promote efficiency ofpower used during construction and service stage, develop ecological buildingmaterials and recycle the C and D wastes. Saving the natural resources, minimizingthe pollution, benefits from the quality and technology guiding are the irreversibletrends in the development of building industry. And these trends have been provedto be efficient by practice done by various countries such as Austria, Belgium,Brazil, Denmark, Finland, France, Germany, Greece, Iceland, Italy, Japan,Netherland, Norway, Spain, Sweden and Great Britain [9].
New building materials New buildings Demolition Building waste
Fig. 1.1 Strategy for sustainability of construction industry
1.1 Sustainable Development of Building Industry 3
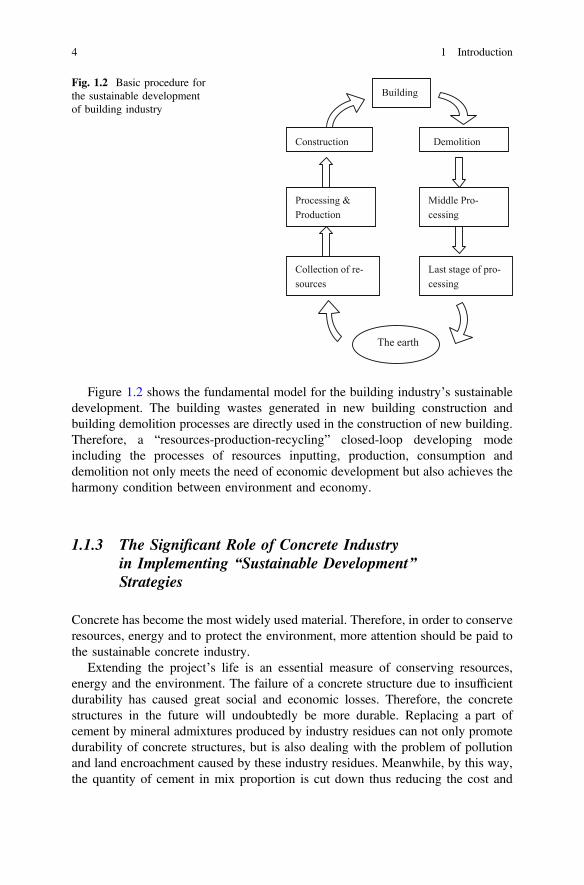
Figure 1.2 shows the fundamental model for the building industry’s sustainabledevelopment. The building wastes generated in new building construction andbuilding demolition processes are directly used in the construction of new building.Therefore, a “resources-production-recycling” closed-loop developing modeincluding the processes of resources inputting, production, consumption anddemolition not only meets the need of economic development but also achieves theharmony condition between environment and economy.
1.1.3 The Significant Role of Concrete Industryin Implementing “Sustainable Development”Strategies
Concrete has become the most widely used material. Therefore, in order to conserveresources, energy and to protect the environment, more attention should be paid tothe sustainable concrete industry.
Extending the project’s life is an essential measure of conserving resources,energy and the environment. The failure of a concrete structure due to insufficientdurability has caused great social and economic losses. Therefore, the concretestructures in the future will undoubtedly be more durable. Replacing a part ofcement by mineral admixtures produced by industry residues can not only promotedurability of concrete structures, but is also dealing with the problem of pollutionand land encroachment caused by these industry residues. Meanwhile, by this way,the quantity of cement in mix proportion is cut down thus reducing the cost and
Processing & Production
Construction Demolition
Last stage of pro-cessing
Building
The earth
Middle Pro-cessing
Collection of re-sources
Fig. 1.2 Basic procedure forthe sustainable developmentof building industry
4 1 Introduction

consumption of resources and energy in addition to the minimized gas pollutionemissions. Because of these advantages, Portland slag cement concrete conformsthe concept of “green concrete” and is an indispensable sustainable developmentdirection of the concrete industry.
Along with the Chinese building industry’s fast development, there is an increasein demand of sand and crushed stone. In order to satisfy this demand, over-exploitingof mountains for stones and rivers for sand are seriously destroying the ecologicalenvironment. In recent years, some areas in China have witnessed a natural aggre-gate depletion at higher rate, and therefore, leading to cost increment for stones andsand transportation. Meanwhile, the C and D wastes generation is mounting and isestimated that approximately 200 million tonnes of waste concrete are currentlygenerated annually in the mainland China [10]. Plenty of waste concrete from C andD, which results in encroachment of lands and potential soil damage, has become aproblem that should be addressed urgently, especially in big cities considering theirlimited land and space. RAC comes into being as a sustainable method of resolvingthe issue of natural resources shortage, environment pollution, and waste concrete.On the one side, investigation and applying RAC can resolve the problem of a greatamount of waste concrete and its concomitant problem of ecology and on other side,replacing virgin aggregate by recycled aggregate can decrease the consumption ofnatural aggregates to relieve the shortage of natural resources. In short, applyingRAC in engineering is propitious to meet the requirement of sustainable develop-ment. Therefore, this accords the conception of “green” proposed by the WorldEnvironment Organization: (1) conserve natural resources and energy; (2) nodamage but favour should be caused to the environment; (3) sustainable develop-ment meets both present generation’s needs and also does not harm the futuregeneration’s needs. The RAC technology has been widely considered to be one ofthe key strategies to develop green concrete and realize the building industry’sresources and environmental sustainable development.
1.2 Concrete Recycling and Reusing
1.2.1 The Life Cycle and Extension of Concrete Structures
The concrete structure’s life cycle includes the concrete raw materials production,concrete mixing, concrete components production, concrete structure construction,the service and the demolition process; Fig. 1.3 shows the cycle.
From the point view of a concrete structure’s life cycle, all stages include theenergy consumption, waste gas, wastewater and solid waste generation. Thelife-cycle assessment, LCA, of a concrete structure can analyze each process on allstages and can finally give an environmental quantitative analysis to the entireprocess each linking to the environmental impact and also gives suggestion on thereduction in environmental impact.
1.1 Sustainable Development of Building Industry 5

After demolition, the waste concrete is crushed and processed and then used asconcrete material (i.e., recycled coarse aggregates (RCA)) in the production of newconcrete. It is one of the current hot research topics application RAC in engineeringto reduce the environmental impact of concrete industry, as well as recycle theconcrete materials in a new structure effectively.
1.2.2 Waste Concrete
Waste concrete, the concrete which is obtained as a result of demolition of concretebuildings, pavements, dams and other concrete infrastructures, as well as remainsof concrete waste from the ready mix concrete plants.
As one of the pillar industries of the national economy, the construction industryhas been developing rapidly in recent years. However, increasing amount ofbuilding wastes has been generated, as displayed in Fig. 1.4 and it can be seen thatthe C and D wastes in China reached 1590 million tonnes in 2016, of which nearly500 million tonnes are waste concretes. With China’s socioeconomic development,annual concrete waste volumes will keep on increasing.
In the past 10 years, these waste concretes, except a small part used as thecushion of roads and buildings, are not processed and transported to suburbs orrural stacking or landfilling. This obviously will consume a lot of land requisitionfees, garbage fees, handling fees and other construction costs. Meanwhile, dustcaused by these processes will lead to environmental pollution making the citiesdirtier. In addition, concrete as the world’s most widely used man-made buildingmaterials consumes a lot of resources. According to statistics, it is estimated that5000 million tonnes of clay soil, limestone and sand are exploited annually in Chinato manufacture cement and concrete. The enormous demand will inevitably lead todepletion of natural resources and the final result will cause the deterioration of theecological environment. But at the same time, with the increase in the application of
Raw re-sources ex-ploiting
Concrete material production
Demolition
Concrete componentsproduction
Concrete structureconstruc-tion
Service and maintenance
Land filling
Reuse and Recycling
Fig. 1.3 General model for concrete structure’s life cycle
6 1 Introduction
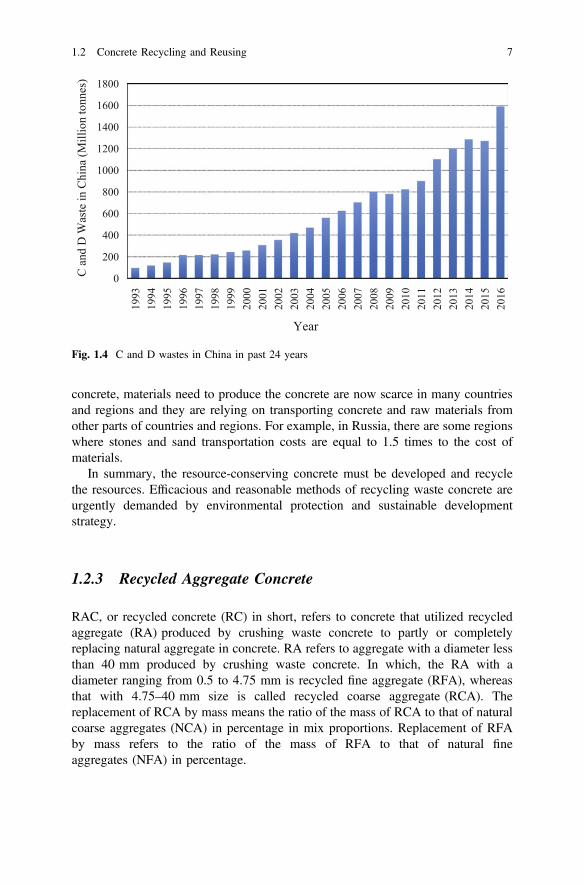
concrete, materials need to produce the concrete are now scarce in many countriesand regions and they are relying on transporting concrete and raw materials fromother parts of countries and regions. For example, in Russia, there are some regionswhere stones and sand transportation costs are equal to 1.5 times to the cost ofmaterials.
In summary, the resource-conserving concrete must be developed and recyclethe resources. Efficacious and reasonable methods of recycling waste concrete areurgently demanded by environmental protection and sustainable developmentstrategy.
1.2.3 Recycled Aggregate Concrete
RAC, or recycled concrete (RC) in short, refers to concrete that utilized recycledaggregate (RA) produced by crushing waste concrete to partly or completelyreplacing natural aggregate in concrete. RA refers to aggregate with a diameter lessthan 40 mm produced by crushing waste concrete. In which, the RA with adiameter ranging from 0.5 to 4.75 mm is recycled fine aggregate (RFA), whereasthat with 4.75–40 mm size is called recycled coarse aggregate (RCA). Thereplacement of RCA by mass means the ratio of the mass of RCA to that of naturalcoarse aggregates (NCA) in percentage in mix proportions. Replacement of RFAby mass refers to the ratio of the mass of RFA to that of natural fineaggregates (NFA) in percentage.
0
200
400
600
800
1000
1200
1400
1600
1800
1993
1994
1995
1996
1997
1998
1999
2000
2001
2002
2003
2004
2005
2006
2007
2008
2009
2010
2011
2012
2013
2014
2015
2016
C a
nd D
Was
te in
Chi
na (M
illio
n to
nnes
)
Year
Fig. 1.4 C and D wastes in China in past 24 years
1.2 Concrete Recycling and Reusing 7
1.3 An Overview on the Worldwide and China’s WasteConcrete Recycling Techniques
1.3.1 Worldwide Waste Concrete Recycling Techniques
After the World War II, the former Soviet Union, Germany, Japan and othercountries started to research the techniques to recycle the waste concrete [11, 12].Till now, International Union of Laboratories and Experts in ConstructionMaterials, Systems and Structures (RILEM) has held six international conferencesrelated to waste concrete recycling and proposed the environment friendly concrete.In 1976, the RILEM set up “The Demolition and Reuse of Concrete TechnicalCommittee” (37-DRC) [13] and began to study the waste concrete processing andrecycling techniques. In November 1988, a conference sponsored by the buildingresearch instituted by Japanese Ministry of Construction in Tokyo convened thesecond session of “RILEM International Conference on Demolition and Reuse ofConcrete,” and 29 papers were published at the conference concerning the reuse ofconcrete. Later on “The International conference on sustainable development of thecement and concrete industry” was held in Ottawa, Canada, and “Recycling wasteconcrete as aggregate and other recycled structural materials” was discussed as atopic. Also, in 1998 RILEM held a conference under the name “Application ofRecycled Concrete Aggregate for Sustainable Construction” in Britain. In 2004,RILEM convened another conference titled “The application of RA in structures” inSpain. The United Nations also puts emphasis on this research field. In 1992, theUnited Nations held “The United Nations Conference on the EnvironmentExploitation” in Brazil and attracted great importance to the issue of the earthenvironment. Also in 1992, the United Nations created Commission on Sustainabledevelopment, and its secondary organ, the International Organization forStandardization for discussing and designating the standardization for sustainableproducts. RAC technique has become a common concern of all countries in theworld and is also one of the hot and cutting-edge issues of domestic and interna-tional engineering and academic circles [14–18]. Some countries even usethe legislative form to ensure this researching and application.
As early as 1946, the former Soviet scholar Gluzhge [19] had already studied thepossibility of recycling waste concrete to produce recycled aggregate. At the end of1970s, about 40 million tonnes of waste concrete have been reused.
Due to the small land area, relatively scarce resources, Japan has regarded C andD wastes as a by-product of buildings, and a great emphasis has been put onrecycling and reusing these wastes. As early as 1977, the Japanese government hadformulated “Specification for use of RA and RC,” and many plants that couldproduce 100 tonne RAC per hour were established to process waste concrete andproduce RAC in Tokyo, Chiba, Nagoya, Osaka, and Kyoto. In 1991, the Japanesegovernment formulated “Law on promoting resources recycling” and stipulated that
8 1 Introduction
concrete, brick, concrete block, asphalt concrete block, lumber, metal, etc., wastegenerated in the construction process must be transported to “facility of recyclingresources” to be processed. In 1992, a 5-year developmental plan on controlling thedumping of by-products and recycling was proposed by Japanese Ministry ofConstruction. Furthermore, in October 1996, “Law on recycled resources” wasformulated to provide legal and institutional support for recycling and utilization ofwaste concrete. According to reports, by 1988 the ratio of building waste recyclingin Tokyo had reached 56%. In 1995, this ratio increased to 58%, and the ratio forwaste concrete was 65%, and for the sludge was 14%. And according to otherreports, the Japanese scientists have invented one kind of an integrated machinethat could crush waste concrete and produce RAC on sites.
Germany is the world’s first country implementing environment improvementinstitutions. All districts in Germany have large plants which recycle waste con-crete, in Berlin alone, there are 20 plants of this kind. At present, RC is mainly usedin pavement construction. In August 1998, the Germany Reinforced ConcreteCommittee proposed “Guideline for RA used in concrete” and required that con-crete with RA must accord with the national standard of normal concrete (NC).
United State is also one of the pioneer countries to put forward environmentalsigns institutions. According to reports by Federal Highway Administration, thereare more than 20 states that allow application of RA in highway construction, and26 states allow the utilization of RA as base material. Meanwhile, there are 15 statesthat have formed regulations on RA. US has formed “Super Fund Law,” or“Comprehensive Environmental Response, Compensation, and Liability Act,”which aided the development of RA with protection by the law. Among the reg-ulations: “any manufacturing enterprise with industrial wastes, should handle wasteproperly, and discarding without processing is forbidden.” In the middle of 1980s,aggregates crushed by old concrete were used in a new-built road by theTransportation Department of Kansas State. It is proved that, with many years ofobservation, it is feasible to utilize waste concrete as the pavement surface.Recently, a new microwave technique was developed that can recycle superficiallayer material of asphalt concrete pavement with identical quality to new asphaltconcrete with one-third declination in cost. In addition, the cost of transporting,processing building waste as well as environmental pollution was reduced.
Generally speaking, from the beginning to the end of 1970s, research on RA byGermany, Japan, Holland, USA, and other developed countries has been devel-oping rapidly. These research's have achieved good results and successful appli-cations in engineering projects. Overall, researchers are focusing on followingfields:
(1) Technique of producing RA from waste concrete, solving difficulties in recy-cling and expanding the RA application.
1.3 An Overview on the Worldwide and China’s Waste Concrete Recycling Techniques 9

(2) The classifications of RA and RAC and their fundamental properties. Influenceof parent concrete on the properties of RAC. Formulating guideline for RA andRAC.
(3) Laws and regulations to encourage application of RA and RAC.
1.3.2 The Development of RAC Technology in China
Due to large land area and affluent natural resources, China was not threatened bythe crisis of raw material shortage. Therefore, research in China on RAC startedlate. However, with the enhancement of awareness of environmental protection,from 1990s many Chinese investigators have engaged in studying the RAC.
The Chinese government has formulated medium and long-term science andeducational development strategies for sustainable development, encouragingrecycling waste concrete and its corresponding research. In 1997, Ministry ofHousing and Urban-Rural development of the People’s Republic of China(MOHURD) included “Building waste comprehensive utilization” in the key pro-jects of scientific and technological achievements. In 2002, Shanghai Science andTechnology Commission set up key projects to conduct the systematic researches ofrecycling and effective reuse of waste concrete. In 2004, the Ministry of Transportstarted investigating “Key technology of recycling cement concrete pavement.” In2007, China’s Ministry of Scientific and Technology launched the “Research onrecycled products by building wastes” and was supported by the National Scienceand Technology Pillar Program.
At present, the application of RA in China is still at an early stage with itsdemonstration phase. And systematic basic research for application is still lacking.Meanwhile, guidelines, codes, and standards on RA and RAC are scarce to guideengineering. On the other hand, investigations illustrate that there exist some dif-ferences between the mechanical behaviors of RAC and those of ordinary concrete,including in mix proportion and construction techniques. Thus, the ordinary con-crete’s codes and standards could not directly be applied to the design of RACstructures. Due to its complexity and variability, systematic research on RA andRAC are very necessary.
In recent years, many Chinese investigators have engaged in studying RAC, andnearly all aspects of mechanical property and structural performance have beencovered. Some building engineering companies in Shanghai, Beijing and othercities in China have tried reusing building wastes alongwith some colleges andresearch institutes which have been funded by the relevant departments to engagein this field. Researches of recycled building wastes and RAC have already becomeconcrete studies interest and have received great attentions.
10 1 Introduction
1.4 Problems to Research RAC and Forecastof Developing Trend
1.4.1 Primary Problems
Recent years has seen quite a great advancement in RAC research and techniquesboth in China and overseas. However, research on RAC are still limited in the fieldof material properties. Study on RAC structures is still lacking. There are manyproblems need urgent studying:
(1) Further research should be conducted on RAC mix proportion design. Use ofnatural concrete (NC) mix proportion design method for reference, a sheetwhere the quantity of water and cement per 1 m3 could be determined isneeded. A massive amount of data is needed about the relation between mixproportion and mechanical properties of RAC.
(2) The research on durability and fire behavior of RAC is still relatively weak.(3) The bearing capacity of a RAC structure (flexure, shear and seismic resistance,
etc.) and deformation performance (deflection and crack resistance, etc.) shouldalso be studied.
(4) The durability and durability design of RAC structure need further study. Thisis one of the key problems that need urgent solution to apply RAC in the fieldof civil engineering.
1.4.2 Forecast of Developing Trend
(1) High-performance RAC
Research on recycling building wastes, especially waste concrete, began veryearly in some developed countries such as USA, Japan, Singapore and somecountries in Europe. At present, the recycling rate of waste concrete exceeds 90% inthese countries. However, this ratio in China is less than 5%. In order to extend theusage of RAC in engineering and increasing the efficiency of utilization of wasteconcrete, using RA in commercial pre-mix and pre-cast concrete may be the answer.
Replacing part of cement by mineral admixtures produced by processingindustrial waste residue could alleviate the problem of industrial waste residuessuch as fly ash, slag and steel slag which encroach land and pollute environment,and could reduce the usage of cement, power and resources consumption, as well aspolluted gas during cement production. Meanwhile, it could also promote thedurability of RAC. Therefore, producing high-performance RAC by adding mineraladmixtures is a developing trend of sustainable concrete industry.
With the development of RAC technology, it can be inferred that the mechanicaland durable properties of RAC could be promoted obviously. Now, C60
1.4 Problems to Research RAC and Forecast of Developing Trend 11
high-performance RAC could be prepared in laboratory, but its workability,deformability, shrinkage and creep still need further study before applying in a realstructure [20].
(2) RAC composite structure
Due to the fact that lower mechanical properties, durability and deformability ofRAC than those of NC, the structural behaviors of RAC structures are somehowlower than those of NC structures, which limits the usage of RAC.
It is well accepted that the steel–concrete composite structure (or steel textilefiber and other enhancement materials) can effectively enhance advantages andavoid weaknesses for both concrete and steel. Applying RAC in composite struc-tures will not only have all advantages of composite structure, but also improve theecology. Therefore, this will provide a broad prospect for application of RAC instructural engineering to achieve the effective usage of waste concrete. However,there are still a lot of work needs to be expanded further.
1.5 Scientific Subject Chain in Civil Engineering
In past, scholars have only been focusing on traditional subjects in civil engineeringlike urban planning, architecture and structure design, construction management,project management and property management. In recent years, the retrofit was alsointerested by scholars and engineers. However, if less attention is paid on thedemolishing and recycling, the scientific subjects chain in civil engineering cannotbe achieved completely. Figure 1.5 displays the new concept of the scientificsubject chain, in which reuse and recycle point has been added in order to form acomplete cycle.
1.6 Book’s Outline
The book summarizes the overall research on RAC achievements in China, com-bining with developing status and strategies mentioned above. Furthermore, theauthor’s research achievements that mainly focused on material properties of RACand structural behaviors of RAC structures in recent 10 years are introducedsystematically.
The book discusses a number of topics, which are divided into 15 chapters,including introduction, reclaim of waste concrete, recycled aggregates, recycledaggregate concrete, modeled recycled aggregate concrete, strength of recycledaggregate concrete, constitutive relationship of recycled aggregate concrete,long-term properties of recycled aggregate concrete, bond–slip between recycledaggregate concrete and rebar, structural behavior of recycled aggregate concreteelements, seismic performance of recycled aggregate concrete columns, seismic
12 1 Introduction
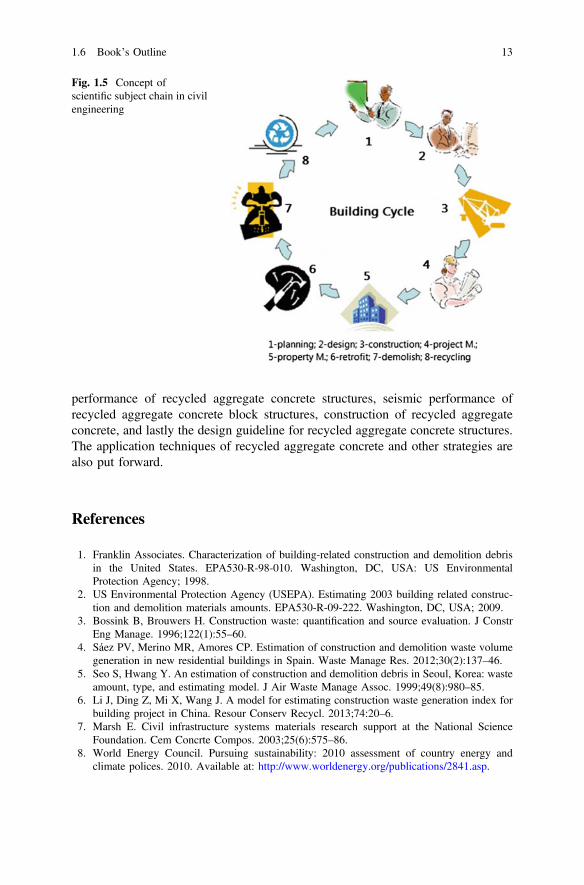
performance of recycled aggregate concrete structures, seismic performance ofrecycled aggregate concrete block structures, construction of recycled aggregateconcrete, and lastly the design guideline for recycled aggregate concrete structures.The application techniques of recycled aggregate concrete and other strategies arealso put forward.
References
1. Franklin Associates. Characterization of building-related construction and demolition debrisin the United States. EPA530-R-98-010. Washington, DC, USA: US EnvironmentalProtection Agency; 1998.
2. US Environmental Protection Agency (USEPA). Estimating 2003 building related construc-tion and demolition materials amounts. EPA530-R-09-222. Washington, DC, USA; 2009.
3. Bossink B, Brouwers H. Construction waste: quantification and source evaluation. J ConstrEng Manage. 1996;122(1):55–60.
4. Sáez PV, Merino MR, Amores CP. Estimation of construction and demolition waste volumegeneration in new residential buildings in Spain. Waste Manage Res. 2012;30(2):137–46.
5. Seo S, Hwang Y. An estimation of construction and demolition debris in Seoul, Korea: wasteamount, type, and estimating model. J Air Waste Manage Assoc. 1999;49(8):980–85.
6. Li J, Ding Z, Mi X, Wang J. A model for estimating construction waste generation index forbuilding project in China. Resour Conserv Recycl. 2013;74:20–6.
7. Marsh E. Civil infrastructure systems materials research support at the National ScienceFoundation. Cem Concrte Compos. 2003;25(6):575–86.
8. World Energy Council. Pursuing sustainability: 2010 assessment of country energy andclimate polices. 2010. Available at: http://www.worldenergy.org/publications/2841.asp.
Fig. 1.5 Concept ofscientific subject chain in civilengineering
1.6 Book’s Outline 13
9. Hendriks ChF, Pietersen HS. Sustainable raw materials-construction and demolition waste.RILEM Report 22 (ISBN: 2–912143-17-9). RILEM Publications s.a.r.1; 2000.
10. Xiao J, Li W, Fan Y, et al. An overview of study on recycled aggregate concrete in China(1996–2011). Constr Build Mater. 2012;31(6):364–83.
11. Nixon PJ. Recycled concrete as an aggregate for concrete-A review. Mater Struct. 1978;11(6):371–78.
12. Topcu BL, Guncan Firat N. Using waste concrete as aggregate. Cem Concr Res. 1995;25(7):1385–90.
13. Hansen TC. Recycling of demolished concrete and masonry. RILEM Report of TechnicalCommittee 37-DRC Demolition and reuse of Concrete. E & FN SPON; 1992.
14. Sayan A. Validity of accelerated mortar bar test methods for slowly reactiveaggregate-comparison of test results with field evidence. Concr Aust. 2001:24–6.
15. Xu A, Shayan A, Baburamani P. Test methods for sulfate resistance of concrete andmechanism of sulfate attack. Review Report 5, ARRB Transport Research; 1998:38–9.
16. Di Niro G, Dolara E, Cairns R. Properties of hardened RCA for structural purposes [1-A]. In:Dhir RK, Henderson NA, Limbachiya MC, editors. Sustainable construction: use of recycledconcrete aggregate. London: Thomas Telford; 1998. p. 177–87.
17. Shayan A, Morris HA. Comparison of RTA T363 and ASTMC1260 accelerated mortar BARfor detecting reactive aggregates. Cem Concr Res. 2001;31(4):655–63.
18. Dolara E, Di Niro G, Cairns R. RAC prestressed beams, sustainable construction: use ofrecycled concrete aggregate. In: Dhir RK, Henderson NA, Limbachiya MC, editors. London:Thomas Telford; 1998. p. 255–60.
19. Gluzhge PJ. The work of scientific research institute. Gidrotekhnicheskoye Stroitel’stvo.No. 4, April 1946, p. 27–8 (In Russian).
20. Limbachiya MC, Leelawat T, Dhir RK. Use of recycled concrete aggregate in high-strengthconcrete. Mater Struct. 2000;33(9):574–80.
14 1 Introduction
Chapter 2Reclaim of Waste Concrete
Abstract In this chapter, the sources, quantity and classification of waste concreteare described and analyzed. The methods for reducing waste concrete are intro-duced. Furthermore, the reclaim of waste concrete, including reusing recyclingphilosophy and technology is described and discussed.
2.1 Introduction
As is described in Chap. 1, in recent years, due to the rapid urbanization and theurgent requirement of sustainable development, an increasing number of buildingsand infrastructures have been demolished and produced a lot of construction anddemolish (C and D) wastes. Besides, many earthquakes in China, such asWenchuan earthquake (2008), Yushu earthquake (2010) and Ya’an earthquake(2013) have produced huge quantities of C and D wastes. Among these C and Dwastes, about 30% is waste concrete. It is necessary to discuss the sources andquantity of waste concrete before researching on the reclamation of the wasteconcrete.
2.2 Source of Waste Concrete
2.2.1 General Sources—Pavement, Buildings, Bridgesand Other Types of Constructions
Through the studies carried out in Shanghai and some other parts of China, it wasdiscovered that waste concrete mainly comes from the following sources:
(1) Buildings which have achieved their service lives and been demolished werefound to be the main source of concrete waste. In China, the design life ofconcrete structures generally ranges from 50 to 100 years. Therefore, theconcrete buildings which were built before 1949 or during the 1950s have
© Springer-Verlag GmbH Germany 2018J. Xiao, Recycled Aggregate Concrete Structures,Springer Tracts in Civil Engineering, https://doi.org/10.1007/978-3-662-53987-3_2
15
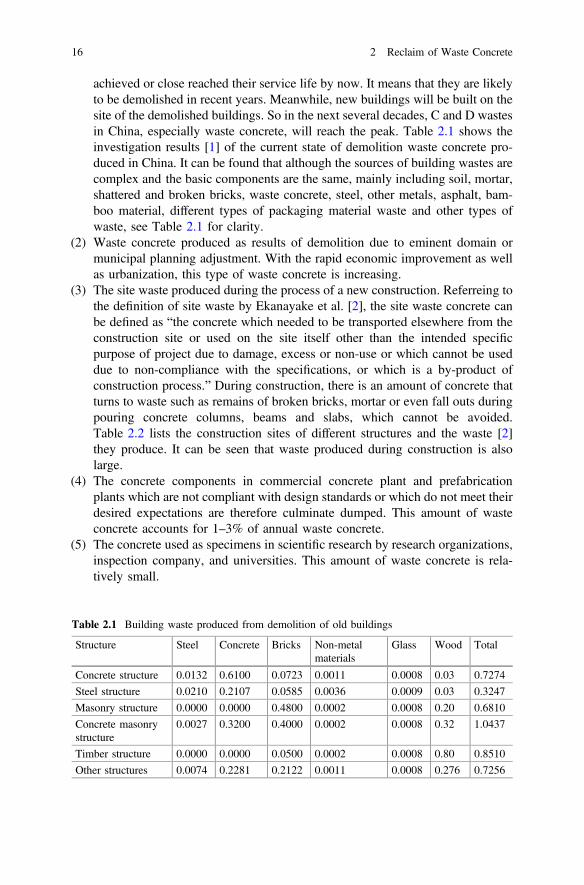
achieved or close reached their service life by now. It means that they are likelyto be demolished in recent years. Meanwhile, new buildings will be built on thesite of the demolished buildings. So in the next several decades, C and D wastesin China, especially waste concrete, will reach the peak. Table 2.1 shows theinvestigation results [1] of the current state of demolition waste concrete pro-duced in China. It can be found that although the sources of building wastes arecomplex and the basic components are the same, mainly including soil, mortar,shattered and broken bricks, waste concrete, steel, other metals, asphalt, bam-boo material, different types of packaging material waste and other types ofwaste, see Table 2.1 for clarity.
(2) Waste concrete produced as results of demolition due to eminent domain ormunicipal planning adjustment. With the rapid economic improvement as wellas urbanization, this type of waste concrete is increasing.
(3) The site waste produced during the process of a new construction. Referreing tothe definition of site waste by Ekanayake et al. [2], the site waste concrete canbe defined as “the concrete which needed to be transported elsewhere from theconstruction site or used on the site itself other than the intended specificpurpose of project due to damage, excess or non-use or which cannot be useddue to non-compliance with the specifications, or which is a by-product ofconstruction process.” During construction, there is an amount of concrete thatturns to waste such as remains of broken bricks, mortar or even fall outs duringpouring concrete columns, beams and slabs, which cannot be avoided.Table 2.2 lists the construction sites of different structures and the waste [2]they produce. It can be seen that waste produced during construction is alsolarge.
(4) The concrete components in commercial concrete plant and prefabricationplants which are not compliant with design standards or which do not meet theirdesired expectations are therefore culminate dumped. This amount of wasteconcrete accounts for 1–3% of annual waste concrete.
(5) The concrete used as specimens in scientific research by research organizations,inspection company, and universities. This amount of waste concrete is rela-tively small.
Table 2.1 Building waste produced from demolition of old buildings
Structure Steel Concrete Bricks Non-metalmaterials
Glass Wood Total
Concrete structure 0.0132 0.6100 0.0723 0.0011 0.0008 0.03 0.7274
Steel structure 0.0210 0.2107 0.0585 0.0036 0.0009 0.03 0.3247
Masonry structure 0.0000 0.0000 0.4800 0.0002 0.0008 0.20 0.6810
Concrete masonrystructure
0.0027 0.3200 0.4000 0.0002 0.0008 0.32 1.0437
Timber structure 0.0000 0.0000 0.0500 0.0002 0.0008 0.80 0.8510
Other structures 0.0074 0.2281 0.2122 0.0011 0.0008 0.276 0.7256
16 2 Reclaim of Waste Concrete

2.2.2 Disasters
Both natural and man-made disasters, such as earthquakes, avalanche, flood andwar, can generate a huge amount of waste concrete. Take earthquakes for example,reports from newspapers and internets reported that a great amount of buildingwaste is often generated when a strong earthquake happens. The building wasteoccupied much space and proper treatment of the large quantities of the wastebecome an enormous task for government in the earthquake-hit area.
(1) On January 17, 1995, the Hyogoken-Nambu earthquake (Fig. 2.1a) resulted indevastating damages to the highly developed urbanized region of Kansai,Japan, and created a total of 2000 million tonnes of debris [3]. Debris clearancein the next two years became an urgent and difficult emergency managementissue for the disaster management entities in Kobe city and HyogoPrefecture/County. The debris clearance included the demolition and operationphase, transportation, crushing and separation at a temporary storage locationand then disposal at final landfill site phases. In practice, most of the debris waseither disposed off at landfill sites or reused as materials for reconstruction.
(2) On September 21, 1999, more than 20 million cubic meters of demolition wastewere created as a result of the devastating Chi-Chi earthquake (Fig. 2.1b) inTaiwan, China [4]. It was found out from investigations that about 70–90% ofthe demolition waste was concrete, brick and fines, all of which could bereclaimed and recycled. Due to their typical characteristics of building materials,they were suitable for use as substitute materials for construction aggregates, andthe possible applications included land backfill, roadway subgrade materials,pavement structures, embankments, revetments, and concrete bricks or blocks.
(3) On May 12, 2008, the Wenchuan earthquake or the Great SichuanEarthquake (Fig. 2.1c) hit Sichuan province of China at CST time 14:28, whichwas a disastrous earthquake measuring 8.0 on the surface wave magnitude scale
Table 2.2 Amount of building waste produced during construction
Types of waste Building waste composition (%) Percentage ofmaterials (%)Brick concrete
structureFramestructure
Frame-loadbearing structure
Broken bricks 30–50 15–30 10–20 3–12
Mortar 8–15 10–20 10–20 5–10
Concrete 8–15 15–30 15–35 1–4
Pile-head – 8–15 8–20 5–15
Steel 1–5 2–8 2–8 2–8
Wood 1–5 1–5 1–5 5–10
Other 10–20 10–20 10–20 –
Total 100 100 100 –
Production unitarea (kg/m2)
50–200 45–150 40–150 –
2.2 Source of Waste Concrete 17

and 7.9 on the moment magnitude scale [5]. It was proved by the latest officialstatistics [6] that the direct economic loss caused by the Wenchuan earthquakehad reached as much as 845.1 billion ¥. Of this total, the loss of buildings werethe largest and nearly accounted for half the losses. In detail, the loss of resi-dential buildings and non-residential buildings (schools, hospitals and others)was 27.4% and 20.4% of the total loss, respectively. Besides, according to thedisaster area statistics [7], 6,945,000 rooms collapsed and 5,932,500 roomswere serious destroyed after the Wenchuan earthquake. Thus a huge amount ofbuilding waste had certainly been generated by these collapsed houses anddilapidated buildings. For the post-earthquake reconstruction, the buildingwaste not just burdens but also resources which ought to be considered to bereclaimed. Therefore, special attentions should be paid to the problem of how toassess the total amount of building waste scientifically and accurately, and howto collect statistics of building waste amount to lead a better reclaiming ofbuilding waste. A detailed analysis on building waste is helpful for the strategictreatment and resource recovery of building waste in the post-earthquakereconstruction activities. (* ¥ = Chinese Yuan)
(4) On March 11, 2011, the Great East Japan Earthquake (Fig. 2.1d) hit thenortheast part of Japan with a magnitude of 9.0 on the Richter scale, which wasone of the largest ocean-trench earthquakes ever recorded in Japan. Theearthquake caused huge damage, including 15,492 dead and 628,377 destroyedhouses [8]. Furthermore, about 22.5 million tonnes debris, such as pieces of
(c) Wenchuan earthquake (d) East Japan earthquake
(a) Kobe earthquake (b) Chi-Chi earthquake
Fig. 2.1 Building waste caused by earthquakes
18 2 Reclaim of Waste Concrete
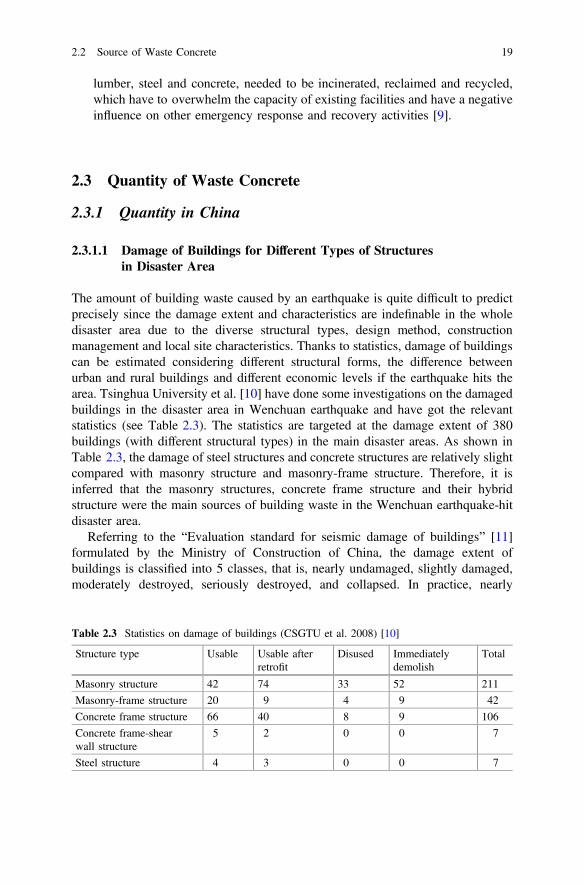
lumber, steel and concrete, needed to be incinerated, reclaimed and recycled,which have to overwhelm the capacity of existing facilities and have a negativeinfluence on other emergency response and recovery activities [9].
2.3 Quantity of Waste Concrete
2.3.1 Quantity in China
2.3.1.1 Damage of Buildings for Different Types of Structuresin Disaster Area
The amount of building waste caused by an earthquake is quite difficult to predictprecisely since the damage extent and characteristics are indefinable in the wholedisaster area due to the diverse structural types, design method, constructionmanagement and local site characteristics. Thanks to statistics, damage of buildingscan be estimated considering different structural forms, the difference betweenurban and rural buildings and different economic levels if the earthquake hits thearea. Tsinghua University et al. [10] have done some investigations on the damagedbuildings in the disaster area in Wenchuan earthquake and have got the relevantstatistics (see Table 2.3). The statistics are targeted at the damage extent of 380buildings (with different structural types) in the main disaster areas. As shown inTable 2.3, the damage of steel structures and concrete structures are relatively slightcompared with masonry structure and masonry-frame structure. Therefore, it isinferred that the masonry structures, concrete frame structure and their hybridstructure were the main sources of building waste in the Wenchuan earthquake-hitdisaster area.
Referring to the “Evaluation standard for seismic damage of buildings” [11]formulated by the Ministry of Construction of China, the damage extent ofbuildings is classified into 5 classes, that is, nearly undamaged, slightly damaged,moderately destroyed, seriously destroyed, and collapsed. In practice, nearly
Table 2.3 Statistics on damage of buildings (CSGTU et al. 2008) [10]
Structure type Usable Usable afterretrofit
Disused Immediatelydemolish
Total
Masonry structure 42 74 33 52 211
Masonry-frame structure 20 9 4 9 42
Concrete frame structure 66 40 8 9 106
Concrete frame-shearwall structure
5 2 0 0 7
Steel structure 4 3 0 0 7
2.2 Source of Waste Concrete 19

undamaged or slightly damaged buildings are treated as the buildings which canstill be inhabited [12], while moderately destroyed buildings are considered as thebuildings which can be used after retrofit, and seriously destroyed or collapsedbuildings are forbidden for further use or human inhabitation. Correspondingly, tosatisfy the relevant requirements, the buildings in disaster areas are classified into 4grades according to the damage severities of the structures through post-earthquakesafety inspections, as shown in Table 2.4. These 4 grades are “usable,” “usable afterretrofit,” “disused (demolished during the reconstruction),” and “immediatelydemolish.” The buildings that are named as “disused” or “immediately demolish”should be classified as seriously destroyed buildings. According to this classifica-tion, the slightly damaged buildings can still be inhabited, and the moderatelydestroyed buildings can also be inhabited after repairing or strengthening; thus, it isgenerally assumed that both of them have generated little building waste.
It is mentioned above that there were 5,932,500 rooms seriously destroyed afterthe Wenchuan earthquake in the disaster area. The total number of seriouslydestroyed buildings with different types of structures may be estimated with theproportion in sample survey, as listed in Table 2.4. In addition, as mentionedbefore, the seriously destroyed buildings generated a large amount of buildingwaste.
2.3.1.2 Characteristics of Building Waste for Different Typesof Structures
Building waste generation in the disaster area is closely related to theseismic-resistance performance of structures; thus, the relationship between thestructural type and the building waste generation should be established before thestatistical analysis of the building waste.
Building collapse during the Wenchuan earthquake mainly occurred in the ruralarea. According to incomplete statistics method [13] (Shi et al. 2008) more than 100million square meters of dwelling houses collapsed in the rural areas. According to
Table 2.4 Statistics on building damage of different structures
Structure (i) The number of seriously destroyed buildings
Sample survey Estimated total number
Disused Immediatelydemolish
Disused Immediatelydemolish
Masonry structure 33 (28.7%) 52 (45.2%) 1,702,628 2,681,490
Masonry-framestructure
4 (3.5%) 9 (7.8%) 207,637 462,735
Concrete framestructure
8 (7%) 9 (7.8%) 415,275 462,735
Total 45 (39.2%) 70 (60.8%) 2,325,540 3,606,960
20 2 Reclaim of Waste Concrete

the statistics by National Bureau of Statistics of the People’s Republic of China,masonry and wood structures accounted for 53.8% of houses in rural areas in 2010.In consideration of the relative lagging economic development level of rural areas,with the advantage of low cost and convenience to construct, the weakseismic-resistance performance is usually ignored. It was surveyed [14] (Chen et al.2008) that only 15% of rural dwelling houses in the Wenchan earthquake-hit dis-aster area were set up with ring beams and tie columns, while more than 90% offloors/roofs in masonry structures were made with precast slabs. As a result, themasonry houses with weak seismic-resistance performance were seriously damagedby strong earthquake, and then generated a mass of building waste.
In general, the concrete frame structure has a good seismic-resistance perfor-mance. However, in meizoseismal areas, there were still many concrete framestructures were seriously destroyed or even collapsed. On the one hand, it wasowing to that the actual seismic intensity of Wenchuan earthquake was much higherthan the local fortification intensity; on the other hand, it was found by investigationthat the many structural elements of collapsed buildings could hardly meet therequirements of Chinese seismic design codes and specifications, and there werealso defects concerning site construction details. Besides, to the concrete framestructures, though the major structures were just slightly damaged, the accessorystructures, such as filled walls, of some buildings were seriously destroyed. Hence,although the moderately destroyed concrete frame structures could be inhabitedafter repairing or strengthening, it should not be neglected that still much buildingwaste was produced by the seriously destroyed accessory structures.
There were many masonry-reinforced concrete hybrid structures, usually con-crete frame for lower level and masonry structure for higher level, or concrete frameon the inner side and masonry stucture on the outside in both urban and rural areas.Because of the different composites, this kind of structures has quite differentseismic behavior during earthquakes. It is necessary to conduct further research onbuilding waste generated by this type of structures.
Both concrete frame-shear wall structures and steel structures showed betterseismic-resistance performance during the Wenchuan earthquake [6]. Referring toTable 2.3, it is easy to draw a conclusion that the building waste produced byconcrete frame-shear wall structures and steel structures need not be taken intoaccount. So, during the following statistical calculations on building waste, muchattentions have been paid to the masonry structures, concrete frame structures,hybrid structures and then the total amount of building waste in the disaster areacan, therefore be estimated.
2.3.1.3 Statistics of Building Waste Generated by Different Typesof Structures
The amount (by volume) of building waste per square meter from demolishedbuildings with different types of structures is available and listed in Table 2.5 [1].As mentioned above, most of the building waste in the earthquake-hit disaster area
2.3 Quantity of Waste Concrete 21
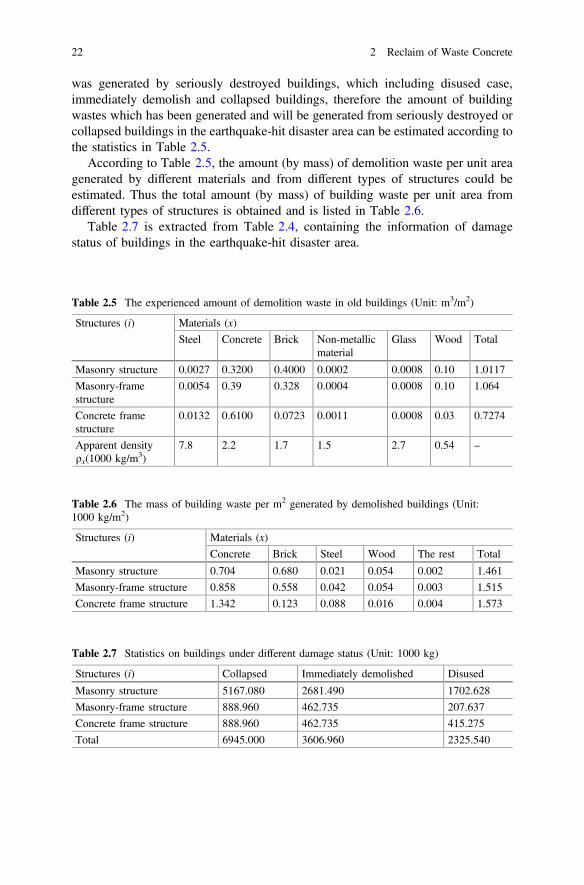
was generated by seriously destroyed buildings, which including disused case,immediately demolish and collapsed buildings, therefore the amount of buildingwastes which has been generated and will be generated from seriously destroyed orcollapsed buildings in the earthquake-hit disaster area can be estimated according tothe statistics in Table 2.5.
According to Table 2.5, the amount (by mass) of demolition waste per unit areagenerated by different materials and from different types of structures could beestimated. Thus the total amount (by mass) of building waste per unit area fromdifferent types of structures is obtained and is listed in Table 2.6.
Table 2.7 is extracted from Table 2.4, containing the information of damagestatus of buildings in the earthquake-hit disaster area.
Table 2.5 The experienced amount of demolition waste in old buildings (Unit: m3/m2)
Structures (i) Materials (x)
Steel Concrete Brick Non-metallicmaterial
Glass Wood Total
Masonry structure 0.0027 0.3200 0.4000 0.0002 0.0008 0.10 1.0117
Masonry-framestructure
0.0054 0.39 0.328 0.0004 0.0008 0.10 1.064
Concrete framestructure
0.0132 0.6100 0.0723 0.0011 0.0008 0.03 0.7274
Apparent densityqx(1000 kg/m3)
7.8 2.2 1.7 1.5 2.7 0.54 –
Table 2.6 The mass of building waste per m2 generated by demolished buildings (Unit:1000 kg/m2)
Structures (i) Materials (x)
Concrete Brick Steel Wood The rest Total
Masonry structure 0.704 0.680 0.021 0.054 0.002 1.461
Masonry-frame structure 0.858 0.558 0.042 0.054 0.003 1.515
Concrete frame structure 1.342 0.123 0.088 0.016 0.004 1.573
Table 2.7 Statistics on buildings under different damage status (Unit: 1000 kg)
Structures (i) Collapsed Immediately demolished Disused
Masonry structure 5167.080 2681.490 1702.628
Masonry-frame structure 888.960 462.735 207.637
Concrete frame structure 888.960 462.735 415.275
Total 6945.000 3606.960 2325.540
22 2 Reclaim of Waste Concrete

2.3.2 Future Tendency Forecast
2.3.2.1 Estimation Formula
The amount of building waste can be calculated according to the followingequations:
Wix ¼ Si � qx � dix ¼ Si � mix ð2:1Þ
Wx ¼Xn
i¼1
Wix; Wi ¼Xk
x¼1
Wix ð2:2Þ
W ¼Xk
x¼1
Wx; W ¼Xn
i¼1
Wi ð2:3Þ
In Eqs. (2.1)–(2.3), n indicates the number of the structure types, and k indicatesthe number of building material types. Wix is the total amount of x-type buildingwaste generated in the i-type structures in the earthquake-hit disaster area. Si is thetotal building area of i-type structures where the building area of each room in theinvestigated area was supposed to be 20 m2. qx is the apparent density of x-typebuilding waste, whereas dix means the volume of the x-type building waste per m2
generated by i-type structure. Wx is the total volume of x-type building wasteproduced; Wi. is the total amount of building waste from the i-type structures; andW is the whole volume of building waste generated in the earthquake-hit disasterarea.
Based on Tables 2.6, 2.7 and Eqs. (2.1)–(2.3), the mass of building waste in theWenchuan earthquake-hit disaster area is calculated and listed in Table 2.8.According to the calculations, the total amount of building waste generated in thedisaster area is approximately 380 million tonnes.
2.3.2.2 Relationship Between Building Waste and Seismic Intensity
As it can be discovered from the Wenchuan earthquake, building waste in geo-graphical regions is closely related to the local seismic intensity. Figure 2.2 showsthat, with higher seismic intensity, buildings would be damaged more seriously andgenerate more building waste. The study of the relationship among building waste,damage status and seismic intensity will contribute a lot for quick responses whenany earthquake occurs and give an important guidance for both emergency rescueand reconstruction activities.
In order to investigate the relationship, some data were collected and sorted out,as shown in Fig. 2.3. All the investigated regions considered the same fortificationintensity of 7.0 against the earthquake happened in Wenchuan. The buildings for
2.3 Quantity of Waste Concrete 23
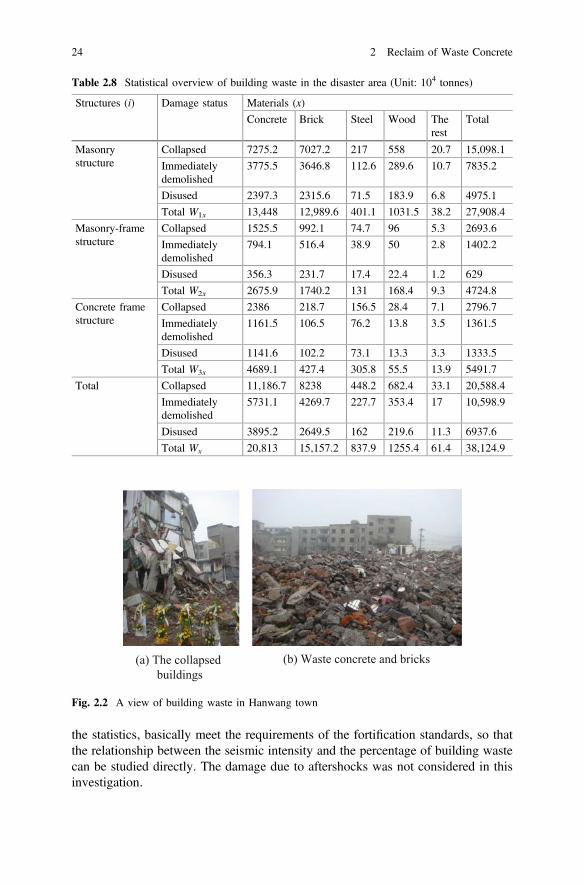
the statistics, basically meet the requirements of the fortification standards, so thatthe relationship between the seismic intensity and the percentage of building wastecan be studied directly. The damage due to aftershocks was not considered in thisinvestigation.
Table 2.8 Statistical overview of building waste in the disaster area (Unit: 104 tonnes)
Structures (i) Damage status Materials (x)
Concrete Brick Steel Wood Therest
Total
Masonrystructure
Collapsed 7275.2 7027.2 217 558 20.7 15,098.1
Immediatelydemolished
3775.5 3646.8 112.6 289.6 10.7 7835.2
Disused 2397.3 2315.6 71.5 183.9 6.8 4975.1
Total W1x 13,448 12,989.6 401.1 1031.5 38.2 27,908.4
Masonry-framestructure
Collapsed 1525.5 992.1 74.7 96 5.3 2693.6
Immediatelydemolished
794.1 516.4 38.9 50 2.8 1402.2
Disused 356.3 231.7 17.4 22.4 1.2 629
Total W2x 2675.9 1740.2 131 168.4 9.3 4724.8
Concrete framestructure
Collapsed 2386 218.7 156.5 28.4 7.1 2796.7
Immediatelydemolished
1161.5 106.5 76.2 13.8 3.5 1361.5
Disused 1141.6 102.2 73.1 13.3 3.3 1333.5
Total W3x 4689.1 427.4 305.8 55.5 13.9 5491.7
Total Collapsed 11,186.7 8238 448.2 682.4 33.1 20,588.4
Immediatelydemolished
5731.1 4269.7 227.7 353.4 17 10,598.9
Disused 3895.2 2649.5 162 219.6 11.3 6937.6
Total Wx 20,813 15,157.2 837.9 1255.4 61.4 38,124.9
(b) Waste concrete and bricks(a) The collapsed buildings
Fig. 2.2 A view of building waste in Hanwang town
24 2 Reclaim of Waste Concrete

Figure 2.3 reveals that, from moderate seismic areas to meizoseismal areas, thepercentage of the building waste increases with the increase of the seismic intensity,and the curve of increase trend is nonlinear. Specifically, for Baoji and Baoxingwhere the actual seismic intensity was 6.0 and 7.0, respectively, the earthquake wasof a medium intensity, and just few buildings collapsed in both the areas. However,for areas with an intensity over 8.0, as the actual seismic intensity increases, thepercentage of building waste increases very quickly. In addition, most seriousdamages happened in Yingxiu town and Beichuan County in meizoseismal areas,yet still some buildings did not collapse and were only slightly damaged. This wasdue to relatively good construction sites on one hand and strongseismic/anti-earthquake capability of the structures adopted for some new buildingswith high quality construction on the other hand.
Beichuan County had the earthquake with same seismic intensity as Yingxiutown. But in fact, the damage of buildings was more severe. This was mainlybecause Beichuan County is situated on soft subgrade foundation soils with badconstruction sites and poor geological conditions, site effect and foundation failureaggravated the damage of buildings. Geological hazards after the earthquakeincluding landslides, rockslides and mudflows doubtless worsen the grave/terriblesituation.
2.4 Classification of Waste Concrete
2.4.1 Standard
As mentioned above, with so much building waste being generated annually, itsenvironmental and economic impacts cannot be ignored because building materials
6 7 8 9 10 11 120
10
20
30
40
50
60
70
80
90
100
Perc
enta
ge o
f bui
ldin
g w
aste
(%)
Actual seismic intensity (degree)
Beichuan
Yingxiu
QingchuanAn county
BaoxingBaoji
Fig. 2.3 Percentage ofbuilding waste versus theactual seismic intensity
2.3 Quantity of Waste Concrete 25
become unrecoverable and eventually be sent to landfills. Waste concrete accountsfor a large mass of building waste. Therefore, the need of recycling waste concreteis urgent.
The waste concrete can be classified into two categories, considering the economicefficiency, and the mechanical properties of recycled aggregates (RA). One categoryis the recyclable waste concrete, and the other is non-recyclable waste concrete. Partof waste concrete, whose properties are poor or which contains a high level of con-tamination and can influence the properties of new in-production recycled aggregateconcrete (RAC), should not be reclaimed or should be used in other ways. Whetherwaste concrete can be recycled or not, it basically depends on its source, environ-mental conditions during service life of structure, exposed conditions and carbona-tion levels. It is advised not to recycle waste concrete under the following conditions.
(1) Waste concrete from lightweight concrete or aerated concrete.(2) Waste concrete from erosion environment condition or contaminated environ-
ment condition such as chemical engineering plants, nuclear power stations,hospital X-ray room etc.
(3) Waste concrete which showed durability failure.(4) Waste concrete which has been polluted by heavy metals or organic content.(5) Waste concrete with alkali-aggregate reaction.(6) Waste concrete which contains fraction of wood, sludge, asphalt etc. that are
difficult to separate.
Since the mechanical properties of recycled coarse aggregate (RCA) are sig-nificantly influenced by the factors such as designed strength grade and environ-mental conditions of parent concrete so, waste concrete should be stacked apart.
2.4.2 Classification
2.4.2.1 Building Waste Classification by Chronological Order/DamageStatus of Buildings
To make a better program of the treatment of building waste in the earthquake-hitdisaster area, and to provide a reference for formulating the corresponding policies,in this book, the building waste is divided according to the order in which it wasgenerated. Then from the viewpoint of different damage status of buildings, therelevant statistics data on building waste are conducted, as shown in Fig. 2.4.
2.4.2.2 Building Waste Classified by Materials
Referring to Table 2.8 and Fig. 2.5 shows the statistics on the amount of buildingwaste classified by building materials. As described in Fig. 2.5, most of the
26 2 Reclaim of Waste Concrete
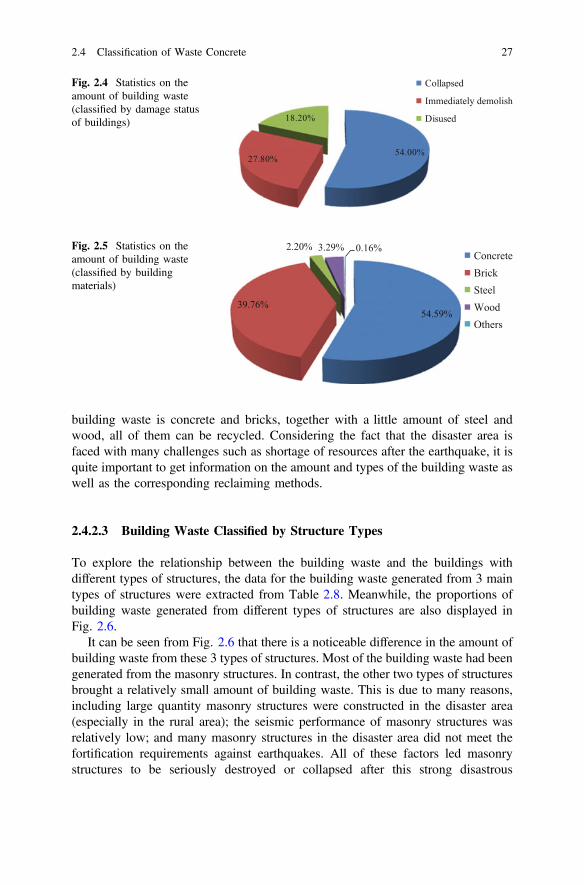
building waste is concrete and bricks, together with a little amount of steel andwood, all of them can be recycled. Considering the fact that the disaster area isfaced with many challenges such as shortage of resources after the earthquake, it isquite important to get information on the amount and types of the building waste aswell as the corresponding reclaiming methods.
2.4.2.3 Building Waste Classified by Structure Types
To explore the relationship between the building waste and the buildings withdifferent types of structures, the data for the building waste generated from 3 maintypes of structures were extracted from Table 2.8. Meanwhile, the proportions ofbuilding waste generated from different types of structures are also displayed inFig. 2.6.
It can be seen from Fig. 2.6 that there is a noticeable difference in the amount ofbuilding waste from these 3 types of structures. Most of the building waste had beengenerated from the masonry structures. In contrast, the other two types of structuresbrought a relatively small amount of building waste. This is due to many reasons,including large quantity masonry structures were constructed in the disaster area(especially in the rural area); the seismic performance of masonry structures wasrelatively low; and many masonry structures in the disaster area did not meet thefortification requirements against earthquakes. All of these factors led masonrystructures to be seriously destroyed or collapsed after this strong disastrous
54.00%27.80%
18.20%
Collapsed
Immediately demolish
Disused
Fig. 2.4 Statistics on theamount of building waste(classified by damage statusof buildings)
54.59%39.76%
2.20% 3.29% 0.16%ConcreteBrickSteelWoodOthers
Fig. 2.5 Statistics on theamount of building waste(classified by buildingmaterials)
2.4 Classification of Waste Concrete 27

earthquake, which in turn led to the massive production of building waste.Although most of the building waste in the disaster area can be reclaimed, it stillwould consume tremendous manpower and resources and delay the reconstructionspeed. Besides, it would be helpful for reducing casualties and minimizing buildingwaste to lessen the damage of buildings. For this reason, it will be of a far-reachingsignificance to take correct seismic structural measures and good structure types inthe future reconstruction.
2.5 Reduce Principle and Methods
In coming decades, the ratio of urbanization will be constantly increase in Chinaand most developing countries in the world. In order to meet the requirement ofdwelling and working of new citizens, meanwhile, to promote the living conditionof original citizens, an enormous amount of new buildings will be constructed,accompanying with many buildings will be deconstructed. In this process, as ismentioned above, wealth will be wasted, resources will be consumed, and socialproblems will emerge.
In the past, structure design is mainly focused on the reliability of buildings,particularly safety, serviceability and durability. In future, sustainability must beconsidered as a new direction in design process. Thus, the “3R” principle, whichmeans Reduce, Reuse and Recycle, is proposed to guide the sustainable develop-ment of building industry.
2.5.1 Reasonable Plan
From the point view of life-cycle analysis, a life of the building is emphasized asone of the most important factors. It is reported that the average life of buildings inChina is only 30 years, which is much lower than that of some developed countries,like UK for 132 years, and that of designed life, which is usually 50 or 100 years.And, even more alarmingly, some buildings were demolished even before they
73.20%
12.39%
14.41%
Masonry structure
Masonry-frame structure
Concrete frame structure
Fig. 2.6 Statistics on theamount of building waste(classified by structure types)
28 2 Reclaim of Waste Concrete
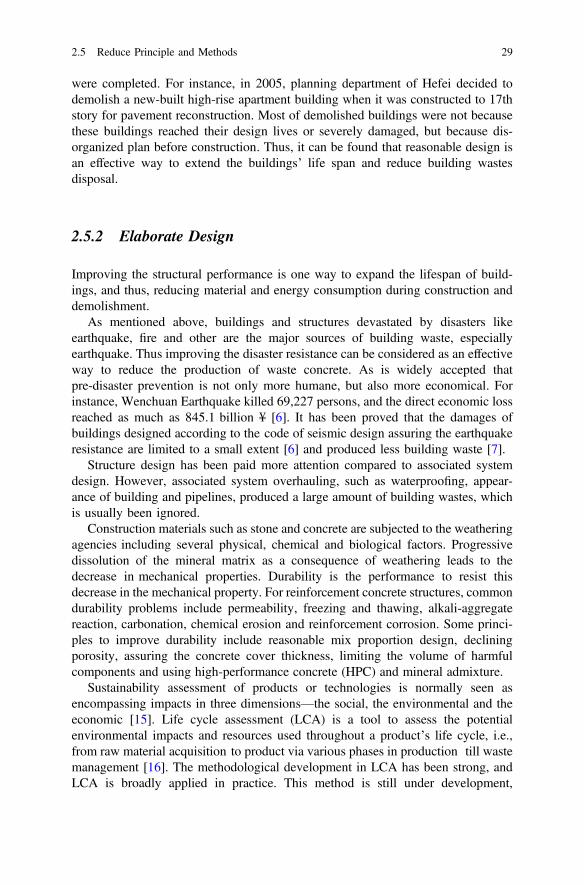
were completed. For instance, in 2005, planning department of Hefei decided todemolish a new-built high-rise apartment building when it was constructed to 17thstory for pavement reconstruction. Most of demolished buildings were not becausethese buildings reached their design lives or severely damaged, but because dis-organized plan before construction. Thus, it can be found that reasonable design isan effective way to extend the buildings’ life span and reduce building wastesdisposal.
2.5.2 Elaborate Design
Improving the structural performance is one way to expand the lifespan of build-ings, and thus, reducing material and energy consumption during construction anddemolishment.
As mentioned above, buildings and structures devastated by disasters likeearthquake, fire and other are the major sources of building waste, especiallyearthquake. Thus improving the disaster resistance can be considered as an effectiveway to reduce the production of waste concrete. As is widely accepted thatpre-disaster prevention is not only more humane, but also more economical. Forinstance, Wenchuan Earthquake killed 69,227 persons, and the direct economic lossreached as much as 845.1 billion ¥ [6]. It has been proved that the damages ofbuildings designed according to the code of seismic design assuring the earthquakeresistance are limited to a small extent [6] and produced less building waste [7].
Structure design has been paid more attention compared to associated systemdesign. However, associated system overhauling, such as waterproofing, appear-ance of building and pipelines, produced a large amount of building wastes, whichis usually been ignored.
Construction materials such as stone and concrete are subjected to the weatheringagencies including several physical, chemical and biological factors. Progressivedissolution of the mineral matrix as a consequence of weathering leads to thedecrease in mechanical properties. Durability is the performance to resist thisdecrease in the mechanical property. For reinforcement concrete structures, commondurability problems include permeability, freezing and thawing, alkali-aggregatereaction, carbonation, chemical erosion and reinforcement corrosion. Some princi-ples to improve durability include reasonable mix proportion design, decliningporosity, assuring the concrete cover thickness, limiting the volume of harmfulcomponents and using high-performance concrete (HPC) and mineral admixture.
Sustainability assessment of products or technologies is normally seen asencompassing impacts in three dimensions—the social, the environmental and theeconomic [15]. Life cycle assessment (LCA) is a tool to assess the potentialenvironmental impacts and resources used throughout a product’s life cycle, i.e.,from raw material acquisition to product via various phases in production till wastemanagement [16]. The methodological development in LCA has been strong, andLCA is broadly applied in practice. This method is still under development,
2.5 Reduce Principle and Methods 29

however. In the future, this method must play a more significant role in the processof optimizing project determination considering environmental impact and wastemanagement.
2.5.3 Ecological Materials
Ecology is nowadays an everyday topic. But what are the characteristics that anecological building material should have? Bica et al. [17] concluded and describedas follows:
• They should be healthy for users; natural materials should be considered.• They should not consume energy for transportation, thus avoiding collateral
pollution; local materials should be considered.• They should not consume a great quantity of energy for fabrication; again,
natural materials should be considered.• High insulation qualities are necessary, in order to avoid excessive energy
consumption; natural materials rarely respond to these requirements withoutexaggerating their thickness.
• Eventually, the new materials and techniques should have beneficial effects onthe environment; vegetation in buildings should be considered.
• They should be recyclable.• They should be reusable at least once, or even several times.• They should reuse residues; the reuse of non-ecological materials can be an
ecological undertaking.
And Bica et al. [17] also give some examples, including earth, green roofs, livingwalls and earthbag constructions, as shown in Fig. 2.7.
It is generally agreed that the production of concrete has adverse ecologicaleffects. CO2, NOx and SOx are among the hazardous emissions generated in rela-tively high volumes by the conventional Portland cement process. However,applying HPC, consuming industrial by-product and recycling aggregates makeconcrete gradually meet the requirement of ecology. Meanwhile, the appearance ofnovel cement, such as high belite cement [18, 19], decreases the energy con-sumption during manufacturing.
2.5.4 Green Construction
Construction is one of the major contributors to environmental problems. Bossinkand Brouwers [20] reported that from 1 to 10% of every single purchased con-struction material leaves the construction site as solid waste. Most of the resourcesconsumed in construction sites are non-renewable, and some may even create
30 2 Reclaim of Waste Concrete
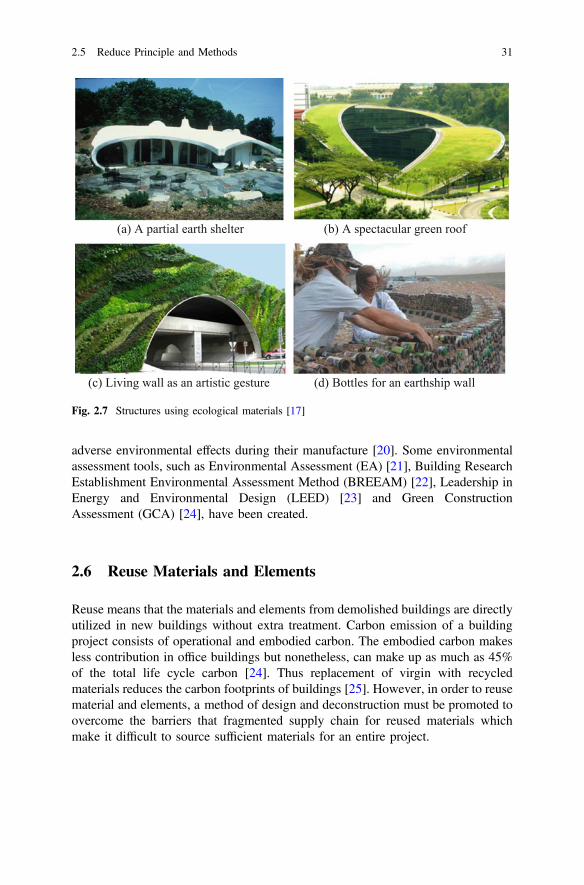
adverse environmental effects during their manufacture [20]. Some environmentalassessment tools, such as Environmental Assessment (EA) [21], Building ResearchEstablishment Environmental Assessment Method (BREEAM) [22], Leadership inEnergy and Environmental Design (LEED) [23] and Green ConstructionAssessment (GCA) [24], have been created.
2.6 Reuse Materials and Elements
Reuse means that the materials and elements from demolished buildings are directlyutilized in new buildings without extra treatment. Carbon emission of a buildingproject consists of operational and embodied carbon. The embodied carbon makesless contribution in office buildings but nonetheless, can make up as much as 45%of the total life cycle carbon [24]. Thus replacement of virgin with recycledmaterials reduces the carbon footprints of buildings [25]. However, in order to reusematerial and elements, a method of design and deconstruction must be promoted toovercome the barriers that fragmented supply chain for reused materials whichmake it difficult to source sufficient materials for an entire project.
(a) A partial earth shelter (b) A spectacular green roof
(c) Living wall as an artistic gesture (d) Bottles for an earthship wall
Fig. 2.7 Structures using ecological materials [17]
2.5 Reduce Principle and Methods 31

2.6.1 Recycled Blocks
As mentioned above, the building waste is mainly composed of waste concrete andconcrete blocks. There exists a large number of undamaged blocks in collapsed ordemolished structures, as shown in Fig. 2.8. After being separated from thebuilding waste and their attached cement mortar removed off, these blocks or brickscan be utilized in constructing new buildings, which not only reduce the cost ofmaterials, transportation and treating waste, but also protect the land resources.Moreover, the waste concrete and waste blocks as well as other kinds of inertmaterials can be reused as backfill materials, such as filling materials ofram-compaction piles with composite bearing bases, after innocuous treatments.
2.6.2 Reuse Elements
As mentioned above, embodied carbon accounts for nearly half of carbon emissionduring life cycle. If the demolished components could be used in new-built struc-tures, the embodied carbon in the demolished components could be transferred intonext life cycle, meanwhile reduce some carbon emissions and energy consumptionsduring manufacturing new components. However, although there have been someattempts to realize this practice [26–28], this method is still in the primary stage andis only applied in several pilot projects. The reason is that although existingbuildings can be deconstructed, they are often not suitable for reuse which canresult in addition of cost to both the project and damaged salvaged materials [25].
One way in which the supply chain can be increased in the future is by designingall new buildings with deconstruction strategy. If a building has been designed fordeconstruction strategy, at the end of life the component parts can be separated withno damage thus enabling maximum reuse.
(a) Waste bricks (b) The waste bricks applied in a new building structure
Fig. 2.8 The waste bricks and reuse
32 2 Reclaim of Waste Concrete
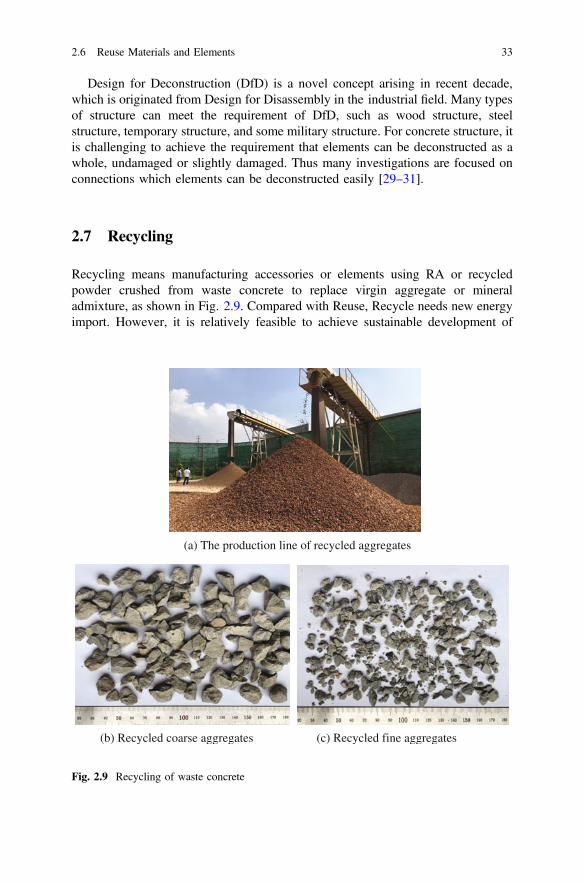
Design for Deconstruction (DfD) is a novel concept arising in recent decade,which is originated from Design for Disassembly in the industrial field. Many typesof structure can meet the requirement of DfD, such as wood structure, steelstructure, temporary structure, and some military structure. For concrete structure, itis challenging to achieve the requirement that elements can be deconstructed as awhole, undamaged or slightly damaged. Thus many investigations are focused onconnections which elements can be deconstructed easily [29–31].
2.7 Recycling
Recycling means manufacturing accessories or elements using RA or recycledpowder crushed from waste concrete to replace virgin aggregate or mineraladmixture, as shown in Fig. 2.9. Compared with Reuse, Recycle needs new energyimport. However, it is relatively feasible to achieve sustainable development of
(a) The production line of recycled aggregates
(c) Recycled fine aggregates(b) Recycled coarse aggregates
Fig. 2.9 Recycling of waste concrete
2.6 Reuse Materials and Elements 33
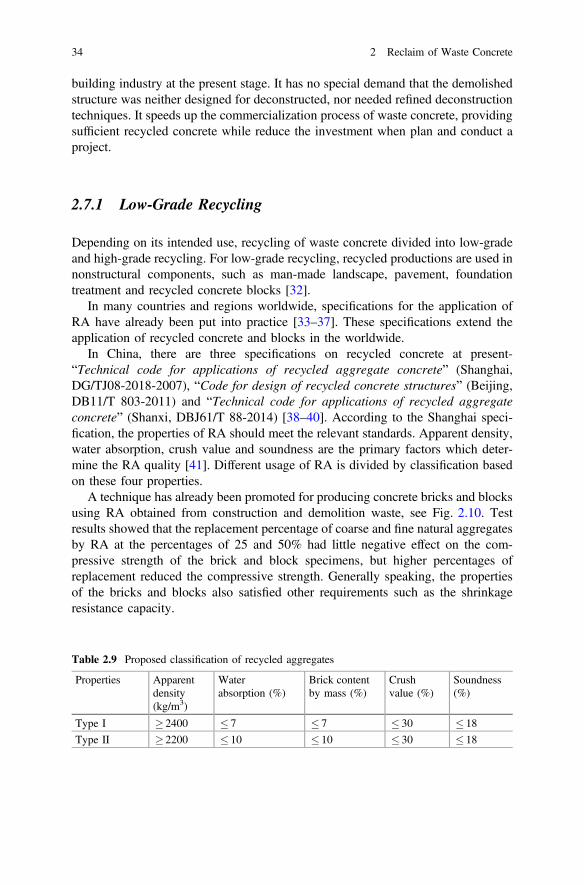
building industry at the present stage. It has no special demand that the demolishedstructure was neither designed for deconstructed, nor needed refined deconstructiontechniques. It speeds up the commercialization process of waste concrete, providingsufficient recycled concrete while reduce the investment when plan and conduct aproject.
2.7.1 Low-Grade Recycling
Depending on its intended use, recycling of waste concrete divided into low-gradeand high-grade recycling. For low-grade recycling, recycled productions are used innonstructural components, such as man-made landscape, pavement, foundationtreatment and recycled concrete blocks [32].
In many countries and regions worldwide, specifications for the application ofRA have already been put into practice [33–37]. These specifications extend theapplication of recycled concrete and blocks in the worldwide.
In China, there are three specifications on recycled concrete at present-“Technical code for applications of recycled aggregate concrete” (Shanghai,DG/TJ08-2018-2007), “Code for design of recycled concrete structures” (Beijing,DB11/T 803-2011) and “Technical code for applications of recycled aggregateconcrete” (Shanxi, DBJ61/T 88-2014) [38–40]. According to the Shanghai speci-fication, the properties of RA should meet the relevant standards. Apparent density,water absorption, crush value and soundness are the primary factors which deter-mine the RA quality [41]. Different usage of RA is divided by classification basedon these four properties.
A technique has already been promoted for producing concrete bricks and blocksusing RA obtained from construction and demolition waste, see Fig. 2.10. Testresults showed that the replacement percentage of coarse and fine natural aggregatesby RA at the percentages of 25 and 50% had little negative effect on the com-pressive strength of the brick and block specimens, but higher percentages ofreplacement reduced the compressive strength. Generally speaking, the propertiesof the bricks and blocks also satisfied other requirements such as the shrinkageresistance capacity.
Table 2.9 Proposed classification of recycled aggregates
Properties Apparentdensity(kg/m3)
Waterabsorption (%)
Brick contentby mass (%)
Crushvalue (%)
Soundness(%)
Type I � 2400 � 7 � 7 � 30 � 18
Type II � 2200 � 10 � 10 � 30 � 18
34 2 Reclaim of Waste Concrete
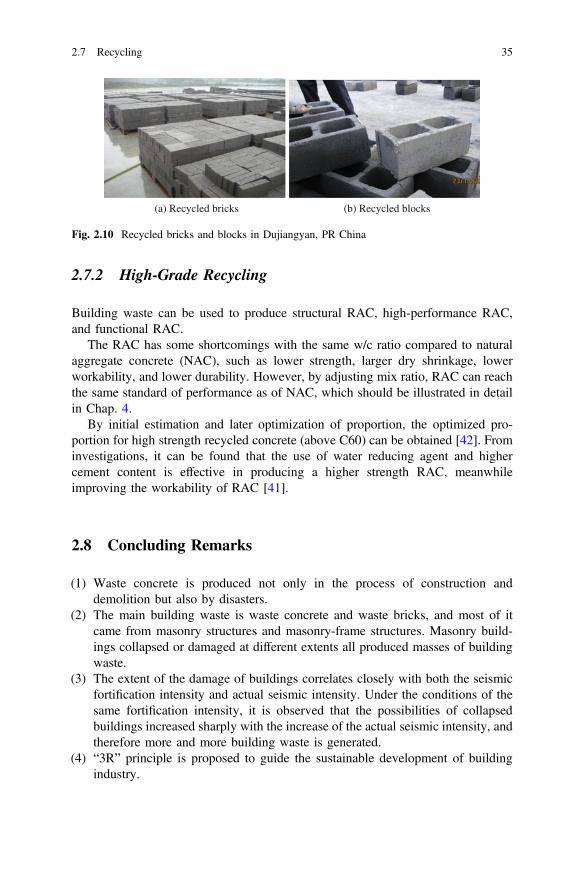
2.7.2 High-Grade Recycling
Building waste can be used to produce structural RAC, high-performance RAC,and functional RAC.
The RAC has some shortcomings with the same w/c ratio compared to naturalaggregate concrete (NAC), such as lower strength, larger dry shrinkage, lowerworkability, and lower durability. However, by adjusting mix ratio, RAC can reachthe same standard of performance as of NAC, which should be illustrated in detailin Chap. 4.
By initial estimation and later optimization of proportion, the optimized pro-portion for high strength recycled concrete (above C60) can be obtained [42]. Frominvestigations, it can be found that the use of water reducing agent and highercement content is effective in producing a higher strength RAC, meanwhileimproving the workability of RAC [41].
2.8 Concluding Remarks
(1) Waste concrete is produced not only in the process of construction anddemolition but also by disasters.
(2) The main building waste is waste concrete and waste bricks, and most of itcame from masonry structures and masonry-frame structures. Masonry build-ings collapsed or damaged at different extents all produced masses of buildingwaste.
(3) The extent of the damage of buildings correlates closely with both the seismicfortification intensity and actual seismic intensity. Under the conditions of thesame fortification intensity, it is observed that the possibilities of collapsedbuildings increased sharply with the increase of the actual seismic intensity, andtherefore more and more building waste is generated.
(4) “3R” principle is proposed to guide the sustainable development of buildingindustry.
(a) Recycled bricks (b) Recycled blocks
Fig. 2.10 Recycled bricks and blocks in Dujiangyan, PR China
2.7 Recycling 35
References
1. Wang LC, Zhao YC. Construction waste disposal and resource utilization. Chemical IndustryPress; 2004 (in Chinese).
2. Ekanayake LL, Ofori G. Building waste assessment score: design-based tool. Build Environ.2004;39(7):851–61.
3. Hayashi H, Katsumi T. Generation and management of disaster waste. Japanese Soc SoilMech Found Eng Tokyo Jpn. 1996;36(1):349–58.
4. Yang C-P. Composition of demolition wastes from Chi-Chi earthquake-damaged structuresand the properties of their inert materials. Can Geotech J. 2009;46(04):470–81.
5. Bin Zhao, Fabio Taucer, Tiziana Rossetto. Field investigation on the performance of buildingstructures during the 12 May 2008 Wenchuan earthquake in China. Eng Struct. 2009;31(8):1707–23.
6. NCEWE (National Committee of Experts on Wenchuan Earthquake). Press conferencesponsored by the State Council Information Office about Wenchuan Earthquake and disasterdamage assessment; 2008.09.04 (in Chinese).
7. Xiao J-Z, Lei B, Wang C-Q. Recycled products from concrete waste in Wenchuanearthquake-hit area. In: Xiao JZ, editors. In: Proceedings of the first national academicexchange conference on the research and application of recycled concrete. Shanghai; 2008 (inChinese).
8. Toyoda A, Kawakami M, Shimizu T, et al. The great East Japan earthquake disaster andsustainable infrastructures. Bauinstandsetzen Und Baudenkmalpflege. 2012;18(3–4):203–12.
9. Asari M, Sakai SI, Yoshioka T, et al. Strategy for separation and treatment of disaster waste: amanual for earthquake and tsunami disaster waste management in Japan. J Mater CyclesWaste Manage. 2013;15(3):290–9.
10. Civil and Structural Groups of Tsinghua University, Xinan Jiaotong University and BeijingJiaotong University. Analysis on seismic damage of buildings in the Wenchuan earthquake.J Build Struct. 2008;29(4):1–9.
11. MOHURD (Ministry of Housing and Urban-Rural Development of the People’s Republic ofChina). Grading standard for seismic damage of buildings; 1990 (in Chinese).
12. Han J, Li Y, Liu L, Zheng N, Wang L, Liu J. Building damage in Mianyang city caused bythe 5–12 Wenchuan Earthquake. J Chongqing Jianzhu Univ. 2008;30(5):21–7 (in Chinese,Abstract in English).
13. Jianguang S, Shuzhi DHL. Discussion on recycling and reusing way of building waste left byWenchuan earthquake. Fujian Archit Constr. 2008;(11):27–30 (in Chinese).
14. Zhaoyuan C, Jiaru Q. Survey of building damage caused by Wenchuan earthquake andanalysis report for the post-earthquake reconstruction. Beijing, China Architecture andBuilding Press; 2008 (in Chinese).
15. Elkington J. Cannibals with forks—the triple bottom line of 21st century business. Canada:New Society Publishers; 1998.
16. Guinee JB. Handbook on life cycle assessment—operational guide to the iso standards. Int JLife Cycle Assess. 2001;7(5):311–3.
17. Bica S, Roşiu L, Radoslav R, et al. What characteristics define ecological building materials.In: Proceedings of the 11th WSEAS international conference on sustainability in scienceengineering, Romania; 2009.
18. Hughes DC, Jaglin D, Kozłowski R, Mucha D. Roman cements—belite cements calcined atlow temperature. Cem Concr Res. 2009;39(2):77–89.
19. Kacimi L, Simon-Masseron A, Salem S, Ghomari A, Derriche Z. Synthesis of belite cementclinker of high hydraulic reactivity. Cem Concr Res. 2009;39(7):559–65.
20. Bossink B, Brouwers H. Construction waste: quantification and source evaluation. J ConstrEng Manage. 1996;122(1):55–60.
21. Griffith A. Environmental management in construction. Macmillan, 1995.
36 2 Reclaim of Waste Concrete

22. Crawley D, Aho I. Building environmental assessment methods: applications and develop-ment trends. Building Research & Information, 1999, 27(4-5): 300-308.
23. LEED (Leadership in Energy and Environmental Design). Homepage, available at http://www.usgbc.org/. 2002.
24. Sturgis S, Roberts G. Redefining zero: carbon profiling as a solution to whole life carbonemission. RCIS Research Report. Available at: http://www.isurv.com/site/download_feed.aspx?fileID=2493&fileExtension=PDF. 2010.
25. Tingley DD, Davison B. Developing an LCA methodology to account for the environmentalbenefits of design for deconstruction. Build Environ. 2012;57(5):387–95.
26. Hassleger W. Demountable and re-erectable precast reinforced concrete buildings. In:Proceeding of the international symposium, Demountable concrete structure-a challenge forprecast concrete; 1985.
27. Gandler R, Schmalhofer O. Demountable superstructure at Munich’s airport. In: Proceedingof the international symposium, demountable concrete structure-a challenge for precastconcrete; 1985.
28. Acer AV. Demountable precast industrial buildings. In: Proceeding of the internationalsymposium, demountable concrete structure-a challenge for precast concrete; 1985.
29. Xue W, Yang X. Tests on half-scale, two-story, two-bay, moment-resisting hybrid concreteframes. ACI Struct J. 2009;106(5).
30. Nigel Priestley MJ, Sritharan S, Conley JR, et al. Preliminary results and conclusions from thePRESSS five-story precast concrete test building. PCI J. 1999;44(6):42–67.
31. Belleri A, Riva P. Seismic performance and retrofit of precast concrete grouted sleeveconnections. PCI J. 2012;57:97–109.
32. Bhuiyan MZI, Ali FH, Salman FA. Application of recycled concrete aggregates as alternativegranular infills in hollow segmental block systems. Soils Found. 2015;55(2):296–303.
33. BRE (Building Research Establishment). Digest 433—recycled aggregates. 1998.34. BS6543. Guide to the use of industrial by-products and waste materials in building and civil
engineering. British Standards Institution, London; 1985.35. CSIRO (Commonwealth Scientific and Industrial Research Organization). Building,
construction and engineering. Guide for specification of recycled concrete aggregate(RCA) for concrete production; 1998, Ecorecycle, Victoria.
36. TFSCCS (Task Force of the Standing Committee of Concrete of Spain). Draft of Spanishregulations for the use of recycled aggregate in the production of structural concrete; 2004,RILEM Publications SARL.
37. WBTC (Works Bureau Technical Circular). 12/2002, Specifications facilitating the use ofrecycled aggregates. Hong Kong SAR Government; 2002.
38. DG/TJ08-2018-2007. Technical code for applications of recycled aggregate concrete.Shanghai; 2007 (in Chinese).
39. DB11/T 803-2011. Code for design of recycled concrete structures. Beijing; 2011 (inChinese).
40. DBJ61/T 88-2014. Technical code for applications of recycled aggregate concrete. Shanxi;2014 (in Chinese).
41. Xiao J, Li W, Fan Y, Huang X. An overview of study on recycled aggregate concrete in china(1996–2011). Constr Build Mater. 2012;31(6):364–83.
42. Limbachiya MC, Leelawat T, Dhir RK. Use of recycled concrete aggregate in high-strengthconcrete. Mater Struct. 2000;33(9):574–80.
References 37

Chapter 3Recycled Aggregates
Abstract This chapter will mainly introduce the crushing and sieving techniquesused around the world, the properties of recycled fine aggregate (RFA) and recy-cled coarse aggregate (RCA), the adhered old mortar and its influence on theproperties of recycled aggregate concrete (RAC) and methods of pre-treating andenhancing techniques. This is fundamental to understand the differences betweennatural aggregate concrete (NAC) and RAC, and it is the basic premise for furtherstudying the behavior of the RAC materials and structures.
3.1 Crushing and Sieving Techniques
It is the prerequisite for recycling waste concrete that the technique of reclaiming,crushing, and manufacturing recycled aggregate (RA). Based on the existingabroad and domestic techniques of crushing waste concrete and recycled aggregatemodification [1], considering the condition of engineering in China, techniques ofRA manufacturing which are suitable for the basic condition of China are suggestedin this section.
3.1.1 Worldwide Waste Concrete Crushing Techniques
(1) Russia
In the view of the fact that waste concrete often includes other waste includingmetals, wood and glasses, therefore in the Russian technical specifications, there arespecifically designed magnet separator and separating tables to separate wastesubstances, as shown in Fig. 3.1. This processing method has two rotor crushers,one for pre-crushing and one for secondary crushing. After pre-crushing, theaggregates are conveyed to double screen sieve, where they are seperated into0–5 mm, 5–40 mm and beyond 40 mm particle sizes. The particle size in normalconcrete mix proportion usually does not exceed 40 mm. Therefore, particles
© Springer-Verlag GmbH Germany 2018J. Xiao, Recycled Aggregate Concrete Structures,Springer Tracts in Civil Engineering, https://doi.org/10.1007/978-3-662-53987-3_3
39
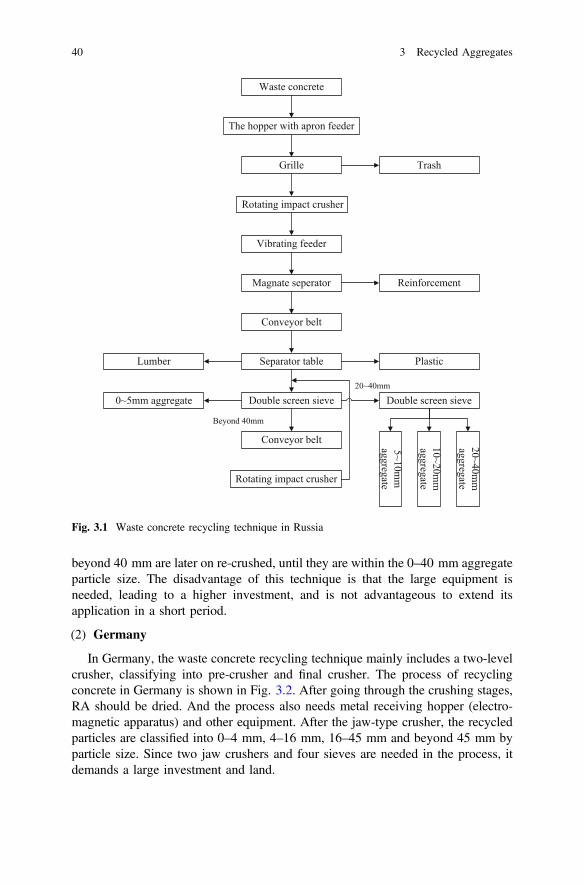
beyond 40 mm are later on re-crushed, until they are within the 0–40 mm aggregateparticle size. The disadvantage of this technique is that the large equipment isneeded, leading to a higher investment, and is not advantageous to extend itsapplication in a short period.
(2) Germany
In Germany, the waste concrete recycling technique mainly includes a two-levelcrusher, classifying into pre-crusher and final crusher. The process of recyclingconcrete in Germany is shown in Fig. 3.2. After going through the crushing stages,RA should be dried. And the process also needs metal receiving hopper (electro-magnetic apparatus) and other equipment. After the jaw-type crusher, the recycledparticles are classified into 0–4 mm, 4–16 mm, 16–45 mm and beyond 45 mm byparticle size. Since two jaw crushers and four sieves are needed in the process, itdemands a large investment and land.
Waste concrete
The hopper with apron feeder
Grille
Rotating impact crusher
Rotating impact crusher
Vibrating feeder
Magnate seperator
Conveyor belt
Separator table
Conveyor belt
Trash
Reinforcement
PlasticLumber
Double screen sieve Double screen sieve0~5mm aggregate
5~10mm
aggregate
10~20mm
aggregate
20~40mm
aggregate
Beyond 40mm
20~40mm
Fig. 3.1 Waste concrete recycling technique in Russia
40 3 Recycled Aggregates

(3) Japan
Figure 3.3 shows Japan’s waste concrete recycling technique. In this process,crushing and sieving are mature techniques which are similar to the techniquesproducing natural aggregate. Therefore, the key processes are selection (screening),neatness, and washing. It is the prominent feature in this process that high-qualityRCA can be attained by heating, level II crushing, and level II sieving. After 300 °Celevated temperatures, part of the weak adhered old mortar will be split by level IIcrushing to improve the quality of RCA. However, heating and additional crushingand sieving will require more energy and investments.
3.1.2 China’s Waste Concrete Crushing Techniques
(1) Chinese Taiwan area
Currently, Taiwan, China uses the hydraulic crawler rock crusher and gravityscreening machine system as waste concrete crushing and sieving. The productionprocess is shown in Fig. 3.4.
Fig. 3.2 Waste concrete recycling technique in Germany
3.1 Crushing and Sieving Techniques 41

(2) Newly suggested waste concrete crushing techniques
The author [1] conducted a comparative analysis of China and worldwidetechniques of producing RA and proposed a production technique suit for the basic
Pre-treating waste concrete(hammering, cutting and classifying)
Magnet separation
Separation of debris
Level I crusher (jaw crusher)
Level I sieve (5mm)
Preliminary RCA (5~40mm)
Heating device (about 300°C)
Level II crusher (eccentric rotating impact crusher or ball-grinding crusher)
Level II sieve (5mm)
High-quality RCA (5~20mm)
Used in C25~C30RAC
Level III sieve (5mm)
High-quality RFA (0.15~5mm)
Recycled powder(below 0.15mm)
Waste metal
Lumber, plastic
Crushed debris (below 5mm)
Used in C15~C20 RAC
0~40mm waste concrete blocks
Fig. 3.3 Waste concrete recycling process in Japan
Waste concrete
Gravity screening machine
Manual classification
Metal, plastic and lumber
Mud, sand and powder
Hydraulic crawler crushing machine
Recycled aggregate
Excavator
Large piece of gravel
Fig. 3.4 RA production technique in Taiwan, China
42 3 Recycled Aggregates
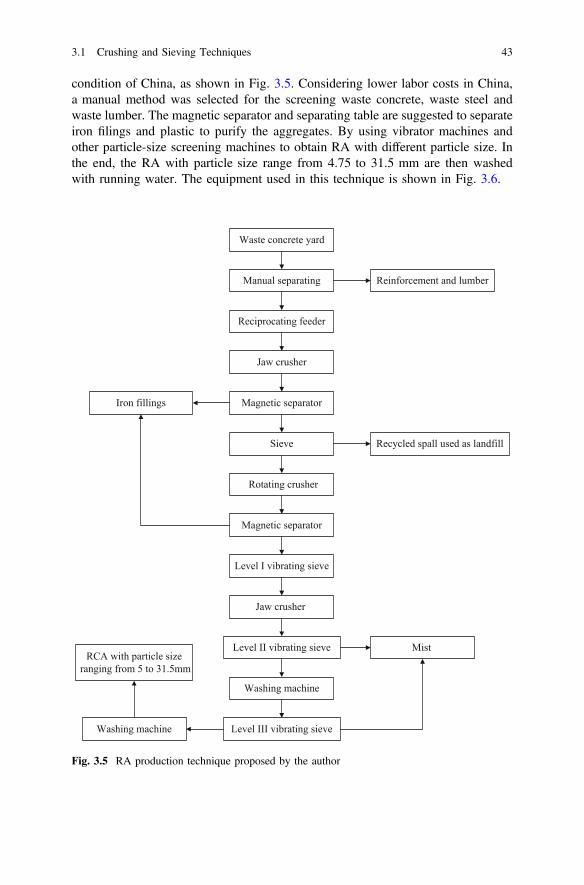
condition of China, as shown in Fig. 3.5. Considering lower labor costs in China,a manual method was selected for the screening waste concrete, waste steel andwaste lumber. The magnetic separator and separating table are suggested to separateiron filings and plastic to purify the aggregates. By using vibrator machines andother particle-size screening machines to obtain RA with different particle size. Inthe end, the RA with particle size range from 4.75 to 31.5 mm are then washedwith running water. The equipment used in this technique is shown in Fig. 3.6.
Waste concrete yard
Manual separating Reinforcement and lumber
Reciprocating feeder
Jaw crusher
Magnetic separatorIron fillings
Sieve Recycled spall used as landfill
Rotating crusher
Magnetic separator
Level I vibrating sieve
Jaw crusher
Level II vibrating sieve Mist
Washing machine
Level III vibrating sieveWashing machine
RCA with particle size ranging from 5 to 31.5mm
Fig. 3.5 RA production technique proposed by the author
3.1 Crushing and Sieving Techniques 43

3.1.3 Crushing Equipment
At present, there are mainly two types of waste concrete crushing equipment, i.e.the stationary type and the moveable type. Equipment for crushing NCA can beapplied as the stationary equipment or obtaining RCA. The complete moveablecrushing and screening equipment is originated from the stationary equipment. Itcombined different but simple functioning equipment and installed on the movingequipment, as shown in Fig. 3.7 [2].
(a) Jaw crusher (b) Impact crusher
(c) Equipment for washing RCA (d) Conveying aggregates in the plant
Fig. 3.6 RA production equipment used in the proposed technique
Crushing mechanism
Feeding mechanism
Transfer mechanism
Crawler travel mechanism
Fig. 3.7 Diagram of amobile crushing machine [2]
44 3 Recycled Aggregates

At present, there are three typical types of concrete crushing moveable machines:
(1) The large-scale towed movable crusher, as shown in Fig. 3.8, is equipped witha high-performance impact crusher, set of feeding, crushing and sievingall-in-one movable production machinery. The advantage is that it actuallycombines the functions of feeding, level I and level II crushing, magneticseparating and screening with its mobility. This machine has an automaticsupply system; thus, it can work without manually controlling it. With thelargest inlet in similar products, massive waste concrete can be processed. Anddue to its precise design, the environmental impact, such as dust and noiserelease, can be reduced to lowest. This machine has ability to producehigh-quality RA.
(2) The medium-scale crawler movable crusher, as shown in Fig. 3.9, is the type ofmachine which is equipped with a feeding system, a rotating impact crusherand a highly effective screening system, aiming at crushing building wastes atsite. With the powerful rotating impact crusher, even reinforced concrete can be
Fig. 3.8 Large-scale towed mobile crusher
Fig. 3.9 Medium-scale crawler mobile crusher
3.1 Crushing and Sieving Techniques 45

crushed. This RA production machine is highly effective and environmentallyfriendly, but it can only produce RCA.
(3) The small-scale moveable crusher is shown in Fig. 3.10. The main advantage istheir mobility and efficiency for use on-site demolition. Although it belongs tothe small machine group, it is also fully functional. The noise and vibration arelimited, therefore even though in compacted cities this machine can be used. Ituses the rubber caterpillar band and does not damage the ground. It can beconnected to a conveyer and magnetic separator to achieve other functions.
3.2 Recycled Fine Aggregates
3.2.1 Properties
The RFA is obtained from waste concrete by machine crushing, with the particlesize below 4.75 mm (Fig. 3.11a), containing natural sand with adhered old hard-ened mortar, as well as hardened cement paste and clay, leading to sharp corners,cracks, low bulk density and high water absorption [3]. Differences between naturalfine aggregate (NFA) and RFA reported by Li et al. [4] are listed in Table 3.1. Bynow, several countries have recommendations for the use of RCA in structuralconcretes, but the RFA are discarded because it may produce modifications on thefresh and hardened concrete properties [5, 6] (Fig. 3.11).
3.2.2 Classification
Currently, China has preliminary technical standards on RFA. Japan has donesystematic research on the RFA and suggested a standard for RFA classification.Table 3.2 shows the classification of RFA used in Japan [7]. The main controlfactors are water absorption and soundness. Li et al. [4] suggested using mortarwater content, mortar strength and robustness to classify RFA, as demonstrated inTable 3.3.
Fig. 3.10 Small-scale mobile crusher
46 3 Recycled Aggregates
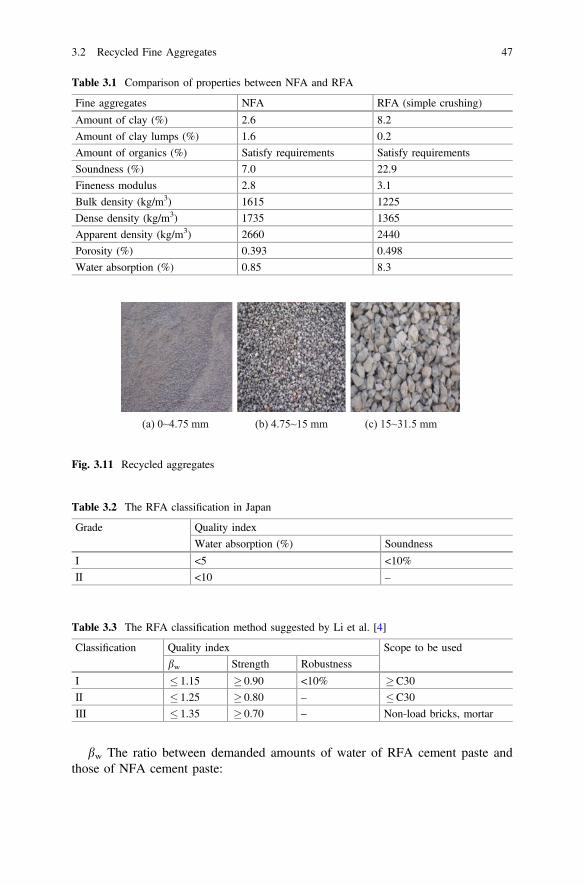
bw The ratio between demanded amounts of water of RFA cement paste andthose of NFA cement paste:
(a) 0~4.75 mm (b) 4.75~15 mm (c) 15~31.5 mm
Fig. 3.11 Recycled aggregates
Table 3.2 The RFA classification in Japan
Grade Quality index
Water absorption (%) Soundness
I <5 <10%
II <10 –
Table 3.1 Comparison of properties between NFA and RFA
Fine aggregates NFA RFA (simple crushing)
Amount of clay (%) 2.6 8.2
Amount of clay lumps (%) 1.6 0.2
Amount of organics (%) Satisfy requirements Satisfy requirements
Soundness (%) 7.0 22.9
Fineness modulus 2.8 3.1
Bulk density (kg/m3) 1615 1225
Dense density (kg/m3) 1735 1365
Apparent density (kg/m3) 2660 2440
Porosity (%) 0.393 0.498
Water absorption (%) 0.85 8.3
Table 3.3 The RFA classification method suggested by Li et al. [4]
Classification Quality index Scope to be used
bw Strength Robustness
I � 1.15 � 0.90 <10% �C30
II � 1.25 � 0.80 – �C30
III � 1.35 � 0.70 – Non-load bricks, mortar
3.2 Recycled Fine Aggregates 47

bw ¼ WR
W0ð3:1Þ
WR Demanded amounts of water of RFA cement paste. The demanded amount ofwater corresponding to 130� 5 mm fluidity for cement paste mixed by1350 g of RFA and 540 g of Portland cement.
W0 Demanded amounts of water of NFA cement paste. The demanded amount ofwater corresponding to 130� 5 mm fluidity for cement paste mixed by1350 g of NFA and 540 g of Portland cement.
3.2.3 Testing Method
Other factors for testing the properties of RFA, the “Standard for technicalrequirements and test method of sand and crushed stone (or gravel) for ordinaryconcrete” (JGJ52-2006) can be used as a reference.
3.3 Recycled Coarse Aggregates
RCA is the aggregate, with the particle size greater than 4.75 mm (Fig. 3.11b, c),crushed and processed by waste concrete. RCA mainly contains NCA and adheredold hardened mortar. Due to the old hardened mortar, the basic properties of RCAare different from those of NCA. And thus the performances of fresh and hardenedRAC differ from those of NAC. In recent years, a series of investigations on thebasic properties of RCA have been carried out [8–12], indicating that the differentsource that the waste concrete comes from is a fundamental cause of randomnessand variability of RCA.
3.3.1 Single Source of RCA
3.3.1.1 Test Summary
The maximum particle size of NCA of continuous grading is 31.5 mm. The RCA iscrushed from the demolished concrete airport pavement. Because of the long age ofthis airport pavement, technical factors, such as strength grade and the mixture ofwaste concrete, remain unknown. RCA are divided into two categories by particlesize: 4.75–15 mm and 15–31.5 mm. In order to obtain RCA with the similargrading to that of NCA, these RCA classified into two particle sizes were combined.
48 3 Recycled Aggregates
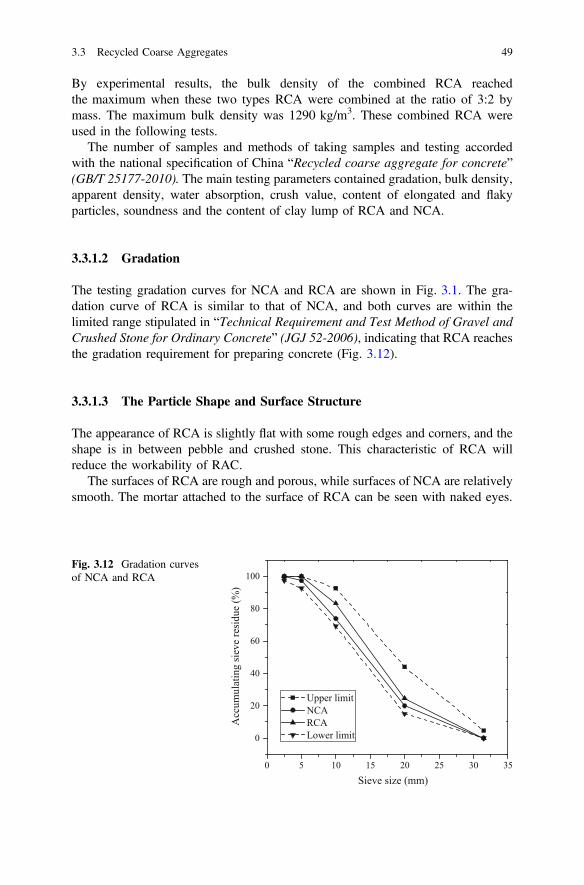
By experimental results, the bulk density of the combined RCA reachedthe maximum when these two types RCA were combined at the ratio of 3:2 bymass. The maximum bulk density was 1290 kg/m3. These combined RCA wereused in the following tests.
The number of samples and methods of taking samples and testing accordedwith the national specification of China “Recycled coarse aggregate for concrete”(GB/T 25177-2010). The main testing parameters contained gradation, bulk density,apparent density, water absorption, crush value, content of elongated and flakyparticles, soundness and the content of clay lump of RCA and NCA.
3.3.1.2 Gradation
The testing gradation curves for NCA and RCA are shown in Fig. 3.1. The gra-dation curve of RCA is similar to that of NCA, and both curves are within thelimited range stipulated in “Technical Requirement and Test Method of Gravel andCrushed Stone for Ordinary Concrete” (JGJ 52-2006), indicating that RCA reachesthe gradation requirement for preparing concrete (Fig. 3.12).
3.3.1.3 The Particle Shape and Surface Structure
The appearance of RCA is slightly flat with some rough edges and corners, and theshape is in between pebble and crushed stone. This characteristic of RCA willreduce the workability of RAC.
The surfaces of RCA are rough and porous, while surfaces of NCA are relativelysmooth. The mortar attached to the surface of RCA can be seen with naked eyes.
0 5 10 15 20 25 30 35
0
20
40
60
80
100
Acc
umul
atin
g si
eve
resi
due
(%)
Sieve size (mm)
Upper limit NCA RCA Lower limit
Fig. 3.12 Gradation curvesof NCA and RCA
3.3 Recycled Coarse Aggregates 49

3.3.1.4 Density
The bulk density and apparent density of RCA and NCA are listed in Table 3.4. Itcan be seen from Table 3.4 that, when compared to NCA, the bulk density andthe apparent density of RCA decrease by 12 and 10%, respectively. The attachedold hardened mortar on RCA is the main reason of this declination. And this lead toa declination of the density and elastic modulus of concrete prepared with RCA.
3.3.1.5 Water Absorption
Water absorption of NCA and RCA is listed in Table 3.5. It proved that as theporous old hardened mortar attached on RCA, the water absorption at 24 h of RCAis 23 times higher than that of NCA. Thus, more water should be added whenpreparing RAC in mix proportion compared to NCA. The high water absorption ofRCA is generally regarded as the most significant characteristic of RCA.
Table 3.5 shows the water absorption rate of NCA and RCA with time variation,it can be found that both NCA and RCA get saturated with water in a short time.For RCA, it takes only 10 min to reach an 85% saturation, while 30 min to reach a95% saturation.
3.3.1.6 Content of Attached Mortar
The content of attached mortar can be estimated with this formula:
X � qM þ 1� Xð Þ � qNCA;ORIGN ¼ qRCA ð3:2Þ
X ¼ qRCA � qNCA;ORIGNqM � qNCA;ORIGN
ð3:3Þ
in which qM means apparent density of mortar; qNCA;ORIGN indicates the apparentdensity of NCA in parent concrete; qRCA represents the apparent density of RCA;and X indicates the content of adhered mortar by volume.
Table 3.4 Density of NCAand RCA
Item name (kg/m3) NCA RCA
Bulk density 1453 1290
Apparent density 2820 2520
Table 3.5 Water absorptionrate of NCA and RCA
Water absorption (%) NCA RCA
10 min 0.332 8.34
30 min 0.382 8.82
24 h 0.4 9.25
50 3 Recycled Aggregates

Based on experience, qM, qNCA;ORIGN and qRCA are set as 1700 kg/m3,2800 kg/m3 and 2520 kg/m3 respectively and X = 25% by Eq. (3.3). This calcu-lating result accords with the experimental result by Hansen [8].
3.3.1.7 Porosity
The porosity of RCA (P) can be calculated by Eq. (3.4):
P ¼ q �Wa=1000 ð3:4Þ
In the formula, P means the porosity of RCA (%); q means the apparent densityof RCA (kg/m3); and Wa means the water absorption of RCA (%).
The calculated result of porosity of RCA and NCA is listed in Table 3.6. It canbe found from the calculation results that the porosity of RCA is about 20 timeshigher than that of NCA, and this is mainly due to the higher mortar contentattached on the surface. The high porosity may lead to stress concentration underload and causes the declination of compressive strength of RAC.
3.3.1.8 Crush Value
The crush value reflects the capacity to resist crushing. The experimental result ofcrush value for NCA and RCA are listed in Table 3.7. Obviously, the crush value ofRCA is higher than that of NCA, indicating that the strength of RCA is lower,which is mainly because of high volume of adhered mortar with high porosity andweak bond performance.
3.3.1.9 Soundness
Soundness of aggregate is used for judging the capacity to resist crushing under themeteorological, environmental and other physical impacts by testing the capacity toresisting resolving immersed in sodium sulfate solution. The soundness of NCA
Table 3.6 Porosity of NCAand RCA
Item name NCA RCA
Factor of porosity (%) 1.1 23.3
Table 3.7 Crush value ofNCA and RCA
Measured item NCA RCA
Crush value (%) 4.04 15.2
3.3 Recycled Coarse Aggregates 51
and RCA, which is represented by the ratio of mass loss, is given in Table 3.8. Asshown in Table 3.8, soundness of RCA is worse than that of NCA, which may leadto durability degradation of RAC. Thus, it is necessary to conduct further study ondurability of RAC.
3.3.1.10 Content of Elongated and Flaky Particles
The coarse aggregate, whose length exceeds 2.4 times that of the average diameterof particle size the aggregate belonging to is called elongated particle, and thecoarse aggregate whose thickness is less than 0.4 times of that average diameter iscalled flaky particle. An overabundance of elongate and flaky particles has disad-vantages of workability and durability for concrete. The comparison of the contentof elongated and flaky particles between NCA and RCA is listed in Table 3.9.For NCA and RCA, the content of elongated and flaky particles is 4.8 and 6.2%,respectively, and the difference between these two values is not large, indicatingthat the shape of RCA is similar to that of NCA.
3.3.1.11 Content of Clay
Content of clay for NCA and RCA is listed in Table 3.10. It is found that thecontent of clay of RCA is higher than that of NCA, which exceeds the limitstipulated in “The Use of Gravel or Pebble Quality Standards and Testing Methodof Ordinary Concrete” (JGJ52-2006). This may be caused by the impropercrushing technology and long-term open-air stacking. Since the overabundance ofclay may lead to the concrete performance degradation, such as strength decreasingand enlarging shrinkage, RCA should be washed or processed by other techniquesbefore preparing RAC.
Table 3.8 Mass loss forNCA and RCA
Measured item NCA RCA
Mass loss (%) 3.2 9.2
Table 3.9 Content ofelongated and flaky particle ofNCA and RCA
Measured item NCA RCA
Content of elongated and flake particle (%) 4.8 6.2
Table 3.10 Content of clayfor NCA and RCA
Measured item NCA RCA
Content of clay (%) 1.80 4.08
52 3 Recycled Aggregates

3.3.2 Multi Source of RCA
3.3.2.1 Test Summary
The RCA was crushed by waste concrete with strength grade at C20, C30, C40 andC50 respectively, by manual and machine crushing. The maximum particle size is40 mm. The gradation curves are shown in Fig. 3.13. It can be concluded that theRCA crushed by different parent concrete accords with the requirement in“Technical Requirement and Test Method of Gravel and Crushed Stone forOrdinary Concrete” (JGJ 52-2006).
3.3.2.2 Apparent Density
The apparent densities of RCA under saturation surface dry condition are listed inTable 3.11. It can be found that the apparent density increases with the increasingstrength grade of parent concrete.
3.3.2.3 Water Absorption
Water absorption at 24 h of different RCA is listed in Table 3.12. From Table 3.12,the increasing strength grade of waste concrete causes a decreasing water absorp-tion. Higher the strength grade is, more rapidly the water absorption decreases.
0 5 10 15 20 25 30 35 40 45
0
20
40
60
80
100
Acc
umul
atin
g si
eve
resi
due
(%)
Aperture (mm)
C20 C30 C40 C50Upper limitLower limit
Fig. 3.13 Gradation curvesof RCA from different parentconcrete
Table 3.11 Apparent density under saturation surface dry condition of RCA
Strength grade of parent concrete C20 C30 C40 C50
Apparent density under saturation surface dry condition(kg/m3)
2433 2454 2457 2525
3.3 Recycled Coarse Aggregates 53
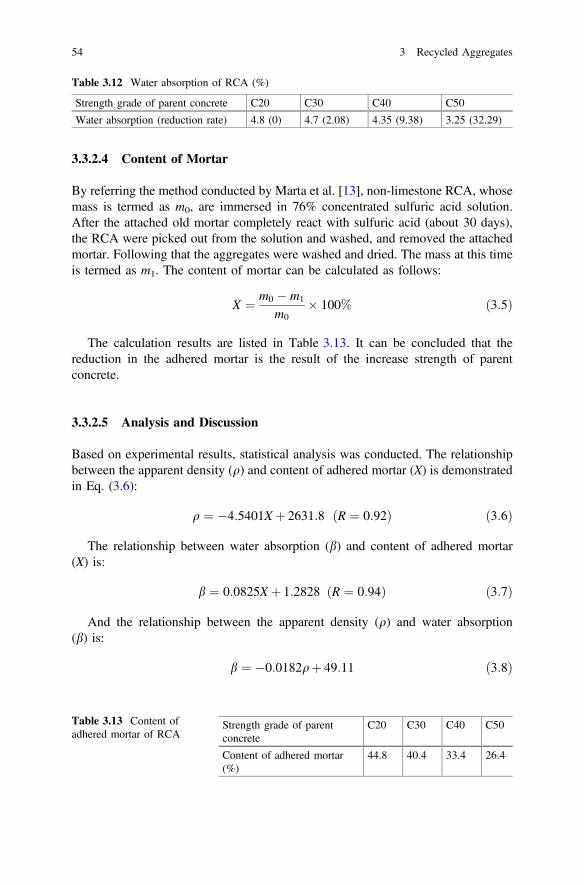
3.3.2.4 Content of Mortar
By referring the method conducted by Marta et al. [13], non-limestone RCA, whosemass is termed as m0, are immersed in 76% concentrated sulfuric acid solution.After the attached old mortar completely react with sulfuric acid (about 30 days),the RCA were picked out from the solution and washed, and removed the attachedmortar. Following that the aggregates were washed and dried. The mass at this timeis termed as m1. The content of mortar can be calculated as follows:
X ¼ m0 � m1
m0� 100% ð3:5Þ
The calculation results are listed in Table 3.13. It can be concluded that thereduction in the adhered mortar is the result of the increase strength of parentconcrete.
3.3.2.5 Analysis and Discussion
Based on experimental results, statistical analysis was conducted. The relationshipbetween the apparent density (q) and content of adhered mortar (X) is demonstratedin Eq. (3.6):
q ¼ �4:5401Xþ 2631:8 R ¼ 0:92ð Þ ð3:6Þ
The relationship between water absorption (b) and content of adhered mortar(X) is:
b ¼ 0:0825Xþ 1:2828 R ¼ 0:94ð Þ ð3:7Þ
And the relationship between the apparent density (q) and water absorption(b) is:
b ¼ �0:0182qþ 49:11 ð3:8Þ
Table 3.12 Water absorption of RCA (%)
Strength grade of parent concrete C20 C30 C40 C50
Water absorption (reduction rate) 4.8 (0) 4.7 (2.08) 4.35 (9.38) 3.25 (32.29)
Table 3.13 Content ofadhered mortar of RCA
Strength grade of parentconcrete
C20 C30 C40 C50
Content of adhered mortar(%)
44.8 40.4 33.4 26.4
54 3 Recycled Aggregates

It is found by collecting data from literature and statistical analysis, the apparentdensity and water absorption of RCA are parabolic, as is shown in Eq (3.9):
b ¼ 4:2� 10�5q2 � 0:22qþ 293:05 R ¼ 0:82ð Þ ð3:9Þ
In general, as is shown in Fig. 3.14, Eqs. (3.8) and (3.9) are both similar toexperimental data, in which Eq (3.9) is closer.
Content of mortar is one of the most essential differences between RCA andNCA. Due to the relativity between content of mortar and water absorption, it isreasonable to use apparent density and water absorption as the main parameter forclassifying RCA.
3.4 Method of Classifying and Testing for RCA
3.4.1 Study on RCA Classification
The performance of RAC is influenced by the properties of RCA to a great extent.Since the great difference exists between the waste concrete obtained from differentsources, the discreteness will be significant if the waste concrete is not classifiedproperly. In order to make the strength to reach a 95% guarantee rate, strength hasto be increased while designing the mixing proportion of RAC, causing wastingcement and cost. Thus, it is necessary to conduct RCA classification.
In addition, the majority of buildings in China in past consists of concrete andmasonry structures. Thus, except waste concrete, the C and D wastes contain a lotof waste bricks. Poon [14] concluded that crush valuees of RCA with 25 and 50%
2200 2300 2400 2500 2600 27000
2
4
6
8
10
12
14 Data collected from literatures Experimental data Equation (3.8) Equation (3.9)
Wat
er a
bsor
ptio
n (%
)
Apparent density (kg/m3)
Fig. 3.14 The relationship between apparent density and water absorption of RCA
3.3 Recycled Coarse Aggregates 55

content of bricks increased by 26.7 and 41.1%, respectively, compared to that ofRCA with 0% content of bricks. Wang and Li [15] carried out comparative tests onRCA with and without bricks. The results show that with the same mix proportion,the strength of RAC with RCA containing waste bricks is only about 50% of that ofRAC with RCA without waste bricks. A lab experiment carried out by Peng et al.[16] discovered that the strength of RAC prepared with RCA with 0, 17, 33, 50, and67% replacement of bricks decreased by 15, 23, 20, 20, and 25% compared withNAC with the same mix proportion, respectively. This demonstrates that theinfluence of brick content on the strength of RAC cannot be ignored, and there mustbe a limit to the waste bricks content in RCA. Therefore, while classifying RCA,recycled bricks should be considered in particular.
Some countries, regions or organizations in the world, have proposed differentmethods of RCA classifications, and they are discussed below:
(1) Hong Kong
The Hong Kong Civil Engineering Specifications does not allow using recycledbuilding materials in concrete until 2001 and constituted two series of specificationsby different replacement percentage (20 and 100%), in which the apparent densityand water absorption were stipulated, as listed in Table 3.14.
(2) RILEM
In 1998, RILEM released a version of RAC specifications [17]. The RCA aredivided into three categories: “Class I” is RCA coming from masonry structures;“Class II” is RCA coming from waste concrete; and “Class III” is a mixture of RCAand NCA, in which the highest replacement percentage of RCA is 20%, whilerecycled bricks must not exceed 10%. The properties of RCA can be seen inTable 3.15, in which SSD means water saturated surface dry condition. Normally,the three categories can be distinguished by observation. If they are difficult todistinguish, a density test should be carried out for separating.
Table 3.14 The requirements of RCA according to Hong Kong civil engineering specification
Mandatory Requirements Limits
Minimum dry particle density (kg/m3) 2000
Max. water absorption 10%
Max. content of wood and other materialless dense than water
0.5%
Max. content of other foreign materials (e.g.metals, plastics, clay lumps, asphalt and tar,glass etc)
1%
Max. content of sulphate 1%
56 3 Recycled Aggregates
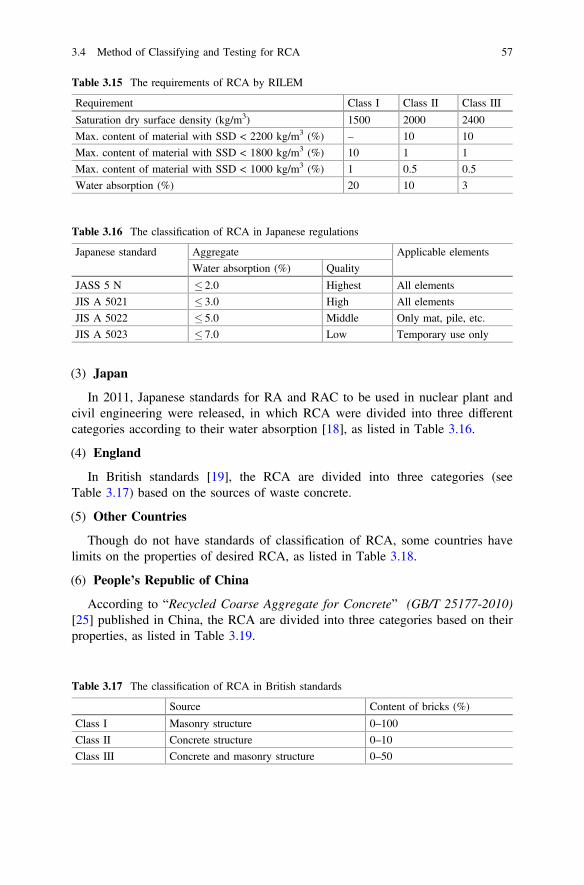
(3) Japan
In 2011, Japanese standards for RA and RAC to be used in nuclear plant andcivil engineering were released, in which RCA were divided into three differentcategories according to their water absorption [18], as listed in Table 3.16.
(4) England
In British standards [19], the RCA are divided into three categories (seeTable 3.17) based on the sources of waste concrete.
(5) Other Countries
Though do not have standards of classification of RCA, some countries havelimits on the properties of desired RCA, as listed in Table 3.18.
(6) People’s Republic of China
According to “Recycled Coarse Aggregate for Concrete” (GB/T 25177-2010)[25] published in China, the RCA are divided into three categories based on theirproperties, as listed in Table 3.19.
Table 3.15 The requirements of RCA by RILEM
Requirement Class I Class II Class III
Saturation dry surface density (kg/m3) 1500 2000 2400
Max. content of material with SSD < 2200 kg/m3 (%) – 10 10
Max. content of material with SSD < 1800 kg/m3 (%) 10 1 1
Max. content of material with SSD < 1000 kg/m3 (%) 1 0.5 0.5
Water absorption (%) 20 10 3
Table 3.16 The classification of RCA in Japanese regulations
Japanese standard Aggregate Applicable elements
Water absorption (%) Quality
JASS 5 N � 2.0 Highest All elements
JIS A 5021 � 3.0 High All elements
JIS A 5022 � 5.0 Middle Only mat, pile, etc.
JIS A 5023 � 7.0 Low Temporary use only
Table 3.17 The classification of RCA in British standards
Source Content of bricks (%)
Class I Masonry structure 0–100
Class II Concrete structure 0–10
Class III Concrete and masonry structure 0–50
3.4 Method of Classifying and Testing for RCA 57

3.4.2 Testing Methods
According to worldwide experience, in order to facilitate the application andcomparision, the testing methods of RCA properties are suggested to be identical tothose of NCA. In China, the testing methods in the standard “Recycled CoarseAggregate for Concrete” (GB/T 25177-2010) [25] are mainly referred from thestandards for NCA. The detailed testing method of RAC will be further discussed inChap. 15.
Table 3.18 The requirements of RCA by other countries
Country Apparentdensity (kg/m3)
Waterabsorption (%)
Content ofbricks (%)
Replacementpercentage ofRCA (%)
Spain [20] – � 5 – –
Germany [21] � 2000 ± 150 � 10 � 10 –
Australia [22] � 2100 � 6 – –
Belgium [23] � 2100 � 10 – –
Brazil [24] � 2300 � 7 – � 20
Table 3.19 The classification of RCA in China
Item Class I Class II Class III
Water absorption (by mass) (%) <3.0 <5.0 <8.0
Apparent density (kg/m3) >2450 >2350 >2250
Porosity (%) <47 <50 <53
Content of clay (by mass) (%) <1.0 <2.0 <3.0
Content of clay lumps (by mass) (%) <0.5 <0.7 <1.0
Content of elongated and flaky particles (by mass) (%) <10
Content of organic Standard
Sulfide and sulfate (by mass) (%) <2.0
Chloride (by mass) (%) <0.06
Content of impurities (%) <1.0
Mass loss (%) <5.0 <10.0 <15.0
Crush value (%) <12 <20 <30
58 3 Recycled Aggregates
3.5 Pre-treating and Enhancement
As mentioned above, the characteristics like high porosity, high water absorption,low apparent density and high crush value for RCA leads to the low performance ofRAC compared with NAC. It is possible to improve the properties of RAC byimproving the shape, removing adhered mortar, decreasing the porosity of RCAand other pre-treatment and enhancing method. The common methods ofpre-treatment and enhancing are described below:
3.5.1 Adjusting Mix Proportion
Adjusting mix proportion is one of the easiest methods to enhance the properties ofRCA, including adjusting the water-cement ratio (w/c) as well as other componentsin mix proportion along with mineral admixture.
Some investigations indicated that adding additional water, based on waterabsorption of RCA can improve the workability of concrete [26–28]. However,some scholars pointed out that although adding additional water can improve theworkability of RAC, it may also cause the reduction of strength and durability[26, 28].
The lower mechanical behaviors of RAC is caused by the adhered old mortar,which makes the high mortar content and the low natural aggregate content. Fromthis point, Fathifazl [29] proposed a new mix proportioning method called“Equivalent Mortar Volume, EMV.” This method is based on the hypothesis thatRCA is a two-phase material comprising residual mortar and original virginaggregate; therefore, while proportioning a concrete mixture containing RCA, thevolume and properties of each phase must be taken into account. The main featureof the proposed method is treating residual mortar in RCA as part of total mortarvolume of concrete. The total mortar volume is considered as the sum of residualand new mortar volumes in concrete made with RCA. Experiments have provedthat this method is advantage of improving the strength and elastic modulus, as wellas the durability of RAC [29]. However, due to the complexity and discreteness ofRCA, it is difficult to apply EMV method in engineering since testing the content ofresidual mortar cost much.
Mineral additives used for the modification of RAC are mainly fly ash and slag.The mineral additives can fill the pores and voids inside the adhered mortar andthen react with calcium hydroxide to form C–S–H gel [30]. It has been proved thatadding fly ash or slag into RAC can improve its compressive strength, elasticmodulus [31], and durability [32].
3.5 Pre-treating and Enhancement 59

3.5.2 Chemical Method
Chemical method means using chemical grout to soak or wash the RCA, or cure theRCA in a specific gas, in order to fill the pores of RCA, or react with chemicalcomposition and its product can fill the cracks, or adhere the initial cracks inaggregate, and finally improve the properties of RAC.
Tam et al. [33] firstly proposed the two-stage mixing approach (TSMA).Compared with normal mixing approach, TSMA divides the mixing process intotwo parts and proportionally splits the required water into two which are added atdifferent timing. During the first stage of mixing, it uses half of the required waterfor mixing leading to formation of a thin layer of cement slurry on the surface ofRA which will permeate into porous old cement mortar, filling up the old cracksand voids. At the second stage of mixing, the remaining water is added to completethe concrete mixing process. The TSMA gives a way for the cement slurry to gel upthe RCA, providing a stronger interficial transition zone (ITZ) by filling up thecracks and pores within RCA.
Polymer emulsions have adhesive properties and can solidify in a short period oftime. Polyvinyl alcohol (PVA) emulsion and silane-based polymers are waterrepellent and can be used to reduce the water absorption of porous materials [30].The polymer molecules can fill the pores of the adhered mortar and seal the surfacesof RCA.
Sodium silicate solution can react with calcium hydroxide to for C–S–H gel asfollows:
Na2SiO3 + Ca OHð Þ2 + H2O ! C�S�HþNaOH
Sodium silicate solution might form a continuous layer of sodium silicate on thesurface of RCA [34].
Carbonation is a neutralizing procedure, in which carbon dioxide react with cal-cium hydroxide dissolved in the concrete pore water, producing calcium carbonateand water. In addition, C–S–H, C3S and C2S can also react with carbon dioxide.Carbonation can effectively improve the compactness of cement mortar, decrease theporosity and water absorption, and increase the density and strength of RCA [35].
3.5.3 Physical Method
Physical method means removing the adhered mortar from the RCA. Mechanicalgrinding, pre-soaking in water/acid and heating are the common physical methods.
The mechanical grinding is achieved by rolling vibration effects of a high speedrotating eccentric gear in a grinding mill. The adhered mortar can be ground by thisaction [36]. However, the disadvantage of mechanical grinding is obvious. Thismodification will lead to cracks appearance and propagation, which causes thereduction of the mechanical and durable properties of RAC.
60 3 Recycled Aggregates

Heat grinding and selective heat grinding can be regarded as improvements ofmechanical grinding, but the basic theories of these two approaches are not thesame. For heat grinding, RCA was heated at around 300 °C to dehydrate theadhered mortar and make it more brittle, before grinding them in a mill. While forselective heat grinding, microwave was used to heat up and weaken the old ITZsbetween the virgin aggregate and the adhered mortar. Then mechanical grinding caneffectively remove the adhered mortar to obtain the high-quality RCA [37]. Theproperties of RCA processed by heat grinding and selective heat grinding are nearlyidentical to that of NCA.
Traditionally, dry processing method is usually adopted in the production ofRCA. However, when the aggregates contained too much impurities, the quality ofRCA is poor by dry processing method. Pre-soaking in water can separate impu-rities and obtain higher quality RCA. It is concluded that pre-soaking whenpreparing RAC can improve the workability and compressive strength of RAC [28].This method is an effective modification approach due to its low cost, low energyconsumption, and low environmental impact.
3.6 Concluding Remarks
This chapter introduced waste concrete and RA, which included the source of wasteconcrete, crushing and classification of aggregates, processing techniques of wasteconcrete, the basic performance of recycled coarse and fine aggregates, the clas-sification and inspection of RCA, the pre-treatment and enhancement of recycledcoarse and fine aggregates. These are very important fundamentals to understandthe differences between ordinary concrete and RAC, and thereby further studyingthe performance of the RAC materials and structures. And they are significant infurther developing RAC with advanced properties such as high-performance RAC.
References
1. Xiao J, Sun Z, Li J, et al. Studies on crushing and regenerating technology of waste concrete.Archit Technol. 2005;36(2):141–4.
2. Li B, Huang B, Zhang D. Research on the application of removable crusher in strip mine.Coal Technol. 2003;22(10):20–1.
3. Jian G, Sun J. Characteristics of the carbonation resistance of recycled fine aggregateconcrete. Constr Build Mater. 2013;49(1):814–20.
4. Li Q, Li Y, Jiang Y. Investigation on quality standards and testing method of recycled fineaggregate. J Qingdao Technol Univ. 2005;26(6):6–9.
5. Hansen TC, Narud H. Strength of recycled concrete made from crushed concrete coarseaggregate. Concr Int. 1983;5:79–83.
6. Zega CJ, Di Maio AA. Use of recycled fine aggregate in concretes with durable requirements.Waste Manag. 2011;31(11):2240–336.
3.5 Pre-treating and Enhancement 61

7. Hirotaka K. The state of using by-products in concrete in Japan and outline of Jis/Tr on“recycled concrete using recycled aggregate”. Public Works Research Institute, Japan.
8. Hansen TC. Recycled aggregate and recycled aggregate concrete. Second state of art report,development from 1945–1985. RILEM Technical Committee 37 DRC. Mater Struct. 1986;19(5):201–46.
9. Lin YH, Tyan YY, Chang TP, et al. An assessment of optimal mixture for concrete made withrecycled concrete aggregates. Cem Concr Res. 2004;34(8):1373–80.
10. Silva RV, Brito JD, Dhir RK. Properties and composition of recycled aggregates fromconstruction and demolition waste suitable for concrete production. Constr Build Mater.2014;65(13):201–17.
11. Ulloa VA, Garc’Ia-Taengua E, Pelufo MJ, et al. New views on effect of recycled aggregateson concrete compressive strength. ACI Mater J. 2013;110(6):1–10.
12. Li JB, Xiao JZ, Sun ZP. The characteristics of recycled coarse aggregates and its effect onperformance of recycled concrete. J Building Mater. 2005;17(5):390–5.
13. Marta SJ, Pilar AG. Influence of attached mortar content on the properties of recycledconcrete aggregate. In: Proceedings of international conference on sustainable wastemanagement and recycling: construction and demolition waste; 2004.
14. Poon CS, Chan D. Feasible use of recycled concrete aggregates and crushed clay brick asunbound road sub-base. Constr Build Mater. 2006;20(8):578–85.
15. Jian Wang, Yi Li. Research on treatment and regeneration of building refuses. Environ Eng.2003;21(6):49–52.
16. Peng HS, Chen HJ, Yen T. Strength and workability of recycled aggregate concrete. In: Theinternational conference on composites in constructions (CCC2003). Italy; 2003.
17. Hendriks CF, Pieterson HS. Sustainable raw materials-construction and demolition waste.RILEM report 22, RILEM publication series, F-94235 Cachan Cedex, France; 1998.
18. Yoda K, Shintani A. Building application of recycled aggregate concrete for upper-groundstructural elements. Constr Build Mater. 2014;67:379–85.
19. British Standards Institution. BS6543-Guide to the use of industrial by-products and wastematerials in building and civil engineering. London; 1985.
20. Take Force of the Standing Committee of Concrete of Spain. Draft of Spanish regulations forthe use of recycled aggregate in the production of structural concrete.
21. German Committee for reinforced concrete (DAFSTB)-code: concrete with recycledaggregates.
22. Csiro, Building, Construction and Engineering. Guide for specification of recycled concreteaggregate (RCA) for production. 1998.
23. Vyncke J, Rousseau E. Recycling of construction and demolition waste in Belgium: actualsituation and future evolution. Brussels: Belgian Building Research Institute.
24. Marcio JE, Cassia S, Juercio T. Recycled aggregate standardization in Brazil. http://congress.cimne.upc.es/rilem04/admin/Files/FilePaper/p310.pdf.
25. GB/T 25177-2010. Recycled coarse aggregate for concrete.26. Padmini AK, Ramamurthy K, Mathews MS. Influence of parent concrete on the properties of
concrete. Constr Build Mater. 2009;23(2):829–36.27. Zhang Y, Qin H, Sun W. Preliminary study on the proportion design of recycled aggregate
concrete. China Concr Cem Prod. 2002;1:7–9 (in Chinese).28. Xiao JZ, Li JB, Sun ZP, et al. Study on compressive strength of recycled aggregate concrete.
J Tongji Univ (Nat Sci). 2004;32(12):1558–61 (in Chinese).29. Fathifazl G. Structural performance of steel reinforced recycled concrete members. PhD
dissertation, Carleton University, Ottawa, Canada; 2008.30. Shi C, Li Y, Zhang J, et al. Performance enhancement of recycled concrete aggregate—A
review. J Clean Prod. 2015;112(1):466–72.31. Corinaldesi V, Moriconi G. Influence of mineral additions on the performance of 100%
recycled aggregate concrete. Constr Build Mater. 2009;23(8):2869–76.32. Kou SC, Poon CS. Long-term mechanical and durability properties of recycled aggregate
concrete prepared with the incorporation of fly ash. Cement Concr Compos. 2013;37(2):12–9.
62 3 Recycled Aggregates
33. Tam VWY, Gao XF, Tam CM. Microstructural analysis of recycled aggregate concreteproduced from two-stage mixing approach. Cem Concr Res. 2005;35(6):1195–203.
34. Shayan A, Xu A. Performance and properties of structural concrete made with recycledconcrete aggregate. ACI Mater J. 2003;100(5):371–80.
35. Wang C, Xiao J, Zhang G, et al. Interfacial properties of modeled recycled aggregate concretemodified by carbonation. Constr Build Mater. 2016;105:307–20.
36. Sun YD, Xiao JZ. Aggregate of recycled concrete. Concrete. 2004;6:33–6 (in Chinese).37. Xiao JZ, Wu L, Fan YH. Test on modification of recycled coarse aggregate by microwave
heating. Concrete. 2012;31(7):55–7 (in Chinese).
References 63
Chapter 4Recycled Aggregate Concrete
Abstract Worldwide research has shown that there exist clear differences betweenproperties of recycled coarse aggregates (RCA) and those of natural coarseaggregates (NCA), such as porosity, water absorption, low surface density, highercrush value. According to the specific performance requirements of concrete,choosing appropriate raw materials, then designing the most economic, high-qualityconcrete based on the proper mix proportion methods, is the best way to overcomethe shortcomings of the traditional design methods, and this puts forward newthoughts and design method.
4.1 Requirement for Mix Proportion Design
4.1.1 General Points
The main objective of mix proportion design is to determine the most economicrecycled aggregate concrete (RAC) ingredients, even for natural aggregate concrete(NAC). Furthermore, a reasonable mix proportion design also assures the safety ofstructures. The design of recycled concrete should satisfy the following require-ments considering the characteristics of RCA.
(1) The RAC strength should satisfy the structural design requirement
The compressive strength of RAC is normally lower than that of NAC. In orderto reach the same strength grade, the water–cement ratio (w/c) of RAC should belower than that of NAC.
(2) Satisfy the requirement of construction and workability, as well as reducing thequantity of cement and investment
Since the porosity and amount of clay are both higher in RCA, as well as therough surfaces, in order to reach the same workability as NAC, the cement in RACmix proportions is generally more than normal concrete. Therefore, the balance
© Springer-Verlag GmbH Germany 2018J. Xiao, Recycled Aggregate Concrete Structures,Springer Tracts in Civil Engineering, https://doi.org/10.1007/978-3-662-53987-3_4
65
between workability and investment is a significant problem that must be settledduring mix proportion design of RAC.
(3) The deformation and durability of RAC should satisfy usage requirements
Due to high porosity of RCA, the modulus of elasticity of RAC is generallylower than NAC, which leads to a lower stiffness of RAC components.Furthermore, the pores within RCA also provide paths for corrossive substances,causing lower durablity of RAC. Therefore, while designing the mix proportion ofRAC, careful consideration should be made to service and durability requirements.
From the definition of RAC, it is a mixture of materials such as cement, coarseand fine aggregates, and water with a certain mix proportion, which is similar to thedefinition of NAC. Additives can be added if needed. The main target of thetraditional mix proportion design method is to meet the strength requirement, basedon the linear relationship between strength and w/c ratio. However, with the con-tinuous development of construction industry, in order to meet the strengthrequirements of different concrete structures, different types of concrete have beenproposed and the mix proportion design has shown some disadvantages.
Many experts concluded that the guiding ideology of the mix proportion designshould be transformed from strength design to performance design. Foo [1] pointedout that reasonable material mix proportion design should be in accordance with therelated standards which include the basis for strength, durability, uniformity, as wellas workability and economizing requirements, to obtain the most economic andapplicable concrete.
4.1.2 Cementitious Material
Cementitious material has a wide scope. Both organic and inorganic cementitiousmaterials can be used in RAC. The inorganic cementitious materials are of a largevariety and are complicated. Normally, cement, gypsum, or can all be used in RAC.But whether its China or other countries in the world, cement occupies the largestproportion among the cementitious materials used in RAC production. Othercementitious materials are less used.
Cement is the most used cementitious material in RAC. Cement mortar does notonly harden by itself, but also binds coarse and fine aggregates together, makingRAC to have mechanical strength. In addition, the hardened cement mortar alsoinfluences the deformation and durability properties of RAC.
With rapid development of the cement industry in China, cement types used inbuilding projects are increasing. The cement mostly used in RAC production is thesame with that of cement mostly used in NAC production, including Portlandcement, slag cement, pozzolanic cement and fly ash cement, as long as it meetscertain requirements. Other cement types such as aluminate cement, sulphoalumi-nate cement, and other special types of cement like expansive cement,quick-hardening cement, bauxite cement can also be used.
66 4 Recycled Aggregate Concrete

4.1.3 Aggregates
RCA are the only reason why RAC is different from NAC from the point view ofmix proportion. The RCA classification, properties and production measures havebeen discussed in former chapters of this book. What must be pointed out here isthat the sources of RCA in China are complicated. Therefore the properties of RCAhave an obvious variety. Due to RCA high water absorption, RAC has worsemechnical and durable properties. For this reason, most building projects do not useRAC in important structures.
All the specifications of natural sand needs to inline with “Quality andInspection Standards of Sand and Stones in Normal concrete” (JGJ52-2006)requirements. Natural crushed stones and cobble can be used in the production ofRAC, but all other technical specifications should be inline with “Quality andInspection Standards of Sand and Stones in Normal concrete” (JGJ52-2006)requirements.
4.1.4 Admixtures
Fine inorganic mineral powders, such as fly ash, silica fume, slag, metakaolin andzeolite powder are now generally used in normal concrete mixture. The theory andpractice show that these admixtures are suitable for use in RAC, and the mostlyused one is fly ash.
Recycled concrete mineral admixtures should be inline with national standardssuch as “Fly Ash used in Cement and Concrete” (GB1596-2005), “TechnicalSpecifications for the Application of Fly Ash in Concrete and Mortar” (JGJ 28-86),“Technical Specifications of Fly Ash Concrete” (GBJ 146-1996) and “GranulatedBlast Furnace Slag Powder in Cement and Concrete” (GB/T 18046-2000).
When fly ash is added to RAC, it obviously reduces the amount of cement used,increases the concrete strength and durability, and achieves good economicbenefits.
NAC and lightweight aggregate concrete specifications can be used as referencein the amount of fly ash used in RAC, fly ash concrete mix proportion factors,amount of cement replacement, and mix proportion design methods, etc.
4.1.5 Chemical Admixtures
The use of chemical admixtures in NAC is very common. Therefore, it is evenregarded as the fifth element of concrete. Since RCA produced from waste concretehave rough surfaces which may also have old mortar attached to them, theadmixtures both in old mortar and new mortar are doubted to deteriorate the
4.1 Requirement for Mix Proportion Design 67

properties of RAC. Research and practical projects in China and worldwide showthat when suitable chemical admixtures are added in RAC, better performances ofRAC are achieved, and there has not been any literature on the disadvantages werereported so far. The chemical admixtures quality standards should be inline withcertain specifications, such as “Concrete Admixtures” (GB80766-1997), “ConcretePumping Agent” (JC473-2001), “Mortar and Concrete Waterproof Agents”(JC474-1997), “Concrete Anti-freezing Agents” (JC475-2004), “ConcreteExpansion Agents” (JC476-2001), and “Technical Specifications of the Applicationof Concrete Admixtures” (GB50119-2003).
4.2 Compressive Strength-Based Mix Proportion DesignMethod
4.2.1 Review Points
The basic idea of NAC mix proportion design in China [2] is that the concrete mixproportion design depends on three parts: the w/c ratio, water amount, and sand-aggregate ratio. According to the preparation of the concrete strength and the actualstrength of the cement, the w/c ratio is obtained by calculations using the Bolomyformula; the water amount used is determined by the slump and the largest coarseaggregate size. Thereafter, the amount of sand used is determined by the largestcoarse aggregate and w/c ratio. At last, according to the bulk density method orvolumetric method, the amount of sand and gravel are determined to achieve thedesired RAC mix proportion.
Due to the higher porosity, water absorption and variable sources of RCA, thelow strength and low elastic modulus characteristics were observed, which make itimpossible to adopt the same strength formula based on mix proportion of NAC.Although there are many researchers, both in China and worldwide [3], haveproposed several kinds of strength formula and tried to formulate the design mixproportion of RAC, they all have limits which makes a big gap between theoreticalformulus and practical application. Therefore, the mix proportion design method ofRAC at present stage is mainly based on NAC strength formula and use test resultto adjust the formula. The two parts of the mix proportion design methods, netwater content and additional water, by Zhang [4] and Shanghai “Recycled concreteapplication technical regulations,” are introduced below.
4.2.2 Calculation Steps
The basic steps in RAC mix proportion ratio design are pointed out as follows:
68 4 Recycled Aggregate Concrete
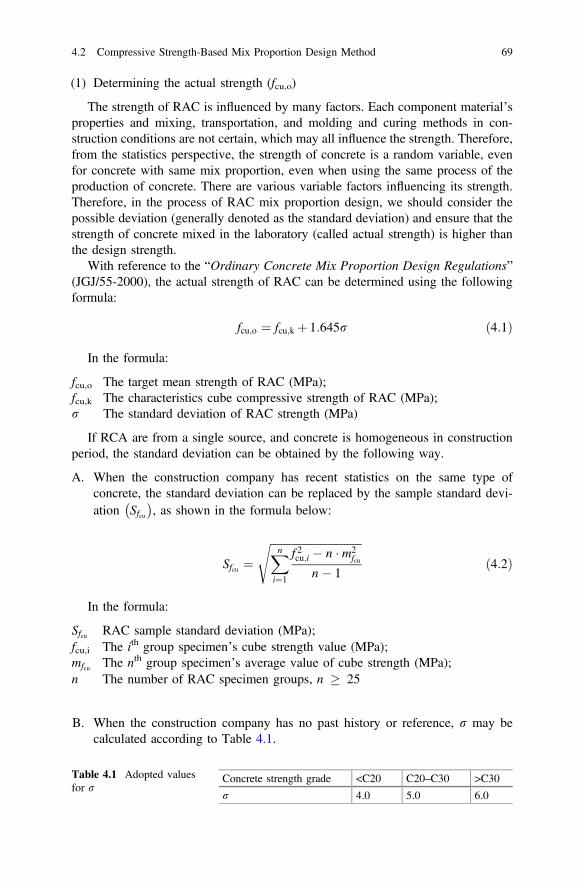
(1) Determining the actual strength (fcu,o)
The strength of RAC is influenced by many factors. Each component material’sproperties and mixing, transportation, and molding and curing methods in con-struction conditions are not certain, which may all influence the strength. Therefore,from the statistics perspective, the strength of concrete is a random variable, evenfor concrete with same mix proportion, even when using the same process of theproduction of concrete. There are various variable factors influencing its strength.Therefore, in the process of RAC mix proportion design, we should consider thepossible deviation (generally denoted as the standard deviation) and ensure that thestrength of concrete mixed in the laboratory (called actual strength) is higher thanthe design strength.
With reference to the “Ordinary Concrete Mix Proportion Design Regulations”(JGJ/55-2000), the actual strength of RAC can be determined using the followingformula:
fcu;o ¼ fcu;k þ 1:645r ð4:1Þ
In the formula:
fcu,o The target mean strength of RAC (MPa);fcu,k The characteristics cube compressive strength of RAC (MPa);r The standard deviation of RAC strength (MPa)
If RCA are from a single source, and concrete is homogeneous in constructionperiod, the standard deviation can be obtained by the following way.
A. When the construction company has recent statistics on the same type ofconcrete, the standard deviation can be replaced by the sample standard devi-ation Sfcu
� �, as shown in the formula below:
Sfcu ¼ffiffiffiffiffiffiffiffiffiffiffiffiffiffiffiffiffiffiffiffiffiffiffiffiffiffiffiffiffiffiffiffiffiXni¼1
f 2cu;i � n � m2fcu
n� 1
sð4:2Þ
In the formula:
Sfcu RAC sample standard deviation (MPa);fcu,i The ith group specimen’s cube strength value (MPa);mfcu The nth group specimen’s average value of cube strength (MPa);n The number of RAC specimen groups, n � 25
B. When the construction company has no past history or reference, r may becalculated according to Table 4.1.
Table 4.1 Adopted valuesfor r
Concrete strength grade <C20 C20–C30 >C30
r 4.0 5.0 6.0
4.2 Compressive Strength-Based Mix Proportion Design Method 69

(2) Preliminary calculations for w/c ratio and water usage
(1) Introduction of the RAC water usage and w/c ratio
The water absorption of RCA varies depending on its source. Therefore, thewater usage of RAC is different from that of NAC and additional water absorbed byRCA should not be ignored. The RAC water usage and its w/c ratio can be dividedby 2 conditions: net water content and net w/c ratio, overall water content andoverall w/c ratio. The so-called net water content refers to the water usage inconcrete which does not includes the water absorbed by RCA, and its related w/cratio is called the net w/c ratio. The overall water content, on the other hand, is theconcrete water content that includes the absorbed water, and the related w/c ratio.
Since water absorption varies with the properties of RCA, in mix proportiondesign of RAC, the w/c ratio used is net water content or net w/c ratio. The overallwater content and overall w/c ratio are only used in the case where the recycled fineaggregates (RFA) are used, that is because the recycled fine aggregates’ waterabsorption is difficult to be considered into calculation.
(2) Calculations for water content or w/c ratio
According to the desired RAC strength fcu; o which is already determined and theactual strength of concrete or concrete strength grade, using concrete formula, thenet w/c ratio value can be calculated as follows:
ðw=cÞ0 ¼ Afcefcu; o þABfce
ð4:3Þ
In the formula:
(w/c)′ Net w/c ratio;A, B Coefficient;fce 28d cement strength value (MPa).
The coefficients A and B are adopted 0.46 and 0.07 respectively, as indicated inthe Chinese code “Ordinary Concrete Mix Proportion Design Regulations” (JGJ55-2000). If there is no 28d cement strength value, the fce in the formula (4.3) canbe calculated as follows:
fce ¼ cc � fce;g ð4:4Þ
In the formula:
cc Concrete strength grade’s surplus coefficient, this is taken for reference;fce,g Concrete strength grade (MPa).
Considering that the mechanical and durability properties of RAC are lower thanthose of NAC, when calculating the mix proportion design using the above formula,adopt a less value of net w/c ratio than the value obtained in the calculation bybetween 0.01 and 0.05 (adopt a larger one if the the replacement percentage ofRCA is larger). And this should be taken as the final net w/c ratio.
70 4 Recycled Aggregate Concrete

Due to the construction requirements, for the slump and the largest RCA particlesize, referred in “Ordinary Concrete Mix Proportion Design Regulations”(JGJ/55-2000), the water content can be determined with Table 4.2. Considering thelarger water absorption of RCA, 10L or 5% of water can be added to obtain final netwater content (mwn).
According to the actual testing results of the RCA water absorption rate, theadditional water usage (mwa) per 1 m3 of concrete can then be determined. The totalcontent of the net water and additional water is the total water content per 1 m3 ofconcrete (mwt), hence:
mwt ¼ mwn þmwa
mwa ¼ r � mg �Wwg
�ð4:5Þ
In the formula:
mwt Total water content of RAC (kg/m3);mwn Net water usage of RAC (kg/m3);mwa Additional water content of RAC (kg/m3);mg Amount of RCA in RAC (kg/m3);Wwg Water absorption of RCA (%);r RCA replacement percentage (%).
(3) Calculating the cement usage amount in 1 m3 of RAC
The cement usage (mc) can be calculated using the determined w/c ratio and thenet water content (mwn).
mc ¼ mwn
w=cð4:6Þ
Table 4.2 Net water content for RAC
Mixing consistency Largest RCA particle size
Item Index 10 20 31.5 40
Slump (mm) 10–30 210 195 185 175
35–50 220 205 195 185
55–70 230 215 205 195
75–90 240 225 215 205
Note 1. The water content in above Table is the mean value when medium-grained sand is used asthe fine aggregate. For silver sand, the water content for one cubic RAC should be increased by 5–10 kg, and the water content should be reduced by 5–10 kg when thick sand is used2. When admixtures are used, the water usage must be adjusted accordingly3. This Table is not applicable when the w/c of RAC is less than 0.4 or higher than 0.8, and whenRAC needs to be specially designed. In these cases, the water usage must be determined aftercarrying out related tests
4.2 Compressive Strength-Based Mix Proportion Design Method 71

(4) Selecting the suitable sand amount (SP)
Using the Chinese code “Ordinary Concrete Mix Proportion DesignRegulations” (JGJ 55-2000), the related Tables can be used to select the suitableamounts of sand according to the largest coarse aggregate particle size and the netwater content. The RCA surface is rougher compared to NCAs, therefore, the sandamount should be slightly higher.
When the slump of RAC is between 10 and 60 mm, the sand content can bechosen according the coarse aggregates particle size and w/c ratio shown inTable 4.3.
When the slump of RAC is more than 60 mm, both practical experience andTable 4.3 are feasible to be used to determine the sand content. When Table 4.3 isused, the sand content should be increased by about 1% for every 20 mm increasein slump.
When the slump of RAC is less than 10 mm, practical experience should be usedto determine the sand content.
(5) Calculating the usage of coarse and fine aggregates (mg) and (ms)
According to the net water content, cement content, and sand content, it isadvised to use the volume method to calculate the content of coarse and fineaggregates, as shown by the formulae below:
mcqc
þ mg
qgþ ms
qsþ mwn
qwþ a ¼ 1
Sp ¼ msms þmg
� 100%
(ð4:7Þ
In the formula:
mg Content of RCA per 1 m3 RAC;ms Content of fine aggregates per 1 m3 RAC;qc Cement density (kg/m3);qs Fine aggregates’ density (kg/m3);qw Water density (kg/m3), 1000 kg/m3 is generally adopted;a Percentage amount of air contained in RAC, when there are no gas admixtures
used, adopt a as 1%qg Coarse aggregates’ density (kg/m3)
Table 4.3 Sand amount inrecycled aggregate concrete
w/c ratio Largest coarse aggregates particle size
16 20 40
0.40 33–38 32–37 30–34
0.50 36–41 35–40 33–38
0.60 39–44 38–43 36–41
0.70 42–47 41–46 39–44
72 4 Recycled Aggregate Concrete

The apparent density of coarse and fine aggregates (qN, qR, qS) must be inaccordance with the approved standards “Standards for sand and gravel usage andinspection of ordinary concrete” (JGJ52-2006)and “The technical specification forthe application of recycled aggregate concrete” (DG/TJ08-2018-2007).
The coarse aggregates’ apparent density is determined by the following formula:
qeq ¼qNqR
rqN þð1� rÞqRð4:8Þ
In the formula:
qeq Equivalent apparent density of coarse aggregates (kg/m3);qN Apparent density of NCA (kg/m3);qR Apparent density of RCA (kg/m3);r The replacement percentage of the RCA
(6) The design, adjustment, and calculation of the mix proportion
The Chinese code “Ordinary Concrete Mix Proportion Design Regulations”(JGJ/55—2000) can be used for reference.
4.3 Durability-Based Mix Proportion Design Method
4.3.1 Review
During the 1980s and 1990s, the realization of high-performance concrete goalshowed the advancement of the concrete industry, and at the same time, it showedthe modern concrete technical performance for modern engineering projects.High-performance concrete possesses good stability, durability, workability, andhigh strength. When compared with NAC with the same mix proportion, RAC haslow durability and strength. Therefore, high-performance concrete is an inevitabletrend of RAC’s development. The technique for the preparation ofhigh-performance concrete is the optimized selection of raw materials, based on thefour ordinary concrete gredients (water, cement, sand and gravel), the addition ofdouble-mixing superplasticizer (highly effective admixture) and active mixingmaterials.
4.2 Compressive Strength-Based Mix Proportion Design Method 73

4.3.2 Design Program
(1) The object of the durability-based mix proportion design
(1) First of all, the needed durability properties must be satisfied which mayinclude the properties like freezing resistance, impermeability, carbonationresistance, and volume stability.
(2) It must satisfy the basic requirement of strength property for high-performanceconcrete.
(3) It must satisfy the workability properties of high-performance concrete, whichshould have higher fluidity, pump-ability, no segregation and bleeding ofaggregate and water respectively, etc. Which are the key factors in casting ofconcrete.
(2) The selected parameters of the durability-based mix proportion design
The mix proportion of high-performance concrete involves water–binder ratio,cement–aggregates ratio, and highly effective admixtures.
(1) Water–binder ratio
Low water–binder ratio is one of the characteristics of high-performance con-crete. In order to achieve a low permeability of RAC and maintain durabilityproperties, the water–binder ratio of high-performance concrete made with RCA isusually less than 0.4. When the water–binder ratio is very low (� 0.4), any slightchange in the water–binder ratio may cause a major increase in the overall concretestrength, and therefore, strict control of the water–binder ratio is necessary from theviewpoint of high-performance concrete’s quality. Table 4.4 may be used as ref-erence for the selection of the water–binder ratio for the high-performance concretemade with RCA, and mineral admixtures are used to adjust the strength.
(2) Cement–aggregates ratio
The proportion of the cement and aggregates is defined as the cement–aggre-gates ratio. Mehta [5] and Aitein [6] reported that when suitable aggregates areused, fixed cement–aggregates volume of 35:65 can solve the strength, workability,and dimensions stability (elastic module, dry shrinkage, and creep) issues very well,and achieving an ideal high-performance concrete. According to experience, thebinder material in high-performance concrete made with RCA should not exceed550 kg/m3. As the RAC strength grade decreases, the overall binder materialsshould be relatively decreased as well. The usage of cement should be reduced as aresult and substituted by mineral admixtures with a low dry shrinkage. This helps inreducing the heat production and dry shrinkage of RAC. In order to maintain the
Table 4.4 Recommended water–binder ratio for high-performance RAC
Recycled aggregate concrete strength grade C50 C60
Water–binder ratio 0.37–0.33 0.34–0.30
74 4 Recycled Aggregate Concrete
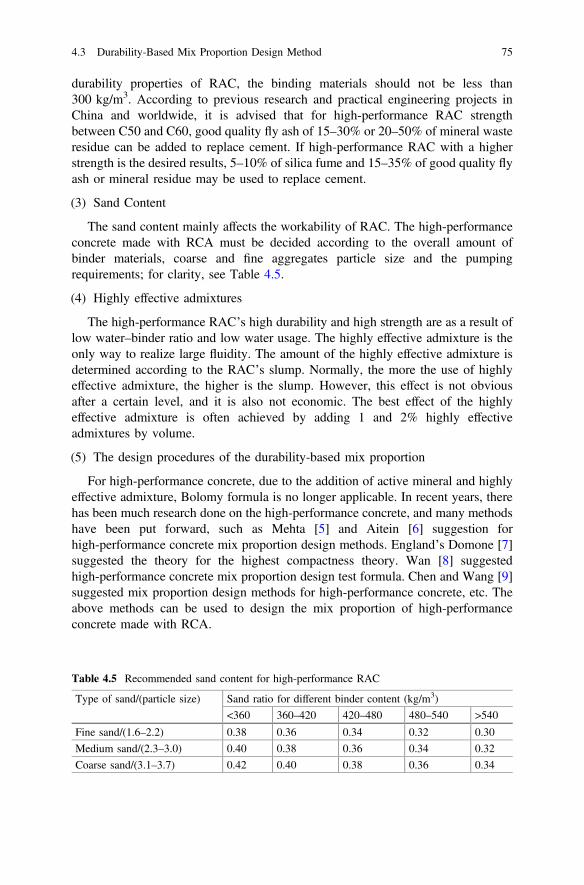
durability properties of RAC, the binding materials should not be less than300 kg/m3. According to previous research and practical engineering projects inChina and worldwide, it is advised that for high-performance RAC strengthbetween C50 and C60, good quality fly ash of 15–30% or 20–50% of mineral wasteresidue can be added to replace cement. If high-performance RAC with a higherstrength is the desired results, 5–10% of silica fume and 15–35% of good quality flyash or mineral residue may be used to replace cement.
(3) Sand Content
The sand content mainly affects the workability of RAC. The high-performanceconcrete made with RCA must be decided according to the overall amount ofbinder materials, coarse and fine aggregates particle size and the pumpingrequirements; for clarity, see Table 4.5.
(4) Highly effective admixtures
The high-performance RAC’s high durability and high strength are as a result oflow water–binder ratio and low water usage. The highly effective admixture is theonly way to realize large fluidity. The amount of the highly effective admixture isdetermined according to the RAC’s slump. Normally, the more the use of highlyeffective admixture, the higher is the slump. However, this effect is not obviousafter a certain level, and it is also not economic. The best effect of the highlyeffective admixture is often achieved by adding 1 and 2% highly effectiveadmixtures by volume.
(5) The design procedures of the durability-based mix proportion
For high-performance concrete, due to the addition of active mineral and highlyeffective admixture, Bolomy formula is no longer applicable. In recent years, therehas been much research done on the high-performance concrete, and many methodshave been put forward, such as Mehta [5] and Aitein [6] suggestion forhigh-performance concrete mix proportion design methods. England’s Domone [7]suggested the theory for the highest compactness theory. Wan [8] suggestedhigh-performance concrete mix proportion design test formula. Chen and Wang [9]suggested mix proportion design methods for high-performance concrete, etc. Theabove methods can be used to design the mix proportion of high-performanceconcrete made with RCA.
Table 4.5 Recommended sand content for high-performance RAC
Type of sand/(particle size) Sand ratio for different binder content (kg/m3)
<360 360–420 420–480 480–540 >540
Fine sand/(1.6–2.2) 0.38 0.36 0.34 0.32 0.30
Medium sand/(2.3–3.0) 0.40 0.38 0.36 0.34 0.32
Coarse sand/(3.1–3.7) 0.42 0.40 0.38 0.36 0.34
4.3 Durability-Based Mix Proportion Design Method 75
4.4 Other Mix Proportion Design Methods
4.4.1 Volumetric Design Method
Due to the development of concrete’s sustainable technology, people have not onlyused concrete’s structural behaviors, but also been gradually pursuing its functions,ecology, capacity and other properties. Non-sand porous permeable concrete hasbeen one of the important products for ecological functions in China and world-wide. It has high permeability and high porosity and can be widely used in pave-ment construction, offshore station, treating sewage water, and sound absorbingmaterials. Therefore, non-sand porous permeable RAC has a wide area to beapplied in the future. In the following sections, the design methods for permeableRAC are discussed.
Currently, designers or researchers in China and worldwide who are designingpermeable concrete often refer to the table, graphs, and calculation formulae, whichare not precise enough, leading to a waste of materials. Here is an introduction ofthe volumetric method, and its principle is as follows: The coarse aggregates undertight accumulation, with a suitable addition of binder material, and the surfaces arewell packed together, after hardening it will form a continuous structure with manyvoids. These voids remain in concrete are the designer’s targeted voids. As to thedesign of the mix proportion with permeability properties, water content of theaggregates, w/c, cement content, etc. should be take into consideration.
(1) Water/Cement ratio (w/c)
The w/c affects the strength of permeable RAC, and it also influences the per-meability. Different particle size and shape of aggregates have to determine dif-ferent w/c ratio. When the w/c is very small, the mortar will be very thick, and itsworkability will be poor. The mortar cannot properly surround surface of theaggregates, and it has no benefits to improve strength. On the contrary, if the w/cratio is very high, the mortar will be very dilute, and the mortar will be washedaway from the aggregates’ surface. The mortar layer on the coarse aggregates willbe thin. It also has no advantage for strength. At the same time, due to its highfluidity, the mortar may block part of or all the voids. Therefore it deteriorate bothstrength and permeablity of concrete. The best w/c ratio ranges from 0.25 to 0.35.
(2) Cement content
The cement content is determined according to filling 25–50% of aggregates’volume porosity in the coarse aggregates with binder materials.
(3) The initial mix proportion of the permeable RAC is firstly determinedaccording to the above principles. The final mix proportion will be determinedby lab test.
76 4 Recycled Aggregate Concrete

4.4.2 Application of Computers in the Design of the MixProportion
Computer technology has now been developing rapidly, promoting a huge changeand development in traditional concrete industry. The integration of each and everyindustry with computer technology plays a very important role in development.In RAC materials and mix proportion design, Wu and Lian [10] and De Larrard[11] had pointed out that the influence of the integration of computers with mixproportion and construction on the quality of the mix proportion design and con-struction is one of the main areas of development for concrete engineering.
The artificial intelligence method is an area which was developed in the middleof the twentieth century. The expert’s system application is a branch of the artificialintelligence, is a computer program system which under certain areas can be used tosolve difficult problems with human knowledge and experience to give a prepro-cessing, design and consultative results.
USA developed its first building material expert system in the 1980s. In China,Hu et al. [12] studied and developed high-performance concrete expert system with3 main parts: the mix proportion design, mix proportion modification, and mixproportion adjustments. Zhang et al. [13] established the expert system and realizedthe computer-aided concrete mix proportion design by using the concrete qualityinspection in computer management.
4.4.3 Application of Artificial Neural Network
The neural network is another branch of the artificial intelligence method, and it hasmade such a progress in the last decades in the field of civil engineering andbuilding materials with successful achievements in application. The neural networkhas strong self-organized, studying, and self-fitting abilities. The system also pos-sesses a strong fault tolerance and associated memory storage functions.
4.4.4 Application of Artificial Neural Network ExpertSystem
During the research and development of expert system and neural network, manyuseful results have been achieved, but at the same time, there exists many draw-backs. The expert system still needs to be studied further and promoted. It still haspoor explanation abilities and knowledge acquisition bottlenecks. But the neuralnetwork has a large volume in providing the user with evidence and explaining thesolution. The integration of the expert system and the neural network forms theneural expert system. It is a new intelligence system which uses neural network toform a knowledge database, thereby realizing the integration of the 2 artificial
4.4 Other Mix Proportion Design Methods 77

intelligence by complementing each other, and solving problems close to humanbrain solutions. The function requirements are very huge compared to single expertsystem or single neural network system. This type of system integrated withcomputer simulations can greatly reduce laboratory mixing of materials, handlingof knowledge and data, and simulation of the concrete properties. The neural expertsystem will be applied in optimization of RAC mix proportion design and qualitycontrol. Because of saving materials and improving production capacity, the neuralnetwork expert system will have a big economic significance and wide area ofapplication; therefore, it is worthy to be studied in the future.
4.5 Microstructure of RAC
4.5.1 Micro-Composition of RAC
One of the core areas of modern materials science is the investigation of therelationship between microstructure and structural behavior. When studying theNAC microstructure, there has been an extension from a two-phase point of view(aggregates and mortar) to a three-phase point of view (aggregates, mortar, andinterfacial transition zone (ITZ)). There has been extensive research which hasshown that some problems in concrete can only be better explained and solvedthrough the ITZ; using the three-phase point of view to study the mechanical anddurability properties of concrete can be a much precise way to obtain results. Theinner structure of RAC is highly unevenly distributed compared with NAC and hashigh degree of randomness. This section will introduce the composition of recycledconcrete microstructure, the effect of each composition on the properties of RAC,and integrating the characteristics of RAC’s tensile strength and compressivestrength, and in overall outlining the failure mechanism of RAC.
As mentioned above, the current used RAC is made of cement, water, naturalcoarse aggregates, and recycled coarse aggregates. With proper mix design, mixingall the above-mentioned ingredients, and followed by a series of both physical andchemical reactions, the recycled concrete will consist of hydration of cement paste,sand, natural aggregates, recycled aggregates, new ITZ (the interface betweenaggregates and new mortar) and old ITZ (the interface zone between the originalnatural aggregates and old cement paste in RCA). With an extensive analysis, thenew interface can be divided into: (1) interface between natural aggregates and newcement paste, (2) interface between recycled coarse aggregates’ rock side and newcement paste, and (3) the interface between recycled aggregates with old mortarsection and new cement paste (see Fig. 4.1).
Through experimental investigation, it was discovered that failure section ofNAC will normally be through the ITZ (high-strength concrete may have crack-ing of coarse aggregates). Reference shows that the interface between coarseaggregates and cement paste plays a role in determining the strength of RAC [14].The failure pattern of RAC is also generally through the ITZ, but due to the fact thatRAC has low strength and its inner structure has damage and micro-cracks, ittherefore also has damage among RCA.
78 4 Recycled Aggregate Concrete

The failure of RAC is similar to that of NAC, beginning with the appearance ofmicro-cracks, further development of the micro-cracks along the ITZ. This will alsodepend on the position of aggregates and cement paste strength to a certain extent;therefore, the strength of RAC is highly related to the characteristics of the ITZ. Allthe interface mechanical properties of RAC are poor, and they are easily influenced,thereby leading to its lower strength when compared to NAC.
In summary of the above, in order to study the microstructure of RAC, a betterunderstanding of ITZ should be developed, based on this background, influence ofinterface on the concrete properties can be studied.
4.5.2 SEM Testing
According to the current research of NAC and RAC, weak points of the mechanicaland durability properties of the ITZ have been analyzed as follows:
(1) The elastic modulus of RCA and cement paste is different. There is a con-centration of stress along the interface between RCA and cement paste, whichleading to a concentration of force in concrete. RCA have low strength and lowelastic modulus properties. Therefore, this weakness may lead to stressconcentration.
(2) During cement paste hardening, there will be shrinkage caused. Aggregateswill have a limit effect on the shrinkage of cement paste, and initial stress willform on the interface and may even form micro-cracks.
(3) There will be heat produced during the hydration process of cement, since it isan exothermic reaction. The aggregates and the cement paste’s expansion factorare different, and this will also lead to initial stress within ITZs.
(4) Cement hydration produces calcium hydroxide (Ca(OH)2), while the ITZbetween coarse aggregates and cement paste will later have a calciumhydroxide concentration phenomenon. Therefore, the aggregates and the
Fig. 4.1 Demonstration of the micro-structure of recycled concrete
4.5 Microstructure of RAC 79
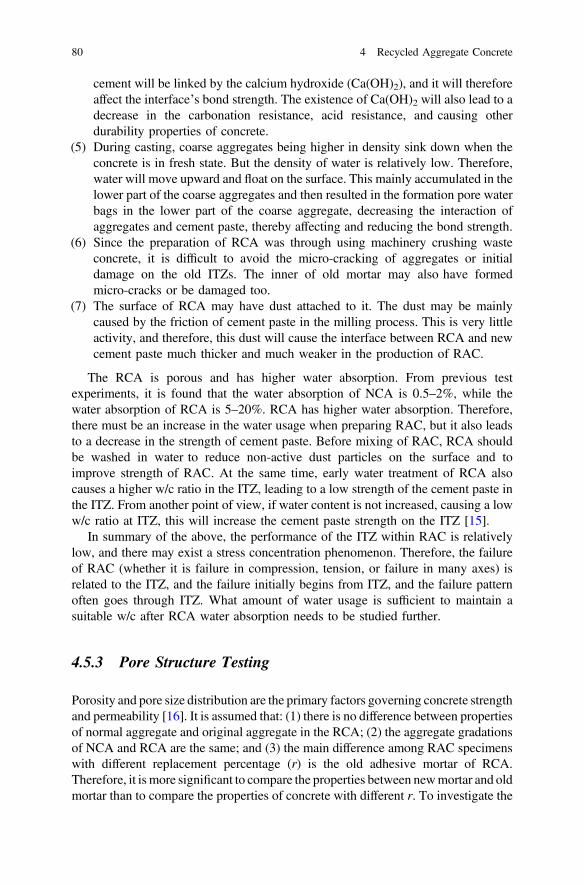
cement will be linked by the calcium hydroxide (Ca(OH)2), and it will thereforeaffect the interface’s bond strength. The existence of Ca(OH)2 will also lead to adecrease in the carbonation resistance, acid resistance, and causing otherdurability properties of concrete.
(5) During casting, coarse aggregates being higher in density sink down when theconcrete is in fresh state. But the density of water is relatively low. Therefore,water will move upward and float on the surface. This mainly accumulated in thelower part of the coarse aggregates and then resulted in the formation pore waterbags in the lower part of the coarse aggregate, decreasing the interaction ofaggregates and cement paste, thereby affecting and reducing the bond strength.
(6) Since the preparation of RCA was through using machinery crushing wasteconcrete, it is difficult to avoid the micro-cracking of aggregates or initialdamage on the old ITZs. The inner of old mortar may also have formedmicro-cracks or be damaged too.
(7) The surface of RCA may have dust attached to it. The dust may be mainlycaused by the friction of cement paste in the milling process. This is very littleactivity, and therefore, this dust will cause the interface between RCA and newcement paste much thicker and much weaker in the production of RAC.
The RCA is porous and has higher water absorption. From previous testexperiments, it is found that the water absorption of NCA is 0.5–2%, while thewater absorption of RCA is 5–20%. RCA has higher water absorption. Therefore,there must be an increase in the water usage when preparing RAC, but it also leadsto a decrease in the strength of cement paste. Before mixing of RAC, RCA shouldbe washed in water to reduce non-active dust particles on the surface and toimprove strength of RAC. At the same time, early water treatment of RCA alsocauses a higher w/c ratio in the ITZ, leading to a low strength of the cement paste inthe ITZ. From another point of view, if water content is not increased, causing a loww/c ratio at ITZ, this will increase the cement paste strength on the ITZ [15].
In summary of the above, the performance of the ITZ within RAC is relativelylow, and there may exist a stress concentration phenomenon. Therefore, the failureof RAC (whether it is failure in compression, tension, or failure in many axes) isrelated to the ITZ, and the failure initially begins from ITZ, and the failure patternoften goes through ITZ. What amount of water usage is sufficient to maintain asuitable w/c after RCA water absorption needs to be studied further.
4.5.3 Pore Structure Testing
Porosity and pore size distribution are the primary factors governing concrete strengthand permeability [16]. It is assumed that: (1) there is no difference between propertiesof normal aggregate and original aggregate in the RCA; (2) the aggregate gradationsof NCA and RCA are the same; and (3) the main difference among RAC specimenswith different replacement percentage (r) is the old adhesive mortar of RCA.Therefore, it ismore significant to compare the properties between newmortar and oldmortar than to compare the properties of concrete with different r. To investigate the
80 4 Recycled Aggregate Concrete

changes in the pore structure of concrete with varied r, mercury intrusion porosimetry(MIP) testing was performed on the new and old mortar. To select the newmortar andold mortar, several specimens were cut into many pieces (see Fig. 4.2). To clearlyobserve the distribution of aggregate and mortar, four pieces of concrete specimenwere taken from water and stand sideways on the desk simultaneously (see Fig. 4.3).The specimen with r of 0% looks slightly dry due to the reason that: (1) NCA isdifficult to absorb water, and (2) NAC is relatively denser than RAC, in which thereinduces slightly less water in NAC than that in RAC. The color of the old mortar islighter than new mortar, as can be readily seen in Fig. 4.3. The MIP instrument isAutoPore IV 9500 V1.07, and the testing process is shown in Fig. 4.4.
(a) R= 0% (b) R=34%
(c) R= 67% (d) R=100%
Fig. 4.3 Cross-sectionalview with different r
Fig. 4.2 Concrete specimens
4.5 Microstructure of RAC 81

(a) Installing instruments (b) Observing test
Fig. 4.4 MIP instrument
Fig. 4.5 Distribution of pore structures
The values of the pore size obtained by MIP are shown in Fig. 4.5. This figureindicates that the total intruded volume of mercury per gram of the old mortar islarger than that of the new mortar for a given pressure (psia). The differentialintrusion of the old mortar is also bigger than that of the new mortar for a givenpore size diameter, which may mean that the chloride is more likely to penetrateinto the old mortar than into the new mortar. Furthermore, the old mortar contentcan increase with the increase in r. And the chloride penetration ability may alsoincrease with the increase in r.
4.6 ITZ Nanoindention
4.6.1 Testing Preparation
4.6.1.1 Materials
The specific gravity and the water absorption capacity of these RCA were 2.41 and5.51%, respectively. Most of NCA in the RCA were limestone. Two different
82 4 Recycled Aggregate Concrete

RACs were mixed and investigated in this study (Table 4.6). One was preparedwith a w/c ratio of 0.42 (noted as RAC I). The Type I Portland cement content was246 kg/m3, and the class C fly ash content was 61 kg/m3. To improve the quality ofRAC, a two-stage mixing approach (TSMA) was applied when preparing this RAC[17]. During mixing, the required water was proportionally split into two parts thatwere added at different timing. The TSMA procedures can generate a thin layer ofcement slurry on the surfaces of the RCA, which would permeate into the pores,voids, and cracks in the residual mortar. The samples were cured under 25 °C and55% relative humidity laboratory conditions.
The other RACs used in this study had a w/c ratio of 0.45, where the type IPortland cement, water and river sand were applied (noted as RAC II). The sampleswere also cured under the same condition as RAC I.
The old ITZ represents the interfaces between the NCA and old paste matrix inoriginal crushed concrete, and the new ITZs are those interfaces around RCA (here,the aggregates consist of old cement paste in particular) in newly cast concrete(Fig. 4.6).
4.6.1.2 Sample Preparation
Since the microstructure of cementitious materials can easily be damaged bygrinding and polishing, it is essential to fill the pores of the sample with epoxy resinimpregnation prior to grinding and polishing. When epoxy-hardened, it stabilizes
Table 4.6 Mix proportions of RAC I and RAC II
w/c ratio kg/m3 MixingapproachWater Cement Fly ash Sand Recycled aggregate
RAC I 0.42 129 246 61 854 978 TSMA
RAC II 0.45 200 444 0 702 1054 TSMA
Note TSMA means two-stage mixing approach
Fig. 4.6 Schematic diagramof old and new ITZs in RAC
4.6 ITZ Nanoindention 83

the microstructure and enables it to withstand the stresses of grinding and polishingwithout any alternations. For the impregnation, the concrete slice was first placed ina diameter of 38.1 mm blue rubber mold. The vacuum to the chamber was thenreleased, allowing atmospheric pressure to facilitate impregnation. The mold wasthen removed from the vacuum chamber and cured for 12 h in an oven at 70 °C.
The biggest challenge and critical step in preparing RAC slices for nanoinden-tation is to polish the sample to provide a smooth and flat surface, while minimizingthe sample disturbance [18].
There are three primary goals for surface grinding and polishing: (1) to achievesurfaces as flat as possible, (2) to obtain repeatable results, and (3) to minimize thesample disturbance. The procedure described here was optimized to satisfy thesegoals:
(a) The sample was initially ground on Buehler–Met II paper disks with gradationof grits 280 (51.8 lm), 800 (22.1 lm), 1200 (14.5 lm), and 1500 (12.2 lm),respectively. Water was used as the cooling medium and lubricant.Approximate grinding time on each gradation was 5 min. The sample was thencleaned in ethanol in an ultrasonic cleaner before further polishing.
(b) After much trial and error with a variety of polishing compounds and polishingmats, one combination can provide a repeated success by lengthy polishingunder light load. An auto-polisher was used with diamond suspensions inethanol with gradation of 9 lm, 6 lm, and 3 lm. The relatively slow lappingspeed minimized the sample disturbance and created a smooth surface. Eachstep lasted approximately 30 min. In the following steps, diamond lappingfilms from Allied High Tech Products Inc. with gradations of 3 lm, 1 lm and0.5 lm were used. The hardness of diamond lapping film can assure that thehigher surfaces of the sample are removed first and the perforation gives a placefor the polishing residue to collect without interfering with the polishing itself.In these steps, manual and semiautomated polishing was used. The ethanol wasused as the cooling medium, and each polishing step lasted approximately30 min.
(c) An ultrasonic bath cleaning in ethanol was performed for 10 min to remove alldust and diamond particles. After polishing, the surface quality was confirmedusing a microscope and then, the sample was stored in a small air-tightcontainer.
The degree to which the RAC can be polished for nanoindentation studies isassociated with the microstructure heterogeneity. On the microscale, RAC iscomposed of several relatively hard phases (natural aggregate, quartz and unhy-drated cement particles) surround by old paste matrix and new paste matrix. Athigher magnification, many different phases of RAC can be observed by opticalmicroscopy (Fig. 4.7).
84 4 Recycled Aggregate Concrete

4.6.1.3 Nanoindentation Details
Hysitron Triboindenter fitted with a Berkovich tip (tip radius of 0.6 lm, angle of142.3°) was used to determine the nanomechanical properties of the ITZs in RAC.Each load/displacement diagram was plotted and inspected for signs of problemsdue to surface roughness, such as abnormal or discontinuous shapes. For mostsamples, the maximum indentation depth was found to be approximately 850 nm.Figure 4.8 presents load–depth curves of different phase in ITZ and the image ofindent mark on the calcium silicate hydrate (C–H–S) gel after nanoindentationcaptured with indenter tip of the triboindenter. The trapezoidal load functions whichincluded single-cycle and multiple-cycle loads were used in this study. It is foundthat multiple cycles of partial loading and unloading lead to minimizing of theshort-term creep and size effect [19].
(a) Old ITZ (b) New ITZ
Fig. 4.7 Optical microscopic images of RAC ITZs after polishing
0 100 200 300 400 500 600 700 800 9000
200
400
600
800
1000
1200
Load
(uN
)
Depth (nm)
Porosity C-S-H CH Unhydrated cement
(a) Load-depth diagrams of different phases
(b) Indent mark on C-S-H
Fig. 4.8 Typical indentation in ITZs of RAC
4.6 ITZ Nanoindention 85

All tests were programmed in a multi-cycle loading way that the indenter cameinto contact with the sample surface with the load increased at a constant rate of120 lN and the maximum load was 1200 lN. Normally, grid indentation is amethod to perform large number of indents on the sample. Statistical analysis ofthese data obtained from grid indentation provides information about the overallnanomechanical properties of the sample and volume fractions of different phasesinvolved. In this study, indentation with in situ imaging was used to determine thelocal nanomechanical properties at specific locations of the sample.
A typical indentation load and indentation displacement curve includes peakindentation load (Pmax), indentation depth at peak load (hmax), and final depth of thecontact impression after unloading (hf). As to the penetration of elastic half spaceby an axisymmetric indenter of arbitrary smooth profile, by applying a continuumscale model, the initial unloading stiffness S = dp/dh is given as follows:
S ¼ dpdh
¼ 2ffiffiffip
p Er
ffiffiffiA
pð4:9Þ
where A is the projected contact area at the peak load; Er is the reduced elasticmodulus, given by:
1Er
¼ ð1� v2ÞE
þ ð1� v2i ÞEi
ð4:10Þ
where E and v are Young’s modulus and Poisson’s ratio of the sample respectively,and Ei and vi are the same parameters of the indenter. For the indenter used in thepresent experiment, the elastic modulus Ei = 1140 GPa and the Poisson’s ratiovi = 0.07. Then, the elastic modulus E of the sample can be calculated as follows:
E ¼ ð1� v2Þ � 1Er
� ð1� v2i ÞEi
� ��1
ð4:11Þ
If the Poisson’s ratio v of the sample is given, the elastic modulus E of thesample can be obtained. The suggested Poisson’s ratio for RAC is v = 0.2, whichwas used in this study to calculate E in Eq. (4.11).
The hardness H has the definition as follows:
H ¼ Pmax
Að4:12Þ
The studied areas were taken randomly within old ITZs and new ITZs in RACthat are around aggregates with similar sizes. The spacing between the indents was5 and 10 lm in the lateral and vertical direction, respectively. The indent areas forold and new ITZs had the dimensions of 100 � 100 lm and 150 � 100 lm,respectively, as shown in Fig. 4.9. The distributions of nanomechanical propertieswere obtained with the distance starting at natural aggregate surrounded by old ITZ
86 4 Recycled Aggregate Concrete

or old paste aggregate surrounded by new ITZ. In this study, the distributions ofindentation modulus were used as a basis for the characterizations of old ITZ andnew ITZ respectively, such as ITZ thickness.
4.6.2 Grid Nanoindentation Results
For the RAC I sample at 90 days, areas on the sample that contained old and newITZs were chosen for indentation (Fig. 4.10a, b). The ITZs around limestoneaggregates with 20 mm diameters were chosen for indentation. Figure 4.10c, dshows the contour maps of indentation modulus of old and new ITZs, respectively.The deep blue and black areas have the lowest moduli, which indicate relativelyweaker zones in the RAC. The results also show that these blue and black areas aredistributed in the regions between NCAs and old paste matrix, as well as betweenold paste matrix and new paste matrix. This is an important indication of theexistence of old ITZ and new ITZ in RAC.
Figure 4.10e, f shows the indentation modulus distributions with the distancesacross old ITZ and new ITZ, respectively. The porosity and CH can be concentratedwhen approaching the aggregate surface and old paste matrix in both old and newITZs due to the wall effect. This may cause the variation of the indentation modulusdistribution that measured along the aggregate surface.
In this study, the ITZ thickness was estimated by locating the place where thereis little variation in indentation modulus with the distance from the NCA (for oldITZ) or old paste aggregate surfaces (for new ITZ), and the indentation modulusdistribution of ITZ seems to become close to those of the paste matrix. For the oldITZ, the thickness of the interfacial zone ranges between 40 lm and 50 lm. Thissupports the ITZ thickness of conventional concrete previously found by other
(a) Across old ITZ (b) Across new ITZ
Fig. 4.9 Schematic view of indented area of old ITZ and new ITZ in RAC
4.6 ITZ Nanoindention 87
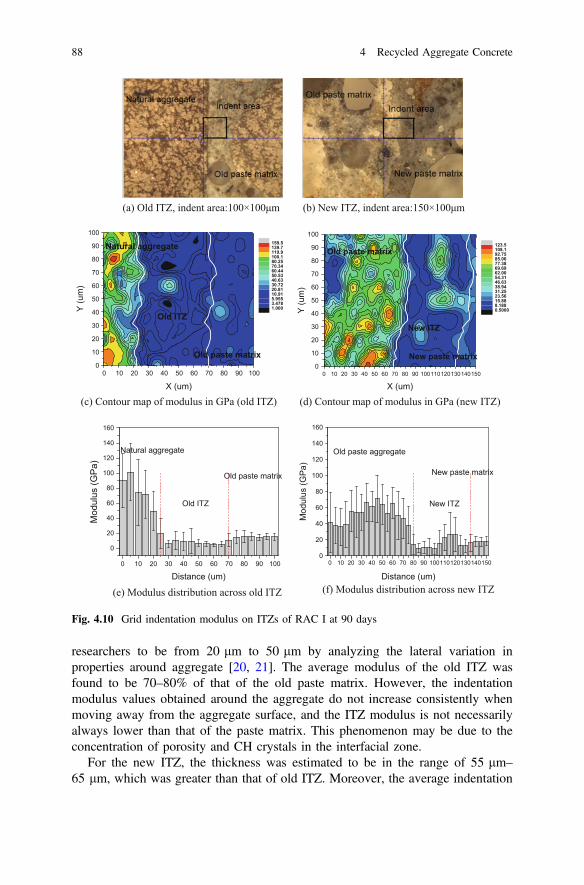
researchers to be from 20 lm to 50 lm by analyzing the lateral variation inproperties around aggregate [20, 21]. The average modulus of the old ITZ wasfound to be 70–80% of that of the old paste matrix. However, the indentationmodulus values obtained around the aggregate do not increase consistently whenmoving away from the aggregate surface, and the ITZ modulus is not necessarilyalways lower than that of the paste matrix. This phenomenon may be due to theconcentration of porosity and CH crystals in the interfacial zone.
For the new ITZ, the thickness was estimated to be in the range of 55 lm–
65 lm, which was greater than that of old ITZ. Moreover, the average indentation
(a) Old ITZ, indent area:100×100μm (b) New ITZ, indent area:150×100μm
0 10 20 30 40 50 60 70 80 90 1000
10
20
30
40
50
60
70
80
90
100
Y (u
m)
X (um)
1.0003.4785.95510.9120.8130.7240.6350.5360.4470.3480.25100.1119.9139.7159.5Natural aggregate
Old ITZ
Old paste matrix
0 10 20 30 40 50 60 70 80 90 1001101201301401500
10
20
30
40
50
60
70
80
90
100
Y (u
m)
X (um)
0.50008.18815.8823.5631.2538.9446.6354.3162.0069.6977.3885.0692.75108.1123.5
Old paste matrix
New ITZ
New paste matrix
(c) Contour map of modulus in GPa (old ITZ) (d) Contour map of modulus in GPa (new ITZ)
0 10 20 30 40 50 60 70 80 90 100
0
20
40
60
80
100
120
140
160
Mod
ulus
(GP
a)
Distance (um)
Natural aggregate
Old ITZ
Old paste matrix
0 10 20 30 40 50 60 70 80 90 1001101201301401500
20
40
60
80
100
120
140
160
Mod
ulus
(GP
a)
Distance (um)
Old paste aggregate
New ITZ
New paste matrix
(e) Modulus distribution across old ITZ (f) Modulus distribution across new ITZ
Fig. 4.10 Grid indentation modulus on ITZs of RAC I at 90 days
88 4 Recycled Aggregate Concrete

modulus of new ITZs was found to be approximately 80–90% of that of the newpaste matrix. Similar to the old ITZ, there is no obvious trend for the modulus ofnew ITZ to increase with an increasing distance from the old paste aggregatesurface. However, the indentation modulus of new ITZ appears to be higher thanthat of old ITZ in RAC. This may be because the improved mixing method TSMAcoats the RCA with cement, and further hydration takes place between old pastematrix and new paste matrix.
Figure 4.11a, b shows the contour map of indentation hardness of the old andnew ITZs in RAC I. It is found that the characterization of indentation hardnessdistribution was close to that of indentation modulus. If locating of the place wherethere is little variation in indentation hardness with the distance from the NCA (forold ITZ) and old paste aggregate surfaces (for new ITZ) to estimate the ITZthickness again, the thicknesses of old ITZ and new ITZ obtained from the hardnessdistribution (Fig. 4.11c, d) was also in a good agreement with that from themodulus distribution (Fig. 4.10e, f). On the other hand, the indentation hardness ofold ITZ was found to be roughly 85% of that of old paste matrix, while theindentation hardness of new ITZ was found to be 90% that of new paste matrix.
0 10 20 30 40 50 60 70 80 90 1000
10
20
30
40
50
60
70
80
90
100
Y (u
m)
X (um)
00.51621.0131.5092.0052.5012.9983.4943.9904.4864.9825.4795.9756.9677.960Natural aggregate
Old ITZ
Old paste matrix
0 10 20 30 40 50 60 70 80 90 100 110 120 130 140 1500
10
20
30
40
50
60
70
80
90
100
Y (u
m)
X (um)
00.86881.7382.6063.4754.3445.2136.0816.9507.8198.6889.55610.4312.1613.90
Old paste matrix
New paste matrix
New ITZ
(b) Contour map of hardness in GPa (new ITZ)
0 10 20 30 40 50 60 70 80 90 1000
1
2
3
4
5
6
7
8
Har
dnes
s (G
Pa)
Distance (um)
Natural aggregate
Old ITZ
Old paste matrix
0 10 20 30 40 50 60 70 80 90 100 110 120 130 140 1500
1
2
3
4
5
6
7
8
Har
dnes
s (G
Pa)
Distance (um)
Old paste aggregate
New ITZ
New paste matrix
(c) Hardness distribution across old ITZ (d) Hardness distribution across new ITZ
(a) Contour map of hardness in GPa (old ITZ)
Fig. 4.11 Grid indentation hardness on ITZs of RAC I at 90 days
4.6 ITZ Nanoindention 89

4.6.3 Grid Nanoindentation on Paste Matrix
With the RAC I samples, nanoindentation was also performed at old paste matrixand new paste matrix (Fig. 4.12a, b). The chosen areas for indentation for both oldand new paste matrix were 100 � 100 lm. And the spacing between indents is10 lm in both lateral and vertical directions. Figure 4.12c, d shows the contour
(a) Old paste matrix: 100×100µm (b) New paste matrix:100×100µm
0 10 20 30 40 50 60 70 80 90 1000
10
20
30
40
50
60
70
80
90
100
Old paste matrix
Y (u
m)
0
10
20
30
40
50
60
70
80
90
100
Y (u
m)
X (um)0 10 20 30 40 50 60 70 80 90 100
X (um)
3.6007.52511.4515.3819.3023.2327.1531.0835.0038.9242.8546.7850.7058.5566.40
3.2007.31311.4315.5419.6523.7627.8831.9936.1040.2144.3348.4452.5560.7869.00
New paste matrix
(c) Contour map of indentation modulus in GPa (d) Contour map of indentation modulus in GPa
0
20
40
60
80
100
120
140
160
Old paste matrix
Mod
ulus
(GP
a)
Distance (um)0 10 20 30 40 50 60 70 80 90 100 0 10 20 30 40 50 60 70 80 90 100
0
20
40
60
80
100
120
140
160
New paste matrix
Mod
ulus
(GP
a)
Distance (um)
(e) Modulus in old paste matrix (f) Modulus in new paste matrix
Fig. 4.12 Indentation modulus in old and new paste matrices in RAC I at 90 days
90 4 Recycled Aggregate Concrete
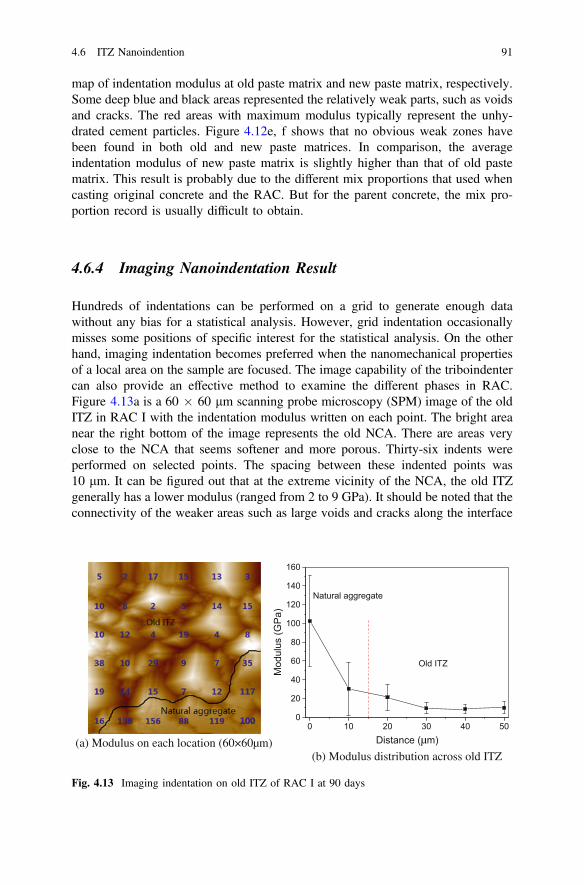
map of indentation modulus at old paste matrix and new paste matrix, respectively.Some deep blue and black areas represented the relatively weak parts, such as voidsand cracks. The red areas with maximum modulus typically represent the unhy-drated cement particles. Figure 4.12e, f shows that no obvious weak zones havebeen found in both old and new paste matrices. In comparison, the averageindentation modulus of new paste matrix is slightly higher than that of old pastematrix. This result is probably due to the different mix proportions that used whencasting original concrete and the RAC. But for the parent concrete, the mix pro-portion record is usually difficult to obtain.
4.6.4 Imaging Nanoindentation Result
Hundreds of indentations can be performed on a grid to generate enough datawithout any bias for a statistical analysis. However, grid indentation occasionallymisses some positions of specific interest for the statistical analysis. On the otherhand, imaging indentation becomes preferred when the nanomechanical propertiesof a local area on the sample are focused. The image capability of the triboindentercan also provide an effective method to examine the different phases in RAC.Figure 4.13a is a 60 � 60 lm scanning probe microscopy (SPM) image of the oldITZ in RAC I with the indentation modulus written on each point. The bright areanear the right bottom of the image represents the old NCA. There are areas veryclose to the NCA that seems softener and more porous. Thirty-six indents wereperformed on selected points. The spacing between these indented points was10 lm. It can be figured out that at the extreme vicinity of the NCA, the old ITZgenerally has a lower modulus (ranged from 2 to 9 GPa). It should be noted that theconnectivity of the weaker areas such as large voids and cracks along the interface
0 10 20 30 40 500
20
40
60
80
100
120
140
160
Mod
ulus
(GPa
)
Natural aggregate
Old ITZ
Distance (µm)(a) Modulus on each location (60×60µm)(b) Modulus distribution across old ITZ
Fig. 4.13 Imaging indentation on old ITZ of RAC I at 90 days
4.6 ITZ Nanoindention 91

influences the mechanical properties of RAC. Figure 4.13b shows that the relativelylower modulus in the vicinity of NCA (around 20 lm–30 lm from the aggregatesurface) has been measured within the old ITZ. It shows that extreme heterogeneityand poor nanomechanical properties exist in old ITZ.
Higher-resolution SPM image with the indentation modulus value obtained fromeach location shows some pores existing in the new ITZ (Fig. 4.14a). Indentationwas performed on 36 selected points. It is observed that the new ITZ had higherporosity in the vicinity of old paste aggregate (dark areas in the figure). Themodulus of the areas with large voids ranged from 3 to 9 GPa. It is also seen that therelatively lower modulus of new ITZ exists at the vicinity of old paste aggregate(around 10 lm–20 lm from the old paste aggregate surface), but no trend ofincreasing modulus with distance moving away from the old paste matrix surfacewas found (Fig. 4.14b). This can tell that new ITZ itself is not a uniform region andthe vicinity of new interface at the old paste aggregate side is a weak part within thenew ITZ region.
4.7 Damage of RAC
Damage refers to the changes (expansion, development, and converging of thematerial inner section leading to macroscopic deterioration of mechanical proper-ties) in the materials of microstructure which may result in cracking or materialfailure due to the effect of the processing of the materials, loading, temperature, orthe environment. From a microscopic and physical point of view, damage is thematerials dislocation of crystal compositions, slip, micro-holes, micro-cracks, andother defects development results; from a macroscopic and continuum mechanicspoint of view, fracture can be an irreversible state microstructure and evolution ofenergy within the material.
0 10 20 30 40 500
20
40
60
80
100
120
140
160
Mod
ulus
(GPa
)
Distance (µm)
New ITZ
Old paste aggregate
(a) Modulus on each location (60×60µm)(b) Modulus distribution across new ITZ
Fig. 4.14 Imaging indentation on new ITZ of RAC I at 90 days
92 4 Recycled Aggregate Concrete
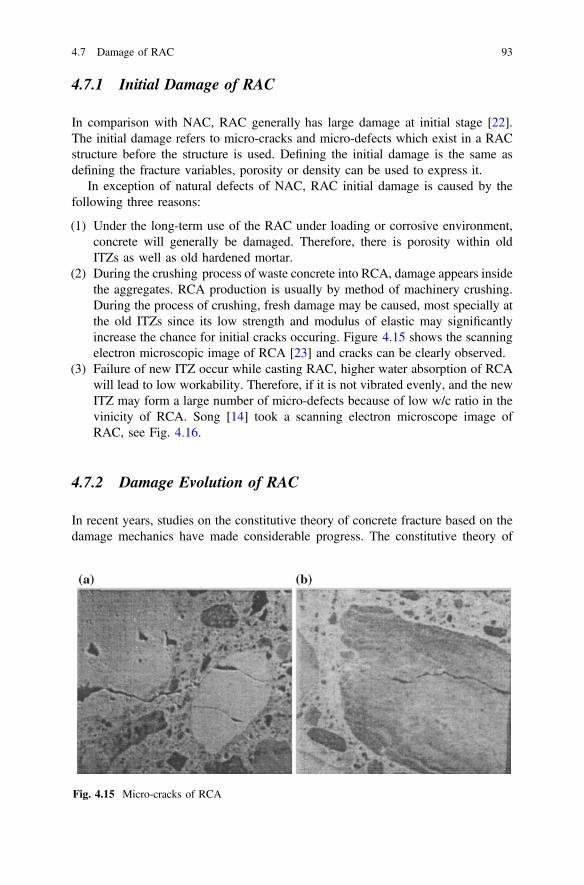
4.7.1 Initial Damage of RAC
In comparison with NAC, RAC generally has large damage at initial stage [22].The initial damage refers to micro-cracks and micro-defects which exist in a RACstructure before the structure is used. Defining the initial damage is the same asdefining the fracture variables, porosity or density can be used to express it.
In exception of natural defects of NAC, RAC initial damage is caused by thefollowing three reasons:
(1) Under the long-term use of the RAC under loading or corrosive environment,concrete will generally be damaged. Therefore, there is porosity within oldITZs as well as old hardened mortar.
(2) During the crushing process of waste concrete into RCA, damage appears insidethe aggregates. RCA production is usually by method of machinery crushing.During the process of crushing, fresh damage may be caused, most specially atthe old ITZs since its low strength and modulus of elastic may significantlyincrease the chance for initial cracks occuring. Figure 4.15 shows the scanningelectron microscopic image of RCA [23] and cracks can be clearly observed.
(3) Failure of new ITZ occur while casting RAC, higher water absorption of RCAwill lead to low workability. Therefore, if it is not vibrated evenly, and the newITZ may form a large number of micro-defects because of low w/c ratio in thevinicity of RCA. Song [14] took a scanning electron microscope image ofRAC, see Fig. 4.16.
4.7.2 Damage Evolution of RAC
In recent years, studies on the constitutive theory of concrete fracture based on thedamage mechanics have made considerable progress. The constitutive theory of
Fig. 4.15 Micro-cracks of RCA
4.7 Damage of RAC 93
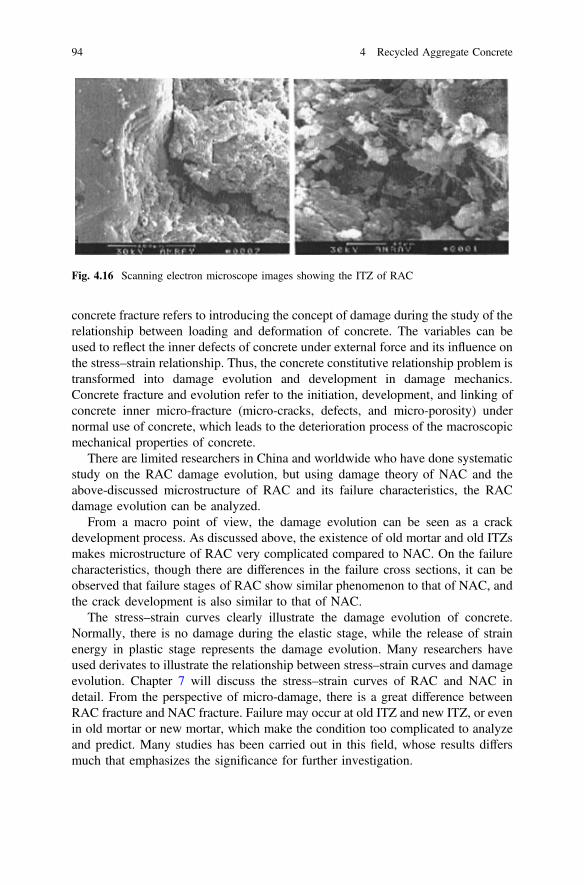
concrete fracture refers to introducing the concept of damage during the study of therelationship between loading and deformation of concrete. The variables can beused to reflect the inner defects of concrete under external force and its influence onthe stress–strain relationship. Thus, the concrete constitutive relationship problem istransformed into damage evolution and development in damage mechanics.Concrete fracture and evolution refer to the initiation, development, and linking ofconcrete inner micro-fracture (micro-cracks, defects, and micro-porosity) undernormal use of concrete, which leads to the deterioration process of the macroscopicmechanical properties of concrete.
There are limited researchers in China and worldwide who have done systematicstudy on the RAC damage evolution, but using damage theory of NAC and theabove-discussed microstructure of RAC and its failure characteristics, the RACdamage evolution can be analyzed.
From a macro point of view, the damage evolution can be seen as a crackdevelopment process. As discussed above, the existence of old mortar and old ITZsmakes microstructure of RAC very complicated compared to NAC. On the failurecharacteristics, though there are differences in the failure cross sections, it can beobserved that failure stages of RAC show similar phenomenon to that of NAC, andthe crack development is also similar to that of NAC.
The stress–strain curves clearly illustrate the damage evolution of concrete.Normally, there is no damage during the elastic stage, while the release of strainenergy in plastic stage represents the damage evolution. Many researchers haveused derivates to illustrate the relationship between stress–strain curves and damageevolution. Chapter 7 will discuss the stress–strain curves of RAC and NAC indetail. From the perspective of micro-damage, there is a great difference betweenRAC fracture and NAC fracture. Failure may occur at old ITZ and new ITZ, or evenin old mortar or new mortar, which make the condition too complicated to analyzeand predict. Many studies has been carried out in this field, whose results differsmuch that emphasizes the significance for further investigation.
Fig. 4.16 Scanning electron microscope images showing the ITZ of RAC
94 4 Recycled Aggregate Concrete
With a systematic investigation of the characteristics of the RAC failure sectionwhich can be taken as a foundation, the micro-fracture theory of RAC can beestablished by integrating the mentioned foundation with the RAC microstructure.This can be a key to understanding recycled concrete better.
4.8 Improvements of RAC
4.8.1 ITZ Improvements—Physical and Chemical
Though most of the research work carried out so far proves that the strength ofRAC is lower than that of NAC with same mix proportions, other experts believethat the strength of RAC can be higher than the strength of NAC with proper mixproportion design and modifications. Overall, as the weakness within concrete,ITZs in general trigger cracks at first, and the cracks usually develop through ITZ.Thus, strengthening ITZs in RAC can no doubt improve the properties of RAC.
Modification measures can be classified as follows:
(1) Adjusting the mix proportion design: Modification can be achieved by selectinglower w/c or increasing cement content. A lower w/c or more cement con-tent usually results in a high-strength cement paste, low shrinkage, and lessITZ.
(2) Adjusting aggregates gradation: Good-quality aggregates will reduce watercontent, which means it will reduce concrete shrinkage and the stress con-centration phenomenon caused by shrinkage.
(3) Improving the mixing process: Using the cement-bound sand method to mixconcrete, this means that the RCA should first be soaked in water, and then littleamount of cement is added to form a layer of mortar on the surface of RCA, andfinally, the rest of the cement and water is added to mix altogether. With theattached cement mortar, water layer can not form on the surface of aggregates,and can decrease w/c in the vinicity of aggregates and can achieve a better-bondITZ. While studying the improvement in concrete mixing machinery, it wasdiscovered since the cement mortar in the vicinity of aggregates and unhydratedcement particles are difficult to mix evenly in concrete, improving mixingtechniques, such as vibration, can also improve the quality of concrete [24].
(4) Adding polymers: Adding polymers in concrete can help to increase perfor-mance of ITZs by preventing cracks and increasing the bond strength. Theoften used three polymer emulsions are SBR, EVA, and PAE [25].
(5) Adding mineral admixtures: There are currently a great number of researchworks which have proven the addition of pozzolanic materials in concrete toimprove the performance of ITZs. The mineral admixtures often used includefly ash, silica fume, diatomite, some burned shale, etc.
4.7 Damage of RAC 95

Pozzolanic materials has little or no gelling effect, but if in powder form and latermixing with water, at normal temperature it can chemically react with calciumhydroxide and produce a composition with gelling ability. Other ultrafine mineralslike silica fume and fly ash can fill up pores in cement, and making concretestructure much denser. The strength of concrete with added mineral admixtures ishigher than the strength of concrete without mineral admixtures, and this differencewill be clearly observed with the increasing curing age.
Sodium silicate is useful in improving the early strength of RAC with medium orlow strength. Soaking RCA in sodium silicate of 5% concentration for 1 h, thecompressive strength of RAC at 7, 28, 60 days will increase by 66, 21 and 19%respectively. The RCA soaked in higher-concentration solution of sodium silicate isnot beneficial for the fluidity and compressive strength of concrete from the point oflong-term performance because it will even lead to a decrease in the strength ofrecycled concrete at a later stage.
The authors completed the initial test experiment on ITZ strengthening. The testresults show that after adding phenolphthalein crystalline modification, the com-pressive strength of RAC increased by 20%, but there was no significant effect onthe improvement in the shrinkage performance, permeability, and carbonationresistance. Overall, there are many methods of strengthening the ITZ of RAC.These methods can also be used for NAC modifications, however, due to theproperties of RCA, they may be more effective when strengthening RAC.
4.8.2 Two-Stage Mixing Approach
To improve the quality of RAC, a new mixing method: two-stage mixing approach(TSMA), has been developed by Tam et al. [26, 27]. Using this method, the RCAwas firstly mixed with cement paste, which was followed by adding natural sand tothe mixture. The two-stage mixing can help to form a layer of cement slurry on thesurface of RCA to fill up the initial damage such as micro-cracks and voids, leadingto an improved ITZ at the pre-mix stage. Compared to normal mixing approach(NMA), it has been demonstrated that TSMA leads to the improvement in strengthand durability of RAC [26, 28].
Li [29] investigated the microstructural characterization and the phase distri-butions with detailed and quantitative analysis of SEM images and nanoindentationand reported that the TSMA can effectively reduce the size and effect of waterlayers and CH crystals formed around the RCA. Therefore, the amount of porosityis reduced, and the enhanced hydration provides a source for production of C–S–H.Furthermore, it is observed that the volume fractions of porosity and CH phases inthe new ITZ with TSMA are relatively lower than those of the old ITZ and new ITZwith NMA, which can explain the improvement in RAC compressive strength.
96 4 Recycled Aggregate Concrete
4.9 Concluding Remarks
This chapter analyzed and investigated the recycled aggregate concrete (RAC) mixproportion design methods aiming to achieve one or several specific properties.Compressive strength-based mix proportion design method, durability-based mixproportion design method, and the mix proportion design methods based on otherproperties were analyzed and systematically compared in this chapter. Then, con-sidering the mix proportion design computerized development trend, the intro-duction of the computer-aided design methods such as expert system, artificialneural network, and neural network expert was fully done. Finally themicro-structure properties of RAC, such as pore structures of RCA and charac-teristics of interfacial transition zone (ITZ) were compared with those of naturalaggregate concrete (NAC). Based on the analysis on interfacial properties of RAC,techniques to improve the performance of RAC were studied.
References
1. Foo HC, Akhras G. Expert systems and design of concrete mixtures. Concr Int. 1993;15(7):42–6.
2. GB 50010-2010. Code for design of concrete structures. Beijing: China Architecture &Building Press; 2010.
3. Deng XH, Luo YS, Wang ZC, Liu WB, Liu Y. The confirmation of A, B in the strengthformula of regenerated concrete. Concrete. 2007;2:29–30.
4. Zhang YM, Qin HG, Sun W, Hao DM, Ning Z. Preliminary study on the proportion design ofrecycled aggregate concrete. China Concr Cement Products. 2002;1:7–9.
5. Mehta PK. Advancements in concrete technology. Concr Int. 1999;21:69–76.6. Aitcin PC. High-performance concrete demystified. Concr Int. 1993;15(1):21–6.7. Domone PL, Soutsos MN. Approach to the proportioning of high-strength concrete mixes.
Concr Int. 1994;16(10):26–31.8. Wan CJ. An experienced discuss on mix proportion design for high strength and super-high
strength high performance concretes. Concrete. 2002;3:41–3 (in Chinese).9. Chen JK, Wang DM. New mix design method for hpc—overall calculation method. J Chin
Ceram Soc. 2000;28(2):194–8.10. Wu ZW, Lian HZ. High performance concrete. Beijing: China Railway Publishing House;
1999.11. De Larrard F. Batching concrete on your desk. Concrete. 1997;31(8):35–8.12. Hu SG, Lu LN, Ma BG. Study on the mix design of the pumpcrete technique expert system.
J Wuhan Univ Technol. 1998;20(4):9–11.13. Zhang Y, Wang JZ, Li HT, Gao GX. Computer-based management in concrete quality test.
Concrete. 2000;12:40–5.14. Song C. Study on the anti-pressure performance and microstructure of recycled concrete.
Harbin Institution of Technology; 2003.15. Deng XH. Study on effect of compressive strength of recycled aggregate concrete with water
cement ratio. Concrete. 2005;2:46–8.16. Poon CS, Azhar S, Anson M, Wong YL. Strength and durability recovery of fire-damaged
concrete after post-fire-curing. Cem Concr Res. 2001;31(9):1307–18.
4.9 Concluding Remarks 97

17. ACI Committee 555. Removal and reuse of hardened concrete. ACI Mater J 2001; 99(8):320–5.
18. Xiao JZ, Li WG, Fan YH, Huang X. An overview of study on recycled aggregate concrete inChina (1996–2011). Constr Build Mater. 2012;31:364–83.
19. Poon CS, Shui ZH, Lam L, Fok H, Kou SC. Influence of moisture states of natural andrecycled aggregates on the slump and compressive strength of concrete. Cem Concr Res.2004;34(1):31–6.
20. Etxebrria M, Vázquez E, Marí A. Microstructure analysis of hardened recycled aggregateconcrete. Mag Concr Res. 2006;58(10):683–90.
21. Li WG, Xiao JZ, Sun ZH, Shah SP. Failure processes of modeled recycled aggregate concreteunder uniaxial compression. Cement Concr Compos. 2012;34(10):1149–58.
22. Nagataki S, Gokce A, Saeki T, Hisada M. Assessment of recycling process induced damagesensitivity of recycled concrete aggregates. Cement Concr Res. 2004;34(6):965–71.
23. Wu C. Experimental study on recycled aggregate concrete highway pavement. Southwest JiaoTong University; 2006.
24. Zhang HJ. Mechanical strengthening method and experimental study of mixing process.Chang’an University; 2006.
25. Wang ZY. Improving the strength of cement mortar with polymer emulsion. Concrete.1999;2:44–7.
26. Tam VWY, Gao XF, Tam CM. Microstructural analysis of recycled aggregate concreteproduced from two-stage mixing approach. Cem Concr Res. 2005;35(6):1195–203.
27. Tam VWY, Tam CM. Assessment of durability of recycled aggregate concrete produced bytwo-stage mixing approach. J Mater Sci. 2007;42(10):3592–602.
28. Teramoto A, Jeong H, Lange D, Maruyama I. Tensile properties of recycled aggregateconcrete. Proceedings of the Japan Concrete Institute. 2011;33(1):551–6.
29. Li WG, Xiao JZ, Sun ZH, Kawashima S, Shah SP. Interfacial transition zones in recycledaggregate concrete with different mixing approaches. Constr Build Mater. 2012;35:1045–55.
98 4 Recycled Aggregate Concrete
Chapter 5Modeled Recycled Aggregate Concrete
Abstract Based on the microstructure analysis, recycled aggregate concrete(RAC) can be described as a five-phase composite that consists of natural aggre-gates (NA), old interfacial transition zone (old ITZ), old mortar, new interfacialtransition zone (new ITZ) and new mortar. Due to the relatively low quality of theITZs and old mortar compared to other phases, new micro cracks normally occurredin these regions first when RAC was under loading. Modeled recycled aggregateconcrete (MRAC) which was composed of the new mortar matrix and some circularrecycled coarse aggregate (RCA) discs embedded in a rectangular array. It isdemonstrated that MRAC can be used to investigate the relation between themesostructure of each phase and the mechanical behavior including static anddynamic as well as chloride diffusion properties of RAC. The obtained resultsindicated that the fracture process and crack pattern of MRAC were greatly affectedby the relative strength of new mortar and old mortar. It was also found that thefailure pattern of RAC was related to the water to cement ratio of the mixture.
5.1 Concept and Realization
5.1.1 Philosophy
Based on the microstructure analysis, RAC can be approximated to a five-phasecomposite that consists of NAs, old ITZ, old mortar, new ITZ and new mortar [1,2]. Many researches revealed that the ITZs and old mortar were considered to be theweakest links in RAC and had significant impacts on the mechanical properties ofRAC [3–5]. Due to the relatively low quality of the ITZs and old mortar comparedto other phases, new microcracks normally occurred in these regions first whenRAC was under loading. Therefore, the in-situ observation of crack propagation inRAC is necessary to investigate crack propagation in RAC.
Due to the material heterogeneity, it is quite difficult to study the in-situ crackpattern of conventional concrete under loading. In order to investigate the fractureprocess of concrete, Maji and Shah [6] proposed to use modeled concrete
© Springer-Verlag GmbH Germany 2018J. Xiao, Recycled Aggregate Concrete Structures,Springer Tracts in Civil Engineering, https://doi.org/10.1007/978-3-662-53987-3_5
99

specimens with cylindrical aggregates. To measure the local displacements undercomplex compressive fracture, Choi and Shah [7] examined the fracture behavior ofmodel concrete specimens that contained different number of embedded coarseaggregates (1, 5 and 13 aggregates) by employing subregion scanning computervision. The concrete had also been idealized by a model consisting of circular discsof aggregates with uniform size embedded in a mortar matrix to form a thin slab byBuyukozturk et al. [8]. Based on this idea, Tregger et al. [9] further proposed aconcrete model to create an efficient link between the mesostructure and themechanical and damage behavior of concrete and related strain-softening response.
MRAC which was composed of the new mortar matrix and several circular RCAdiscs embedded in a rectangular array. It is demonstrated that MRAC can be used toinvestigate the relation between the mesostructure of each phase and the mechanicalbehavior of RAC.
5.1.2 Method
Cylindrical granite aggregates 28 mm in diameter were prepared to make MRACfor this study (Fig. 5.1a). The elastic modulus of these cylindrical granite aggre-gates was tested to be 80 GPa. When casting, the aggregates were fixed and placedvertically in wood molds and the mortar intended to represent old mortar was thenfilled around the aggregates with the aid of a vibration table. The poured plate wascured underwater for 28 days. After it had been taken out of water for one day,modeled recycled coarse aggregate (MRCA) samples with the diameter of 38 mmwere cored from the plate with mortar adhered to NA as shown in Fig. 5.1b, and thethickness of the mortar layer was about 5 mm.
(a) Natural coarse aggregate (b) Modeled recycled coarse aggregate (MRCA)
Fig. 5.1 Cylindrical aggregate
100 5 Modeled Recycled Aggregate Concrete
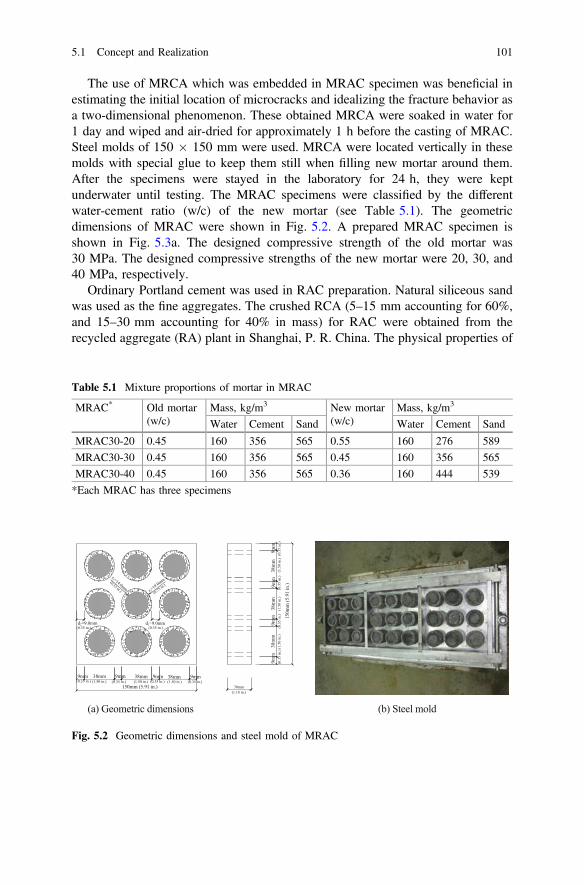
The use of MRCA which was embedded in MRAC specimen was beneficial inestimating the initial location of microcracks and idealizing the fracture behavior asa two-dimensional phenomenon. These obtained MRCA were soaked in water for1 day and wiped and air-dried for approximately 1 h before the casting of MRAC.Steel molds of 150 � 150 mm were used. MRCA were located vertically in thesemolds with special glue to keep them still when filling new mortar around them.After the specimens were stayed in the laboratory for 24 h, they were keptunderwater until testing. The MRAC specimens were classified by the differentwater-cement ratio (w/c) of the new mortar (see Table 5.1). The geometricdimensions of MRAC were shown in Fig. 5.2. A prepared MRAC specimen isshown in Fig. 5.3a. The designed compressive strength of the old mortar was30 MPa. The designed compressive strengths of the new mortar were 20, 30, and40 MPa, respectively.
Ordinary Portland cement was used in RAC preparation. Natural siliceous sandwas used as the fine aggregates. The crushed RCA (5–15 mm accounting for 60%,and 15–30 mm accounting for 40% in mass) for RAC were obtained from therecycled aggregate (RA) plant in Shanghai, P. R. China. The physical properties of
Table 5.1 Mixture proportions of mortar in MRAC
MRAC* Old mortar(w/c)
Mass, kg/m3 New mortar(w/c)
Mass, kg/m3
Water Cement Sand Water Cement Sand
MRAC30-20 0.45 160 356 565 0.55 160 276 589
MRAC30-30 0.45 160 356 565 0.45 160 356 565
MRAC30-40 0.45 160 356 565 0.36 160 444 539
*Each MRAC has three specimens
150mm (5.91 in.)
9mm
(a) Geometric dimensions (b) Steel mold
38mm9mm38mm9mm38mm9mm
9mm
38m
m9m
m38
mm
9mm
38m
m9m
m
150m
m (5
.91
in.)
30mm (1.18 in.)
r 1=19.0mm
d1=9.0mmd2=9.0mm
r2=14.0mm
(0.35 in.) (1.50 in.) (0.35 in.) (1.50 in.) (0.35 in.) (1.50 in.) (0.35 in.)
(0.3
5 in
.)(1
.50
in.)
(0.3
5 in
.)(1
.50
in.)
(0.3
5 in
.)(0
.35
in.)
(1.5
0 in
.)
(0.35 in.)(0.35 in.)
(0.55 in.) (0.75 in.)
Fig. 5.2 Geometric dimensions and steel mold of MRAC
5.1 Concept and Realization 101
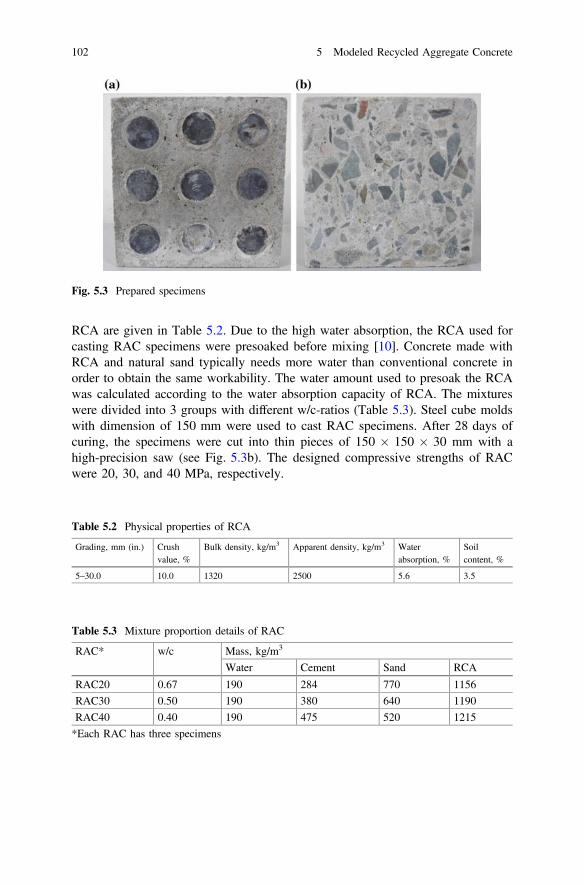
RCA are given in Table 5.2. Due to the high water absorption, the RCA used forcasting RAC specimens were presoaked before mixing [10]. Concrete made withRCA and natural sand typically needs more water than conventional concrete inorder to obtain the same workability. The water amount used to presoak the RCAwas calculated according to the water absorption capacity of RCA. The mixtureswere divided into 3 groups with different w/c-ratios (Table 5.3). Steel cube moldswith dimension of 150 mm were used to cast RAC specimens. After 28 days ofcuring, the specimens were cut into thin pieces of 150 � 150 � 30 mm with ahigh-precision saw (see Fig. 5.3b). The designed compressive strengths of RACwere 20, 30, and 40 MPa, respectively.
Fig. 5.3 Prepared specimens
Table 5.2 Physical properties of RCA
Grading, mm (in.) Crushvalue, %
Bulk density, kg/m3 Apparent density, kg/m3 Waterabsorption, %
Soilcontent, %
5–30.0 10.0 1320 2500 5.6 3.5
Table 5.3 Mixture proportion details of RAC
RAC* w/c Mass, kg/m3
Water Cement Sand RCA
RAC20 0.67 190 284 770 1156
RAC30 0.50 190 380 640 1190
RAC40 0.40 190 475 520 1215
*Each RAC has three specimens
102 5 Modeled Recycled Aggregate Concrete
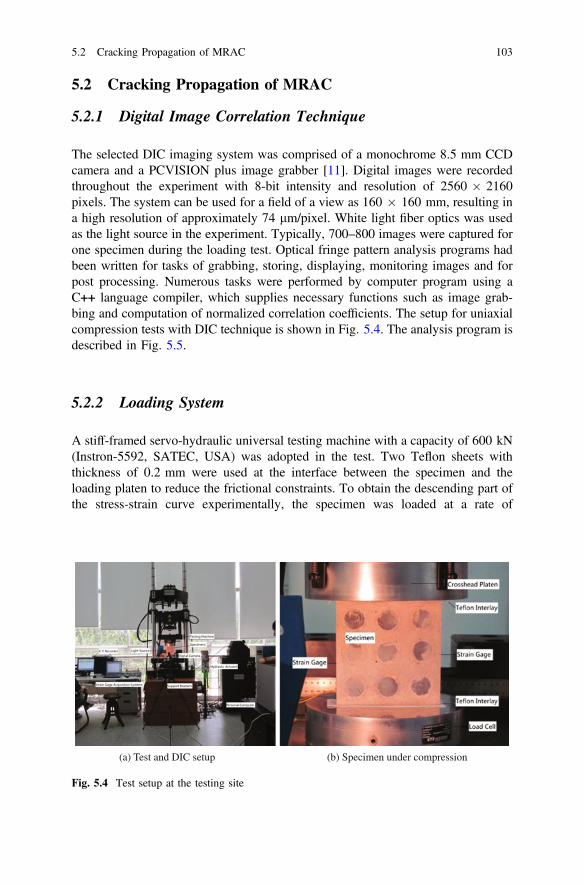
5.2 Cracking Propagation of MRAC
5.2.1 Digital Image Correlation Technique
The selected DIC imaging system was comprised of a monochrome 8.5 mm CCDcamera and a PCVISION plus image grabber [11]. Digital images were recordedthroughout the experiment with 8-bit intensity and resolution of 2560 � 2160pixels. The system can be used for a field of a view as 160 � 160 mm, resulting ina high resolution of approximately 74 lm/pixel. White light fiber optics was usedas the light source in the experiment. Typically, 700–800 images were captured forone specimen during the loading test. Optical fringe pattern analysis programs hadbeen written for tasks of grabbing, storing, displaying, monitoring images and forpost processing. Numerous tasks were performed by computer program using aC++ language compiler, which supplies necessary functions such as image grab-bing and computation of normalized correlation coefficients. The setup for uniaxialcompression tests with DIC technique is shown in Fig. 5.4. The analysis program isdescribed in Fig. 5.5.
5.2.2 Loading System
A stiff-framed servo-hydraulic universal testing machine with a capacity of 600 kN(Instron-5592, SATEC, USA) was adopted in the test. Two Teflon sheets withthickness of 0.2 mm were used at the interface between the specimen and theloading platen to reduce the frictional constraints. To obtain the descending part ofthe stress-strain curve experimentally, the specimen was loaded at a rate of
(a) Test and DIC setup (b) Specimen under compression
Fig. 5.4 Test setup at the testing site
5.2 Cracking Propagation of MRAC 103
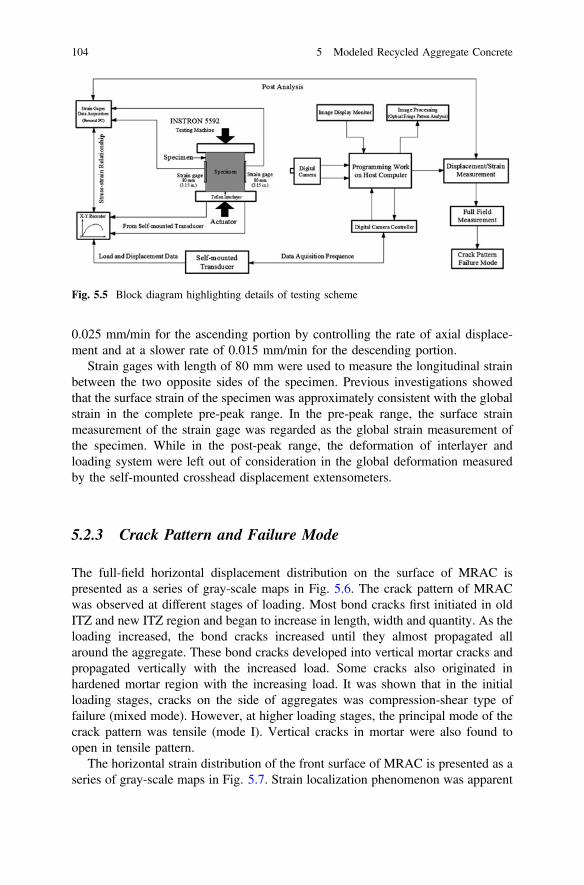
0.025 mm/min for the ascending portion by controlling the rate of axial displace-ment and at a slower rate of 0.015 mm/min for the descending portion.
Strain gages with length of 80 mm were used to measure the longitudinal strainbetween the two opposite sides of the specimen. Previous investigations showedthat the surface strain of the specimen was approximately consistent with the globalstrain in the complete pre-peak range. In the pre-peak range, the surface strainmeasurement of the strain gage was regarded as the global strain measurement ofthe specimen. While in the post-peak range, the deformation of interlayer andloading system were left out of consideration in the global deformation measuredby the self-mounted crosshead displacement extensometers.
5.2.3 Crack Pattern and Failure Mode
The full-field horizontal displacement distribution on the surface of MRAC ispresented as a series of gray-scale maps in Fig. 5.6. The crack pattern of MRACwas observed at different stages of loading. Most bond cracks first initiated in oldITZ and new ITZ region and began to increase in length, width and quantity. As theloading increased, the bond cracks increased until they almost propagated allaround the aggregate. These bond cracks developed into vertical mortar cracks andpropagated vertically with the increased load. Some cracks also originated inhardened mortar region with the increasing load. It was shown that in the initialloading stages, cracks on the side of aggregates was compression-shear type offailure (mixed mode). However, at higher loading stages, the principal mode of thecrack pattern was tensile (mode I). Vertical cracks in mortar were also found toopen in tensile pattern.
The horizontal strain distribution of the front surface of MRAC is presented as aseries of gray-scale maps in Fig. 5.7. Strain localization phenomenon was apparent
Fig. 5.5 Block diagram highlighting details of testing scheme
104 5 Modeled Recycled Aggregate Concrete

at the ITZs for MRAC. The initiation and propagation of the interfacial cracks wereevident ahead of macrocrack formation. Localized cracking and consequent insta-bility may therefore explain the failure mechanism of MRAC in compression. Atabout 45% of the peak load, small strain localizations were visible at both theinterfacial zone and mortar region. However, at about 75% of peak load, the strainswere obviously larger at the interface zones, indicating that the bond crack hadalready formed in this region and dominated the microcracks at the mortar region. Itis important to note that the failure crack mostly formed at the interface zones first,
45% of peak load (MRAC30-20) 45% of peak load (MRAC30-30) 45% of peak load (MRAC30-40)
75% of peak load (MRAC30-20) 75% of peak load (MRAC30-30) 75% of peak load (MRAC30-40)
100% of peak load (post) 100% of peak load (post) 100% of peak load (post)
Fig. 5.6 Gray-scale maps for typical horizontal field displacement for MRAC
5.2 Cracking Propagation of MRAC 105
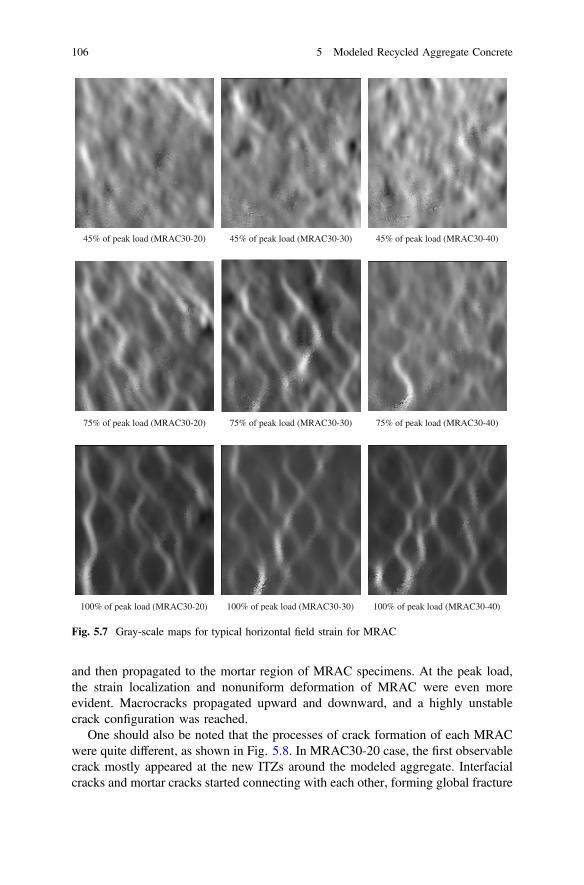
and then propagated to the mortar region of MRAC specimens. At the peak load,the strain localization and nonuniform deformation of MRAC were even moreevident. Macrocracks propagated upward and downward, and a highly unstablecrack configuration was reached.
One should also be noted that the processes of crack formation of each MRACwere quite different, as shown in Fig. 5.8. In MRAC30-20 case, the first observablecrack mostly appeared at the new ITZs around the modeled aggregate. Interfacialcracks and mortar cracks started connecting with each other, forming global fracture
45% of peak load (MRAC30-20) 45% of peak load (MRAC30-30) 45% of peak load (MRAC30-40)
75% of peak load (MRAC30-20) 75% of peak load (MRAC30-30) 75% of peak load (MRAC30-40)
100% of peak load (MRAC30-20) 100% of peak load (MRAC30-30) 100% of peak load (MRAC30-40)
Fig. 5.7 Gray-scale maps for typical horizontal field strain for MRAC
106 5 Modeled Recycled Aggregate Concrete

after the peak load. In the final crack pattern, most cracks lined up parallel to theloading direction except around the aggregate. Some inclined cracks were alsoobserved in the mortar region. In MRAC30-30 case, the first observable cracksappeared around both the new and old ITZs. As the load increased, cracks wereobserved at both ITZs and mortar region. Next, old interfacial cracks crossed the oldmortar and propagated into new mortar parallel to the loading direction. InMRAC30-40 case, the first observable crack mostly appeared at the old ITZs. Thebond crack propagated into the mortar region by connecting adjacent aggregate ITZs.
5.3 Stress Distribution in MRAC
5.3.1 Analytical Procedures
5.3.1.1 Finite Element Model (FEM) Analysis
A commercially available software program (ABAQUS 6.8) was applied for thefinite element analysis in this study (ABAQUS version 6.8 documentation 2008).Quadrilateral plane stress elements (CPS4R) were used to mesh all the phase of theMRAC. The FEM of MRAC with 18,148 elements is shown in Fig. 5.9. Toinvestigate the effect of ITZs in the MRAC numerically, old ITZ and new ITZ wereset to be 50 lm thick combined by Scanning electron microscopy (SEM) image
(a) MRAC30-20 (b) MRAC30-30 (c) MRAC30-40
Fig. 5.8 Cracks pattern of MRAC specimens
5.2 Cracking Propagation of MRAC 107
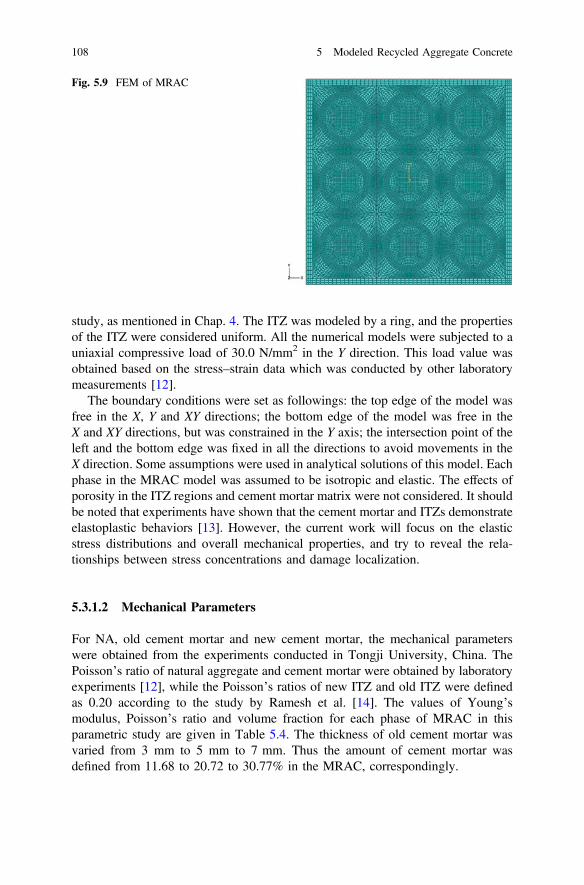
study, as mentioned in Chap. 4. The ITZ was modeled by a ring, and the propertiesof the ITZ were considered uniform. All the numerical models were subjected to auniaxial compressive load of 30.0 N/mm2 in the Y direction. This load value wasobtained based on the stress–strain data which was conducted by other laboratorymeasurements [12].
The boundary conditions were set as followings: the top edge of the model wasfree in the X, Y and XY directions; the bottom edge of the model was free in theX and XY directions, but was constrained in the Y axis; the intersection point of theleft and the bottom edge was fixed in all the directions to avoid movements in theX direction. Some assumptions were used in analytical solutions of this model. Eachphase in the MRAC model was assumed to be isotropic and elastic. The effects ofporosity in the ITZ regions and cement mortar matrix were not considered. It shouldbe noted that experiments have shown that the cement mortar and ITZs demonstrateelastoplastic behaviors [13]. However, the current work will focus on the elasticstress distributions and overall mechanical properties, and try to reveal the rela-tionships between stress concentrations and damage localization.
5.3.1.2 Mechanical Parameters
For NA, old cement mortar and new cement mortar, the mechanical parameterswere obtained from the experiments conducted in Tongji University, China. ThePoisson’s ratio of natural aggregate and cement mortar were obtained by laboratoryexperiments [12], while the Poisson’s ratios of new ITZ and old ITZ were definedas 0.20 according to the study by Ramesh et al. [14]. The values of Young’smodulus, Poisson’s ratio and volume fraction for each phase of MRAC in thisparametric study are given in Table 5.4. The thickness of old cement mortar wasvaried from 3 mm to 5 mm to 7 mm. Thus the amount of cement mortar wasdefined from 11.68 to 20.72 to 30.77% in the MRAC, correspondingly.
Fig. 5.9 FEM of MRAC
108 5 Modeled Recycled Aggregate Concrete
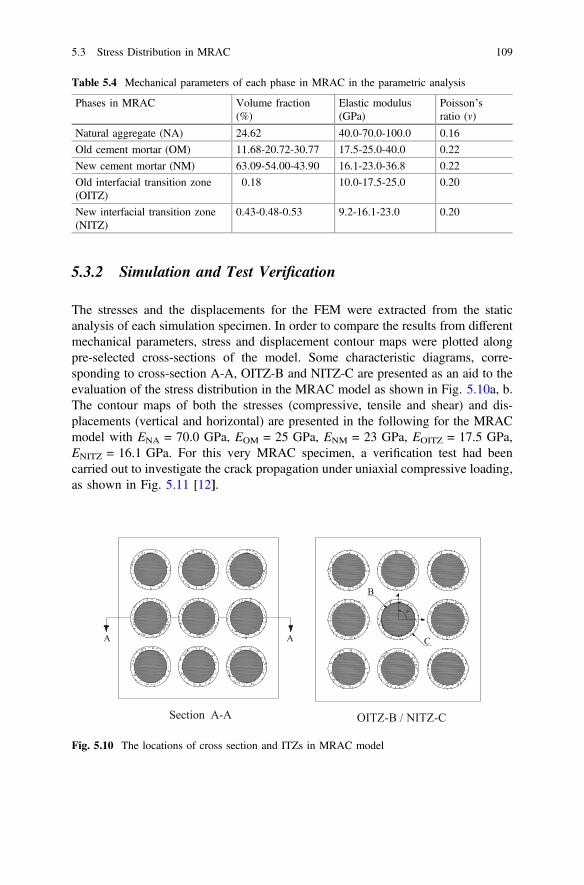
5.3.2 Simulation and Test Verification
The stresses and the displacements for the FEM were extracted from the staticanalysis of each simulation specimen. In order to compare the results from differentmechanical parameters, stress and displacement contour maps were plotted alongpre-selected cross-sections of the model. Some characteristic diagrams, corre-sponding to cross-section A-A, OITZ-B and NITZ-C are presented as an aid to theevaluation of the stress distribution in the MRAC model as shown in Fig. 5.10a, b.The contour maps of both the stresses (compressive, tensile and shear) and dis-placements (vertical and horizontal) are presented in the following for the MRACmodel with ENA = 70.0 GPa, EOM = 25 GPa, ENM = 23 GPa, EOITZ = 17.5 GPa,ENITZ = 16.1 GPa. For this very MRAC specimen, a verification test had beencarried out to investigate the crack propagation under uniaxial compressive loading,as shown in Fig. 5.11 [12].
Table 5.4 Mechanical parameters of each phase in MRAC in the parametric analysis
Phases in MRAC Volume fraction(%)
Elastic modulus(GPa)
Poisson’sratio (m)
Natural aggregate (NA) 24.62 40.0-70.0-100.0 0.16
Old cement mortar (OM) 11.68-20.72-30.77 17.5-25.0-40.0 0.22
New cement mortar (NM) 63.09-54.00-43.90 16.1-23.0-36.8 0.22
Old interfacial transition zone(OITZ)
0.18 10.0-17.5-25.0 0.20
New interfacial transition zone(NITZ)
0.43-0.48-0.53 9.2-16.1-23.0 0.20
A
Section A-A
A
B
C
OITZ-B / NITZ-C
Fig. 5.10 The locations of cross section and ITZs in MRAC model
5.3 Stress Distribution in MRAC 109

5.3.2.1 Stress Distribution
The simulated compressive stress in the Y direction (S22), tensile stress in theX direction (S11) and shear stress in the XY direction (S12) of the MRAC are shownin Fig. 5.12a–d. The higher stress (S22) are evident within the natural aggregate,while the lower stress (S22) are developed in the old ITZ and new ITZ regions. It isworth noting that the highest stress concentrations (S11 and S12) occurred in the newITZ and old ITZ regions, especially in the old ITZ. The maximum tensile stressfrom h = 0 to h = p/2 for old ITZ occurs approximately at the OITZ with h = p/5,and the maximum shear stress occurs approximately at the OITZ with h = p/7. Themaximum tensile stress from h = 0 to h = p/2 for the new ITZ occurs at the NITZwith h = 0, and the maximum shear stress occurs approximately at the NITZ withh = p/6. The magnitude of maximum values of S11 and S12 for the NITZ are lessthan those of the OITZ. For RAC with a weak tensile strength, the tensile stresses atthese locations may further aggravate the already existing microcracks in the ITZregions. It is also observed that the highest Von Mises stress occurred within thenatural aggregate, for which the Young’s modulus is the highest in MRAC.
Generally, the maximum tensile stress (S11) tends to concentrate mainly in theITZ regions which lay between the natural aggregate and the old cement mortar,and between old cement mortar and new cement mortar as well, in Fig. 5.13a, b.These stress concentrations could lead to the development of microcracks alongthese regions, which in turn could lead to the failure of the MRAC. As the prop-erties of the ITZs are weaker than those of other phases in the MRAC, the stressconcentrations mainly occur in these regions and may lead to or promote the failure.Experimental results also proved that bond cracks firstly appeared around the weakITZs, and then propagated into the mortar by connecting with each other [12], asshown in Fig. 5.14a, b.
Fig. 5.11 MRAC specimenfor uniaxial compressivetesting
110 5 Modeled Recycled Aggregate Concrete
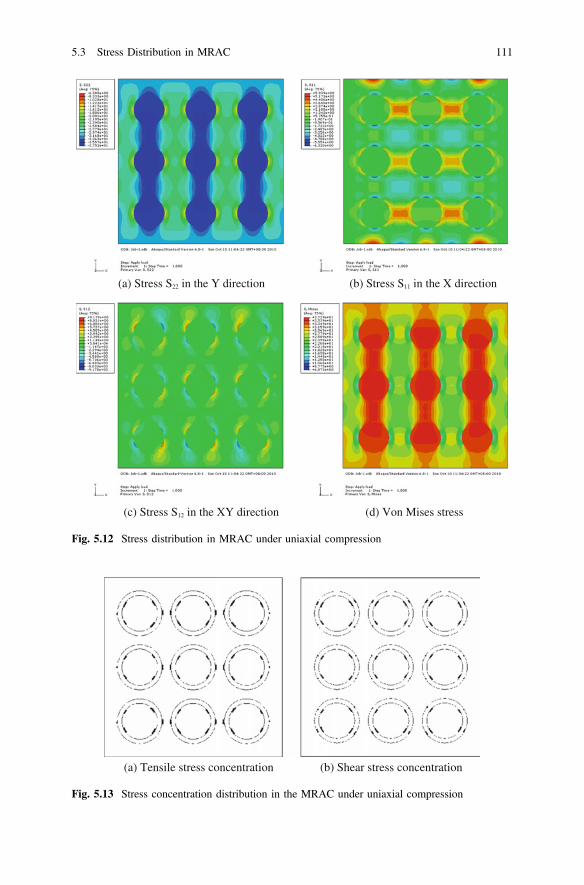
(a) Stress S22 in the Y direction (b) Stress S11 in the X direction
(c) Stress S12 in the XY direction (d) Von Mises stress
Fig. 5.12 Stress distribution in MRAC under uniaxial compression
(a) Tensile stress concentration (b) Shear stress concentration
Fig. 5.13 Stress concentration distribution in the MRAC under uniaxial compression
5.3 Stress Distribution in MRAC 111

5.3.3 Effects of Relative Properties of ITZs
The mechanical properties of old ITZ and new ITZ may vary with the curing ageand addition of admixtures in RAC. In this study, the EOITZ/EOM and ENITZ/ENM
ratios are defined from 0.4 to 0.7 to 1.0. For the different elastic moduli of old ITZand new ITZ, the overall elastic modulus and the Poisson’s ratio of the MRAC aswell as the magnitude of stresses along preselected sections are shown in Tables 5.5and 5.6, respectively. It is found that the overall elastic modulus of MRAC appearsto be increased slightly with the increase of the elastic modulus of ITZs. Similarly,the Poisson’s ratio of MRAC can be considered to be not sensitive to the elasticmodulus of old ITZ and new ITZ. On the other hand, it can be seen that for theEOITZ/EOM and ENITZ/ENM ratios ranging from 0.4 to 1.0, the magnitude of max-imum and minimum stresses along section A-A is not significantly changed, but thestress along OITZ-B and NITZ-C decreases due to the increase in elastic modulusof ITZs. This indicates that when the elastic modulus of ITZs is close to those ofcement mortar, the incompatibility between different phases in RAC is reduced.
Figure 5.15a, b show the distributions of S11 and S22 stresses along the sectionA-A for different elastic modulus of ITZs. It can be seen that with the increase ofelastic modulus of ITZs, the internal force transmitted to the cement mortar is
(a) Horizontal field strain contour map (b) Crack pattern
Fig. 5.14 Testing results on the MRAC under uniaxial loading by DIC
Table 5.5 Mechanical properties of MRAC for different elastic modulus of old ITZ and new ITZ
Modulus of old ITZ(GPa)
Modulus of new ITZ(GPa)
Modulus of MRAC(GPa)
Poisson’s ratio ofMRAC
10.0 9.2 29.22 0.17
17.5 16.1 29.41 0.17
25.0 23.0 29.41 0.17
112 5 Modeled Recycled Aggregate Concrete
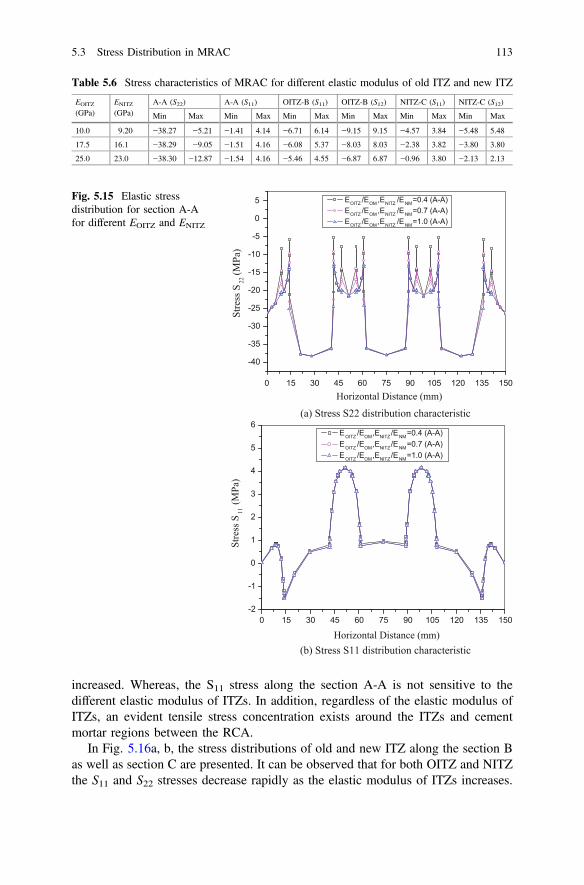
increased. Whereas, the S11 stress along the section A-A is not sensitive to thedifferent elastic modulus of ITZs. In addition, regardless of the elastic modulus ofITZs, an evident tensile stress concentration exists around the ITZs and cementmortar regions between the RCA.
In Fig. 5.16a, b, the stress distributions of old and new ITZ along the section Bas well as section C are presented. It can be observed that for both OITZ and NITZthe S11 and S22 stresses decrease rapidly as the elastic modulus of ITZs increases.
Table 5.6 Stress characteristics of MRAC for different elastic modulus of old ITZ and new ITZ
EOITZ
(GPa)ENITZ
(GPa)A-A (S22) A-A (S11) OITZ-B (S11) OITZ-B (S12) NITZ-C (S11) NITZ-C (S12)
Min Max Min Max Min Max Min Max Min Max Min Max
10.0 9.20 −38.27 −5.21 −1.41 4.14 −6.71 6.14 −9.15 9.15 −4.57 3.84 −5.48 5.48
17.5 16.1 −38.29 −9.05 −1.51 4.16 −6.08 5.37 −8.03 8.03 −2.38 3.82 −3.80 3.80
25.0 23.0 −38.30 −12.87 −1.54 4.16 −5.46 4.55 −6.87 6.87 −0.96 3.80 −2.13 2.13
0 15 30 45 60 75 90 105 120 135 150
-40
-35
-30
-25
-20
-15
-10
-5
0
5
Stre
ss S
22 (M
Pa)
Horizontal Distance (mm)
(a) Stress S22 distribution characteristic
(b) Stress S11 distribution characteristic
EOITZ /EOM ,ENITZ /ENM=0.4 (A-A) EOITZ /EOM ,ENITZ /ENM=0.7 (A-A) EOITZ /EOM ,ENITZ /ENM=1.0 (A-A)
0 15 30 45 60 75 90 105 120 135 150-2
-1
0
1
2
3
4
5
6 EOITZ /EOM,ENITZ/ENM=0.4 (A-A) EOITZ /EOM,ENITZ/ENM=0.7 (A-A) EOITZ /EOM,ENITZ/ENM=1.0 (A-A)
Stre
ss S
11 (M
Pa)
Horizontal Distance (mm)
Fig. 5.15 Elastic stressdistribution for section A-Afor different EOITZ and ENITZ
5.3 Stress Distribution in MRAC 113

Therefore, the mechanical properties of ITZs can be expected to have significantinfluence on the microcracks development in the MRAC. For both old and newITZs, it is found that the higher elastic modulus of ITZs results in the lower S11 andS12 stresses. In addition, the location of maximum and minimum stress S11 and S12are not changed in old ITZ but are changed in new ITZ with an increase in theelastic modulus of ITZs. Finally, this implies that the elastic modulus of new ITZand old ITZ significantly influences the stresses concentration around the new ITZand old ITZ in the MRAC.
-8
-6
-4
-2
0
2
4
6
8
10
Stre
ss S
11 (M
Pa)
(rad)(a) Stress S11 distribution characteristic
(b) Stress S12 distribution characteristic
EOITZ /EOM,ENITZ/ENM=0.4 (OITZ) EOITZ /EOM,ENITZ /ENM=0.7 (OITZ) EOITZ /EOM,ENITZ/ENM=1.0 (OITZ) EOITZ /EOM,ENITZ /ENM=0.4 (NITZ) EOITZ /EOM,ENITZ/ENM=0.7(NITZ) EOITZ /EOM,ENITZ /ENM=1.0 (NITZ)
0.0 0.5 1.0 1.5 2.0 2.5 3.0 3.5 4.0 4.5 5.0 5.5 6.0 6.5
0.0 0.5 1.0 1.5 2.0 2.5 3.0 3.5 4.0 4.5 5.0 5.5 6.0 6.5-12-10-8-6-4-202468
101214 EOITZ /EOM,ENITZ/ENM=0.4 (OITZ) EOITZ /EOM,ENITZ /ENM=0.7 (OITZ)
EOITZ /EOM,ENITZ/ENM=1.0 (OITZ) EOITZ /EOM,ENITZ /ENM=0.4 (NITZ) EOITZ /EOM,ENITZ/ENM=0.7(NITZ) EOITZ /EOM,ENITZ /ENM=1.0 (NITZ)
Stre
ss S
12 (M
Pa)
(rad)
Fig. 5.16 Elastic stressdistribution for old ITZ-B andnew ITZ-C for different EOITZ
and ENITZ
114 5 Modeled Recycled Aggregate Concrete
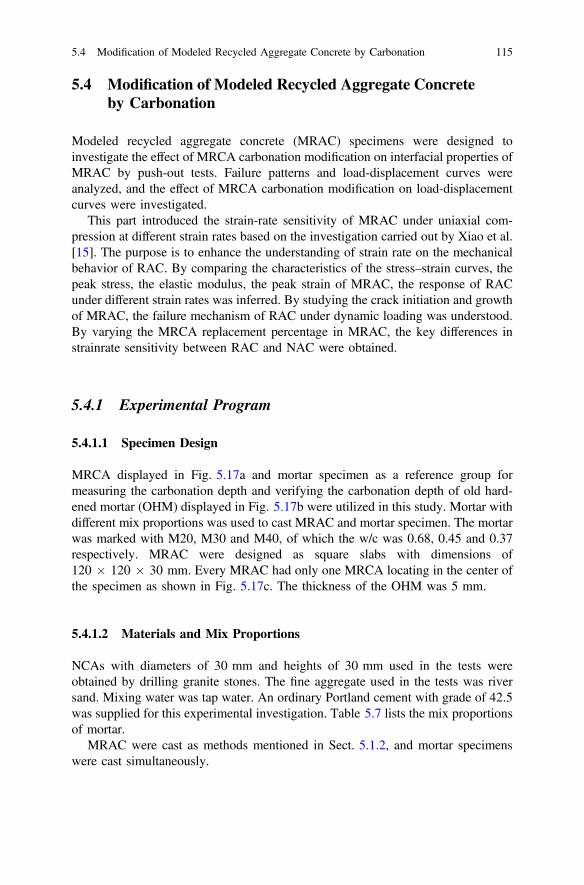
5.4 Modification of Modeled Recycled Aggregate Concreteby Carbonation
Modeled recycled aggregate concrete (MRAC) specimens were designed toinvestigate the effect of MRCA carbonation modification on interfacial properties ofMRAC by push-out tests. Failure patterns and load-displacement curves wereanalyzed, and the effect of MRCA carbonation modification on load-displacementcurves were investigated.
This part introduced the strain-rate sensitivity of MRAC under uniaxial com-pression at different strain rates based on the investigation carried out by Xiao et al.[15]. The purpose is to enhance the understanding of strain rate on the mechanicalbehavior of RAC. By comparing the characteristics of the stress–strain curves, thepeak stress, the elastic modulus, the peak strain of MRAC, the response of RACunder different strain rates was inferred. By studying the crack initiation and growthof MRAC, the failure mechanism of RAC under dynamic loading was understood.By varying the MRCA replacement percentage in MRAC, the key differences instrainrate sensitivity between RAC and NAC were obtained.
5.4.1 Experimental Program
5.4.1.1 Specimen Design
MRCA displayed in Fig. 5.17a and mortar specimen as a reference group formeasuring the carbonation depth and verifying the carbonation depth of old hard-ened mortar (OHM) displayed in Fig. 5.17b were utilized in this study. Mortar withdifferent mix proportions was used to cast MRAC and mortar specimen. The mortarwas marked with M20, M30 and M40, of which the w/c was 0.68, 0.45 and 0.37respectively. MRAC were designed as square slabs with dimensions of120 � 120 � 30 mm. Every MRAC had only one MRCA locating in the center ofthe specimen as shown in Fig. 5.17c. The thickness of the OHM was 5 mm.
5.4.1.2 Materials and Mix Proportions
NCAs with diameters of 30 mm and heights of 30 mm used in the tests wereobtained by drilling granite stones. The fine aggregate used in the tests was riversand. Mixing water was tap water. An ordinary Portland cement with grade of 42.5was supplied for this experimental investigation. Table 5.7 lists the mix proportionsof mortar.
MRAC were cast as methods mentioned in Sect. 5.1.2, and mortar specimenswere cast simultaneously.
5.4 Modification of Modeled Recycled Aggregate Concrete by Carbonation 115
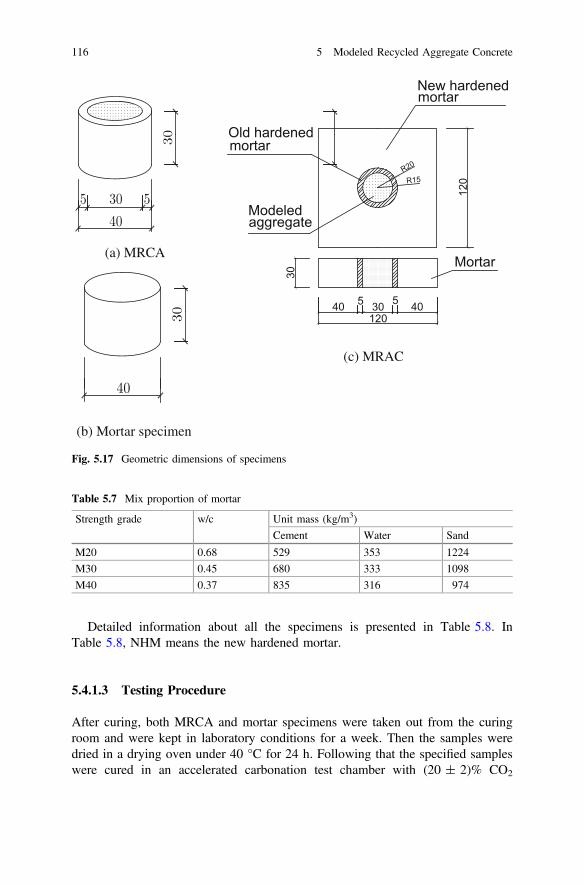
Detailed information about all the specimens is presented in Table 5.8. InTable 5.8, NHM means the new hardened mortar.
5.4.1.3 Testing Procedure
After curing, both MRCA and mortar specimens were taken out from the curingroom and were kept in laboratory conditions for a week. Then the samples weredried in a drying oven under 40 °C for 24 h. Following that the specified sampleswere cured in an accelerated carbonation test chamber with (20 ± 2)% CO2
5 30 540
30
(a) MRCA
mortar
40 5 30120
5 40
New hardened
Old hardened
Modeled
30
R15R20
Mortar
120
mortar
aggregate
(c) MRAC
40
30
(b) Mortar specimen
Fig. 5.17 Geometric dimensions of specimens
Table 5.7 Mix proportion of mortar
Strength grade w/c Unit mass (kg/m3)
Cement Water Sand
M20 0.68 529 353 1224
M30 0.45 680 333 1098
M40 0.37 835 316 974
116 5 Modeled Recycled Aggregate Concrete

concentration, 30 ± 3 °C temperature and 70 ± 5% relative humidity. The car-bonation device is displayed in Fig. 5.18. The MRCA which were not carbonatedafter being cured for 28 days would be put in the laboratory until other MRCA werecarbonized.
Finally, both carbonated and uncarbonated MRCA were used to cast MRACspecimens accordingly. Push-out tests were conducted to investigate the effect ofcarbonation modification of MRCA on mechanical response of specimens whichrepresented the interfacial properties of MRAC, as shown in Fig. 5.19.
Table 5.8 MRCA and corresponding MRAC specimens
No. ofMRCA
w/c ofOHM
Whether the OHM wascarbonated
No. ofMRAC
w/c ofNHM
MRCA1 0.37 Carbonated MRAC1 0.45
MRCA2 0.37 Uncarbonated MRAC2 0.45
MRCA3 0.68 Carbonated MRAC3 0.45
MRCA4 0.68 Uncarbonated MRAC4 0.45
MRCA5 0.45 Carbonated MRAC5 0.37
MRCA6 0.45 Uncarbonated MRAC6 0.37
MRCA7 0.45 Carbonated MRAC7 0.45
MRCA8 0.45 Uncarbonated MRAC8 0.45
MRCA9 0.45 Carbonated MRAC9 0.68
MRCA10 0.45 Uncarbonated MRAC10 0.68
VP
18
9
5
56
7
42
3
11
10
1-Carbonation chamber 2-MRCA and mortar specimens 3-Desiccant 4-CO2gas storage
5-Value 6-Flow regulator 7-Safety value 8-Temperature and humidity inductor
9-Piezometer 10-Vacum pump 11-Data processor
Fig. 5.18 The accelerated carbonation testing apparatus
5.4 Modification of Modeled Recycled Aggregate Concrete by Carbonation 117

The measurement and loading systems are displayed in Fig. 5.20. A YHD-30displacement transducer was installed at the bottom of MRCA. The loading ratewas controlled at 0.05 mm/min. MRCA at the center of MRAC specimen waspushed out under vertical loading. Failure process was observed. In addition, loadand displacement were monitored and recorded by a computer acquisition system.
5.4.2 Experimental Results and Discussions
The experimental analysis was conducted mainly according to the failure processesand load-displacement curves, especially the peak load and the peak displacement.Peak load is the maximum push-out load, and the peak displacement is the dis-placement at the peak load.
5.4.2.1 Failure Patterns
The failure patterns are displayed from Figs. 5.21, 5.22, 5.23, and 5.24. In push-outtests, cracks appeared on the surface of some specimens with the increasing load.Most cracks initiated at old ITZ and connected with each other within OHM, andthen propagated into mortars until the specimen failed. However, a small quantityof cracks initiated within the NHM. Four major types of cracks can be found: Cracktype I, II, III and IV, as shown from Figs. 5.21, 5.22, 5.23, and 5.24.
mortar
Modeled
Old hardened
New ITZ
P
Old ITZ
New hardened aggregate
mortar
Fig. 5.19 ITZ in MRAC
aggregate
mortar
machine
Stiffened
Displacement
New hardened mortar
transducer
Old hardened
ModeledP
LVDT
press pole
LoadingFig. 5.20 Push-out testdevice
118 5 Modeled Recycled Aggregate Concrete

(a) (b) (c)
Fig. 5.21 Type I Cracks
(a) (b) (c) (d)
Fig. 5.22 Type II Cracks
(a) (b) (c)
Fig. 5.23 Type III Cracks
Fig. 5.24 Type IV Cracks
5.4 Modification of Modeled Recycled Aggregate Concrete by Carbonation 119
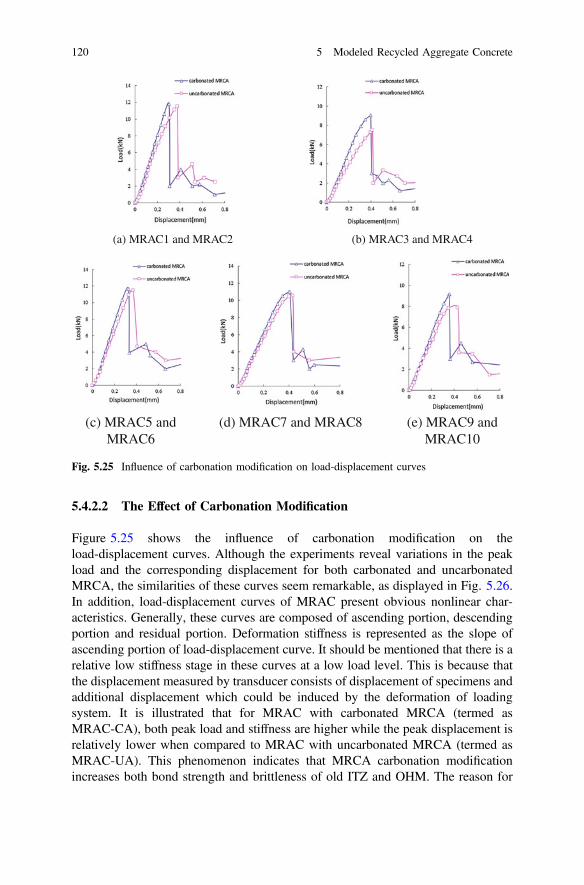
5.4.2.2 The Effect of Carbonation Modification
Figure 5.25 shows the influence of carbonation modification on theload-displacement curves. Although the experiments reveal variations in the peakload and the corresponding displacement for both carbonated and uncarbonatedMRCA, the similarities of these curves seem remarkable, as displayed in Fig. 5.26.In addition, load-displacement curves of MRAC present obvious nonlinear char-acteristics. Generally, these curves are composed of ascending portion, descendingportion and residual portion. Deformation stiffness is represented as the slope ofascending portion of load-displacement curve. It should be mentioned that there is arelative low stiffness stage in these curves at a low load level. This is because thatthe displacement measured by transducer consists of displacement of specimens andadditional displacement which could be induced by the deformation of loadingsystem. It is illustrated that for MRAC with carbonated MRCA (termed asMRAC-CA), both peak load and stiffness are higher while the peak displacement isrelatively lower when compared to MRAC with uncarbonated MRCA (termed asMRAC-UA). This phenomenon indicates that MRCA carbonation modificationincreases both bond strength and brittleness of old ITZ and OHM. The reason for
(a) MRAC1 and MRAC2 (b) MRAC3 and MRAC4
(c) MRAC5 and MRAC6
(d) MRAC7 and MRAC8 (e) MRAC9 and MRAC10
Fig. 5.25 Influence of carbonation modification on load-displacement curves
120 5 Modeled Recycled Aggregate Concrete

higher peak load of MRAC-CA may lie in the relative higher strength of OHM anda reduction of porosity around interfaces provoked by carbonation.
5.4.2.3 The Effect of NHM’s w/c
Figure 5.27 demonstrates the effect of NHM’s w/c on load-displacement curves. Inthis section, the w/c of OHM was 0.45, and the w/c of NHM varied from 0.37 to0.45 to 0.68. The test results illustrate that an increase of the w/c of NHM leads to a
S0
p
0
a
bc
d
SbSa
max
pb
pa
p
S
Fig. 5.26 Simplified modelload-displacement curves
(a) Carbonated (b) Uncarbonated
Fig. 5.27 Load-displacement curves with different w/c of NHM
5.4 Modification of Modeled Recycled Aggregate Concrete by Carbonation 121

reduction of peak load as well as the deformation stiffness for both MRAC-CA andMRAC-UA.
Figures 5.28 and 5.29 demonstrate the variation of the peak load and peakdisplacement being as a function of w/c for NHM respectively. It can be seen thatthe increasing w/c of new mortar leads to a linear reduction of the peak load forMRAC-CA and MRAC-UA. The peak load of MRAC-CA is always higher thanthat of MRAC-UA. Furthermore, with the increase of w/c of NHM, the effect ofcarbonation modification on peak load of MRAC is becoming more notable. Forinstance, for MRAC with 0.68 w/c of NHM, the peak load of MRAC-CA is 16.1%higher than that of MRAC-UA; whereas for MRAC with 0.37 w/c of NHM, thepeak load of MRAC-CA is only 1.2% higher than that of MRAC-UA. It meanscarbonation can undoubtedly improve the interfacial properties of MRCA, espe-cially when the w/c is relatively higher. This phenomenon may be caused byimprovement of compactness and porosity at interface between MRCA and NHM,and this improvement may be more remarkable when the w/c of new mortar ishigher. From Fig. 5.29, the peak displacement of MRAC-UA is always larger thanthat of MRAC with carbonated MRCA. For MRAC-UA, the increase of w/c forNHM increases the peak displacement. For MRAC-CA, when the w/c of new
Fig. 5.28 Influence of w/cfor NHM on peak load
Fig. 5.29 Influence of w/cfor NHM on peakdisplacement
122 5 Modeled Recycled Aggregate Concrete
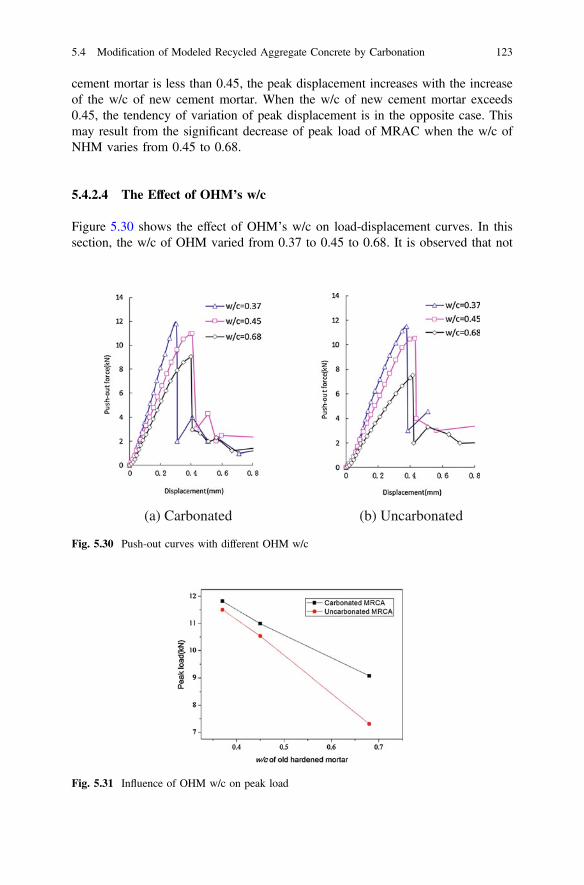
cement mortar is less than 0.45, the peak displacement increases with the increaseof the w/c of new cement mortar. When the w/c of new cement mortar exceeds0.45, the tendency of variation of peak displacement is in the opposite case. Thismay result from the significant decrease of peak load of MRAC when the w/c ofNHM varies from 0.45 to 0.68.
5.4.2.4 The Effect of OHM’s w/c
Figure 5.30 shows the effect of OHM’s w/c on load-displacement curves. In thissection, the w/c of OHM varied from 0.37 to 0.45 to 0.68. It is observed that not
(a) Carbonated (b) Uncarbonated
Fig. 5.30 Push-out curves with different OHM w/c
Fig. 5.31 Influence of OHM w/c on peak load
5.4 Modification of Modeled Recycled Aggregate Concrete by Carbonation 123

only the peak load but also the deformation stiffness of MRAC decreases as the w/cof OHM increases for both MRAC-CA and MRAC-UA.
Figures 5.31 and 5.32 demonstrate the variations of the peak load and peakdisplacement with w/c of OHM respectively. The peak load decreases with theincreasing w/c of OHM. The peak load of MRAC-CA is always higher than that ofMRAC-UA within the range of w/c of OHM from 0.37 to 0.68. Furthermore, withthe increase of w/c of OHM, the effect of carbonation on peak load of MRAC isbecoming increasingly obvious. In detail, when the w/c of OHM equals 0.37, thepeak load increases by 2.7% due to modification, while in the condition of 0.68 w/cof OHM, the increasing rate is 20.9%. It should be mentioned that this feature isconsistent with results for different w/c of NHM. Peak displacement increases atfirst and then decreases with the increasing w/c of OHM for MRAC-CA andMRAC-UA. The peak displacement of MRAC-CA is smaller than that ofMRAC-UA, indicating that brittleness was improved by carbonation.
5.4.3 Summary
(1) Carbonation can improve the interfacial properties of MRAC. Particularly, theeffect of modification is more significant when the w/c of both new hardenedmortar (NHM) and OHM is higher. On the other hand, carbonation candecrease the peak displacement of MRAC.
(2) The variation of interfacial properties is analyzed with the change of w/c ofNHM and OHM. For both carbonated and uncarbonated specimens, an increaseof w/c of NHM and OHM leads to a reduction of peak load.
(3) Most cracks initiated at ITZs and propagated into mortars. There are mainlyfour types of failure patterns in the push-out tests.
(4) This carbonation modification approach can provide an effective, environ-mental friendly and low-cost method for enhancing the interfacial properties ofRAC.
Fig. 5.32 Influence of OHMw/c on peak displacement
124 5 Modeled Recycled Aggregate Concrete

5.5 Chloride Diffusion in Modeled Recycled AggregateConcrete
5.5.1 Specimen Design
The present study attempts to build a chloride diffusivity model of RAC with onlyone RA. A five-phase composite with round, hexagonal, pentagon or quadrilateralRCA is proposed to represent the heterogeneous nature of RAC as realistically aspossible. Based on this new model, the geometrical and physical properties of thefive phase constituents as well as their interactions have been considered todetermine the chloride diffusivity of RAC. This study focuses on theone-recycled-aggregate model, where the chloride diffusion characteristics will beincorporated to reveal the particulars of the chloride diffusion in a hetero-structuredone-recycled-aggregate-model of multiple phases without modeling two or moreaggregates or actual RAC. For the purpose of simplicity, the randomness in actualRAC will also be neglected in this study.
The use of RCA (about 5–40 mm) in conjunction with recycled fine aggregates(RFAs) (about 0.15–5 mm) as sub-base materials has been widely studied [16, 17].Without any loss of generality, a representative model of 10 � 10 mm square slicewith unit thickness, as shown in Fig. 5.34, which is supposed to be taken from asemi-infinite RAC body with its surface exposed to a chloride-containing medium.The origin of the coordinates is located at the center of the square. The size of RA inthis model is determined in Sect. 3.2. It is assumed that the chloride diffusionmainly occurs in the x-direction, although the possible transverse diffusions in the y-direction due to the presence of structural heterogeneity are also considered. For thepurpose of simplicity, the external boundary of the new mortar in Fig. 5.33 isassumed to be the square boundary as shown in Fig. 5.34, while the other com-ponents remain the same.
New mortar
New ITZ
Old adhered mortar
Old ITZ
Original aggregate
Fig. 5.33 Five-phasecomposite sphere model
5.5 Chloride Diffusion in Modeled Recycled Aggregate Concrete 125

5.5.2 Simulation Procedure
The accurate dimension of each phase in the RAC model is calculated from theadhesive rate of the old adhered mortar (Rrm), the thickness of the ITZ, the RAvolume fraction (Fra) and the volume of the recycled model. For example, for around RA, the radius of the interfaces between the adjacent phases in the five-phaseRAC model can be defined to be R1, R2, R3 and R4, from inside to outside,successively (see Fig. 5.34), which can be calculated as follows
R3 ¼ffiffiffiffiffiffiffiffiffiffiffiffiffiffiffiFra � V
p
r) R4 ¼ R3 þ TITZ ) R2 ¼
ffiffiffiffiffiffiffiffiffiffiffiffiffiffiffiffiffiffiffiffiffiffiffiffið1� RrmÞR2
3
q) R1 ¼ R2 � TITZ
ð5:1Þ
Accordingly, for a regular polygon aggregate with n sides,
R3 ¼ffiffiffiffiffiffiffiffiffiffiffiffiffiffiffiffiffiffiffiffiffiffiffiffiffiffiffiffiffiffiffiffiffiffiffiffiffiFra � V � 2
n � sin 2pn
s) R4 ¼ R3 þ TITZ � sec pn ) R2 ¼
ffiffiffiffiffiffiffiffiffiffiffiffiffiffiffiffiffiffiffiffiffiffiffiffið1� RrmÞR2
3
q
) R1 ¼ R2 � TITZ secpn
ð5:2Þ
Software Abaqus is used in the FEM simulations. The type for selected step isvolume concentration with the value of 0.03. The transient analysis is selected. Thetime period is 3.1536 � 107 s, i.e., one year. The type of incrementation is auto-matic. The maximum number of increments is 105. The initial, minimum andmaximum increment sizes are 1 s, 1 s, 3.1536 � 107 s, respectively. Matrix storagein Equation Solver is unsymmetric. In the simulations, convert severe discontinuityiterations is propagated from previous step; extrapolation of previous state at start ofeach increment is linear. The 8-node quadratic heat transfer quadrilateral element isused for the FEM simulation with approximate global size of 0.3 mm in global
0,0
R4R3
R2R1
Chloride
5,-5-5,-5
-5,5 5,5Fig. 5.34 Modeled RAC forsimulation
126 5 Modeled Recycled Aggregate Concrete

seeds, and the maximum deviation factor is 0.1 mm in global seeds. About 3529elements are generated in each RAC model. The details in the RAC model areshown in Fig. 5.35.
5.5.3 Parametric Study
The main parameters affecting the diffusivity of the MRAC are the position, theRAs volume fraction (Fra), the RAs shapes, the boundary conditions, the adhesiverate of the old adhered mortar (Rrm), i.e., the ratio of the volume of the old attachedmortar to that of the RA, and the thickness of ITZ. The total chloride amount CT atthe boundary X = 5 mm can be calculated by integrating the chloride concentrationat time t, as follows.
CT ¼Z5mm
�5mm
Cð5; yÞ dy ð5:3Þ
where C(5, y) is the mean chloride concentration (�10−1 mg/mm3) at X = 5 mmand time t = 31,536,000 s (one year). Based on the Fick’s second law [11], thechloride effective diffusivity Deff can be calculated by
Deff ¼ x2
4 erfc�1 CmeanCs
� �h i2t
ð5:4Þ
where Cs is the boundary conditions of chloride concentration (�10−1 mg/mm3),and erfc−1() is the inverse complementary error function, Cmean is the mean value ofCT at the position of x and the mean value of chloride amount along the boundaryX = 5 mm is calculated by Cmean = CT � 10 mm.
Fig. 5.35 Details in modeled RAC by FEM
5.5 Chloride Diffusion in Modeled Recycled Aggregate Concrete 127

For an arbitrary RA in the MRAC, the chloride concentration varies in thedifferent location surrounding the RA, as demonstrated in Fig. 5.36. The totalchloride amount on the boundary at x = −5 mm is set to be Cs = 0.03 (�10−1
mg/mm3) � 10 (mm2), where 10 (mm2) is the area of boundary surface. In theFEM simulations, in order to analyze the effect of the fluctuating chloride con-centration distribution along the boundary on the effective diffusivity Cs, three typesof chloride concentration distribution on the boundary at x = −5 mm will beconsidered as shown in Fig. 5.37. For the first type, i.e., the bulge boundary, Cs1 iscalculated by
Cs1 ¼ 0:3p10� p� 20
� 1� cosp � y10
� �� �� ð�10�1 mg=mm3Þ: ð5:5Þ
Aggregate
Aggregates
Aggregate
Fig. 5.36 The Chloride ionflow in concrete
Bulge boundry
Constant boundry
Concave boundry
0,0
R4R3
R2R1
Fig. 5.37 The variation ofsurface chloride concentrationalong the boundary edge
128 5 Modeled Recycled Aggregate Concrete

For the second type the chloride concentration on the boundary at x = −5 mm isCs2 = 0.03 (�10−1 mg/mm3), which matches what suggested by Wang et al. [18].For the third type, i.e., concave boundary, Cs3 is calculated using
Cs2 ¼ 0:15p � cos p � y10
� �� ð�10�1mg=mm3Þ: ð5:6Þ
Additionally, for the same RA with the regular pentagon, three types of theconcentration boundary, namely, the left boundary (at x = −5 mm), the lowerboundary (at y = −5 mm) and the upper boundary (at y = 5 mm), will be discussednext.
The chloride diffusivities of each phase used in the FEM simulation isapproximately determined by the mean value of the diffusivities. The six casestudies and the corresponding parameters used in the FEM simulations are given inTables 5.9 and 5.10.
5.5.4 Results and Discussions
5.5.4.1 Position Effect
For Case I, the chloride concentration distributions in MRAC with round aggregateare shown in Fig. 5.38. The horizontal variations of the chloride concentration at
Table 5.9 The parameters in the FEM simulations
Case Boundaryconcentration(�10−1 mg/mm3)
RA shape Adhesive rate of oldadhered mortar (Rrm)
Thickness ofboth new andold ITZ (µm)
RAvolumefraction(Fra)
I 0.03 Round 0.68 50 0.4
II 0.03 Round 0.12 50 0.3, 0.4,0.5, 0.6
III 0.03 Square, round,regularpentagon,regular hexagon
0.68 50 0.4
IV 0.03,Eqs. (5.5)and (5.6)
Round 0.68 50 0.4
V 0.03 Round 0.04, 0.12, 0.2, 0.28,0.36, 0.44, 0.52, 0.6,0.68, 0.76, 0.84, 0.92
50 0.4
VI 0.03 Round 0.68 5, 20, 35, 50,65
0.4
5.5 Chloride Diffusion in Modeled Recycled Aggregate Concrete 129
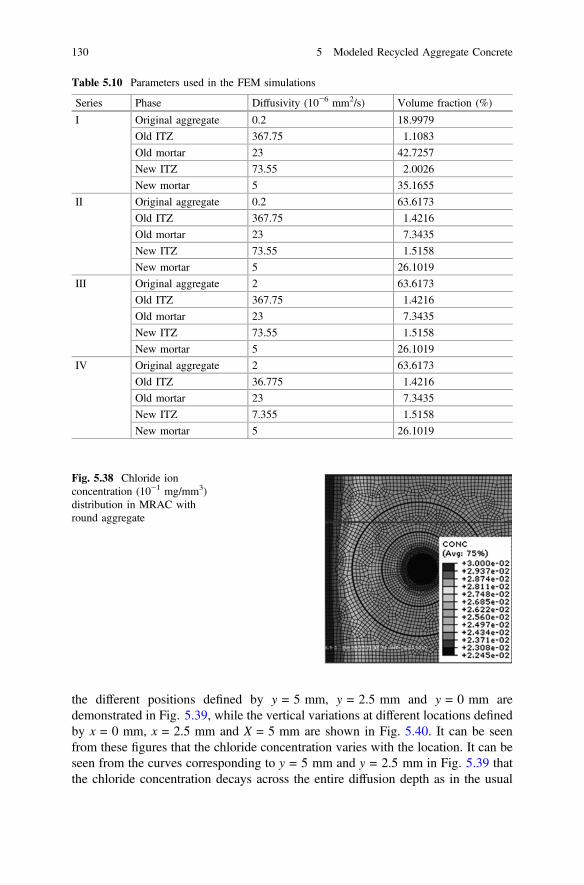
the different positions defined by y = 5 mm, y = 2.5 mm and y = 0 mm aredemonstrated in Fig. 5.39, while the vertical variations at different locations definedby x = 0 mm, x = 2.5 mm and X = 5 mm are shown in Fig. 5.40. It can be seenfrom these figures that the chloride concentration varies with the location. It can beseen from the curves corresponding to y = 5 mm and y = 2.5 mm in Fig. 5.39 thatthe chloride concentration decays across the entire diffusion depth as in the usual
Table 5.10 Parameters used in the FEM simulations
Series Phase Diffusivity (10−6 mm2/s) Volume fraction (%)
I Original aggregate 0.2 18.9979
Old ITZ 367.75 1.1083
Old mortar 23 42.7257
New ITZ 73.55 2.0026
New mortar 5 35.1655
II Original aggregate 0.2 63.6173
Old ITZ 367.75 1.4216
Old mortar 23 7.3435
New ITZ 73.55 1.5158
New mortar 5 26.1019
III Original aggregate 2 63.6173
Old ITZ 367.75 1.4216
Old mortar 23 7.3435
New ITZ 73.55 1.5158
New mortar 5 26.1019
IV Original aggregate 2 63.6173
Old ITZ 36.775 1.4216
Old mortar 23 7.3435
New ITZ 7.355 1.5158
New mortar 5 26.1019
Fig. 5.38 Chloride ionconcentration (10−1 mg/mm3)distribution in MRAC withround aggregate
130 5 Modeled Recycled Aggregate Concrete

cases where homogeneous diffusion conceptions were utilized [19]. As illustrated inthe curve corresponding to y = 0 mm, however, a chloride concentration curve forCase I with respect to a diffusion time of 1 year demonstrates a tunnel-like pitinstead of a smooth surface, whose location appears to be spatially corresponding tothe old aggregate. Moreover, it is easy to find that the tunnel pits have theirprofundities reduced with the increasing diffusion depth. A closer observation canalso reveal that for each old aggregate there is a conspicuous widened pit mouth onthe two-dimensional concentration profile. Obviously, these simulation resultsindicate that the large chloride diffusivity difference between the aggregates andtheir surrounding mortar may remarkably complicate the chloride diffusionbehavior in a hetero-structural RAC, although the complexity against the smoothprofile for a homogeneous medium may diminish gradually as the diffusion depthincreases, which is similar to Zeng’s study [20].
As can be seen from Fig. 5.40, the chloride concentration fluctuates alongx = 2.5 mm and X = 5 mm, while it features a tunnel-like pit instead of a smoothsurface for the line x = 0 mm. This is mainly because the x = 0 and y = 0 curves gothrough the center of the original aggregate, which restrains the chloride diffusiongreatly. This agrees well with the chloride test results using electron probemicro-analyzer from the literature.
5.5.4.2 RA Volume Fraction Effect
For Case II, four chloride concentration profiles at X = 5 mm are reported inFig. 5.41. The chloride concentration at X = 5 fluctuates in a wide range from0.0195 to 0.215 (�10−1 mg/mm3) and decreases entirely with the increase of Fra.
Fig. 5.39 Concentrationprofiles along the diffusiondepth
5.5 Chloride Diffusion in Modeled Recycled Aggregate Concrete 131

The troughs of the curves in Fig. 5.41 reasonably account for the influence of RAs,which restrain the chloride diffusion.
Figure 5.42 presents the total chloride amount at the surface X = 5 mm as afunction of Fra. The values of the total chloride amount are in the range of 0.217(�10−1 mg) to 0.235 (�10−1 mg) corresponding to the value of Fra changing from0.3 to 0.6. It is interesting to note that both the chloride amount and the effectivechloride diffusivity decrease linearly with the increase of Fra, which can beexplained by the effects of both the original aggregate and the old adhered mortar.
Fig. 5.40 Concentrationprofiles along the diffusiontransverse line
0.019
0.0195
0.02
0.0205
0.021
0.0215
-5 -4 -3 -2 -1 0 1 2 3 4 5
Chl
orid
e co
ncen
trat
ion
(10
- 1mg/mm
3 )
Y (mm)
Fra=0.3Fra=0.4Fra=0.5Fra=0.6
Fig. 5.41 Chloride ionconcentration on the surfaceas X = 5 mm
132 5 Modeled Recycled Aggregate Concrete
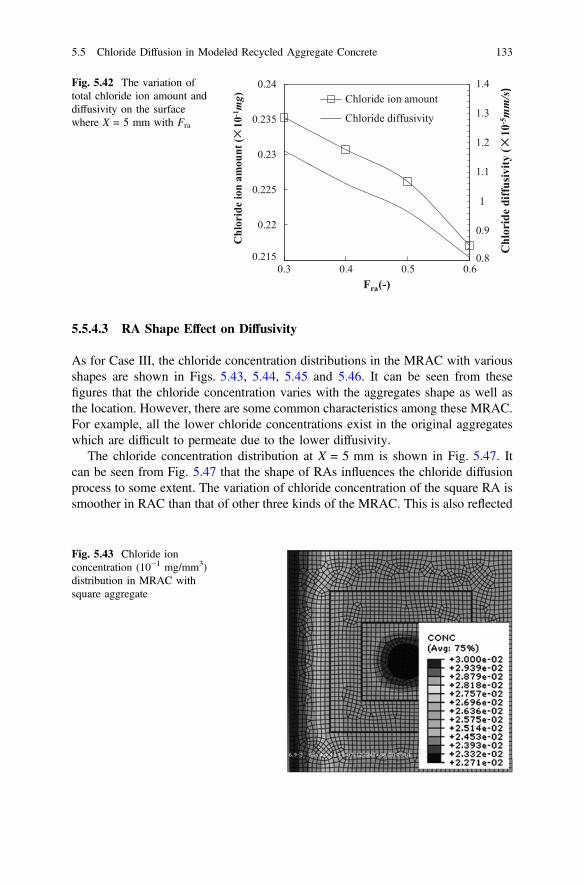
5.5.4.3 RA Shape Effect on Diffusivity
As for Case III, the chloride concentration distributions in the MRAC with variousshapes are shown in Figs. 5.43, 5.44, 5.45 and 5.46. It can be seen from thesefigures that the chloride concentration varies with the aggregates shape as well asthe location. However, there are some common characteristics among these MRAC.For example, all the lower chloride concentrations exist in the original aggregateswhich are difficult to permeate due to the lower diffusivity.
The chloride concentration distribution at X = 5 mm is shown in Fig. 5.47. Itcan be seen from Fig. 5.47 that the shape of RAs influences the chloride diffusionprocess to some extent. The variation of chloride concentration of the square RA issmoother in RAC than that of other three kinds of the MRAC. This is also reflected
0.8
0.9
1
1.1
1.2
1.3
1.4
0.215
0.22
0.225
0.23
0.235
0.24
0.3 0.4 0.5 0.6
Chl
orid
e di
ffus
ivity
(10
-5mm/s)
Chl
orid
e io
n am
ount
(10
- 1mg)
Fra(-)
Chloride ion amount
Chloride diffusivity
Fig. 5.42 The variation oftotal chloride ion amount anddiffusivity on the surfacewhere X = 5 mm with Fra
Fig. 5.43 Chloride ionconcentration (10−1 mg/mm3)distribution in MRAC withsquare aggregate
5.5 Chloride Diffusion in Modeled Recycled Aggregate Concrete 133
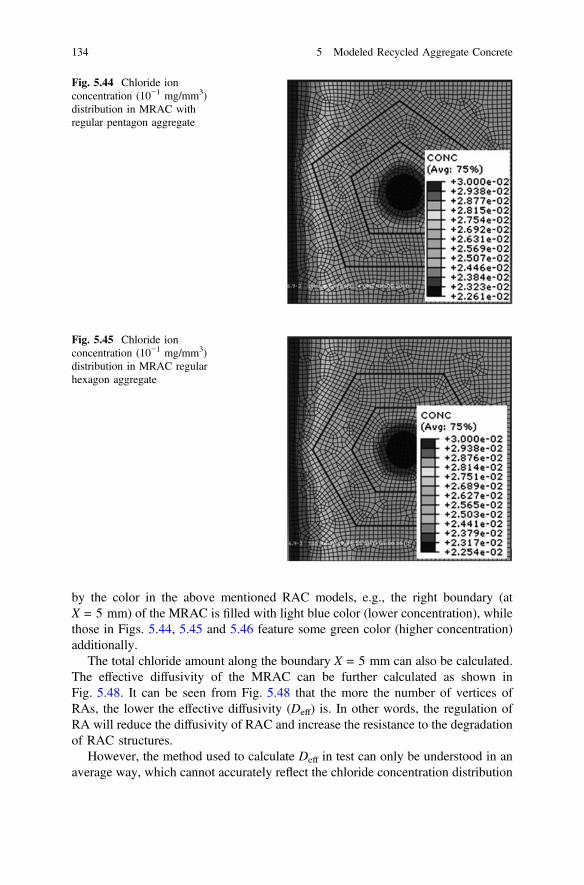
by the color in the above mentioned RAC models, e.g., the right boundary (atX = 5 mm) of the MRAC is filled with light blue color (lower concentration), whilethose in Figs. 5.44, 5.45 and 5.46 feature some green color (higher concentration)additionally.
The total chloride amount along the boundary X = 5 mm can also be calculated.The effective diffusivity of the MRAC can be further calculated as shown inFig. 5.48. It can be seen from Fig. 5.48 that the more the number of vertices ofRAs, the lower the effective diffusivity (Deff) is. In other words, the regulation ofRA will reduce the diffusivity of RAC and increase the resistance to the degradationof RAC structures.
However, the method used to calculate Deff in test can only be understood in anaverage way, which cannot accurately reflect the chloride concentration distribution
Fig. 5.44 Chloride ionconcentration (10−1 mg/mm3)distribution in MRAC withregular pentagon aggregate
Fig. 5.45 Chloride ionconcentration (10−1 mg/mm3)distribution in MRAC regularhexagon aggregate
134 5 Modeled Recycled Aggregate Concrete

in every point in mesoscope if the effect of RA shape is considered. For example,the peak value of chloride concentration with round shape RA is greatly larger thanthat with square shape RA as shown in Fig. 5.47, although Deff with round shapeRA is smaller than that with square shape RA in Fig. 5.48. Because the corrosion ofsteel bar in reinforced concrete structure usually begins with pit corrosion causedmainly by the localized chloride concentration, it is important to control the RAshape surrounding steel bar, which will greatly influence the chloride concentration(see Fig. 5.47).
Additionally, the position of chloride concentration boundary can also affect thediffusion process and the chloride ion diffusivity. The simulation results indicatethat the location of concentration boundary conditions can also influence thechloride distribution (see Fig. 5.49), and thus Deff which varies in the range of3.562 � 10−5 (mm2/s) to 3.621 � 10−5 (mm2/s) (see Fig. 5.50).
Fig. 5.46 Chloride ionconcentration (10−1 mg/mm3)distribution MRAC withround aggregate
Fig. 5.47 Chloride ionconcentration at X = 5 mm
5.5 Chloride Diffusion in Modeled Recycled Aggregate Concrete 135
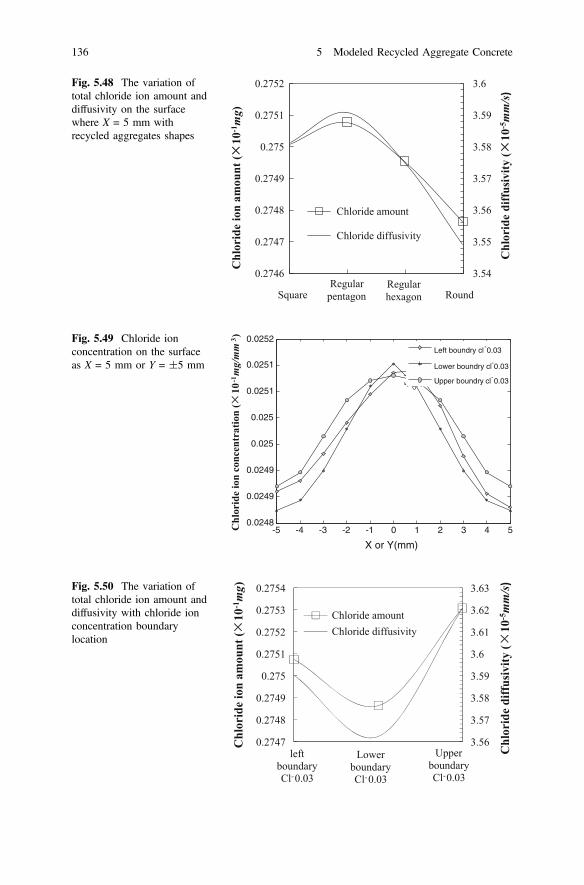
SquareRegular
pentagonRegular hexagon Round
3.54
3.55
3.56
3.57
3.58
3.59
3.6
0.2746
0.2747
0.2748
0.2749
0.275
0.2751
0.2752
Chl
orid
e di
ffus
ivity
(10
-5mm/s)
Chl
orid
e io
n am
ount
(10
-1mg )
Chloride amount
Chloride diffusivity
Fig. 5.48 The variation oftotal chloride ion amount anddiffusivity on the surfacewhere X = 5 mm withrecycled aggregates shapes
-5 -4 -3 -2 -1 0 1 2 3 4 50.0248
0.0249
0.0249
0.025
0.025
0.0251
0.0251
0.0252
X or Y(mm)
Chl
orid
e io
n co
ncen
trat
ion
(10
-1mg/mm
3 )
Left boundry cl-0.03
Lower boundry cl-0.03
Upper boundry cl-0.03
Fig. 5.49 Chloride ionconcentration on the surfaceas X = 5 mm or Y = ±5 mm
left boundary Cl-0.03
Lower boundary Cl-0.03
Upper boundary Cl-0.03
3.56
3.57
3.58
3.59
3.6
3.61
3.62
3.63
0.2747
0.2748
0.2749
0.275
0.2751
0.2752
0.2753
0.2754
Chl
orid
e di
ffus
ivity
(10
-5mm/s)
Chl
orid
e io
n am
ount
(10
-1mg)
Chloride amountChloride diffusivity
Fig. 5.50 The variation oftotal chloride ion amount anddiffusivity with chloride ionconcentration boundarylocation
136 5 Modeled Recycled Aggregate Concrete

5.5.4.4 Boundary Effect
For Case IV, the comparison between the colors in Figs. 5.51 and 5.52 exhibits theprofound difference of the chloride diffusion process due to the variation ofboundary conditions. The comparisons of the chloride concentration distributionsand the amount of chloride at the boundary X = 5 mm are shown in Fig. 5.53. Itappears that larger chloride concentration on the boundary in the middle side isfavorable to the chloride diffusion than that on the both ends.
Fig. 5.51 Chloride ionconcentration (10−1 mg/mm3)distribution with concaveboundary
Fig. 5.52 Chloride ionconcentration (10−1 mg/mm3)distribution with bulgeboundary
5.5 Chloride Diffusion in Modeled Recycled Aggregate Concrete 137
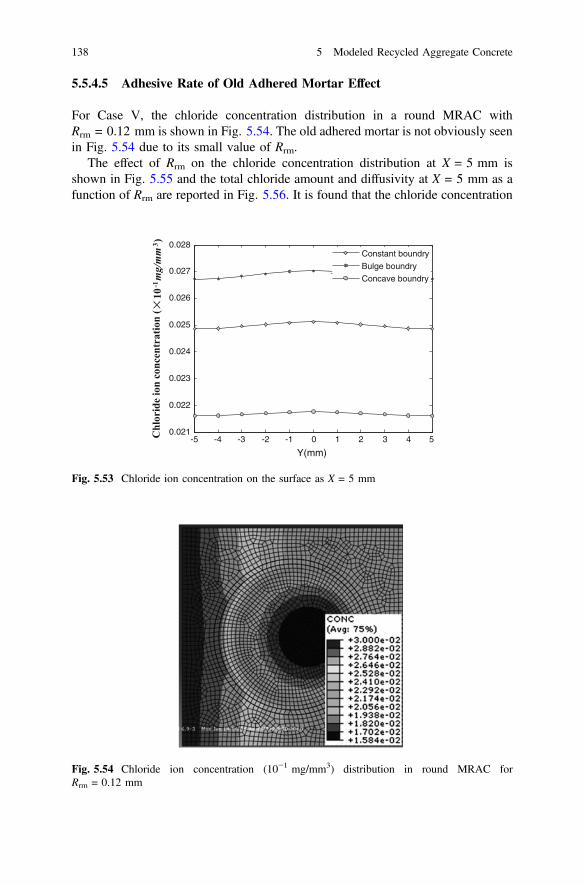
5.5.4.5 Adhesive Rate of Old Adhered Mortar Effect
For Case V, the chloride concentration distribution in a round MRAC withRrm = 0.12 mm is shown in Fig. 5.54. The old adhered mortar is not obviously seenin Fig. 5.54 due to its small value of Rrm.
The effect of Rrm on the chloride concentration distribution at X = 5 mm isshown in Fig. 5.55 and the total chloride amount and diffusivity at X = 5 mm as afunction of Rrm are reported in Fig. 5.56. It is found that the chloride concentration
-5 -4 -3 -2 -1 0 1 2 3 4 50.021
0.022
0.023
0.024
0.025
0.026
0.027
0.028
Y(mm)
Chl
orid
e io
n co
ncen
trat
ion
(10
-1mg/mm
3 )
Constant boundry
Bulge boundry
Concave boundry
Fig. 5.53 Chloride ion concentration on the surface as X = 5 mm
Fig. 5.54 Chloride ion concentration (10−1 mg/mm3) distribution in round MRAC forRrm = 0.12 mm
138 5 Modeled Recycled Aggregate Concrete
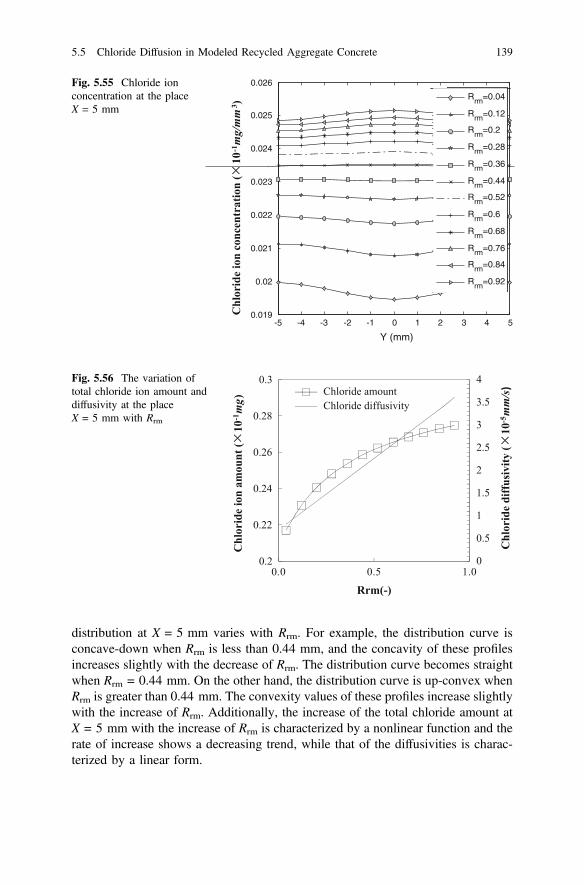
distribution at X = 5 mm varies with Rrm. For example, the distribution curve isconcave-down when Rrm is less than 0.44 mm, and the concavity of these profilesincreases slightly with the decrease of Rrm. The distribution curve becomes straightwhen Rrm = 0.44 mm. On the other hand, the distribution curve is up-convex whenRrm is greater than 0.44 mm. The convexity values of these profiles increase slightlywith the increase of Rrm. Additionally, the increase of the total chloride amount atX = 5 mm with the increase of Rrm is characterized by a nonlinear function and therate of increase shows a decreasing trend, while that of the diffusivities is charac-terized by a linear form.
-5 -4 -3 -2 -1 0 1 2 3 4 50.019
0.02
0.021
0.022
0.023
0.024
0.025
0.026
Y (mm)
Rrm
=0.04
Rrm
=0.12
Rrm
=0.2
Rrm
=0.28
Rrm
=0.36
Rrm
=0.44
Rrm
=0.52
Rrm
=0.6
Rrm
=0.68
Rrm
=0.76
Rrm
=0.84
Rrm
=0.92
Chl
orid
e io
n co
ncen
trat
ion
(10
-1mg/mm
3 )
Rrm=0.04
Rrm=0.12
Rrm=0.2
Rrm=0.28
Rrm=0.36
Rrm=0.44
Rrm=0.52
Rrm=0.6
Rrm=0.68
Rrm=0.76
Rrm=0.84
Rrm=0.92
Fig. 5.55 Chloride ionconcentration at the placeX = 5 mm
0
0.5
1
1.5
2
2.5
3
3.5
4
0.2
0.22
0.24
0.26
0.28
0.3
0.0 0.5 1.0
Chl
orid
e di
ffus
ivity
(10
-5mm/s)
Chl
orid
e io
n am
ount
(10
-1mg )
Rrm(-)
Chloride amountChloride diffusivity
Fig. 5.56 The variation oftotal chloride ion amount anddiffusivity at the placeX = 5 mm with Rrm
5.5 Chloride Diffusion in Modeled Recycled Aggregate Concrete 139
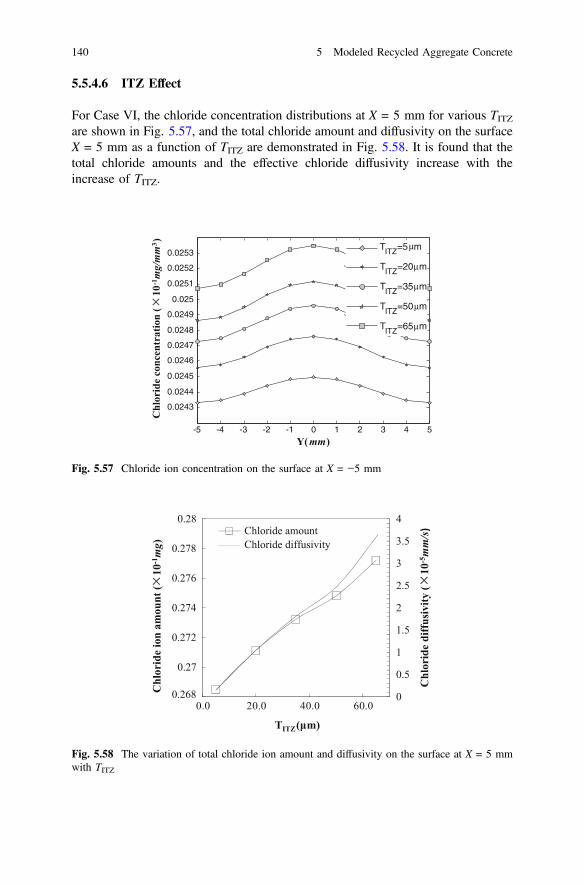
5.5.4.6 ITZ Effect
For Case VI, the chloride concentration distributions at X = 5 mm for various TITZare shown in Fig. 5.57, and the total chloride amount and diffusivity on the surfaceX = 5 mm as a function of TITZ are demonstrated in Fig. 5.58. It is found that thetotal chloride amounts and the effective chloride diffusivity increase with theincrease of TITZ.
-5 -4 -3 -2 -1 0 1 2 3 4 5
0.0243
0.0244
0.0245
0.0246
0.0247
0.0248
0.0249
0.025
0.0251
0.0252
0.0253
Chl
orid
e co
ncen
trat
ion
(10
-1mg/mm
3 ) TITZ=5 m
TITZ=20 m
TITZ=35 m
TITZ=50 m
TITZ=65 m
Y(mm)
µ
µ
µ
µ
µ
Fig. 5.57 Chloride ion concentration on the surface at X = −5 mm
0
0.5
1
1.5
2
2.5
3
3.5
4
0.268
0.27
0.272
0.274
0.276
0.278
0.28
0.0 20.0 40.0 60.0
Chl
orid
e di
ffus
ivity
(10
-5mm/s)
Chl
orid
e io
n am
ount
(10
-1mg)
TITZ(μm)
Chloride amountChloride diffusivity
Fig. 5.58 The variation of total chloride ion amount and diffusivity on the surface at X = 5 mmwith TITZ
140 5 Modeled Recycled Aggregate Concrete

5.6 Concluding Remarks
This chapter introduced the micro structure and failure process, as well as chloridediffusion of recycled aggregate concrete (RAC) through a new definition of mod-eled recycled aggregate concrete (MRAC). The following conclusions can bedrawn.
(1) The global cracks basically developed along the loading direction for all themodeled cement-based materials. For modeled natural aggregate concrete(MNAC), the first crack appeared around the interfacial properties zone (ITZ),and then propagated into the mortar matrix. In MRAC, the initial cracksoccurred around both new and old ITZs, and propagated across the old mortarregion connecting with each other. Understanding of the differences in thefailure processes between MRAC and MNAC can provide insights into thefailure mechanism of RAC. Such understanding can be used to improve themechanical properties of RAC through optimization of the mixture proportions.
(2) From the results presented in this simulation, it is evident that the stress con-centration and incompatibility are primary factors influencing the microcrackdevelopment of RAC. The higher relative elastic moduli of both ITZs to cementmortar and new cement mortar to old cement mortar can be expected to reducethe stress concentration and improve the compatibility of RAC. The simulationresults can provide useful information for optimizing mixture proportion designof RAC. Improving the properties of ITZs may reduce the stress concentrationand then enhance the mechanical properties of RAC. High-strength RAC canbe obtained by optimizing the mixing design such as water-to-binder ratio andsilica fume additive.
(3) Effective chloride diffusivity (Deff) decreases with the increasing RCA volumefraction, but increases with the increase of the adhesive rate of the old adheredmortar and the thickness of ITZ. The chloride diffusion process is also influ-enced by the RCA shape to some extent. The more the number of equilateralpolygon of RA, the lower the Deff is, namely, the regulation of RCA can reducethe Deff of the RAC model. In addition, the variation of chloride concentrationboundary can also affect the diffusion process and diffusivity of chloride. Largerchloride concentration on the boundary in the middle side is favor to thediffusion than that on the both ends for the same chloride amount on theboundary. Moreover, the comparison of Deff calculated from theoreticalequation and numerical simulation exhibits reasonable correlation.
5.6 Concluding Remarks 141

References
1. Xiao JZ. Recycled concrete. Beijing: Chinese Building Construction Publishing Press; 2008(in Chinese).
2. Xiao JZ, Liu Q, Li WG, Tam V. On the micro- and meso-structure and failure mechanism ofrecycled concrete. J Qingdao Technol Univ. 2009;30(4):24–30 (in Chinese).
3. Poon CS, Shui ZH, Lam L. Effect of microstructure of ITZ on compressive strength ofconcrete prepared with recycled aggregates. Constr Build Mater. 2004;18(6):461–8.
4. Etxeberria M, Vázquez E, Marí A. Microstructure analysis of hardened recycled aggregateconcrete. Mag Concrete Res. 2006;58(10):683–90.
5. Tam VWY, Gao XF, Tam CM. Microstructural analysis of recycled aggregate concreteproduced from two-stage mixing approach. Cem Concr Res. 2005;35(6):1195–203.
6. Maji AK, Shah SP. Application of acoustic emission and laser holography to studymicrofracture in concrete. In: Lew HS, editor. Nondestructive testing, SP-112. FarmingtonHills, MI: American Concrete Institute; 1989. p. 83–110.
7. Choi S, Shah SP. Propagation of microcracks in concrete studied with subregion scanningcomputer vision (SSCV). ACI Mater J. 1999;96(2):255–60.
8. Buyukozturk O, Nilson AH, Slate FO. Stress-strain response and fracture of a concrete modelin biaxial loading. ACI J. 1971;68(8):590–9.
9. Tregger N, Corr D, Graham-Brady L, Shah S. Modeling the effect of mesoscale randomnesson concrete fracture. Probab Eng Mech. 2006;21(3):217–25.
10. Xiao JZ, Li JB, Zhang C. Mechanical properties of recycled aggregate concrete under uniaxialloading. Cem Concr Res. 2005;35(6):1187–94.
11. Zhang DS, Luo M, Arola DD. Displacement/strain measurements using an optical microscopeand digital image correlation. Opt Eng. 2006;45(3):033605.
12. Xiao JZ, Li WG, Sun ZH, Shah SP. Crack propagation in recycled aggregate concrete underuniaxial compressive loading. ACI Mater J. 2012;109(4):451–62.
13. Mitsui K, Li ZJ, Lange DA, Shah SP. Relationship between microstructure and mechanicalproperties of paste-aggregate interface. ACI Mater J. 1994;91(1):30–9.
14. Ramesh G, Sotelino ED, Chen WF. Effect of transition zone on elastic moduli of concretematerials. Cem Concr Res. 1996;26(4):611–22.
15. Xiao J, Li L, Shen L, Yuan J. Effects of strain rate on mechanical behavior of modeled recycledaggregate concrete under uniaxial compression. Constr Build Mater. 2015;93:214–22.
16. Kou SC, Poon CS. Properties of concrete prepared with crushed fine stone, furnace bottomash and fine recycled aggregate as fine aggregates. Constr Build Mater. 2009;23(8):2877–86.
17. Kou SC, Poon CS. Properties of self-compacting concrete prepared with coarse and finerecycled concrete aggregates. Cement Concr Compos. 2009; 31(Compendex):622–627.
18. Wang L, Soda M, Ueda T. Simulation of chloride diffusivity for cracked concrete based onRBSM and truss network model. J Adv Concr Technol. 2008;6(1):143–55.
19. Villagran-Zaccardi YA, Zega CJ, Di Maio AA. Chloride penetration and binding in recycledconcrete. J Mater Civ Eng. 2008;20(6):449–55.
20. Zeng YW. Modeling of chloride diffusion in hetero-structured concretes by finite elementmethod. Cement Concr Compos. 2007;29(7):559–65.
21. Xiao J, Li W, Corr DJ, Shah SP. Simulation study on the stress distribution in modeledrecycled aggregate concrete under uniaxial compression. ASCE. J Mater Civ Eng. 2013;25(4):504–18.
142 5 Modeled Recycled Aggregate Concrete

Chapter 6Strength of Recycled Aggregate Concrete
Abstract This chapter intensively studied the strength indexes of recycledaggregate concrete (RAC), which includes the RAC compressive strength, tensilestrength, flexural strength, the relationship of the conversion coefficients of RACmechanical index, and the effects of elevated temperatures on the RAC strengths.The research results in this chapter are very important and useful for comprehen-sively understanding RAC material’s mechanical properties and their differenceswith natural aggregate concrete (NAC).
6.1 Compressive Strength
Due to the differences in the physical properties between recycled coarse aggregate(RCA) and natural coarse aggregate (NCA), there are many differences for theproperties of RAC compared to those of NAC. The compressive strength is themost important mechanical property of RAC, and it is the foundation to evaluateother mechanical properties. The following content in this section is based on theresearch done by the author as well as from literatures gathered from within Chinaand worldwide.
Malhotra [1], Buck [2], Sri and Tam [3], Dhir et al. [4], Limachiya et al. [5], andGupta [6] found that the compressive strength of RAC follows a similar patternwith NAC when undergoing curing.
Based on the overall analysis of the results at the early stage, Nixon [7] foundthat the compressive strength of RAC decreased by 20% when compared to NAC.Later on BCS [8] noticed similar results in laboratory tests, and according to thistest results the compressive strength of RAC decreased by between 14 and 32%when compared to NAC. Wesche and Schulz [9] compared the test results at theearly stage achieved by Buck [2], Malhotra [1], and Frondistou-Tannas [10] dis-covered that the compressive strength of RAC decreased by approximately 10%when compared to NAC.
Research carried out by Sri and Tam [3] showed that the compressive strength ofRAC decreased by 8–24% when compared to NAC.
© Springer-Verlag GmbH Germany 2018J. Xiao, Recycled Aggregate Concrete Structures,Springer Tracts in Civil Engineering, https://doi.org/10.1007/978-3-662-53987-3_6
143

Gerardu and Hendriks [11] pointed out that the compressive strength of RAC isabout 95% of that of NAC. Hansen [12] made a comprehensive review of the RACresearch carried out between 1945 and 1985 and found that the compressivestrength of RAC is approximately 5–24% lower than that of NAC.
The test carried out by Ramamurthy and Gumaste [13] discovered that thecompressive strength of RAC is lower than that of NAC by roughly between 15 and24%. The test carried out by Mandal and Gupta [14] discovered that the com-pressive strength of RAC is lower than that of NAC by approximately 15% at allcuring stages. At the same time, they pointed out that the main reason for lowcompressive strength of RAC is the weak interface transition zone (ITZ) betweenNCA and old mortar, and the weak ITZ between the RCA and new mortar in RAC.
However, Yoda et al.’s test results [15] are contrary to the above test results, hefound out that the compressive strength of RAC is 8.5% higher than that of NAC.Ridzuan et al. [16] discovered that in comparison with NAC, the RAC compressivestrength is higher than that of NAC by 2–20%. Hansen and Narud [17] and Salem[18] also confirmed this point.
Gupta’s test [6] discovered that when the water-cement ratio (w/c) is lower, thecompressive strength of RAC is lower than that of NAC at the same curing time.But when the w/c ratio is higher, the compressive strength of RAC is higher thanthat of NAC, and the compressive strength of RAC does not decrease with theincrease in w/c ratio. In this test, when the w/c ratio is 0.6, the compressive strengthof RAC is the highest, and when the w/c ratio is 0.55, the compressive strength ofRAC is the lowest.
In order to continue studying factors influencing the compressive strength ofRAC during curing, the authors carried out an experiment to study the compressivestrength of RAC based on 635 cubes in the Concrete Material Research Laboratory,Tongji University, China. The following is the analysis of the test results achievedand an introduction to the basic properties of RAC.
6.1.1 The Characteristics of Cube Compressive Strength
Figure 6.1 shows the cube compressive strength with the w/c ratio 0.43 and 0.47and its development with curing age. In the figure, it can be seen that the devel-opment trend of the compressive strength of both RAC and NAC is basically thesame percentage. It is important to note that no matter how much NCA is replaced,at 28d and 90d, the increase in the compressive strength of RAC is higher than thatof NAC, showing that during this stage the compressive strength of RAC increasesmuch more rapidly. The reason may be that, during concrete mixing, the waterabsorbed by the RCA may be lost during cement hydration, allowing RAC tomaintain moisture at a longer duration of time, forming up an inner curing effect,enabling the compressive strength of RAC to keep increasing.
144 6 Strength of Recycled Aggregate Concrete

The concrete age coefficient is set to be a ratio of a certain concrete compressivestrength and compressive strength at 28d. Table 6.1 shows the relative cubecompressive strength with the different w/c and the curing age ranging from 7 to360 days. From Table 6.1 it can be seen that before 90d, the curing coefficient ofNAC is lower than that of RAC, and later on the curing coefficient of NAC is higherthan that of RAC. This demonstrates that curing before 90d the development of thecompressive strength of the RAC is faster than that of NAC, and after passingcuring of 90d, the development of the compressive strength of RAC becomesslower than that of NAC.
6.1.2 Factors Influencing the Cube Compressive Strength
There are many factors influencing the compressive strength of RAC, mainlyincluding: the replacement percentage of RCA, w/c ratio, bricks content, source ofRCA, content of recycled fine aggregates (RFAs), etc.
0
10
20
30
40
50
60
0 100 200 300 400Age days
Com
pres
sive
Stre
ngth
MPa
RC-0RC-30RC-50RC-70RC-100
0
10
20
30
40
50
60
0 100 200 300 400Age days
Com
pres
sive
Stre
ngth
MPa
RC-0RC-30RC-50RC-70RC-100
w/c =0.43 w/c =0.47(a) (b)
Fig. 6.1 Different effects of the replacement percentage on the development of the compressivestrength of the RAC
Table 6.1 Relative cubecompressive strength of RACwith the different w/c ratioand the curing age
Serial no. w/c 7d 14d 28d 90d 180d 360d
RC-0 0.43 0.62 0.75 1.00 1.16. 1.45 1.55
RC-30 0.43 0.73 0.84 1.00 1.49 1.33 1.54
RC-50 0.43 0.75 0.88 1.00 1.31 1.32 1.36
RC-70 0.43 0.73 0.83 1.00 1.35 1.41 1.44
RC-100 0.43 0.58 0.73 1.00 1.37 1.50 1.61
RC-0 0.47 0.61 0.63 1.00 1.20 1.42 1.63
RC-30 0.47 0.56 0.71 1.00 1.36 1.32 1.49
RC-50 0.47 0.76 0.88 1.00 1.24 1.19 1.31
RC-70 0.47 0.67 0.82 1.00 1.53 1.51 1.56
RC-100 0.47 0.62 0.82 1.00 1.48 1.47 1.56
6.1 Compressive Strength 145
(1) The replacement percentage of RCA
The influence of the replacement percentage of the RCA on the compressivestrength of RAC is very great. In general, the higher the replacement percentage is,the lower the compressive strength will achieve. The reason is attested to the weakbonding between the RCA and the new and old mortars. At the same time, this maybe caused by a higher effective w/c ratio because of introduction of additional waterby pre-soaked RCA, and also due to more pores in RCA, when exposed to axialloading the force can easily lead to a stress concentration point. These can all leadto the lower compressive strength of RAC.
(2) Water-cement ratio (w/c)
The w/c ratio is significantly related to the compressive strength, as the w/c ratioincreases, the compressive strength of RAC decreases. The author investigateddifferent replacement percentages of RCA and the influence of w/c ratio on theRAC compressive strength and found that when the replacement percentage “r” is30, 70, and 100%, the RAC compressive strength decreased linearly with theincrease of the w/c ratio. But when the RCA replacement percentage “r” is 50%,and the w/c ratio increases, the RAC compressive strength firstly increases thendecreases.
(3) The influence of the brick content
The increase in brick content in RCA causes the strength of RAC decreasing,and there are two main reasons: The strength of the waste bricks is lower than thatof the RCA. As there are brick pieces contained among the aggregates, it leads to anuneven distribution of inner stresses and can easily lead to a concentrated stress.Research has showed that if brick piece accounts about 5% of RCA, they have aless influence on the RAC compressive strength.
(4) Source of RCA
The strength of waste concrete has a less influence on the RAC compressivestrength. But mixing RCA from different waste sources leads to a lower RACcompressive strength. Therefore, the waste concrete from different sources is sug-gested to be recycled seperately.
6.2 Distribution of the Compressive Strength
6.2.1 The Histogram of the Compressive Strength
Figure 6.2 shows the results of compressive strength of RAC vs the RCAreplacement percentage “r”. According to the histogram, it can be initially observedthat the compressive strength of RAC of all RCA replacement percentage “r” obeysnormal distribution.
146 6 Strength of Recycled Aggregate Concrete
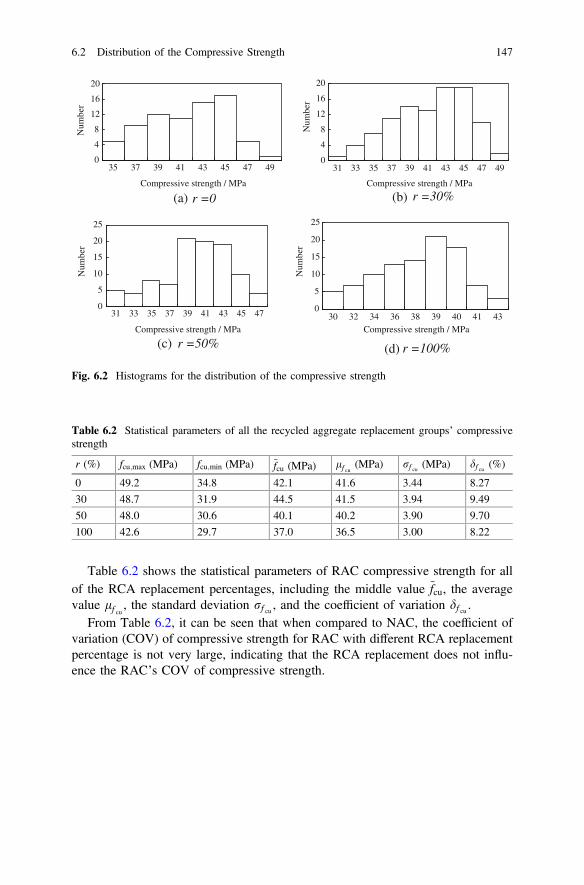
Table 6.2 shows the statistical parameters of RAC compressive strength for allof the RCA replacement percentages, including the middle value ~fcu, the averagevalue lf cu , the standard deviation rf cu , and the coefficient of variation df cu .
From Table 6.2, it can be seen that when compared to NAC, the coefficient ofvariation (COV) of compressive strength for RAC with different RCA replacementpercentage is not very large, indicating that the RCA replacement does not influ-ence the RAC’s COV of compressive strength.
0
4
8
12
16
20
35 37 39 41
Compressive strength / MPa Compressive strength / MPa
Compressive strength / MPa Compressive strength / MPa
43
Num
ber
Num
ber
Num
ber
Num
ber
45 47 490
4
8
12
16
20
31 33 35 37 39 41 43 45 47 49
(a) r =0 (b) r =30%
0
5
10
15
20
25
31 33 35 37 39 41 43 45 47 0
5
10
15
20
25
30 32 34 36 38 39 40 41 43
(c) r =50% (d) r =100%
Fig. 6.2 Histograms for the distribution of the compressive strength
Table 6.2 Statistical parameters of all the recycled aggregate replacement groups’ compressivestrength
r (%) fcu;max (MPa) fcu;min (MPa) ~fcu (MPa) lf cu (MPa) rf cu (MPa) df cu (%)
0 49.2 34.8 42.1 41.6 3.44 8.27
30 48.7 31.9 44.5 41.5 3.94 9.49
50 48.0 30.6 40.1 40.2 3.90 9.70
100 42.6 29.7 37.0 36.5 3.00 8.22
6.2 Distribution of the Compressive Strength 147
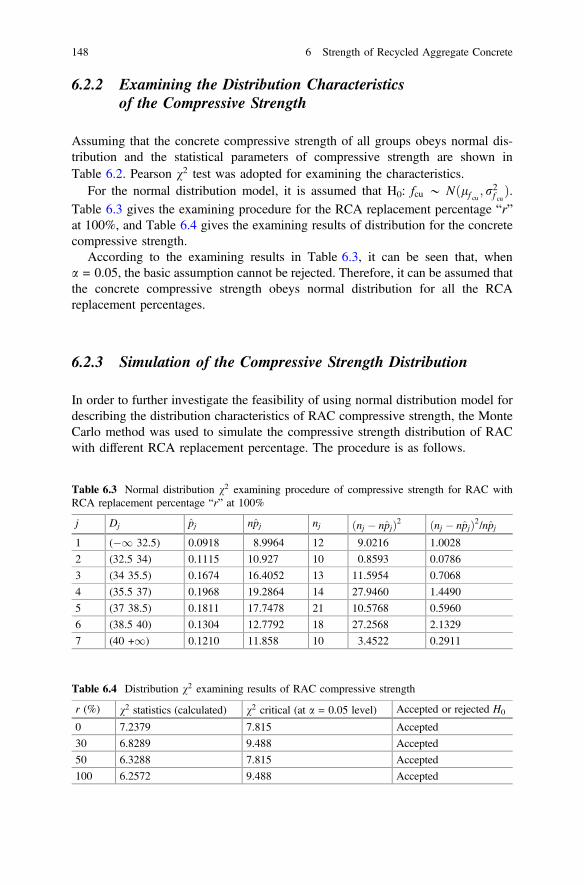
6.2.2 Examining the Distribution Characteristicsof the Compressive Strength
Assuming that the concrete compressive strength of all groups obeys normal dis-tribution and the statistical parameters of compressive strength are shown inTable 6.2. Pearson v2 test was adopted for examining the characteristics.
For the normal distribution model, it is assumed that H0: fcu * Nðlf cu ; r2f cuÞ.Table 6.3 gives the examining procedure for the RCA replacement percentage “r”at 100%, and Table 6.4 gives the examining results of distribution for the concretecompressive strength.
According to the examining results in Table 6.3, it can be seen that, whena = 0.05, the basic assumption cannot be rejected. Therefore, it can be assumed thatthe concrete compressive strength obeys normal distribution for all the RCAreplacement percentages.
6.2.3 Simulation of the Compressive Strength Distribution
In order to further investigate the feasibility of using normal distribution model fordescribing the distribution characteristics of RAC compressive strength, the MonteCarlo method was used to simulate the compressive strength distribution of RACwith different RCA replacement percentage. The procedure is as follows.
Table 6.3 Normal distribution v2 examining procedure of compressive strength for RAC withRCA replacement percentage “r” at 100%
j Dj p̂j np̂j nj ðnj � np̂jÞ2 ðnj � np̂jÞ2/np̂j1 (�1 32.5) 0.0918 8.9964 12 9.0216 1.0028
2 (32.5 34) 0.1115 10.927 10 0.8593 0.0786
3 (34 35.5) 0.1674 16.4052 13 11.5954 0.7068
4 (35.5 37) 0.1968 19.2864 14 27.9460 1.4490
5 (37 38.5) 0.1811 17.7478 21 10.5768 0.5960
6 (38.5 40) 0.1304 12.7792 18 27.2568 2.1329
7 (40 +1) 0.1210 11.858 10 3.4522 0.2911
Table 6.4 Distribution v2 examining results of RAC compressive strength
r (%) v2 statistics (calculated) v2 critical (at a = 0.05 level) Accepted or rejected H0
0 7.2379 7.815 Accepted
30 6.8289 9.488 Accepted
50 6.3288 7.815 Accepted
100 6.2572 9.488 Accepted
148 6 Strength of Recycled Aggregate Concrete

First of all, create 1000 random numbers ri from 0 to 1 to represent its possi-bilities, then make FðxiÞ in the following formula equal to ri. By solving theequation to obtain xi, the compressive strength of RAC can be simulated by MonteCarlo method.
FðxiÞ ¼Zxi�1
f ðxÞdx ð6:1Þ
In the formula, f ðxÞ is the probability density function for the concrete com-pressive strength:
f ðxÞ ¼ 1ffiffiffiffiffiffiffiffiffiffiffiffiffiffiffiffiffiffi2p� rf cu
p e�ðx�lf cu
Þ2r2
f cu ð6:2Þ
The comparison of the simulation results and the experimental results are asshown in Fig. 6.3. These two results well agreed with each other, which furtherdemonstrates that normal distribution model can be used to describe the probabilitydistribution characteristics of the RAC compressive strength.
(a) r=0 (b) r=30%
(c) r=50% (d) r=100%
0.0
0.2
0.4
0.6
0.8
1.0
1.2
F(x)
0.0
0.2
0.4
0.6
0.8
1.0
1.2
F(x)
0.0
0.2
0.4
0.6
0.8
1.0
1.2
F(x)
0.0
0.2
0.4
0.6
0.8
1.0
1.2
25 30 35 40 45 50 55 60 30 35 40 45 50 55
25 30 35 40 45 50 55 25 30 35 40 45 50
F(x)
Compressive strength / MPa Compressive strength / MPa
Compressive strength / MPa Compressive strength / MPa
Fig. 6.3 Comparison of the results of the compressive strength distribution model and the testresults
6.2 Distribution of the Compressive Strength 149
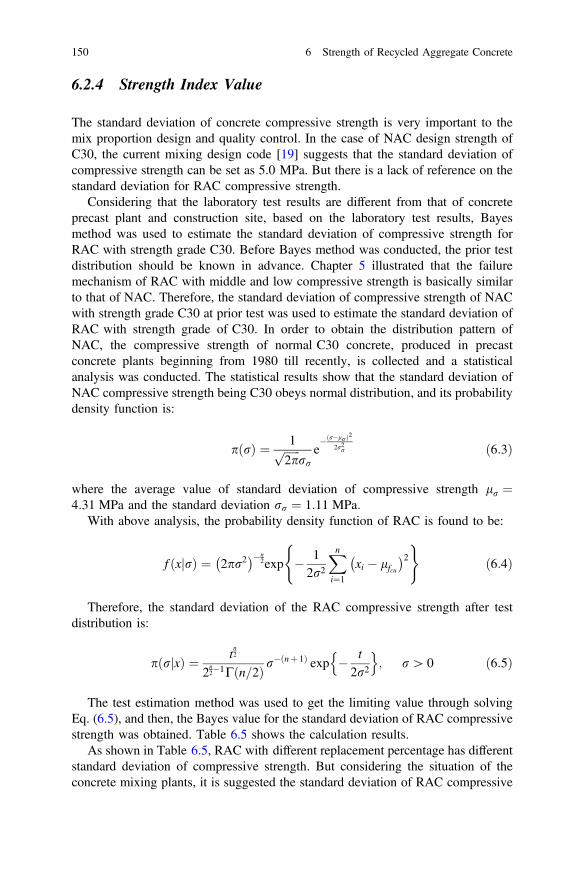
6.2.4 Strength Index Value
The standard deviation of concrete compressive strength is very important to themix proportion design and quality control. In the case of NAC design strength ofC30, the current mixing design code [19] suggests that the standard deviation ofcompressive strength can be set as 5.0 MPa. But there is a lack of reference on thestandard deviation for RAC compressive strength.
Considering that the laboratory test results are different from that of concreteprecast plant and construction site, based on the laboratory test results, Bayesmethod was used to estimate the standard deviation of compressive strength forRAC with strength grade C30. Before Bayes method was conducted, the prior testdistribution should be known in advance. Chapter 5 illustrated that the failuremechanism of RAC with middle and low compressive strength is basically similarto that of NAC. Therefore, the standard deviation of compressive strength of NACwith strength grade C30 at prior test was used to estimate the standard deviation ofRAC with strength grade of C30. In order to obtain the distribution pattern ofNAC, the compressive strength of normal C30 concrete, produced in precastconcrete plants beginning from 1980 till recently, is collected and a statisticalanalysis was conducted. The statistical results show that the standard deviation ofNAC compressive strength being C30 obeys normal distribution, and its probabilitydensity function is:
pðrÞ ¼ 1ffiffiffiffiffiffi2p
prr
e�ðr�lrÞ2
2r2r ð6:3Þ
where the average value of standard deviation of compressive strength lr ¼4:31 MPa and the standard deviation rr ¼ 1:11 MPa:
With above analysis, the probability density function of RAC is found to be:
f xjrð Þ ¼ 2pr2� ��n
2exp � 12r2
Xni¼1
xi � lfcu� �2( )
ð6:4Þ
Therefore, the standard deviation of the RAC compressive strength after testdistribution is:
p rjxð Þ ¼ tn2
2n2�1C n=2ð Þ r
� nþ 1ð Þ exp � t2r2
n o; r[ 0 ð6:5Þ
The test estimation method was used to get the limiting value through solvingEq. (6.5), and then, the Bayes value for the standard deviation of RAC compressivestrength was obtained. Table 6.5 shows the calculation results.
As shown in Table 6.5, RAC with different replacement percentage has differentstandard deviation of compressive strength. But considering the situation of theconcrete mixing plants, it is suggested the standard deviation of RAC compressive
150 6 Strength of Recycled Aggregate Concrete

strength is set as 5.0 MPa, which is identical to that of NAC. It needs to bementioned that this result is only applicable to the RCA from a single source whichcan control the quality of RAC.
6.3 Tensile Strength and Flexural Strength
6.3.1 Tensile Strength
Mukai et al. [20] discovered that the differences between splitting tensile strength ofRAC and NAC is not obvious. Coquillat’s laboratory test [21] also achieved similarresults. Ahmad et al.’s test [22] showed that RAC splitting tensile strength is almostthe same as that of NAC, while Ikeda et al. [23] discovered that RAC tensilestrength is 6% less than that of NAC. Hansen [12] found that the splitting tensilestrength of RAC is 10% less than that of NAC, and Ravindrarajah et al. [24]showed that RAC tensile strength is 10% less than that of NAC.Sagoe-Crentsil et al.’s test [25] discovered that the ratio of RAC’s compressive andtensile strength is higher than that of NAC. Salem’s test [18] indicated that thecalculation formulae in ACI regulations concerning NAC’s tensile strength andcompressive strength are suitable to be used to estimate RAC tensile and com-pressive strengths.
Gupta [6] reported the RAC tensile strength is lower than that of NAC with alow w/c ratio, and the RAC tensile strength is higher than that of NAC with a highw/c ratio. Besides, it was discovered that the tensile strength development causedby curing of RAC is similar to that of NAC.
In order to further study the RAC tensile strength, the author completed a test on30 prism specimens of RAC with the RCA replacement percentage “r” of 0, 30, 50,70 and 100%. The test results are shown in Table 6.6.
Table 6.6 Main test results chart
Recycled coarseaggregates replacementpercentage (%)
Cubecompressivestrength (MPa)
Tensilestrength(MPa)
Peak tensilestrain (10−6)
Originaltangentmodulus (GPa)
0 43 2.97 98 35
30 45 2.76 103 33
50 42 2.67 105 31
70 40 2.36 101 28
100 38 2.06 102 25
Table 6.5 Bayes estimation results of the standard deviation for RAC compressive strength
r (%) 0 30 50 100
r (MPa) 4.31 4.5 3.95 3.2
6.2 Distribution of the Compressive Strength 151
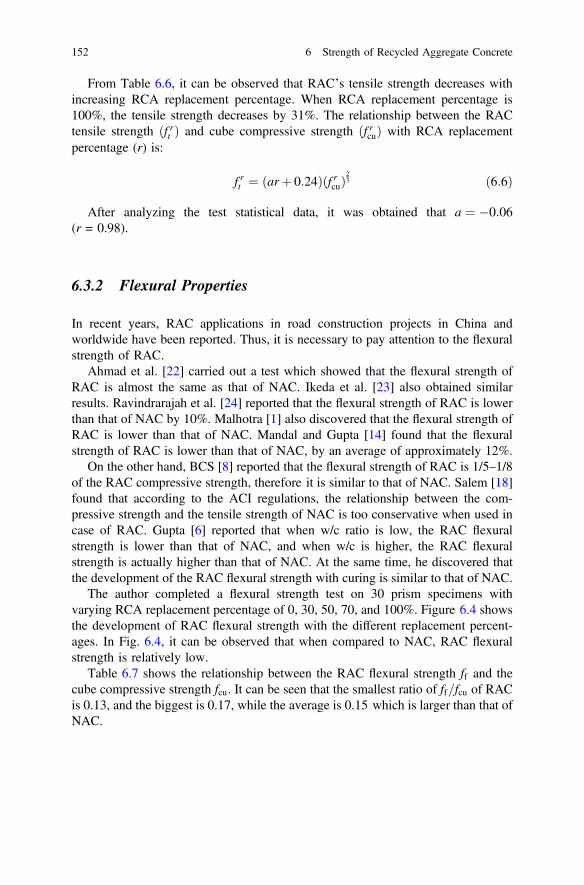
From Table 6.6, it can be observed that RAC’s tensile strength decreases withincreasing RCA replacement percentage. When RCA replacement percentage is100%, the tensile strength decreases by 31%. The relationship between the RACtensile strength ðf rt Þ and cube compressive strength ðf rcuÞ with RCA replacementpercentage (r) is:
f rt ¼ ðarþ 0:24Þðf rcuÞ23 ð6:6Þ
After analyzing the test statistical data, it was obtained that a ¼ �0:06(r = 0.98).
6.3.2 Flexural Properties
In recent years, RAC applications in road construction projects in China andworldwide have been reported. Thus, it is necessary to pay attention to the flexuralstrength of RAC.
Ahmad et al. [22] carried out a test which showed that the flexural strength ofRAC is almost the same as that of NAC. Ikeda et al. [23] also obtained similarresults. Ravindrarajah et al. [24] reported that the flexural strength of RAC is lowerthan that of NAC by 10%. Malhotra [1] also discovered that the flexural strength ofRAC is lower than that of NAC. Mandal and Gupta [14] found that the flexuralstrength of RAC is lower than that of NAC, by an average of approximately 12%.
On the other hand, BCS [8] reported that the flexural strength of RAC is 1/5–1/8of the RAC compressive strength, therefore it is similar to that of NAC. Salem [18]found that according to the ACI regulations, the relationship between the com-pressive strength and the tensile strength of NAC is too conservative when used incase of RAC. Gupta [6] reported that when w/c ratio is low, the RAC flexuralstrength is lower than that of NAC, and when w/c is higher, the RAC flexuralstrength is actually higher than that of NAC. At the same time, he discovered thatthe development of the RAC flexural strength with curing is similar to that of NAC.
The author completed a flexural strength test on 30 prism specimens withvarying RCA replacement percentage of 0, 30, 50, 70, and 100%. Figure 6.4 showsthe development of RAC flexural strength with the different replacement percent-ages. In Fig. 6.4, it can be observed that when compared to NAC, RAC flexuralstrength is relatively low.
Table 6.7 shows the relationship between the RAC flexural strength ff and thecube compressive strength fcu. It can be seen that the smallest ratio of ff=fcu of RACis 0.13, and the biggest is 0.17, while the average is 0.15 which is larger than that ofNAC.
152 6 Strength of Recycled Aggregate Concrete
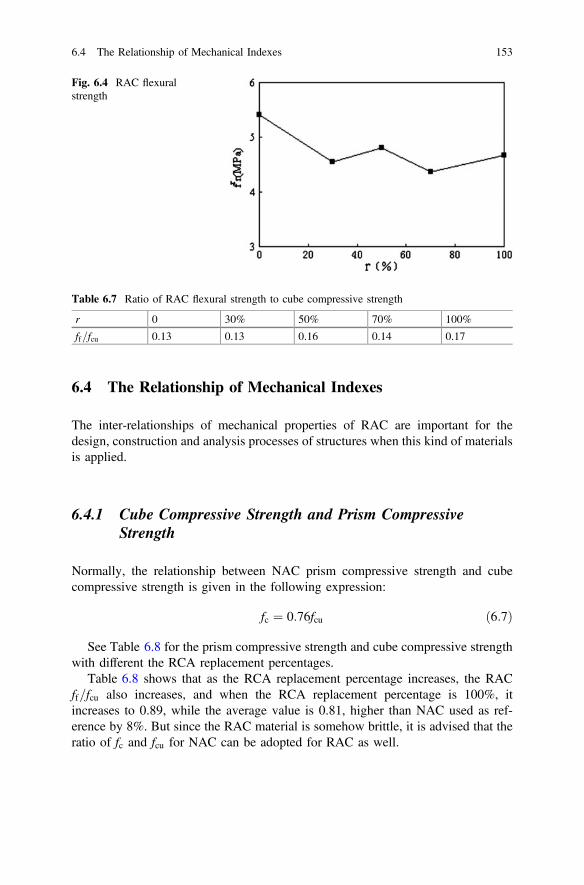
6.4 The Relationship of Mechanical Indexes
The inter-relationships of mechanical properties of RAC are important for thedesign, construction and analysis processes of structures when this kind of materialsis applied.
6.4.1 Cube Compressive Strength and Prism CompressiveStrength
Normally, the relationship between NAC prism compressive strength and cubecompressive strength is given in the following expression:
fc ¼ 0:76fcu ð6:7Þ
See Table 6.8 for the prism compressive strength and cube compressive strengthwith different the RCA replacement percentages.
Table 6.8 shows that as the RCA replacement percentage increases, the RACff=fcu also increases, and when the RCA replacement percentage is 100%, itincreases to 0.89, while the average value is 0.81, higher than NAC used as ref-erence by 8%. But since the RAC material is somehow brittle, it is advised that theratio of fc and fcu for NAC can be adopted for RAC as well.
Fig. 6.4 RAC flexuralstrength
Table 6.7 Ratio of RAC flexural strength to cube compressive strength
r 0 30% 50% 70% 100%
ff=fcu 0.13 0.13 0.16 0.14 0.17
6.4 The Relationship of Mechanical Indexes 153

6.4.2 Splitting Tensile Strength and Cube CompressiveStrength
The splitting tensile strength test is often used to obtain the tensile strength ofconcrete, rather than by a direct tensile strength test because the former is easier toperform. In practical applications, however, the tensile strength of concrete is oftenestimated from the compressive strength. The splitting tensile strength of the RACobtained by previous investigators as a function of the compressive strength issummarized and shown in Fig. 6.5. Although the results show a considerablescatter, the tendency that the splitting tensile strength increases with increasingcompressive strength can still be recognized.
In the Chinese code [26], the relationship between the splitting tensile strengthfsp (MPa) and the compressive strength fcu (MPa) for NAC is expressed as
fsp ¼ 0:19f 0:75cu ð6:8Þ
1
2
3
4
5
6
15 20 25 30 35 40 45 50 55f cu (MPa)
f sp (M
Pa)
Dillmann Ravindrarajah & TamBairagi et al. CorinadesiGómez-Soberón SalemDolara et al. Di Niro et al.Kawamura & Tori TadayoshiYamato et al. Ikeda & YamanePoon et al. Xiao et al.Eq.(6.8) Eq.(6.10)
Fig. 6.5 Relationship between splitting tensile strength and cube compressive strength of RAC(ACI Code and Eq. (6.10))
Table 6.8 Prism and cube compressive strength of RAC
No. Slump (mm) Apparent density (kg/m3) fcu (MPa) fc (MPa) fc=fcuRC-0 42 2402 35.9 26.9 0.74
RC-30 33 2368 34.1 25.4 0.80
RC-50 41 2345 29.6 23.6 0.80
RC-70 40 2316 30.3 24.2 0.89
RC-100 44 2280 26.7 23.8 0.89
154 6 Strength of Recycled Aggregate Concrete

By using Eq. (6.8), the relationship between fsp and fcu for RAC is plotted inFig. 6.5 and it can be observed that Eq. (6.8) results in a significant over-estimationof the splitting tensile strength of RAC. To improve Eq. (6.8), a regression analysisof test results was performed by using the following regression equation:
fsp ¼ cf dcu ð6:9Þ
where c and d are the regression coefficients to be determined through experimentalresults. By using a correlation coefficient R = 0.87, the regression analysis yieldsc = 0.24 and d = 0.65. Hence, the Eq. (6.10) is proposed for the relation betweenthe splitting tensile strength and the cubic compressive strength of RAC.
fsp ¼ 0:24f 0:65cu ð6:10Þ
Comparisons between the test results and those predicted by Eq. (6.10) areillustrated in Fig. 6.5. It can be seen that the proposed Eq. (6.10) can provide abetter agreement with the experimental results than Eq. (6.8) does.
6.4.3 Flexural Strength and Cube Compressive Strength
The flexural strength of concrete is another mechanical parameter which is oftenused to estimate the tensile strength of concrete. The test results for flexural strengthversus cube compressive strength of the RAC obtained by various investigators aregiven in Fig. 6.6. Although unavoidable discrepancies exist among the results, there
1
3
5
7
9
11
15 20 25 30 35 40 45 50 55f cu (MPa)
f f (M
Pa)
Dillmann Ravindrarajah & TamDhir et al. Bairagi et al.Salem Limbachiya et al.Dolara et al. Di Niro et al.Kawamura & Tori Mandal & GuptaXiao et al. Eq.(6.12)Eq.(6.11) Eq.(6.14)
Fig. 6.6 Relationship between flexural strength and cube compressive strength of RAC (Eqs.(6.11), (6.12), and (6.14))
6.4 The Relationship of Mechanical Indexes 155

exists a tendency that the flexural strength increases with the increase in thecompressive strength.
In the CEB code [27] and the ACI code [28], the empirical relationships betweenflexural strength ff (in MPa) and cube compressive strength fcu (in MPa) for NACare given by the following equations:
CEB : ff ¼ 0:81ffiffiffiffiffifcu
pð6:11Þ
ACI : ff ¼ 0:57ffiffiffiffiffifcu
pð6:12Þ
It should be noted here that in Eq. (6.12), a conversion from the cylinder to thecube compressive strength has been undertaken. According to Chinese code [26],the cylinder compressive strength is taken as 0.76 times of the cube compressivestrength.
Figure 6.6 shows that the ACI equation leads to an underestimation, while theCEB equation yields an over-estimation of the flexural strength of the RAC.
Based on the collected test results and by using the following regressionequation to describe the relationship,
ff ¼ effiffiffiffiffifcu
pð6:13Þ
A statistical regression analysis was performed; with a correlation coefficientR = 0.91, the regression coefficient “e” was estimated as e = 0.75. Therefore,Eq. (6.14) is suggested for describing the relation between the flexural strength andthe compressive strength of the RAC:
ff ¼ 0:75ffiffiffiffiffifcu
pð6:14Þ
Compared with Eqs. (6.11) and (6.12), Eq. (6.14) provides a much betterdescription of the relation between the flexural strength and the cubic compressivestrength of the RAC.
6.5 Effects of Elevated Temperatures on Strength
6.5.1 Residual Compressive Strength
(1) Comparisons between concrete with different RCA replacement percentages
In order to evaluate the influence of different RCA replacement percentages onthe residual cube compressive strength after fire exposure, the residual-to-initialratio (i.e., the ratio of the residual strength at the elevated temperature of T °C to theinitial strength at 20 °C) of compressive strength with different RCA replacement
156 6 Strength of Recycled Aggregate Concrete
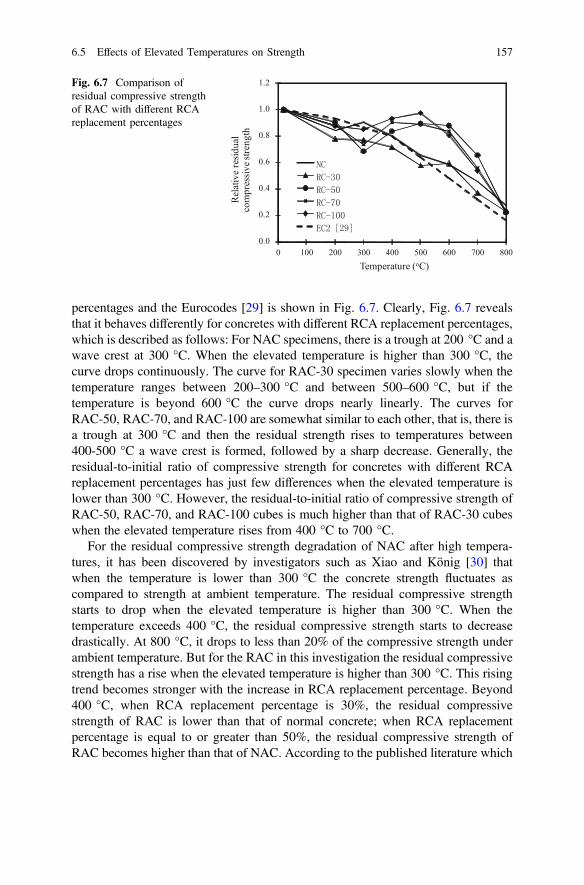
percentages and the Eurocodes [29] is shown in Fig. 6.7. Clearly, Fig. 6.7 revealsthat it behaves differently for concretes with different RCA replacement percentages,which is described as follows: For NAC specimens, there is a trough at 200 °C and awave crest at 300 °C. When the elevated temperature is higher than 300 °C, thecurve drops continuously. The curve for RAC-30 specimen varies slowly when thetemperature ranges between 200–300 °C and between 500–600 °C, but if thetemperature is beyond 600 °C the curve drops nearly linearly. The curves forRAC-50, RAC-70, and RAC-100 are somewhat similar to each other, that is, there isa trough at 300 °C and then the residual strength rises to temperatures between400-500 °C a wave crest is formed, followed by a sharp decrease. Generally, theresidual-to-initial ratio of compressive strength for concretes with different RCAreplacement percentages has just few differences when the elevated temperature islower than 300 °C. However, the residual-to-initial ratio of compressive strength ofRAC-50, RAC-70, and RAC-100 cubes is much higher than that of RAC-30 cubeswhen the elevated temperature rises from 400 °C to 700 °C.
For the residual compressive strength degradation of NAC after high tempera-tures, it has been discovered by investigators such as Xiao and König [30] thatwhen the temperature is lower than 300 °C the concrete strength fluctuates ascompared to strength at ambient temperature. The residual compressive strengthstarts to drop when the elevated temperature is higher than 300 °C. When thetemperature exceeds 400 °C, the residual compressive strength starts to decreasedrastically. At 800 °C, it drops to less than 20% of the compressive strength underambient temperature. But for the RAC in this investigation the residual compressivestrength has a rise when the elevated temperature is higher than 300 °C. This risingtrend becomes stronger with the increase in RCA replacement percentage. Beyond400 °C, when RCA replacement percentage is 30%, the residual compressivestrength of RAC is lower than that of normal concrete; when RCA replacementpercentage is equal to or greater than 50%, the residual compressive strength ofRAC becomes higher than that of NAC. According to the published literature which
0.0
0.2
0.4
0.6
0.8
1.0
1.2
0 100 200 300 400 500 600 700 800
Rela
tive
resid
ual
com
pres
sive s
treng
th
Temperature (oC)
Fig. 6.7 Comparison ofresidual compressive strengthof RAC with different RCAreplacement percentages
6.5 Effects of Elevated Temperatures on Strength 157
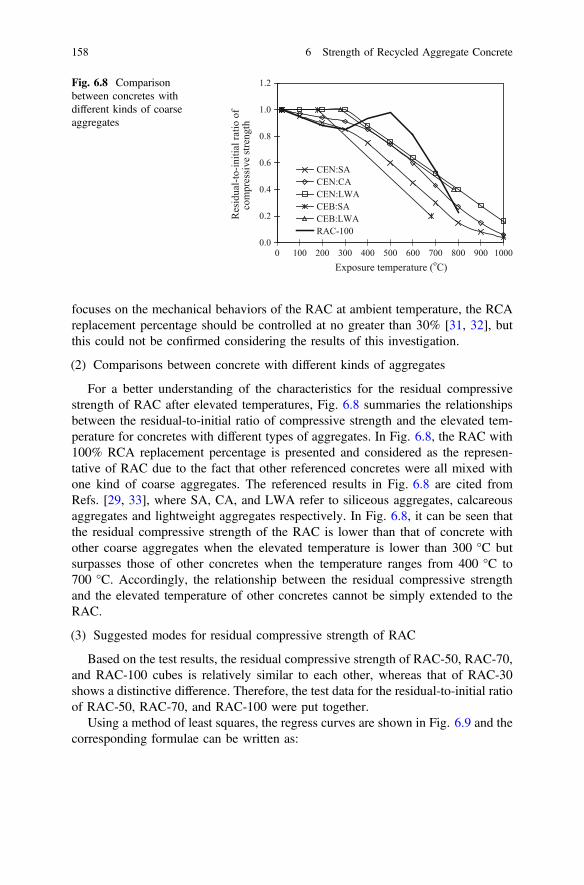
focuses on the mechanical behaviors of the RAC at ambient temperature, the RCAreplacement percentage should be controlled at no greater than 30% [31, 32], butthis could not be confirmed considering the results of this investigation.
(2) Comparisons between concrete with different kinds of aggregates
For a better understanding of the characteristics for the residual compressivestrength of RAC after elevated temperatures, Fig. 6.8 summaries the relationshipsbetween the residual-to-initial ratio of compressive strength and the elevated tem-perature for concretes with different types of aggregates. In Fig. 6.8, the RAC with100% RCA replacement percentage is presented and considered as the represen-tative of RAC due to the fact that other referenced concretes were all mixed withone kind of coarse aggregates. The referenced results in Fig. 6.8 are cited fromRefs. [29, 33], where SA, CA, and LWA refer to siliceous aggregates, calcareousaggregates and lightweight aggregates respectively. In Fig. 6.8, it can be seen thatthe residual compressive strength of the RAC is lower than that of concrete withother coarse aggregates when the elevated temperature is lower than 300 °C butsurpasses those of other concretes when the temperature ranges from 400 °C to700 °C. Accordingly, the relationship between the residual compressive strengthand the elevated temperature of other concretes cannot be simply extended to theRAC.
(3) Suggested modes for residual compressive strength of RAC
Based on the test results, the residual compressive strength of RAC-50, RAC-70,and RAC-100 cubes is relatively similar to each other, whereas that of RAC-30shows a distinctive difference. Therefore, the test data for the residual-to-initial ratioof RAC-50, RAC-70, and RAC-100 were put together.
Using a method of least squares, the regress curves are shown in Fig. 6.9 and thecorresponding formulae can be written as:
0.0
0.2
0.4
0.6
0.8
1.0
1.2
0 100 200 300 400 500 600 700 800 900 1000Exposure temperature (oC)
Res
idua
l-to-
initi
al ra
tio o
f co
mpr
essi
ve st
reng
th
CEN:SACEN:CACEN:LWACEB:SACEB:LWARAC-100
Fig. 6.8 Comparisonbetween concretes withdifferent kinds of coarseaggregates
158 6 Strength of Recycled Aggregate Concrete
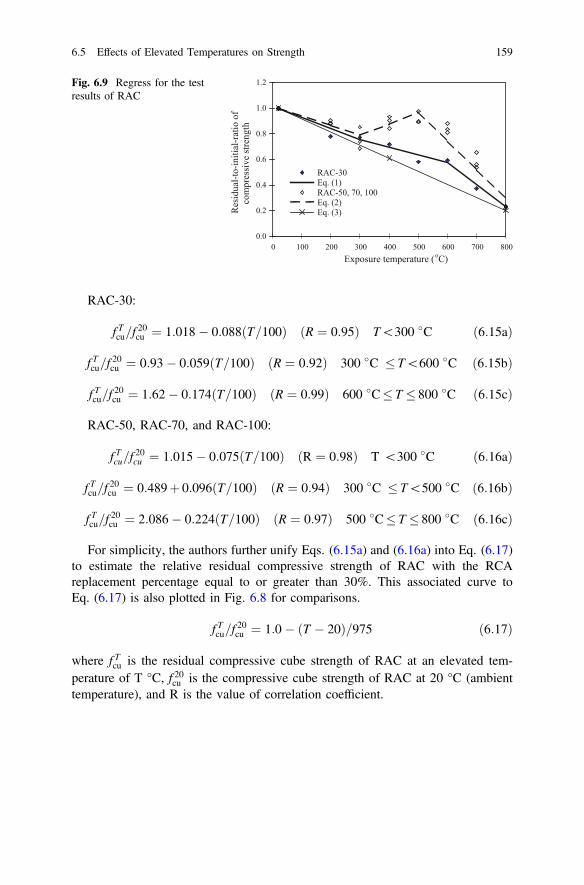
RAC-30:
f Tcu=f20cu ¼ 1:018� 0:088ðT=100Þ R ¼ 0:95ð Þ T\300 �C ð6:15aÞ
f Tcu=f20cu ¼ 0:93� 0:059ðT=100Þ R ¼ 0:92ð Þ 300 �C � T\600 �C ð6:15bÞ
f Tcu=f20cu ¼ 1:62� 0:174ðT=100Þ R ¼ 0:99ð Þ 600 �C� T � 800 �C ð6:15cÞ
RAC-50, RAC-70, and RAC-100:
f Tcu=f20cu ¼ 1:015� 0:075ðT=100Þ ðR ¼ 0:98Þ T \300 �C ð6:16aÞ
f Tcu=f20cu ¼ 0:489þ 0:096ðT=100Þ ðR ¼ 0:94Þ 300 �C � T\500 �C ð6:16bÞ
f Tcu=f20cu ¼ 2:086� 0:224ðT=100Þ ðR ¼ 0:97Þ 500 �C� T � 800 �C ð6:16cÞ
For simplicity, the authors further unify Eqs. (6.15a) and (6.16a) into Eq. (6.17)to estimate the relative residual compressive strength of RAC with the RCAreplacement percentage equal to or greater than 30%. This associated curve toEq. (6.17) is also plotted in Fig. 6.8 for comparisons.
f Tcu=f20cu ¼ 1:0� ðT � 20Þ=975 ð6:17Þ
where f Tcu is the residual compressive cube strength of RAC at an elevated tem-perature of T °C, f 20cu is the compressive cube strength of RAC at 20 °C (ambienttemperature), and R is the value of correlation coefficient.
0.0
0.2
0.4
0.6
0.8
1.0
1.2
0 100 200 300 400 500 600 700 800Exposure temperature (oC)
Res
idua
l-to-
initi
al-r
atio
of
com
pres
sive
stre
ngth
RAC-30Eq. (1)RAC-50, 70, 100Eq. (2)Eq. (3)
Fig. 6.9 Regress for the testresults of RAC
6.5 Effects of Elevated Temperatures on Strength 159

6.5.2 Residual Flexure Strength
(1) Flexure test
The flexural strength test on prisms was carried out after they were exposedto high temperatures, the test was carried out by a YEW-300B testing machine,which has a maximum load of 300 kN, and the loading rate was kept inbetween 0.05–0.08 MPa/s. Data were achieved by LM-02 Smart Acquisition DataCollection. The loading pattern is demonstrated in Fig. 6.10. The values for the testresults should be obtained in line with regulations in Ref. [34]. After recording thevalue at failure point, and ignoring all the values which exceeds the average valueby 15%, take the average value of all the prisms at same elevated temperature, seeTable 6.9. It can be concluded from Table 6.9 that the residual flexural strength ofRAC does not obviously vary with the increase in the RCA replacement rate undera certain elevated temperature, while the residual flexural strength of RACdecreases with the increase under exposed temperature at same replacement per-centage of RCA.
(2) Comparisons between concrete with different RCA replacement percentages
In order to evaluate the influence of the different RCA replacement percentageson the residual flexural strength of prisms after elevated temperature exposure, theresidual-to-initial ratio of flexural strength with different RCA replacement per-centages is shown in Fig. 6.11. It can be clearly observed in Fig. 6.11 that the
Fig. 6.10 Loading sketch forthe flexural strength
Table 6.9 Mean values of the residual flexural strength of RAC (Unit: MPa)
Temperature (°C) NC RAC-30 RAC-50 RAC-70 RAC-100
20 5.83 5.70 5.08 4.81 4.51
200 2.19 2.83 2.61 2.14 1.97
400 3.09 2.27 1.44 2.61 2.05
600 0.76 0.18 0.51 0.10 0.61
800 0 0 0 0 0
160 6 Strength of Recycled Aggregate Concrete

change in RAC residual flexural strength of different replacement percentages afterhigh temperature is almost the same, the change is very slow between 200 ºC and400 °C, and the change is very rapid when temperature is greater than 400 °C. Theresidual flexural strength of RAC-50 keeps decreasing with the change in tem-perature, and its rate of decrease is greater than all the other replacement percent-ages. In overall, the RAC residual flexural strength value after elevatedtemperatures between 200–400 °C is relatively stable, but after 400 °C it decreasesgreatly, and when it reaches 800 °C the residual flexural strength is almost “0”. Incomparison with the residual compressive strength after elevated temperature, theinfluence of the recycled coarse aggregates (RCA) replacement percentage on theresidual flexural strength is not very significant.
(3) Suggested modes for residual flexural strength of RAC
For applying the RAC in engineering projects, and considering RAC residualflexural strength at elevated temperatures, the author divided the RAC residualflexural strength in this study into 3.
The regression curve is demonstrated in Fig. 6.12. The regression formulae are:
f Tf =f20f ¼ 1:058� 0:0029T 20 �C� T � 200 �C ð6:18aÞ
f Tf =f20f ¼ 0:53� 0:00027T 200 �C� T � 400 �C ð6:18bÞ
f Tf =f20f ¼ 1:117� 0:00174T 400 �C� T � 600 �C ð6:18cÞ
where f Tf is the residual flexural strength of RAC at an elevated temperature of T °Cand f 20f is the flexural strength of RAC at 20 °C (ambient temperature).
0
0.2
0.4
0.6
0.8
1
0 200 400 600 800Res
idua
l-to
-initi
al ra
tio o
f fle
xura
l stre
ngth
Exposure temperature (oC)
NC
RC-30
RC-50
RC-70
RC-100
Fig. 6.11 Comparison of theresidual flexural strength ofRAC with different RCAreplacement percentages
6.5 Effects of Elevated Temperatures on Strength 161

6.5.3 Comparisons Between Residual Compressiveand Flexural Strength of RAC
Based on the tests on the residual compressive strength and the residual flexuralstrength of the RAC after elevated temperatures, the ratio of the residual flexuralstrength to the residual compressive strength after elevated temperatures is com-paratively analyzed as displayed in Fig. 6.13.
It can be observed in Fig. 6.13 that at ambient temperature, the ratios of flexuralto compressive strength of RAC with different RCA replacement percentage are allbasically around 0.15, and they all show a downward trend with an increase in theelevated temperature. The ratios at the condition of RCA replacement percentagewith 30, 70 and 100% gradually decreases between 200–400 °C. When the RCAreplacement percentage is 50%, it shows a downward trend with an increase intemperature and shows a much greater decrease compared to the rest of thereplacement percentages. At 600 °C, the ratio is already very small, and at 800 °C,since the RAC residual flexural strength is basically “0”, therefore, the ratio is also“0”. Generally, the ratio of NAC flexural strength to compressive strength isbetween 0.1 and 0.2 [35], the result of this study at ambient temperature would be
0
0.2
0.4
0.6
0.8
1
0 200 400 600 800R
esid
ual-t
o-in
itial
ratio
Exposure temperature (oC)
NC
RC-30
RC-50
RC-70
RC-100
Eq.(4)
of f
lexu
ral s
treng
th
Fig. 6.12 Regression on therelationship between theresidual flexural strength andelevated temperatures
0
0.05
0.1
0.15
0.2
0 200 400 600 800Rat
io o
f fle
xura
l stre
ngth
to co
mpr
essi
ve
stre
ngth
Exposure temperature (oC)
NC
RC-30
RC-50
RC-70
RC-100
Fig. 6.13 Ratios of theresidual flexural to thecompressive strength of RAC
162 6 Strength of Recycled Aggregate Concrete

around 0.15. This is to say that at ambient temperature the relationship betweenRAC flexural strength and compressive strength are of RAC basically the same withNAC.
6.6 Concluding Remarks
(1) The compressive strength of recycled aggregate concrete (RAC) is lower thanthat of natural aggregate concrete (NAC) under the condition that water-cementratios (w/c) are same and the development of the compressive strength overtime of RAC is basically the same as that of NAC. The factors like thereplacement percentage of the RCA, w/c, brick content, and the source of RCAare proved to have obvious influence on the RAC strength. Base on theexperimental results and collected data of RAC compressive strength, thedistribution test was executed and the results show that the normal distributioncan be used to describe the characteristics of RAC compressive strength.
(2) When w/c ratio is lower, the RAC tensile strength is lower than that of NAC.On the contrary, when w/c ratio is higher, the RAC tensile strength is higherthan that of NAC. Furthermore, the development trend of RAC tensile strengthover time is similar to that of NAC. The same conclusions are also found in thecase of RAC flexural strength.
(3) The relationships of the mechanical indexes of RAC including the cubiccompressive strength and prism compressive strength, splitting tensile strengthand cubic compressive strength, flexural strength and cubic compressivestrength are established based on the experimental results, collected data, andexisting relationships of NAC. The formulations established for RAC have thesame form as that of NAC.
(4) The residual compressive strength of the RAC has an obvious change fromfalling to rising when the temperature is about 300 °C. Up to this variation, arising trend occurs until 500 °C. When the replacement percentage of RCA is30%, the residual compressive strength of RAC is lower than that of naturalaggregate concrete. But when the RCA replacement percentage is not less than50%, the residual compressive strength of RAC is higher than that of NAC. Thehigher the RCA replacement percentage, the clearer the trend becomes.
(5) The residual flexural strength of RAC gradually decreases on the whole fol-lowing elevated temperatures. When compared with the residual compressivestrength at elevated temperatures, the effect of RCA replacement percentage onthe residual flexural strength at elevated temperatures is not very significant. Atambient temperature, the ratio of the flexural strength to the compressivestrength of RAC is 0.15, which is almost the same as NAC. After exposure toelevated temperatures, the ratio of the residual flexural strength to the residualcompressive strength of RAC gradually decreases as the elevated temperatureincreases.
6.5 Effects of Elevated Temperatures on Strength 163
References
1. Malhotra VM. Use of recycled concrete as a new aggregate. Energy, Mines and ResourcesCanada, Canada Centre for Mineral and Energy Technology, Minerals Research Program,Mineral Sciences Laboratories; 1976.
2. Buck AD. Recycled concrete as a source of aggregate. J Proc. 1977;74(5):212–9.3. Sri R, Tam CT. Properties of concrete made with crushed concrete as coarse aggregate. Mag
Concr Res. 1985;37(130).4. Dhir RK, Limbachiya MC, Leelawat T. Suitability of recycled concrete aggregate for use in
BS 5328 designated mixes. Proc Inst Civil Eng Struct Build. 1999;134(3):257–74.5. Limbachiya MC, Leelawat T, Dhir RK. Recycled coarse aggregate concrete: a study of
properties in the fresh state, strength development and durability. In: Proceedings ofinternational symposium on sustainable construction: use of recycled concrete aggregate,University of Dundee, Scotland; 1998. p. 11–2.
6. Gupta SM. Strength characteristics of concrete made with demolition waste as coarseaggregate. In: Proceedings of the international conference on recent development in structuralengineering; 2001. p. 364–73.
7. Nixon PJ. Recycled concrete as an aggregate for concrete—a review. Mater Struct. 1978;11(5):371–8.
8. Bcs J. Study on recycled aggregate and recycled aggregate concrete. Concr J. 1978;16(7):18–31.
9. Wesche K, Schulz RR. Beton aus aufbereitetem Altbeton-Technologie und Eigenschaften.Betontechnische Berichte. 1984;(22).
10. Frondistou-Yannas S. Waste concrete as aggregate for new concrete. J Proc. 1977;74(8):373–6.11. Gerardu JJ, Hendriks CF. Recycling of road pavement materials in the Netherlands. Dienst
Weg-en Waterbouwkunde: Rijkswaterstaat; 1985.12. Hansen TC. Recycled aggregates and recycled aggregate concrete second state-of-the-art
report developments 1945–1985. Mater Struct. 1986;19(3):201–46.13. Ramamurthy K, Gumaste KS. Properties of RAC;1998.14. Mandal S, Gupta A. Strength and durability of recycled aggregate concrete. IABSE Symp
Rep. 2002;86(6):33–46.15. Yoda K, Yoshikane T, Nakashima Y, Soshiroda T. Recycled cement and recycled concrete in
Japan. In: Proceedings of the international conference on demolition and reuse of concrete andmasonry; 1988. p. 527–36.
16. Ridzuan AR, Diah AB, Hamir R, Kamarulzaman KB. The influence of recycled aggregate onthe early compressive strength and drying shrinkage of concrete. Struct Eng Mech Comput.2001;2:1415–22.
17. Hansen TC, Narud H. Strength of recycled concrete made from crushed concrete coarseaggregate. Concr Int. 1983;5(01):79–83.
18. Salem RM. Strength and durability characteristics of recycled aggregate concrete; 1996.19. MOHURD. JGJ55-2011 Specification for mix proportion design of ordinary concrete.
Beijing: China Architecture and Building Press; 2011.20. Mukai T, Kikuchi M, Ishikawa N. Study on the properties of concrete containing recycled
concrete aggregate. Cement Association of Japan 32nd Review; 1978.21. Coquillat G. Recyclage de materiaux de demolition dans la confection de Beton.
CEBTP-Service d’Etudes des Matériaux Unite. Technology des Béton; 1982.22. Ahmad SH, Fisher DG, Sackett KW. Properties of concrete made with north carolina recycled
coarse and fine aggregates. Center for Transportation Engineering Studies, Department ofCivil Engineering, North Carolina State University; 1996.
23. Ikeda T, Yamane S, Sakamoto A. Strengths of concrete containing recycled aggregate. In:Proceedings of the 2nd international RILEM symposium on demolition and reuse of concreteand masonry, Tokyo, Japan; Nov 1988. p. 7–11.
164 6 Strength of Recycled Aggregate Concrete
24. Ravindrarajah RS, Loo YH, Tam CT. Recycled concrete as fine and coarse aggregates inconcrete. Mag Concr Res. 1987;39(141):214–20.
25. Sagoe-Crentsil KK, Brown T, Taylor AH. Performance of concrete made with commerciallyproduced coarse recycled concrete aggregate. Cem Concr Res. 2001;31(5):707–12.
26. MOHURD. GB 50010-2010 Code for design of concrete structures. Beijing: ChinaArchitecture and Building Press: China Architecture and Building Press; 2010.
27. MC90 CE. Design of concrete structures. CEB-FIP Model Code; 1990.28. ACI Committee, American Concrete Institute, International Organization for Standardization.
Building code requirements for structural concrete (ACI 318-08) and commentary. AmericanConcrete Institute.
29. Comité Européen de Normalisation: prENV 1992-1-2, Eurocode 2: Design of concretestructures, part 1–2: structural fire design, CEN/TC 250/SC 2; 1993.
30. Xiao J, König G. Study on concrete at high temperature in China—an overview. FireSaf J. 2004;39(1):89–103.
31. Hansen, TC. Recycling of demolished concrete and masonry. E&FN SPON, London; 1992.32. German Committee for reinforced concrete: guideline for concrete with recycled aggregate.
Draft status; 1998 (in German).33. Comité Euro-International du Béton: Fire design of concrete structures in accordance with
CEB/FIP Model Code 90. CEB Bulletin d’Information No. 208, Switzerland; 1991.34. Chinese National Standard. Standard for test method of mechanical properties on ordinary
concrete (GB/T 50081-2002).35. Teranishi K, Dosho Y, Narikawa M, Kikuchi M. Application of recycled aggregate concrete
for structural concrete, part 3—production of recycled aggregate by real-scale plant andquality of recycled aggregate concrete. In: Dhir RK, et al. editor. Proceedings of internationalsymposium on use of recycled concrete aggregate. University of Dundee, Scotland, 11–12Nov 1998. p. 143–156.
References 165

Chapter 7Constitutive Relationship of RecycledAggregate Concrete
Abstract This chapter investigates the constitutive relationships of recycledaggregate concrete (RAC), including the static compressive stress–strain curvewithout/with confinements (confined by steel tubes and by glassfiber-reinforcedplastic tubes) under axial compressive loading, the tensile stress–strain curve ofRAC under axial tension loading, the shear transfer behavior across cracks of RACas well as the compressive behavior of RAC under high strain rate loading. Theinfluences of recycled coarse aggregate (RCA) influences strength, elastic modulus,peak and ultimate strength of RAC were evaluated. For the case of dynamic con-stitutive relationship of RAC, the effects of strain rate on failure pattern, com-pressive strength, initial elastic modulus, and peak strain were studied. Based on theconstitutive relationships of RAC in this chapter, the related simulation studies canbe executed.
7.1 Stress–Strain Relationship Under AxialCompressive Loading
7.1.1 Test
7.1.1.1 Materials
Ordinary Portland cement with a 28 days compressive strength of 32.5 MPa wasused in this investigation. The fine aggregate used was river sand (the OrdinaryPortland Cement with a 42.5 MPa compressive strength, river sand and tap waterwere used in the following experiments in this chapter except for additionalstatement). The used coarse aggregates were natural coarse aggregate (NCA) andRCA (5–15 mm accounting for 60%, and 15–31.5 mm accounting for 40% inweight) obtained from the waste concrete brought from the airport runway inShanghai, PR China. The physical properties of the NCA and the RCA are shownin Table 7.1.
© Springer-Verlag GmbH Germany 2018J. Xiao, Recycled Aggregate Concrete Structures,Springer Tracts in Civil Engineering, https://doi.org/10.1007/978-3-662-53987-3_7
167
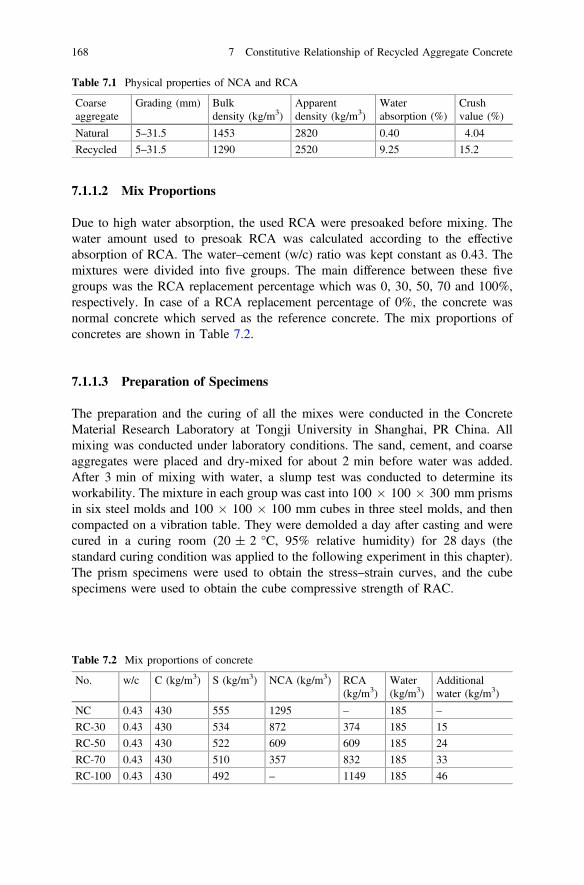
7.1.1.2 Mix Proportions
Due to high water absorption, the used RCA were presoaked before mixing. Thewater amount used to presoak RCA was calculated according to the effectiveabsorption of RCA. The water–cement (w/c) ratio was kept constant as 0.43. Themixtures were divided into five groups. The main difference between these fivegroups was the RCA replacement percentage which was 0, 30, 50, 70 and 100%,respectively. In case of a RCA replacement percentage of 0%, the concrete wasnormal concrete which served as the reference concrete. The mix proportions ofconcretes are shown in Table 7.2.
7.1.1.3 Preparation of Specimens
The preparation and the curing of all the mixes were conducted in the ConcreteMaterial Research Laboratory at Tongji University in Shanghai, PR China. Allmixing was conducted under laboratory conditions. The sand, cement, and coarseaggregates were placed and dry-mixed for about 2 min before water was added.After 3 min of mixing with water, a slump test was conducted to determine itsworkability. The mixture in each group was cast into 100 � 100 � 300 mm prismsin six steel molds and 100 � 100 � 100 mm cubes in three steel molds, and thencompacted on a vibration table. They were demolded a day after casting and werecured in a curing room (20 ± 2 °C, 95% relative humidity) for 28 days (thestandard curing condition was applied to the following experiment in this chapter).The prism specimens were used to obtain the stress–strain curves, and the cubespecimens were used to obtain the cube compressive strength of RAC.
Table 7.1 Physical properties of NCA and RCA
Coarseaggregate
Grading (mm) Bulkdensity (kg/m3)
Apparentdensity (kg/m3)
Waterabsorption (%)
Crushvalue (%)
Natural 5–31.5 1453 2820 0.40 4.04
Recycled 5–31.5 1290 2520 9.25 15.2
Table 7.2 Mix proportions of concrete
No. w/c C (kg/m3) S (kg/m3) NCA (kg/m3) RCA(kg/m3)
Water(kg/m3)
Additionalwater (kg/m3)
NC 0.43 430 555 1295 – 185 –
RC-30 0.43 430 534 872 374 185 15
RC-50 0.43 430 522 609 609 185 24
RC-70 0.43 430 510 357 832 185 33
RC-100 0.43 430 492 – 1149 185 46
168 7 Constitutive Relationship of Recycled Aggregate Concrete

7.1.1.4 Test Setup and Test Method
The loading setup as shown in Fig. 7.1 was an LAX-W500 microcomputer-controlled electrohydraulic servo tester. In order to get the complete stress-straincurve, the strain rate of the test specimens was kept constant as 44 � 10−6/s.During the experiment, the axial compression and the vertical deformation of thespecimens were automatically collected by the computer installed. The measuredvertical deformation was the deformation of middle 1/3 part (100 mm from thespecimen top) of the concrete prism specimen. Each specimen was preloaded beforethe actual loading in order to lessen the impacts on test results due to the defect ofspecimens’ end. As preloading, 30–40% of the estimated peak loading (accordingto the test results for the cube compressive strength) was applied, and the loadingwas repeated three times.
7.1.2 Curves of the Stress–Strain Relationship of RAC
7.1.2.1 Characteristics of the Overall Curves of the Stress–StrainRelationship of RAC
Figure 7.2 shows the stress–strain relationship of RAC with different recycledaggregate replacement percentages. Like ordinary concrete, the curves of the stress–strain relationship of RAC are considered of ascending and descending stages, andboth have a limit point, critical stress point, peak point, inflection point and con-vergent point.
When the stress is 40–60% lower than the peak stress, the increases withincreasing strain proportionally. As the stress increases, the inelastic deformationincreases, the inclination of the curve decreases, and when the peak stress is reachedthe curve becomes a horizontal straight line, but it has no plateau. Then later on thecurve drastically drops and continues to drop along.
Fig. 7.1 Test setup for thestress-strain curve
7.1 Stress–Strain Relationship Under Axial Compressive Loading 169
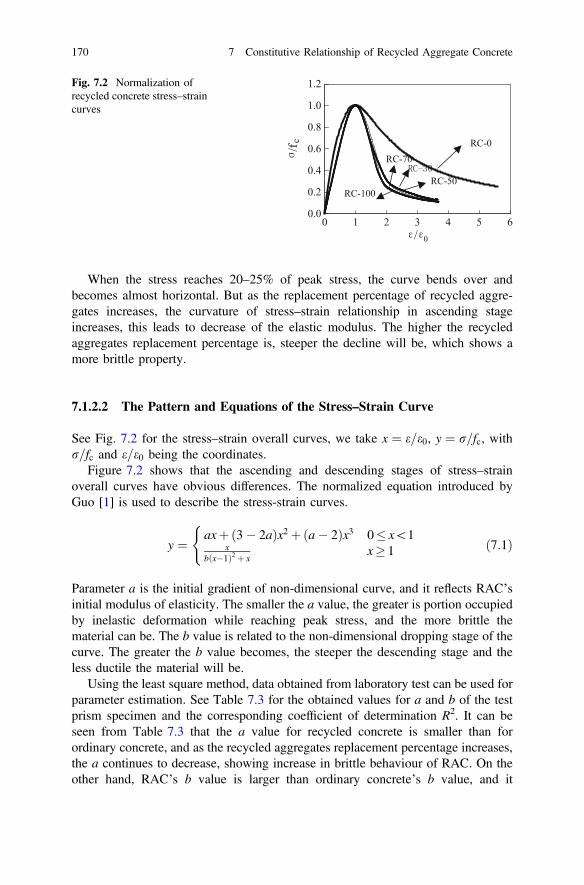
When the stress reaches 20–25% of peak stress, the curve bends over andbecomes almost horizontal. But as the replacement percentage of recycled aggre-gates increases, the curvature of stress–strain relationship in ascending stageincreases, this leads to decrease of the elastic modulus. The higher the recycledaggregates replacement percentage is, steeper the decline will be, which shows amore brittle property.
7.1.2.2 The Pattern and Equations of the Stress–Strain Curve
See Fig. 7.2 for the stress–strain overall curves, we take x ¼ e=e0, y ¼ r=fc, withr=fc and e=e0 being the coordinates.
Figure 7.2 shows that the ascending and descending stages of stress–strainoverall curves have obvious differences. The normalized equation introduced byGuo [1] is used to describe the stress-strain curves.
y ¼ axþð3� 2aÞx2 þða� 2Þx3 0� x\1x
bðx�1Þ2 þ xx� 1
(ð7:1Þ
Parameter a is the initial gradient of non-dimensional curve, and it reflects RAC’sinitial modulus of elasticity. The smaller the a value, the greater is portion occupiedby inelastic deformation while reaching peak stress, and the more brittle thematerial can be. The b value is related to the non-dimensional dropping stage of thecurve. The greater the b value becomes, the steeper the descending stage and theless ductile the material will be.
Using the least square method, data obtained from laboratory test can be used forparameter estimation. See Table 7.3 for the obtained values for a and b of the testprism specimen and the corresponding coefficient of determination R2. It can beseen from Table 7.3 that the a value for recycled concrete is smaller than forordinary concrete, and as the recycled aggregates replacement percentage increases,the a continues to decrease, showing increase in brittle behaviour of RAC. On theother hand, RAC’s b value is larger than ordinary concrete’s b value, and it
0.0
0.2
0.4
0.6
0.8
1.0
1.2
0 1 2 3 4 5 6/ 0
/fc RC-0
RC-50
RC-70
RC-100
Fig. 7.2 Normalization ofrecycled concrete stress–straincurves
170 7 Constitutive Relationship of Recycled Aggregate Concrete

increases as the recycled aggregates replacement percentage increases, showing thatRAC’s ductility is poor.
Through analyzing statistical data, the relationship between parameters a and b,and the RCA replacement percentage r can be further established as follows:
a ¼ 2:2ð0:748r2 � 1:231rþ 0:975Þ ð7:2Þ
b ¼ 0:8ð7:6483rþ 1:142Þ ð7:3Þ
See Fig. 7.3 for a comparison of the calculated complete curves and the actualcomplete curves.
Table 7.3 Parameters a and b
r 0 30% 50% 70% 100%
Parameter a/R2 2.20/0.99 1.32/0.99 1.26/1.00 1.15/0.98 1.04/1.00
Parameter b/R2 0.80/0.99 3.30/0.93 3.96/0.96 4.31/0.91 7.50/0.94
0
0.2
0.4
0.6
0.8
1
1.2Experimental
0
0.2
0.4
0.6
0.8
1
1.2
/f
ExperimentalPredicted
(a) 30%r = (b) 50%r =
0
0.2
0.4
0.6
0.8
1
1.2
/ 0
/f
ExperimentalPredicted
0
0.2
0.4
0.6
0.8
1
1.2
0 1 2 3 4 0 1 2 3 4
0 1 2 3 4 0 1 2 3 4
/f
ExperimentalPredicted
(c) 70%r = (d) 100%r =/ 0
/ 0 / 0
Fig. 7.3 Comparison of the test results and predicted curves
7.1 Stress–Strain Relationship Under Axial Compressive Loading 171

From Fig. 7.3, it can be seen that the curves of the calculated complete curvatureare in consistence with the actual curves. Therefore, the equations described byformula (7.1)–(7.3) can be taken as the RAC’s uniaxial loading constitutive model.This is for the linear analysis of the RAC structure and members.
7.1.3 Peak Stress
The compressive strength is the peak stress of test specimens under uniaxialcompression. The prism compressive strength fc and cube compressive strength fcuof RAC with different RCA replacement percentages are given in Table 7.4. It canbe seen from Table 7.4 that RCA contents have a significant influence on thecompressive strength of RAC. Generally, when the w/c ratios are same, the com-pressive strength of RAC decreases with increase in RCA. It is worth mentioningthat the fc/fcu ratio of RAC is higher than that of normal concrete, except in the caseof RC-30. The average fc/fcu ratio of RAC is 0.81, which is 8% higher than that ofnormal concrete. However, under the condition of same w/c ratio, both fc and fcu arelower than that of the normal concrete, because of the existence of RCA.
7.1.4 Peak Strain
The peak strain is the strain corresponding to peak stress. The peak strains of theRAC with different RCA contents are shown in Fig. 7.4. From Fig. 7.4, it can beseen that the value of peak strain increases as the RCA content increases. For aRCA replacement percentage r = 100%, the peak strain is increased by about 20%.This is consistent with the results of Rqhl and Atkinson [2]. The main reason for theincrease in the peak strain of RAC is due to the reduced elastic modulus of RAC,which leads to a larger deformation.
Table 7.4 Compressive strengths of RAC
No. Slump (mm) Density (kg/m3) fcu (MPa) fc (MPa) fc/fcuNC 42 2402 35.9 26.9 0.75
RC-30 33 2368 34.1 25.4 0.74
RC-50 41 2345 29.6 23.6 0.80
RC-70 40 2316 30.3 24.2 0.80
RC-100 44 2280 26.7 23.8 0.89
172 7 Constitutive Relationship of Recycled Aggregate Concrete

7.1.5 Ultimate Strain
The ultimate strain is taken as the longitudinal strain on the descending stage at astress level that equals to 85% of peak stress. The dependence of ultimate strain onRCA replacement percentage is shown in Fig. 7.5. Figure 7.5 reveals that the ulti-mate strain may decrease or increase with increasing RCA replacement percentage,depending on the value of r. For a smaller value of r, the ultimate strain decreaseswith increase in r, while the opposite may be the case for a larger value of r.
7.1.6 Elastic Modulus
The elastic modulus of RAC is shown in Fig. 7.6, versus the RCA replacementpercentage r. Figure 7.6 shows that the elastic modulus of the RAC is lower thanthat of the normal concrete (i.e., r = 0%), and it decreases with increasing RCAreplacement percentage. When the RCA replacement percentage is 100%, theelastic modulus is reduced by 45%. This lower elastic modulus of RAC than that ofNAC is due to the attached old mortar.
Fig. 7.4 Peak strain of RACvs Replacement percentage (r)
Fig. 7.5 Ultimate strain ofRAC vs Replacementpercentage (r)
7.1 Stress–Strain Relationship Under Axial Compressive Loading 173
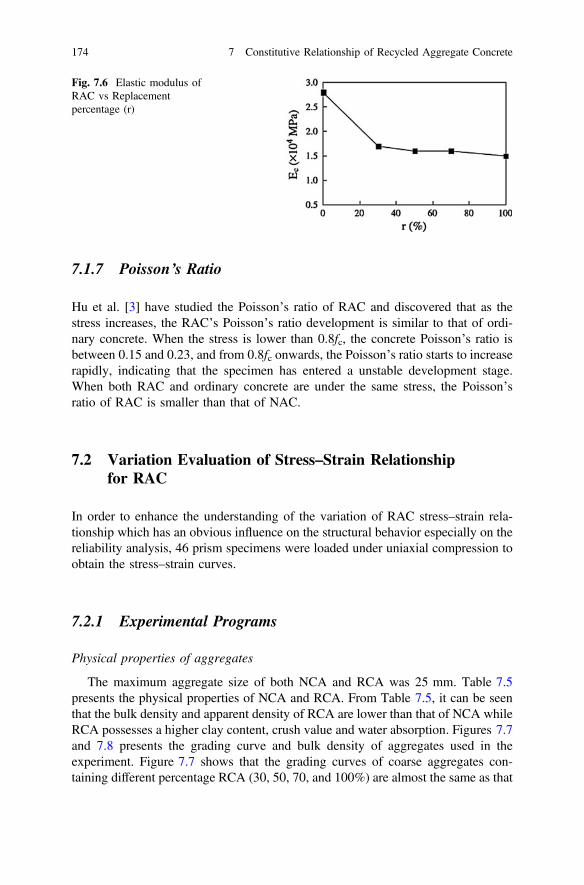
7.1.7 Poisson’s Ratio
Hu et al. [3] have studied the Poisson’s ratio of RAC and discovered that as thestress increases, the RAC’s Poisson’s ratio development is similar to that of ordi-nary concrete. When the stress is lower than 0.8fc, the concrete Poisson’s ratio isbetween 0.15 and 0.23, and from 0.8fc onwards, the Poisson’s ratio starts to increaserapidly, indicating that the specimen has entered a unstable development stage.When both RAC and ordinary concrete are under the same stress, the Poisson’sratio of RAC is smaller than that of NAC.
7.2 Variation Evaluation of Stress–Strain Relationshipfor RAC
In order to enhance the understanding of the variation of RAC stress–strain rela-tionship which has an obvious influence on the structural behavior especially on thereliability analysis, 46 prism specimens were loaded under uniaxial compression toobtain the stress–strain curves.
7.2.1 Experimental Programs
Physical properties of aggregates
The maximum aggregate size of both NCA and RCA was 25 mm. Table 7.5presents the physical properties of NCA and RCA. From Table 7.5, it can be seenthat the bulk density and apparent density of RCA are lower than that of NCA whileRCA possesses a higher clay content, crush value and water absorption. Figures 7.7and 7.8 presents the grading curve and bulk density of aggregates used in theexperiment. Figure 7.7 shows that the grading curves of coarse aggregates con-taining different percentage RCA (30, 50, 70, and 100%) are almost the same as that
Fig. 7.6 Elastic modulus ofRAC vs Replacementpercentage (r)
174 7 Constitutive Relationship of Recycled Aggregate Concrete
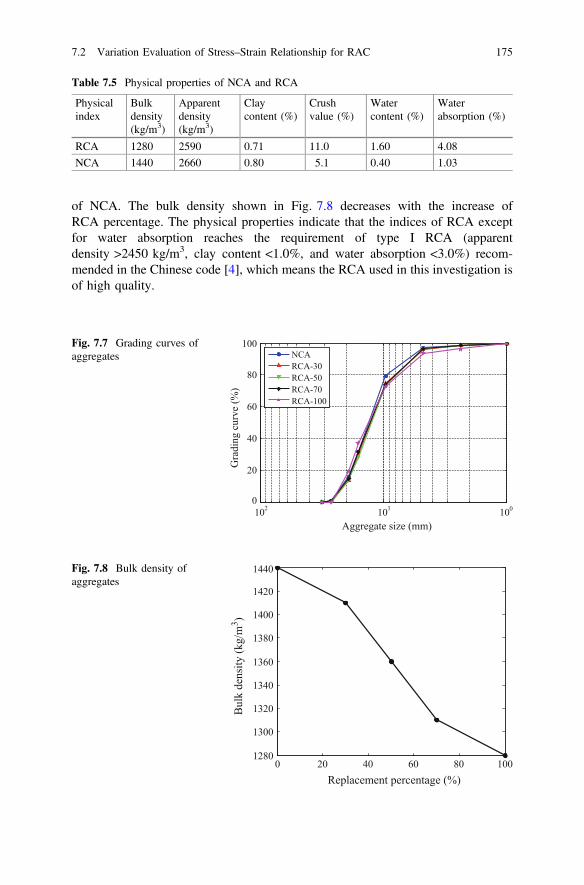
of NCA. The bulk density shown in Fig. 7.8 decreases with the increase ofRCA percentage. The physical properties indicate that the indices of RCA exceptfor water absorption reaches the requirement of type I RCA (apparentdensity >2450 kg/m3, clay content <1.0%, and water absorption <3.0%) recom-mended in the Chinese code [4], which means the RCA used in this investigation isof high quality.
Table 7.5 Physical properties of NCA and RCA
Physicalindex
Bulkdensity(kg/m3)
Apparentdensity(kg/m3)
Claycontent (%)
Crushvalue (%)
Watercontent (%)
Waterabsorption (%)
RCA 1280 2590 0.71 11.0 1.60 4.08
NCA 1440 2660 0.80 5.1 0.40 1.03
1001011020
20
40
60
80
100
Aggregate size (mm)
Gra
ding
cur
ve (%
)
NCARCA-30RCA-50RCA-70RCA-100
Fig. 7.7 Grading curves ofaggregates
0 20 40 60 80 1001280
1300
1320
1340
1360
1380
1400
1420
1440
Replacement percentage (%)
Bul
k de
nsity
(kg/
m3 )
Fig. 7.8 Bulk density ofaggregates
7.2 Variation Evaluation of Stress–Strain Relationship for RAC 175

Mix proportions
The mix proportions adopted in this experiment are listed in Table 7.6. In order toobtain similar compressive strength of NAC and RAC, the w/c ratio varies from 0.45to 0.41 with the RCA replacement percentage increasing from 0 to 100%. There are5 series of mixture to which the superplasticizer (SP) is added to improve theworkability of concrete. The aggregates used in this experiment are pre-saturated [5]before casting the specimens.
Specimens
The specimens included cubes of 150 mm side length and prisms with150 � 150 mm cross section and 300 mm height. There were 16 specimens(10 prisms and 6 cubes) for each RAC series and 12 specimens (6 prisms and 6cubes) for NAC, so the total number of specimens was 76.
The specimens were named as follows: (1) the letter RAC followed by a numberto represent the replacement percentage (in percentage) of RCA; (2) a number todifferentiate between the nominally identical specimens; and (3) for NAC speci-mens, the letter NAC directly followed by the identical number. For example,specimen RAC-30-02 is the second specimen of the RAC series that has a RCAreplacement percentage of 30%. NAC-03 is the third specimen of the NAC series.
Test setup and loading
The prism specimens were loaded in uniaxial compression using a stiff-framedservo-hydraulic testing machine (MTS815.02). The compressive load capacity is2700 kN, and this system can provide sufficient stiffness (the stiffness is9.0 � 109 N/m) to prevent specimens from sudden rupture and thus acquire thedescending part of stress–strain curve [6]. There is an internal force transducer formeasuring the load applied to the specimen in the system. The displacements ofplaten were recorded via the internal linear variable differential transformer (LVDT)fixed in the test setup. Two extensometers were fixed at mid-height on the oppositesurfaces of the specimens by strings to measure the average axial longitudinalstrain. The test setup is displayed in Fig. 7.9.
Table 7.6 Mix proportions
Specimen R (%) W (kg/m3) w/c C (kg/m3) S (kg/m3) NCA (kg/m3) RCA (kg/m3) SP (ml)
5–25 mm 5–25 mm
NAC 0 160 0.45 357 683 1080 0 571.43
RAC-30 30 160 0.44 364 681 749 321 581.82
RAC-50 50 160 0.43 372 678 530 530 595.35
RAC-70 70 160 0.42 377 678 315 735 603.77
RAC-100 100 160 0.41 386 679 0 1030 618.36
Note (1) The cement grade is 42.5; (2) R means replacement percentage; and (3) S is river sand
176 7 Constitutive Relationship of Recycled Aggregate Concrete
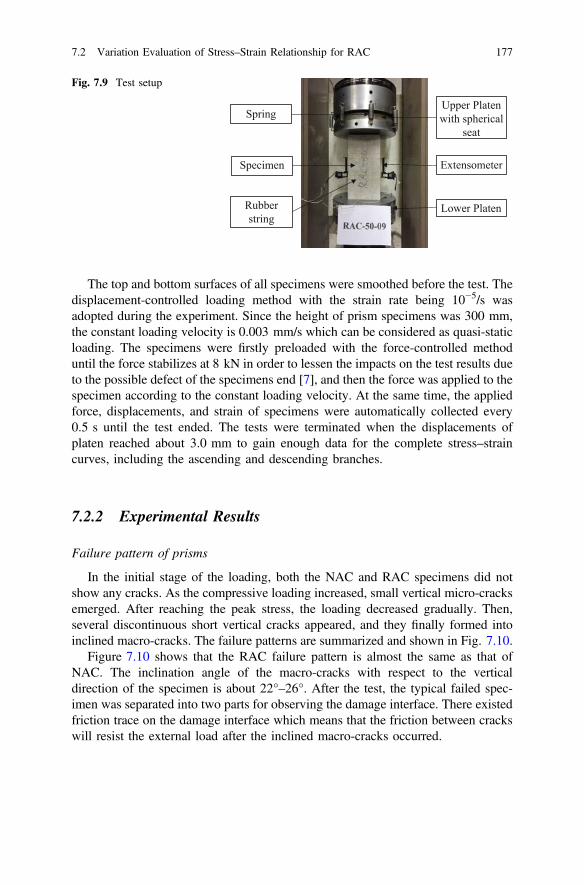
The top and bottom surfaces of all specimens were smoothed before the test. Thedisplacement-controlled loading method with the strain rate being 10−5/s wasadopted during the experiment. Since the height of prism specimens was 300 mm,the constant loading velocity is 0.003 mm/s which can be considered as quasi-staticloading. The specimens were firstly preloaded with the force-controlled methoduntil the force stabilizes at 8 kN in order to lessen the impacts on the test results dueto the possible defect of the specimens end [7], and then the force was applied to thespecimen according to the constant loading velocity. At the same time, the appliedforce, displacements, and strain of specimens were automatically collected every0.5 s until the test ended. The tests were terminated when the displacements ofplaten reached about 3.0 mm to gain enough data for the complete stress–straincurves, including the ascending and descending branches.
7.2.2 Experimental Results
Failure pattern of prisms
In the initial stage of the loading, both the NAC and RAC specimens did notshow any cracks. As the compressive loading increased, small vertical micro-cracksemerged. After reaching the peak stress, the loading decreased gradually. Then,several discontinuous short vertical cracks appeared, and they finally formed intoinclined macro-cracks. The failure patterns are summarized and shown in Fig. 7.10.
Figure 7.10 shows that the RAC failure pattern is almost the same as that ofNAC. The inclination angle of the macro-cracks with respect to the verticaldirection of the specimen is about 22°–26°. After the test, the typical failed spec-imen was separated into two parts for observing the damage interface. There existedfriction trace on the damage interface which means that the friction between crackswill resist the external load after the inclined macro-cracks occurred.
Upper Platen with spherical
seat
Lower Platen
ExtensometerSpecimen
Rubber string
Spring
Fig. 7.9 Test setup
7.2 Variation Evaluation of Stress–Strain Relationship for RAC 177

Experimental stress–strain curves
The experimental stress–strain data of each mixture series were drawn in onefigure, respectively, as shown in Fig. 7.11. It can be figured out that in theascending branch when the stress is lower than 0.4 times peak stress (rcp), thecurves almost coincide with each other. In contrast, the peak stress and peak strain(ecp) show obvious variation in each series. In order to assess the variation of eachseries of curves, the values of mean and coefficient of variation (COV) corre-sponding to given strain which starts from 0 to 0.009 with a 0.0002 interval werecalculated. Figure 7.12 describes the change on statistical parameters of stress withthe increase in strain. The standard deviation shown in descending branch is largerthan that in ascending branch. The five mean curves and five COV series were puttogether in one figure (Figs. 7.13 and 7.14), respectively, for the convenience ofcomparing with each other. As Fig. 7.13a shows, the peak stress of RAC-70 is thehighest followed by RAC-50, RAC-100, and NAC while the RAC-30 is the lowest,which is coincident with that of cubes. Figure 7.13b indicates that the descendingbranches of RAC are steeper than that of NAC, which means that the RAC pos-sesses more brittle properties. Figure 7.14 shows that the COV of stress decreasesbefore the strain reaches about 0.001 for RAC series while the COV of NACincreases until the strain reaches about 0.0055. Then, the COV increases except forRAC-30 with the increasing strain and the first peak COV occurs for RAC-50,RAC-70, and RAC-100 corresponding to the strain which is larger than the peakstrain. Finally, the maximum COV occurs nearby the strain about 0.0085 except forNAC and RAC-30 whose maximum COV occurs earlier with the strain about0.0055.
7.2.3 Summary
(a) The failure pattern of RAC under uniaxial compression is almost the same asthat of NAC when they have the similar compressive strength. The initial
(a) NAC (b) RAC-30 (c) RAC-50 (d) RAC-70 (e) RAC-100
Fig. 7.10 Failure pattern of prism specimens
178 7 Constitutive Relationship of Recycled Aggregate Concrete

discontinuous cracks finally formed into an inclined macro-crack along thediagonal direction when the failure occurred.
(b) The use of high quality RCA is expected to reduce the variability in themechanical behavior of RAC. As the experimental results showed, the RACstress-strain curve did not appear significant higher variation than that of NAC.Besides the mentioned high quality of RAC, the multiple source is considered
0 0.002 0.004 0.006 0.008 0.010
10
20
30
40
50
Strain εc
Stre
ss σ
c(M
Pa)
NAC-01NAC-02NAC-03NAC-04NAC-05NAC-06
0 0.002 0.004 0.006 0.008 0.010
10
20
30
40
50
Strain εc
Stre
ss σ
c(M
Pa)
RAC-30-01RAC-30-02RAC-30-03RAC-30-04RAC-30-05RAC-30-06RAC-30-07RAC-30-08RAC-30-09RAC-30-10
(a) NAC (b) RAC-30
0 0.002 0.004 0.006 0.008 0.010
10
20
30
40
50
60
Strain εc
Stre
ss σ
c(M
Pa)
RAC-50-01RAC-50-02RAC-50-03RAC-50-04RAC-50-05RAC-50-06RAC-50-07RAC-50-08RAC-50-09RAC-50-10
0 0.002 0.004 0.006 0.008 0.010
10
20
30
40
50
60
Strain εc
Stre
ss σ
c(M
Pa)
RAC-70-01RAC-70-02RAC-70-03RAC-70-04RAC-70-05RAC-70-06RAC-70-07RAC-70-08RAC-70-09RAC-70-10
(c) RAC-50 (d) RAC-70
0 0.002 0.004 0.006 0.008 0.010
10
20
30
40
50
Strain εc
Stre
ss σ
c(M
Pa)
RAC-100-01RAC-100-02RAC-100-03RAC-100-04RAC-100-05RAC-100-06RAC-100-07RAC-100-08RAC-100-09RAC-100-10
(e) RAC-100
Fig. 7.11 Stress–strain curves of specimens
7.2 Variation Evaluation of Stress–Strain Relationship for RAC 179

as one of the most important factors that influence the variation of RACproperties.
(c) Accounting for potential variability in the stress-strain relationship of RAC ishighly important to achieve a more realistic prediction of RAC’s behaviorunder load in practice. However, there is currently a lack of a comprehensiveanalytical investigation for incorporation of such variability in availablestress-strain analytical expressions. Further research is required to investigatethe variability caused by use of multiple sources of RCA on stress-strainrelationship of RAC.
0 0.002 0.004 0.006 0.008 0.010
10
20
30
40
50
Strain εc
Stre
ss σ
c(M
Pa)
0 0.002 0.004 0.006 0.008 0.010
10
20
30
40
50
Strain εc
Stre
ss σ
c(M
Pa)
(a) NAC (b) RAC-30
0 0.002 0.004 0.006 0.008 0.010
10
20
30
40
50
Strain εc
Stre
ss σ
c(M
Pa)
0 0.002 0.004 0.006 0.008 0.010
10
20
30
40
50
Strain εc
Stre
ss σ
c(M
Pa)
(c) RAC-50 (d) RAC-70
0 0.002 0.004 0.006 0.008 0.010
10
20
30
40
50
Strain εc
Stre
ss σ
c(M
Pa)
(e) RAC-100
Fig. 7.12 Mean and standard deviation of stress–strain curves
180 7 Constitutive Relationship of Recycled Aggregate Concrete

7.3 Stress–Strain Relationship Under Axial TensileLoading
7.3.1 Experimental Descriptions
7.3.1.1 Design of Experiments
Two strength grades (i.e., C20 and C30) were prepared by using different mixproportions as listed in Table 7.7. Specimens were made to conduct both tensileand compressive strength tests for the parent concrete. In addition, six cube
0 0.002 0.004 0.006 0.008 0.010
10
20
30
40
50
Strain εc
Stre
ss σ
c(M
Pa)
NACRAC-30RAC-50RAC-70RAC-100
0 1 2 3 4 50
0.2
0.4
0.6
0.8
1
εc / εcp
σ c / σ
cp
NACRAC-30RAC-50RAC-70RAC-100
(a) Mean stress-strain curves without normalization (b) Normalized mean stress-strain curves
Fig. 7.13 Mean stress-strain curves for different RAC series
0 0.002 0.004 0.006 0.008 0.010
0.05
0.1
0.15
0.2
0.25
Strain εc
CO
V
NACRAC-30RAC-50RAC-70RAC-100
Fig. 7.14 COV of differentRAC series
Table 7.7 Mix proportionsof the concrete
Cement Sand Coarse aggregate Water
C20 1.000 1.989 3.693 0.574
C30 1.000 1.395 2.591 0.429
7.3 Stress–Strain Relationship Under Axial Tensile Loading 181
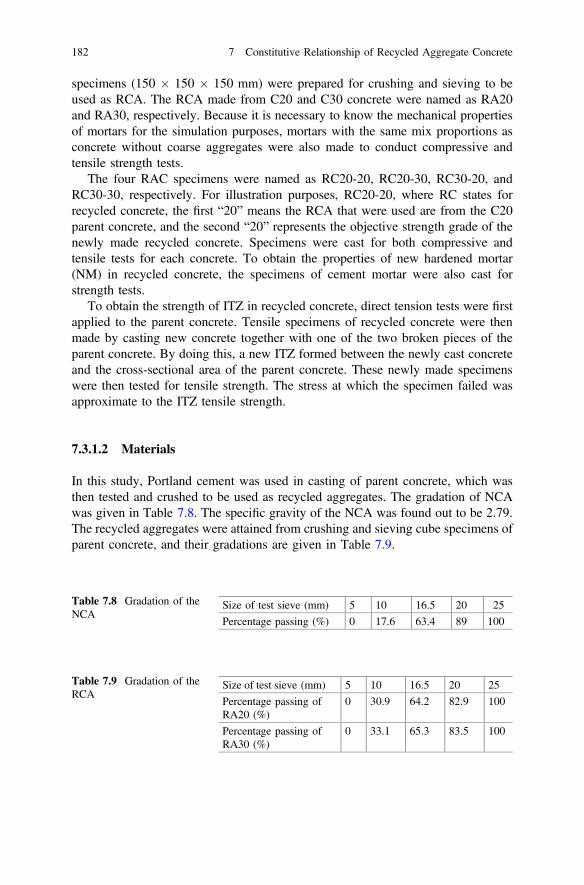
specimens (150 � 150 � 150 mm) were prepared for crushing and sieving to beused as RCA. The RCA made from C20 and C30 concrete were named as RA20and RA30, respectively. Because it is necessary to know the mechanical propertiesof mortars for the simulation purposes, mortars with the same mix proportions asconcrete without coarse aggregates were also made to conduct compressive andtensile strength tests.
The four RAC specimens were named as RC20-20, RC20-30, RC30-20, andRC30-30, respectively. For illustration purposes, RC20-20, where RC states forrecycled concrete, the first “20” means the RCA that were used are from the C20parent concrete, and the second “20” represents the objective strength grade of thenewly made recycled concrete. Specimens were cast for both compressive andtensile tests for each concrete. To obtain the properties of new hardened mortar(NM) in recycled concrete, the specimens of cement mortar were also cast forstrength tests.
To obtain the strength of ITZ in recycled concrete, direct tension tests were firstapplied to the parent concrete. Tensile specimens of recycled concrete were thenmade by casting new concrete together with one of the two broken pieces of theparent concrete. By doing this, a new ITZ formed between the newly cast concreteand the cross-sectional area of the parent concrete. These newly made specimenswere then tested for tensile strength. The stress at which the specimen failed wasapproximate to the ITZ tensile strength.
7.3.1.2 Materials
In this study, Portland cement was used in casting of parent concrete, which wasthen tested and crushed to be used as recycled aggregates. The gradation of NCAwas given in Table 7.8. The specific gravity of the NCA was found out to be 2.79.The recycled aggregates were attained from crushing and sieving cube specimens ofparent concrete, and their gradations are given in Table 7.9.
Table 7.8 Gradation of theNCA
Size of test sieve (mm) 5 10 16.5 20 25
Percentage passing (%) 0 17.6 63.4 89 100
Table 7.9 Gradation of theRCA
Size of test sieve (mm) 5 10 16.5 20 25
Percentage passing ofRA20 (%)
0 30.9 64.2 82.9 100
Percentage passing ofRA30 (%)
0 33.1 65.3 83.5 100
182 7 Constitutive Relationship of Recycled Aggregate Concrete

7.3.1.3 Specimens Casting and Curing
There were three types of specimens. The prism specimens of with the dimensionsof 100 � 100 � 300 mm were cast for compressive test. The compressive speci-mens of mortar were prisms with the dimensions of 70.7 � 70.7 � 210 mm. Allthe tensile specimens were in the shape of dumbbell as shown in Fig. 7.15. The areaof the cross section of the middle part is about 100 � 100 mm. An ITZ tensilespecimen is shown in Fig. 7.16.
After demolding, the specimens were stored under standard moist curing con-ditions at 23 °C and 95% RH till testing. All the specimens were tested after therecycled concrete was cured for 28 days.
7.3.1.4 Test Loading
The experimental setup is shown in Fig. 7.17a. Stroke control mode was usedduring the tests. The wading speed of the tests was kept constant at 0.01 mm/min.
(a) Front view dimension (b) Side view dimension (c) Photo
Fig. 7.15 Tensile specimen (mm)
Fig. 7.16 ITZ simulationtensile specimen
7.3 Stress–Strain Relationship Under Axial Tensile Loading 183
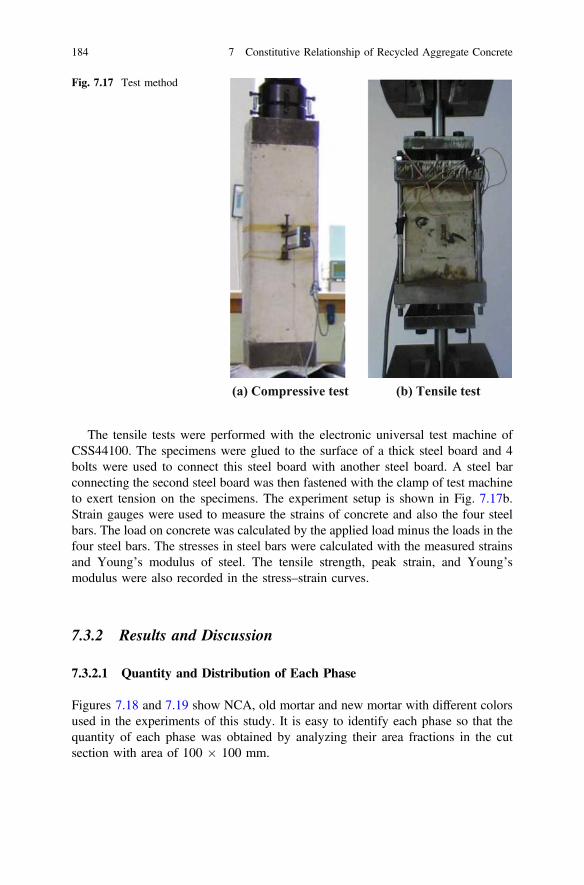
The tensile tests were performed with the electronic universal test machine ofCSS44100. The specimens were glued to the surface of a thick steel board and 4bolts were used to connect this steel board with another steel board. A steel barconnecting the second steel board was then fastened with the clamp of test machineto exert tension on the specimens. The experiment setup is shown in Fig. 7.17b.Strain gauges were used to measure the strains of concrete and also the four steelbars. The load on concrete was calculated by the applied load minus the loads in thefour steel bars. The stresses in steel bars were calculated with the measured strainsand Young’s modulus of steel. The tensile strength, peak strain, and Young’smodulus were also recorded in the stress–strain curves.
7.3.2 Results and Discussion
7.3.2.1 Quantity and Distribution of Each Phase
Figures 7.18 and 7.19 show NCA, old mortar and new mortar with different colorsused in the experiments of this study. It is easy to identify each phase so that thequantity of each phase was obtained by analyzing their area fractions in the cutsection with area of 100 � 100 mm.
(a) Compressive test (b) Tensile test
Fig. 7.17 Test method
184 7 Constitutive Relationship of Recycled Aggregate Concrete

Figure 7.18a shows an image of a cross section of parent concrete, andFig. 7.18b shows the processed image of the same section. In both images, the darkcolor represents natural aggregates and the white color represents hardened mortar.By counting the total pixels of each color, the area fractions of each phase weredetermined.
For recycled concrete, an image of a cut sectional area and the correspondingprocessed image are shown in Fig. 7.19. Same as Fig. 7.18, the dark color is naturalaggregates, the white color is old hardened mortar, and the grey color is newhardened mortar. Area fractions of each phase were identified and calculated withexactly the same procedures as described for parent concrete.
7.3.2.2 Physical Properties
The physical properties of recycled aggregate are listed in Table 7.10. From thetable, it was observed that the densities of both recycled aggregates made from twodifferent parent concrete are lower than the natural aggregate density, while bothrecycled aggregates have much higher water absorption than that of naturalaggregate. This is due to the higher porosity in recycled aggregate. The densities of
(a) Real one (b) After processed
Fig. 7.18 Cut section ofparent concrete
(a) Real one (b) After processed
Fig. 7.19 Cut section ofrecycled concrete
7.3 Stress–Strain Relationship Under Axial Tensile Loading 185
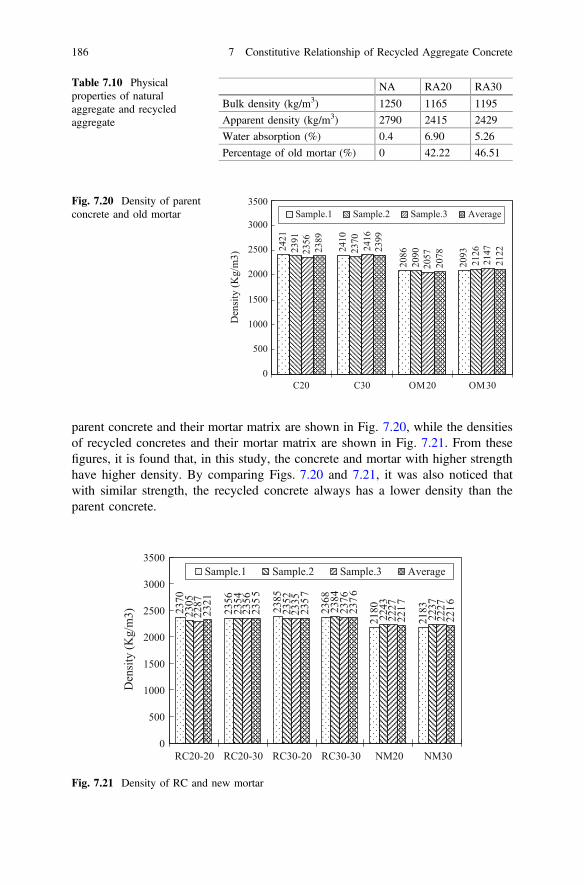
parent concrete and their mortar matrix are shown in Fig. 7.20, while the densitiesof recycled concretes and their mortar matrix are shown in Fig. 7.21. From thesefigures, it is found that, in this study, the concrete and mortar with higher strengthhave higher density. By comparing Figs. 7.20 and 7.21, it was also noticed thatwith similar strength, the recycled concrete always has a lower density than theparent concrete.
Table 7.10 Physicalproperties of naturalaggregate and recycledaggregate
NA RA20 RA30
Bulk density (kg/m3) 1250 1165 1195
Apparent density (kg/m3) 2790 2415 2429
Water absorption (%) 0.4 6.90 5.26
Percentage of old mortar (%) 0 42.22 46.51
2421
2410
2086
209323
91
2370
2090
212623
56
2416
2057 214723
89
2399
2078
2122
0
500
1000
1500
2000
2500
3000
3500
C20 C30 OM20 OM30
Den
sity
(Kg/
m3)
Sample.1 Sample.2 Sample.3 AverageFig. 7.20 Density of parentconcrete and old mortar
2370
2356
2385
2368
2180
218323
05
2354
2352
2384
2243
2237
2287
2356
2335
2376
2227
22272321
2355
2357
2376
221 7
2216
0
500
1000
1500
2000
2500
3000
3500
RC20-20 RC20-30 RC30-20 RC30-30 NM20 NM30
Den
sity
(Kg/
m3)
Sample.1 Sample.2 Sample.3 Average
Fig. 7.21 Density of RC and new mortar
186 7 Constitutive Relationship of Recycled Aggregate Concrete
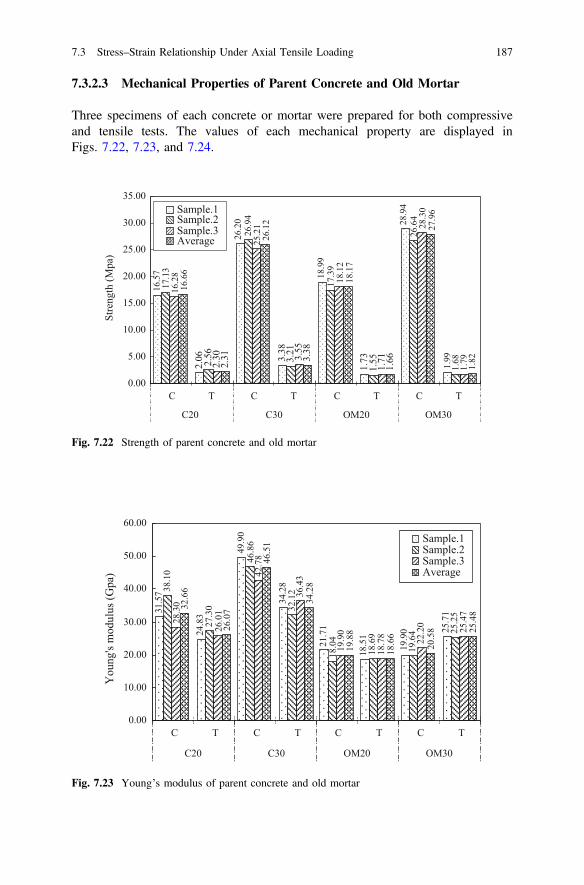
7.3.2.3 Mechanical Properties of Parent Concrete and Old Mortar
Three specimens of each concrete or mortar were prepared for both compressiveand tensile tests. The values of each mechanical property are displayed inFigs. 7.22, 7.23, and 7.24.
16.5
7
26.2
0
18.9
9
28.9
4
17.1
3
26.9
4
17.3
9
26.6
4
16.2
8
25.2
1
18.1
2
28.3
0
16.6
6
26.1
2
18.1
7
27.9
6
2.06 3.
38
1.73 1.992.56 3.21
1.55
1.682.30 3.
55
1.71
1.792.31 3.
38
1.66
1.82
0.00
5.00
10.00
15.00
20.00
25.00
30.00
35.00
C T C T C T C T
C20 C30 OM20 OM30
Stre
ngth
(Mpa
)
Sample.1Sample.2Sample.3Average
Fig. 7.22 Strength of parent concrete and old mortar
31.5
7
49.9
0
38.1
0
46.8
6
18.0
4
19.6
4
28.3
0
42.7
8
19.9
0
22.2
0
32.6
6
46.5
1
19.8
8
20.5
824.8
3
34.2
8
18.5
1
25.7
1
27.3
0 32.1
2
18.6
9 25.2
5
26.0
1
36.4
3
18.7
8 25.4
7
26.0
7
34.2
8
18.6
6 25.4
8
21.7
1
19.9
0
0.00
10.00
20.00
30.00
40.00
50.00
60.00
C T C T C T C T
C20 C30 OM20 OM30
You
ng's
mod
ulus
(Gpa
)
Sample.1Sample.2Sample.3Average
Fig. 7.23 Young’s modulus of parent concrete and old mortar
7.3 Stress–Strain Relationship Under Axial Tensile Loading 187
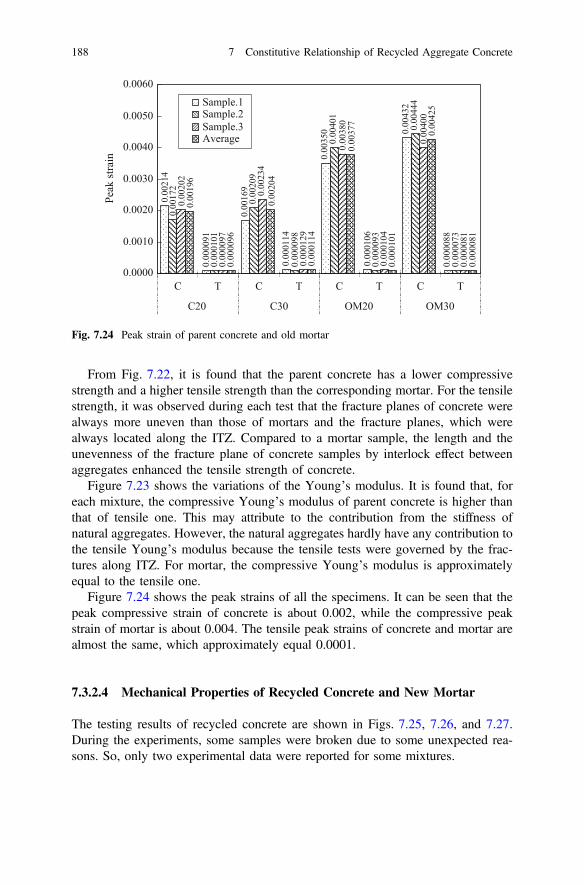
From Fig. 7.22, it is found that the parent concrete has a lower compressivestrength and a higher tensile strength than the corresponding mortar. For the tensilestrength, it was observed during each test that the fracture planes of concrete werealways more uneven than those of mortars and the fracture planes, which werealways located along the ITZ. Compared to a mortar sample, the length and theunevenness of the fracture plane of concrete samples by interlock effect betweenaggregates enhanced the tensile strength of concrete.
Figure 7.23 shows the variations of the Young’s modulus. It is found that, foreach mixture, the compressive Young’s modulus of parent concrete is higher thanthat of tensile one. This may attribute to the contribution from the stiffness ofnatural aggregates. However, the natural aggregates hardly have any contribution tothe tensile Young’s modulus because the tensile tests were governed by the frac-tures along ITZ. For mortar, the compressive Young’s modulus is approximatelyequal to the tensile one.
Figure 7.24 shows the peak strains of all the specimens. It can be seen that thepeak compressive strain of concrete is about 0.002, while the compressive peakstrain of mortar is about 0.004. The tensile peak strains of concrete and mortar arealmost the same, which approximately equal 0.0001.
7.3.2.4 Mechanical Properties of Recycled Concrete and New Mortar
The testing results of recycled concrete are shown in Figs. 7.25, 7.26, and 7.27.During the experiments, some samples were broken due to some unexpected rea-sons. So, only two experimental data were reported for some mixtures.
0.00
214
0.00
169
0.00
350 0.
0043
2
0.00
172
0.00
209
0.00
401
0.00
444
0.00
202
0.00
234
0.00
380
0.00
400
0.00
196
0.00
204
0.00
377
0.00
425
0.00
0114
0.00
0106
0.00
0088
0.00
0101
0.00
0098
0.00
0093
0.00
0073
0.00
0097
0.00
0129
0.00
0104
0.00
0081
0.00
0096
0.00
0114
0.00
0101
0.00
0081
0.00
0091
0.0000
0.0010
0.0020
0.0030
0.0040
0.0050
0.0060
C T C T C T C T
C20 C30 OM20 OM30
Peak
stra
inSample.1Sample.2Sample.3Average
Fig. 7.24 Peak strain of parent concrete and old mortar
188 7 Constitutive Relationship of Recycled Aggregate Concrete
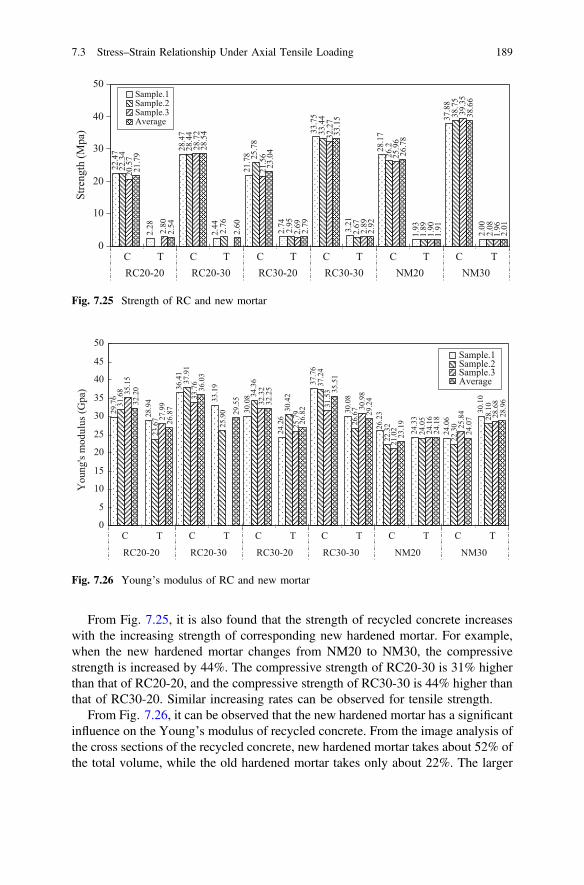
From Fig. 7.25, it is also found that the strength of recycled concrete increaseswith the increasing strength of corresponding new hardened mortar. For example,when the new hardened mortar changes from NM20 to NM30, the compressivestrength is increased by 44%. The compressive strength of RC20-30 is 31% higherthan that of RC20-20, and the compressive strength of RC30-30 is 44% higher thanthat of RC30-20. Similar increasing rates can be observed for tensile strength.
From Fig. 7.26, it can be observed that the new hardened mortar has a significantinfluence on the Young’s modulus of recycled concrete. From the image analysis ofthe cross sections of the recycled concrete, new hardened mortar takes about 52% ofthe total volume, while the old hardened mortar takes only about 22%. The larger
22.4
7 28.4
7
21.7
8
33.7
5
28.1
7
37.8
8
22.3
4 28.4
4
25.7
8
33.4
4
26.2
38.7
5
20.5
7
28.7
2
21.5
6
32.2
7
25.9
6
39.3
5
28.5
4
23.0
4
33.1
5
26.7
8
38.6
6
2.28
2.44 2.74 3.21
1.93
2.002.76
2.95
2.67
1.89
2.082.80
2.69
2.89
1.90
1.962.54
2.79
2.92
1.91
2.01
21.7
9
2.60
0
10
20
30
40
50
C T C T C T C T C T C TRC20-20 RC20-30 RC30-20 RC30-30 NM20 NM30
Stre
ngth
(Mpa
)Sample.1Sample.2Sample.3Average
Fig. 7.25 Strength of RC and new mortar
29.7
6
36.4
1
30.0
8
37.7
6
31.6
8
37.9
1
34.3
6 37.2
4
22.3
2
22.3
0
35.1
5
33.7
6
32.3
2
31.5
3
21.0
2 25.8
4
32.2
0 36.0
3
32.2
5 35.5
1
23.1
9
24.0
728.9
4 33.1
9
24.2
6
30.0
8
24.3
3
30.1
0
23.6
7
25.9
0 30.4
2
26.6
7
24.0
5 28.1
0
27.9
9
25.7
9 30.9
8
24.1
6 28.6
8
26.8
7 29.5
5
26.8
2 29.2
4
24.1
8 28.9
6
26.2
3
24.0
6
0
5
10
15
20
25
30
35
40
45
50
C T C T C T C T C T C T
RC20-20 RC20-30 RC30-20 RC30-30 NM20 NM30
You
ng's
mod
ulus
(Gpa
)
Sample.1Sample.2Sample.3Average
Fig. 7.26 Young’s modulus of RC and new mortar
7.3 Stress–Strain Relationship Under Axial Tensile Loading 189
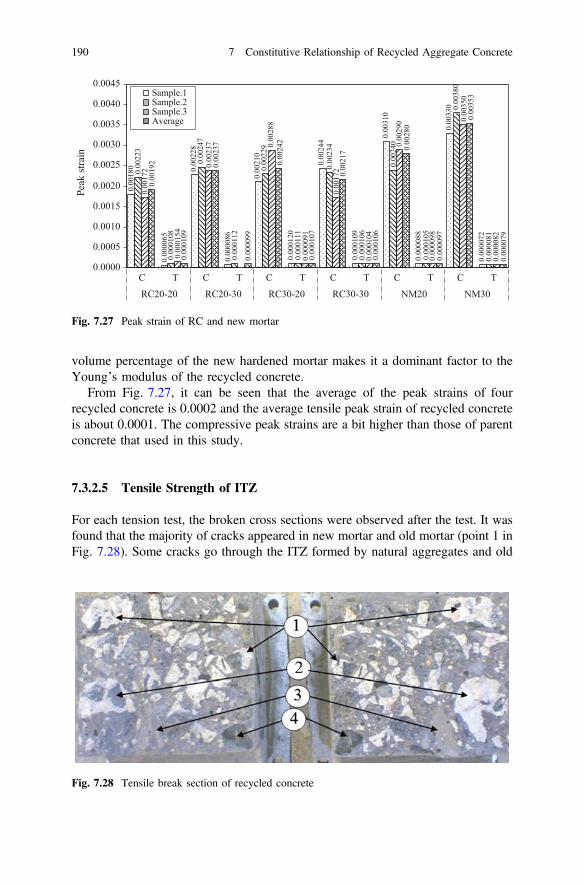
volume percentage of the new hardened mortar makes it a dominant factor to theYoung’s modulus of the recycled concrete.
From Fig. 7.27, it can be seen that the average of the peak strains of fourrecycled concrete is 0.0002 and the average tensile peak strain of recycled concreteis about 0.0001. The compressive peak strains are a bit higher than those of parentconcrete that used in this study.
7.3.2.5 Tensile Strength of ITZ
For each tension test, the broken cross sections were observed after the test. It wasfound that the majority of cracks appeared in new mortar and old mortar (point 1 inFig. 7.28). Some cracks go through the ITZ formed by natural aggregates and old
0.00
180 0.00
228
0.00
210
0.00
244
0.00
310
0.00
330
0.00
223
0.00
247
0.00
229
0.00
234
0.00
240
0.00
380
0.00
172 0.
0023
7 0.00
288
0.00
172
0.00
290 0.
0035
0
0.00
192 0.00
237
0.00
242
0.00
217 0.
0028
0
0.00
353
0.00
0065
0.00
0086
0.00
0120
0.00
0109
0.00
0088
0.00
0072
0.00
0108
0.00
0112
0.00
0111
0.00
0106
0.00
0105
0.00
0081
0.00
0154
0.00
0091
0.00
0104
0.00
0098
0.00
0082
0.00
0109
0.00
0099
0.00
0107
0.00
0106
0.00
0097
0.00
0079
0.0000
0.0005
0.0010
0.0015
0.0020
0.0025
0.0030
0.0035
0.0040
0.0045
C T C T C T C T C T C T
RC20-20 RC20-30 RC30-20 RC30-30 NM20 NM30
Peak
stra
inSample.1Sample.2Sample.3Average
Fig. 7.27 Peak strain of RC and new mortar
Fig. 7.28 Tensile break section of recycled concrete
190 7 Constitutive Relationship of Recycled Aggregate Concrete

mortar (point 2 in Fig. 7.28). Cracks going through the ITZ formed by naturalaggregates and new mortar were also found (point 3 in Fig. 7.28), and some crackswere found to go through natural aggregates as shown in Fig. 7.28 (point 4).However, very few cracks were found to go through the ITZ formed between oldmortar and new mortar. This indicates that the new mortar has good bonding withthe old mortar in a recycled concrete.
The ITZ strength was found to be 1.021 MPa and 1.321 MPa for specimensmade from NM20 and NM30, respectively. The ITZ strength is about 60% of thetensile strength of new mortar that was used.
7.3.3 Simulation with Lattice Model
7.3.3.1 Conventional Lattice Model Method
The theory of lattice model was firstly developed by Schlangen and Van Mier [8,9], which usually is used to simulate the crack growth in concrete. The basic stepsof lattice model analysis include dispersing the material into a lattice with bar orbeam elements, loading and numerically calculation, and deleting some elementshaving high tensile stresses. The crack growth and deformation of the micro andmeso-structure can then be obtained.
7.3.3.2 A Modified Lattice Model
Based on the essential micro-mechanical mechanism of solid materials, a newlattice model is proposed in this study (shown in Fig. 7.29a). The mesh algorithmused in lattice includes horizontal, vertical, and tilted bars. Ideally, the cross tiltedbars are separated from each other without intercrossing. In the model, all the nodesare hinges.
(a) Lattice model (b) Restriction and load
Fig. 7.29 Lattice model
7.3 Stress–Strain Relationship Under Axial Tensile Loading 191

The area of the lattice model is 100 � 100 mm, with totally 10,201 nodes and40,200 bar elements inside. 20,200 bar elements are horizontal or vertical, and20,000 bar elements are tilted. The length of both vertical and horizontal bar ele-ments is 1 mm.
Coded by FORTRAN language, the 101 nodes on the bottom of the lattice arerestricted along Y-direction and one of them is also restricted along X-direction asshown in Fig. 7.29b. The 101 nodes along the top edge of the lattice are subjectedto a Y-axis displacement step by step.
The basic parameters of the bar elements are area of the cross section (A), theYoung’s modulus (E), and the tensile strength (ft). They are attained with tentativenumerical calculations as follows:
The principle of selecting basic parameters of bar elements is that the wholelattice has the same elastic modulus, Poisson’s ratio, and tensile strength asconcrete.
The Young’s modulus (E) and the area (A) of the bar elements obviouslyinfluence the calculation result of lattice method. And they commonly appeartogether as EA in the numerical calculation. In this model, the elastic modulus E ofbars was assumed as a constant while the area A was suggested changeable. Inaddition, Poisson’s ratio of 0.167 was used in the simulation. The area of the barsshould be filled fully in the area of the lattice as a continuous material. Afternumerically trial calculations, the Young’s modulus and the area assigned to thelattice are listed in Table 7.11.
The tensile strength of the bars was determined based on two principles: (1) thetensile strength of the lattice is similar to concrete tensile strength; (2) for homo-geneous material, the vertical bars and the inclined ones are broken almost at thesame step when a large enough tensile load is applied to the lattice.
7.3.3.3 A Modified Random Aggregate Model for RecycledAggregate Concrete
A modified random aggregate model was proposed to simulate the concretematerial as a four-phase composite that includes natural aggregate, old hardenedmortar, new hardened mortar, and ITZ (new ITZ and old ITZ). In the simulation,the aggregates were simplified into circular shape as shown in Fig. 7.30.
The random aggregate model of recycled concrete was achieved by aFORTRAN program which was summarized as follows:
Table 7.11 Basic parameters of the lattice
Young’s modulus Area (mm2) Tensile strength
Concrete E ftVertical and horizontal elements 1.64E 0.5 3.34ftTilted elements 1.64E 0.2 1.34ft
192 7 Constitutive Relationship of Recycled Aggregate Concrete

(1) Construct a 100 � 100 mm square.(2) According to the gradation of RCA, the number of each particle size was
calculated as listed in Table 7.12. The average values of each neighboring sievesizes were used to represent the sizes of aggregates. For instance, the averageparticle size from 5 to 10 mm was set as 7.5 mm.
(3) The random numbers between 0 and 1 were gained in FORTRAN program bythe Monte Carlo method.
(4) The RCA were placed in the model were in a sequence from big to small.(5) The small aggregates between 5 and 10 mm were generated and were defined
as either old hardened mortar or NCA according to their volume percentage.
Based on the above steps, the random aggregate of RAC RC20-20 was built asshown in Fig. 7.31. In the figure, the dark color represents NCA, the white colorrepresents old hardened mortar, and the gray color represents new hardened mortar.
NA
Old HM
New ITZ
New ITZ
New ITZ
Old HM
Old ITZ
NA
New HM
Fig. 7.30 Simplifiedrecycled concrete
Table 7.12 Quantity of coarse aggregate of different particle size
Particle size (mm) 5 10 16.5 20 25
Percentage passing (%) 0 30.9 64.2 82.9 100
Particle size scope (mm) 5–10 10–16.5 16.5–20 20–25
Weight percentage in RA20 (%) 30.9 33.3 18.7 17.1
Volume percentage in RC20-20 (%) 14.62 15.75 8.85 8.09
Representative diameter (mm) 7.5 13.25 18.25 22.5
Number of aggregate 33 12 3 2
7.3 Stress–Strain Relationship Under Axial Tensile Loading 193
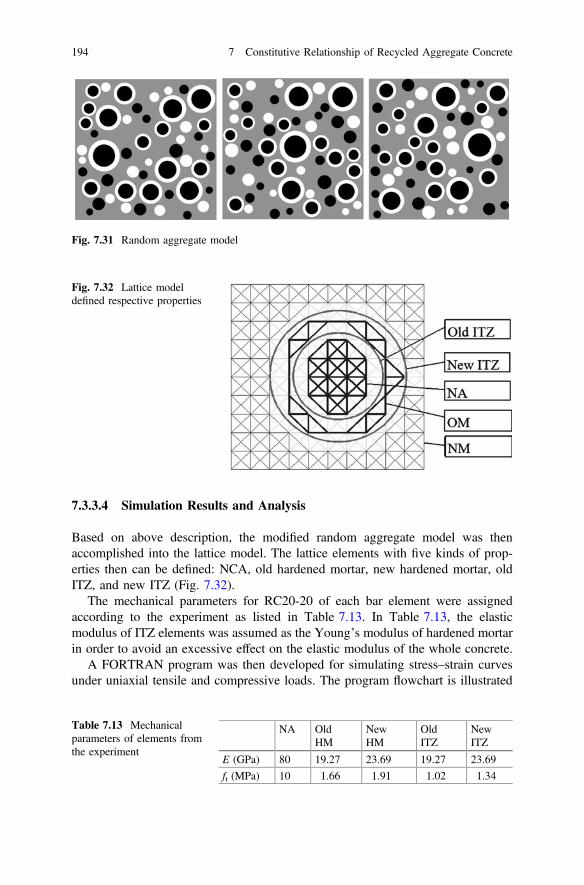
7.3.3.4 Simulation Results and Analysis
Based on above description, the modified random aggregate model was thenaccomplished into the lattice model. The lattice elements with five kinds of prop-erties then can be defined: NCA, old hardened mortar, new hardened mortar, oldITZ, and new ITZ (Fig. 7.32).
The mechanical parameters for RC20-20 of each bar element were assignedaccording to the experiment as listed in Table 7.13. In Table 7.13, the elasticmodulus of ITZ elements was assumed as the Young’s modulus of hardened mortarin order to avoid an excessive effect on the elastic modulus of the whole concrete.
A FORTRAN program was then developed for simulating stress–strain curvesunder uniaxial tensile and compressive loads. The program flowchart is illustrated
Fig. 7.32 Lattice modeldefined respective properties
Fig. 7.31 Random aggregate model
Table 7.13 Mechanicalparameters of elements fromthe experiment
NA OldHM
NewHM
OldITZ
NewITZ
E (GPa) 80 19.27 23.69 19.27 23.69
ft (MPa) 10 1.66 1.91 1.02 1.34
194 7 Constitutive Relationship of Recycled Aggregate Concrete
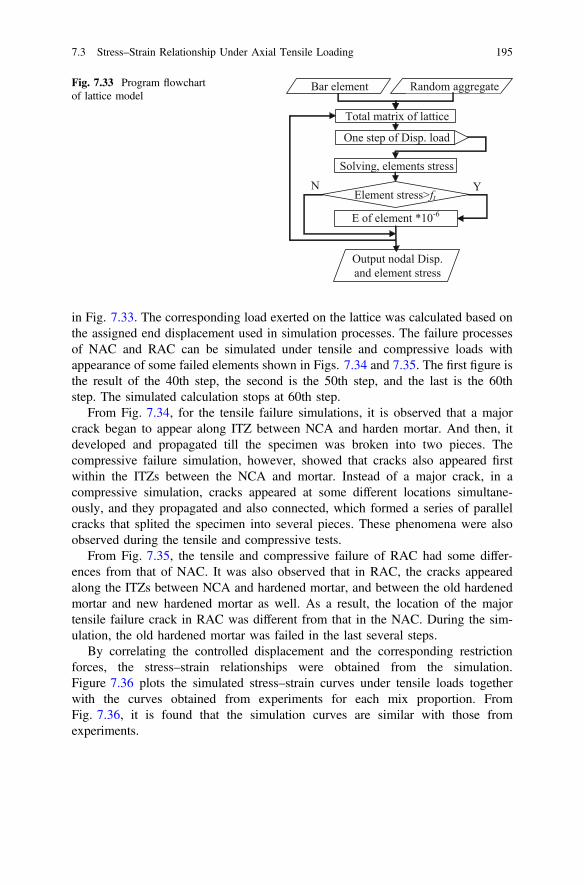
in Fig. 7.33. The corresponding load exerted on the lattice was calculated based onthe assigned end displacement used in simulation processes. The failure processesof NAC and RAC can be simulated under tensile and compressive loads withappearance of some failed elements shown in Figs. 7.34 and 7.35. The first figure isthe result of the 40th step, the second is the 50th step, and the last is the 60thstep. The simulated calculation stops at 60th step.
From Fig. 7.34, for the tensile failure simulations, it is observed that a majorcrack began to appear along ITZ between NCA and harden mortar. And then, itdeveloped and propagated till the specimen was broken into two pieces. Thecompressive failure simulation, however, showed that cracks also appeared firstwithin the ITZs between the NCA and mortar. Instead of a major crack, in acompressive simulation, cracks appeared at some different locations simultane-ously, and they propagated and also connected, which formed a series of parallelcracks that splited the specimen into several pieces. These phenomena were alsoobserved during the tensile and compressive tests.
From Fig. 7.35, the tensile and compressive failure of RAC had some differ-ences from that of NAC. It was also observed that in RAC, the cracks appearedalong the ITZs between NCA and hardened mortar, and between the old hardenedmortar and new hardened mortar as well. As a result, the location of the majortensile failure crack in RAC was different from that in the NAC. During the sim-ulation, the old hardened mortar was failed in the last several steps.
By correlating the controlled displacement and the corresponding restrictionforces, the stress–strain relationships were obtained from the simulation.Figure 7.36 plots the simulated stress–strain curves under tensile loads togetherwith the curves obtained from experiments for each mix proportion. FromFig. 7.36, it is found that the simulation curves are similar with those fromexperiments.
Output nodal Disp. and element stress
Element stress>ft
Bar element Random aggregate
Total matrix of lattice
Solving, elements stress
E of element *10-6
N Y
One step of Disp. load
Fig. 7.33 Program flowchartof lattice model
7.3 Stress–Strain Relationship Under Axial Tensile Loading 195
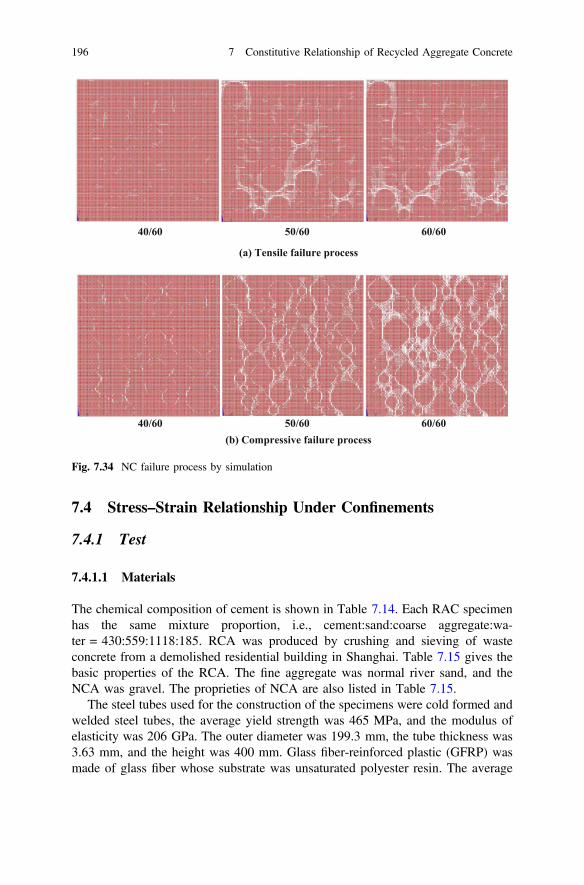
7.4 Stress–Strain Relationship Under Confinements
7.4.1 Test
7.4.1.1 Materials
The chemical composition of cement is shown in Table 7.14. Each RAC specimenhas the same mixture proportion, i.e., cement:sand:coarse aggregate:wa-ter = 430:559:1118:185. RCA was produced by crushing and sieving of wasteconcrete from a demolished residential building in Shanghai. Table 7.15 gives thebasic properties of the RCA. The fine aggregate was normal river sand, and theNCA was gravel. The proprieties of NCA are also listed in Table 7.15.
The steel tubes used for the construction of the specimens were cold formed andwelded steel tubes, the average yield strength was 465 MPa, and the modulus ofelasticity was 206 GPa. The outer diameter was 199.3 mm, the tube thickness was3.63 mm, and the height was 400 mm. Glass fiber-reinforced plastic (GFRP) wasmade of glass fiber whose substrate was unsaturated polyester resin. The average
40/60 50/60 60/60
(a) Tensile failure process
40/60 50/60 60/60(b) Compressive failure process
Fig. 7.34 NC failure process by simulation
196 7 Constitutive Relationship of Recycled Aggregate Concrete
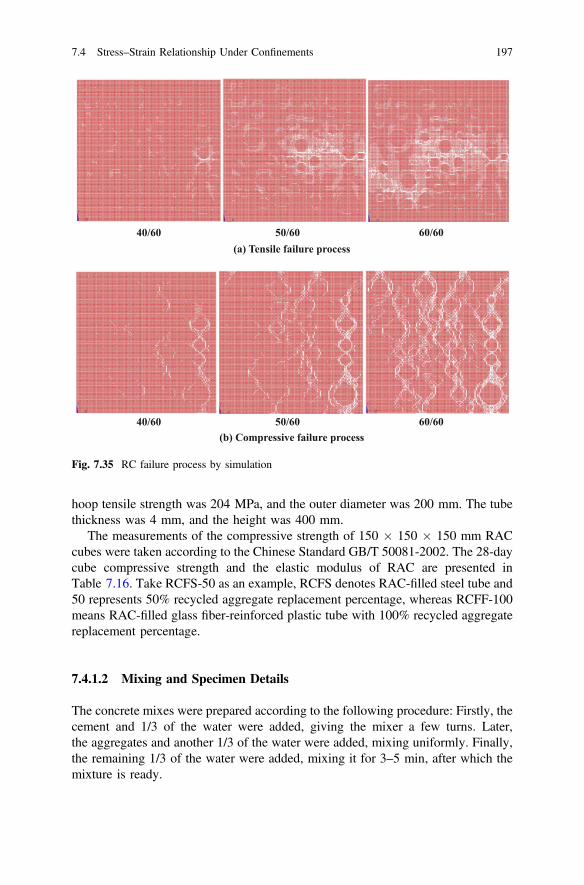
hoop tensile strength was 204 MPa, and the outer diameter was 200 mm. The tubethickness was 4 mm, and the height was 400 mm.
The measurements of the compressive strength of 150 � 150 � 150 mm RACcubes were taken according to the Chinese Standard GB/T 50081-2002. The 28-daycube compressive strength and the elastic modulus of RAC are presented inTable 7.16. Take RCFS-50 as an example, RCFS denotes RAC-filled steel tube and50 represents 50% recycled aggregate replacement percentage, whereas RCFF-100means RAC-filled glass fiber-reinforced plastic tube with 100% recycled aggregatereplacement percentage.
7.4.1.2 Mixing and Specimen Details
The concrete mixes were prepared according to the following procedure: Firstly, thecement and 1/3 of the water were added, giving the mixer a few turns. Later,the aggregates and another 1/3 of the water were added, mixing uniformly. Finally,the remaining 1/3 of the water were added, mixing it for 3–5 min, after which themixture is ready.
(a) Tensile failure process40/60 50/60 60/60
40/60 50/60 60/60(b) Compressive failure process
Fig. 7.35 RC failure process by simulation
7.4 Stress–Strain Relationship Under Confinements 197
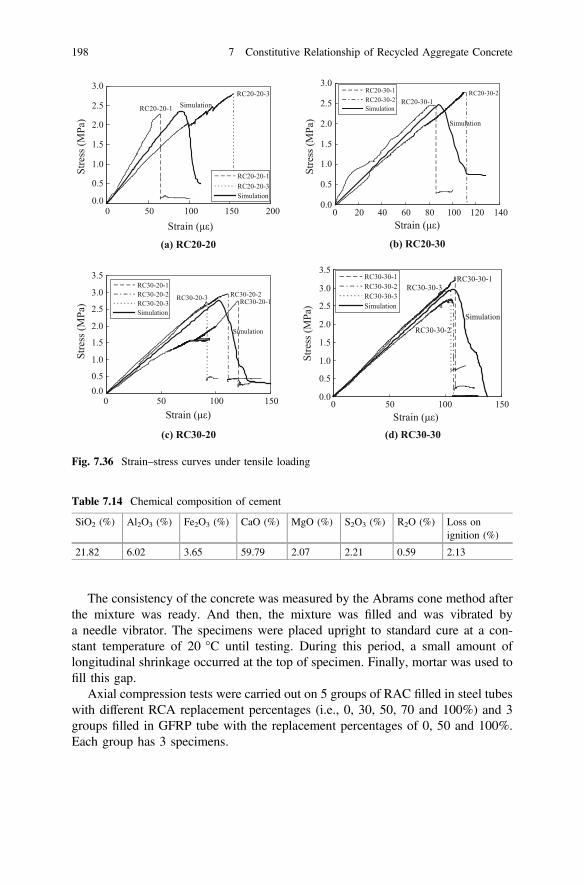
The consistency of the concrete was measured by the Abrams cone method afterthe mixture was ready. And then, the mixture was filled and was vibrated bya needle vibrator. The specimens were placed upright to standard cure at a con-stant temperature of 20 °C until testing. During this period, a small amount oflongitudinal shrinkage occurred at the top of specimen. Finally, mortar was used tofill this gap.
Axial compression tests were carried out on 5 groups of RAC filled in steel tubeswith different RCA replacement percentages (i.e., 0, 30, 50, 70 and 100%) and 3groups filled in GFRP tube with the replacement percentages of 0, 50 and 100%.Each group has 3 specimens.
RC20-20-1
RC20-20-3Simulation
0.0
0.5
1.0
1.5
2.0
2.5
3.0
0 50 100 150 200
Strain (με)
Stre
ss (M
Pa)
RC20-20-1RC20-20-3Simulation
(a) RC20-20
RC20-30-1RC20-30-2
Simulation
0.0
0.5
1.0
1.5
2.0
2.5
3.0
0 20 40 60 80 100 120 140Strain (με)
Stre
ss (M
Pa)
RC20-30-1RC20-30-2Simulation
(b) RC20-30
RC30-20-1
Simulation
0.00.5
1.0
1.5
2.0
2.5
3.0
3.5
0 50 100 150
RC30-20-1RC30-20-2RC30-20-3Simulation
(c) RC30-20
RC30-30-1
RC30-30-2
RC30-30-3
Simulation
0.0
0.5
1.0
1.5
2.0
2.5
3.0
3.5
0 50 100 150Strain (με)
Stre
ss (M
Pa)
RC30-30-1RC30-30-2RC30-30-3Simulation
(d) RC30-30
Strain (με)
Stre
ss (M
Pa)
RC30-20-3 RC30-20-2
Fig. 7.36 Strain–stress curves under tensile loading
Table 7.14 Chemical composition of cement
SiO2 (%) Al2O3 (%) Fe2O3 (%) CaO (%) MgO (%) S2O3 (%) R2O (%) Loss onignition (%)
21.82 6.02 3.65 59.79 2.07 2.21 0.59 2.13
198 7 Constitutive Relationship of Recycled Aggregate Concrete
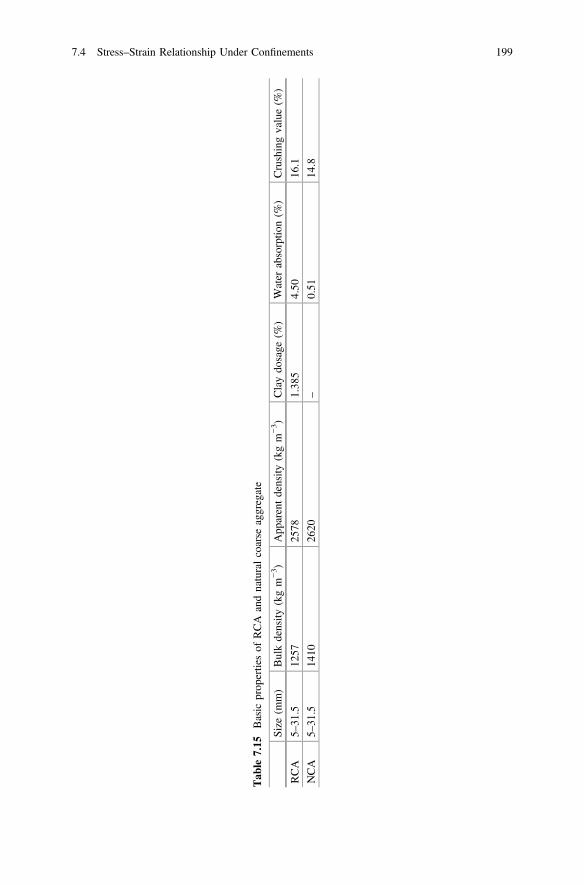
Tab
le7.15
Basic
prop
ertiesof
RCA
andnaturalcoarse
aggregate
Size
(mm)
Bulkdensity
(kgm
−3 )
App
arentdensity
(kgm
−3 )
Claydo
sage
(%)
Water
absorptio
n(%
)Crushingvalue(%
)
RCA
5–31
.512
5725
781.38
54.50
16.1
NCA
5–31
.514
1026
20–
0.51
14.8
7.4 Stress–Strain Relationship Under Confinements 199
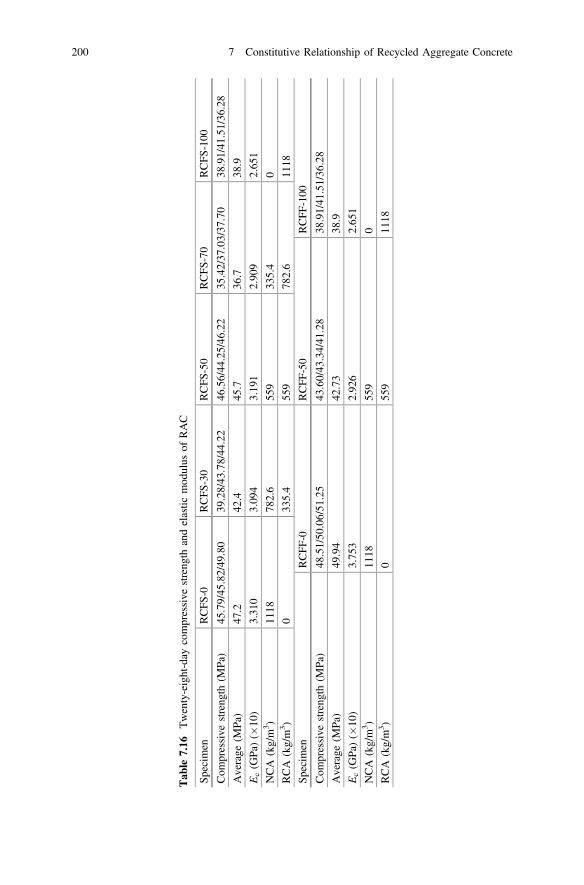
Tab
le7.16
Twenty-eight-day
compressive
streng
thandelastic
mod
ulus
ofRAC
Specim
enRCFS
-0RCFS
-30
RCFS
-50
RCFS
-70
RCFS
-100
Com
pressive
streng
th(M
Pa)
45.79/45
.82/49
.80
39.28/43
.78/44
.22
46.56/44
.25/46
.22
35.42/37
.03/37
.70
38.91/41
.51/36
.28
Average
(MPa)
47.2
42.4
45.7
36.7
38.9
Ec(G
Pa)(�
10)
3.31
03.09
43.19
12.90
92.65
1
NCA
(kg/m
3 )11
1878
2.6
559
335.4
0
RCA
(kg/m
3 )0
335.4
559
782.6
1118
Specim
enRCFF
-0RCFF
-50
RCFF
-100
Com
pressive
streng
th(M
Pa)
48.51/50
.06/51
.25
43.60/43
.34/41
.28
38.91/41
.51/36
.28
Average
(MPa)
49.94
42.73
38.9
Ec(G
Pa)(�
10)
3.75
32.92
62.65
1
NCA
(kg/m
3 )11
1855
90
RCA
(kg/m
3 )0
559
1118
200 7 Constitutive Relationship of Recycled Aggregate Concrete

7.4.1.3 Test Setup and Test Method
The loading setup is shown in Fig. 7.37, which is a 10,000 kN multi-functionelectrohydraulic servo tester. Both ends of the core concrete were placed on a steelpad with a diameter of 190 mm in order to transmit force uniformly. Thearrangement of the strain gauges is shown in Fig. 7.38.
Four 50-mm longitudinal strain gauges and four 50-mm transverse strain gaugeswere set in the mid of each specimen. Two longitudinal strain gauges and twotransverse strain gauges were set at both ends of each specimen. Two displacementtransducers (LVDTs) were set at the mid-span of the specimens to measure the axialdeformation of the core concrete.
S/4 S/4 S/4
150
150
transverse strain gauges
longitudinal straingauges
Fig. 7.38 Arrangement ofstrain gauges
Fig. 7.37 Loading setup
7.4 Stress–Strain Relationship Under Confinements 201
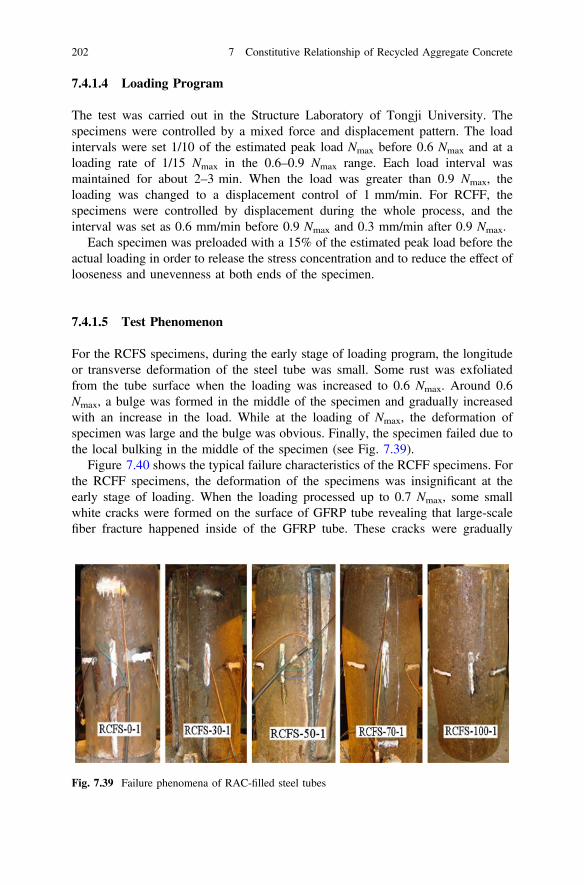
7.4.1.4 Loading Program
The test was carried out in the Structure Laboratory of Tongji University. Thespecimens were controlled by a mixed force and displacement pattern. The loadintervals were set 1/10 of the estimated peak load Nmax before 0.6 Nmax and at aloading rate of 1/15 Nmax in the 0.6–0.9 Nmax range. Each load interval wasmaintained for about 2–3 min. When the load was greater than 0.9 Nmax, theloading was changed to a displacement control of 1 mm/min. For RCFF, thespecimens were controlled by displacement during the whole process, and theinterval was set as 0.6 mm/min before 0.9 Nmax and 0.3 mm/min after 0.9 Nmax.
Each specimen was preloaded with a 15% of the estimated peak load before theactual loading in order to release the stress concentration and to reduce the effect oflooseness and unevenness at both ends of the specimen.
7.4.1.5 Test Phenomenon
For the RCFS specimens, during the early stage of loading program, the longitudeor transverse deformation of the steel tube was small. Some rust was exfoliatedfrom the tube surface when the loading was increased to 0.6 Nmax. Around 0.6Nmax, a bulge was formed in the middle of the specimen and gradually increasedwith an increase in the load. While at the loading of Nmax, the deformation ofspecimen was large and the bulge was obvious. Finally, the specimen failed due tothe local bulking in the middle of the specimen (see Fig. 7.39).
Figure 7.40 shows the typical failure characteristics of the RCFF specimens. Forthe RCFF specimens, the deformation of the specimens was insignificant at theearly stage of loading. When the loading processed up to 0.7 Nmax, some smallwhite cracks were formed on the surface of GFRP tube revealing that large-scalefiber fracture happened inside of the GFRP tube. These cracks were gradually
Fig. 7.39 Failure phenomena of RAC-filled steel tubes
202 7 Constitutive Relationship of Recycled Aggregate Concrete

increased with an increase in loading. While at the loading of Nmax, the fracture wasformed in the GFRP tube and the core concrete was crushed. In comparison withfailure phenomena of RCFF and that of RCFS, the lateral deformation of steel tubewas more obvious than that of GFRP tube.
7.4.2 Analysis
7.4.2.1 The Effect of the RCA Replacement Percentage on the PeakLoad
The peak loads in the test are summarized in Table 7.17. In general, the perfor-mance of the specimens significantly changes with the variations of the recycledaggregate replacement percentage. The test results in Fig. 7.41 show the influenceof the RCA replacement percentage. It can be observed that with the same specimensize and mixture proportion, the peak load of RAC confined by steel tubesdecreases when the replacement percentage of RCA is increased, which is similar tothose of RAC confined by GFRP tubes.
The results summarized in Table 7.17 also proved that specimens with referenceconcrete possess a higher peak load. It was obtained that the peak load of RCFSspecimens with reference concrete was 7.76, 9.31, 15.16 and 13.71% higherthan that of RCFS specimens containing 30, 50, 70 and 100% RCA (RCA),respectively. The peak load of RCFF with reference concrete was 7.90 and 21.6%higher than that of RCFF specimens containing 50 and 100% RCA, respectively.Simultaneously, for RCFS, on the test day, the cube strength of ordinary concrete
Fig. 7.40 Failure phenomena of RAC-filled GFRP tubes
7.4 Stress–Strain Relationship Under Confinements 203

Tab
le7.17
Mem
berbearingcapacities
Specim
enRCFS
-0RCFS
-30
RCFS
-50
RCFS
-70
RCFS
-100
RCFF
-0RCFF
-50
RCFF
-100
Peak
load
(kN)
2455/2570/2200
a2338/2325/2400
a2202/2427/2171
2265/2166/2198
2232/2294/2126
1911/2062/1965
1831/1837/2662
a1575/1680/2463
a
Average
(kN)
2513
2332
2299
2182
2210
1979
1834
1627
a Thisvalueisneglectedbecauseof
thelargedeviations
204 7 Constitutive Relationship of Recycled Aggregate Concrete

was 11.3, 3.38, 28.6 and 21.1% higher than that of the RAC containing 30, 50, 70and 100% RCA, respectively. For RCFF, the cube compressive strength of theordinary concrete was 16.8 and 28.38% higher than that of the RAC containing 50and 100% RCA, respectively. The decrease in the axial load of RAC-filled outertube can be attributed to the lower strength of the RAC as compared to the ordinaryconcrete.
For the convenience of comparison between the peak loads of the specimen andplain concrete, the strength index (l) is defined as follows:
l ¼ Nmax
fcAcð7:4Þ
where Nmax and fcAc are the peak load of the specimen and plain concrete,respectively.
The strength index (l) is displayed in Fig. 7.42. For RCFS series, it is observedthat the strength index ranges from 2.44 to 3.16. For RCFF series, it is shown that lranges from 1.98 to 2.22. The strength index does not obviously decrease with theincrease in RCA replacement percentage. That means that the enhanced strength oftriaxially confined RAC is similar with that of triaxially confined reference con-crete. However, the peak load of RCFF is lower than that of RCFS because theGFRP hoop tensile strength is less than the yield strength of the steel.
7.4.2.2 The Effect of the RCA Replacement Percentage on the AxialDeformation
The relationship between the axial load and the axial strain based on the straingauge measurement along the height of the specimens is shown in Fig. 7.43. Theascending branch of the axial load–strain curve of RCFF was characterized by anonlinear curve, and the descending branch was relatively steep because GFRP is abrittle material. For RCFS, the axial load–strain curve remains linear elastic tillreach the peak load, after which the load dropped insignificantly. All RCFS
1600
1800
2000
2200
2400
2600
0 20 40 60 80 100Pe
ak lo
ad (k
N)
Recycled coarse aggregate replacement (%)
RCFSRCFF
Fig. 7.41 Effect of RCAreplacement percentage
7.4 Stress–Strain Relationship Under Confinements 205
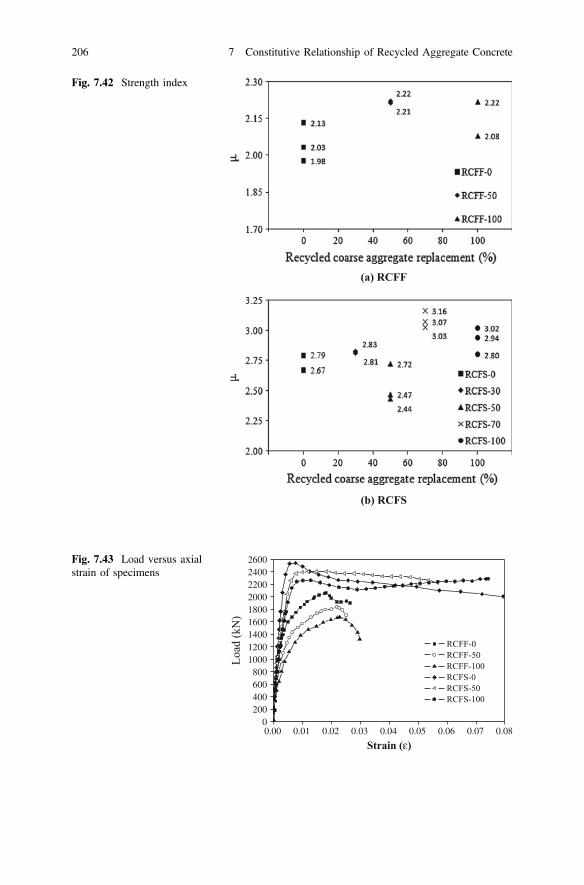
(a) RCFF
(b) RCFS
Fig. 7.42 Strength index
0.00 0.01 0.02 0.03 0.04 0.05 0.06 0.07 0.080
200400600800100012001400160018002000220024002600
RCFF-0RCFF-50RCFF-100RCFS-0RCFS-50RCFS-100
Load
(kN
)
Strain (ε)
Fig. 7.43 Load versus axialstrain of specimens
206 7 Constitutive Relationship of Recycled Aggregate Concrete

specimens maintained the load with an excellent ductility up to failure. Thedescending branch of RCFF dropped significantly compared to that of RCFS. Thedeformation of RCFS was larger than that of RCFF because the steel tube had along plastic stage after the peak load.
(1) The initial modulus
The initial modulus is defined as the initial slope of the stress–strain curve. It iscalculated as the ratio of 0.3 times peak stress to corresponding strain. The initialmodulus of specimens (E) is shown in Table 7.18. For RCFS series, results inTable 7.18 show that RCFS with reference concrete was 8.5 and 17.4% higher thanthat of RCFS specimens containing 50 and 100% RCA, respectively. In order to getthe improvement of RCFS initial modulus, E=Ec is used to get these results, whichis also given in Table 7.18 (Ec is the tested elastic modulus of RAC). It is observedthat the improvement of RCFS initial modulus ranges from 1.57 to 1.64. On thewhole, the improvement of RCFS-50 and RCFS-100 initial modulus does notlargely vary compared to that of RCFS-0 initial modulus.
For RCFF series, results in Table 7.18 show that RCFS with reference concretewas 28.3 and 40.9% higher than that of RCFS specimens containing 50 and 100%RCA, respectively. It is observed that the improvement of RCFF initial modulusranges from 1.19 to 1.23. Overall, the improvement of RCFF-50 and RCFF-100initial modulus is similar to that of RCFF initial modulus.
Generally, the initial modulus of specimens decreases with the increase in RCAreplacement percentage. In addition, the initial modulus of RCFS is higher than thatof RCFF, which is because the longitude modulus of steel is higher than that ofGFRP.
(2) The peak strain
The peak strain of specimens (epeak) is shown in Table 7.18. For RCFS series,RCFS with reference concrete was 33 and 25.1% lower than that of RCFS speci-mens containing 50 and 100% RCA, respectively. In order to obtain theimprovement of RCFS peak strain, epeak=ec is used to get these results, which is alsoshown in Table 7.17 (ec is the calculated peak strain of RAC). It is observed that theimprovement of RCFS peak strain ranges from 3.39 to 4.30. Overall, theimprovement of RCFS peak strain increases with the increase in RCA replacementpercentage.
Table 7.18 Initial modulus and peak strain of confined RAC
Specimen ecc ec ecc=ec E (GPa) Ec (GPa) E=Ec
RCFS-0 0.00680 0.002 3.39 51.83 33.1 1.57
RCFS-50 0.01015 0.00207 4.91 47.79 31.91 1.54
RCFS-100 0.00909 0.00211 4.30 44.15 26.51 1.67
RCFF-0 0.01777 0.00205 8.63 44.54 37.53 1.19
RCFF-50 0.01801 0.00201 8.95 34.71 29.26 1.19
RCFF-100 0.02222 0.00212 8.55 31.59 25.76 1.23
Mean value 6.51 1.40
7.4 Stress–Strain Relationship Under Confinements 207
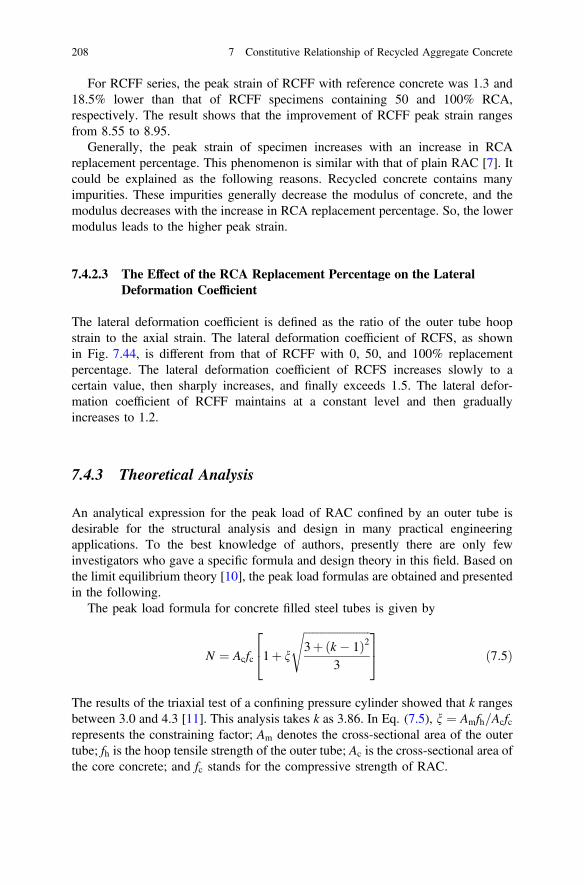
For RCFF series, the peak strain of RCFF with reference concrete was 1.3 and18.5% lower than that of RCFF specimens containing 50 and 100% RCA,respectively. The result shows that the improvement of RCFF peak strain rangesfrom 8.55 to 8.95.
Generally, the peak strain of specimen increases with an increase in RCAreplacement percentage. This phenomenon is similar with that of plain RAC [7]. Itcould be explained as the following reasons. Recycled concrete contains manyimpurities. These impurities generally decrease the modulus of concrete, and themodulus decreases with the increase in RCA replacement percentage. So, the lowermodulus leads to the higher peak strain.
7.4.2.3 The Effect of the RCA Replacement Percentage on the LateralDeformation Coefficient
The lateral deformation coefficient is defined as the ratio of the outer tube hoopstrain to the axial strain. The lateral deformation coefficient of RCFS, as shownin Fig. 7.44, is different from that of RCFF with 0, 50, and 100% replacementpercentage. The lateral deformation coefficient of RCFS increases slowly to acertain value, then sharply increases, and finally exceeds 1.5. The lateral defor-mation coefficient of RCFF maintains at a constant level and then graduallyincreases to 1.2.
7.4.3 Theoretical Analysis
An analytical expression for the peak load of RAC confined by an outer tube isdesirable for the structural analysis and design in many practical engineeringapplications. To the best knowledge of authors, presently there are only fewinvestigators who gave a specific formula and design theory in this field. Based onthe limit equilibrium theory [10], the peak load formulas are obtained and presentedin the following.
The peak load formula for concrete filled steel tubes is given by
N ¼ Acfc 1þ n
ffiffiffiffiffiffiffiffiffiffiffiffiffiffiffiffiffiffiffiffiffiffiffiffi3þ k � 1ð Þ2
3
s24
35 ð7:5Þ
The results of the triaxial test of a confining pressure cylinder showed that k rangesbetween 3.0 and 4.3 [11]. This analysis takes k as 3.86. In Eq. (7.5), n ¼ Amfh=Acfcrepresents the constraining factor; Am denotes the cross-sectional area of the outertube; fh is the hoop tensile strength of the outer tube; Ac is the cross-sectional area ofthe core concrete; and fc stands for the compressive strength of RAC.
208 7 Constitutive Relationship of Recycled Aggregate Concrete

0.0 0.2 0.4 0.6 0.8 1.0 1.2 1.4 1.6 1.80
10
20
30
40
50
60
70
80
90
100
Stre
ss (M
Pa)
Lateral deformation coefficient
RCFFRCFS
(a) 30% replacement percentage
0.0 0.2 0.4 0.6 0.8 1.0 1.2 1.4 1.6 1.80
10
20
30
40
50
60
70
80
90
Stre
ss (M
Pa)
Lateral deformation coefficient
RCFFRCFS
(b) 50% replacement percentage
0.0 0.2 0.4 0.6 0.8 1.0 1.2 1.4 1.6 1.8 2.00
10
20
30
40
50
60
70
80
Stre
ss (M
Pa)
Lateral deformation coefficient
RCFFRCFS
(c) 100% replacement percentage
Fig. 7.44 Lateraldeformation coefficient
7.4 Stress–Strain Relationship Under Confinements 209
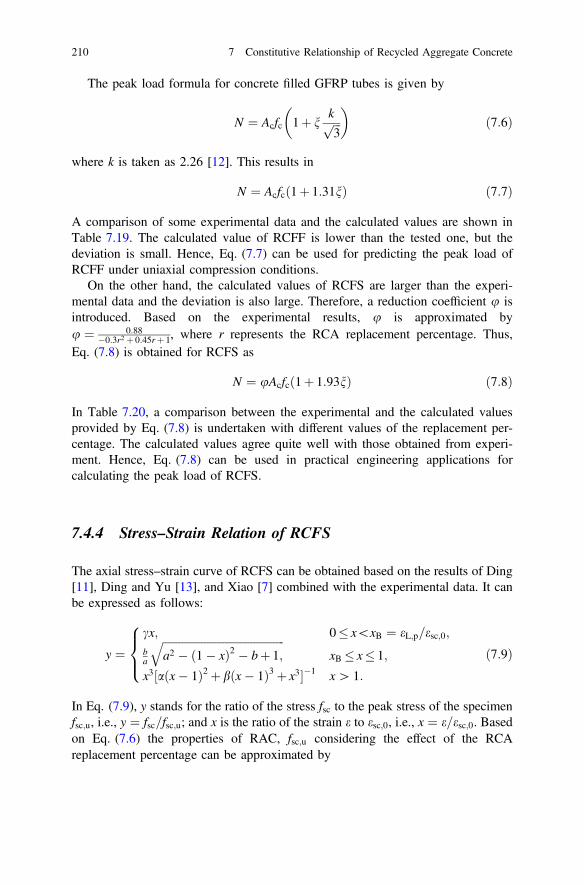
The peak load formula for concrete filled GFRP tubes is given by
N ¼ Acfc 1þ nkffiffiffi3
p� �
ð7:6Þ
where k is taken as 2.26 [12]. This results in
N ¼ Acfc 1þ 1:31nð Þ ð7:7Þ
A comparison of some experimental data and the calculated values are shown inTable 7.19. The calculated value of RCFF is lower than the tested one, but thedeviation is small. Hence, Eq. (7.7) can be used for predicting the peak load ofRCFF under uniaxial compression conditions.
On the other hand, the calculated values of RCFS are larger than the experi-mental data and the deviation is also large. Therefore, a reduction coefficient u isintroduced. Based on the experimental results, u is approximated byu ¼ 0:88
�0:3r2 þ 0:45rþ 1, where r represents the RCA replacement percentage. Thus,Eq. (7.8) is obtained for RCFS as
N ¼ uAcfc 1þ 1:93nð Þ ð7:8Þ
In Table 7.20, a comparison between the experimental and the calculated valuesprovided by Eq. (7.8) is undertaken with different values of the replacement per-centage. The calculated values agree quite well with those obtained from experi-ment. Hence, Eq. (7.8) can be used in practical engineering applications forcalculating the peak load of RCFS.
7.4.4 Stress–Strain Relation of RCFS
The axial stress–strain curve of RCFS can be obtained based on the results of Ding[11], Ding and Yu [13], and Xiao [7] combined with the experimental data. It canbe expressed as follows:
y ¼cx; 0� x\xB ¼ eL;p=esc;0;ba
ffiffiffiffiffiffiffiffiffiffiffiffiffiffiffiffiffiffiffiffiffiffiffiffiffiffiffiffiffiffiffiffiffiffiffiffiffiffiffiffiffiffiffiffia2 � ð1� xÞ2 � bþ 1;
qxB � x� 1;
x3½aðx� 1Þ2 þ bðx� 1Þ3 þ x3��1 x[ 1:
8><>: ð7:9Þ
In Eq. (7.9), y stands for the ratio of the stress fsc to the peak stress of the specimenfsc;u, i.e., y ¼ fsc=fsc;u; and x is the ratio of the strain e to esc;0, i.e., x ¼ e=esc;0. Basedon Eq. (7.6) the properties of RAC, fsc;u considering the effect of the RCAreplacement percentage can be approximated by
210 7 Constitutive Relationship of Recycled Aggregate Concrete

Tab
le7.19
Com
parisons
betweencalculated
andexperimentalpeak
load
Specim
enRCFS
-0RCFS
-30
RCFS
-50
RCFS
-70
RCFS
-100
RCFF
-0RCFF
-50
RCFF
-100
Calculated(kN)
2677
2584
2648
2480
2516
1877
1705
1620
Tested(kN)
2513
2332
2299
2182
2210
1979
1834
1627
Deviatio
n(%
)6.5
10.8
15.2
13.6
13.9
6.9
7.6
0.5
7.4 Stress–Strain Relationship Under Confinements 211

fsc;u ¼ uð1� qÞð1þ 1:93nÞfc ð7:10Þ
In Eq. (7.10), u represents the reduction coefficient which can be expressed asu ¼ 0:88
�0:3r2 þ 0:45rþ 1, and q ¼ Am=Ac:
Based on Ding and Yu [13], Ottosen [14], and Xiao [7], the peak strain of RCFSspecimens esc;0 can be determined by
esc;0 ¼ ð1þ 1:93nwÞ½1þ 3:4ffiffiffiffiffiffinw
pðc1 � 1Þ�er0 ð7:11Þ
In Eq. (7.11), c1 ¼ 9:1f�4=9cu ; w is related to the concrete compressive strength by
w ¼ 0:9� 0:005fcu, and er0 is the peak strain of RAC, which can be expressed asfollows:
er0 ¼ 0:00076þ ½ð0:626fc � 4:33Þ � 10�7�0:5n o
� 1þ rBðrÞ
� �ð7:12Þ
where B rð Þ ¼ 65:715r2 � 109:43rþ 48:989:
(1) Coefficients in Eq. (7.9a)
In Eq. (7.9a), xB stands for the ratio of the proportional limit strain eL;p to thepeak strain of RCFS specimens esc;0, i.e., xB ¼ eL;p=esc;0.
The proportional limit strain is defined by eL;p ¼ hfs=Es [13], where h isdetermined by
h ¼0:3; fs=fc [ 20;1� 0:035fs=fc; 5:7� fs=fc � 20;0:8; fs=fc\5:7:
8<: ð7:13Þ
In Eq. (7.13), fs is the yield stress of steel tubes.Also, c is the ratio of Esc to Esc;p Esc;p ¼ fsc;u=esc;0
� �: Based on [15], c can be
expressed as follows:
c ¼ c1½ð1� qÞþ q � Es=Ec�ð1þ 1:93nwÞ½1þ 3:4
ffiffiffiffiffiffinw
p ðc1 � 1Þ�uð1� qÞð1þ 1:93nÞ ð7:14Þ
Table 7.20 Comparisons between calculated and experimental peak load
Specimen RCFS-0 RCFS-30 RCFS-50 RCFS-70 RCFS-100
Calculated (kN) 2677 2331 2303 2118 2188
Tested (kN) 2513 2332 2299 2182 2210
Deviation 6.5 0 0.2 2.9 1.0
212 7 Constitutive Relationship of Recycled Aggregate Concrete

(2) Coefficients in Eq. (7.9b)
In Eq. (7.9b), a and b are ellipse parameters, which are defined by
a ¼ ðc� 1Þffiffiffiffiffiffiffiffiffiffiffiffiffiffiffiffiffiffiffiffiffiffiffiffiffiffiffiffiffi
1� xBcðcxB þ c� 2Þ
sð7:15Þ
b ¼ cxB þ c� c2xB � 1cxB þ c� 2
ð7:16Þ
(3) Coefficients in Eq. (7.9c)
In Eq. (7.9c), the parameters are given by
a ¼ 0:5=n4 n� 10:5 n[ 1
�ð7:17Þ
b ¼ 0:7� 0:5n0:3þ 2:2n
ð7:18Þ
where n is the constraining factor, which is shown in Eq. (7.5).In Fig. 7.45, the comparison of the calculated results by using Eq. (7.9) with the
experimental data of RCFS shows that the former is only slightly lower than thelatter. Hence, Eq. (7.9) can be used in practical engineering applications.
7.4.5 Stress–Strain Relation of RCFF
Only the uniaxial load of the core concrete is considered because of the low axialmodulus of GFRP. According to the conclusion by Fardis and Khalili [16] and theexperimental data, the uniaxial stress–strain relation of RCFF can be expressed asfollows:
rc ¼ Ecec1þ ec½Ec=fcc � 1=ecc� ð7:19Þ
where fcc is the compressive strength of the confined concrete; ecc is the straincorresponding to fcc; Ec represents the elastic modulus of the RAC. The strain ecc isdefined by
ecc ¼ er0 þ 0:001Ef tf=Dfc ð7:20Þ
7.4 Stress–Strain Relationship Under Confinements 213
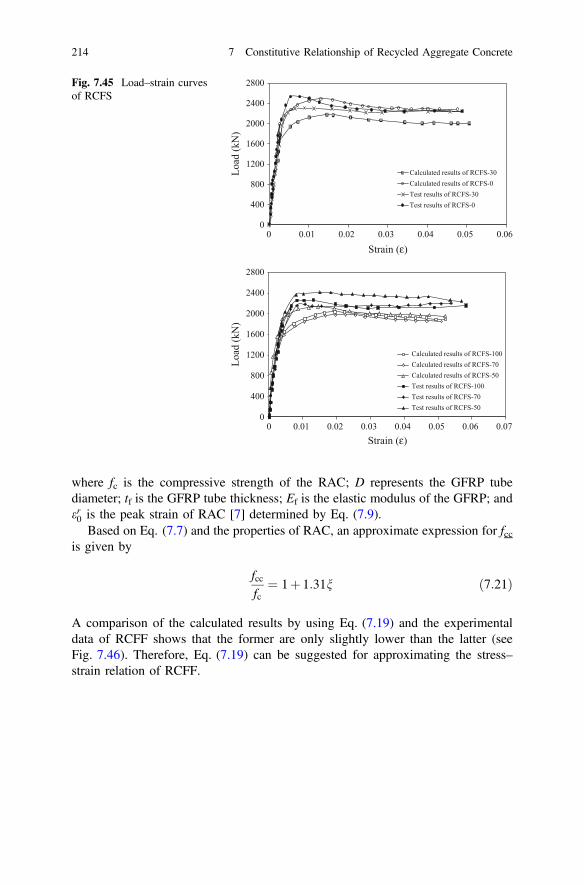
where fc is the compressive strength of the RAC; D represents the GFRP tubediameter; tf is the GFRP tube thickness; Ef is the elastic modulus of the GFRP; ander0 is the peak strain of RAC [7] determined by Eq. (7.9).
Based on Eq. (7.7) and the properties of RAC, an approximate expression for fccis given by
fccfc
¼ 1þ 1:31n ð7:21Þ
A comparison of the calculated results by using Eq. (7.19) and the experimentaldata of RCFF shows that the former are only slightly lower than the latter (seeFig. 7.46). Therefore, Eq. (7.19) can be suggested for approximating the stress–strain relation of RCFF.
0
400
800
1200
1600
2000
2400
2800
0 0.01 0.02 0.03 0.04 0.05 0.06
Strain (ε)
Strain (ε)
0
400
800
1200
1600
2000
2400
2800
0 0.01 0.02 0.03 0.04 0.05 0.06 0.07
Load
(kN
)Lo
ad (k
N)
Calculated results of RCFS-30Calculated results of RCFS-0Test results of RCFS-30Test results of RCFS-0
Calculated results of RCFS-100Calculated results of RCFS-70Calculated results of RCFS-50Test results of RCFS-100Test results of RCFS-70Test results of RCFS-50
Fig. 7.45 Load–strain curvesof RCFS
214 7 Constitutive Relationship of Recycled Aggregate Concrete
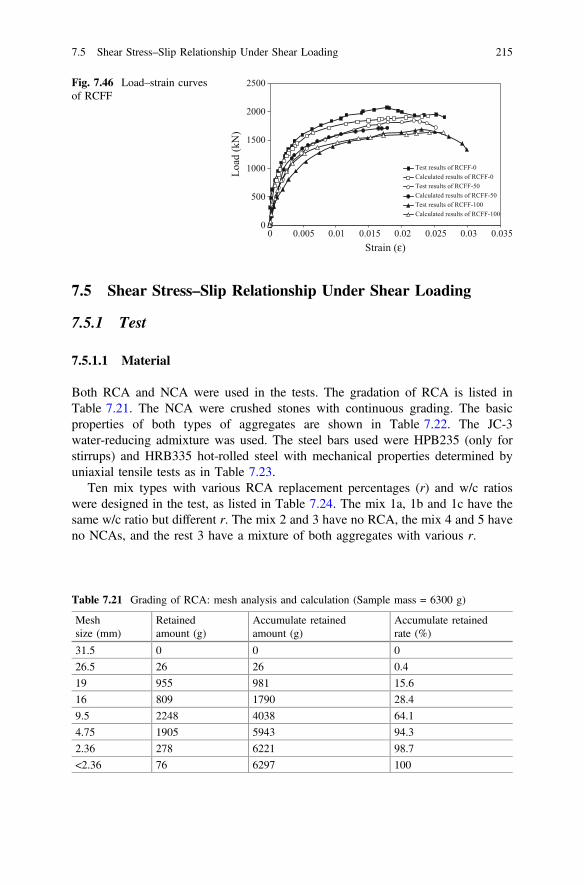
7.5 Shear Stress–Slip Relationship Under Shear Loading
7.5.1 Test
7.5.1.1 Material
Both RCA and NCA were used in the tests. The gradation of RCA is listed inTable 7.21. The NCA were crushed stones with continuous grading. The basicproperties of both types of aggregates are shown in Table 7.22. The JC-3water-reducing admixture was used. The steel bars used were HPB235 (only forstirrups) and HRB335 hot-rolled steel with mechanical properties determined byuniaxial tensile tests as in Table 7.23.
Ten mix types with various RCA replacement percentages (r) and w/c ratioswere designed in the test, as listed in Table 7.24. The mix 1a, 1b and 1c have thesame w/c ratio but different r. The mix 2 and 3 have no RCA, the mix 4 and 5 haveno NCAs, and the rest 3 have a mixture of both aggregates with various r.
0
500
1000
1500
2000
2500
0 0.005 0.01 0.015 0.02 0.025 0.03 0.035Lo
ad (k
N)
Strain (ε)
Test results of RCFF-0Calculated results of RCFF-0Test results of RCFF-50Calculated results of RCFF-50Test results of RCFF-100Calculated results of RCFF-100
Fig. 7.46 Load–strain curvesof RCFF
Table 7.21 Grading of RCA: mesh analysis and calculation (Sample mass = 6300 g)
Meshsize (mm)
Retainedamount (g)
Accumulate retainedamount (g)
Accumulate retainedrate (%)
31.5 0 0 0
26.5 26 26 0.4
19 955 981 15.6
16 809 1790 28.4
9.5 2248 4038 64.1
4.75 1905 5943 94.3
2.36 278 6221 98.7
<2.36 76 6297 100
7.5 Shear Stress–Slip Relationship Under Shear Loading 215

7.5.1.2 Specimen Design
Thirty-two shear push-off specimens with the same size, shown in Fig. 7.47, weredesigned and cast. To ensure that the crack initiates and propagates in the shearplane (the shaded area in Fig. 7.47), two 300 mm long and 15 mm deep v-slotswere made when the concrete was cast, resulting in a shear plane areaAc = 36,000 mm2.
Horizontal bars across the crack in the form of closed stirrups were used tosimulate the lateral constraint, as shown in Fig. 7.48. Two to four stirrups were usedin different specimens to model different lateral constraint stiffness. To reduce thecontribution of the stirrups’ dowel action to the shear strength, the stirrups werewrapped with soft tubes of 40 mm length.
The basic information of the 32 specimens is listed in Table 7.25. Each speci-men is given a unique name with a letter and digits. The letter and the digits beforethe hyphen sign identify the source of aggregates, with R for RCA, N for NCA, andthe digits following R for RCA’s replacement percentage Rxx (R without digitsfollowed means 100% replacement percentage in mass). The first digit after thehyphen sign indicates the mix type in Table 7.24, and the second digit indicates thenumber of stirrups passing through the shear plane. In Table 7.25, the amount ofstirrups is presented as xUy, x means the number and Uy means the diameter of thesteel bar is y, hereafter.
7.5.1.3 Fabrication and Curing of Specimens
The formwork was placed horizontally, and the concrete was cast along the spec-imen thickness direction. Two 300 mm long battens with an equilateral trianglecross section were used to make the v-slots. A finished specimen after 28-daycuring at room temperature is shown in Fig. 7.49b.
Table 7.22 Basic property of coarse aggregates
Aggregate Crushvalue (%)
Volumedensity (kg m−3)
Apparentdensity (kg m−3)
Waterabsorption (%)
Soilcontent (%)
RCA 10.0 1320 2500 5.6 3.5
NCA 3.5 1465 2810 0.6 0.9
Table 7.23 Mechanicalproperties of steel
Steel bar U8(HPB235)
U14(HRB335)
Yield strength fy (MPa) 340.0 549.4
Modulus of elasticityE (GPa)
210.9 196.0
216 7 Constitutive Relationship of Recycled Aggregate Concrete
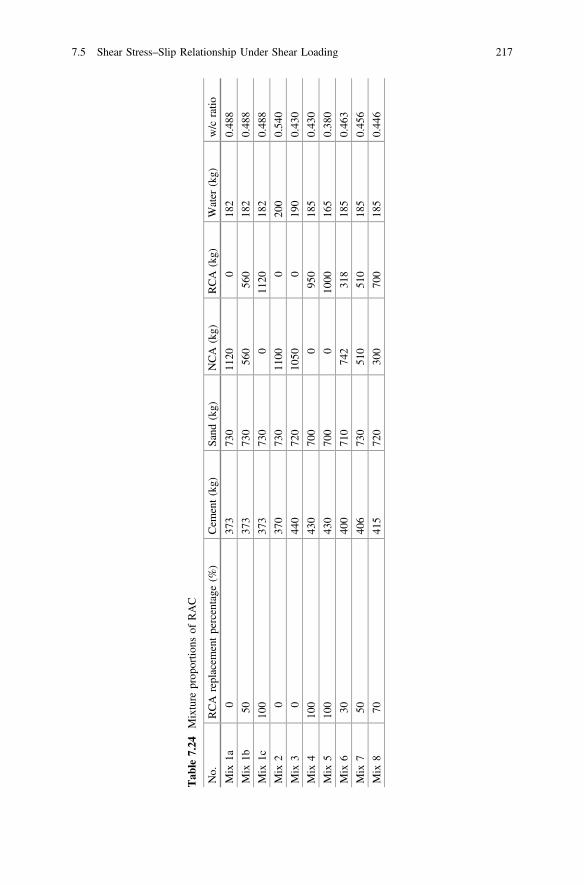
Tab
le7.24
Mixture
prop
ortio
nsof
RAC
No.
RCA
replacem
entpercentage
(%)
Cem
ent(kg)
Sand
(kg)
NCA
(kg)
RCA
(kg)
Water
(kg)
w/c
ratio
Mix
1a0
373
730
1120
018
20.48
8
Mix
1b50
373
730
560
560
182
0.48
8
Mix
1c10
037
373
00
1120
182
0.48
8
Mix
20
370
730
1100
020
00.54
0
Mix
30
440
720
1050
019
00.43
0
Mix
410
043
070
00
950
185
0.43
0
Mix
510
043
070
00
1000
165
0.38
0
Mix
630
400
710
742
318
185
0.46
3
Mix
750
406
730
510
510
185
0.45
6
Mix
870
415
720
300
700
185
0.44
6
7.5 Shear Stress–Slip Relationship Under Shear Loading 217

7.5.1.4 Testing Facility
All the tests were carried on in the Laboratory of Building Structures at TongjiUniversity, Shanghai, China. Before the push-off shear tests were conducted, all thespecimens were pre-cracked using the test rig shown in Fig. 7.49a. The specimenwas carefully placed horizontally. The vertical loading was applied gradually until acleavage crack appeared or the strain in the stirrups reached 600 le, through around steel rod and a triangular steel wedge along the top and bottom v-slots ofspecimen, respectively.
After pre-cracked, the specimen was turned by 90° and placed vertically in thesame test rig, as shown in Fig. 7.49b. The specimen was supported on rollerbearings so that it could move freely in the horizontal direction to impose pure shearloading on the cracked plane.
7.5.1.5 Instrumentation
A loading cell was installed vertically on the end of the hydraulic jack to record theapplied load. Two displacement transducers were placed vertically near the
600
400
125
125
2525
150
V-slot
15A A
Section A-A
400
150
120
300
(a) Drawing (b) Photo
Fig. 7.47 Geometry and dimensions of the shear push-off specimens
165
210
165
30
165 135 60
65
40
30
110
Section A-A
150
110 100 110
80 120
400
Restraint stirrup
400
4 14 4 14Restraint stirrup
A A
(a) Drawing (b) Photo
Fig. 7.48 Reinforcement in the specimens
218 7 Constitutive Relationship of Recycled Aggregate Concrete
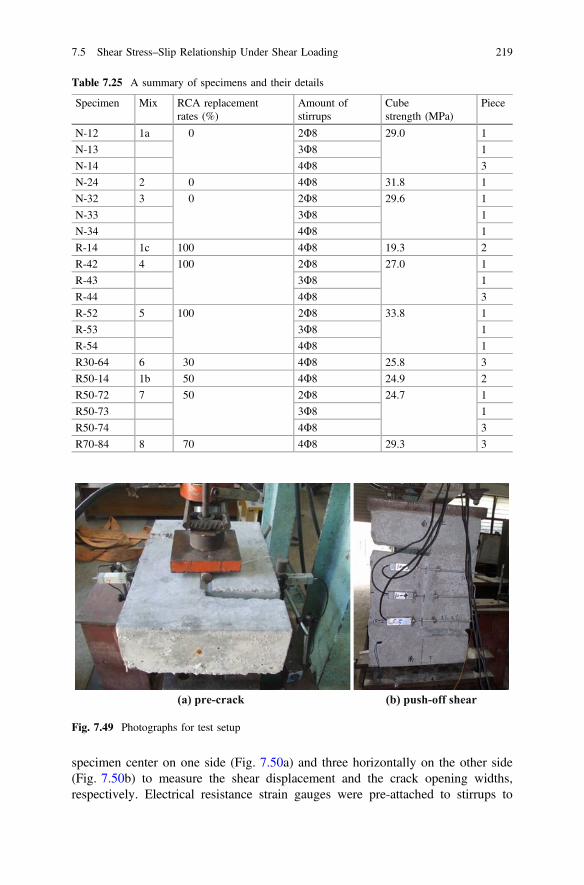
Table 7.25 A summary of specimens and their details
Specimen Mix RCA replacementrates (%)
Amount ofstirrups
Cubestrength (MPa)
Piece
N-12 1a 0 2U8 29.0 1
N-13 3U8 1
N-14 4U8 3
N-24 2 0 4U8 31.8 1
N-32 3 0 2U8 29.6 1
N-33 3U8 1
N-34 4U8 1
R-14 1c 100 4U8 19.3 2
R-42 4 100 2U8 27.0 1
R-43 3U8 1
R-44 4U8 3
R-52 5 100 2U8 33.8 1
R-53 3U8 1
R-54 4U8 1
R30-64 6 30 4U8 25.8 3
R50-14 1b 50 4U8 24.9 2
R50-72 7 50 2U8 24.7 1
R50-73 3U8 1
R50-74 4U8 3
R70-84 8 70 4U8 29.3 3
(a) pre-crack (b) push-off shear
Fig. 7.49 Photographs for test setup
specimen center on one side (Fig. 7.50a) and three horizontally on the other side(Fig. 7.50b) to measure the shear displacement and the crack opening widths,respectively. Electrical resistance strain gauges were pre-attached to stirrups to
7.5 Shear Stress–Slip Relationship Under Shear Loading 219
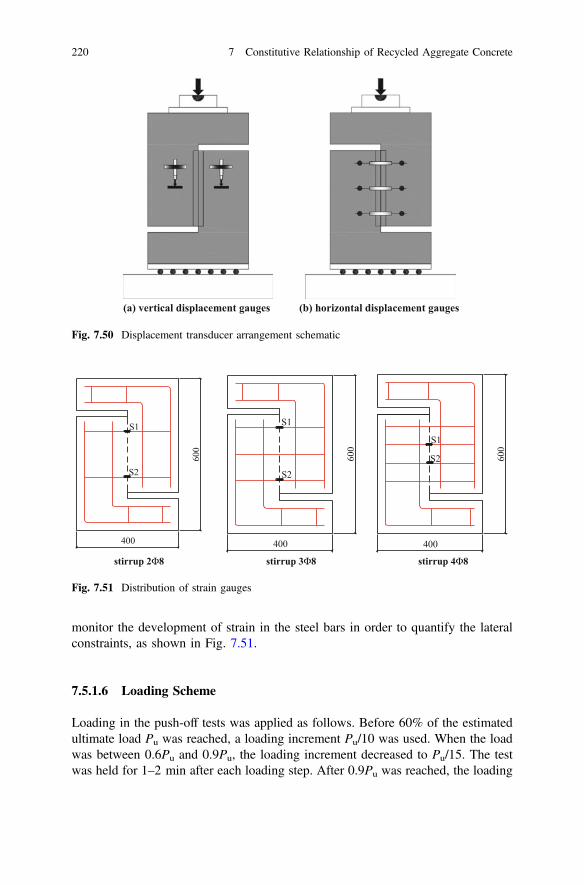
monitor the development of strain in the steel bars in order to quantify the lateralconstraints, as shown in Fig. 7.51.
7.5.1.6 Loading Scheme
Loading in the push-off tests was applied as follows. Before 60% of the estimatedultimate load Pu was reached, a loading increment Pu/10 was used. When the loadwas between 0.6Pu and 0.9Pu, the loading increment decreased to Pu/15. The testwas held for 1–2 min after each loading step. After 0.9Pu was reached, the loading
(a) vertical displacement gauges (b) horizontal displacement gauges
Fig. 7.50 Displacement transducer arrangement schematic
S1
S2
400
600
600
S1
S2
400
S1
S2 600
400
stirrup 2Φ8 stirrup 3Φ8 stirrup 4Φ8
Fig. 7.51 Distribution of strain gauges
220 7 Constitutive Relationship of Recycled Aggregate Concrete

was controlled by vertical displacement at a loading rate being 0.03 mm/min. Theloading was stopped when the strain in the stirrups reached about 600 le, orequivalently when the crack width reached the serviceability limit 0.2 mm.
7.5.1.7 Failure Modes
When the applied load was small, no cracks or crush could be seen in the specimensurfaces. When the load approached the ultimate load, some vertical shear cracksappeared in the specimen surfaces. The crack width increased with the increase inthe shear displacement on both sides of the cracks. The specimens failed with muchwider cracks width and shear displacement. The recordings from strain gaugesshowed that the stirrups had yielded.
There exists an only slight difference between all the failure and cracking pat-terns. Three representative crack patterns at failure are shown in Fig. 7.52: onestraight vertical crack, one kinked vertical crack, and a crack band with shortdiagonal cracks.
7.5.1.8 Main Test Results
Table 7.26 lists the main test results of all 32 specimens, including the uniaxialcompressive strength of concrete fc (fc = 0.76fcu [7]), the stirrup constraint stress onthe shear plane qvfy, where qv = Av/Ac is the reinforcement ratio of thecross-sectional area of all stirrups Av across the crack to the shear plane area Ac; fy isthe yielding strength of stirrups; Pu is the ultimate shear load; su = Pu/Ac is theultimate shear stress; wu is the mean crack width measured in three positions; andDu is the shear displacement or slip at the ultimate shear load.
(a) Straight vertical crack (b) Kinked vertical crack (c) Crack band with diagonalcracks
Fig. 7.52 Representative crack patterns of push-off specimens
7.5 Shear Stress–Slip Relationship Under Shear Loading 221

From Table 7.26, it can be found that the ultimate shear stress su increases withthe increase in qv, irrespective of RAC specimens or NAC specimens. The shearslip and the crack width at the ultimate shear stress are in the range of 0.46–1.26 mm and 0.24–1.16 mm, respectively.
Table 7.26 List of main test results
Specimen fc (MPa) qvfy (MPa) Pu (kN) su (MPa) wu (mm) Du (mm)
N-12 22.0 1.9 – – – –
N-13 2.9 184 5.10 0.44 0.65
N-14a 3.8 265 7.35 0.30 0.94
N-14b 3.8 273 7.59 0.29 0.98
N-14c 3.8 296 8.23 0.43 0.69
N-24 24.2 3.8 223 6.21 0.59 0.76
N-32 22.5 1.9 137 3.80 0.60 0.54
N-33 2.9 245 6.80 0.32 0.99
N-34 3.8 246 6.82 0.51 0.86
R-14a 14.6 3.8 230 6.39 0.54 0.73
R-14b 3.8 227 6.31 0.59 0.48
R-42 20.5 1.9 171 4.74 0.24 0.65
R-43 2.9 199 5.52 0.48 0.49
R-44a 3.8 264 7.34 0.46 0.54
R-44b 3.8 244 6.78 0.51 0.80
R-44c 3.8 222 6.18 0.31 0.73
R-52 25.7 1.9 154 4.27 0.46 0.81
R-53 2.9 220 6.12 0.21 0.47
R-54 3.8 245 6.80 0.50 0.46
R30-64a 19.6 3.8 286 7.93 1.16 1.26
R30-64b 3.8 295 8.20 1.01 0.79
R30-64c 3.8 290 8.05 0.56 0.89
R50-14a 18.9 3.8 242 6.72 0.64 0.84
R50-14b 3.8 238 6.60 0.45 0.91
R50-72 18.8 1.9 102 2.82 0.94 1.10
R50-73 2.9 220 6.10 0.85 0.76
R50-74a 3.8 249 6.93 0.52 0.80
R50-74b 3.8 251 6.97 0.38 0.82
R50-74c 3.8 232 6.45 0.80 0.79
R70-84a 22.2 3.8 244 6.78 0.46 0.66
R70-84b 3.8 238 6.62 0.74 1.07
R70-84c 3.8 253 7.02 0.68 0.97
Note N-12 has an operation mistake during testing
222 7 Constitutive Relationship of Recycled Aggregate Concrete

7.5.1.9 Shear Stress–Shear Displacement Curves
The typical shear stress–shear displacement curves of a few specimens are plottedin Fig. 7.53. It can be seen that all the curves are of similar shape: a straight line
0123456789
0 0.5 1 1.5 2 2.5 3
shea
r str
ees
(MPa
)
slip (mm)
N-14aN-14bN-14c
0123456789
0 0.5 1 1.5 2 2.5 3
shea
r str
ess
(MPa
)
slip (mm)
R30-64aR30-64bR30-64c
(a) RCA replacement percentage 0% (N-14) (b) RCA replacement percentage 30% (R30-64)
0
1
2
3
4
5
6
7
8
0 0.5 1 1.5 2 2.5 3
shea
r str
ess
(MPa
)
slip (mm)
R50-74aR50-74bR50-74c
012345678
0 0.5 1 1.5 2 2.5 3
shea
r str
ess
(MPa
)
slip (mm)
R70-84aR70-84bR70-84c
(c) RCA replacement percentage 50% (R50-74) (d) RCA replacement percentage 70% (R70-84)
0
1
2
3
4
5
6
7
8
0 0.5 1 1.5 2 2.5 3
shea
r st
ress
(MPa
)
slip (mm)
R-44aR-44bR-44c
(e) RCA replacement percentage 100% (R-44)
Fig. 7.53 Typical shear stress–shear displacement curves
7.5 Shear Stress–Slip Relationship Under Shear Loading 223

representing linear elastic material behavior in the early stage of loading and anonlinear section representing the initiation and propagation of micro-cracks, fol-lowed by a short plateau near the peak load representing the stable propagation ofmacro-cracks and finally a long, nearly straight, decreasing line representing theforming of the major shear crack and the gradual loss of the aggregate interlockcapability.
7.5.1.10 Shear Slip–Crack Separation Curves
Figure 7.54 shows typical shear slip–crack separation curves for six specimens. Ascrack separations were measured at three vertical positions by horizontal dis-placement transducers, three curves are drawn in each of Fig. 7.20. It can be foundthat in the initial period of loading, the crack width hardly changes. Before theultimate shear load is reached, the crack has nearly the same width along thespecimen depth. It can also be noted from Fig. 7.54 that the crackseparation/opening curves for the RAC specimens with different r and for the NACspecimens share the same features. They are convex before the ultimate shear stressis reached. After that, an inflection point appears, followed by quick growth of bothcrack width and shear slip and the final failure.
7.5.2 Analysis of Test Results
7.5.2.1 Effects of the Lateral Constraint Stiffness
Figure 7.55a compares the shear stress–shear slip curves for the 5 RAC specimensof mix 4 (R-42, R-43, R-44a, R-44b, and R-44c) with the same r = 100% butdifferent stirrups. The curves for the 3 RAC specimens of mix 5 (R-52, R-53, andR-54) and the 5 specimens of mix 7 (R50-72, R50-73, R50-74a, R50-74b, andR50-74c) are compared in Fig. 7.55b, c, respectively.
It can be seen that, compared with 2U8 lateral stirrups, the greater lateral con-straint from more stirrups (3U8 or 4U8) leads to higher initial shear stiffness, highershear stress for the same shear slip, and higher ultimate shear stress. From Fig. 7.55and Table 7.26, the ultimate shear stress increased by 40–140% when the lateralstirrups increased from 2U8 to 4U8.
7.5.2.2 Effects of Concrete Strength
Figure 7.56 compares the averaged shear stress–shear slip curves of three groups ofspecimens with the same r (100%) and stirrups (4U8) but different compressivestrengths, namely R-14a and R-14b with fc = 14.6 MPa, R-44a, R-44b and R-44cwith fc = 20.5 MPa, and R-54 with fc = 25.7 MPa, as an example. It can be seen
224 7 Constitutive Relationship of Recycled Aggregate Concrete

that the initial shear transfer stiffness increases as fc rises. Table 7.27 lists theaverage ultimate shear load Pu of specimens for each group. It can be seen that theultimate shear stress of the RAC specimens tends to improve with the increase inconcrete strength.
0
0.5
1
1.5
2
0 0.5 1 1.5 2sl
ip (m
m)
seperation (mm)
uppermiddlelower
0
0.5
1
1.5
2
0 0.5 1 1.5 2
slip
(mm
)
separation (mm)
uppermiddlelower
(a) N-14a (b) R-44b
0
0.5
1
1.5
2
0 0.5 1 1.5 2
slip
(mm
)
separation (mm)
uppermiddlelower
0
0.5
1
1.5
2
0 0.5 1 1.5 2sl
ip (m
m)
separation (mm)
uppermiddlelower
(c) R30-64a (d) R50-14b
0
0.5
1
1.5
2
0 0.5 1 1.5 2
slip
(mm
)
separation (mm) separation (mm)
uppermiddlelower
0
0.5
1
1.5
2
0 0.5 1 1.5 2
slip
(mm
)
uppermiddlelower
(e) R50-74a (f) R70-84a
Fig. 7.54 Typical crack opening curve
7.5 Shear Stress–Slip Relationship Under Shear Loading 225

0
1
2
3
4
5
6
7
8
0 0.5 1 1.5 2 2.5 3
shea
r st
ress
(MPa
)
slip (mm)
R-43
R-44a
R-42
R-44b
R-44c
(a) R-42, R-43, R-44
0
1
2
3
4
5
6
7
8
0 0.5 1 1.5 2 2.5 3
shea
r st
ress
(MPa
)
slip (mm)
R-54
R-53
R-52
(b) R-52, R-53, R-54
0
1
2
3
4
5
6
7
8
0 0.5 1 1.5 2 2.5 3
shea
r st
ress
(MPa
)
slip (mm)
R50-74b
R50-74a
R50-74c
R50-72
R50-73
(c) R50-72, R50-73, R50-74
Fig. 7.55 Effects ofconstraint stiffness on shearstress–shear displacementcurves
226 7 Constitutive Relationship of Recycled Aggregate Concrete
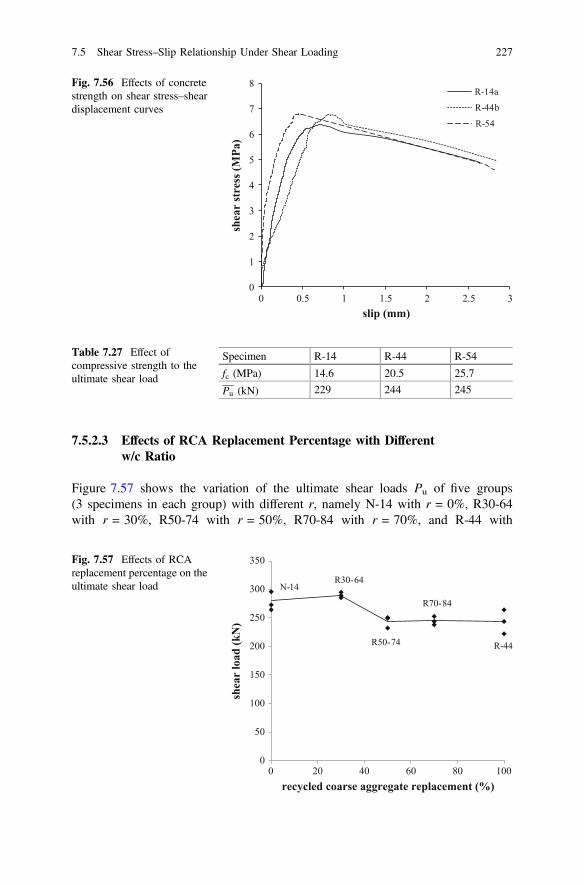
7.5.2.3 Effects of RCA Replacement Percentage with Differentw/c Ratio
Figure 7.57 shows the variation of the ultimate shear loads Pu of five groups(3 specimens in each group) with different r, namely N-14 with r = 0%, R30-64with r = 30%, R50-74 with r = 50%, R70-84 with r = 70%, and R-44 with
0
1
2
3
4
5
6
7
8
0 0.5 1 1.5 2 2.5 3
shea
r st
ress
(MPa
)
slip (mm)
R-14a
R-44b
R-54
Fig. 7.56 Effects of concretestrength on shear stress–sheardisplacement curves
Table 7.27 Effect ofcompressive strength to theultimate shear load
Specimen R-14 R-44 R-54
fc (MPa) 14.6 20.5 25.7
Pu (kN) 229 244 245
0
50
100
150
200
250
300
350
0 20 40 60 80 100
shea
r lo
ad (k
N)
recycled coarse aggregate replacement (%)
N-14R30-64
R-44
R70-84
R50-74
Fig. 7.57 Effects of RCAreplacement percentage on theultimate shear load
7.5 Shear Stress–Slip Relationship Under Shear Loading 227

r = 100%. The specimens in each group have different w/c ratio but similar con-crete strength (fc � 20 MPa) and the same constraint stiffness (4U8 stirrups).A broken line connecting the mean point of each group is also shown in Fig. 7.57.It can be seen that the ultimate shear load of RAC is nearly the same as that of NACfor r < 30%, but it reduces by nearly 15% from r = 30 to 50%, after which itstabilizes with a value of 0.85Pu of NAC. It could be concluded that the RCAreplacement percentage is one of the important parameters influencing the ultimateshear load. This could be explained by the micro- and mesostructure feature ofRAC. With the increase in the RCA replacement percentage, the old mortar as wellas the old ITZs increases in the RAC. These contribute to the reduction in theaggregate interlocking [17]. The detailed mechanism needs further study in thefuture.
Figure 7.58 displays the shear stress–shear displacement curve of N-14a,R50-74b, and R-44b, respectively. From the ascending part of the curves inFig. 7.58, it can be found that the basic performance of shear stress versus the slip isalmost the same when the specimen has similar compressive strength and sameconstraint, irrespective of different RCA replacement percentage, i.e., 0, 50 and100%.
7.5.2.4 Effects of RCA Replacement Percentage with Same w/c Ratio
Figure 7.59 compares the shear stress–slip curves of three specimens, N-14a,R50-14a, and R-14a, which have the same w/c ratio (0.488), the same constrainstiffness (4U8), but different r (0, 50, and 100%). It can be seen that r has noobvious influence on the initial shear stiffness; however, a higher RCA replacement
0
1
2
3
4
5
6
7
8
0 0.5 1 1.5 2 2.5 3
shea
r st
ress
(MPa
)
slip (mm)
N-14a
R50-74b
R-44b
Fig. 7.58 Effects of RCAreplacement percentage onshear stress–slip curves
228 7 Constitutive Relationship of Recycled Aggregate Concrete

ratio, r leads to lower ultimate shear stress. This is because higher r leads to lowerfc of RAC with the same w/c ratio (fc = 22.0, 18.9, and 14.6 MPa for N-14a,R50-14a and R-14a, respectively, from Table 7.26), and in turn, the lower fc leadsto lower ultimate shear load, as already shown in Table 7.27. More experimentalevidences of the adverse effects of r on fc of RAC can be found in Refs. [18, 19].
7.5.2.5 Prediction of the Shear Transfer Strength
(1) Comparison of the test values and code values
A few design codes provide formulas which cover different constraint stiffness topredict the shear transfer strength su. For example, ACI [20] and PCI [21] useEqs. (7.22) and (7.23) to calculate su, respectively
su ¼ 1:4qvfyf 0c
� 0:2f 0c � 5:5 ð7:22Þ
su ¼ 1:4 qvfyf 0c
qvfyf 0c
\4:14
su ¼ 1:4 2:07qvfy
þ 0:5�
qvfyf 0c
qvfyf 0c
� 4:14
8<: ð7:23Þ
where qvfy=f0c is the reinforcement index and f 0c ¼ 0:79fcu is the cylinder com-
pressive strength of concrete [22]. The other symbols have the same meanings asdescribed in Sect. 7.5.1.8.
The predicted su from Eqs. (7.22) and (7.23) for the 32 push-off specimens iscompared with the test values in Table 7.28. The ratios of test values to predicted
0
1
2
3
4
5
6
7
8
0 0.5 1 1.5 2 2.5 3
shea
r st
ress
(MPa
)
slip (mm)
N-14a
R50-14a
R-14a
Fig. 7.59 Shear stress–slipcurve with same mixproportions
7.5 Shear Stress–Slip Relationship Under Shear Loading 229

ones are also shown. It can be seen that, except for R-14a and R50-72, bothequations underestimate the shear strength considerably, by 45–100% forEq. (7.22) and 20–55% for Eq. (7.23), respectively. This indicates that both theACI and PCI codes may be used to calculate the shear transfer strength of RACwith safety. The ACI code is much more conservative than the PCI code because astrict upper limit is specified by the former.
Table 7.28 Shear strength su from the test and codes
Specimen Test (MPa) ACI (MPa) Test: ACI PCI (MPa) Test: PCI
N-13 5.10 3.99 1.28 3.99 1.28
N-14a 7.35 4.57 1.61 5.32 1.38
N-14b 7.59 4.57 1.66 5.32 1.43
N-14c 8.23 4.57 1.80 5.32 1.55
N-24 6.21 5.02 1.24 5.32 1.17
N-32 3.80 2.66 1.43 2.66 1.43
N-33 6.80 3.99 1.70 3.99 1.70
N-34 6.82 4.67 1.46 5.32 1.28
R-14a 6.39 3.04 2.10 5.32 1.20
R-14b 6.31 3.04 2.07 5.32 1.19
R-42 4.74 2.66 1.78 2.66 1.78
R-43 5.52 3.99 1.38 3.99 1.38
R-44a 7.34 4.26 1.72 5.32 1.38
R-44b 6.78 4.26 1.59 5.32 1.27
R-44c 6.18 4.26 1.45 5.32 1.16
R-52 4.27 2.66 1.61 2.66 1.61
R-53 6.12 3.99 1.53 3.99 1.53
R-54 6.80 5.32 1.28 5.32 1.28
R30-64a 7.93 4.07 1.95 5.32 1.49
R30-64b 8.20 4.07 2.01 5.32 1.54
R30-64c 8.05 4.07 1.98 5.32 1.51
R50-14a 6.72 3.93 1.71 5.32 1.26
R50-14b 6.60 3.93 1.68 5.32 1.24
R50-72 2.82 2.66 1.06 2.66 1.06
R50-73 6.10 3.9 1.56 3.99 1.53
R50-74a 6.45 3.9 1.66 5.32 1.21
R50-74b 6.97 3.9 1.79 5.32 1.31
R50-74c 6.93 3.9 1.78 5.32 1.30
R70-84a 6.78 4.62 1.47 5.32 1.27
R70-84b 6.62 4.62 1.43 5.32 1.24
R70-84c 7.02 4.62 1.52 5.32 1.32
230 7 Constitutive Relationship of Recycled Aggregate Concrete
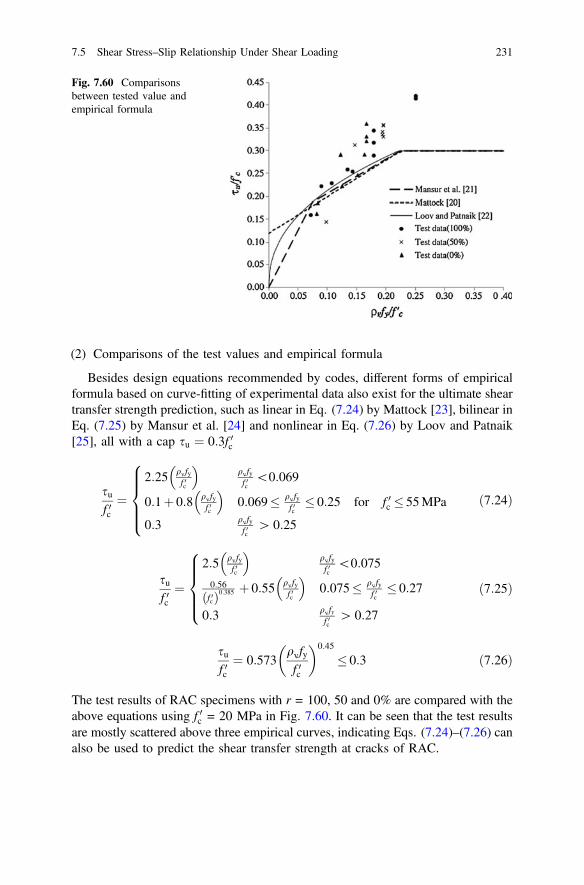
(2) Comparisons of the test values and empirical formula
Besides design equations recommended by codes, different forms of empiricalformula based on curve-fitting of experimental data also exist for the ultimate sheartransfer strength prediction, such as linear in Eq. (7.24) by Mattock [23], bilinear inEq. (7.25) by Mansur et al. [24] and nonlinear in Eq. (7.26) by Loov and Patnaik[25], all with a cap su ¼ 0:3f 0c
suf 0c
¼2:25 qvfy
f 0c
� qvfyf 0c\0:069
0:1þ 0:8 qvfyf 0c
� 0:069� qvfy
f 0c� 0:25 for f 0c � 55MPa
0:3 qvfyf 0c
[ 0:25
8>>><>>>:
ð7:24Þ
suf 0c
¼2:5 qvfy
f 0c
� qvfyf 0c\0:075
0:56f 0cð Þ0:385 þ 0:55 qvfy
f 0c
� 0:075� qvfy
f 0c� 0:27
0:3 qvfyf 0c
[ 0:27
8>>><>>>:
ð7:25Þ
suf 0c
¼ 0:573qvfyf 0c
� �0:45
� 0:3 ð7:26Þ
The test results of RAC specimens with r = 100, 50 and 0% are compared with theabove equations using f 0c = 20 MPa in Fig. 7.60. It can be seen that the test resultsare mostly scattered above three empirical curves, indicating Eqs. (7.24)–(7.26) canalso be used to predict the shear transfer strength at cracks of RAC.
Fig. 7.60 Comparisonsbetween tested value andempirical formula
7.5 Shear Stress–Slip Relationship Under Shear Loading 231

7.6 Compressive Behavior Under Impact Loading
Since the pioneer work by Abrams [26] in 1917, a large number of studies on thedynamic properties of NAC have been conducted in terms of compressive strength,tensile strength, flexural strength, elastic modulus, peak strain (strain at the peakstress), Poisson’s ratio, and so on. It is concluded that the compressive strength ofconcrete increases with increasing strain rate [27–29]. However, there are fewstudies reporting the mechanical behavior of RAC under high strain rate loadings.Chakradhara Rao et al. [30] compared the impact behavior of RAC beams withdifferent RCA replacement percentages and showed that the accelerations, maxi-mum displacement, and strains at the middle of RAC beams were larger than thoseof normal concrete beams at a given impact energy, and the impact resistance ofRAC beams decreased with increasing RCA replacement percentage. Lu et al. [31]preliminarily studied the impact behavior of RAC based on the split Hopkinsonpressure bar test, and demonstrated that the impact behavior of RAC includingdynamic compressive strength, critical compressive strain, and specific energyabsorption increased approximately linearly with increasing strain rate. These earlystudies have proven that the dynamic properties of RAC are different from ourcommon knowledge of concrete prepared with natural aggregates. Therefore, it isnecessary to conduct further research to understand the compressive behavior ofRAC under high strain rates.
7.6.1 Experimental Program
7.6.1.1 Materials
The selected coarse aggregates were NCAs from a local aggregate production plantand RCA derived from waste concrete which were obtained from a local RCAmanufacturing plant in Shanghai, China. The physical properties of the NCA andthe RCA are given in Table 7.29.
Five RCA replacement percentages, i.e., 0, 30, 50, 70, and 100%, were used inthe tests. The measured effective water absorption of the RCA in the test was about4%. The mix proportions of concretes are listed in Table 7.30.
Table 7.29 Physical properties of NCA and RCA
Type Coarse aggregategrading (mm)
Bulkdensity (kg/m3)
Apparentdensity (kg/m3)
Crushingvalue (%)
NCA 5–12.5 1395 2634 5.0
RCA 5–12.5 1290 2620 12.4
232 7 Constitutive Relationship of Recycled Aggregate Concrete

Tab
le7.30
Mix
prop
ortio
nsof
concretes
Specim
enw/c
Cem
ent(kg/m
3 )Sand
(kg/m
3 )NCA
(kg/m
3 )RCA
(kg/m
3 )Mixingwater
(kg/m
3 )Add
ition
alwater
(kg/m
3 )
NAC
0.45
467
582
1082
021
00
RAC-30
0.45
467
574
746
320
210
12.8
RAC-50
0.45
467
568
528
528
210
21.12
RAC-70
0.45
467
562
313.5
731.5
210
29.26
RAC-100
0.45
467
554
010
2921
041
.46
7.6 Compressive Behavior Under Impact Loading 233

7.6.1.2 Specimens
The specimens were first cast in polyvinyl chloride (PVC) pipes with the dimen-sions U75 mm (diameter U, hereafter) � 320 mm (length). The diameters ofspecimens were about 70 mm. The specimens were cut with their two ends beingground smooth and parallel to produce 70-mm-diameter and 35-mm-long cylin-drical specimens for the SHPB test, and 70-mm-diameter and 140-mm-longcylindrical specimens for the quasi-static tests. In each case, five specimens wereprepared for the SHPB tests and the quasi-static tests. After that specimens werekept under indoor conditions until testing. Two days before testing, some RAC-100and NAC specimens were submerged in water in an indoor environment to studythe moisture effect on the compressive behavior of RAC at high strain rates.
7.6.1.3 Quasi-Static Tests
The prepared specimens with the dimensions U70 mm � 140 mm were loadedunder quasi-static uniaxial compression at a strain rate of 10−5/s using a stiff-framedservo-hydraulic testing machine. The cylinder specimens had the same diameter asthose used in the SHPB tests but with a length-to-diameter (L/D) ratio of 2.0. Wanget al. [32] have suggested that this kind of specimen size would be suitable fordetermining the quasi-static strength to calculate the dynamic increase factor(DIF) based on the stress state and failure pattern. In order to reduce the frictionalconstraints, two Teflon sheets with a thickness of 0.2 mm were used at the top andbottom surfaces of the specimens [33].
7.6.1.4 Split Hopkinson Pressure Bar (SHPB) Tests
Impact tests under strain rates ranging from 101/s to 102/s were conducted using a74-mm-diameter conic variable cross-sectional SHPB as shown in Fig. 7.61.The SHPB apparatus consists of four basic parts: a striker bar (37 mm in diameter,400 mm in length); a conic variable cross-sectional incident bar (the striking end is
ф37mm
Striker bar
v Transmitter bar
Strain gaugeSpecimen Conic variable cross-sectional incident bar Strain gauge Damper
Dynamic strain indicator
Oscilloscope Data process system
ф74mm
Fig. 7.61 Mm–diameter conic variable cross-sectional SHPB
234 7 Constitutive Relationship of Recycled Aggregate Concrete
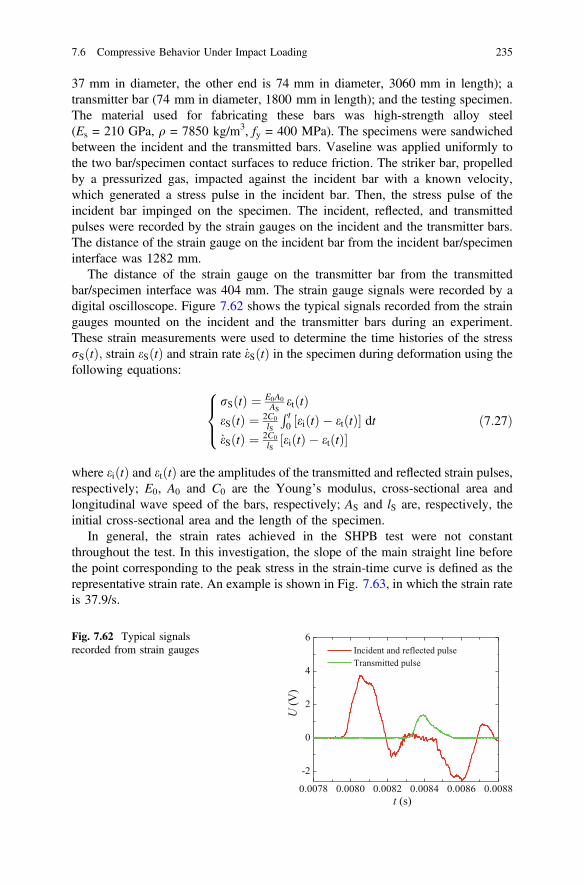
37 mm in diameter, the other end is 74 mm in diameter, 3060 mm in length); atransmitter bar (74 mm in diameter, 1800 mm in length); and the testing specimen.The material used for fabricating these bars was high-strength alloy steel(Es = 210 GPa, q = 7850 kg/m3, fy = 400 MPa). The specimens were sandwichedbetween the incident and the transmitted bars. Vaseline was applied uniformly tothe two bar/specimen contact surfaces to reduce friction. The striker bar, propelledby a pressurized gas, impacted against the incident bar with a known velocity,which generated a stress pulse in the incident bar. Then, the stress pulse of theincident bar impinged on the specimen. The incident, reflected, and transmittedpulses were recorded by the strain gauges on the incident and the transmitter bars.The distance of the strain gauge on the incident bar from the incident bar/specimeninterface was 1282 mm.
The distance of the strain gauge on the transmitter bar from the transmittedbar/specimen interface was 404 mm. The strain gauge signals were recorded by adigital oscilloscope. Figure 7.62 shows the typical signals recorded from the straingauges mounted on the incident and the transmitter bars during an experiment.These strain measurements were used to determine the time histories of the stressrSðtÞ; strain eSðtÞ and strain rate _eSðtÞ in the specimen during deformation using thefollowing equations:
rSðtÞ ¼ E0A0AS
etðtÞeSðtÞ ¼ 2C0
lS
R t0 eiðtÞ � etðtÞ½ � dt
_eSðtÞ ¼ 2C0lS
eiðtÞ � etðtÞ½ �
8><>: ð7:27Þ
where eiðtÞ and etðtÞ are the amplitudes of the transmitted and reflected strain pulses,respectively; E0, A0 and C0 are the Young’s modulus, cross-sectional area andlongitudinal wave speed of the bars, respectively; AS and lS are, respectively, theinitial cross-sectional area and the length of the specimen.
In general, the strain rates achieved in the SHPB test were not constantthroughout the test. In this investigation, the slope of the main straight line beforethe point corresponding to the peak stress in the strain-time curve is defined as therepresentative strain rate. An example is shown in Fig. 7.63, in which the strain rateis 37.9/s.
0.0078 0.0080 0.0082 0.0084 0.0086 0.0088
-2
0
2
4
6 Incident and reflected pulse Transmitted pulse
U (V
)
t (s)
Fig. 7.62 Typical signalsrecorded from strain gauges
7.6 Compressive Behavior Under Impact Loading 235
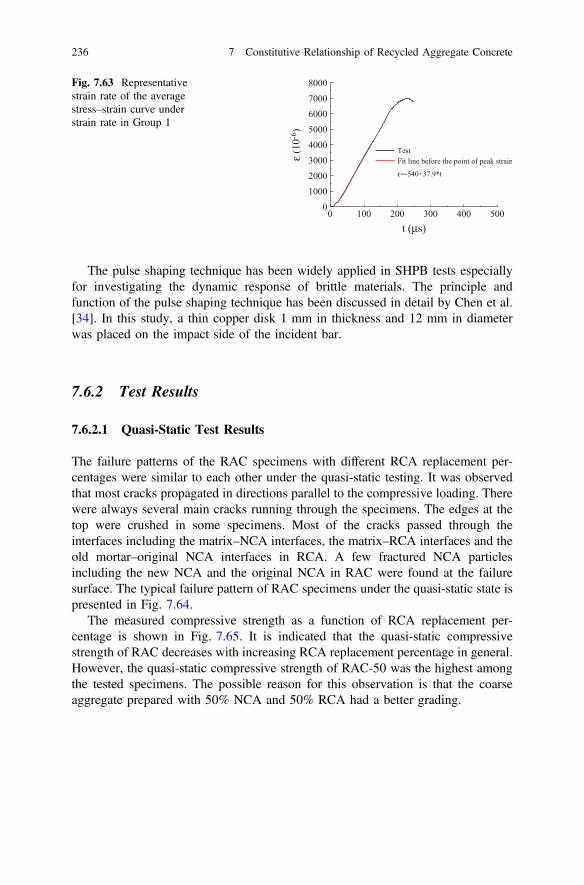
The pulse shaping technique has been widely applied in SHPB tests especiallyfor investigating the dynamic response of brittle materials. The principle andfunction of the pulse shaping technique has been discussed in detail by Chen et al.[34]. In this study, a thin copper disk 1 mm in thickness and 12 mm in diameterwas placed on the impact side of the incident bar.
7.6.2 Test Results
7.6.2.1 Quasi-Static Test Results
The failure patterns of the RAC specimens with different RCA replacement per-centages were similar to each other under the quasi-static testing. It was observedthat most cracks propagated in directions parallel to the compressive loading. Therewere always several main cracks running through the specimens. The edges at thetop were crushed in some specimens. Most of the cracks passed through theinterfaces including the matrix–NCA interfaces, the matrix–RCA interfaces and theold mortar–original NCA interfaces in RCA. A few fractured NCA particlesincluding the new NCA and the original NCA in RAC were found at the failuresurface. The typical failure pattern of RAC specimens under the quasi-static state ispresented in Fig. 7.64.
The measured compressive strength as a function of RCA replacement per-centage is shown in Fig. 7.65. It is indicated that the quasi-static compressivestrength of RAC decreases with increasing RCA replacement percentage in general.However, the quasi-static compressive strength of RAC-50 was the highest amongthe tested specimens. The possible reason for this observation is that the coarseaggregate prepared with 50% NCA and 50% RCA had a better grading.
0 100 200 300 400 5000
10002000300040005000600070008000
ε=-540+37.9*t
TestFit line before the point of peak strainε
(10-6
)
t (μs)
Fig. 7.63 Representativestrain rate of the averagestress–strain curve understrain rate in Group 1
236 7 Constitutive Relationship of Recycled Aggregate Concrete

NAC RAC30 RAC50 RAC70 RAC100
DA B
AD D
A
A
B
DE
E
B
C
Fig. 7.64 Failure patterns under static loading (a cracks passed through the matrix–NCAinterfaces, b cracks passed through the matrix–RCA interfaces, c cracks passed through the oldmortar–original NCA interfaces, d cracks passed through the new NCA, e cracks passed throughthe original NCA in RAC)
0 20 40 60 80 1000
5
10
15
20
25
30
35
40
Qua
si-s
tatic
stre
ngth
(MPa
)
RCA replacement percentage (%)
Fig. 7.65 Quasi-staticcompressive strength of RACwith different RCAreplacement percentages
7.6.2.2 SHPB Test Results
Failure pattern
During the SHPB tests, the specimens were tested at different strain rates, whichwere produced by varying the impact velocity. The impact velocities were classifiedinto four groups, i.e., Group 1: velocity � 10 m/s, Group 2: velocity � 12 m/s,Group 3: velocity � 16 m/s, and Group 4: velocity � 20 m/s. The correspondingstrain rates were about 40/s, 50/s, 75/s, and 100/s, respectively. The failure patternsof RAC specimens at the four velocities are presented in Fig. 7.66. It is observedthat the failure patterns of the RAC specimens with different RCA replacement
7.6 Compressive Behavior Under Impact Loading 237

(a) NAC20m/s16m/s12m/s10m/s
20m/s16m/s12m/s10m/s(b) RAC30
20m/s16m/s12m/s10m/s(c) RAC50
(d) RAC70 20m/s16m/s12m/s10m/s
(e) RAC100 20m/s16m/s12m/s10m/s
Fig. 7.66 Failure patterns of RAC specimens under impact loadings
238 7 Constitutive Relationship of Recycled Aggregate Concrete

percentages at a high strain rate are similar. The failure pattern was more and moresevere with increasing impact velocity which is summarized as follows: Thespecimens failed with a few visible cracks under impact velocity in Group 1; at ahigher impact velocity (i.e., Group 2), the specimens cracked into several largepieces; the specimens were crushed into fine fragments under impact velocity inGroup 3 and Group 4, and the crushing was more serious under the highest impactvelocity (i.e., Group 4). To sum up, most of the cracks still passed through theinterfaces, which is similar to that under static loading reported by Xiao et al. [35].It therefore suggests that the more fractured NCA particles generated under impactloading may be a factor but not the main factor for the increase in dynamic strength.
Stress–strain curves
Figure 7.67 displays the average stress–strain curves of the naturally dried andwet RAC specimens under different strain rates. It is observed that the stress–straincurves of the RAC specimens with different RCA replacement percentages obtainedat high strain rates have common features. A significant change in the stress–strainresponse of the RAC specimens with increasing strain rate can be clearly seen.However, the peak strain seems to show no clear trend as strain rate increases. Thenonlinearity of the ascending part and the descending part of the stress–straincurves decrease with increasing strain rate.
The average stress–strain curves of the RAC specimens with different RCAreplacement percentages under the same high strain rate groups are compared inFig. 7.68. It is observed that these curves are relatively similar under the same strainrate. This shows that the RCA replacement percentage has no significant and directinfluence on the stress–strain curves at a high strain rate.
7.6.3 Test Analysis and Discussion
7.6.3.1 Compressive Strength and Dynamic Increase Factor
The results of the dynamic compressive strength versus strain rate for the RAC spec-imens are demonstrated in Fig. 7.69, which indicates that the compressive strength ofRAC is clearly strain rate-dependent and increases with increasing strain rate.
The dynamic increase factor (DIF), which is defined as the ratio of dynamic com-pressive strength to its corresponding quasi-static strength, has been widely used toquantify the effect of strain rate on concrete-like materials. In this study, the DIF of theRAC specimens under high strain rates had the same feature, as shown in Fig. 7.70.Based on the experimental results, the relationship of the DIF of the RAC specimensversus strain rate in the range of 20/s–110/s can be described by the following formula:
DIF ¼ aþ b� log 10ð_edÞ ð7:28Þ
7.6 Compressive Behavior Under Impact Loading 239

0.000 0.006 0.012 0.018 0.024 0.0300
10
20
30
40
50
60
70
80 NAC, 38/s NAC, 48/s NAC, 77/s NAC, 100/s
0.000 0.006 0.012 0.018 0.024 0.0300
10
20
30
40
50
60
70
80 RAC30, 41/s RAC30, 50/s RAC30, 71/s RAC30, 93/s
(a) NAC (b) RAC30
0.000 0.006 0.012 0.018 0.024 0.0300
10
20
30
40
50
60
70
80
RAC50, 36/s RAC50, 51/s RAC50, 74/s RAC50, 93/s
0.000 0.006 0.012 0.018 0.024 0.0300
10
20
30
40
50
60
70
80 RAC70, 36/s RAC70, 49/s RAC70, 80/s RAC70, 97/sec
(d) RAC70
0.000 0.006 0.012 0.018 0.024 0.0300
10
20
30
40
50
60
70
80 RAC100, 39/s RAC100, 54/s RAC100, 78/s RAC100, 111/s
0.000 0.006 0.012 0.018 0.024 0.0300
10
20
30
40
50
60
70
80
NAC(wet), 40/s NAC(wet), 108/s
(f) NAC (wet)
0.000 0.006 0.012 0.018 0.024 0.0300
10
20
30
40
50
60
70
80
RAC100(wet), 43/s RAC100(wet), 111/s
(g) RAC100 (wet)
(c) RAC50
(e) RAC100
/MPa
Fig. 7.67 Average stress–strain curves of RAC specimens under different strain rates
240 7 Constitutive Relationship of Recycled Aggregate Concrete
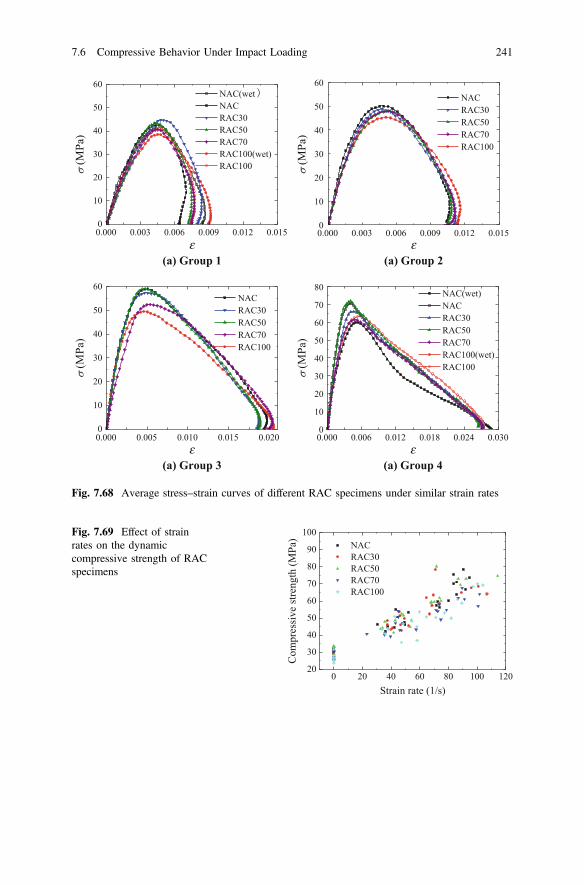
0.000 0.003 0.006 0.009 0.012 0.0150
10
20
30
40
50
60 NAC(wet) NAC RAC30 RAC50 RAC70 RAC100(wet) RAC100
0.000 0.003 0.006 0.009 0.012 0.0150
10
20
30
40
50
60 NAC RAC30 RAC50 RAC70 RAC100
(a) Group 1
0.000 0.005 0.010 0.015 0.0200
10
20
30
40
50
60 NAC RAC30 RAC50 RAC70 RAC100
0.000 0.006 0.012 0.018 0.024 0.0300
10
20
30
40
50
60
70
80 NAC(wet) NAC RAC30 RAC50 RAC70 RAC100(wet) RAC100
e(a) Group 2
e
(a) Group 3e
(a) Group 4e
Fig. 7.68 Average stress–strain curves of different RAC specimens under similar strain rates
0 20 40 60 80 100 12020
30
40
50
60
70
80
90
100 NAC RAC30 RAC50 RAC70 RAC100
Com
pres
sive
stre
ngth
(MPa
)
Strain rate (1/s)
Fig. 7.69 Effect of strainrates on the dynamiccompressive strength of RACspecimens
7.6 Compressive Behavior Under Impact Loading 241
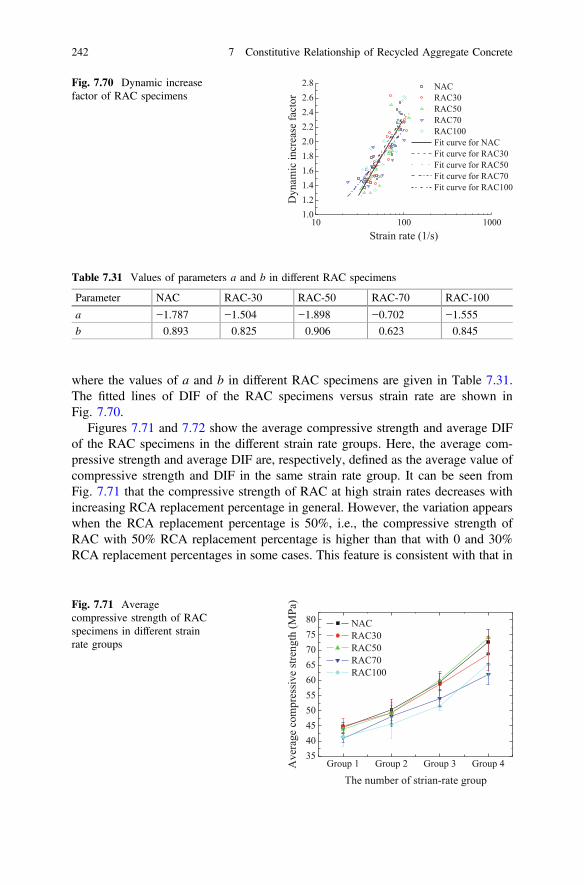
where the values of a and b in different RAC specimens are given in Table 7.31.The fitted lines of DIF of the RAC specimens versus strain rate are shown inFig. 7.70.
Figures 7.71 and 7.72 show the average compressive strength and average DIFof the RAC specimens in the different strain rate groups. Here, the average com-pressive strength and average DIF are, respectively, defined as the average value ofcompressive strength and DIF in the same strain rate group. It can be seen fromFig. 7.71 that the compressive strength of RAC at high strain rates decreases withincreasing RCA replacement percentage in general. However, the variation appearswhen the RCA replacement percentage is 50%, i.e., the compressive strength ofRAC with 50% RCA replacement percentage is higher than that with 0 and 30%RCA replacement percentages in some cases. This feature is consistent with that in
10 100 10001.01.21.41.61.82.02.22.42.62.8 NAC
RAC30 RAC50 RAC70 RAC100 Fit curve for NAC Fit curve for RAC30 Fit curve for RAC50 Fit curve for RAC70 Fit curve for RAC100
Dyn
amic
incr
ease
fact
or
Strain rate (1/s)
Fig. 7.70 Dynamic increasefactor of RAC specimens
Table 7.31 Values of parameters a and b in different RAC specimens
Parameter NAC RAC-30 RAC-50 RAC-70 RAC-100
a −1.787 −1.504 −1.898 −0.702 −1.555
b 0.893 0.825 0.906 0.623 0.845
Group 1 Group 2 Group 3 Group 435404550556065707580 NAC
RAC30 RAC50 RAC70 RAC100
Ave
rage
com
pres
sive
stre
ngth
(MPa
)
The number of strian-rate group
Fig. 7.71 Averagecompressive strength of RACspecimens in different strainrate groups
242 7 Constitutive Relationship of Recycled Aggregate Concrete
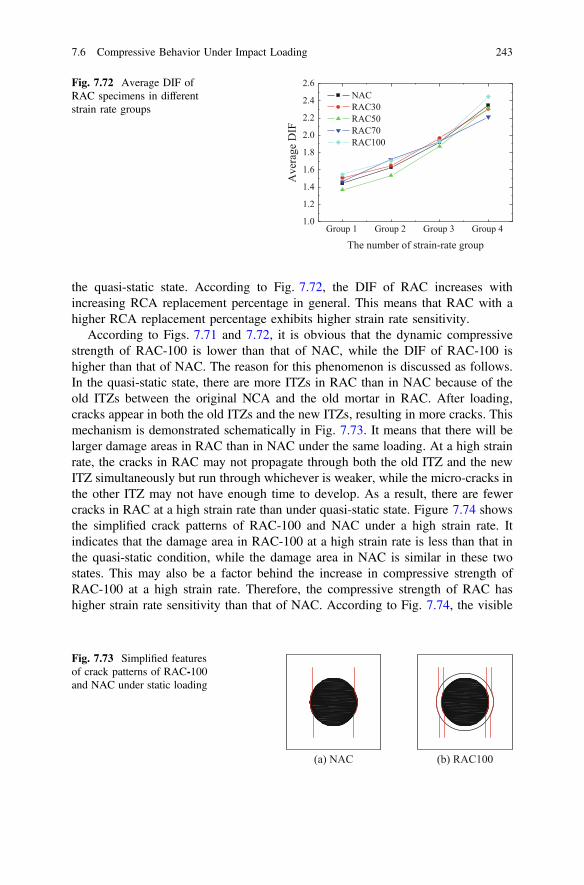
the quasi-static state. According to Fig. 7.72, the DIF of RAC increases withincreasing RCA replacement percentage in general. This means that RAC with ahigher RCA replacement percentage exhibits higher strain rate sensitivity.
According to Figs. 7.71 and 7.72, it is obvious that the dynamic compressivestrength of RAC-100 is lower than that of NAC, while the DIF of RAC-100 ishigher than that of NAC. The reason for this phenomenon is discussed as follows.In the quasi-static state, there are more ITZs in RAC than in NAC because of theold ITZs between the original NCA and the old mortar in RAC. After loading,cracks appear in both the old ITZs and the new ITZs, resulting in more cracks. Thismechanism is demonstrated schematically in Fig. 7.73. It means that there will belarger damage areas in RAC than in NAC under the same loading. At a high strainrate, the cracks in RAC may not propagate through both the old ITZ and the newITZ simultaneously but run through whichever is weaker, while the micro-cracks inthe other ITZ may not have enough time to develop. As a result, there are fewercracks in RAC at a high strain rate than under quasi-static state. Figure 7.74 showsthe simplified crack patterns of RAC-100 and NAC under a high strain rate. Itindicates that the damage area in RAC-100 at a high strain rate is less than that inthe quasi-static condition, while the damage area in NAC is similar in these twostates. This may also be a factor behind the increase in compressive strength ofRAC-100 at a high strain rate. Therefore, the compressive strength of RAC hashigher strain rate sensitivity than that of NAC. According to Fig. 7.74, the visible
Group 1 Group 2 Group 3 Group 41.0
1.2
1.4
1.6
1.8
2.0
2.2
2.4
2.6 NAC RAC30 RAC50 RAC70 RAC100
Ave
rage
DIF
The number of strain-rate group
Fig. 7.72 Average DIF ofRAC specimens in differentstrain rate groups
(a) NAC (b) RAC100
Fig. 7.73 Simplified featuresof crack patterns of RAC-100and NAC under static loading
7.6 Compressive Behavior Under Impact Loading 243

primary cracks in NAC and RAC-100 are equal in number at high strain rates andthe crack-passed ITZs in RAC-100 are weaker than those in NAC. As a result, thecompressive strength of RAC-100 is still lower than NAC at high strain rates.
7.6.3.2 Initial Elastic Modulus
The initial elastic modulus of RAC was determined from the average stress–straincurve using the following equation:
Ei ¼ r2 � r1e2 � e2
ð7:29Þ
where r1 and r2 are the stresses corresponding to 5 and 25% of the peak stress,respectively; e1 and e2 are the strain at the stress level r1 and r2, respectively. Theinitial elastic modulus Ei of RAC versus strain rate is shown in Fig. 7.75. It can benoticed that in general, the initial elastic modulus of RAC increases with increasingstrain rate. Figure 7.75 also shows that the initial elastic modulus of RAC at a highstrain rate decreases with increasing RCA replacement percentage, which is con-sistent with the case in the quasi-static state.
(a) NAC (b) RAC100
Fig. 7.74 Simplified featuresof crack patterns of RAC-100and NAC under impactloading
0 10 20 30 40 50 60 70 80 90 100 110 1200
5
10
15
20
25
30
35
40 NAC RAC30 RAC50 RAC70 RAC100
Initi
al e
last
ic m
odul
us (G
Pa)
Strian rate (1/s)
Fig. 7.75 Initial elasticmodulus of RAC specimensunder different strain rates
244 7 Constitutive Relationship of Recycled Aggregate Concrete

7.6.3.3 Peak Strain
Figure 7.76 demonstrates the variation of the peak strain ep obtained from theaverage stress–strain curves of the RAC specimens as a function of log 10 of strainrate. Figure 7.76 shows that, for the RAC specimens, ep stays at relatively similarvalues with increasing strain rate. But it can be observed that ep of RAC-100 andRAC-70 are generally larger than that of RAC-30 and NAC. Therefore, it is sug-gested that ep of RAC with higher RCA replacement percentages at a certain highstrain rate is larger.
7.6.3.4 Moisture Effect
The average compressive strength and DIF of RAC-100 and NAC in the naturallydried and wet states in the different strain rate groups are shown in Figs. 7.77 and7.78. It shows that the compressive strength of both wet RAC-100 and NAC islower than the naturally dried ones when they are under a similar high strain rate,which is consistent with the results obtained under the quasi-static state. Thedecrease in static strength in wet condition was due to the presence of water forcing
0 20 40 60 80 100 1202000
3000
4000
5000
6000
7000
8000 NAC RAC30 RAC50 RAC70 RAC100
Stria
n at
pea
k st
ress
(με)
Strian rate (1/s)
Fig. 7.76 Peak strain ofRAC specimens underdifferent strain rates
0 20 40 60 80 100 1200
20
40
60
80
100 NAC RAC100 NAC (wet) RAC100 (wet)
Com
pres
sive
stre
ngth
(MPa
)
Strain rate (1/s)
Fig. 7.77 Compressivestrength of RAC-100 andNAC in naturally dried andwet states in different strainrate groups
7.6 Compressive Behavior Under Impact Loading 245

the gel surface further apart and reducing the Van der Walls forces between gelparticles, which results in reduced stress required for crack propagation. This mayalso be the reasons for the similar results observed at high strain rates.
According to Figs. 7.77 and 7.78, both wet RAC-100 and wet NAC exhibithigher compressive strength at high strain rates, which is consistent with the nat-urally dried ones. Moreover, it seems that the strain rate dependence of wet concreteis higher than in naturally dried concrete, especially for RAC-100. It indicates thatthe moisture condition is an important factor influencing the strain rate sensitivity ofRAC. From Fig. 7.78, the DIF of wet RAC-100 is also higher than that of wetNAC, suggesting that wet RAC-100 has higher strain rate sensitivity. The reasonsmay also lie in the difference in crack propagation under quasi-static loading andimpact loading, which has been described in the case of naturally dried condition.
7.7 Concluding Remarks
(1) For all considered cases from r = 0–100%, the compressive stress–strain curvesshow a similar behavior. The recycled coarse aggregate (RCA) replacementpercentage has a considerable influence on the compressive stress–strain curvesof recycled aggregate concrete (RAC). The compressive strengths including theprism and the cube compressive strengths of RAC generally decrease withincreasing RCA contents. The elastic modulus of RAC is lower than that of thenormal concrete. It decreases as the RCA content increases. The peak strain ofRAC is higher than that of normal concrete. It increases with the increase inRCA contents. Uniaxial compressive constitutive model of RAC, which isextended from the analytical expression initially proposed by Guo and Zhangfor normal concrete, can be used directly in many practical engineeringapplications of RAC.
(2) The statistical parameters indicate that the RAC has more variable characteristicindices than natural aggregate concrete (NAC). The relationships betweencharacteristic indices were established, which indicates that the RAC has a
0 20 40 60 80 100 1201.0
1.5
2.0
2.5
3.0 NAC RAC100 NAC (wet) RAC100 (wet)
Ave
rage
DIF
Strain rate (1/s)
Fig. 7.78 DIF of RAC-100and NAC in naturally driedand wet states in differentstrain rate groups
246 7 Constitutive Relationship of Recycled Aggregate Concrete

wider scale of descending branches of stress–strain curves and possesses brittleproperties compared with NAC based on established relationships. The coef-ficient of variation of stress decreases with the increasing strain and reaches thelowest value when the strain is a bit lower than peak strain and then increasesgradually. The stress corresponding to each strain obeys normal distribution byanalyzing created samples of RAC stress–strain curve.
(3) The failure process and mechanism of RAC under tensile loading can be drawn.The cracks are most likely to appear first within ITZs between natural aggre-gates and hardened mortar including new and old ones. Compared with newmortar, the old mortar in RAC has a higher tendency to crack. Due to the largevolume content of hardened mortar (both old and new), some of the mechanicalproperties of RAC are similar to those of mortar. So compared to parentconcrete, RAC with similar mix proportions normally has a lower Young’smodulus, a lower strength, and a higher peak strain.
(4) The stress–strain curve of the confined RAC is similar to that of the confinedordinary concrete. The stress–strain curve of RCFS is divided into elastic andplastic stages. The stress–strain curve of RCFF is divided into elastic, elastic–plastic, and descending stages. The peak load decreases with an increase in therecycled aggregate replacement percentage. Under the same condition, the peakload of RCFF is lower than that of RCFS because the hoop tensile strength ofGFRP is lower than the yield strength of the steel tube. The lateral deformationcoefficient of RCFS increases slowly to a certain value, then sharply increases,and finally exceeds 1.5, while for RCFF it maintains at a constant value andthen gradually increases to 1.2. Based on the limit equilibrium theory and theexperimental data, approximate formulas for the peak load and the stress–strainrelationship of RCFF and RCFS have been also presented, which are in goodagreement with the experimental data.
(5) Overall, in terms of the shape of shear stress–slip curves and the crack prop-agation paths, the shear transfer performance across cracks in RAC is similar tothat in NAC. The RCA replacement percentage r has significant effects on theultimate shear load Pu of specimens with similar concrete strength (different w/cratios) and same constrain stiffness. Pu of RAC is nearly the same as that ofNAC for r < 30%, but it reduces from r = 30 to 50%, after which it stabilizes atabout 0.85Pu of NAC. Its influence on the initial shear stiffness is negligible.Lower r leads to higher concrete strength, which in turn results in higherultimate shear load for RAC specimens with the same w/c ratio (differentcompressive strength) and lateral constraint stiffness.
(6) The compressive strength of RAC at high strain rates decreases with increasingRCA replacement percentage in general and the strength values start to varywhen the RCA replacement percentage reaches 50%, which is similar to thesituation in the quasi-static state. The dynamic increase factor (DIF) of the RACspecimens increases approximately linearly with the log 10 of strain rate.The DIF of RAC at high strain rates increases with increasing RCA replace-ment percentage in general.
7.7 Concluding Remarks 247
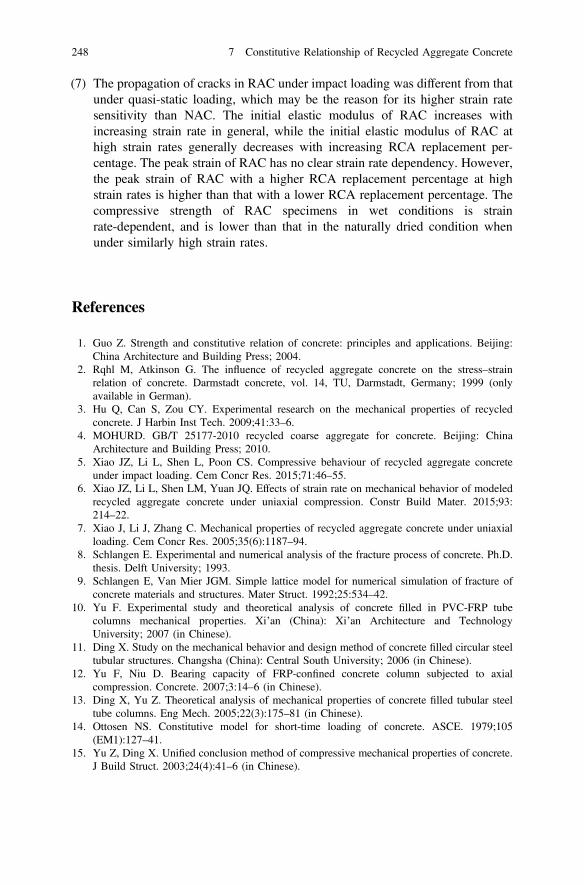
(7) The propagation of cracks in RAC under impact loading was different from thatunder quasi-static loading, which may be the reason for its higher strain ratesensitivity than NAC. The initial elastic modulus of RAC increases withincreasing strain rate in general, while the initial elastic modulus of RAC athigh strain rates generally decreases with increasing RCA replacement per-centage. The peak strain of RAC has no clear strain rate dependency. However,the peak strain of RAC with a higher RCA replacement percentage at highstrain rates is higher than that with a lower RCA replacement percentage. Thecompressive strength of RAC specimens in wet conditions is strainrate-dependent, and is lower than that in the naturally dried condition whenunder similarly high strain rates.
References
1. Guo Z. Strength and constitutive relation of concrete: principles and applications. Beijing:China Architecture and Building Press; 2004.
2. Rqhl M, Atkinson G. The influence of recycled aggregate concrete on the stress–strainrelation of concrete. Darmstadt concrete, vol. 14, TU, Darmstadt, Germany; 1999 (onlyavailable in German).
3. Hu Q, Can S, Zou CY. Experimental research on the mechanical properties of recycledconcrete. J Harbin Inst Tech. 2009;41:33–6.
4. MOHURD. GB/T 25177-2010 recycled coarse aggregate for concrete. Beijing: ChinaArchitecture and Building Press; 2010.
5. Xiao JZ, Li L, Shen L, Poon CS. Compressive behaviour of recycled aggregate concreteunder impact loading. Cem Concr Res. 2015;71:46–55.
6. Xiao JZ, Li L, Shen LM, Yuan JQ. Effects of strain rate on mechanical behavior of modeledrecycled aggregate concrete under uniaxial compression. Constr Build Mater. 2015;93:214–22.
7. Xiao J, Li J, Zhang C. Mechanical properties of recycled aggregate concrete under uniaxialloading. Cem Concr Res. 2005;35(6):1187–94.
8. Schlangen E. Experimental and numerical analysis of the fracture process of concrete. Ph.D.thesis. Delft University; 1993.
9. Schlangen E, Van Mier JGM. Simple lattice model for numerical simulation of fracture ofconcrete materials and structures. Mater Struct. 1992;25:534–42.
10. Yu F. Experimental study and theoretical analysis of concrete filled in PVC-FRP tubecolumns mechanical properties. Xi’an (China): Xi’an Architecture and TechnologyUniversity; 2007 (in Chinese).
11. Ding X. Study on the mechanical behavior and design method of concrete filled circular steeltubular structures. Changsha (China): Central South University; 2006 (in Chinese).
12. Yu F, Niu D. Bearing capacity of FRP-confined concrete column subjected to axialcompression. Concrete. 2007;3:14–6 (in Chinese).
13. Ding X, Yu Z. Theoretical analysis of mechanical properties of concrete filled tubular steeltube columns. Eng Mech. 2005;22(3):175–81 (in Chinese).
14. Ottosen NS. Constitutive model for short-time loading of concrete. ASCE. 1979;105(EM1):127–41.
15. Yu Z, Ding X. Unified conclusion method of compressive mechanical properties of concrete.J Build Struct. 2003;24(4):41–6 (in Chinese).
248 7 Constitutive Relationship of Recycled Aggregate Concrete
16. Farids MN, Khalili H. FRP-encased concrete as a structural material. Mag Concr Res.1982;34(121):191–202.
17. Xiao JZ, Li WG, Sun Z. Crack propagation in recycled aggregate concrete under uniaxialcompressive loading. ACI Mater J. 2012;110 (in press).
18. Xiao JZ, Li WG, Fan YH, Huang X. A review of study on recycled aggregate concrete inChina (1996–2011). Constr Build Mater. 2012;29 (in press).
19. Etxeberria M, Vázquez E, Marí A, Barra M. Influence of amount of recycled coarseaggregates and production process on properties of recycled aggregate concrete. Cem ConcrRes. 2007;37:735–42.
20. American Concrete Institute (ACI). Building code requirements for structural concrete.No. 318-2005, Committee 318, Farmington, Hills, Mich; 2005.
21. Prestressed Concrete Institute (PCI). PCI design handbook. 4th ed. Chicago: PCI; 1992.22. Gu X. The basic principle of concrete structures. Shanghai: Tongji University Press; 2011 (in
Chinese).23. Mattock AH. Shear friction and high-strength concrete. ACI J. 2001;69:50–9.24. Mansur MA, Vinayagam T, Tan K-H. Shear transfer across a crack in reinforced
high-strength concrete. J Mater Civ Eng ASCE. 2008;20:294–302.25. Loov R, Patnaik A. Horizontal shear strength of composite concrete beams with rough
interface. PCI J. 1994;39:48–67.26. Abrams DA. Effect of rate of application of load on the compressive strength of concrete.
Proc. ASTM. 1917;17:364–5.27. Harsh S, Shen ZJ, Darwin D. Strain-rate sensitive behavior of cement paste and mortar in
compression. ACI Mater J. 1990;87(5):508–16.28. Ross CA, Tedesco JW, Kuennen ST. Effects of strain-rate on concrete strength. ACI
Mater J. 1995;92(1):37–47.29. Xiao SY, Li HN, Monteiro P. Influence of strain rates and loading histories on the
compressive damage behaviour of concrete. Mag Concr Res. 2011;63(12):915–26.30. Chakradhara Rao M, Bhattacharyya SK, Barai SV. Behaviour of recycled aggregate concrete
under drop weight impact load. Constr Build Mater. 2011;25(1):69–80.31. Lu YB, Chen X, Teng X, Zhang S. Dynamic compressive behavior of recycled aggregate
concrete based on split Hopkinson pressure bar tests. Lat Am J Solids Struct. 2014;11:131–41.
32. Wang S, Zhang MH, Quek ST. Effect of specimen size on static strength in dynamic increasefactor of high-strength concrete strength from SHPB test. J Test Eval. 2011;39(5):898–907.
33. Van Mier JGM, Shah SP, Arnaud M, et al. Strain-softening of concrete in uniaxialcompression. Mater Struct. 1997;30:195–209.
34. Chen XD, Wu SX, Zhou JK. Experimental and modeling study of dynamic mechanicalproperties of cement paste, mortar and concrete. Constr Build Mater. 2013;47:419–30.
35. Xiao JZ, Li WG, Sun ZH, Lange DA, Shah SP. Crack propagation in recycled aggregateconcrete under uniaxial compressive loading. ACI Mater J. 2012;109(4):451–61.
References 249

Chapter 8Long-Term Property of RecycledAggregate Concrete
Abstract This chapter analyzes the long-term properties of recycled aggregateconcrete (RAC), including shrinkage, creep, carbonation resistance, chloride dif-fusion resistance, and fatigue behavior. Most studies have shown that the long-termproperties of RAC are inferior to those of natural aggregate concrete (NAC), andsome indicated that the long-term properties are better than those of NAC. RAC’slong-term properties are influenced by many factors such as recycled coarseaggregate (RCA) replacement percentage, water–cement (w/c) ratio, and mineraladmixtures. The long-term properties of RAC can be improved through bettercontrol of these factors. This chapter will be helpful for a comprehensive under-standing of and further research on RAC and provides an important basis andreferences for the engineering applications of RAC.
8.1 Shrinkage and Creep Characteristics
8.1.1 Experimental Programme
8.1.1.1 Materials
Ordinary Portland Cement with grade 42.5 confirming to standard GB175-2007was adopted in this experimental investigation. The chemical composition andphysical properties of the Portland cement used are shown in Table 8.1. The fineaggregate used in the experiments was river sand, and water absorption, specificdensity and fineness modulus of the fine aggregate are about 14%, 2464 kg/m3 and2.8 respectively.
Natural coarse aggregate (NCA) (5–25 mm) and RCA (5–25 mm) were used inthe experimental study. The aggregate used in the study has a continuous granu-lometric curve according to Chinese standard GB/T 14685-2011 (see Fig. 8.1). Thebasic physical properties of NCA and RCA are given in Table 8.2, where the lastcolumn of the Table shows the residual adhering mortar content of RCA, and theresidual mortar content measured uses the method in Ref. [1]. The RCA is similar in
© Springer-Verlag GmbH Germany 2018J. Xiao, Recycled Aggregate Concrete Structures,Springer Tracts in Civil Engineering, https://doi.org/10.1007/978-3-662-53987-3_8
251

appearance to the NCA; however, the water absorption and crush value of RCA aregreater than those of NCA, and the density is lower than that of NCA, which isbecause there is a large quantity of old adhering mortar in the RCA [2, 3].
8.1.1.2 Mix Proportions
The NAC with 30 MPa cubic compressive strength and 120 mm slump was used;its mix proportions were designed to Chinese standard JGJ55-2011. In order todesign the same volume content of new mortar in NAC and RAC, the method ofsubstituting NCA with RCA by volume was adopted for producing the RAC, andthe replacement percentages are 33, 66 and 100% (denoted RAC33, RAC66 and
Table 8.1 Chemical composition and physical properties of Portland cement used
SiO2
(%)Al2O3
(%)Fe2O3
(%)CaO(%)
MgO(%)
S2O3
(%)R2O(%)
Loss onignition (%)
Compressivestrength(MPa)
Flexuralstrength(MPa)
3d 28d 3d 28d
21.82 6.02 3.65 59.79 2.07 2.21 0.59 2.13 22.0 42.5 4.0 6.5
Table 8.2 Physical properties of NCA and RCA
Type Bulkdensity(kg/m3)
Apparentdensity(kg/m3)
10-minabsorption(%)
24-hourabsorption(%)
Crushvalue(%)
Oldmortar(%)
NCA 1407 2730 – 0.6 12 –
RCA 1203 2530 3.5 4.8 9 25.5
Fig. 8.1 Gradation curve (Chinese standard GB/T 14685-2011)
252 8 Long-Term Property of Recycled Aggregate Concrete

RAC100 respectively). Owing to the high water absorption of RCA, additionalwater (AW) was added to keep the mix proportion of new mortar in NAC and RACconsistent. This high absorption rate of RCA meant that the 10 min RCAabsorption reached about 80% of the RAC saturated absorption [4], and the addi-tional water can be calculated using the 10 min absorption and the content of RCAin RAC. The RAC mix proportions are given in Table 8.3.
The mortar mix proportion was designed according to the mix proportion ofNAC: cement (C):water (W):sand (S) = 1:0.5:1.49 (M−0.5).
8.1.1.3 Preparation of Specimens
Preparation and mixing of RAC were conducted under laboratory conditions. Inorder to provide a consistent mix proportion for new mortar in NAC and RAC,based on the two-stage mixing approach developed in Ref. [5], the RAC mix in thissection was prepared according to the following procedure: the RCA and additionalwater were added, the mixer was given a few turns and left to rest for 10 min; thesand, cement and half of the water were then added, mixed for 3 min and left to restfor another 3 min, covering it to avoid evaporation; finally, the remaining water wasadded and mixed for 2 min, after which the concrete was ready. For each mix withdifferent RCA replacement percentages, the mix was cast in six 100 mm cubemoulds and nine 100 � 100 � 400 mm prism moulds and compacted on avibrating table.
The RAC and mortar specimens were demoulded after 24 h and transferred to awater curing bath (20 ± 2 °C) for 7 days. After that, the specimens were cured in achamber at a temperature of about 24 ± 2 °C and relative humidity of 65 ± 15%until the day for testing.
8.1.1.4 Testing Equipment
After curing for 28 days, shrinkage and creep tests were carried out according toChinese standard GB/T 50080-2002. The specimens were tested at a temperature of24 ± 2 °C and relative humidity of 65 ± 15%, which is different from the
Table 8.3 RAC mix proportions
Series RCAreplacementpercentage
Cement(kg/m3)
Mix water(kg/m3)
Sand(kg/m3)
NCA(kg/m3)
RCA(kg/m3)
AW(kg/m3)
NCA 0 417 208 621 1153 0 0
RCA33 33% 417 208 621 769 353 12.4
RCA66 66% 417 208 621 384 707 24.7
RCA100 100% 417 208 621 0 1060 37.1
8.1 Shrinkage and Creep Characteristics 253
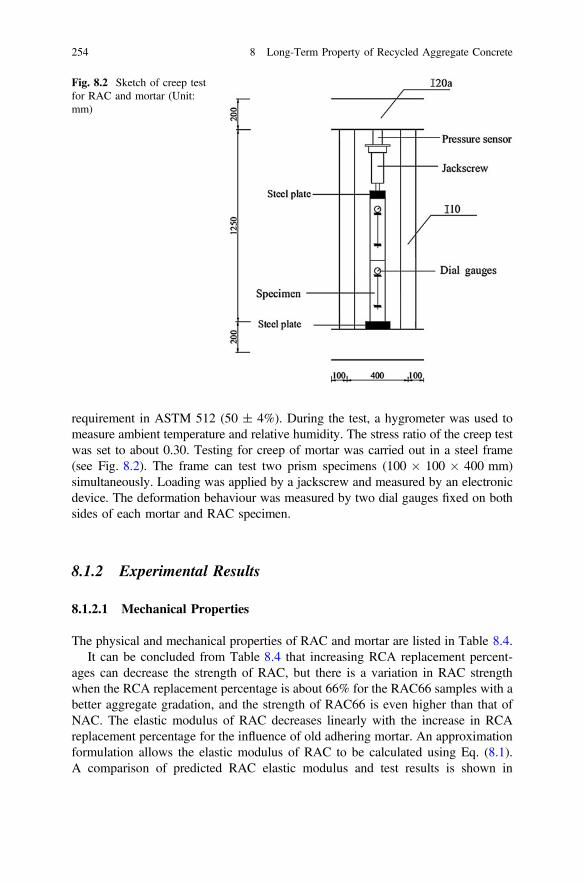
requirement in ASTM 512 (50 ± 4%). During the test, a hygrometer was used tomeasure ambient temperature and relative humidity. The stress ratio of the creep testwas set to about 0.30. Testing for creep of mortar was carried out in a steel frame(see Fig. 8.2). The frame can test two prism specimens (100 � 100 � 400 mm)simultaneously. Loading was applied by a jackscrew and measured by an electronicdevice. The deformation behaviour was measured by two dial gauges fixed on bothsides of each mortar and RAC specimen.
8.1.2 Experimental Results
8.1.2.1 Mechanical Properties
The physical and mechanical properties of RAC and mortar are listed in Table 8.4.It can be concluded from Table 8.4 that increasing RCA replacement percent-
ages can decrease the strength of RAC, but there is a variation in RAC strengthwhen the RCA replacement percentage is about 66% for the RAC66 samples with abetter aggregate gradation, and the strength of RAC66 is even higher than that ofNAC. The elastic modulus of RAC decreases linearly with the increase in RCAreplacement percentage for the influence of old adhering mortar. An approximationformulation allows the elastic modulus of RAC to be calculated using Eq. (8.1).A comparison of predicted RAC elastic modulus and test results is shown in
Fig. 8.2 Sketch of creep testfor RAC and mortar (Unit:mm)
254 8 Long-Term Property of Recycled Aggregate Concrete

Fig. 8.3. It can be seen that the results of Eq. (8.1) agree with the experimentalresults. The Poisson’s ratio of RAC increases with the increase in RCA replacementpercentage. The Poisson’s ratio of RAC ranges from 0.181 to 0.253 when thereplacement percentage of RCA changes from 0 to 100%.
Ec ¼ �83:36rþ 35445 ð8:1Þ
where,
Ec elastic modulus of RAC (MPa)r RCA replacement percentage (%)
8.1.2.2 Shrinkage
Shrinkage of RAC and mortar are shown in Figs. 8.4 and 8.5 respectively. Thevariations in temperature and relative humidity are shown in Fig. 8.6.
Table 8.4 Physical and mechanical properties of RAC and mortar
Series fcu (7d)(MPa)
fcu (28d)(MPa)
fc (28d)(MPa)
fc/fcu(28d)
Elasticmodulus(MPa)
Poisson’sratio
NCA 21.8 36.0 28.3 0.786 35875 0.181
RCA33 20.9 32.3 27.2 0.842 32395 0.212
RCA66 22.1 37.5 30.3 0.808 29268 0.240
RCA100 19.1 30.9 26.2 0.848 27653 0.253
M-0.5 27.2 46.6 38.4 0.824 24660 0.219
Fig. 8.3 Comparison between calculated values and test values for elastic modulus of RAC
8.1 Shrinkage and Creep Characteristics 255

It can be seen from Figs. 8.4 and 8.5 that the shrinkage of RAC increases withthe increase in RCA replacement percentage. The shrinkage deformation ofRAC33, RAC66 and RAC100 is higher than that of NAC by about 2.6, 15.4 and26.9% respectively after the RAC specimens are dried for 200 days. The influenceof temperature and relative humidity on the shrinkage deformation of RAC issignificant, which is identical with the conclusion reported in Ref. [6].
Fig. 8.4 RAC shrinkagecurves
Fig. 8.5 Mortar shrinkagecurves
Fig. 8.6 Temperature andrelative humidity records
256 8 Long-Term Property of Recycled Aggregate Concrete
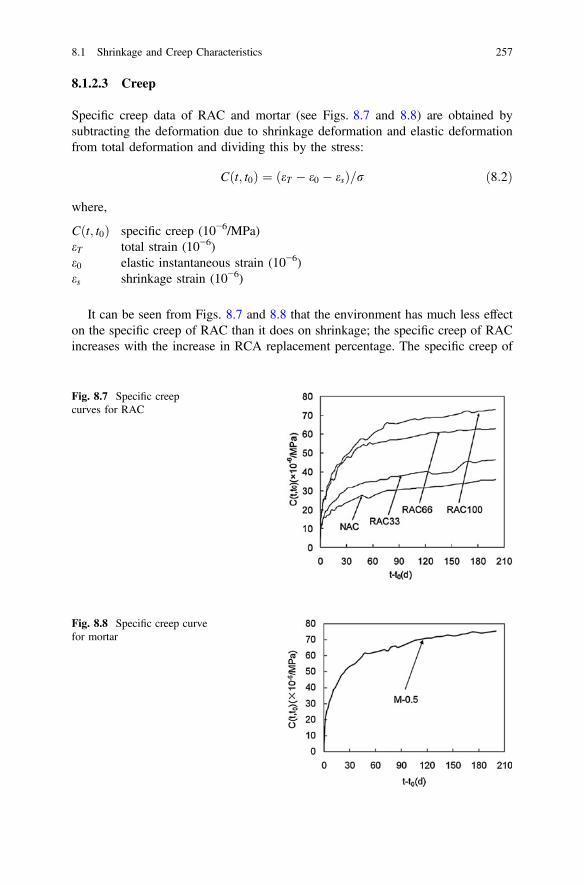
8.1.2.3 Creep
Specific creep data of RAC and mortar (see Figs. 8.7 and 8.8) are obtained bysubtracting the deformation due to shrinkage deformation and elastic deformationfrom total deformation and dividing this by the stress:
C t; t0ð Þ ¼ eT � e0 � esð Þ=r ð8:2Þ
where,
C t; t0ð Þ specific creep (10−6/MPa)eT total strain (10−6)e0 elastic instantaneous strain (10−6)es shrinkage strain (10−6)
It can be seen from Figs. 8.7 and 8.8 that the environment has much less effecton the specific creep of RAC than it does on shrinkage; the specific creep of RACincreases with the increase in RCA replacement percentage. The specific creep of
Fig. 8.7 Specific creepcurves for RAC
Fig. 8.8 Specific creep curvefor mortar
8.1 Shrinkage and Creep Characteristics 257

RAC 33, RAC66 and RAC100 is higher than that of NAC by about 28.7, 75.0 and103.3% respectively after loading for 200 days. The instantaneous elastic strain,strain of RAC and mortar at 0.1 day and elastic strain (calculated using the elasticmodulus) are listed in Table 8.5. It can be seen from Table 8.5 that the instanta-neous elastic strain and the 0.1-day strain of RAC increase with the increase inRCA replacement percentage. The 0.1-day strain of RAC and mortar is approxi-mately 1.1 times the instantaneous elastic strain, and the 0.1-day strain of RAC isapproximately equal to the elastic strains calculated using its elastic modulus (1/Ec).
8.2 Carbonation Resistance Performance
8.2.1 Existing Prediction Models of Carbonation Depth
The tested carbonation depths can be regarded as a function of square root time,which usually results in a fairly linear relation. This square root time relation forcarbonation coefficient has been considered as an effective way to estimate roughlywhen carbonation front is expected to reach the reinforcing steel bars and trigger itsdepassivation [7].
The linear relation is based on Fick’s first law of diffusion, and the relation isshown as follows.
xcðtÞ ¼ Kcffiffit
p ð8:3Þ
where xcðtÞ is the carbonation depth at service time t and Kc is the carbonationcoefficient, which is determined by many factors. In this section, three existingprediction models were introduced and used to compare and analyze the carbon-ation depth of RAC.
8.2.1.1 Fib Carbonation Model
The carbonation depth xcðtÞ at time t, in mm, is determined by the followingformula [8].
Table 8.5 Value of instantaneous elastic strain, elastic strain and 0.1-day strain of RAC
Series Instantaneous elasticstrain (per MPa 10−6)
0.1-day strain(per MPa 10−6)
0.1-daystrain/instantaneous
Elastic strain(per MPa 10−6)
NCA 25 28 1.12 28
RCA33 29 31 1.07 31
RCA66 32 36 1.13 34
RCA100 34 38 1.12 36
258 8 Long-Term Property of Recycled Aggregate Concrete

xcðtÞ ¼ffiffiffiffiffiffiffiffiffiffiffiffiffiffiffiffiffiffiffiffiffiffiffiffiffiffiffiffiffiffiffiffiffiffiffiffiffiffiffiffiffiffi2 � ke � kc � R�1
NAC;0 � CS
q�WðtÞ � ffiffi
tp ð8:4Þ
where ke is the environmental function; kc is the execution transfer parameter;R�1NAC;0 is the inverse effective carbonation resistance of concrete, in (mm2/year)/
(kg/m3); CS is the CO2 concentration (kg/m3); and WðtÞ is the weather function.The environmental function ke can be described by Eq. (8.5). It takes into account
the case that the influence of the relative humidity level (RH) on the diffusioncoefficient may differ from the reference relative humidity (RHref = 65%) [8, 9].
ke ¼ 1� RH100
� �5" #
= 1� RHref
100
� �5" #( )2:5
ð8:5Þ
The execution transfer parameter kc takes the curing into account in order toevaluate the effective carbonation resistance.
kc ¼ tc7
� �bc ð8:6Þ
where bc is the exponent of regression and the mean value of bc is −0.567; tc is theperiod of curing (days).
According to the fib Bulletin 34 [8], the inverse carbonation resistance R�1NAC;0 of
concrete under natural conditions can be determined by the following expression.
R�1NAC;0 ¼ kt � R�1
ACC;0 þ et ð8:7Þ
where R�1ACC;0 is the inverse effective carbonation resistance of dry concrete,
determined at a certain point of time on specimens with the accelerated carbonationtest; kt is the regression parameter (mean value 1.25) which considers the influenceof test method on the accelerated carbonation test; et is the error term (mean value315.5) considering inaccuracies which occur conditionally when using the accel-erated carbonation test method, in (mm2/year)/(kg/m3). The value of R�1
ACC;0 can beobtained by Table 8.6.
Table 8.6 Quantification of R�1ACC;0 (adopted from fib Bulletin 34 [8])
Cement type w=ceqv0.35 0.40 0.45 0.50 0.55 0.60
CEM I 42.5 R – 3.1 5.2 6.8 9.8 13.4
CEM I 42.5 R + FA (k = 0.5) – 0.3 1.9 2.4 6.5 8.3
CEM I 42.5 R + SF (k = 2.0) 3.5 5.5 – – 16.5 –
CEM III/B 42.5 – 8.3 16.9 26.6 44.3 80.0
Note The unit of R�1ACC;0 is 10
−11 (m2/s)/(kg/m3); w=ceqv is the equivalent w/c ratio, considering FA(fly ash) or SF (silica fume) with the respective k-value (efficiency factor)
8.2 Carbonation Resistance Performance 259

The weather function WðtÞ takes the mesoclimate conditions due to wettingevents of the concrete surface into account and is expressed as [8] follows.
WðtÞ ¼ t0t
� �ðPSR �ToWÞbw2 ð8:8Þ
where t0 is the time of reference (years); PSR is the probability of driving rain; ToWis the time of wetness, which is the annual frequency of days with significantrainfall (rainy days with amounts of rain above 2.5 mm) [8]; and bw is the exponentof regression (mean value 0.446).
8.2.1.2 Chinese Code’s Model
Chinese code [10] proposed the following empirical model to predict the carbon-ation depth of concrete.
xcðtÞ ¼ 3KCO2 � Kk1 � Kkt � Kks � KF � T0:25 � RH1:5 � ð1� RHÞ � 58fcu;k
� 0:76� �
� ffiffit
p
ð8:9Þ
where KCO2 is the factor of CO2 concentration, KCO2 ¼ffiffiffiffiffiffiC00:03
q; C0 is the CO2
concentration by volume (%); Kk1 is the location factor, 1.4 for corner and 1.0 forother place; Kkt is the curing and casting factor, equals to 1.2; Kks is the stressfactor, 1.0 for compression and 1.1 for tension; T is the temperature (°C); RH is therelative humidity; KF is the fly ash replacement factor, KF ¼ 1:0þ 13:34F3:3; fcu;k isthe c value of cube compressive strength; and F is the fly ash replacementpercentage.
8.2.1.3 Zhang and Jiang’s Model
Based on the carbonation mechanism, Zhang and Jiang [11] proposed a mathe-matical model of carbonation depth for natural aggregate concrete (NAC).
xcðtÞ ¼ 839 � ð1� RHÞ1:1ffiffiffiffiffiffiffiffiffiffiffiffiffiffiffiffiffiffiffiffiffiffiffiffiffiffiffiffiffiffiffiffiffiffiW=ccC � 0:34
cHDccCn0
s� ffiffi
tp ð8:10Þ
where xcðtÞ is the carbonation depth of concrete at time t, in mm; W is the watercontent (kg/m3); C is the cement content (kg/m3); cc is the coefficient for cementtype (1.0 for Portland cement); cHD is the coefficient of the degree of hydration(0.85 for 28 days’ curing, 1.0 for 90 days’ curing); and n0 is the CO2 concentrationby volume.
260 8 Long-Term Property of Recycled Aggregate Concrete

The considered factors in the existing models are summarized in Table 8.7.From Table 8.7, it can be seen that considered factors are related to the mixture
proportion of specimen and environmental conditions. As for RAC, the replacementpercentage is an important factor in predicting the carbonation depth. Note: Pleaserefer to 8.2.2.5 for the detailed explanation of Xiao and Lei models.
8.2.2 Carbonation Test of RAC
8.2.2.1 Test Design
Cement used was ordinary Portland cement with grade of 42.5, see Table 8.8 forrecycled aggregates (RA); before mixing concrete, the RA were treated by soakingthem in water; natural aggregates particle size was 5–30 mm gravel; and fineaggregate was river sand. The classification between A and F in Table 8.9 showsthe w/c ratio, cement amount, RCA, mineral admixtures, RA replacement percen-tage, the influence of horizontal stress on the carbonation rate.
Table 8.7 Mostly considered factors in the existing models
Model w/c Cement strength Cement type fc tc R T RH CO2
fib Y Y Y – Y – – Y Y
Chinese code – – – Y Y – Y Y Y
Zhang and Jiang Y – Y – Y – – Y Y
Xiao and Lei a – – – Y – Y Y Y Y
Xiao and Lei b Y – Y – Y Y – Y Y
Table 8.8 The property of RCA
Type Property index
Originalconcretestrength
Mortaramount(%)
Bulkdensity(g/cm3)
Saturatedsurface drydensity (g/cm3)
Waterabsorptionrate (%)
Crushvalue(%)
1 C20 44.8 1.37 2.43 4.80 27.26
2 C30 40.4 1.38 2.45 4.70 23.77
3 C50 26.4 1.48 2.53 3.25 19.78
8.2 Carbonation Resistance Performance 261
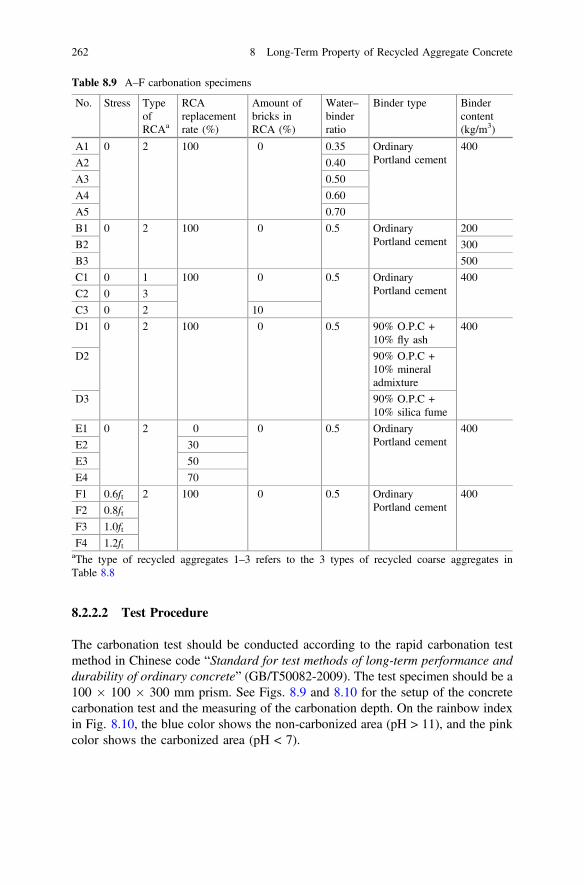
8.2.2.2 Test Procedure
The carbonation test should be conducted according to the rapid carbonation testmethod in Chinese code “Standard for test methods of long-term performance anddurability of ordinary concrete” (GB/T50082-2009). The test specimen should be a100 � 100 � 300 mm prism. See Figs. 8.9 and 8.10 for the setup of the concretecarbonation test and the measuring of the carbonation depth. On the rainbow indexin Fig. 8.10, the blue color shows the non-carbonized area (pH > 11), and the pinkcolor shows the carbonized area (pH < 7).
Table 8.9 A–F carbonation specimens
No. Stress TypeofRCAa
RCAreplacementrate (%)
Amount ofbricks inRCA (%)
Water–binderratio
Binder type Bindercontent(kg/m3)
A1 0 2 100 0 0.35 OrdinaryPortland cement
400
A2 0.40
A3 0.50
A4 0.60
A5 0.70
B1 0 2 100 0 0.5 OrdinaryPortland cement
200
B2 300
B3 500
C1 0 1 100 0 0.5 OrdinaryPortland cement
400
C2 0 3
C3 0 2 10
D1 0 2 100 0 0.5 90% O.P.C +10% fly ash
400
D2 90% O.P.C +10% mineraladmixture
D3 90% O.P.C +10% silica fume
E1 0 2 0 0 0.5 OrdinaryPortland cement
400
E2 30
E3 50
E4 70
F1 0.6ft 2 100 0 0.5 OrdinaryPortland cement
400
F2 0.8ftF3 1.0ftF4 1.2ftaThe type of recycled aggregates 1–3 refers to the 3 types of recycled coarse aggregates inTable 8.8
262 8 Long-Term Property of Recycled Aggregate Concrete
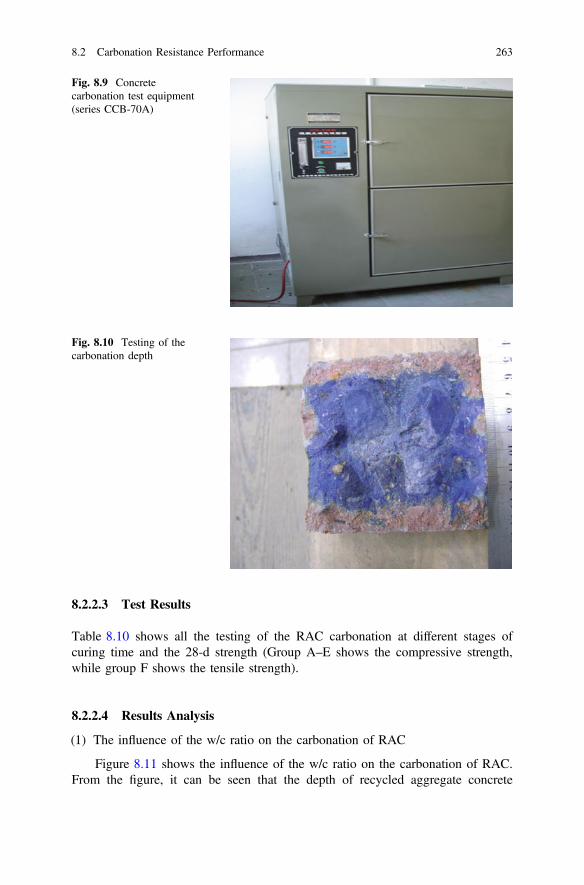
8.2.2.3 Test Results
Table 8.10 shows all the testing of the RAC carbonation at different stages ofcuring time and the 28-d strength (Group A–E shows the compressive strength,while group F shows the tensile strength).
8.2.2.4 Results Analysis
(1) The influence of the w/c ratio on the carbonation of RAC
Figure 8.11 shows the influence of the w/c ratio on the carbonation of RAC.From the figure, it can be seen that the depth of recycled aggregate concrete
Fig. 8.9 Concretecarbonation test equipment(series CCB-70A)
Fig. 8.10 Testing of thecarbonation depth
8.2 Carbonation Resistance Performance 263

carbonation increases with increase in w/c ratio, and after the w/c ratio passes 0.5,there is a rapid increase in the carbonation depth. This is coincident with Otsukiet al.’s test results [12]. The higher the w/c ratio, poorer the concrete’s compactness,faster the diffusion of CO2, deeper the carbonation depth has become.
(2) The influence of the cement on the carbonation depth
Figure 8.12 shows the influence of cement on the carbonation depth by main-taining the same w/c ratio and changing the amount of cement. From Fig. 8.12, itcan be seen that when the amount of cement used is small (less than 400 kg/m3), thecompressive strength of RAC increases with the increase in the amount of cement,and the carbonation depth decreases; when the amount of cement used is large(more than 400 kg/m3), the compressive strength of recycled concrete decreaseswith the increase in the cement amount, and the carbonation depth increases.The RAC compressive strength and carbonation are both inversely proportional tothe change in amount of cement. At the same w/c ratio, when the cement amountincreases, the concrete compactness and the strength grows larger, this slows down
Table 8.10 The recycled aggregate concrete carbonation and the 28-d compressive strength
No. Carbonation depth (mm) 28-dstrength(MPa)
No. Carbonation depth (mm) 28-dstrength(MPa)
7d 14d 28d 80d 7d 14d 28d 0d
A1 10.1 14.5 14.7 24.0 42.9 D1 14.7 18.4 23.1 34.7 27.2
A2 9.5 15.8 16.8 24.8 40.0 D2 7.3 17.2 29.2 45.2 32.0
A3 10.4 13.4 17.1 26.7 31.7 D3 6.3 20.8 25.8 38.5 32.2
A4 13.3 18.2 23.5 36.3 26.8 E1 10.1 12.9 16.5 21.2 27.8
A5 16.6 26.9 28.5 44.8 18.7 E2 9.5 13.1 17.0 22.9 34.0
B1 13.5 18.1 19.6 36.8 27.0 E3 12.2 17.2 22.0 33.8 32.2
B2 11.2 16.7 18.2 29.2 27.4 E4 16.2 23.5 26.0 41.7 33.9
B3 13.9 17.6 20.9 33.4 31.4 F1 21.0 3.5
C1 14.0 17.7 21.2 38.1 22.1 F2 23.6 3.5
C2 7.4 10.9 14.3 23.3 24.5 F3 26.3 3.5
C3 10.6 10.9 14.0 28.7 28.0 F4 28.6 3.5
0.35 0.40 0.45 0.50 0.55 0.60 0.65 0.7020
25
30
35
40
45
w/c
Car
bona
tion
dept
h (m
m)Fig. 8.11 Influence of the
w/c ratio on the carbonationdepth
264 8 Long-Term Property of Recycled Aggregate Concrete
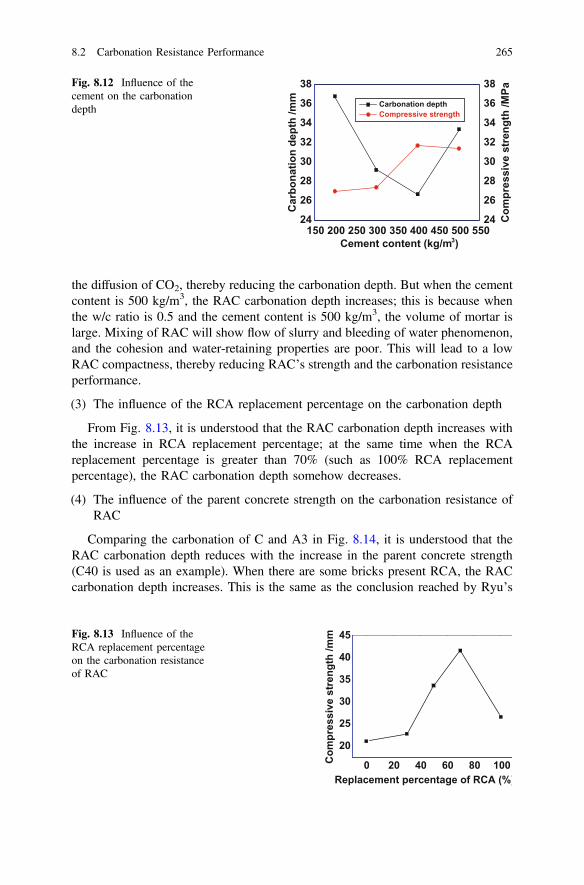
the diffusion of CO2, thereby reducing the carbonation depth. But when the cementcontent is 500 kg/m3, the RAC carbonation depth increases; this is because whenthe w/c ratio is 0.5 and the cement content is 500 kg/m3, the volume of mortar islarge. Mixing of RAC will show flow of slurry and bleeding of water phenomenon,and the cohesion and water-retaining properties are poor. This will lead to a lowRAC compactness, thereby reducing RAC’s strength and the carbonation resistanceperformance.
(3) The influence of the RCA replacement percentage on the carbonation depth
From Fig. 8.13, it is understood that the RAC carbonation depth increases withthe increase in RCA replacement percentage; at the same time when the RCAreplacement percentage is greater than 70% (such as 100% RCA replacementpercentage), the RAC carbonation depth somehow decreases.
(4) The influence of the parent concrete strength on the carbonation resistance ofRAC
Comparing the carbonation of C and A3 in Fig. 8.14, it is understood that theRAC carbonation depth reduces with the increase in the parent concrete strength(C40 is used as an example). When there are some bricks present RCA, the RACcarbonation depth increases. This is the same as the conclusion reached by Ryu’s
150 200 250 300 350 400 450 500 55024
26
28
30
32
34
36
38
24
26
28
30
32
34
36
38
Car
bo
nat
ion
dep
th /m
m Carbonation depthCompressive strength
Co
mp
ress
ive
stre
ng
th /M
Pa
Cement content (kg/m ) 3
Fig. 8.12 Influence of thecement on the carbonationdepth
0 20 40Replacement percentage of RCA (%)
Com
pres
sive
str
engt
h /m
m
60 80 100
20
25
30
35
40
45Fig. 8.13 Influence of theRCA replacement percentageon the carbonation resistanceof RAC
8.2 Carbonation Resistance Performance 265
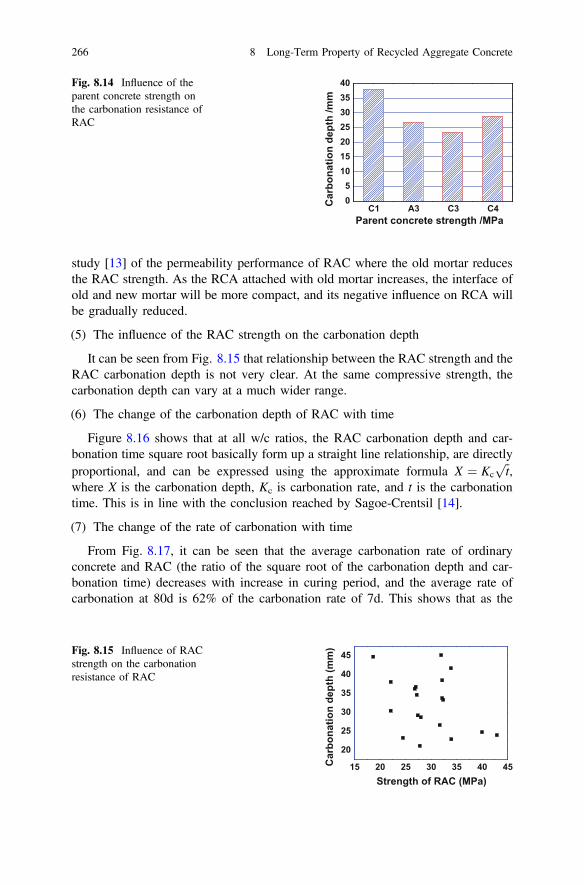
study [13] of the permeability performance of RAC where the old mortar reducesthe RAC strength. As the RCA attached with old mortar increases, the interface ofold and new mortar will be more compact, and its negative influence on RCA willbe gradually reduced.
(5) The influence of the RAC strength on the carbonation depth
It can be seen from Fig. 8.15 that relationship between the RAC strength and theRAC carbonation depth is not very clear. At the same compressive strength, thecarbonation depth can vary at a much wider range.
(6) The change of the carbonation depth of RAC with time
Figure 8.16 shows that at all w/c ratios, the RAC carbonation depth and car-bonation time square root basically form up a straight line relationship, are directlyproportional, and can be expressed using the approximate formula X ¼ Kc
ffiffit
p,
where X is the carbonation depth, Kc is carbonation rate, and t is the carbonationtime. This is in line with the conclusion reached by Sagoe-Crentsil [14].
(7) The change of the rate of carbonation with time
From Fig. 8.17, it can be seen that the average carbonation rate of ordinaryconcrete and RAC (the ratio of the square root of the carbonation depth and car-bonation time) decreases with increase in curing period, and the average rate ofcarbonation at 80d is 62% of the carbonation rate of 7d. This shows that as the
C1 A3 C3 C405
10152025303540
Car
bona
tion
dept
h /m
m
Parent concrete strength /MPa
Fig. 8.14 Influence of theparent concrete strength onthe carbonation resistance ofRAC
15 20 25 30 35 40 45
20
25
30
35
40
45
Car
bona
tion
dept
h (m
m)
Strength of RAC (MPa)
Fig. 8.15 Influence of RACstrength on the carbonationresistance of RAC
266 8 Long-Term Property of Recycled Aggregate Concrete

curing period increases, concrete compactness increases, leading to a reduction inthe diffusion of RAC.
(8) The effect of the horizontal stress on the carbonation depth
After considering that in actual engineering projects normally axial tensileloading is very limited, most cases are flexural tensile. Therefore the author set up atest as illustrated in Fig. 8.18, which shows the flexural tensile stress test specimen.The strain gauges were set up in the pure bending section of the screw and the
0 2 4 6
Time / d8 10
-505
101520253035404550
Car
bona
tion
dept
h /m
m
0.5
W/C=0.35W/C=0.4W/C=0.5W/C=0.6W/C=0.7
Fig. 8.16 Change of thecarbonation depth of RACwith time
7 14Time / d
Rel
ativ
e ra
te o
f Car
bona
tion
28
RACNAC
800.0
0.2
0.4
0.6
0.8
1.0
1.2Fig. 8.17 Change of the rateof carbonation of RAC withtime
Fig. 8.18 Loading set up of the specimen for flexural tensile test
8.2 Carbonation Resistance Performance 267

concrete specimens. A load was applied by using a spanner to screw up the nuts.The tensile stress produced by concrete was used as a standard for controlling andadjusting the external load by 0.6ft, 0.8ft, 1.0ft, 1.2ft (ft is the concrete specimen’stensile strength). After considering the screw’s stress relaxation and concrete’sshrinkage and creep, every specimen’s stress should only exceed the tensile stressby 3%, see Table 8.11.
The RAC carbonation depth under horizontal tensile stress is shown in Fig. 8.19and it can be observed that the carbonation depth increases under tensile stress.When the stress is 1.2, it increases by 60% compared to when there is no stressexerted. The inner RAC will form micro-cracks under tensile stress.
(9) The influence of the mineral admixtures on the carbonation depth
By comparing the carbonation depth of all the groups in series D with A3, (seeFig. 8.20), we found that if mineral admixtures are added into RAC, they actuallyhelp in increasing the carbonation depth. Adding mineral admixtures can reduce theporosity of inner concrete and help improve the interface between recycledaggregates and new mortar, but at the same time they also reduce the inner concretealkali amount, thereby increasing the carbonation rate.
This test results show that, when the mineral admixture amount replaced cementby 10%, the negative effect of the alkali reduction by the mineral admixture in RACexceeds its improvement of the compactness of the inner concrete, thereforereducing the carbonation resistance of RAC.
Table 8.11 The tensile status of the concrete specimen with actual applied load
Specimenno.
Tensilestress ft(MPa)
Appliedtensilestress ðrtÞ
Calculatedstrain ðleÞ
Measuredstrain ðleÞ
Calculatedstress(MPa)
Measuredstress(MPa)
F1 3.5 0.6 ft 95.5 98.4 2.1 2.16
F2 3.5 0.8 ft 127.3 131.1 2.8 2.88
F3 3.5 1.0 ft 159.1 163.9 3.5 3.71
F4 3.5 1.2 ft 190.9 196.6 4.2 4.33
0 0.6Relative level of tensile stress
Rel
ativ
e ra
te o
f car
bona
tion
0.8 1 1.20.00.20.40.60.81.01.21.41.61.8Fig. 8.19 Influence of the
stress level on the carbonationdepth
268 8 Long-Term Property of Recycled Aggregate Concrete

(10) The influence of the RCA on the carbonation depth discreteness
Statistics of the carbonation depth on the same cross-sectional area was carriedout, and the results are shown in Fig. 8.21. The standard deviation of RAC car-bonation depth increases with increase in w/c ratio, while the coefficient of variationdecreases with increase in w/c ratio; thus, RAC concrete carbonation depthincreases, the standard deviation increases, but the coefficient of variation decrea-ses. The influence of change in the recycled aggregates’ replacement percentage onRAC carbonation depth’s standard deviation and the coefficient of variation is notsignificant, but both reach higher values when the recycled aggregates’ replacementpercentage is 100%.
8.2.2.5 Xiao and Lei’s Model
In order to predict the carbonation depth of RAC, Xiao and Lei [15] modifiedZhang and Jiangs model and Chinese code’s model based on the experimentalresults as well as the collected 28 groups of experimental data. The modifiedprediction models are expressed by Eq. (8.11) (Xiao and Lei’s model a) andEq. (8.12) (Xiao and Lei’s model b).
A3 D1 D2 D305
1015202530354045
Car
bona
tion
dept
h (m
m)
Mineral admixtures
Fig. 8.20 Influence of themineral admixtures on thecarbonation depth
2.42.62.83.03.23.43.63.8
w/c
Stan
dard
dev
iatio
n /m
m
12
13
14
15
16
17
00.3 0.4 0.5 0.6 0.7 20 40 60 80 1002.2
2.3
2.4
2.5
2.6
2.7
2.8
Replacement percentage of RCA (%)
10
12
14
16
Coe
ffici
ent o
f var
iatio
n (%
)
Stan
dard
dev
iatio
n /m
m
Coe
ffici
ent o
f var
iatio
n (%
)
Fig. 8.21 Influence of the RCA on the carbonation depth standard deviation
8.2 Carbonation Resistance Performance 269

xcðtÞ ¼ KCO2 � Kk1 � Kks � T0:25 � RH1:5 � ð1� RHÞ � 230f RCcu
þ 2:5� �
� ffiffit
p ð8:11Þ
The values of variables in Eq. (8.11) are the same as that of the Chinese code’s
model except for KCO2 which is determined by KCO2 ¼ffiffiffiffiffiC00:2
q; f RCcu is the mean value
of RAC compressive strength.
xcðtÞ ¼ 839 � gRCð1� RHÞ1:1ffiffiffiffiffiffiffiffiffiffiffiffiffiffiffiffiffiffiffiffiffiffiffiffiffiffiffiffiffiffiffiffiffiffiW=ccC � 0:34
cHDccCn0
s� ffiffi
tp ð8:12Þ
The factors considered in this model are the same as that of Zhangs and Jiang’smodel. Here, gRC is the replacement percentage factor of RCA. For NAC, gRCequals to 1.0, while for RAC with a 100% replacement percentage of RCA, gRCis 1.5.
8.3 Chloride Diffusion Resistance Performance
8.3.1 Rapid Chloride Test (RCT)
8.3.1.1 RCT Testing Procedure
After the 28-day period of water curing using the immersed method [16], the100 � 100 � 100 mm. RAC cubes were placed and dried in oven with 105 °C.Then, all surfaces of the concrete specimen except one side were sealed by epoxyresin so that the chloride penetration could only take place in one direction. Theexposed surface was polished to prevent the influence of hardened cement paste onthe surface. The specimens were immersed in the deionized water for 5 days untilsaturation, and pure sodium chloride (specialized vocabulary denotes the purity ofsodium chloride) was then disposed into the deionized water. The 10% chloridesolution was stirred every week to maintain a uniform concentration. After thescheduled 235-day immersion period, the specimens were taken out from thechloride solution, and the surfaces of the specimens were cleaned using wet towelsto prevent the influence of crystallized salt. Additionally, four cubes with the samemix proportions were not immersed in chloride solution in order to test the initialchloride concentration.
To insure enough precision during sampling process, vertical spindle andceramic drills were used to drill and collect testing samples. The error of drillingdepth was controlled in the range from 0 to 0.1 mm using fine adjustments, and theresidue powder was extremely fine due to the use of ceramic drills (see Fig. 8.22).Powder was taken from more than 200 points by drilling, and the powder from 5 to
270 8 Long-Term Property of Recycled Aggregate Concrete
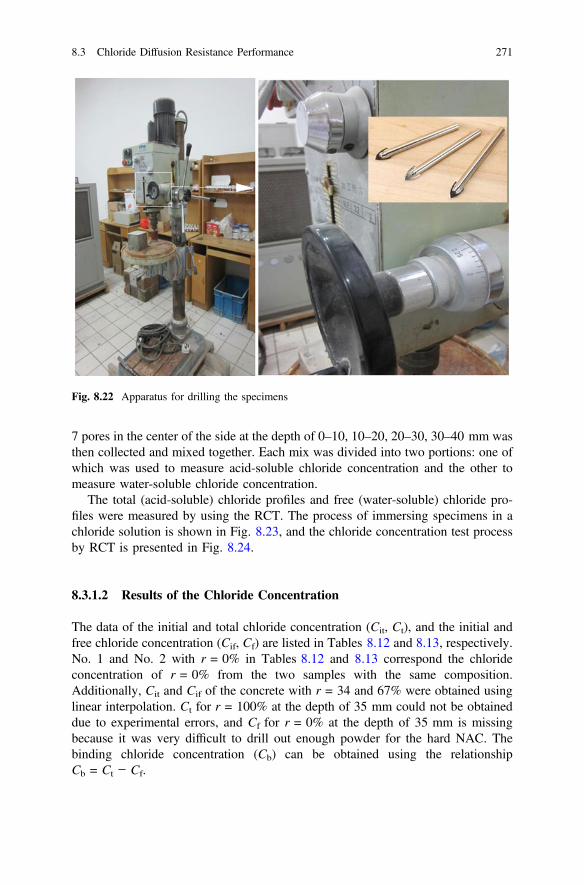
7 pores in the center of the side at the depth of 0–10, 10–20, 20–30, 30–40 mm wasthen collected and mixed together. Each mix was divided into two portions: one ofwhich was used to measure acid-soluble chloride concentration and the other tomeasure water-soluble chloride concentration.
The total (acid-soluble) chloride profiles and free (water-soluble) chloride pro-files were measured by using the RCT. The process of immersing specimens in achloride solution is shown in Fig. 8.23, and the chloride concentration test processby RCT is presented in Fig. 8.24.
8.3.1.2 Results of the Chloride Concentration
The data of the initial and total chloride concentration (Cit, Ct), and the initial andfree chloride concentration (Cif, Cf) are listed in Tables 8.12 and 8.13, respectively.No. 1 and No. 2 with r = 0% in Tables 8.12 and 8.13 correspond the chlorideconcentration of r = 0% from the two samples with the same composition.Additionally, Cit and Cif of the concrete with r = 34 and 67% were obtained usinglinear interpolation. Ct for r = 100% at the depth of 35 mm could not be obtaineddue to experimental errors, and Cf for r = 0% at the depth of 35 mm is missingbecause it was very difficult to drill out enough powder for the hard NAC. Thebinding chloride concentration (Cb) can be obtained using the relationshipCb = Ct − Cf.
Fig. 8.22 Apparatus for drilling the specimens
8.3 Chloride Diffusion Resistance Performance 271
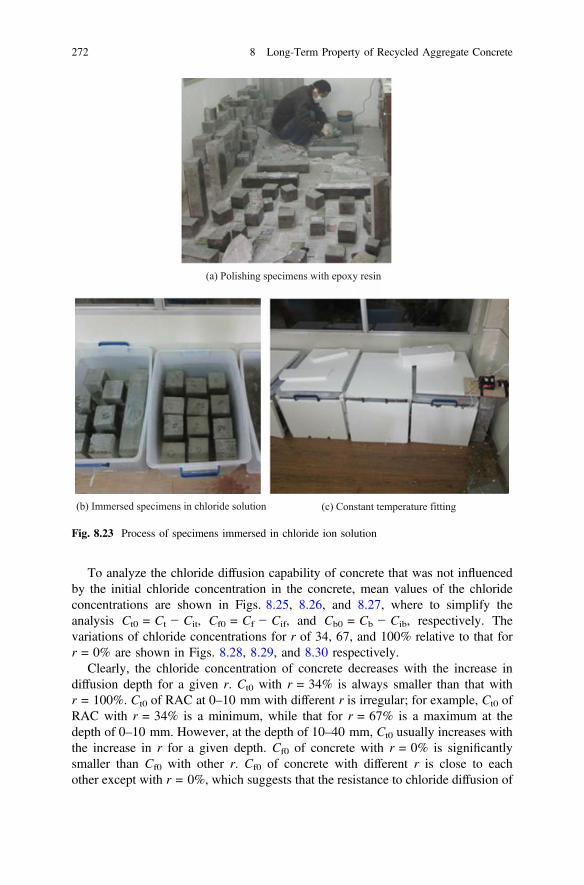
To analyze the chloride diffusion capability of concrete that was not influencedby the initial chloride concentration in the concrete, mean values of the chlorideconcentrations are shown in Figs. 8.25, 8.26, and 8.27, where to simplify theanalysis Ct0 = Ct − Cit, Cf0 = Cf − Cif, and Cb0 = Cb − Cib, respectively. Thevariations of chloride concentrations for r of 34, 67, and 100% relative to that forr = 0% are shown in Figs. 8.28, 8.29, and 8.30 respectively.
Clearly, the chloride concentration of concrete decreases with the increase indiffusion depth for a given r. Ct0 with r = 34% is always smaller than that withr = 100%. Ct0 of RAC at 0–10 mm with different r is irregular; for example, Ct0 ofRAC with r = 34% is a minimum, while that for r = 67% is a maximum at thedepth of 0–10 mm. However, at the depth of 10–40 mm, Ct0 usually increases withthe increase in r for a given depth. Cf0 of concrete with r = 0% is significantlysmaller than Cf0 with other r. Cf0 of concrete with different r is close to eachother except with r = 0%, which suggests that the resistance to chloride diffusion of
(a) Polishing specimens with epoxy resin
(b) Immersed specimens in chloride solution (c) Constant temperature fitting
Fig. 8.23 Process of specimens immersed in chloride ion solution
272 8 Long-Term Property of Recycled Aggregate Concrete
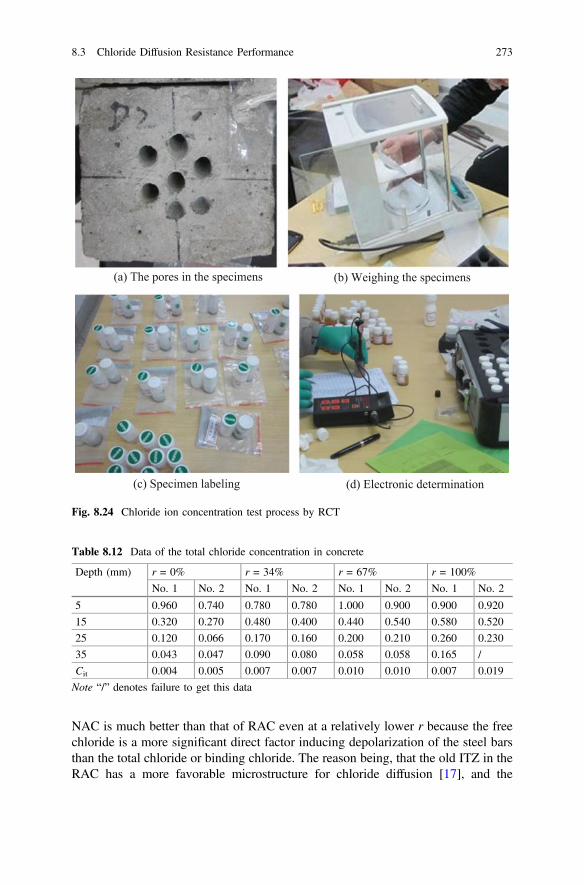
NAC is much better than that of RAC even at a relatively lower r because the freechloride is a more significant direct factor inducing depolarization of the steel barsthan the total chloride or binding chloride. The reason being, that the old ITZ in theRAC has a more favorable microstructure for chloride diffusion [17], and the
(a) The pores in the specimens (b) Weighing the specimens
(c) Specimen labeling (d) Electronic determination
Fig. 8.24 Chloride ion concentration test process by RCT
Table 8.12 Data of the total chloride concentration in concrete
Depth (mm) r = 0% r = 34% r = 67% r = 100%
No. 1 No. 2 No. 1 No. 2 No. 1 No. 2 No. 1 No. 2
5 0.960 0.740 0.780 0.780 1.000 0.900 0.900 0.920
15 0.320 0.270 0.480 0.400 0.440 0.540 0.580 0.520
25 0.120 0.066 0.170 0.160 0.200 0.210 0.260 0.230
35 0.043 0.047 0.090 0.080 0.058 0.058 0.165 /
Cit 0.004 0.005 0.007 0.007 0.010 0.010 0.007 0.019
Note “/” denotes failure to get this data
8.3 Chloride Diffusion Resistance Performance 273

content of the old ITZ between the original natural aggregate and old adhesivemortar decreased as r decreased for a given aggregate gradation, while the old ITZdisappeared in the NAC. As a result, the NAC has less ITZ than RAC even at smallvalues of r, and the NAC increases the resistance to chloride diffusion. The dif-ference between Cf0 of RAC with r = 34% and that with r = 100% becomes largewith increase in diffusion depth, while both values become smaller at the depth of30–40 mm. Values of Cb0 for concrete with different values of r are close to eachother, except when r = 34% near the boundary, and this is different from the case
Table 8.13 Data of the concrete free chloride concentration
Depth (mm) r = 0% r = 34% r = 67% r = 100%
No. 1 No. 2 No. 1 No. 2 No. 1 No. 2 No. 1 No. 2
5 0.230 0.320 0.320 0.420 0.350 0.450 0.370 0.390
15 0.100 0.090 0.150 0.190 0.210 0.225 0.215 0.210
25 0.035 0.016 0.070 0.056 0.070 0.056 0.160 0.070
35 / / 0.016 0.013 0.028 0.026 0.070 0.019
Cif 0.004 0.004 0.004 0.004 0.004 0.004 0.004 0.004
Note “/” denotes failure to get this data
Fig. 8.25 Variation of Ct0
along the diffusion depth
Fig. 8.26 Variation of Cf0
along the diffusion depth
274 8 Long-Term Property of Recycled Aggregate Concrete

of Ct0. The value of Cb0 of RAC with r = 34% is clearly smaller than the othervalues at depths of 0–10 mm. The reason for this may be that the powder used totest Cb contained more natural aggregate powder than the others and this is influ-enced by the aggregate position in concrete. At the diffusion depth of 10–20 mm,the Cb0 of RAC with r = 0% is the smallest value and that with r = 100% is thelargest, while the values of Cb0 for RAC with r = 34% and r = 67% are similar.
Fig. 8.27 Variation of Cb0
along the diffusion depth
Fig. 8.28 Variation of Ct0
with r = 34, 67 and 100%relative to that with r = 0%
Fig. 8.29 Variation of Cf0
with r = 34, 67 and 100%relative to that with r = 0%
8.3 Chloride Diffusion Resistance Performance 275
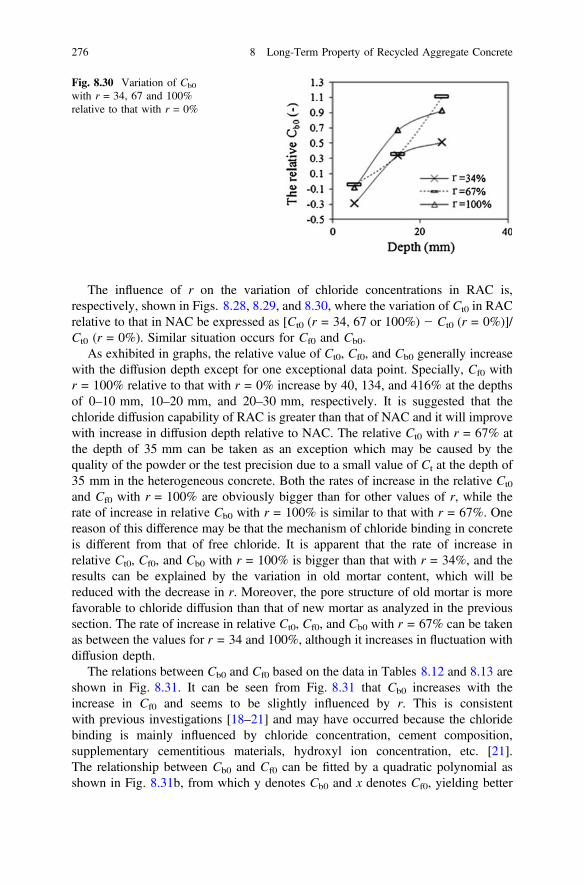
The influence of r on the variation of chloride concentrations in RAC is,respectively, shown in Figs. 8.28, 8.29, and 8.30, where the variation of Ct0 in RACrelative to that in NAC be expressed as [Ct0 (r = 34, 67 or 100%) − Ct0 (r = 0%)]/Ct0 (r = 0%). Similar situation occurs for Cf0 and Cb0.
As exhibited in graphs, the relative value of Ct0, Cf0, and Cb0 generally increasewith the diffusion depth except for one exceptional data point. Specially, Cf0 withr = 100% relative to that with r = 0% increase by 40, 134, and 416% at the depthsof 0–10 mm, 10–20 mm, and 20–30 mm, respectively. It is suggested that thechloride diffusion capability of RAC is greater than that of NAC and it will improvewith increase in diffusion depth relative to NAC. The relative Ct0 with r = 67% atthe depth of 35 mm can be taken as an exception which may be caused by thequality of the powder or the test precision due to a small value of Ct at the depth of35 mm in the heterogeneous concrete. Both the rates of increase in the relative Ct0
and Cf0 with r = 100% are obviously bigger than for other values of r, while therate of increase in relative Cb0 with r = 100% is similar to that with r = 67%. Onereason of this difference may be that the mechanism of chloride binding in concreteis different from that of free chloride. It is apparent that the rate of increase inrelative Ct0, Cf0, and Cb0 with r = 100% is bigger than that with r = 34%, and theresults can be explained by the variation in old mortar content, which will bereduced with the decrease in r. Moreover, the pore structure of old mortar is morefavorable to chloride diffusion than that of new mortar as analyzed in the previoussection. The rate of increase in relative Ct0, Cf0, and Cb0 with r = 67% can be takenas between the values for r = 34 and 100%, although it increases in fluctuation withdiffusion depth.
The relations between Cb0 and Cf0 based on the data in Tables 8.12 and 8.13 areshown in Fig. 8.31. It can be seen from Fig. 8.31 that Cb0 increases with theincrease in Cf0 and seems to be slightly influenced by r. This is consistentwith previous investigations [18–21] and may have occurred because the chloridebinding is mainly influenced by chloride concentration, cement composition,supplementary cementitious materials, hydroxyl ion concentration, etc. [21].The relationship between Cb0 and Cf0 can be fitted by a quadratic polynomial asshown in Fig. 8.31b, from which y denotes Cb0 and x denotes Cf0, yielding better
Fig. 8.30 Variation of Cb0
with r = 34, 67 and 100%relative to that with r = 0%
276 8 Long-Term Property of Recycled Aggregate Concrete

accuracy than the other fitting techniques such as exponential and power. Theaccuracy difference between the two equations is only (0.895 − 0.8859)/0.8859 = 0.01, which is reasonable to assume that the chloride binding in RACsatisfies linear isotherm.
Cb0 ¼ 1:2908Cf0 þ 0:0452 ð8:13Þ
This equation is different from Langmuir isotherm and Freundlich isothermstudied by Martin-Perez et al. [22] but similar to Ref. [18]. This may be because ofthe different testing methods. For example, similar to Ref. [18], the RCT equipmentis used to directly test the chloride concentration in the concrete powder, which isdifferent from the method that estimated the bound chloride from the decrease in thechloride concentration of external solutions [23].
The chloride binding capability of the NAC is usually higher than that of RACexcept at an exceptional point for r = 34% at the depth of 35 mm as shown in
(a) The variation of Cb0 with Cf0 (b) The fitting of Cb0 with Cf0
(c) The chloride binding capability (d) The fitting of chloride bindingcapability
Fig. 8.31 Chloride ion binding capability of RAC
8.3 Chloride Diffusion Resistance Performance 277

(a) R=0% (b) R=34%
(c) R=67% (d) R=100%
Fig. 8.32 Three types of chloride ion concentration distribution in the concrete
Fig. 8.31c. The reason for this is that the chloride concentration in NAC is usuallysmaller than that in RAC. The smaller the Cf0 is, the stronger the chloride bindingcapability is, as shown in Fig. 8.31d. The chloride binding capability generallydecreases with an increase in Cf0, and this fact can also be verified using thetheoretical equations of Langmuir isotherm and Freundlich isotherm [22].
In comparing the three types of chloride concentrations for a given type ofspecimens, Ct0, Cf0, and Cb0 are compared as shown in Fig. 8.32.
As can be seen from the figures, Cb0 is generally bigger than Cf0 for a givendepth with the same mixture proportion. The difference between Cb0 and Cf0 inconcrete with r = 0% decreases with the increase in diffusion depth, which isdifferent from that with r = 34, 67, and 100%. Specially, Cb0 and Cf0 of RAC withr = 34% are close to each other at the depths of 0–10 mm and 20–30 mm than atother locations; Cb0 and Cf0 in RAC with r = 67% are close to each other at a depthof 10–20 mm and 30–40 mm than at the other places; and Cb0 and Cf0 in RAC withr = 100% are close to each other at the depths of 20–30 mm than at the otherplaces. The results suggest that the chloride binding capability characteristics ofRAC are not as obvious as NAC. In comparison with the NAC, there is oldadhesive mortar and old ITZ in RAC in the micro-mesoscope. The distribution israndom in concrete, and the content of the new mortar and old mortar in the powderof RAC used for testing chloride concentration is more scattered than that of NAC.Additionally, the chloride binding capability of the new mortar differs from that ofold mortar due to the different pore structures as shown in the last section. As aresult, the chloride binding capability of RAC shows more scattered patterns thanthat of NAC. Therefore, it is suggested that the old mortar content in RCA shouldbe determined with a quantitative analysis, which can then be further studied.
278 8 Long-Term Property of Recycled Aggregate Concrete

8.3.1.3 Verification and Prediction of the Chloride Diffusion in RAC
(1) Parameter calibration
To predict the chloride concentration distribution in concrete, the chloride diffu-sivities of concrete with back-analysis based on Fick’s second law should firstly bedetermined. With a 235-day immersed period, the free chloride concentration atboundary (Csf) and apparent diffusion coefficient (D�
c ) can be obtained by fitting thefree chloride concentration data in Fig. 12 by using Eq. (8.14), see Fig. 8.33.
Cfðx; tÞ ¼ Cfs � Cifð Þ 1� erfx
2ffiffiffiffiffiffiffiD�
c tp
!" #ð8:14Þ
(2) Experimental verification
The distributions of Cf, Cb, and Ct with diffusion depth are shown in Fig. 8.34,in which the points are the test data by RCT, while the lines are the theoreticalequations.
It can be seen from these figures that the experimental and theoretical values forchloride diffusivity are generally in agreement, which implies that the chloridetransport into concrete in these experiments is in line with the Fick’s second law.The chloride binding equation obtained by fitting test data is also appropriate.
Fig. 8.33 Fitting curve of free chloride ion concentration
8.3 Chloride Diffusion Resistance Performance 279

8.3.2 Rapid Chloride Migration (RCM) Test
8.3.2.1 Experimental Program
This study considers concrete as a composite material in which inclusions (coarseaggregate) are embedded in a continuous matrix (mortar), and both phases interactthrough the ITZ. Without any loss of generality, a representative model with fouradjacent coarse aggregate is supposed to be taken from a semi-infinite RAC bodywith its low surface exposed to a chloride-containing medium as shown inFig. 8.35, from which the origin of the coordinates is located at the bottom leftcorner. If the variation of aggregate and old mortar shape is not considered, only therelative position of recycled aggregate is concerned, and one type of aggregateshape and thickness of old adhered mortar are selected for this study. Consideringthe current experimental situation, the rectangular modeled aggregate is easier toprocess than the circular one. Therefore, a rectangular aggregate type withdimensions of 26 � 18 mm is selected to be as RCA and NCA in RAC. Thethickness of old mortar value varies in large range based on the aggregate diameter;
CCtCbCf
CfCbCt
CtCfCb
(c) The Cf, Cb and Ct distribution with r=67% (d) The Cf, Cb and Ct distribution with r=100%
(a) The Cf, Cb and Ct distribution with r=0% (b) The Cf, Cb and Ct distribution with r=34%
CfCbCt
CtCbCf
CtCbCf
CfCbCt
CfCbCt
Fig. 8.34 Three types of chloride ion concentration distribution in the concrete
280 8 Long-Term Property of Recycled Aggregate Concrete

for example, some aggregate only contains mortar, while others contain differentcontents of old cement mortar. There is no statistic value about the thickness of oldmortar at present. Therefore, the thickness of the old attached mortar is selected as5 mm which is in the range of real mortar thickness. The net horizontal distancebetween aggregate is 10 mm. The net vertical distance between aggregate is15 mm. The net distance between aggregate and the bottom, vertical edge, andupper edge is 2, 19 and 6 mm, respectively.
There are two columns and two rows of coarse aggregate in the modeled con-crete. The recycled aggregate replacement rate by volume (RRAv) of 0% (100%)corresponds to all natural (recycled) coarse aggregate in the modeled concrete, andRRAv of 50% corresponds to the modeled concrete containing two RCA and twoNCA. According to the mathematical combination, there are four different aggre-gate arrangements which affect the overall chloride transmission rate in the RAC.For example, RCA50%-11–12 denotes the two recycled aggregates located in row 1column 1 and row 1 column 2, respectively, with RRAv of 50% in the modeledconcrete. Similarly, three other combinations with RRAv of 50% are RCA50%-21–22, RCA50%-11–21, and RCA50%-11–22.
Mixture ratios of the old and new mortar are listed in Table 8.14, and the sandused in the new mortar containing about 3.6% of water and the water-reducingagent is a polycarboxylate superplasticizer.
Firstly, black granite bars with 500 mm (long) � 16 mm (width) � 8 mm(height) are prepared, which can be set in a wooden mold with the net spacing of14 mm side by side. The granites have 5 mm from the upper and lower edges in themold; the mortar (old mortar-1 and old mortar-2 in Table 8.14) is cast into the moldand vibrated by a modified vibrator (see Fig. 8.36a). After cured under standardconditions for 28 days, a diamond saw is used to cut (kerf width is 4 mm) along thecenterline of the granite gap; then, the modeled RCA with the section size of26 � 18 mm is obtained. Similarly, the modeled NCA with same size obtained
New mortar
Old mortarNatural aggregateFig. 8.35 Modeled RACcontaining modeled RCA andNCA
Table 8.14 The new and old mortar proportions
Series Cement Water Sand Age (days) Vibrating situation
New mortar 1 0.35 1.64 110–123 Slightly vibration
Old mortar-1 0.40 3.50 341–354 Fully vibration
Old mortar-2 0.67
8.3 Chloride Diffusion Resistance Performance 281

with red granite bars is taken as the modeled NCA for differentiation. Secondly, themodeled RCA and NCA are placed in a mold in accordance with a certain order,which are casted with mortar (new mortar in Table 8.14) with minor vibrations (seeFig. 8.36b). Cylindrical modeled RAC samples with 100 mm in diameter and60 mm in height are obtained by drilling core samples after cured with water; threesamples are prepared for each batch (see Fig. 8.36c) and the surface of the hardenedcement paste are polished with emery cloth.
Figure 8.36d presents a RCA three-dimensional rendering, taking half forillustration according to the symmetry. The RCM method of concrete test is pro-posed by DruaCrete [24], Build NordTest [25], and CCES01-2004 [26]. Previousresearch [27] indicated that for equal concrete compositions, chloride diffusioncoefficient DRCM,0 shows strong statistical correlation with effective diffusioncoefficients. Therefore, the RCM test is proposed to determine chloride diffusioncoefficients of the modeled RAC.
According to CCES01-2004 [26], apparent chloride diffusivity of the modeledRAC is tested using RCM (see Fig. 8.37a, b). After the test, the specimen is splitinto two pieces, one of which is immediately sprayed with 5% solution of silvernitrate (see Fig. 8.37c, d).
(a) Modelled RCA production process (b) The placing of the modelled RCA and NCA
(c) The modelled RAC (d) The half of the three-dimensional map of the
modelled RAC
Fig. 8.36 Modeled RAC production process
282 8 Long-Term Property of Recycled Aggregate Concrete

The calculation of the rapid migration coefficient with chloride for the test isperformed according to the analytical derivation in Eqs. (8.15) and (8.16) [26]:
DRCM;0 ¼ 2:872� 10�6 Thðxd � affiffiffiffiffixd
p Þt
ð8:15Þ
a ¼ 3:338� 10�3ffiffiffiffiffiffiTh
pð8:16Þ
where DRCM,0 is the chloride migration coefficient (m2/s); T is the average tem-perature (°C) of electrolyte at initial and final tests; h is the specimen height (mm);xd is the diffusion depth of chloride (mm); and t is the power continuous time (h).
8.3.2.2 Test Results and Discussions
The average chloride diffusivities of three specimens in each modeled RAC areshown in Table 8.15, from which the chloride diffusivity of the modeled RACincreases with the increase in RRAv. For the same RRAv, the chloride content
Rubber sleeveInside diameter 100
high 150-170Solution KOH
Anode plate
StrapSpecimen
Cathode Plate
Solution KOH+Cl-
StrapBraciNg (High
Though
Holder
(a) RCM detector diagram (b) RCM testing process
(c) The splitting of the modelled RAC (d) The modelled RAC section after spraying silver nitrate
Fig. 8.37 RCM testing
8.3 Chloride Diffusion Resistance Performance 283

distribution of the modeled RAC, reflected by the color of silver chloride, is stilldifferent due to the effect of different combinations of the modeled RCA and NCA.For the four types of combinations with the same RRAv of 0.5, the maximumchloride diffusivity corresponding to the two modeled RCA in the bottom is about12.6 � 10−6 mm/s. The difference of chloride diffusivities with the differentaggregate combination of RRAv of 0.5 is about 32% but the difference of chloridediffusivities among the three pieces of the same specimens is less than 10%.Therefore, it is necessary to consider the influence of aggregate combinations on thechloride diffusivity variation.
To further study the influence of aggregate combinations on the chloride dif-fusivity, the depth of color variation after spraying 5% solution of silver nitrate isconsidered in the following analysis. Some specimens are approximately markedwith a flow direction arrow to identify the correct orientation as shown in Fig. 8.38.The color of different specimens might be slightly varied, since the time andconcentration of spraying solution show a bit difference.
It can be seen from Fig. 8.38a–f that the chloride migration is solely carried outinwards to the modeled RAC, while possible local transverse migrations due to thepresence of structural heterogeneity are rather limited and confined within thedimension of the rectanglar specimen’s long side in this experiment, which issimilar to the study performed by Zeng [28] and Xiao et al. [29]. When the chloridemigration comes in contact with modeled NCA, which is very difficult to permeate(see Fig. 8.38a–d), the chloride migration is seen to surround the NCA. When thechloride migration comes in contact of the modeled RCA, chloride is permeatedinto the old mortar and ITZ of the RCA, while the original NCA in the modeledRCA is still difficult to permeate (see Fig. 8.38c–h). The new NCA and the originalNCA can resist the chloride permeability, while the old mortar and the new mortarcannot.
Table 8.15 The chloride diffusivity by the RCM (10−6 mm/s)
Specimens Chloride diffusivity Mixture ratios of old mortar in RCA The number of modeled RCA
RA0% 6.12 Old mortar-1 4
RCA50%-11–12 9.57 Old mortar-1 4
RCA50%-11–22 11.1 Old mortar-1 4
RCA50%-21–22 12.6 Old mortar-1 4
RCA50%-11–21 11.3 Old mortar-1 4
RCA100% 13.0 Old mortar-1 4
New mortar 14.8 – 0
Old mortar-1 9.57 – 0
Old mortar-2 18.0 – 0
RCA old mortar-1 11.0 Old mortar-1 1
RCA old mortar-2 14.0 Old mortar-2 1
Virgin aggregate – – –
284 8 Long-Term Property of Recycled Aggregate Concrete
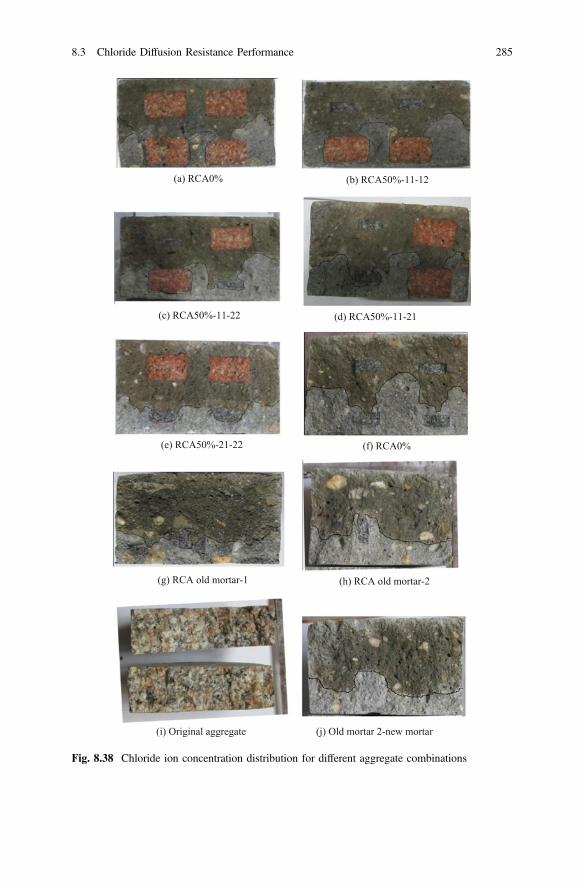
(a) RCA0% (b) RCA50%-11-12
(c) RCA50%-11-22 (d) RCA50%-11-21
(e) RCA50%-21-22 (f) RCA0%
(g) RCA old mortar-1 (h) RCA old mortar-2
(i) Original aggregate (j) Old mortar 2-new mortar
Fig. 8.38 Chloride ion concentration distribution for different aggregate combinations
8.3 Chloride Diffusion Resistance Performance 285

There is only one modeled RCA in Fig. 8.38g, h, and the chloride diffusivity ofthe old mortar is smaller than that of the new mortar in Fig. 8.38g, in contrast to thatprovided in Fig. 8.38h. The chloride distribution in the modeled RAC seemsnon-uniform (see Fig. 8.38h). There is higher chloride concentration near the oldITZ than that near the new ITZ; maybe the permeability of the old ITZ is higherthan that of the new ITZ. The ITZ between the original aggregate and the old mortarseems weaker than that between the old adhered mortar and the new mortar, basedon the principle of dissolution in similar material structures. This may be due to thefact that the new and the old mortars are easier to integrate with each other with theincrease in hydration degree, while the NCA is more difficult to integrate.
Natural granites with the thickness of about 30 mm are split into two halves aftertesting for 40 h, one of which is sprayed with 5% solution of silver nitrate as shownin Fig. 8.38i, which shows that there is no significant difference between colors ofthe two pieces. Therefore, it is reasonable to assume that the chloride diffusivity ofthe NCA is rather small, while other types of aggregate properties (such as light-weight aggregate) are different from that of the NCA. In Fig. 8.38j, the modeledRCA is composed of the old mortar, and the chloride diffusivity of the old mortar-2is given in Table 8.15. It can be seen from Fig. 8.38j that the depth of chloridepermeation into the old mortar is higher than the new mortar.
8.4 Fatigue Behavior
8.4.1 Fatigue Testing
All the fatigue tests were carried out using an MTS fatigue test machine after thespecimens were cured for six months at room temperature. The cyclic loading insinusoid wave form was selected. Figure 8.41a shows the testing apparatus forcompression tests. For the uniaxial compressive tests, the minimum fatigue loadingstress was a constant fmin ¼ 0:1f 0c ¼ 4:6MPa, and the maximum stress fmax ¼ Sf 0c ,where the stress level S varies from 0.65 to 0.85. In the four-point bending fatiguetests, the stress levels S = 0.6, 0.7, and 0.8 and the stress ratios (i.e., fmin/fmax) 0.15,0.35, and 0.55 were used in the bottom surface of the tension zone in the center.The loading frequency was 10 Hz for all the fatigue tests.
To eliminate the loading eccentricity in uniaxial compressive tests, the specimenwas first placed roughly at the center of the machine. A static load was then appliedand the strains on the four vertical sides of the specimen were recorded, as shown inFig. 8.39b. The specimen’s position was gradually adjusted until all the verticalstrains were approximately the same. The load control was used during both thecompressive and bending fatigue tests, and residual strain and fatigue strain weremeasured and recorded at certain number of fatigue cycles, such as five thousandsfor high stress level or twenty thousand for low stress level [30].
286 8 Long-Term Property of Recycled Aggregate Concrete

8.4.2 Compressive Fatigue Test Results and Analysis
8.4.2.1 Testing Phenomena
Table 8.16 summarizes the fatigue results of 15 specimens under uniaxial com-pressive cyclic loading, and Fig. 8.39c shows a typical failed specimen. It wasobserved that the progressive development of cracks as the number of loading cycleN increases is similar to that under the static loading conditions. Only a few vertical
(a) MTS machine (b) strain gauges (c) fatigue failure
Fig. 8.39 Compressive fatigue tests
Table 8.16 Results of compression fatigue tests
Specimen number Stress level (S = fmax/f 0c ) Stress ratio (fmin/fmax) Fatigue life (Nf)
fp-a1 0.85 0.12 40,920
fp-a2 19,407
fp-a3 2490
fp-b1 0.80 0.13 87,506
fp-b2 70,688
fp-b3 38,145
fp-c1 0.75 0.13 81,825
fp-c2 76,564
fp-c3 455,978
fp-d1 0.70 0.14 226,759
fp-d2 85,402
fp-d3 705,713
fp-e1 0.65 0.15 3,000,000a
fp-e2 3,000,000a
fp-e3 3,000,000a
aSpecimen has not been destroyed after three million fatigue loading
8.4 Fatigue Behavior 287
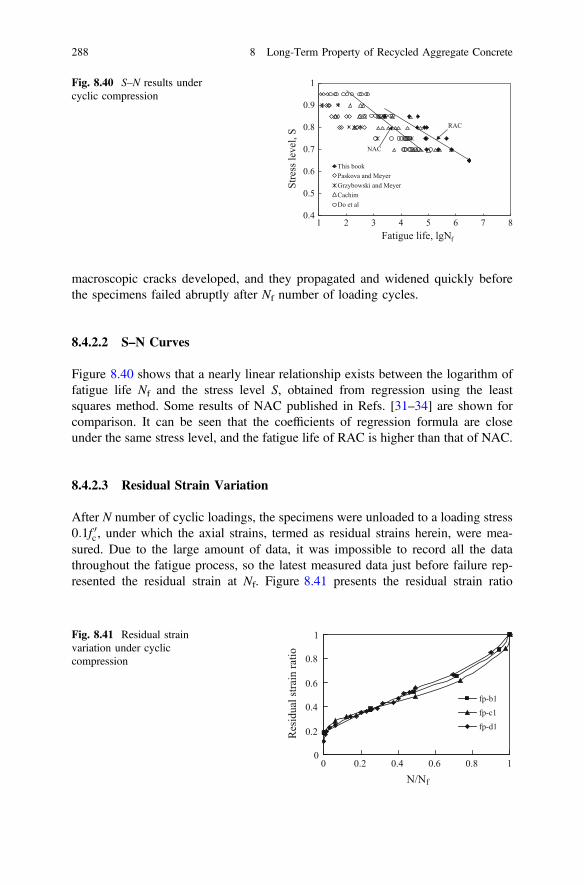
macroscopic cracks developed, and they propagated and widened quickly beforethe specimens failed abruptly after Nf number of loading cycles.
8.4.2.2 S–N Curves
Figure 8.40 shows that a nearly linear relationship exists between the logarithm offatigue life Nf and the stress level S, obtained from regression using the leastsquares method. Some results of NAC published in Refs. [31–34] are shown forcomparison. It can be seen that the coefficients of regression formula are closeunder the same stress level, and the fatigue life of RAC is higher than that of NAC.
8.4.2.3 Residual Strain Variation
After N number of cyclic loadings, the specimens were unloaded to a loading stress0:1f 0c , under which the axial strains, termed as residual strains herein, were mea-sured. Due to the large amount of data, it was impossible to record all the datathroughout the fatigue process, so the latest measured data just before failure rep-resented the residual strain at Nf. Figure 8.41 presents the residual strain ratio
0.4
0.5
0.6
0.7
0.8
0.9
1
1 2 3 4 5 6 7 8
Stre
ss le
vel,
S
Fatigue life, lgNf
This bookPaskova and MeyerGrzybowski and MeyerCachimDo et al
RAC
NAC
Fig. 8.40 S–N results undercyclic compression
0
0.2
0.4
0.6
0.8
1
0 0.2 0.4 0.6 0.8 1
N/Nf
Res
idua
l stra
in ra
tio
fp-b1
fp-c1
fp-d1
Fig. 8.41 Residual strainvariation under cycliccompression
288 8 Long-Term Property of Recycled Aggregate Concrete
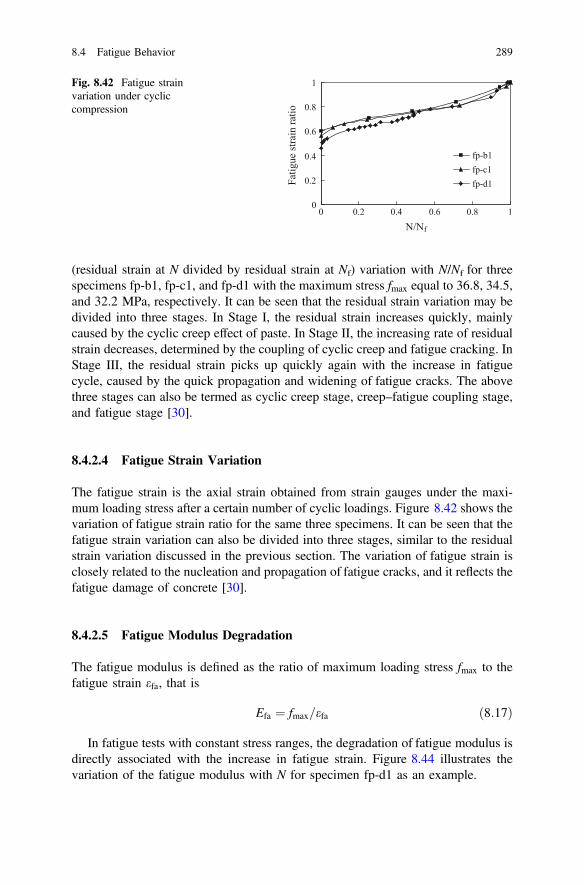
(residual strain at N divided by residual strain at Nf) variation with N/Nf for threespecimens fp-b1, fp-c1, and fp-d1 with the maximum stress fmax equal to 36.8, 34.5,and 32.2 MPa, respectively. It can be seen that the residual strain variation may bedivided into three stages. In Stage I, the residual strain increases quickly, mainlycaused by the cyclic creep effect of paste. In Stage II, the increasing rate of residualstrain decreases, determined by the coupling of cyclic creep and fatigue cracking. InStage III, the residual strain picks up quickly again with the increase in fatiguecycle, caused by the quick propagation and widening of fatigue cracks. The abovethree stages can also be termed as cyclic creep stage, creep–fatigue coupling stage,and fatigue stage [30].
8.4.2.4 Fatigue Strain Variation
The fatigue strain is the axial strain obtained from strain gauges under the maxi-mum loading stress after a certain number of cyclic loadings. Figure 8.42 shows thevariation of fatigue strain ratio for the same three specimens. It can be seen that thefatigue strain variation can also be divided into three stages, similar to the residualstrain variation discussed in the previous section. The variation of fatigue strain isclosely related to the nucleation and propagation of fatigue cracks, and it reflects thefatigue damage of concrete [30].
8.4.2.5 Fatigue Modulus Degradation
The fatigue modulus is defined as the ratio of maximum loading stress fmax to thefatigue strain efa, that is
Efa ¼ fmax=efa ð8:17Þ
In fatigue tests with constant stress ranges, the degradation of fatigue modulus isdirectly associated with the increase in fatigue strain. Figure 8.44 illustrates thevariation of the fatigue modulus with N for specimen fp-d1 as an example.
0
0.2
0.4
0.6
0.8
1
0 0.2 0.4 0.6 0.8 1
N/Nf
Fatig
ue st
rain
ratio
fp-b1fp-c1fp-d1
Fig. 8.42 Fatigue strainvariation under cycliccompression
8.4 Fatigue Behavior 289

The fatigue damage is defined as
D ¼ 1� ðEfa=E0Þ ð8:18Þ
where E0 is the initial modulus of elasticity.Figure 8.44 shows the variation of the fatigue damage D with the increase in
fatigue load cycles for specimen fp-d1.
8.4.2.6 Stress–Strain Curves
During fatigue testing, axial stress–strain curves were recorded at certain fatiguecycles. Some examples for specimen fp-b1 with stress level S = 0.8 are shown inFig. 8.45. As N increases, the stress–strain curves move toward the right, that is, theplastic strain becomes higher. The stress–strain curves under quasi-static loading–unloading tests with fmax = 36.8 MPa and loading rate 0.5 MPa/s for the samespecimen are shown in Fig. 8.46 for comparison. It can be seen that the strength isloading rate dependent, and the dynamic strength in the fatigue tests is higher thanthe static strength. Figure 8.47 shows the relations between fatigue axial stress andtransverse strain. It can be seen that as N increases, the transverse strain increases,
5
10
15
20
25
30
0 0.2 0.4 0.6 0.8 1N/Nf
Fatig
ue M
odul
us (G
pa)
Fig. 8.43 Fatigue modulusdegradation under cycliccompression
0.2
0.3
0.4
0.5
0.6
0.7
0 0.2 0.4 0.6 0.8 1N/Nf
Fatig
ue d
amag
e
D ( / )fc0.2D N N=
Fig. 8.44 Fatigue damageevolution under cycliccompression
290 8 Long-Term Property of Recycled Aggregate Concrete

indicating that the damage increases caused by the transverse deformation.Figure 8.48 shows the relations between the fatigue axial stress and the volumetricstrain. As N increases, the volumetric strain increases, indicating that the RACexperiences dilatation when it is damaged and cracked under fatigue loading.Figure 8.49 shows that the Poisson’s ratio increases as N increases, indicating thatthe axial strain increases slower than the transverse strain.
1820222426283032343638
900 1100 1300 1500 1700 1900Strain (uε)
Stre
ss (M
Pa)
N=618000
N=721000N=1042444
Fig. 8.45 Fatigue stress–strain relationship forspecimen fp-b1 with S = 0.8under cyclic compression
05
10152025303540
0 500 1000 1500 2000
Stre
ss (M
Pa)
Strain (uε)
N=618000
N=721000
N=1042444
Fig. 8.46 Static stress–strainrelationship for specimenfp-b1 with fmax = 36.8 MPaafter cyclic compression
0
5
10
15
20
25
30
35
0 100 200 300 400 500
Stre
ss (M
Pa)
Strain (uε)
N=0N=5000N=11174
Fig. 8.47 Axial stress–transverse strain curves undercyclic compression
8.4 Fatigue Behavior 291
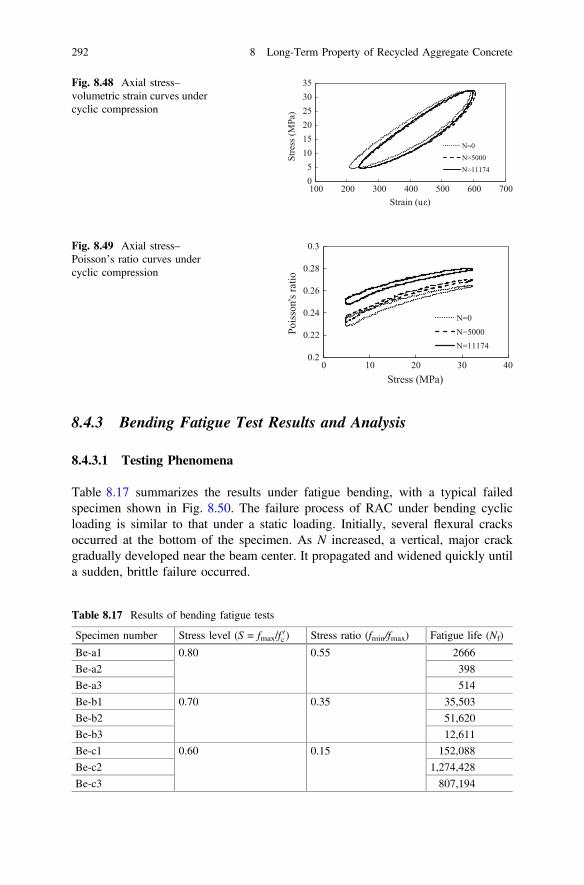
8.4.3 Bending Fatigue Test Results and Analysis
8.4.3.1 Testing Phenomena
Table 8.17 summarizes the results under fatigue bending, with a typical failedspecimen shown in Fig. 8.50. The failure process of RAC under bending cyclicloading is similar to that under a static loading. Initially, several flexural cracksoccurred at the bottom of the specimen. As N increased, a vertical, major crackgradually developed near the beam center. It propagated and widened quickly untila sudden, brittle failure occurred.
05
101520253035
100 200 300 400 500 600 700
Stre
ss (M
Pa)
Strain (uε)
N=0N=5000N=11174
Fig. 8.48 Axial stress–volumetric strain curves undercyclic compression
0.2
0.22
0.24
0.26
0.28
0.3
0 10 20 30 40
Pois
son'
s rat
io
Stress (MPa)
N=0N=5000N=11174
Fig. 8.49 Axial stress–Poisson’s ratio curves undercyclic compression
Table 8.17 Results of bending fatigue tests
Specimen number Stress level (S = fmax/f 0c ) Stress ratio (fmin/fmax) Fatigue life (Nf)
Be-a1 0.80 0.55 2666
Be-a2 398
Be-a3 514
Be-b1 0.70 0.35 35,503
Be-b2 51,620
Be-b3 12,611
Be-c1 0.60 0.15 152,088
Be-c2 1,274,428
Be-c3 807,194
292 8 Long-Term Property of Recycled Aggregate Concrete
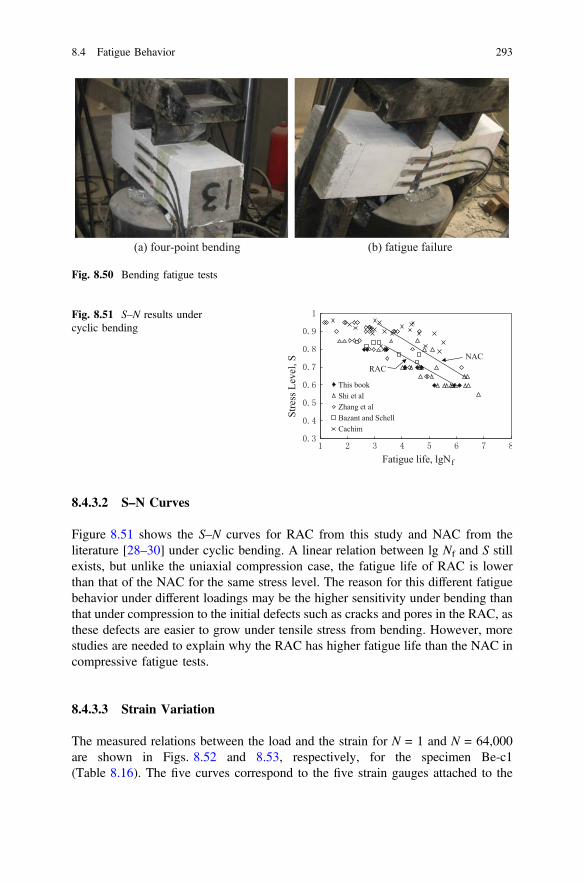
8.4.3.2 S–N Curves
Figure 8.51 shows the S–N curves for RAC from this study and NAC from theliterature [28–30] under cyclic bending. A linear relation between lg Nf and S stillexists, but unlike the uniaxial compression case, the fatigue life of RAC is lowerthan that of the NAC for the same stress level. The reason for this different fatiguebehavior under different loadings may be the higher sensitivity under bending thanthat under compression to the initial defects such as cracks and pores in the RAC, asthese defects are easier to grow under tensile stress from bending. However, morestudies are needed to explain why the RAC has higher fatigue life than the NAC incompressive fatigue tests.
8.4.3.3 Strain Variation
The measured relations between the load and the strain for N = 1 and N = 64,000are shown in Figs. 8.52 and 8.53, respectively, for the specimen Be-c1(Table 8.16). The five curves correspond to the five strain gauges attached to the
(a) four-point bending (b) fatigue failure
Fig. 8.50 Bending fatigue testsSt
ress
Lev
el, S
Fatigue life, lgNf
This bookShi et alZhang et alBazant and SchellCachim
RACNAC
Fig. 8.51 S–N results undercyclic bending
8.4 Fatigue Behavior 293
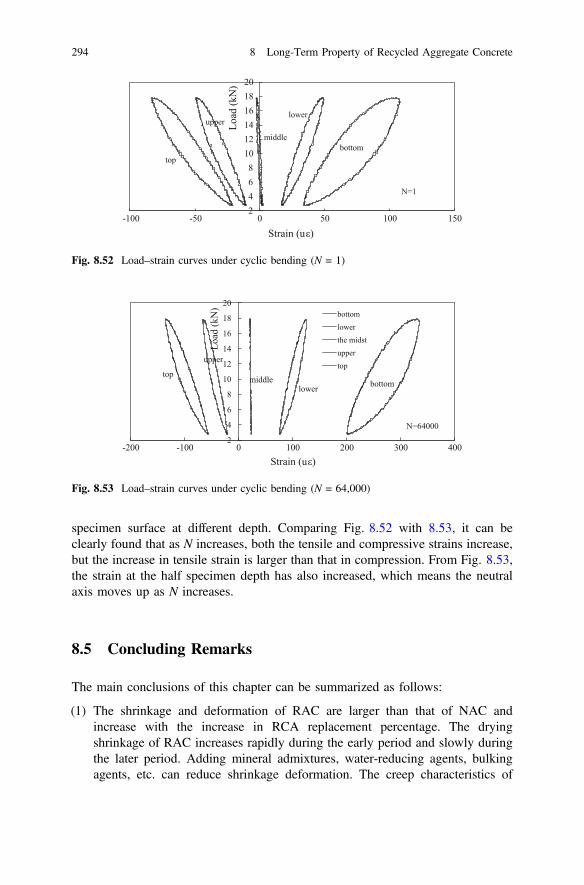
specimen surface at different depth. Comparing Fig. 8.52 with 8.53, it can beclearly found that as N increases, both the tensile and compressive strains increase,but the increase in tensile strain is larger than that in compression. From Fig. 8.53,the strain at the half specimen depth has also increased, which means the neutralaxis moves up as N increases.
8.5 Concluding Remarks
The main conclusions of this chapter can be summarized as follows:
(1) The shrinkage and deformation of RAC are larger than that of NAC andincrease with the increase in RCA replacement percentage. The dryingshrinkage of RAC increases rapidly during the early period and slowly duringthe later period. Adding mineral admixtures, water-reducing agents, bulkingagents, etc. can reduce shrinkage deformation. The creep characteristics of
2
4
6
8
10
12
14
16
18
20
-200 -100 0 100 200 300 400
Load
(kN
)
Strain (uε)
bottomlowerthe midstuppertop
N=64000
topbottomlower
middle
upper
Fig. 8.53 Load–strain curves under cyclic bending (N = 64,000)
2468
101214161820
-100 -50 0 50 100 150Lo
ad (k
N)
Strain (uε)
N=1
top
upper
bottom
lower
middle
Fig. 8.52 Load–strain curves under cyclic bending (N = 1)
294 8 Long-Term Property of Recycled Aggregate Concrete

RAC are influenced significantly by the content, elastic modulus, and creepbehavior of the old adhering mortar. The influence of old adhering mortarcannot be ignored when calculating the creep of RAC.
(2) All these factors such as w/c ratio, replacement percentage of RCA, the contentof cement in mix proportion, the strength of RAC as well as the environmentalconditions affect the carbonation depth of RAC. The proposed model can beused to analyze the carbonation resistance of RAC.
(3) The chloride ingress into RAC immersed in a chloride solution agrees with theFick’s second diffusion law. The diffusion of free chloride concentration inRAC with r = 34, 67 and 100% relative to that in NAC is more noticeable thanthat of binding chloride concentration and total chloride concentration. Thebinding chloride concentration increases lineally with the increase in freechloride concentration. The difference between free chloride concentration inRAC with r = 100% and that with r = 0% increases with the increase in depthand then decreases slowly with the increase in depth for a given immersionperiod.
(4) The chloride diffusivities of the modeled RAC generally increase with theincrease in RRAv. For the same RRAv, the chloride diffusivities and the chlorideconcentration distribution in the modeled RAC are still different due to theeffect of different combinations of the modeled RCA. The variation rate ofchloride concentration of ITZ is significantly larger than that in the mortar andthe natural aggregate. The coefficients of variation of the modeled RAC varyingwith RRAv for chloride migration and strength show consistent tendency;namely, each of them demonstrates a type of “low-high-low” pattern.
(5) Under compressive cyclic loading, both the residual strain and fatigue strain ofRAC increase with the increase in the number of cycles, and their variations canalso be divided into three stages as in NAC: cyclic creep stage, creep–fatiguecoupling stage, and fatigue stage. There exist no obvious differences in theoverall fatigue behavior of RAC and NAC. The proposed model is a simple andpractical fatigue damage model for RAC under uniaxial compression withconstant stress range, which has good agreement with results from fatigue tests.A linear relation between lg Nf and S still exists under cyclic bend loading, butunlike the uniaxial compression case, the fatigue life of RAC is lower than thatof the NAC for the same stress level.
References
1. Miao C, Liu X, Ni QF, Research on measurement method for mortar content of RCA and itsclassification. Sichuan Build Sci. 2011;37 (4):219–22 (in Chinese).
2. Zaharieva R, Buyle-Bodin F, Skoczylas F, Wirquin E, Assessment of the surface permeationproperties of recycled aggregate concrete. Cem Concr Compos. 2003;25(2):223–32.
3. Xu YZ, Shi JG, Analyses and evaluation of the behaviour of recycled aggregate and recycledconcrete. Concrete 2006;7:41–6 (in Chinese).
8.5 Concluding Remarks 295

4. Xiao JZ, Recycled concrete. Beijing: China Building Industry Press; 2005 (in Chinese).5. Tam VWY, Gao XF, Tam CM, Microstructural analysis of recycled aggregate concrete
produced from two stage mixing approach. Cem Concr Res. 2005;35(6):1195–203.6. Neville AM, Dilger WH, Brooks JJ, Creep of plain and structural concrete. London:
Construction Press; 1983.7. Van den Heede P, De Belie N. A service life based global warming potential for high-volume
fly ash concrete exposed to carbonation. Constr Build Mater. 2014;55:183–93.8. CEB-FIP fib Bulletin 34. Model code for service life design: the International Federation for
structural concrete. Task Group 5.6. Lausanne (Switzerland); 2006.9. Guiglia M, Taliano M. Comparison of carbonation depths measured on in-field exposed
existing r.c. structures with predictions made using fib-model code 2010. Cem ConcrCompos. 2013;38:92–108.
10. CECS. Standard for durability assessment of concrete structures. Beijing: China Architectureand Building Press; 2007.
11. Zhang Y, Jiang LX. A practical mathematical model of concrete carbonation depth based onthe mechanism. Ind Constr. 1998;28(1):16–9.
12. Otsuki N, Miyazato S, Yodsudjai W. Influence of recycled aggregate on interfacial transitionzone, strength, chloride penetration and carbonation of concrete. J Mater Civ Eng. 2003;15(5):443–51.
13. Ryu JS. An experimental study on the effect of recycled aggregate on concrete properties.Mag Concr Res. 2002;54(1):7–12.
14. Sagoe-Crentsil KK, Brown T, Taylor AH. Performance of concrete made with commerciallyproduced coarse recycled concrete aggregate. Cem Concr Res. 2001;31(5):707–12.
15. Xiao JZ, Lei B. Carbonation model and structural durability design for recycled concrete.J Archit Civ Eng. 2008;25(3):66–72.
16. Oh BH, Jang SY. Effects of material and environmental parameters on chloride penetrationprofiles in concrete structures. Cem Concr Res. 2007;37(1):47–53.
17. Caré S. Influence of aggregates on chloride diffusion coefficient into mortar. Cem Concr Res.2003;33(7):1021–8.
18. Villagrán-Zaccardi YA, Zega CJ, Di Maio ÁA. Chloride penetration and binding in recycledconcrete. J Mater Civ Eng. 2008;20(6):449–55.
19. Ishida T, Iqbal PO, Anh HT. Modeling of chloride diffusivity coupled with non-linear bindingcapacity in sound and cracked concrete. Cem Concr Res. 2009;39(10):913–23.
20. Cheewaket T, Jaturapitakkul C, Chalee W. Long term performance of chloride bindingcapacity in fly ash concrete in a marine environment. Constr Build Mater. 2010;24(8):1352–7.
21. Yuan Q, Shi C, De Schutter G, Audenaert K, Deng D. Chloride binding of cement-basedmaterials subjected to external chloride environment—a review. Constr Build Mater. 2009;23(1):1–3.
22. Martın-Pérez B, Zibara H, Hooton RD, Thomas MD. A study of the effect of chloride bindingon service life predictions. Cem Concr Res. 2000;30(8):1215–23.
23. Tang LP, Nilsson L-O. Chloride binding capacity and binding isotherms of OPC pastes andmortars. Cem Concr Res. 1993;23:247–53.
24. DuraCrete. Compliance testing for probabilistic design purposes. In: DuraCrete final reportfor the European Union Brite EuRam III; 2000. p. 99–109.
25. Build NordTest. Concrete, mortar and cement-based repair materials: chloride migrationcoefficient from non-steady-state, migration experiments. Nordtest method 492, 1999.
26. China civil engineering society CCES01-2004 (2005 revised edition). Guide to durabilitydesign and construction of, concrete structures (in Chinese).
27. Board TR. Life-cycle management of concrete infrastructures for improved sustainability. In:Board TR, editor. 9th International bridge management conference Orlando, FloridaTransportation Research Board; 2003.
28. Zeng YW. Modeling of chloride diffusion in hetero-structured concretes by finite elementmethod. Cem Concr Compos. 2007;29(7):559–65.
296 8 Long-Term Property of Recycled Aggregate Concrete

29. Xiao JZ, Ying JW, Shen LM. FEM simulation of chloride diffusion in modeled recycledaggregate concrete. Constr Build Mater. 2012;29:12–23.
30. Gao L. Hsu Cheng-Tzu Thomas. Fatigue of concrete under uniaxial compression cyclicloading. ACI Mater J. 1998;95(5):575–82.
31. Paskova T, Meyer C. Low-cycle fatigue of plain and fiber reinforced concrete. ACIMater J. 1997;94:273–85.
32. Grzybowski M, Meyer C. Damage accumulation in concrete with and without fiberreinforcement. ACI Mater J. 1993;90:594–604.
33. Cachim PB. Experimental and numerical analysis of the behaviour of structural concreteunder fatigue loading with applications to concrete pavements. PhD thesis. Faculty ofEngineering of the University of Porto; 1999. p. 246.
34. Do M-T. Chaallal Aïtcin P-C. Fatigue behavior of high performance concrete. J Mater CivEng. 1993;5:96–111.
References 297

Chapter 9Bond–Slip Between Recycled AggregateConcrete and Rebars
Abstract To popularize the recycled aggregate concrete (RAC) in civil engi-neering, sometimes it should be reinforced with steel bars. One of the mostimportant requirements of reinforced concrete constructions is the bond betweenconcrete and reinforcement. This chapter will consider the RAC replacement per-centage and the steel rebar type including normal rebars and eroded rebars as themain experimental parameters. The aim of this work is to investigate the bondbehavior between RAC and steel rebars and to establish a bond stress versus sliprelationship between RAC and steel rebars.
9.1 Bond Between RAC and Normal Rebars
9.1.1 Test
9.1.1.1 Materials
Ordinary Portland cement (OPC) type 32.5 R conforming to the Chinese standard GB175-1999, river sand (S), and drinkingwater (W) were used for the test specimens. Therecycled coarse aggregate (RCA) was obtained by processing waste concrete. Thenatural coarse aggregate (NCA) was common crushed stone. Table 9.1 lists the fun-damental physical properties of both natural and recycled coarse aggregates. Plain anddeformed (i.e., crescent ribbed) low-carbon steel rebars with yield strengths 300 and420 MPa were used, and a diameter of 10 mm was adopted for this investigation. Thesurface features of the rebars are described in Table 9.2.
9.1.1.2 Mix Proportion
The RCA replacement percentage (r) is the ratio of the recycled aggregates to thetotal aggregates (by weight). Due to the high water absorption, the used RCA werepresoaked with additional water before mixing. The water amount used to presoak
© Springer-Verlag GmbH Germany 2018J. Xiao, Recycled Aggregate Concrete Structures,Springer Tracts in Civil Engineering, https://doi.org/10.1007/978-3-662-53987-3_9
299

the RCA was calculated on the basis of the saturated surface-dry condition. Thewater/cement ratio was kept constant as 0.43. The mixtures were divided into threegroups and carried out under the same laboratory conditions. The main differencebetween the three groups was the RCA replacement percentage, which was 0, 50,and 100%, respectively. Normal concrete (NC), i.e., a concrete with r = 0, servedas reference concrete. The mix proportions of the concrete are given in Table 9.3.
9.1.1.3 Preparation of Specimens
The pullout test specimens are shown in Fig. 9.1. The main information about thespecimens is given in Table 9.4. The specimens were cast with the steel rebar in ahorizontal position in order to simulate the situation of end rebar anchorage inconcrete beams. The steel bars were rust-free. For each concrete batch, the cubecompressive strength was determined by six 100 � 100 � 100 mm3 cubes. All thespecimens were demolded a day after pouring and transferred to the curing roomunder natural conditions for 28 days.
Table 9.1 Physical properties of NCA and RCA
Coarseaggregate
Bulkdensity(kg/m3)
Apparentdensity(kg/m3)
Waterabsorption(%)
Crushvalue(%)
Needle-sliceparticlescontent (%)
Claycontent(%)
Natural 1453 2820 0.40 4.04 4.8 1.80
Recycled 1290 2520 9.25 15.2 6.2 4.08
Table 9.2 Surface characteristics of the rebars
Type Deformed bar Plain bar
Rib height 1.0 mm Smooth surface
Rib width 0.6 mm
Rib spacing 6.5 mm
Rib face angle 55°
Table 9.3 Mix proportions of concrete (kg/m3)
No. RCA replacement percentage (r) (%) C S NCA RCA Mixing water
RAC-0 0 430 473 1058 0 185
RAC-50 50 430 473 529 529 185
RAC-100 100 430 473 0 1058 185
300 9 Bond–Slip Between Recycled Aggregate Concrete and Rebars

The mean values of the measured cube compressive strength of the RAC are alsolisted in Table 9.4. It can be noted from Table 9.4 that the compressive strengthdecreases with the increase in the RCA replacement percentage. When the RCAreplacement percentage equals 100%, the compressive strength is approximately20% lower compared to NC.
9.1.1.4 Test Setup
The setup for the pullout test is shown in Fig. 9.2. The load (P) and the slip (s) atthe free end of steel rebar anchored in the test specimen were measured in order todetermine a load–slip relationship. The monotonically increased load was appliedby the testing machine. Two high-precision linear variable differential transducers(LVDTs) were attached to a 25 mm thick mild-steel plate. One LVDT monitoredthe movement on the top concrete surface of the specimen, while the other onerecorded the displacement of the free end of the steel bar embedded in the concrete.A personal computer was used to collect test data automatically. Under differentloading levels, the relative displacement between the steel rebar and the concrete,that is the slippage value at the free end of the rebar, can be computed by thedisplacement difference between the two LVDTs.
(a) sketch (Unit: mm)
Plastic tube
(b) view of test specimens
Fig. 9.1 Details of pull-out specimens
Table 9.4 Description of the pullout specimens
RCA replacementpercentage (r)
fcu(MPa)
Plain bar Deformed bar
No. Quantity No. Quantity
0 43.52 RAC-I-0 6 RAC-II-0 6
50 39.27 RAC-I-50 6 RAC-II-50 6
100 34.63 RAC-I-100 6 RAC-II-100 6
9.1 Bond Between RAC and Normal Rebars 301

9.1.2 Analysis
9.1.2.1 Load Versus Slip Curves
The measured load versus slip curves for the six series of specimens (i.e., RAC-I-0,RAC-I-50, RAC-I-100, RAC-II-0, RAC-II-50, and RAC-II-100) are drawn inFig. 9.3. The bold curve represents the calculated average of each test series. Due todifficulties in the test procedure in some groups, some tests failed to show thedescending branch of the load versus slip curves. By analyzing theabove-mentioned curves, it can be seen that the bond development and deteriorationprocess between the recycled aggregate concrete (RAC) and steel rebars is similarto that between natural aggregate concrete and steel rebars as reported by Edwardsand Yannopoulos [1]. Each curve reflects the behavior at different stages which aremicro-slip, internal cracking, pullout, descending, and residual. At the micro-slipstage, the load is small and no obvious slip occurs at the free end of the rebar, i.e.,the load versus slip curve remains linear. At the internal cracking stage, when theload increases toward a critical value, the free end of the rebar begins to slip, whichdemonstrates that the adhesion force at the anchorage has nearly been exhausted.After this stage, the rate of the slip begins to increase and the ascending portion ofthe curve becomes distinctly nonlinear. At the pullout stage, the load reaches thepeak load (P0) and some longitudinal splitting cracks develop along the weakestarea of the concrete cover. The mean value of the peak slip (s0) for RAC-I-0,RAC-I-50, and RAC-I-100 is 0.22, 0.20, and 0.14 mm, respectively, whereas thecorresponding value for RAC-II-0, RAC-II-50, and RAC-II-100 is 0.69, 0.47, and1.2 mm, respectively. At the descending stage, the load declines rapidly and the slipincreases until the steel bar is completely pulled out. At the residual stage, when theslip of the loading end reaches a certain value, the load becomes nearly constant andis approximately less than one half of the peak load.
Fig. 9.2 Photograph of testsetup
302 9 Bond–Slip Between Recycled Aggregate Concrete and Rebars

9.1.2.2 Bond Strength
Under the conditions of these pullout tests, the bond stress along the wholeanchorage length of the steel rebar can be considered to be uniformly distributed.The bond strength can be expressed by:
(a) RAC-I-0 (b) RAC-I-50
(c) RAC-I-100 (d) RAC-II-0
(e) RAC-II-50 (f) RAC-II-100
Fig. 9.3 Test curves of load versus slip
9.1 Bond Between RAC and Normal Rebars 303

s0 ¼ P0=ðpdlaÞ; ð9:1Þ
where s0 is the peak bond stress in MPa between concrete and steel rebar which isalso termed as the bond strength; P0 is the peak load in N; d is the diameter of thesteel rebar in mm, which is 10 mm; and la is the embedded length of the steel rebarin mm, which is 50 mm.
The bond strengths obtained from the test results are summarized in Table 9.5,and the mean values of the bond strengths are compared in Fig. 9.4. FromTable 9.5, as well as from Fig. 9.4, it can be concluded that under the condition ofequivalent mix proportions (i.e., the mix proportions are the same, except fordifferent RCA replacement percentages) and compared to NC (i.e., the RCAreplacement percentage is 0), the bond strength between the RAC and the plainrebar decreases by 12 and 6% with a RCA replacement percentage of 50 and 100%,respectively. However, the bond strength between the RAC and the deformed rebaris much closer to each other, irrespective of the RCA replacement percentage.For NC or RAC, the bond strength between deformed steel rebars and concrete isapproximately 100% higher than that between plain steel rebars and concrete. Thecoefficient of variation for the bond strength related to the plain steel rebar is much
Table 9.5 The summary of the bond strength
No. Mean peakload P0 (N)
Mean bondstrength s0 (MPa)
Standarddeviation (MPa)
Coefficient ofvariation (%)
RAC-I-0 14,030 8.93 1.29 14.47
RAC-I-50 12,310 7.84 1.46 18.58
RAC-I-100 13,130 8.36 1.29 15.46
RAC-II-0 27,300 17.39 1.50 8.62
RAC-II-50 27,060 17.24 0.78 4.53
RAC-II-100 27,300 17.39 0.34 1.95
Fig. 9.4 Comparisonbetween the mean value ofbond strength
304 9 Bond–Slip Between Recycled Aggregate Concrete and Rebars

higher than the one for the deformed steel rebar. This can be explained as follows.The bond between RAC and deformed rebars depends much more on themechanical anchorage and friction resistance, whereas the bond between RAC andplain rebars mainly depends on the adhesion between steel and concrete, which isstrongly influenced by the RCA replacement percentage.
9.1.2.3 Relative Bond Strength
In order to study the impact of coarse aggregate type, the relative bond strength isdefined as the ratio of the mean bond strength to the square root of the meancompressive strength. The calculated relative bond strengths of different specimensare listed in Table 9.6. It can be seen from Table 9.6 that compared to the values ofNC, with a RCA replacement percentage of 50 and 100%, the relative bond strengthbetween the RAC and the plain rebar is decreased by 7.4% and increased by 5.2%,respectively, whereas the relative bond strength between the RAC and the deformedrebar is increased by 4.2 and 12%, respectively. It is interesting that the relativebond strength reaches the maximum value when the RCA replacement percentageis 100% for both plain and deformed rebars. This may be due to the similarmodulus of elasticity of the RCA and the cement paste of the RAC [2]. Therefore,for the case of equal compressive strength, it can be inferred that the bond strengthbetween the RAC with r = 100% and steel rebars is higher than that betweenconcrete and steel rebars.
9.1.2.4 Approximation of the Normalized Bond–Slip Relationship
An analytical expression for the bond–slip relationship of RAC is necessary for themodeling bond at the steel–concrete interface in the finite element analysis ofreinforced RAC members. The following dimensionless bond stress (�s) and slip (�s)parameters are used:
�s ¼ ss0
; �s ¼ ss0; ð9:2Þ
Table 9.6 List of relativebond strength
No. s0=ffiffiffiffiffifcu
p
RAC-I-0 1.35
RAC-I-50 1.25
RAC-I-100 1.42
RAC-II-0 2.64
RAC-II-50 2.75
RAC-II-100 2.96
9.1 Bond Between RAC and Normal Rebars 305

where s0 is the peak bond stress (i.e., bond strength) and s0 is the slip correspondingto the s0. Based on comparisons with test results, the normalized bond–slip rela-tionship of RAC can be approximately expressed as:
�s ¼ð�sÞa1 �s� 1;
�sb1ð�s�1Þ2 þ�s
�s[ 1;
(ð9:3Þ
where a1 and b1 are constants which have to be determined from the test results. Itshould be remarked here that the first equation of Eq. (9.3) was suggested by Haraji[3], while the second equation in Eq. (9.3) was proposed by Guo [4] for thedescending portion of compressive stress–strain relationship, in both cases for NC.In this analysis, Eq. (9.3) was extended to the RAC by modifying the parameters a1and b1. In Eq. (9.3), the value of parameter b1 is related to the area under thedescending part of the �s-�s curve. By using a data regression program, the value ofthe parameter a1 was determined as 0.3 for all tests, which is the same as the resultreported by Haraji for NC [3]. The values of the parameter b1 can be computedaccording to the similar data regress program and are given in Table 9.7.
The value of parameter a1 obviously does not change with the variations of themix proportion, which can be confirmed by the test results for both plain andfiber-reinforced concrete [3], high-performance concrete [5], and the test results inthis section. From Table 9.7 it can be inferred that the area under the descendingbranch does not decrease with the increase in the RCA replacement percentage,which indicates that the energy absorbing capacity of the RAC does not decreasefrom the bond–slip relation points of view. It can also be concluded from thevariation of the b1 value in Table 9.7 that the energy absorbing capacity fordeformed rebars anchored in the RAC is much higher than that of plain rebars underthe condition of a certain slip.
The average test curves and the predicted curves provided by Eq. (9.3) for theRAC are plotted in Fig. 9.5. It can be seen that the predicted curves are fitted well tothe test curves, which demonstrates that Eq. (9.3) can be used to simulate the wholeprocess of bond–slip relationship of RAC with plain and deformed rebars.
Table 9.7 Regress parameterof b1
No. b1RAC-I-0 0.038
RAC-I-50 0.038
RAC-I-100 0.038
RAC-II-0 0.10
RAC-II-50 0.10
RAC-II-100 0.15
306 9 Bond–Slip Between Recycled Aggregate Concrete and Rebars

9.1.2.5 Discussion on Anchorage Length
The parameters considered in this investigation were kept to a minimum, and theattention was focused on the bond between RAC and steel rebars. Therefore, theanchorage length of steel rebars in RAC can only be discussed preliminarily. Underthe condition of the equivalent mixture ratio, the compressive strength of the RACis smaller than that of the NC. But under the condition of the same compressivestrength, the bond strength of the RAC with r = 100% is higher than that of the NC.
S/S0 S/S0
S/S0 S/S0
S/S0 S/S0
(a) RAC-I-0 (b) RAC-I-50
(c) RAC-I-100 (d) RAC-II-0
(e) RAC-II-50 (f) RAC-II-100
τ/τ 0
τ/τ 0
τ/τ 0
τ/τ 0
τ/τ 0
τ/τ 0
Fig. 9.5 Comparisons of predicted bond–slip relationship with test results
9.1 Bond Between RAC and Normal Rebars 307

According to the well-known influencing factors for the anchorage length, such ascompressive strength of concrete, diameter of rebar, and yield strength of rebar, theanchorage length of steel rebars in the RAC with r = 100% can be estimated to beslightly shorter than those for NC for the case of an equivalent compressivestrength. Furthermore, RILEM [6] recommended that the tensile splitting strengthof RAC which is closely related to the bond performance can be chosen as the samefor NC. Therefore, this chapter suggests that the anchorage length of steel rebarsembedded in the RAC with r = 100% may be determined as the same for NC underthe condition of the same compressive strength.
9.2 Bond Between RAC and Eroded Rebars
Under the effect of long-term effects, the degradation of the bond strength betweenconcrete and reinforcement must be considered. This degradation may be caused bysteel rebars corrosion due to RAC carbonation or chloride ion penetration. Thissection will consider the degradation rules of the bond behavior between RAC andcorroded steel rebars through the center pullout test of RAC and corroded steelrebars of different corrosion rates, which were obtained through the acceleratedmethod of electrochemistry.
9.2.1 Test
9.2.1.1 Materials
The strength grade of RAC was C30. Ordinary Portland cement (OPC) type 32.5Rconforming to the Chinese standard GB 175-1999, river sand (S), and drinkingwater (W) were used for the test specimens. Table 9.8 lists the fundamentalphysical properties of RCA, and Table 9.9 lists the mix proportion and compressivestrength of RAC. With a diameter of 14 mm, HRB335 steel rebars with yieldstrength 374 MPa and ultimate strength 571 MPa were used.
Table 9.8 Physical properties of RCA
Particleradius (mm)
Bulk density(kg/m3)
Apparentdensity (kg/m3)
Mudcontent (%)
Waterabsorption (%)
Crushvalue (%)
5 * 31.5 1257 2578 1.39 4.50 16.1
308 9 Bond–Slip Between Recycled Aggregate Concrete and Rebars

9.2.1.2 Preparation of Specimens
RAC specimens with the dimensions of 200 � 200 � 200 mm3 were used. Threespecimens were contained in each group, and the total amounts of the 7 groups are28. The cube compressive strength was determined on six 150 � 150 � 150 mm3
cubes. Figures 9.6 and 9.7 show the sketch of pullout specimens and pulloutspecimens after casting, respectively.
9.2.1.3 Corrosion Setup
After curing, the electrochemical methods were used to accelerate corrosion, andthe device is shown in Fig. 9.8. Put the specimens into approximately 5% NaClsolution, and the steel bars should remain above the level off the solution. Link DCstabilized power supply and wires at the steel end and copper used as the cathode,
Table 9.9 The mix proportion and compressive strength of RAC
Replacementpercentage ofRCA (%)
Amount (kg/m3) Compressivestrength (MPa)
C S Natural coarseaggregate
Recycled coarseaggregate
W Cube compressivestrength
100 430 473 0 1058 185 32.5
Plastic tube
Fig. 9.6 Sketch of pulloutspecimens (Unit: mm)
9.2 Bond Between RAC and Eroded Rebars 309

and turn on power to corrode steel rebars. Ammeter and transformers are containedin the DC stabilized power supply, and the current size [7] of the corroded steelrebars is determined by ammeter, which can estimate corrosion current density. Inthe corrosion process, it is necessary to check and adjust the current (i.e., recordcurrent size) passing the steel rebars regularly (i.e., general interval 6–7 and 3–4 hin the early corrosion) in order to ensure the current stability.
9.2.1.4 Determination of Steel Corrosion Rate
Remove the steel rebars after the pullout test. According to relevant provisions ofthe Chinese standard “Standard for test methods of long-term performance anddurability of ordinary concrete” (GB/T50082-2009), it is necessary to scrape theconcrete adhered to the steel bars and to carry out pickling with 12% hydrochloricacid solution. After washing steel bars with clean water and limewater, it is nec-essary to rinse with clean water. After toweling off and drying 4 h in the drying
Fig. 9.8 Setup for accelerated corrosion of steel rebars
Fig. 9.7 Pullout specimens after casting
310 9 Bond–Slip Between Recycled Aggregate Concrete and Rebars
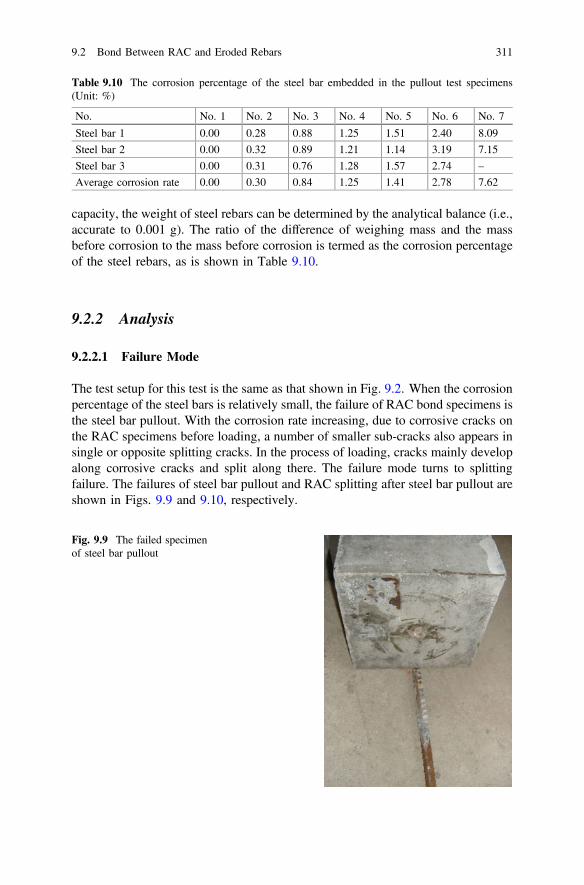
capacity, the weight of steel rebars can be determined by the analytical balance (i.e.,accurate to 0.001 g). The ratio of the difference of weighing mass and the massbefore corrosion to the mass before corrosion is termed as the corrosion percentageof the steel rebars, as is shown in Table 9.10.
9.2.2 Analysis
9.2.2.1 Failure Mode
The test setup for this test is the same as that shown in Fig. 9.2. When the corrosionpercentage of the steel bars is relatively small, the failure of RAC bond specimens isthe steel bar pullout. With the corrosion rate increasing, due to corrosive cracks onthe RAC specimens before loading, a number of smaller sub-cracks also appears insingle or opposite splitting cracks. In the process of loading, cracks mainly developalong corrosive cracks and split along there. The failure mode turns to splittingfailure. The failures of steel bar pullout and RAC splitting after steel bar pullout areshown in Figs. 9.9 and 9.10, respectively.
Table 9.10 The corrosion percentage of the steel bar embedded in the pullout test specimens(Unit: %)
No. No. 1 No. 2 No. 3 No. 4 No. 5 No. 6 No. 7
Steel bar 1 0.00 0.28 0.88 1.25 1.51 2.40 8.09
Steel bar 2 0.00 0.32 0.89 1.21 1.14 3.19 7.15
Steel bar 3 0.00 0.31 0.76 1.28 1.57 2.74 –
Average corrosion rate 0.00 0.30 0.84 1.25 1.41 2.78 7.62
Fig. 9.9 The failed specimenof steel bar pullout
9.2 Bond Between RAC and Eroded Rebars 311

9.2.2.2 Bond–Slip Curves
The load-slip (the loading end and the free end) curves of each group are shown inFig. 9.11. Each curve shown in Fig. 9.11 reflects the bond failure of corrosion steelbars at different stages which are micro-slip, internal cracking and slipping, pullout,descending, and residual. From the bond versus slip curves of the degradation of thebond behavior, the load declines rapidly and the residual strength decreases with thecorrosion percentage increasing. As is shown in Fig. 9.11, the steel bar of onespecimen of No. 7 was pulled off at the interface, so there are only two curves.
9.2.2.3 Bond Strength
Table 9.11 lists pullout test results of bonding behavior between RAC and corrodedsteel rebars. From Table 9.11, it can be concluded that with the steel corrosion ratioincreasing, the bond strength between RAC and steel rebars increases first anddecreases afterwards. Average peak slip decreases when the steel corrosion ratioincreases.
Figure 9.12 presents the test results and fitting curves of the bond strengthbetween RAC and corrosion steel bars, compared with results of NC and corrosionsteel bars. The rules of degradation of bond behavior of RAC are similar to that ofNC, and the rate of the degradation of RAC is faster than that of NC.
The mix proportion of the center pullout test referred is the same as Sect. 9.1.1.2.The size of the concrete block is 100 � 100 � 100 mm3, the diameter of the steelbar is 10 mm, and the bond length of the steel rebar is 50 mm. By analyzing the testresults, the bond strength of the RAC and NC before degradation is the same, thevalue of which is 17.39 MPa. The ratio of the bond strength to the correspondingcube compressive is the relative bond strength: 0.5 and 0.4, respectively. From thetest results of group 1 shown in Table 9.11, the bond strength between RAC andsteel rebars is 16.63 MPa, and the relative bond strength is 0.51. This further
Fig. 9.10 Cross-sectionalview of concrete after the barpull out test
312 9 Bond–Slip Between Recycled Aggregate Concrete and Rebars
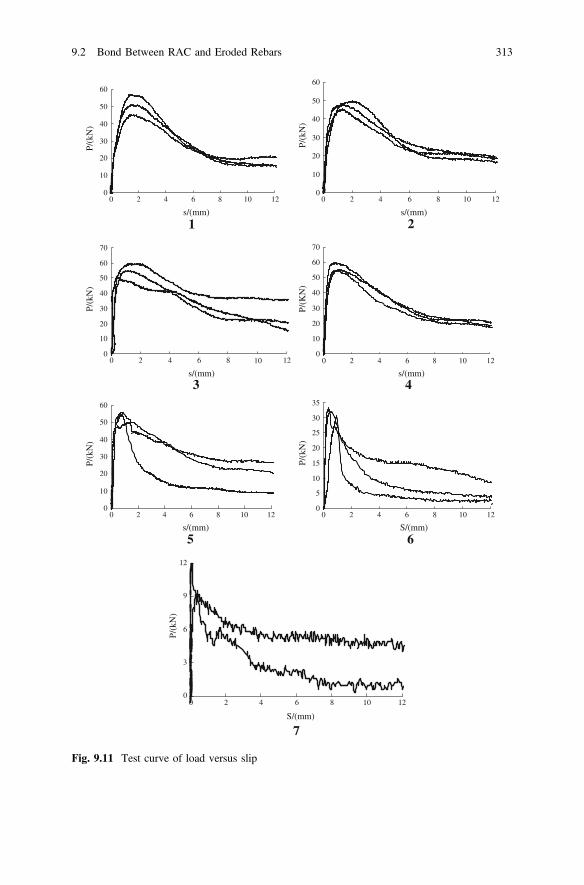
0
10
20
30
40
50
60
0 2 4 6 8 10 12
s/(mm)
P/(k
N)
0
10
20
30
40
50
60
0 2 4 6 8 10 12
s/(mm)
P/(k
N)
1 2
0
10
20
30
40
50
60
70
0 2 4 6 8 10 12
s/(mm)
P/(k
N)
0
10
20
30
40
50
60
70
0 2 4 6 8 10 12
s/(mm)
P/(K
N)
0
10
20
30
40
50
60
0 2 4 6 8 10 12
s/(mm)
P/(k
N)
0
5
10
15
20
25
30
35
0 2 4 6 8 10 12
S/(mm)
P/(k
N)
3 4
5 6
0
3
6
9
12
0 2 4 6 8 10 12
S/(mm)
P/(k
N)
7
Fig. 9.11 Test curve of load versus slip
9.2 Bond Between RAC and Eroded Rebars 313

confirms that under the equivalent mix proportion, the bond strength between theRAC and steel rebars is close to that of NC and steel rebars. Whereas under thesame compressive strength, the bond strength between the RAC and steel rebars ishigher than that of NC and steel rebars.
9.2.2.4 Bond Constitution Relationship
According to the research results in Ref. [8], the average bond stress–strain curvewas fitted:
The ascending part:
ssu
¼ ssu
� �a2
ð9:4Þ
The descending part:
ssu
¼ s=sub2ðs=su � 1Þ2 þ s=su
ð9:5Þ
where s is the bond stress, s is slip, su is the bond strength, and su is the slipcorresponding to the su. By fitting the test results, the value of the parameter a isdetermined as 0.3 for all test, and the values of the parameter b2 are given inTable 9.12. The value of parameter a2 does not change with variations of the steelcorrosion ratio, showing that no changes occur in the ascending part of thedimensionless bond–slip curve.
Figure 9.13 lists the variation of the b value referring to steel corrosion ratio. Thevalue of parameter b2 is related to the area under the descending part of thedimensionless bond–slip curve. The area under the curve does not decrease with theincrease in the value of b2, which indicates that the energy absorbing capacity does
0
0.2
0.4
0.6
0.8
1
1.2
1.4
0 2 4 6 8 10 12
Test data of RAC
Test data of NAC
Fitted curve of NAC
Fitted curve of RAC
Corrosion rate(%)
Red
uctio
n co
effi
cien
t
Fig. 9.12 Reduction coefficient of bond strength versus corrosion rate of steel bars
314 9 Bond–Slip Between Recycled Aggregate Concrete and Rebars

Tab
le9.11
Pullo
uttestresults
ofbo
ndingbehavior
betweenrecycled
concrete
andcorrod
edsteelbars
No.
Load(kN
)Bon
dstreng
th(M
Pa)
Average
bond
streng
th(M
Pa)
Bon
dstreng
thredu
ction
factor
Relativebo
ndstreng
th(correspon
ding
tocompressive
streng
th)
The
peak
slip
ofthe
free
end
(mm)
The
peak
slip
ofthe
loadingend
(mm)
The
average
peak
slip
oftwoends
(mm)
The
average
peak
slip
(mm)
No.
145
.42
14.76
15.88
1.00
0.49
1.08
1.48
1.28
1.41
49.97
16.24
1.32
1.78
1.55
51.17
16.63
1.11
1.70
1.41
No.
248
.16
15.65
15.38
0.97
0.47
1.48
1.52
1.50
1.41
48.43
15.74
1.21
1.61
1.41
45.41
14.76
1.04
1.59
1.32
No.
359
.94
19.48
17.97
1.13
0.55
0.88
1.71
1.30
1.31
50.86
16.53
0.77
1.94
1.36
55.11
17.91
0.93
1.62
1.28
No.
455
.11
17.91
18.40
1.15
0.57
0.87
1.56
1.22
1.01
59.94
19.48
0.44
1.13
0.79
a
45.42
17.81
0.58
1.01
0.80
No.
549
.96
16.24
17.38
1.09
0.53
0.89
1.61
1.25
a0.80
55.72
18.11
0.48
1.08
0.78
54.20
17.61
0.11
1.51
0.81
No.
633
.19
10.79
10.41
0.66
0.32
0.14
0.55
0.35
0.43
32.26
10.48
0.25
0.77
0.51
30.68
9.97
0.53
2.43
1.48
a
No.
711
.96
3.89
3.49
0.22
0.11
0.04
0.09
0.07
a0.36
9.51
3.09
0.34
0.37
0.36
a Itmeans
thisvalueexceedsthemeanvalueof
15%,no
tinclud
edin
thecalculationof
themeanvalue
9.2 Bond Between RAC and Eroded Rebars 315
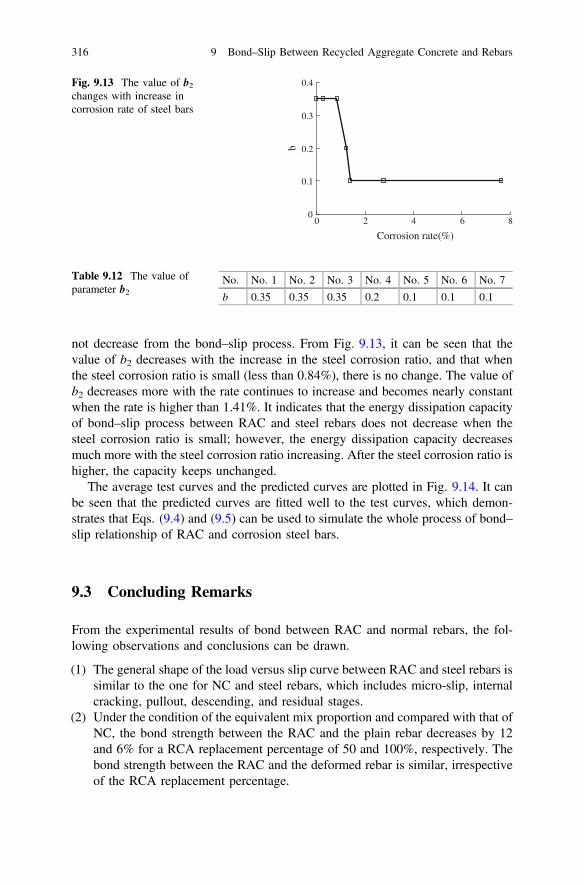
not decrease from the bond–slip process. From Fig. 9.13, it can be seen that thevalue of b2 decreases with the increase in the steel corrosion ratio, and that whenthe steel corrosion ratio is small (less than 0.84%), there is no change. The value ofb2 decreases more with the rate continues to increase and becomes nearly constantwhen the rate is higher than 1.41%. It indicates that the energy dissipation capacityof bond–slip process between RAC and steel rebars does not decrease when thesteel corrosion ratio is small; however, the energy dissipation capacity decreasesmuch more with the steel corrosion ratio increasing. After the steel corrosion ratio ishigher, the capacity keeps unchanged.
The average test curves and the predicted curves are plotted in Fig. 9.14. It canbe seen that the predicted curves are fitted well to the test curves, which demon-strates that Eqs. (9.4) and (9.5) can be used to simulate the whole process of bond–slip relationship of RAC and corrosion steel bars.
9.3 Concluding Remarks
From the experimental results of bond between RAC and normal rebars, the fol-lowing observations and conclusions can be drawn.
(1) The general shape of the load versus slip curve between RAC and steel rebars issimilar to the one for NC and steel rebars, which includes micro-slip, internalcracking, pullout, descending, and residual stages.
(2) Under the condition of the equivalent mix proportion and compared with that ofNC, the bond strength between the RAC and the plain rebar decreases by 12and 6% for a RCA replacement percentage of 50 and 100%, respectively. Thebond strength between the RAC and the deformed rebar is similar, irrespectiveof the RCA replacement percentage.
Table 9.12 The value ofparameter b2
No. No. 1 No. 2 No. 3 No. 4 No. 5 No. 6 No. 7
b 0.35 0.35 0.35 0.2 0.1 0.1 0.1
0
0.1
0.2
0.3
0.4
0 2 4 6 8
Corrosion rate(%)
b
Fig. 9.13 The value of b2changes with increase incorrosion rate of steel bars
316 9 Bond–Slip Between Recycled Aggregate Concrete and Rebars
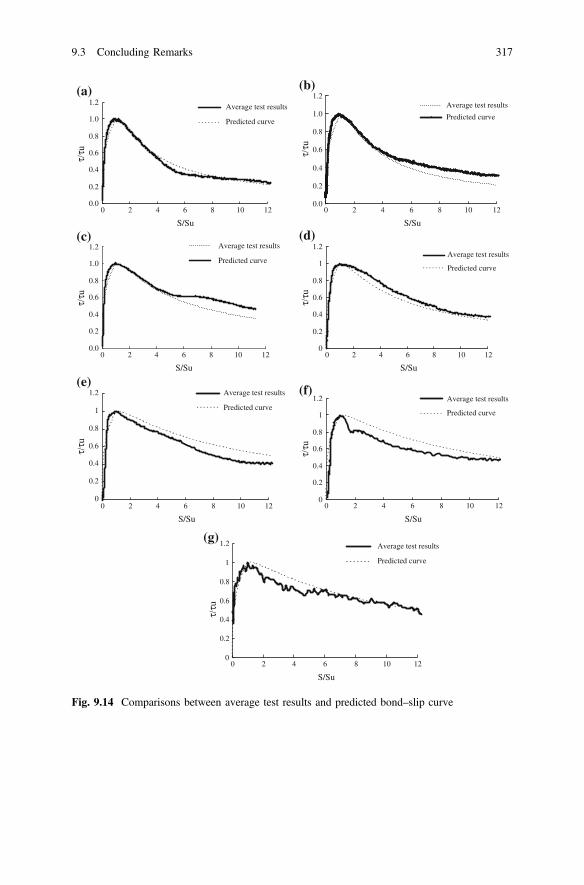
0.0
0.2
0.4
0.6
τ/τu
τ/τu
τ/τu
τ/τu
τ/τu
τ/τu
τ/τu
0.8
1.0
1.2
0 2 4 6 8 10 12
Average test results
Predicted curve
Average test results
Predicted curve
Average test results
Predicted curveAverage test results
Predicted curve
Average test results
Predicted curve
Average test results
Predicted curve
Average test results
Predicted curve
S/Su
0.0
0.2
0.4
0.6
0.8
1.0
1.2
0 2 4 6 8 10 12
S/Su
0.0
0.2
0.4
0.6
0.8
1.0
1.2
0 2 4 6 8 10 12
S/Su
0
0.2
0.4
0.6
0.8
1
1.2
0 2 4 6 8 10 12
S/Su
0
0.2
0.4
0.6
0.8
1
1.2
S/Su
0
0.2
0.4
0.6
0.8
1
1.2
0 2 4 6 8 10 12 0 2 4 6 8 10 12
S/Su
0
0.2
0.4
0.6
0.8
1
1.2
0 2 4 6 8 10 12
S/Su
(a) (b)
(d)(c)
(e)
(g)
(f)
Fig. 9.14 Comparisons between average test results and predicted bond–slip curve
9.3 Concluding Remarks 317
(3) For the case of the same compressive strength, the bond strength between theRAC with r = 100% and steel rebars is larger than the one between NC andsteel rebars.
(4) For the RAC, the bond strength between deformed steel rebars and concrete isapproximately 100% higher than the one between plain steel rebars and con-crete. The coefficient of variation for the bond strength of the plain steel rebar ismuch larger than the one for the deformed steel rebar.
(5) The normalized bond versus slip relationship for the RAC can be fitted byEq. (9.3).
(6) The anchorage length of steel rebars embedded in the RAC with r = 100% canbe chosen as the same for NC under the condition of the same compressivestrength of concrete.
From the experimental results of bond between RAC and eroded rebars, thefollowing observations and conclusions can be drawn.
(1) The failure of the specimens is steel bar pullout when the steel corrosion ratio issmall. With the rate increasing, the bond failure modes turn into RAC splittingfailure.
(2) The bond failure of corrosion steel rebars contain five stages, which aremicro-slip, internal cracking and slipping, pullout, descending, and residual.
(3) The bond strength between the RAC and deformed rebars increases with cor-rosion up to a certain amount, and then, the bond strength decreases as thecorrosion ratio further increases, which is similar to that of NC.
(4) Under the condition of the equivalent mix proportion, the bond strengthbetween RAC and steel rebars is close to that of NC. Under the condition of theequivalent compressive strength, the bond strength between RAC and steelrebars is higher than that between NC and steel rebars.
(5) The normalized bond versus slip relationship for the RAC and corrosion steelrebars can be fitted by Eqs. (9.4) and (9.5).
References
1. Edwards AD, Yannopoulos PJ. Local bond-stress to slip relationships for hot rolled deformedbars and mild steel plain bars. ACI J. 1979;76(3):405–20.
2. Poon CS, Shui ZH, Lam L. Effect of microstructure of ITZ on compressive strength of concreteprepared with recycled aggregates. Constr Build Mater. 2004;18(6):461–8.
3. Haraji MH. Development/splice strength of reinforcing bars embedded in plain and fiberreinforced concrete. ACI Struct J. 1994;91(5):511–20.
4. Guo Z. Strength and deformation of concrete—experimental foundation and constitutiverelationship. Beijing: Press of Tsinghua University; 1997 (in Chinese).
5. Gao X. The experimental study and numerical simulation of bond performance between highperformance concrete and reinforcement. Dissertation, Tongji University, 2003 (in Chinese).
6. Rilem Recommendation. Specification for concrete with recycled aggregates. Mater Struct.1994;27(173):557–559.
318 9 Bond–Slip Between Recycled Aggregate Concrete and Rebars

7. Zhong W, Gong J. Control method for quick electrochemical corrosion experiment of rebars.Build Tech Dev. 2002;29(4):28–29, 67.
8. Xiao J. Recycled concrete. Beijing: Chinese Building Construction Publishing Press; 2008 (inChinese).
References 319

Chapter 10Structural Behavior of Recycled AggregateConcrete Elements
Abstract This chapter focus on the basic structural behavior of recycled aggregateconcrete (RAC) components, which includes the bending and shear behaviors ofRAC beam, the flexural and shear behaviors of RAC semi-precast beam, theflexural behaviors of RAC gradient slab, the punching shear behaviors of steelfiber reinforced RAC slab, the behaviors of RAC column under eccentric com-pression. The suitability of the code formulae to calculate RAC’s bending and shearcapacity was verified, and based on this, a reliability analysis for RAC elements wascarried out, investigating RAC beam bending moment and shear capacity relia-bility, analyzing the cracking patterns, deflections, bearing capacities of U, andC-typed semi-precast beams, studing the gradient slabs through experiment and theFEM analysis, analyzing the effectiveness of both recycled aggregate replacementpercentage and steel fiber volume ratio when it refers to the punching shear of theslab, and carring out the reliability analysis of RAC column under axial com-pression and eccentric compression loading.
10.1 RAC Beams
Currently, researchers worldwide have carried out extensive studies on the basicbehaviors of RAC beams. The following includes research results and the com-pleted verification, the process and analysis of the recycled concrete beam’s loadingand failure pattern, and the theory of bending and reliability analysis.
10.1.1 Flexural Behavior of RAC Beams
10.1.1.1 Test Design of RAC Beams
After collecting and analyzing research data concerning the beam bending failure inChina and worldwide, a test was carried out by the author to investigate the bending
© Springer-Verlag GmbH Germany 2018J. Xiao, Recycled Aggregate Concrete Structures,Springer Tracts in Civil Engineering, https://doi.org/10.1007/978-3-662-53987-3_10
321

behaviors of RAC beam. During the test, three RAC beams were designed: Amongthem, one was a control specimen (ordinary concrete), given the code BF0, and theother two are RAC beams with recycled aggregate replacement percentages of 50and 100%, given the codes BF50 and BF100, respectively. In order to concentrateon the influence of the recycled coarse aggregate (RCA) on the loading anddeformation of RAC beam cross-sectional area, all the beams used the samereinforcement. The reinforcement ratio of the tensile reinforcement was 0.77%, andthe shear area was reinforced with stirrups of 0.67%, (see Fig. 10.1 for details of thebeams’ dimensions and reinforcement).
The parameters measured are mainly the concrete bending deformation at all theloading stages, the steel deformation along the span, the component deflection, andthe crack width. The test setup is shown in Fig. 10.2. Figure 10.3 is the overview ofthe test site. The load was performed along the specimens by two points simulta-neously. Pre-loading of 10 kN was done prior to actual loading of the test specimenin order to make sure that all the equipment was running properly. All equipmentwas controlled by computer and could record data automatically. And the test wascarried out strictly according to the Chinese code [1].
Fig. 10.1 Diagram of the beam specimen (Unit: mm)
Displacement gauge
Displacement gauge Displacement gauge
Strain gauge of concrete
Strain gauge of reinforcement
Displacement gauge
Displacement gauge
Note: all the support are steel support, the size of the top steel plate is 20*40*150 (mm) and the size of the bottom plate is 20*80*150 (mm).
Fig. 10.2 Test set-up diagram (Unit: mm)
322 10 Structural Behavior of Recycled Aggregate Concrete Elements

10.1.1.2 Analysis of RAC Beams
(1) Analysis of the application of the plane section assumption
Figure 10.4a, b, and c represents the reinforcement and concrete strain along theheight of cross section of the beams BF0, BF50, and BF100, respectively at dif-ferent loads. From Fig. 10.4, it can be observed that RAC follows the assumptionthat the plane section remains plane after bending.
(2) Load–deflection analysis
After modifying the deflection at the supports, it was found that the spandeflection is related to the change in the loading (see Fig. 10.5). From Fig. 10.5, itis shown that RAC beam behaves in the same way as how an ordinary concretebeam behaves, and it has an elastic stage, cracking stage, and failure stage. Duringthe elastic stage, the load–deflection relationship changes in an ascending straightline. From cracking up to just before the yielding of longitudinal reinforcement, theload–deflection relationship is nonlinear. And after the longitudinal reinforcementyields, the load–deflection relationship becomes a horizontal line. When comparingthe relationship between load and deflection of the 3 beams, it is found that beforethe cracks formed, at the same loading level, BF100 had a slightly higher deflection,followed by BF50 and BF0 had the minor deflection. After the yielding of thelongitudinal reinforcement, all the 3 beams showed good ductility, and the ductilityof RAC was even slightly higher.
Fig. 10.3 Overview of testsite
10.1 RAC Beams 323

(3) Load–span reinforcement strain relationship analysis
The load–span reinforcement strain relationship of the 3 beams is shown inFig. 10.6, and it can be observed from Fig. 10.6 that the curves have 3 branches—straight line branch, yielding branch, and horizontal branch. The three curves showthat before yielding of reinforcement, the difference between the reinforcementstrain of RAC beam and ordinary concrete beam was very slight. After the longi-tudinal reinforcement yielded, RAC beam’s reinforcement strain sharply increased,
05
1015202530
-1000 0 1000 2000 3000
Strain (×10 )−6 Strain (×10 )−6
Strain (×10 )−6
Hei
ght (
cm)
Hei
ght (
cm)
Hei
ght (
cm)
10kN40kN60kN80kN120kN
05
1015202530
-1000 0 1000 2000 3000
10kN
40kN
60kN
80kN
110kN
05
101520
2530
-1000 0 1000 2000 3000
10kN
40kN
60kN
80kN
110kN
(a) (b)
(c)
Fig. 10.4 Distribution of the deformation along the plane section at different loads
0
40
80
120
160
0 20 40
BF0BF50BF100
60Deflection at mid-span (mm)
Load
(kN
)
Fig. 10.5 Load–spandeflection of the beam
324 10 Structural Behavior of Recycled Aggregate Concrete Elements
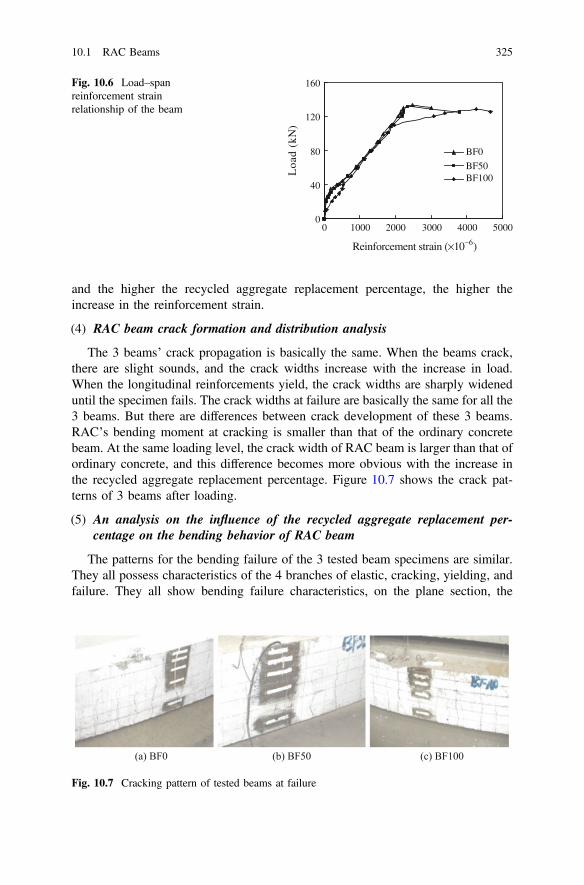
and the higher the recycled aggregate replacement percentage, the higher theincrease in the reinforcement strain.
(4) RAC beam crack formation and distribution analysis
The 3 beams’ crack propagation is basically the same. When the beams crack,there are slight sounds, and the crack widths increase with the increase in load.When the longitudinal reinforcements yield, the crack widths are sharply wideneduntil the specimen fails. The crack widths at failure are basically the same for all the3 beams. But there are differences between crack development of these 3 beams.RAC’s bending moment at cracking is smaller than that of the ordinary concretebeam. At the same loading level, the crack width of RAC beam is larger than that ofordinary concrete, and this difference becomes more obvious with the increase inthe recycled aggregate replacement percentage. Figure 10.7 shows the crack pat-terns of 3 beams after loading.
(5) An analysis on the influence of the recycled aggregate replacement per-centage on the bending behavior of RAC beam
The patterns for the bending failure of the 3 tested beam specimens are similar.They all possess characteristics of the 4 branches of elastic, cracking, yielding, andfailure. They all show bending failure characteristics, on the plane section, the
0
40
80
120
160
0 1000 2000 3000 4000 5000
BF0
BF50BF100
Reinforcement strain (×10 )−6
Loa
d (k
N)
Fig. 10.6 Load–spanreinforcement strainrelationship of the beam
(a) BF0 (b) BF50 (c) BF100
Fig. 10.7 Cracking pattern of tested beams at failure
10.1 RAC Beams 325
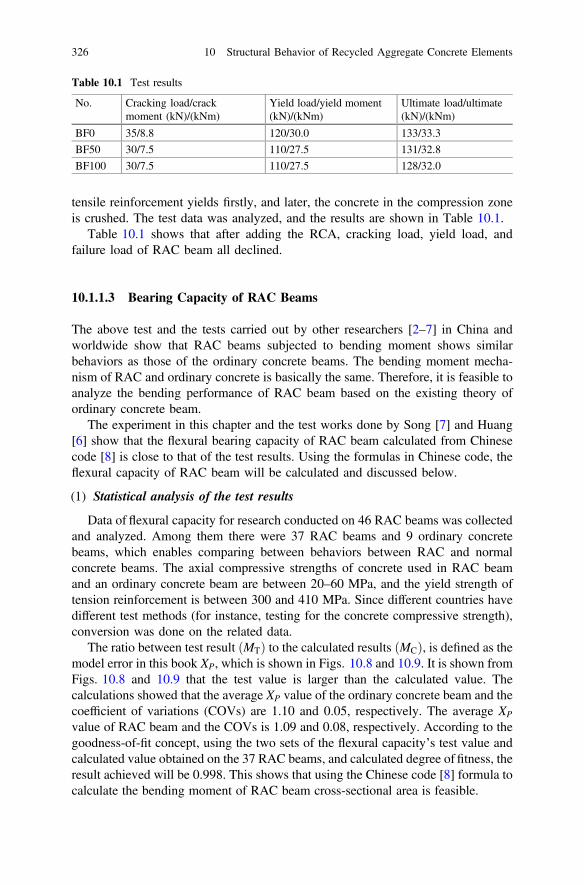
Table 10.1 Test results
No. Cracking load/crackmoment (kN)/(kNm)
Yield load/yield moment(kN)/(kNm)
Ultimate load/ultimate(kN)/(kNm)
BF0 35/8.8 120/30.0 133/33.3
BF50 30/7.5 110/27.5 131/32.8
BF100 30/7.5 110/27.5 128/32.0
tensile reinforcement yields firstly, and later, the concrete in the compression zoneis crushed. The test data was analyzed, and the results are shown in Table 10.1.
Table 10.1 shows that after adding the RCA, cracking load, yield load, andfailure load of RAC beam all declined.
10.1.1.3 Bearing Capacity of RAC Beams
The above test and the tests carried out by other researchers [2–7] in China andworldwide show that RAC beams subjected to bending moment shows similarbehaviors as those of the ordinary concrete beams. The bending moment mecha-nism of RAC and ordinary concrete is basically the same. Therefore, it is feasible toanalyze the bending performance of RAC beam based on the existing theory ofordinary concrete beam.
The experiment in this chapter and the test works done by Song [7] and Huang[6] show that the flexural bearing capacity of RAC beam calculated from Chinesecode [8] is close to that of the test results. Using the formulas in Chinese code, theflexural capacity of RAC beam will be calculated and discussed below.
(1) Statistical analysis of the test results
Data of flexural capacity for research conducted on 46 RAC beams was collectedand analyzed. Among them there were 37 RAC beams and 9 ordinary concretebeams, which enables comparing between behaviors between RAC and normalconcrete beams. The axial compressive strengths of concrete used in RAC beamand an ordinary concrete beam are between 20–60 MPa, and the yield strength oftension reinforcement is between 300 and 410 MPa. Since different countries havedifferent test methods (for instance, testing for the concrete compressive strength),conversion was done on the related data.
The ratio between test result MTð Þ to the calculated results MCð Þ, is defined as themodel error in this book XP, which is shown in Figs. 10.8 and 10.9. It is shown fromFigs. 10.8 and 10.9 that the test value is larger than the calculated value. Thecalculations showed that the average XP value of the ordinary concrete beam and thecoefficient of variations (COVs) are 1.10 and 0.05, respectively. The average XP
value of RAC beam and the COVs is 1.09 and 0.08, respectively. According to thegoodness-of-fit concept, using the two sets of the flexural capacity’s test value andcalculated value obtained on the 37 RAC beams, and calculated degree offitness, theresult achieved will be 0.998. This shows that using the Chinese code [8] formula tocalculate the bending moment of RAC beam cross-sectional area is feasible.
326 10 Structural Behavior of Recycled Aggregate Concrete Elements
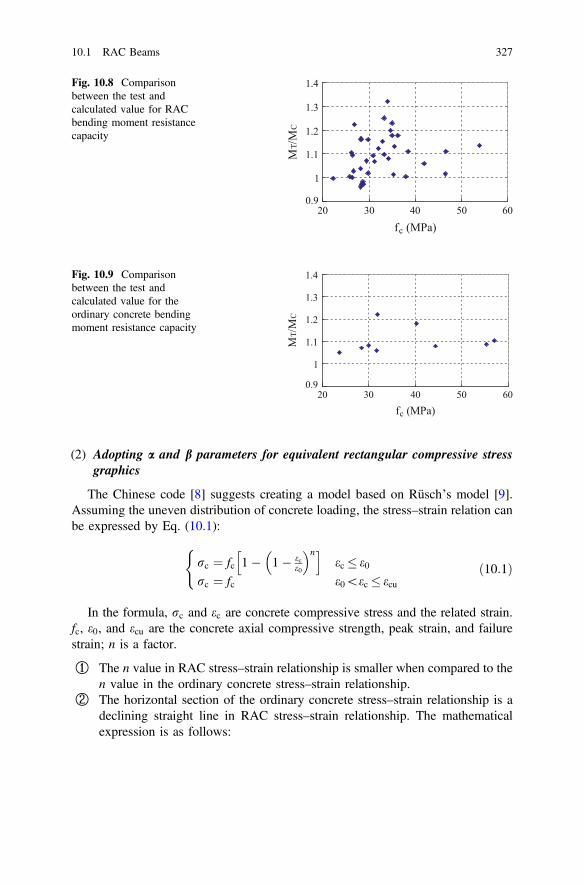
(2) Adopting a and b parameters for equivalent rectangular compressive stressgraphics
The Chinese code [8] suggests creating a model based on Rüsch’s model [9].Assuming the uneven distribution of concrete loading, the stress–strain relation canbe expressed by Eq. (10.1):
rc ¼ fc 1� 1� ece0
� �nh iec � e0
rc ¼ fc e0\ec � ecu
(ð10:1Þ
In the formula, rc and ec are concrete compressive stress and the related strain.fc, e0, and ecu are the concrete axial compressive strength, peak strain, and failurestrain; n is a factor.
① The n value in RAC stress–strain relationship is smaller when compared to then value in the ordinary concrete stress–strain relationship.
② The horizontal section of the ordinary concrete stress–strain relationship is adeclining straight line in RAC stress–strain relationship. The mathematicalexpression is as follows:
0.9
1
1.1
1.2
1.3
1.4
20 30 40 50 60
fc (MPa)
MT/
MC
Fig. 10.8 Comparisonbetween the test andcalculated value for RACbending moment resistancecapacity
0.9
1
1.1
1.2
1.3
1.4
20 30 40 50 60fc (MPa)
MT/
MC
Fig. 10.9 Comparisonbetween the test andcalculated value for theordinary concrete bendingmoment resistance capacity
10.1 RAC Beams 327
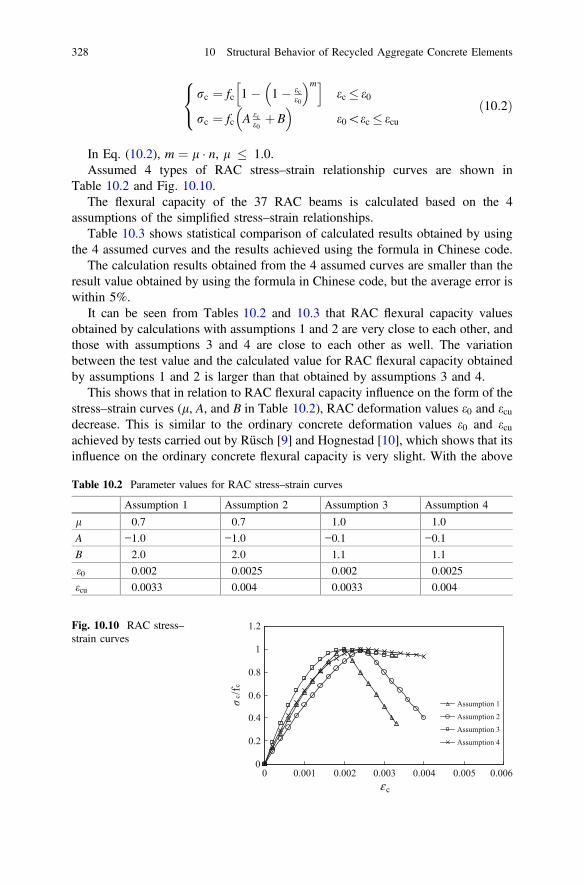
rc ¼ fc 1� 1� ece0
� �mh iec � e0
rc ¼ fc A ece0þB
� �e0\ec � ecu
8<: ð10:2Þ
In Eq. (10.2), m ¼ l � n, l � 1.0.Assumed 4 types of RAC stress–strain relationship curves are shown in
Table 10.2 and Fig. 10.10.The flexural capacity of the 37 RAC beams is calculated based on the 4
assumptions of the simplified stress–strain relationships.Table 10.3 shows statistical comparison of calculated results obtained by using
the 4 assumed curves and the results achieved using the formula in Chinese code.The calculation results obtained from the 4 assumed curves are smaller than the
result value obtained by using the formula in Chinese code, but the average error iswithin 5%.
It can be seen from Tables 10.2 and 10.3 that RAC flexural capacity valuesobtained by calculations with assumptions 1 and 2 are very close to each other, andthose with assumptions 3 and 4 are close to each other as well. The variationbetween the test value and the calculated value for RAC flexural capacity obtainedby assumptions 1 and 2 is larger than that obtained by assumptions 3 and 4.
This shows that in relation to RAC flexural capacity influence on the form of thestress–strain curves (l, A, and B in Table 10.2), RAC deformation values e0 and ecudecrease. This is similar to the ordinary concrete deformation values e0 and ecuachieved by tests carried out by Rüsch [9] and Hognestad [10], which shows that itsinfluence on the ordinary concrete flexural capacity is very slight. With the above
Table 10.2 Parameter values for RAC stress–strain curves
Assumption 1 Assumption 2 Assumption 3 Assumption 4
l 0.7 0.7 1.0 1.0
A −1.0 −1.0 −0.1 −0.1
B 2.0 2.0 1.1 1.1
e0 0.002 0.0025 0.002 0.0025
ecu 0.0033 0.004 0.0033 0.004
0
0.2
0.4
0.6
0.8
1
1.2
0 0.001 0.002 0.003 0.004 0.005 0.006ε c
σ c/fc
Assumption 1
Assumption 2
Assumption 3
Assumption 4
Fig. 10.10 RAC stress–strain curves
328 10 Structural Behavior of Recycled Aggregate Concrete Elements
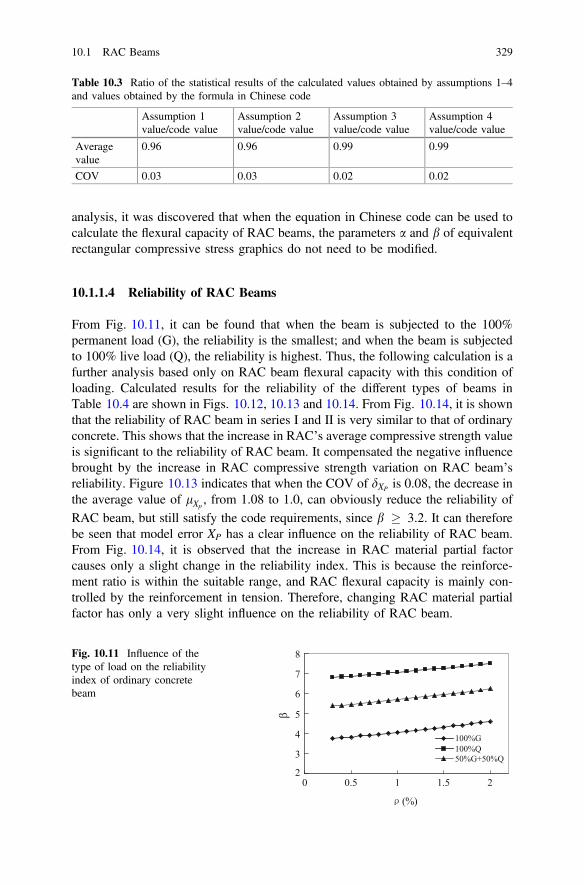
analysis, it was discovered that when the equation in Chinese code can be used tocalculate the flexural capacity of RAC beams, the parameters a and b of equivalentrectangular compressive stress graphics do not need to be modified.
10.1.1.4 Reliability of RAC Beams
From Fig. 10.11, it can be found that when the beam is subjected to the 100%permanent load (G), the reliability is the smallest; and when the beam is subjectedto 100% live load (Q), the reliability is highest. Thus, the following calculation is afurther analysis based only on RAC beam flexural capacity with this condition ofloading. Calculated results for the reliability of the different types of beams inTable 10.4 are shown in Figs. 10.12, 10.13 and 10.14. From Fig. 10.14, it is shownthat the reliability of RAC beam in series I and II is very similar to that of ordinaryconcrete. This shows that the increase in RAC’s average compressive strength valueis significant to the reliability of RAC beam. It compensated the negative influencebrought by the increase in RAC compressive strength variation on RAC beam’sreliability. Figure 10.13 indicates that when the COV of dXP is 0.08, the decrease inthe average value of lXp
, from 1.08 to 1.0, can obviously reduce the reliability ofRAC beam, but still satisfy the code requirements, since b � 3.2. It can thereforebe seen that model error XP has a clear influence on the reliability of RAC beam.From Fig. 10.14, it is observed that the increase in RAC material partial factorcauses only a slight change in the reliability index. This is because the reinforce-ment ratio is within the suitable range, and RAC flexural capacity is mainly con-trolled by the reinforcement in tension. Therefore, changing RAC material partialfactor has only a very slight influence on the reliability of RAC beam.
Table 10.3 Ratio of the statistical results of the calculated values obtained by assumptions 1–4and values obtained by the formula in Chinese code
Assumption 1value/code value
Assumption 2value/code value
Assumption 3value/code value
Assumption 4value/code value
Averagevalue
0.96 0.96 0.99 0.99
COV 0.03 0.03 0.02 0.02
2
3
4
5
6
7
8
0 0.5 1 1.5 2
(%)
β
100%G100%Q50%G+50%Q
Fig. 10.11 Influence of thetype of load on the reliabilityindex of ordinary concretebeam
10.1 RAC Beams 329

Table 10.4 Statistical results of compressive strength and model error
Type fcuk(MPa)
lfcu(MPa)
rfcu(MPa)
dfcu lfc(MPa)
fck(MPa)
fc(MPa)
lXpdXP
I 30.0 38.2 5 0.13 25.6 20.1 14.3 1.0 0.04
II 30.0 42.3 7.5 0.18 28.6 20.1 14.3 1.08 0.08
III 30.0 42.3 7.5 0.18 28.6 20.1 14.3 1.0 0.08
IV 30.0 42.3 7.5 0.18 28.6 20.1 13.9 1.0 0.08
V 30.0 42.3 7.5 0.18 28.6 20.1 13.4 1.0 0.08
3
3.5
4
4.5
5
0 0.5 1 1.5 2 2.5
(%)
β
Fig. 10.12 Comparisonbetween the bending momentreliability of ordinary concreteand RAC
3
3.5
4
4.5
5
0 0.5 1 1.5 2 2.5
(%)
β
Fig. 10.13 Influence of theresistance unstable factor onRAC beam flexural capacityreliability
3
3.2
3.4
3.6
3.8
4
4.2
0 0.5 1 1.5 2
(%)
β
Fig. 10.14 Influence of RACmaterials partial factor onRAC beam flexural capacityreliability
330 10 Structural Behavior of Recycled Aggregate Concrete Elements

10.1.2 Shear Behavior of RAC Beams
In order to investigate the shear behavior of RAC beam, the author completed aninvestigative test on shear behavior of RAC beams. The following content intro-duces the results of the test.
10.1.2.1 Design of RAC Beams
In this test, three beams were designed: One of them was an ordinary concretebeam, named BS0, while the other two were RAC beams with recycled aggregatereplacement percentages of 50 and 100%, marked BS50 and BS100, respectively.The cross section was rectangular. In order to study the influence of the recycledaggregate replacement percentage on the shear behaviors of RAC beams, all thebeam specimens used the same reinforcement. The tension and stirrup reinforce-ment ratios were 1.9 and 0.25%, respectively (see Fig. 10.15).
The loads on the test beam specimens were applied on 2 points, as shown inFigs. 10.15 and 10.16. The span-to-depth ratio is 1.5. The tested parameters includethe deflection at each stage of the load, the strains of stirrups, the average width ofdiagonal cracks and their development. The whole test is strictly done according tothe Chinese code [1].
10.1.2.2 Shear Failure of RAC Beams
(1) Load–mid-span deflection curves
Figure 10.17 shows the load–mid-span deflection curves. It is observed that thethree beams had both elastic and inelastic stages, and during the inelastic stage, theload still increased with the increasing mid-span deflection. Before cracking, BS100had the lowest flexural stiffness, followed by BS50, while BS0 had the highestflexural stiffness. After cracking, as the load increased, the deflections of all thethree beams also increased. But BS100 has slow increase in the deflection, muchcloser to the beam BS0, while BS0’s deflection was much larger than that of BS100and BS0, and increased very rapidly.
Fig. 10.15 Diagram of the beam specimen (Unit: mm)
10.1 RAC Beams 331
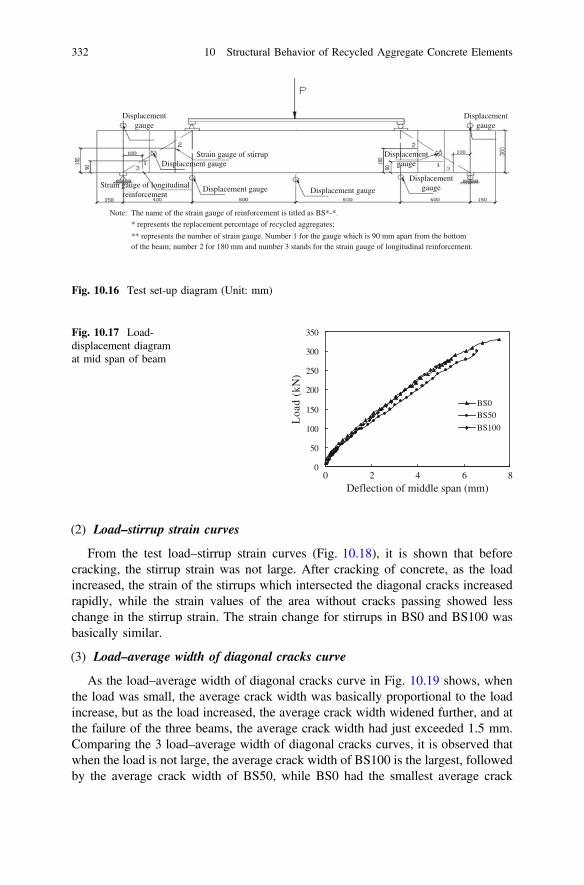
(2) Load–stirrup strain curves
From the test load–stirrup strain curves (Fig. 10.18), it is shown that beforecracking, the stirrup strain was not large. After cracking of concrete, as the loadincreased, the strain of the stirrups which intersected the diagonal cracks increasedrapidly, while the strain values of the area without cracks passing showed lesschange in the stirrup strain. The strain change for stirrups in BS0 and BS100 wasbasically similar.
(3) Load–average width of diagonal cracks curve
As the load–average width of diagonal cracks curve in Fig. 10.19 shows, whenthe load was small, the average crack width was basically proportional to the loadincrease, but as the load increased, the average crack width widened further, and atthe failure of the three beams, the average crack width had just exceeded 1.5 mm.Comparing the 3 load–average width of diagonal cracks curves, it is observed thatwhen the load is not large, the average crack width of BS100 is the largest, followedby the average crack width of BS50, while BS0 had the smallest average crack
Displacementgauge
Displacementgauge
Displacementgauge
Displacementgauge
Strain gauge of stirrup
Note: The name of the strain gauge of reinforcement is titled as BS*-*.
* represents the replacement percentage of recycled aggregates;
** represents the number of strain gauge. Number 1 for the gauge which is 90 mm apart from the bottomof the beam; number 2 for 180 mm and number 3 stands for the strain gauge of longitudinal reinforcement.
Displacement gauge
Displacement gauge Displacement gaugeStrain gauge of longitudinal
reinforcement
Fig. 10.16 Test set-up diagram (Unit: mm)
0
50
100
150
200
250
300
350
0 2 4 6
BS0BS50
BS100
8Deflection of middle span (mm)
Loa
d (k
N)
Fig. 10.17 Load-displacement diagramat mid span of beam
332 10 Structural Behavior of Recycled Aggregate Concrete Elements
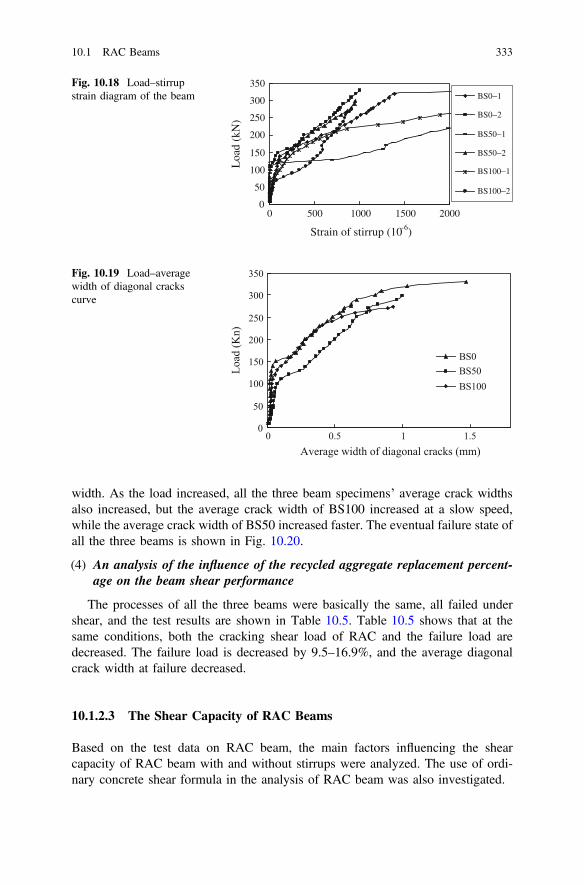
width. As the load increased, all the three beam specimens’ average crack widthsalso increased, but the average crack width of BS100 increased at a slow speed,while the average crack width of BS50 increased faster. The eventual failure state ofall the three beams is shown in Fig. 10.20.
(4) An analysis of the influence of the recycled aggregate replacement percent-age on the beam shear performance
The processes of all the three beams were basically the same, all failed undershear, and the test results are shown in Table 10.5. Table 10.5 shows that at thesame conditions, both the cracking shear load of RAC and the failure load aredecreased. The failure load is decreased by 9.5–16.9%, and the average diagonalcrack width at failure decreased.
10.1.2.3 The Shear Capacity of RAC Beams
Based on the test data on RAC beam, the main factors influencing the shearcapacity of RAC beam with and without stirrups were analyzed. The use of ordi-nary concrete shear formula in the analysis of RAC beam was also investigated.
0
50
100
150
200
250
300
350
0 500 1000 1500 2000
BS0−1
BS0−2
BS50−1
BS50−2
BS100−1
BS100−2
Strain of stirrup (10 )-6L
oad
(kN
)
Fig. 10.18 Load–stirrupstrain diagram of the beam
0
50
100
150
200
250
300
350
0 0.5Average width of diagonal cracks (mm)
Load
(Kn)
1 1.5
BS0BS50BS100
Fig. 10.19 Load–averagewidth of diagonal crackscurve
10.1 RAC Beams 333
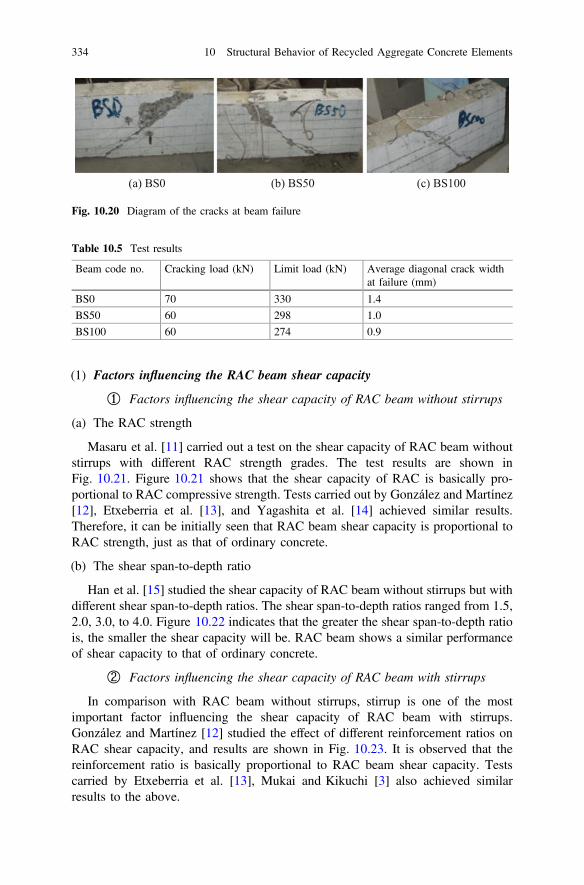
(a) BS0 (b) BS50 (c) BS100
Fig. 10.20 Diagram of the cracks at beam failure
Table 10.5 Test results
Beam code no. Cracking load (kN) Limit load (kN) Average diagonal crack widthat failure (mm)
BS0 70 330 1.4
BS50 60 298 1.0
BS100 60 274 0.9
(1) Factors influencing the RAC beam shear capacity
① Factors influencing the shear capacity of RAC beam without stirrups
(a) The RAC strength
Masaru et al. [11] carried out a test on the shear capacity of RAC beam withoutstirrups with different RAC strength grades. The test results are shown inFig. 10.21. Figure 10.21 shows that the shear capacity of RAC is basically pro-portional to RAC compressive strength. Tests carried out by González and Martínez[12], Etxeberria et al. [13], and Yagashita et al. [14] achieved similar results.Therefore, it can be initially seen that RAC beam shear capacity is proportional toRAC strength, just as that of ordinary concrete.
(b) The shear span-to-depth ratio
Han et al. [15] studied the shear capacity of RAC beam without stirrups but withdifferent shear span-to-depth ratios. The shear span-to-depth ratios ranged from 1.5,2.0, 3.0, to 4.0. Figure 10.22 indicates that the greater the shear span-to-depth ratiois, the smaller the shear capacity will be. RAC beam shows a similar performanceof shear capacity to that of ordinary concrete.
② Factors influencing the shear capacity of RAC beam with stirrups
In comparison with RAC beam without stirrups, stirrup is one of the mostimportant factor influencing the shear capacity of RAC beam with stirrups.González and Martínez [12] studied the effect of different reinforcement ratios onRAC shear capacity, and results are shown in Fig. 10.23. It is observed that thereinforcement ratio is basically proportional to RAC beam shear capacity. Testscarried by Etxeberria et al. [13], Mukai and Kikuchi [3] also achieved similarresults to the above.
334 10 Structural Behavior of Recycled Aggregate Concrete Elements

(2) Investigation of RAC beam shear capacity formula
The following is the comparative analysis based on the existing test data and thecalculated value using the formula in the Chinese code [8]. The feasibility of theshear calculation formula in the code on calculating the shear capacity of the RACbeam will be discussed. Due to the differences in the test methods in each country(the concrete axial tensile strength, etc.), this book has already done related con-version where necessary.
020
4060
80100
120140
160
1 1.5 2 2.5 3 3.5 4 4.5
Shea
r cap
acity
(kN
)
Shear span ratio λ
Fig. 10.22 Han’s differentshear span ratio RAC beamshear capacity test result
00.20.40.60.8
11.21.41.61.8
2
20 30 40 50 60 70 8
Axial compressive strength of concrete (MPa)U
ltim
ate
shea
r stre
ss (N
/mm
2 )Fig. 10.21 Masaru’sdifferent concrete strengthgrades test
0
50
100
150
200
250
0 0.12 0.17 0.22
without silica fumewith silica fume
Stirrup ratio (%)
Shea
r cap
acity
(kN
)
Fig. 10.23 Relationshipbetween the shear capacityand the reinforcement
10.1 RAC Beams 335
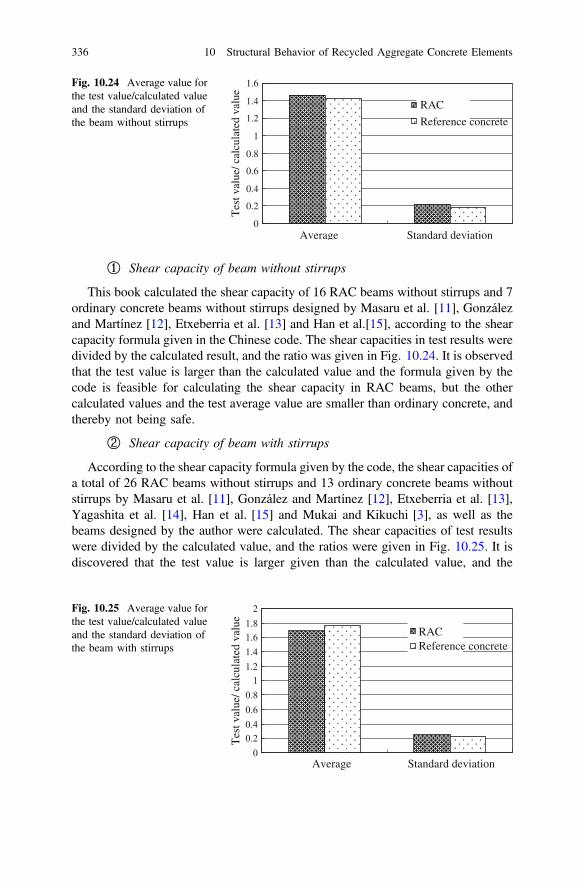
① Shear capacity of beam without stirrups
This book calculated the shear capacity of 16 RAC beams without stirrups and 7ordinary concrete beams without stirrups designed by Masaru et al. [11], Gonzálezand Martínez [12], Etxeberria et al. [13] and Han et al.[15], according to the shearcapacity formula given in the Chinese code. The shear capacities in test results weredivided by the calculated result, and the ratio was given in Fig. 10.24. It is observedthat the test value is larger than the calculated value and the formula given by thecode is feasible for calculating the shear capacity in RAC beams, but the othercalculated values and the test average value are smaller than ordinary concrete, andthereby not being safe.
② Shear capacity of beam with stirrups
According to the shear capacity formula given by the code, the shear capacities ofa total of 26 RAC beams without stirrups and 13 ordinary concrete beams withoutstirrups by Masaru et al. [11], González and Martínez [12], Etxeberria et al. [13],Yagashita et al. [14], Han et al. [15] and Mukai and Kikuchi [3], as well as thebeams designed by the author were calculated. The shear capacities of test resultswere divided by the calculated value, and the ratios were given in Fig. 10.25. It isdiscovered that the test value is larger given than the calculated value, and the
0Average Standard deviation
0.2
0.4
0.6
0.8
1
1.2
1.4
Tes
t val
ue/ c
alcu
late
d va
lue
1.6
RAC
Reference concrete
Fig. 10.24 Average value forthe test value/calculated valueand the standard deviation ofthe beam without stirrups
00.20.40.60.8
11.21.41.61.8
2
Average Standard deviation
Tes
t val
ue/ c
alcu
late
d va
lue
RACReference concrete
Fig. 10.25 Average value forthe test value/calculated valueand the standard deviation ofthe beam with stirrups
336 10 Structural Behavior of Recycled Aggregate Concrete Elements
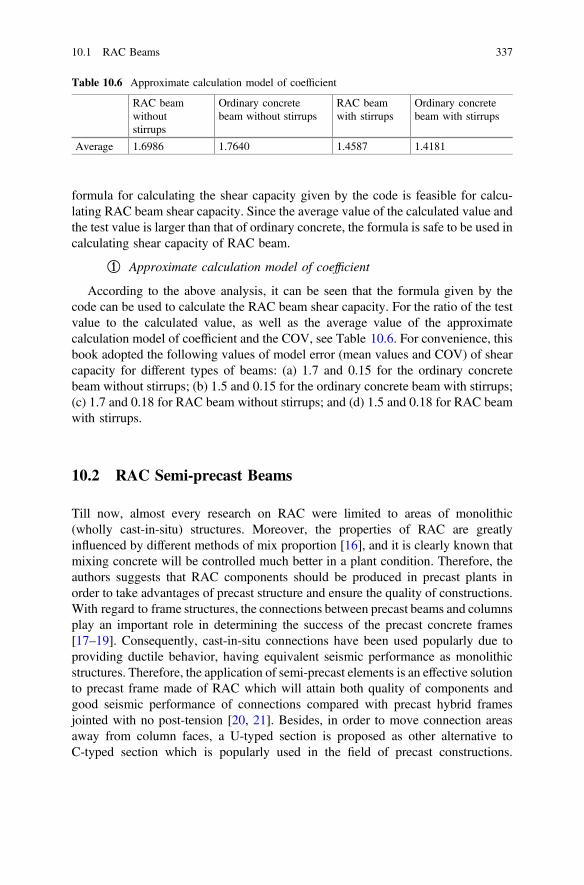
formula for calculating the shear capacity given by the code is feasible for calcu-lating RAC beam shear capacity. Since the average value of the calculated value andthe test value is larger than that of ordinary concrete, the formula is safe to be used incalculating shear capacity of RAC beam.
① Approximate calculation model of coefficient
According to the above analysis, it can be seen that the formula given by thecode can be used to calculate the RAC beam shear capacity. For the ratio of the testvalue to the calculated value, as well as the average value of the approximatecalculation model of coefficient and the COV, see Table 10.6. For convenience, thisbook adopted the following values of model error (mean values and COV) of shearcapacity for different types of beams: (a) 1.7 and 0.15 for the ordinary concretebeam without stirrups; (b) 1.5 and 0.15 for the ordinary concrete beam with stirrups;(c) 1.7 and 0.18 for RAC beam without stirrups; and (d) 1.5 and 0.18 for RAC beamwith stirrups.
10.2 RAC Semi-precast Beams
Till now, almost every research on RAC were limited to areas of monolithic(wholly cast-in-situ) structures. Moreover, the properties of RAC are greatlyinfluenced by different methods of mix proportion [16], and it is clearly known thatmixing concrete will be controlled much better in a plant condition. Therefore, theauthors suggests that RAC components should be produced in precast plants inorder to take advantages of precast structure and ensure the quality of constructions.With regard to frame structures, the connections between precast beams and columnsplay an important role in determining the success of the precast concrete frames[17–19]. Consequently, cast-in-situ connections have been used popularly due toproviding ductile behavior, having equivalent seismic performance as monolithicstructures. Therefore, the application of semi-precast elements is an effective solutionto precast frame made of RAC which will attain both quality of components andgood seismic performance of connections compared with precast hybrid framesjointed with no post-tension [20, 21]. Besides, in order to move connection areasaway from column faces, a U-typed section is proposed as other alternative toC-typed section which is popularly used in the field of precast constructions.
Table 10.6 Approximate calculation model of coefficient
RAC beamwithoutstirrups
Ordinary concretebeam without stirrups
RAC beamwith stirrups
Ordinary concretebeam with stirrups
Average 1.6986 1.7640 1.4587 1.4181
10.1 RAC Beams 337
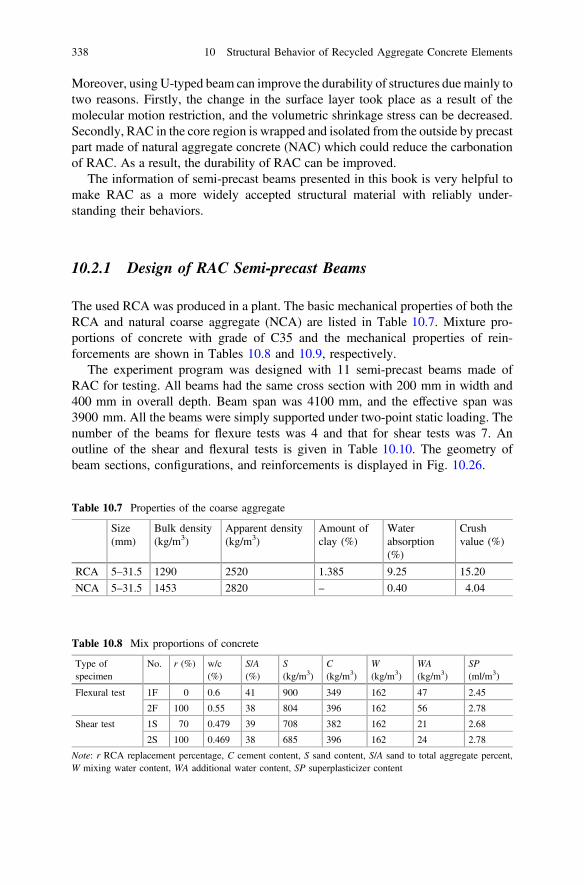
Moreover, using U-typed beam can improve the durability of structures due mainly totwo reasons. Firstly, the change in the surface layer took place as a result of themolecular motion restriction, and the volumetric shrinkage stress can be decreased.Secondly, RAC in the core region is wrapped and isolated from the outside by precastpart made of natural aggregate concrete (NAC) which could reduce the carbonationof RAC. As a result, the durability of RAC can be improved.
The information of semi-precast beams presented in this book is very helpful tomake RAC as a more widely accepted structural material with reliably under-standing their behaviors.
10.2.1 Design of RAC Semi-precast Beams
The used RCA was produced in a plant. The basic mechanical properties of both theRCA and natural coarse aggregate (NCA) are listed in Table 10.7. Mixture pro-portions of concrete with grade of C35 and the mechanical properties of rein-forcements are shown in Tables 10.8 and 10.9, respectively.
The experiment program was designed with 11 semi-precast beams made ofRAC for testing. All beams had the same cross section with 200 mm in width and400 mm in overall depth. Beam span was 4100 mm, and the effective span was3900 mm. All the beams were simply supported under two-point static loading. Thenumber of the beams for flexure tests was 4 and that for shear tests was 7. Anoutline of the shear and flexural tests is given in Table 10.10. The geometry ofbeam sections, configurations, and reinforcements is displayed in Fig. 10.26.
Table 10.7 Properties of the coarse aggregate
Size(mm)
Bulk density(kg/m3)
Apparent density(kg/m3)
Amount ofclay (%)
Waterabsorption(%)
Crushvalue (%)
RCA 5–31.5 1290 2520 1.385 9.25 15.20
NCA 5–31.5 1453 2820 – 0.40 4.04
Table 10.8 Mix proportions of concrete
Type ofspecimen
No. r (%) w/c(%)
S/A(%)
S(kg/m3)
C(kg/m3)
W(kg/m3)
WA(kg/m3)
SP(ml/m3)
Flexural test 1F 0 0.6 41 900 349 162 47 2.45
2F 100 0.55 38 804 396 162 56 2.78
Shear test 1S 70 0.479 39 708 382 162 21 2.68
2S 100 0.469 38 685 396 162 24 2.78
Note: r RCA replacement percentage, C cement content, S sand content, S/A sand to total aggregate percent,W mixing water content, WA additional water content, SP superplasticizer content
338 10 Structural Behavior of Recycled Aggregate Concrete Elements

For the series of beams with U-shaped precast part, the contact surface betweenthe cast-in-situ and precast parts was plane and natural, while that of beams withC-shaped was rough and artificial (Fig. 10.27). The roughness of interface wasproduced by a brush or comb-scratched. The roughness is defined as a depthbetween upper and lower peaks, which is averages of the 5 maximum peaks (JIS B0031-1994). In this study, the roughness of the interface was designed to be within6 mm.
Arrangements of instruments and measurements are shown in Fig. 10.28. Linearvariable differential transformers (LVDTs) were used to measure the deflection ofbeam and the width of inclined cracks. Strain gauges were installed on the beamsurface, reinforcements, and stirrups to monitor strain of concrete and steel rebarsduring testing.
Loading protocol was based on China specification Standard Test Method forConcrete Structures (GB50152-2012) [1]. All beams were loaded to about 20% ofthe calculated flexural (shear) cracking load and unloaded to check all the instru-ments. The readings of all gauges were then set to zero. Prior to cracking, beams
Table 10.9 Mechanical properties of reinforcements
Specifications Diameter(mm)
Yield strength(MPa)
Ultimate strength(MPa)
Elastic modulus(GPa)
/8 8 290 430 220
/16 16 350 540 200
/18 18 350 540 200
/22 22 380 550 200
/25 25 380 550 200
Table 10.10 Details of specimens
Type ofseries
No. Steel ratio q (%) Shearspan-to-depthratio k
Strength ofprecastconcrete fcu(MPa)
Strength ofcast-in-situconcrete fcu(MPa)
Flexuraltestseries
RF 1.03 2.4 – 44.4
UF-1 0.54 2.4 48.2 40.1
UF-2 1.03 2.4 52.9 39.1
UF-3 1.54 2.4 47.0 38.2
Sheartestseries
RS 2.47 3.0 – 43.6
CS-1 2.47 2.0 45.9 40.3
CS-2 2.47 1.5 41.8 40.2
CS-3 2.47 3.0 35.6 39.4
US-1 2.47 2.0 42.6 40.3
US-2 2.47 1.5 41.3 37.6
US-3 2.47 3.0 37.9 39.3
10.2 RAC Semi-precast Beams 339

Cast-in-situ
Precast Precast
Cast-in-situ
2
3
1
4
3 3 3
2
1
4
RFUF-1 UF-2 UF-3
(a) Flexural test
Precast
Cast-in-situ
U-Typed C-Typed RS
2
1
4
3
2
1
4
3
(b) Shear test
44 4 4
Arrangement of stirrups
(a) Flexural test (b) Shear test
Fig. 10.26 Beam configurations and reinforcements (Unit: mm)
(a) C-typed (b) U-Typed
Fig. 10.27 Precast part of beams after casting
340 10 Structural Behavior of Recycled Aggregate Concrete Elements
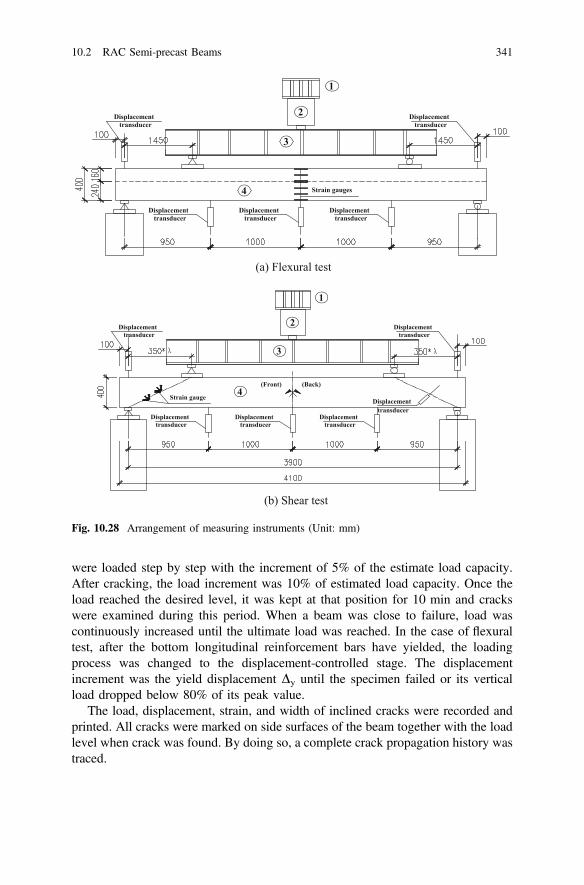
were loaded step by step with the increment of 5% of the estimate load capacity.After cracking, the load increment was 10% of estimated load capacity. Once theload reached the desired level, it was kept at that position for 10 min and crackswere examined during this period. When a beam was close to failure, load wascontinuously increased until the ultimate load was reached. In the case of flexuraltest, after the bottom longitudinal reinforcement bars have yielded, the loadingprocess was changed to the displacement-controlled stage. The displacementincrement was the yield displacement Dy until the specimen failed or its verticalload dropped below 80% of its peak value.
The load, displacement, strain, and width of inclined cracks were recorded andprinted. All cracks were marked on side surfaces of the beam together with the loadlevel when crack was found. By doing so, a complete crack propagation history wastraced.
Displacement
Strain gauges
1
2
3
4
transducer
Displacement transducer
Displacement transducer
Displacement transducer
Displacement transducer
(a) Flexural test
Strain gauge
(Front) (Back)
3
4
Displacement transducer
Displacement transducer
Displacement transducer
Displacement transducer
Displacement transducer
Displacement transducer
1
2
(b) Shear test
Fig. 10.28 Arrangement of measuring instruments (Unit: mm)
10.2 RAC Semi-precast Beams 341
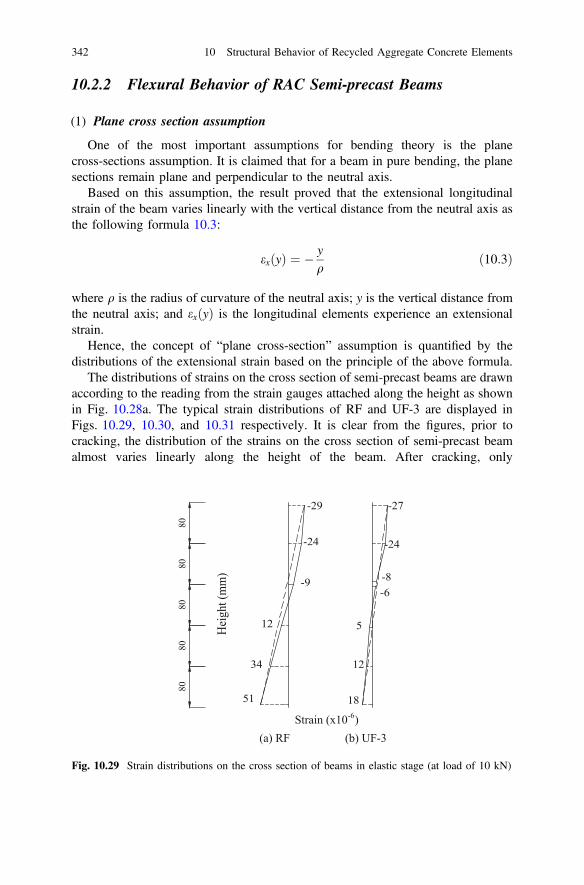
10.2.2 Flexural Behavior of RAC Semi-precast Beams
(1) Plane cross section assumption
One of the most important assumptions for bending theory is the planecross-sections assumption. It is claimed that for a beam in pure bending, the planesections remain plane and perpendicular to the neutral axis.
Based on this assumption, the result proved that the extensional longitudinalstrain of the beam varies linearly with the vertical distance from the neutral axis asthe following formula 10.3:
exðyÞ ¼ � yq
ð10:3Þ
where q is the radius of curvature of the neutral axis; y is the vertical distance fromthe neutral axis; and exðyÞ is the longitudinal elements experience an extensionalstrain.
Hence, the concept of “plane cross-section” assumption is quantified by thedistributions of the extensional strain based on the principle of the above formula.
The distributions of strains on the cross section of semi-precast beams are drawnaccording to the reading from the strain gauges attached along the height as shownin Fig. 10.28a. The typical strain distributions of RF and UF-3 are displayed inFigs. 10.29, 10.30, and 10.31 respectively. It is clear from the figures, prior tocracking, the distribution of the strains on the cross section of semi-precast beamalmost varies linearly along the height of the beam. After cracking, only
-27
-24
-8-6
5
12
18
-29
-24
-9
12
34
51
8080
8080
80
Hei
ght (
mm
)
Strain (x10-6)(a) RF (b) UF-3
Fig. 10.29 Strain distributions on the cross section of beams in elastic stage (at load of 10 kN)
342 10 Structural Behavior of Recycled Aggregate Concrete Elements

compressive strains were drawn because the contributions of the concrete in tensionzone were ignored, and the figures indicate that the distribution of the strainsapproximately varies linearly along the height of the beam. Based on the results, itcan be summarized that the plane section assumption remains valid in applicationfor semi-precast beams made of RAC.
(2) Cracking behavior
The first crack in pure bending or flexure-shear zone near the load point wereformed at the load of 20, 10, 40 and 30 kN for UF-1, UF-2, UF-3 and RF, respec-tively. After some stages of loading, the rate of crack development slowed down.
-142
-102
-3
-637
-254
-823
-358
-25
-1486
-300
-70
-3
-16
Hei
ght (
mm
)
110kN 140kN95kN40kN
Strain (x10-6)
8080
8080
80
Fig. 10.30 Strain distributions on the cross section of beam RF in post-elastic stage
Hei
ght (
mm
)
-39
-443
-603
110kN 140kN95kN
-42
-564
-794-509
-384
-38
-181
-158
-31-28
40kN
8080
8080
80
-1046
-718
-52
180kN
Strain (x10-6)
Fig. 10.31 Strain distributions on the cross section of beam UF-3 in post-elastic stage
10.2 RAC Semi-precast Beams 343
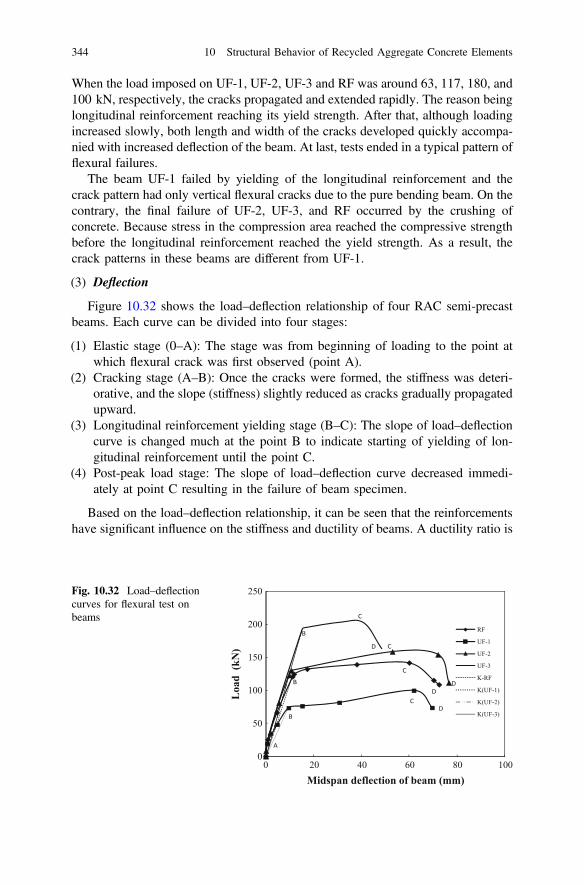
When the load imposed on UF-1, UF-2, UF-3 and RF was around 63, 117, 180, and100 kN, respectively, the cracks propagated and extended rapidly. The reason beinglongitudinal reinforcement reaching its yield strength. After that, although loadingincreased slowly, both length and width of the cracks developed quickly accompa-nied with increased deflection of the beam. At last, tests ended in a typical pattern offlexural failures.
The beam UF-1 failed by yielding of the longitudinal reinforcement and thecrack pattern had only vertical flexural cracks due to the pure bending beam. On thecontrary, the final failure of UF-2, UF-3, and RF occurred by the crushing ofconcrete. Because stress in the compression area reached the compressive strengthbefore the longitudinal reinforcement reached the yield strength. As a result, thecrack patterns in these beams are different from UF-1.
(3) Deflection
Figure 10.32 shows the load–deflection relationship of four RAC semi-precastbeams. Each curve can be divided into four stages:
(1) Elastic stage (0–A): The stage was from beginning of loading to the point atwhich flexural crack was first observed (point A).
(2) Cracking stage (A–B): Once the cracks were formed, the stiffness was deteri-orative, and the slope (stiffness) slightly reduced as cracks gradually propagatedupward.
(3) Longitudinal reinforcement yielding stage (B–C): The slope of load–deflectioncurve is changed much at the point B to indicate starting of yielding of lon-gitudinal reinforcement until the point C.
(4) Post-peak load stage: The slope of load–deflection curve decreased immedi-ately at point C resulting in the failure of beam specimen.
Based on the load–deflection relationship, it can be seen that the reinforcementshave significant influence on the stiffness and ductility of beams. A ductility ratio is
C
D
B
CD
B
C
D
A
B
C
D
0
50
100
150
200
250
0 20 40 60 80 100
Loa
d (k
N)
Midspan deflection of beam (mm)
RF
UF-1
UF-2
UF-3
K-RF
K(UF-1)
K(UF-2)
K(UF-3)
Fig. 10.32 Load–deflectioncurves for flexural test onbeams
344 10 Structural Behavior of Recycled Aggregate Concrete Elements

defined in this study is to evaluate the deformation capability of beams underbending. It can be expressed as follows:
l ¼ Du
Dyð10:4Þ
where Dy is the yield deflection, and Du is the deflection when the load falls to 80%of the peak load. K is the bending stiffness as shown in Fig. 10.32 and is defined asfollows:
K ¼ PðBÞDy
ð10:5Þ
where P(B) is the value of load at the yield deflection.From the results shown in Table 10.11, it can be summarized that the stiffness
increases as the reinforcement ratio increases; on the contrary, the ductilitydecreases as the reinforcement ratio increases for the same type sections (UF-1,UF-2 and UF-3). The results also show that the shape of precast part has slightinfluence on the performance of beam with the same longitudinal reinforcementratio (see UF-2 and RF). The UF-2 performed not only with ductility but also withstiffness slightly greater than RF.
(4) Flexural capacity
In the current Chinese technical code entirely for RAC (SCSS, 2007 [22]), thefollowing formula is used to calculate the flexural bearing capacity of RAC beams:
Mu ¼ 0:95fyAs h0 � fyAs
2� 0:95fcb
� �ð10:6Þ
where Mu is the ultimate moment (N mm); b and h0 are the width and the effectivedepth of the section (mm); fy and As are the yield strength (MPa) and the area (mm2)of the longitudinal reinforcement; and fc is the compressive strength of concrete(MPa).
The results given in Table 10.12 indicate that the moment bearing capacity isproportional to the reinforcement ratio. The results in Table 10.12 also show thatresults derived from Eq. (10.6) are close to experimental values and confirm thefeasibility of Eq. (10.6) to calculate the flexure capacity of beam made of RAC.
Table 10.11 Ductility ratioand bending stiffness
No. Δy (mm) Δm (mm) Δl K (kN/mm)
RF 11.20 70.93 6.33 10.78
UF-1 9.59 67.84 7.07 7.66
UF-2 10.75 75.36 7.01 12.49
F-3 15.16 48.65 3.21 12.62
10.2 RAC Semi-precast Beams 345
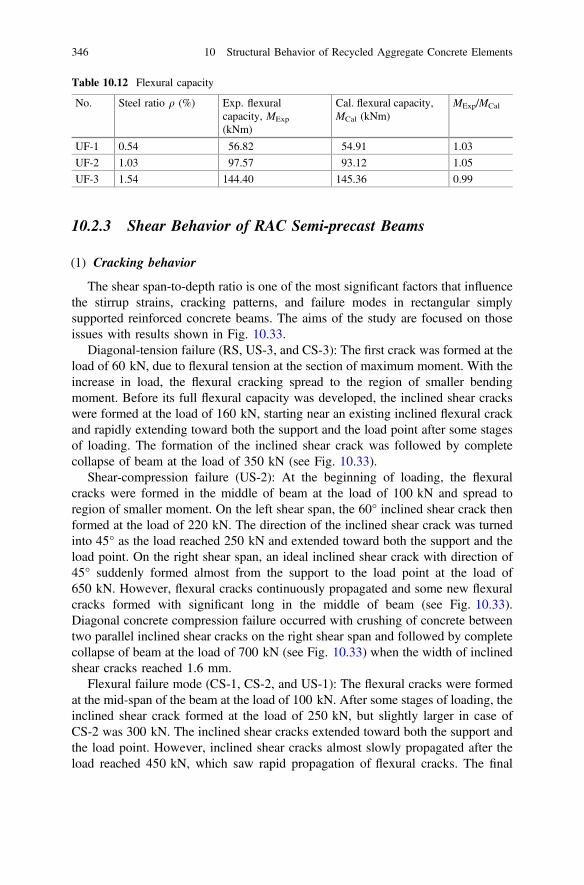
10.2.3 Shear Behavior of RAC Semi-precast Beams
(1) Cracking behavior
The shear span-to-depth ratio is one of the most significant factors that influencethe stirrup strains, cracking patterns, and failure modes in rectangular simplysupported reinforced concrete beams. The aims of the study are focused on thoseissues with results shown in Fig. 10.33.
Diagonal-tension failure (RS, US-3, and CS-3): The first crack was formed at theload of 60 kN, due to flexural tension at the section of maximum moment. With theincrease in load, the flexural cracking spread to the region of smaller bendingmoment. Before its full flexural capacity was developed, the inclined shear crackswere formed at the load of 160 kN, starting near an existing inclined flexural crackand rapidly extending toward both the support and the load point after some stagesof loading. The formation of the inclined shear crack was followed by completecollapse of beam at the load of 350 kN (see Fig. 10.33).
Shear-compression failure (US-2): At the beginning of loading, the flexuralcracks were formed in the middle of beam at the load of 100 kN and spread toregion of smaller moment. On the left shear span, the 60° inclined shear crack thenformed at the load of 220 kN. The direction of the inclined shear crack was turnedinto 45° as the load reached 250 kN and extended toward both the support and theload point. On the right shear span, an ideal inclined shear crack with direction of45° suddenly formed almost from the support to the load point at the load of650 kN. However, flexural cracks continuously propagated and some new flexuralcracks formed with significant long in the middle of beam (see Fig. 10.33).Diagonal concrete compression failure occurred with crushing of concrete betweentwo parallel inclined shear cracks on the right shear span and followed by completecollapse of beam at the load of 700 kN (see Fig. 10.33) when the width of inclinedshear cracks reached 1.6 mm.
Flexural failure mode (CS-1, CS-2, and US-1): The flexural cracks were formedat the mid-span of the beam at the load of 100 kN. After some stages of loading, theinclined shear crack formed at the load of 250 kN, but slightly larger in case ofCS-2 was 300 kN. The inclined shear cracks extended toward both the support andthe load point. However, inclined shear cracks almost slowly propagated after theload reached 450 kN, which saw rapid propagation of flexural cracks. The final
Table 10.12 Flexural capacity
No. Steel ratio q (%) Exp. flexuralcapacity, MExp
(kNm)
Cal. flexural capacity,MCal (kNm)
MExp/MCal
UF-1 0.54 56.82 54.91 1.03
UF-2 1.03 97.57 93.12 1.05
UF-3 1.54 144.40 145.36 0.99
346 10 Structural Behavior of Recycled Aggregate Concrete Elements

failure occurred by crushing of concrete in the compression zone when the loadreached its full flexural capacity of CS-1, CS-2, and US-1 at the load of 515, 725and 524 kN respectively (see Fig. 10.33). In fact, the width of inclined shear crackreached 1.5 mm at the load of 690 kN and beam CS-2 can be considered asshear-compression failure like US-2.
(2) Deflection
Figure 10.34 shows the load–deflection relationship of seven RAC semi-precastbeams. Each curve can be divided into two stages:
(a) RS (b) US-3
(c) CS-3 (d) US-2
(e) US-1
(f) CS-1
(g) CS-2
Fig. 10.33 Failure pattern of the shear test beams
10.2 RAC Semi-precast Beams 347

(1) Flexural cracking stage: the stage from beginning of loading to the point atwhich inclined shear crack was firstly observed.
(2) Inclined shear cracking stage: the stage from the point of the inclined shearcrack initiation to the ultimate load.
After the ultimate load, all beams immediately were collapsed because all fail-ures were in brittle mode. The load–deflection curves are similar to each other withthe same shear span-to-depth ratio. The results reveal that slope of the curveincreases as the shear span-to-depth ratio decreases.
(3) Principal tensile stress
One of the aims of the study is to determine the principal tensile stress fromstrain gauges adhered on beams (see Fig. 10.35b) and verify inclined shear crack
0
100
200
300
400
500
600
700
800
900
0 5 10 15 20 25 30 35
Mid-span deflection (mm)
RS
US-3
CS-3
CS-1
US-1
CS-2
US-2
Loa
d ( k
N)
Fig. 10.34 Load–deflectioncurves of the shear test beams
εθ
ε measured inthis direction
cb
a
(a) Location of strain. (b) Geometry of rectangular rosette.
Fig. 10.35 Measurements of strains and reference axes
348 10 Structural Behavior of Recycled Aggregate Concrete Elements

through the comparison principal tensile stress with uniaxial tensile strength ofconcrete.
According to the theory of elastic, the direct stress on a surface in directionsx and y is given by:
rx ¼ Eð1� m2Þ ðex þ meyÞ ð10:7aÞ
ry ¼ Eð1� m2Þ ðey þ mexÞ ð10:7bÞ
E Modulus of elasticity;m Poisson’s ratio;ex Unit strain in x direction; andey Unit strain in y direction.
And the shear stress is given by
sxy ¼ cxyE
2ð1þ mÞ ð10:8Þ
The strain eh at any direction h from the x-axis (Fig. 10.35a) is related to theorthogonal normal strains of ex and ey and the shearing strain cxy by the expression
eh ¼ ex þ ey2
þ ex � ey2
cos 2hþ cxy2sin 2h ð10:9Þ
Figure 10.35b shows the rectangular rosette geometry and the correspondingsine and cosine function. Thus, from above equations, one obtains:
ea ¼ ex ex ¼ eaeb ¼ 0:5ðex þ eyÞþ 0:5cxy cxy ¼ 2eb � ðea þ ecÞec ¼ ey ey ¼ ec
ð10:10Þ
As ex, ey, and cxy are known through the values of ea, eb, and ec by strain gauges,the principal strains can be obtained from Eq. (10.6), and then, those results can inturn be substituted into Eqs. (10.7a, b) and (10.8) to obtain the principal stress:
r1;2 ¼ Eea þ ec2ð1� mÞ �
ffiffiffiffiffiffiffiffiffiffiffiffiffiffiffiffiffiffiffiffiffiffiffiffiffiffiffiffiffiffiffiffiffiffiffiffiffiffiffiffiffiffiffiffiffiffiffiffiffiffiffiffiffiffiffiffiffiffiffiðea � ecÞ2 þ 2eb � ðea þ ecÞ2
h ir2ð1þ mÞ
8>><>>:
9>>=>>; ð10:11Þ
hp ¼ 12tan�1 2eb � ðea þ ecÞ
ea � ecð10:12Þ
10.2 RAC Semi-precast Beams 349

smax ¼ E2ð1þ mÞ
ffiffiffiffiffiffiffiffiffiffiffiffiffiffiffiffiffiffiffiffiffiffiffiffiffiffiffiffiffiffiffiffiffiffiffiffiffiffiffiffiffiffiffiffiffiffiffiffiffiffiffiffiffiffiffiffiffiffiffiðea � ecÞ2 þ 2eb � ðea þ ecÞ2
h irð10:13Þ
In the “Technical Code for the Application of RAC” [22], a value of 0.2 isrecommended for the initial Poisson’s ratio of RAC, irrespective of the RCAreplacement percentage. Based on the research by Xiao et al. [23], the followingequations were proposed for predicting the unaxial tensile strength from the com-pressive strength and the elastic modulus Ec
ft ¼ ð0:24� arÞf 2=3cu ð10:14Þ
Ec ¼ 105
2:8þ 40:1=fcuð Þ ð10:15Þ
where ft and fcu are the unaxial tensile strength and cube compressive strength ofRAC, respectively. Parameter r is the RCA replacement percentage, and parametera = 0.06. The results of properties of the specimens are given in Table 10.13.
The principal tensile stresses rmax in Table 10.14 exceed the tensile strengths ofconcrete ft in Table 10.13, respectively, and by testing. Width of inclined shearcracks needs to be sufficiently large in order to observe visually so the values ofload level marked on beam were higher than those in Table 10.14.
(4) Interface phenomenon
These interactions of semi-precast beam may be of physical or chemical natureand strongly dependent on interfacial interactions. The change in the surface layertook place as a result of the molecular motion restriction. Besides, the type offinishing and the roughness of the contact surface also influence the cohesivestrength (bond strength). Paulay et al. [24] presented that adequate constructionjoint with clean and rough surface can develop sufficient shear capacity corre-sponding to monolithic concrete.
The inside of the inclined shear cracks of the semi-precast beams confirmed avery good composite action between the precast part and the cast-in-situ part (seeFig. 10.36). In case of C-shaped precast part beams, because the interface was
Table 10.13 Mechanical properties of RAC
No. r fcu (MPa) ft (MPa) Ec (GPa) m
RS 1.0 45.9 2.3 27.2 0.2
CS-1 0.7 37.9 2.2 25.9 0.2
US-1 0.7 43.6 2.5 26.8 0.2
CS-2 0.7 42.6 2.4 26.7 0.2
US-2 0.7 41.3 2.4 26.5 0.2
US-3 0.7 41.8 2.4 26.6 0.2
CS-3 0.7 35.6 2.1 25.5 0.2
350 10 Structural Behavior of Recycled Aggregate Concrete Elements

artificial and rough, the interface slip phenomenon did not occur. For U-typedbeams, the interface was natural and plane, the fraction of crushing concrete revealsthat interface of semi-precast can be considered in further study. When the shearspan-to-depth ratio is large, the shear capacities of US-3 (178.8 kN) and US-1(262.2 kN) are relatively small; the cohesive strength between cast-in-situ andprecast part is high enough to ensure that both of the parts work well together.However, when the shear span-to-depth ratio is small, the shear capacity of US-2(359.4 kN) is relatively high, and the shear force is big enough to damage thebinding force of surface between cast-in-situ and precast part. As a result,the separation of them occurred along with shear-compression failure mode of thebeam.
Table 10.14 Principal tensile stress at point of attached strain gauges
No. Time Load (kN) Strain e rmax (MPa)
a b c
RS 8/30/2011 10:53 150.9 73 126 60 3.64
CS-3 9/1/2011 15:43 255.6 −492 196 −18 2.80
US-3 8/31/2011 11:06 221.0 45 112 59 2.92
CS-1 9/8/2011 10:06 350.4 325 641 276 2.31
US-1 9/5/2011 10:45 192.3 78 89 5 2.74
CS-2 9/6/2011 11:25 420.8 −51 172 45 3.94
US-2 9/7/2011 10:56 623.9 −252 203 −97 2.73
(a) CS-1 (b) CS-2 (c) CS-3
(d) US-1 (e) US-2 (f) US-3
Fig. 10.36 Exposed cracks of failed shear test beams
10.2 RAC Semi-precast Beams 351

(5) Shear capacity
According to the Chinese technical code entirely for RAC (SCSS, 2007 [22]),the shear capacity of RAC beam is calculated by the following formula:
Vcs ¼ 1:75kþ 1
ftbh0 þ fyvAsv
sh0 ð10:16Þ
in which ft is the tensile strength of RAC (MPa); fyv, Asv, and s are the yield strength(MPa), the area (mm2), and the spacing of the stirrups (mm), respectively; b and h0are the width and the effective height of the section (mm); and k is shearspan-to-depth ratio, respectively.
Indeed, the ultimate shear capacity is conveniently considered as a function of k,and the results of ultimate shear capacity can be interpreted as below: When kexceeds about 2.5, the shear cracking load Vcr represents ultimate shear capacity Vu,and there is no reserve strength beyond cracking load. In beams with k smaller than2.5, Vu is higher than Vcr. The reserve capacity Vr ¼ Vu � Vcr becomes higher as kdecreases. As k become larger, Vcr and Vu become smaller. Ultimate shear capacityVu of CS-2 is slightly higher than that of US-2 because that value is correspondedwith full flexural capacity of CS-2 beam which is proved with flexural failure modeby crushing of concrete in the compression zone (see Fig. 10.37).
10.3 RAC Slabs
10.3.1 Flexural Behavior of RAC Gradient Slabs
The concept functionally gradient material (FGM) was first presented by Japanesescholars in 1987 [25], aiming at effectively solving the problem of heat resistance ofaviation equipment. In the recent 15 years, this topic in the field of ceramic andmetal has been studied around the world.
The previous investigation [26–28] on the fundamental mechanical properties ofRAC has proved that the strength and elastic modulus of RAC decrease with theincrease in RCA replacement percentages (see Fig. 10.38). The author tried tocombine this tendency of RAC to “gradient” in this section, and the new concept“gradient RAC” was put forward. In order to achieve gradient distribution of therecycled concrete mechanical properties, a method changing the RCA distributionin a certain direction was induced and proposed, as shown in Fig. 10.39. Becausethere is no instrument available for RCA non-uniform distribution, in this sectionthe method of casting/pouring RAC with different RCA replacement percentagesand constructing stratified vibrators was applied, as shown in Fig. 10.40. The RCAreplacement percentages of each layer are different, so the mechanical properties ofconcrete along the thickness direction of the slabs will vary. Also, because thedifferences between the layers are only reflected in the mechanical properties, each
352 10 Structural Behavior of Recycled Aggregate Concrete Elements

Shear force corresponding with theoretical full flexural capacity
Reserve capacity VrMeasured failure shear force Vu
Observed shear cracking load Vcr
Shear span-to-depth ratio
Shea
r fo
rce
(kN
)
1 2 3 4 5 6 7 80 1.5
Vu of RS, US-3 and CS-3
89
178
267
356
445
Vu of US-1 and CS-1
Vu of US-2
Vu of CS-2
(Woo 1987)
Fig. 10.37 Variation of load-carrying capacities of reinforced concrete beams plotted againstshear span-to-depth ratio
Fig. 10.38 Elastic modulus and compressive strength as a function of RCA replacementpercentage
10.3 RAC Slabs 353

layer of material is still essentially concrete and the nature of the transition betweenlayers are mild without mutations. Theoretical analysis and varying parameters ofFEM analysis, the flexural behavior of gradient slabs with RAC will be intensivelyanalyzed based on the test results.
10.3.1.1 Design of RAC Gradient Slabs
In the study, 6 gradient slabs with RAC and 3 homogeneous slabs with RAC weredesigned. The RCA consisted of 60% coarse aggregates with the size of 5–15 mmand 40% of coarse aggregates with the size of 15–25 mm, while the NCAs arecontinuous-grading gravel. The basic properties of RCA are given in Table 10.15.The cement used was ordinary Portland cement P.O. 42.5. Ordinary medium riversand was used as fine aggregates, and water was Shanghai municipality tap water.The mixing proportions of NAC and RAC are shown in Table 10.16, and themechanical behaviors of the concrete at 28 days are presented in Table 10.17. Themechanical properties of the reinforcements are listed in Table 10.18.
RCA NCA mechanical property
Fig. 10.39 Gradient slabwith RAC
RCA NCA mechanical property
Fig. 10.40 Simplifiedgradient slab with RAC
Table 10.15 RCA properties
Coarse aggregates type Bulk density(kg/m3)
Apparent density(kg/m3)
Water absorptionrate (%)
Crushvalue (%)
Non-washed recycledaggregates
1115 2493 12.6 26.5
Washed recycledaggregates
1280 2520 5.4 11.0
354 10 Structural Behavior of Recycled Aggregate Concrete Elements
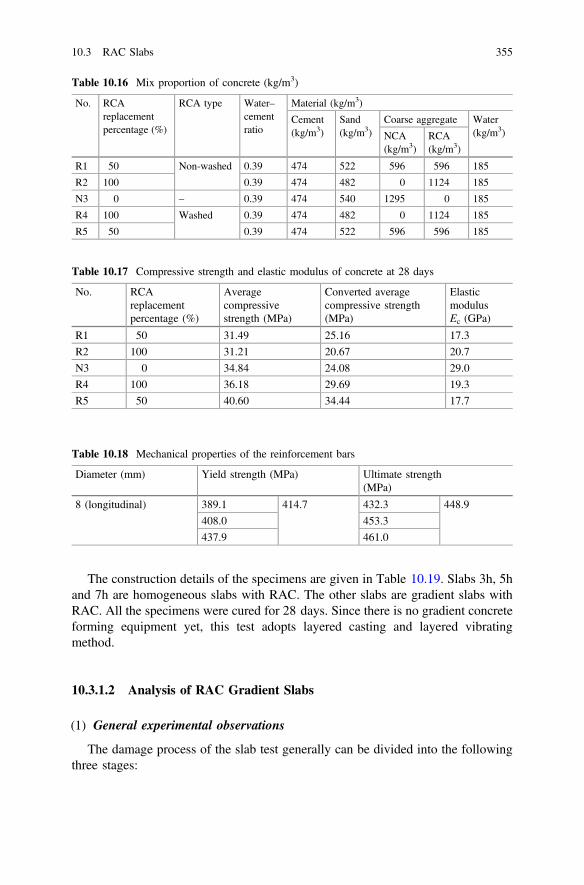
The construction details of the specimens are given in Table 10.19. Slabs 3h, 5hand 7h are homogeneous slabs with RAC. The other slabs are gradient slabs withRAC. All the specimens were cured for 28 days. Since there is no gradient concreteforming equipment yet, this test adopts layered casting and layered vibratingmethod.
10.3.1.2 Analysis of RAC Gradient Slabs
(1) General experimental observations
The damage process of the slab test generally can be divided into the followingthree stages:
Table 10.16 Mix proportion of concrete (kg/m3)
No. RCAreplacementpercentage (%)
RCA type Water–cementratio
Material (kg/m3)
Cement(kg/m3)
Sand(kg/m3)
Coarse aggregate Water(kg/m3)NCA
(kg/m3)RCA(kg/m3)
R1 50 Non-washed 0.39 474 522 596 596 185
R2 100 0.39 474 482 0 1124 185
N3 0 – 0.39 474 540 1295 0 185
R4 100 Washed 0.39 474 482 0 1124 185
R5 50 0.39 474 522 596 596 185
Table 10.17 Compressive strength and elastic modulus of concrete at 28 days
No. RCAreplacementpercentage (%)
Averagecompressivestrength (MPa)
Converted averagecompressive strength(MPa)
ElasticmodulusEc (GPa)
R1 50 31.49 25.16 17.3
R2 100 31.21 20.67 20.7
N3 0 34.84 24.08 29.0
R4 100 36.18 29.69 19.3
R5 50 40.60 34.44 17.7
Table 10.18 Mechanical properties of the reinforcement bars
Diameter (mm) Yield strength (MPa) Ultimate strength(MPa)
8 (longitudinal) 389.1 414.7 432.3 448.9
408.0 453.3
437.9 461.0
10.3 RAC Slabs 355

(1) At the beginning of the test, flexural moment is relatively small, and the crosssection is uncracked. The specimens showed elastic deformation characteristics,and the load–deflection curve approximates a straight line. When the loadincreased close to the cracking load, the slabs showed a certain degree ofplasticity performance despite the cross section not having any cracks, but thedeflection curve has a trend to grow faster;
(2) When the moment reached the cracking moment, one or more vertical cracksappeared in the pure bending section. Cracks developed to a certain height onceappear, but the crack width is relatively small. In this case, the load–deflectioncurve appeared at the first transition point, and stress of reinforcement signif-icantly increased compared with that before cracking. Even though the defor-mation curve is not straight, in general the deformation is still stable as well asthe loading ability. With the increasing loading, steel and concrete strainincreased as well as the number and width of cracks. However, these changesare very stable. The test showed that gradient slabs with RAC with crackssession had stable performance;
(3) When the reinforcement strain gradually increases to a certain stage, the rein-forcement exhibited characteristics of plastic deformation, and the deflection ofthe concrete slab increased faster. When the tensile reinforcement yielded, thesecond twist of the load–deflection curve appeared. With the development ofstrain of reinforcement, the crack width reached the failure value. But the slabsdid not immediately fail with further loading, and the load and deflection kepton increasing. When the concrete under compression is crushed, the loadreaches the ultimate value.
(2) Plane cross section assumption
Figure 10.41 shows the relationship between load and concrete strain. Twostrain gauges were relatively uniform, and the slab reverse loading process was notcarried out. When the specimens were going to fail, the strain gauges on the
Table 10.19 Construction details of the slabs
Slab No. RCA replacementpercentage distributionfrom bottom to top (%)
Concretenumber frombottom to top
Longitudinalreinforcementratio (%)
Entirecross-sectionsize (mm2)
3f-1 0-100-50 N3-R4-R5 0.42 400 � 90
5f-1 0.70
7f-1 0.98
3h 50 R1 0.42
5h 0.70
7h 0.98
3f-2 50-100-0 R1-R2-N3 0.42
5f-2 0.70
7f-2 0.98
356 10 Structural Behavior of Recycled Aggregate Concrete Elements

concrete surface had been damaged, and it is difficult to collect concrete surfacestrain at the late stages of loading.
The plane cross section assumption states that for a beam or a slab in purebending, the plane cross sections remain plane and perpendicular to the neutral axis.Figure 10.42 shows the concrete strain distribution along the section height of themid-span section under different load levels. According to the measurement data,the average strain of concrete is still proportional to the distance to the neutral axis.So the plane cross section assumption is also feasible for the gradient slabs withRAC cross section.
(3) Failure pattern of the specimen
At bending failure stage, all specimens’ concrete crushed in the compression zoneand no longitudinal reinforcement was pulled out. Limited by space of the testingmachine, the compression zone concrete of the slab with reinforcement ratio 0.42%was not crushed. Crack distribution is shown in Fig. 10.43. The flexural behaviorsof the gradient slabs with RAC are similar to that of normal concrete slabs.
0 500 1000 1500 2000 2500 30000
5
10
15
20
25
3h(a) 3h(b)
0 500 1000 1500 2000 2500 3000 3500 4000 45000
5
10
15
20
25
30
35
5h(a) 5h(b)
0 500 1000 1500 2000 2500 3000 3500 4000 4500 5000 55000
5
10
15
20
25
30
35
40
45
7h(a) 7h(b)
0 500 1000 1500 20000
5
10
15
3f-1(a) 3f-1(b)
0 500 1000 1500 2000 2500 30000
5
10
15
20
25
30
35
5f-1(a) 5f-1(b)
0 500 1000 1500 2000 2500 3000 3500 40000
5
10
15
20
25
30
35
40
45
7f-1(a) 7f-1(b)
0 500 1000 1500 2000 2500 3000 3500 40000
5
10
15
20
3f-2(a) 3f-2(b)
0 500 1000 1500 2000 2500 3000 3500 40000
5
10
15
20
25
30
35
5f-2(a) 5f-2(b)
0 500 1000 1500 2000 2500 3000 3500 40000
5
10
15
20
25
30
35
40
45
7f-2(a) 7f-2(b)
(a) 3h (b) 5h (c) 7h
(d) 3f-1 (e) 5 f-1 (f) 7 f-1
(g) 3f-2 (h) 5f-2 (i) 7f-2
Fig. 10.41 Strain curves for load on top surface of concrete slab
10.3 RAC Slabs 357
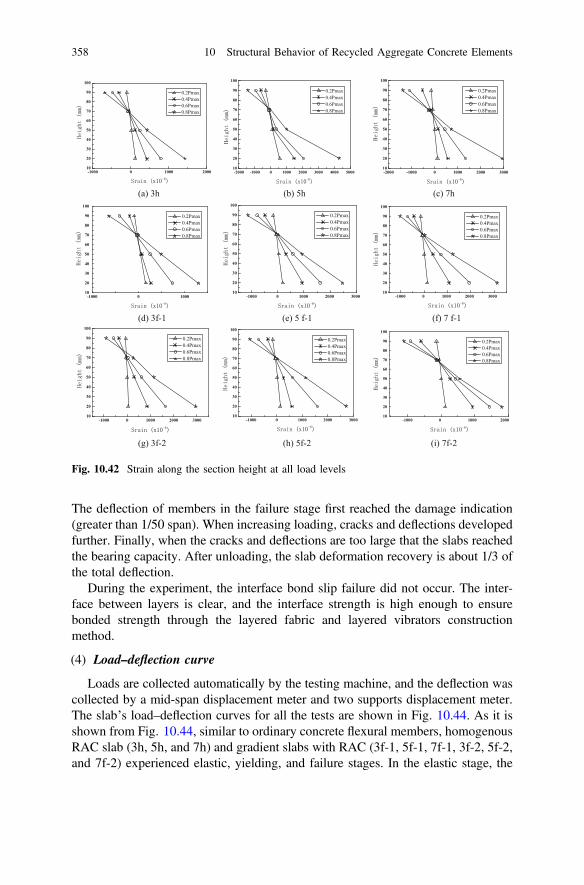
The deflection of members in the failure stage first reached the damage indication(greater than 1/50 span). When increasing loading, cracks and deflections developedfurther. Finally, when the cracks and deflections are too large that the slabs reachedthe bearing capacity. After unloading, the slab deformation recovery is about 1/3 ofthe total deflection.
During the experiment, the interface bond slip failure did not occur. The inter-face between layers is clear, and the interface strength is high enough to ensurebonded strength through the layered fabric and layered vibrators constructionmethod.
(4) Load–deflection curve
Loads are collected automatically by the testing machine, and the deflection wascollected by a mid-span displacement meter and two supports displacement meter.The slab’s load–deflection curves for all the tests are shown in Fig. 10.44. As it isshown from Fig. 10.44, similar to ordinary concrete flexural members, homogenousRAC slab (3h, 5h, and 7h) and gradient slabs with RAC (3f-1, 5f-1, 7f-1, 3f-2, 5f-2,and 7f-2) experienced elastic, yielding, and failure stages. In the elastic stage, the
-1000 0 1000 200010
20
30
40
50
60
70
80
90
100
0.2Pmax0.4Pmax0.6Pmax0.8Pmax
-2000 -1000 0 1000 2000 3000 4000 500010
20
30
40
50
60
70
80
90
100
0.2Pmax0.4Pmax0.6Pmax0.8Pmax
-2000 -1000 0 1000 2000 300010
20
30
40
50
60
70
80
90
100
0.2Pmax0.4Pmax0.6Pmax0.8Pmax
-1000 0 100010
20
30
40
50
60
70
80
90
100
0.2Pmax0.4Pmax0.6Pmax0.8Pmax
-1000 0 1000 2000 300010
20
30
40
50
60
70
80
90
100
0.2Pmax0.4Pmax0.6Pmax0.8Pmax
-1000 0 1000 2000 300010
20
30
40
50
60
70
80
90
100
0.2Pmax0.4Pmax0.6Pmax0.8Pmax
-1000 0 1000 2000 300010
20
30
40
50
60
70
80
90
100
0.2Pmax0.4Pmax0.6Pmax0.8Pmax
-1000 0 1000 2000 300010
20
30
40
50
60
70
80
90
100
0.2Pmax0.4Pmax0.6Pmax0.8Pmax
-1000 0 1000 200010
20
30
40
50
60
70
80
90
100
0.2Pmax0.4Pmax0.6Pmax0.8Pmax
(a) 3h (b) 5h (c) 7h
(d) 3f-1 (e) 5 f-1 (f) 7 f-1
(g) 3f-2 (h) 5f-2 (i) 7f-2
Fig. 10.42 Strain along the section height at all load levels
358 10 Structural Behavior of Recycled Aggregate Concrete Elements

relationship between load and deflection was nearly linear. From cracking stage tothe longitudinal reinforcement yielding stage, the relationship between load anddeflection growth became nonlinear. After the longitudinal reinforcement yielded,there was a gradual increase in the load, while the deflection increases rapidly, andthe curve was close to a horizontal relationship.
No. Crack distribution of gradient slabs with RAC
3f-1
5f-1
7f-1
3f-2
5f-2
7f-2
3h
5h
7h
Fig. 10.43 Crack distribution of gradient slabs with RAC
10.3 RAC Slabs 359
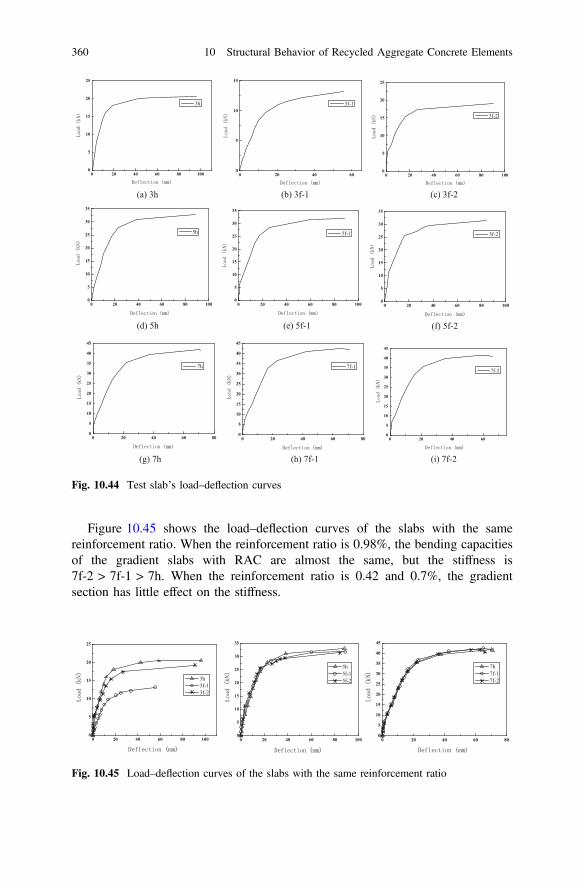
Figure 10.45 shows the load–deflection curves of the slabs with the samereinforcement ratio. When the reinforcement ratio is 0.98%, the bending capacitiesof the gradient slabs with RAC are almost the same, but the stiffness is7f-2 > 7f-1 > 7h. When the reinforcement ratio is 0.42 and 0.7%, the gradientsection has little effect on the stiffness.
0 20 40 60 80 1000
5
10
15
20
25
3h
0 20 40 600
5
10
15
3f-1
0 20 40 60 80 1000
5
10
15
20
25
3f-2
0 20 40 60 80 1000
5
10
15
20
25
30
35
5h
0 20 40 60 80 1000
5
10
15
20
25
30
35
5f-1
0 20 40 60 80 1000
5
10
15
20
25
30
35
5f-2
0 20 40 60 800
5
10
15
20
25
30
35
40
45
7h
0 20 40 60 800
5
10
15
20
25
30
35
40
45
7f-1
0 20 40 600
5
10
15
20
25
30
35
40
45
7f-2
(a) 3h (b) 3f-1 (c) 3f-2
(d) 5h (e) 5f-1 (f) 5f-2
(g) 7h (h) 7f-1 (i) 7f-2
Fig. 10.44 Test slab’s load–deflection curves
0 20 40 60 80 1000
5
10
15
20
25
3h3f-13f-2
0 20 40 60 80 1000
5
10
15
20
25
30
35
5h5f-15f-2
0 20 40 60 800
5
10
15
20
25
30
35
40
45
7h7f-17f-2
Fig. 10.45 Load–deflection curves of the slabs with the same reinforcement ratio
360 10 Structural Behavior of Recycled Aggregate Concrete Elements
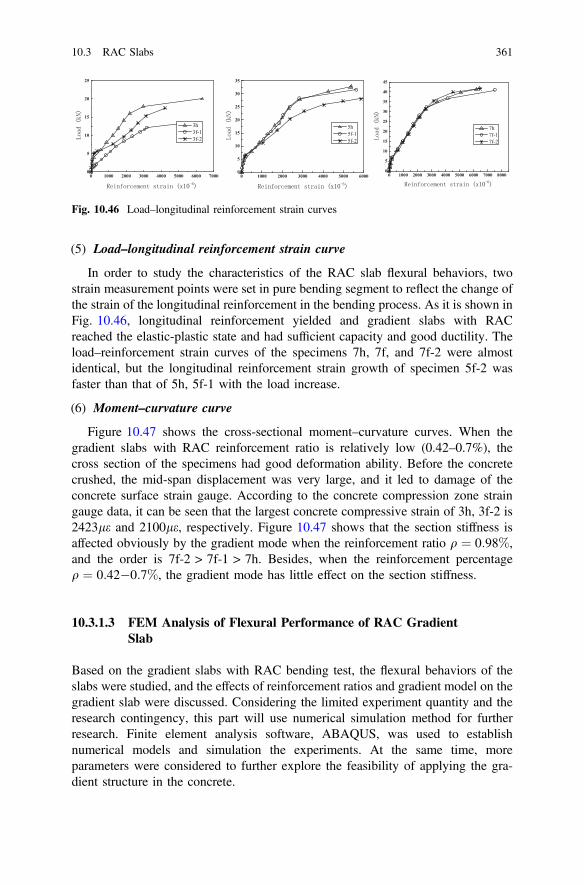
(5) Load–longitudinal reinforcement strain curve
In order to study the characteristics of the RAC slab flexural behaviors, twostrain measurement points were set in pure bending segment to reflect the change ofthe strain of the longitudinal reinforcement in the bending process. As it is shown inFig. 10.46, longitudinal reinforcement yielded and gradient slabs with RACreached the elastic-plastic state and had sufficient capacity and good ductility. Theload–reinforcement strain curves of the specimens 7h, 7f, and 7f-2 were almostidentical, but the longitudinal reinforcement strain growth of specimen 5f-2 wasfaster than that of 5h, 5f-1 with the load increase.
(6) Moment–curvature curve
Figure 10.47 shows the cross-sectional moment–curvature curves. When thegradient slabs with RAC reinforcement ratio is relatively low (0.42–0.7%), thecross section of the specimens had good deformation ability. Before the concretecrushed, the mid-span displacement was very large, and it led to damage of theconcrete surface strain gauge. According to the concrete compression zone straingauge data, it can be seen that the largest concrete compressive strain of 3h, 3f-2 is2423le and 2100le, respectively. Figure 10.47 shows that the section stiffness isaffected obviously by the gradient mode when the reinforcement ratio q ¼ 0:98%,and the order is 7f-2 > 7f-1 > 7h. Besides, when the reinforcement percentageq ¼ 0:42�0:7%, the gradient mode has little effect on the section stiffness.
10.3.1.3 FEM Analysis of Flexural Performance of RAC GradientSlab
Based on the gradient slabs with RAC bending test, the flexural behaviors of theslabs were studied, and the effects of reinforcement ratios and gradient model on thegradient slab were discussed. Considering the limited experiment quantity and theresearch contingency, this part will use numerical simulation method for furtherresearch. Finite element analysis software, ABAQUS, was used to establishnumerical models and simulation the experiments. At the same time, moreparameters were considered to further explore the feasibility of applying the gra-dient structure in the concrete.
0 1000 2000 3000 4000 5000 6000 70000
5
10
15
20
25
3h3f-13f-2
0 1000 2000 3000 4000 5000 60000
5
10
15
20
25
30
35
5h5f-15f-2
0 1000 2000 3000 4000 5000 6000 7000 80000
5
10
15
20
25
30
35
40
45
7h7f-17f-2
Fig. 10.46 Load–longitudinal reinforcement strain curves
10.3 RAC Slabs 361

(1) Concrete model
When the replacement percentages of recycled aggregates were 50 and 100%,the compressive stress–strain curves are shown in Fig. 10.48. The curve equation isas follows:
50 00.0
2.5
5.0
3h
0 50 100 150 200 2500.0
2.5
5.0
7.5
10.0
5h
0 50 100 150 200 250 300 3500.0
2.5
5.0
7.5
10.0
12.5
7h
(a) 3h (b) 5h (c) 7h
0500.0
2.5
3f-1
0 50 100 150 2000.0
2.5
5.0
7.5
10.0
5f-1
0 50 100 150 200 250 3000.0
2.5
5.0
7.5
10.0
12.5
7f-1
(d) 3f-1 (e) 5 f-1 (f) 7 f-1
0010500.0
2.5
5.0
3f-2
0 50 100 150 200 250 3000.0
2.5
5.0
7.5
10.0
5f-2
0 50 100 150 200 2500.0
2.5
5.0
7.5
10.0
12.5
7f-2
(g) 3f-2 (h) 5f-2 (i) 7f-2
0 50 100 150 200 250 300 3500.0
2.5
5.0
7.5
10.0
12.5
15.0
3h3f-13f-25h5f-15f-27h7f-17f-2
0 50 100 150 200 250 300 3500.0
2.5
5.0
7.5
10.0
12.5
15.0
3h3f-13f-25h5f-15f-27h7f-17f-2
(j) Actually collected strain conversion (k) Board top concrete compressive strain of 2000 when moment - curvature relationship the cross-section moment - curvature relationship
Fig. 10.47 Cross-sectional moment curvature curves
362 10 Structural Behavior of Recycled Aggregate Concrete Elements

y ¼ axþ 3� 2að Þx2 þ a� 2ð Þx3; 0� x\1x
b x�1ð Þ2 þ x; x� 1
(ð10:17Þ
where x ¼ ee0, y ¼ r
fc, where e0 is peak strain under unaxial compressive stress–strain
curve, fc is the measured axial compressive strength of concrete, and the values ofparameters a and b are shown in Table 10.20.
The tension stress–strain curves equation is:
y ¼ ax� a� 1ð Þx6 ð10:18Þ
where x ¼ e=etc, y ¼ r=f rt , and a is the slope of dimensionless curves shown inTable 10.21.
According to the related literature, Table 10.21, the tensile damage variablegrows linearly with the cracking strain, and the maximum damage is 0.9.
(2) Reinforcement model
The reinforcement unaxial stress–strain curve is the double slash elastic-plasticmodel. The curve is divided into elastic and plastic branches, and the tangent
-0.001 0.000 0.001 0.002 0.003 0.004 0.005 0.006 0.007 0.008
5
10
15
20
25
30
35
stre
ss(M
Pa)
inelastic strain
R1 R2 N3 R4 R5
Fig. 10.48 The RAC stress–inelastic strain relationshipcurves
Table 10.20 Parameters about RAC compressive stress–strain
The replacement rate of recycled aggregate (%) 0 50 100
A 2.2 1.26 1.04
B 0.8 3.96 7.5
Table 10.21 Parameter a The replacement percentage of RCA (%) 0 50 100
A 1.19 1.23 1.26
10.3 RAC Slabs 363
modulus in plastic branch is 0.01 times of the initial elastic modulus. The strengthand elastic modulus of reinforcements were determined by the test, and themathematical expression is as follows:
rs ¼ Eses es � eyfy þ 0:01Esðeu � eyÞ ey � es � eu
�ð10:19Þ
(3) Establishment of gradient slabs with RAC ABAQUS model
Without considering the reinforcement and concrete bond slippage, separatedmodeling was built and reinforcements were embedded into concrete. Gradientslabs with RAC was modeled by the slab that was divided into three layers alongthe thickness direction and set different parameters for materials to each layer.
The element of concrete and rigid steel block are modeled by C3D8R, andreinforcements are simulated by T3D2. The concrete and reinforcement elementlength is 100 mm in the longitudinal direction, and along the thickness direction,the slab is divided into 6 elements.
In fact, a Q235B steel plate was set at supports in order to avoid concrete localcrushing. Similarly, in finite element modeling, four rigid cushion blocks were setup and assigned high elastic modulus to ensure the pad itself does not affect thefinite element calculation results.
In finite element simulation, the loading method is displacement loading.In ABAQUS, the rigid steel block was tied together with the concrete slab. Thereference points were set above the block, and they were coupled together with therigid steel block. In this way, the real test process was simulated and at the sametime avoided the local crushing caused by concentrated loads.
In ABAQUS software, the support boundary condition of the test slab is: the leftside Uy ¼ Uz ¼ 0 and the right side Ux ¼ Uy ¼ Uz ¼ 0. Constraints are imposedalong the center line of the block.
For checking the accuracy of the modelling method, when q ¼ 0:42%, 5f-1, 5h,5f-2, 7f-1, 7h, and 7f-2 six specimens were simulated in finite element analysis.Figure 10.49 shows the comparison between FEM and test load–deflection curves,it could be found that the simulation modeling is well agree with the test results.
10.3.1.4 Summary
Based on the experimental study and the FEM analysis, it is found that the RACgradient slabs have good flexural behaviors. The main results are described in thefollowing:
(1) RAC gradient slab with different reinforcement ratios occurred flexural failurewith good ductility and bearing capacity.
364 10 Structural Behavior of Recycled Aggregate Concrete Elements

(2) Slippage did not occur within the interface of the gradient slab with RACconstructed by layered casting and layered vibrating. The results show that thegradient construction method does not have negative effects on the flexuralperformance.
(3) In the case of no interface slippage, the ductility of RAC gradient slab issuperior to that of the homogeneous slab, when high elastic modulus concretewas set in compression zone. However, there is no obvious influence on thebearing capacity.
(4) The RAC gradient slab FEM analysis model is built in the ABAQUS software,and FEM analysis results agree well with the experimental test results, whichmeans the ABAQUS simulation of the gradient slab with RAC is feasible.
10.3.2 Punching Shear Behavior of RAC Slabs
10.3.2.1 Design of Punching Shear RAC Slabs
(1) Test materials
The cement selected was ordinary Portland cement PO42.5, all the technicalaspects were in accordance with China’s specifications.
The fine aggregates used were middle sand, see Table 10.22. All the technicalaspects were in accordance with the Chinese code [29] and standard [30].
0 20 40 60 80 1000
5
10
15
20
25
30
35
0 20 40 60 80 100 1200
5
10
15
20
25
30
35
0 20 40 60 80 100 1200
5
10
15
20
25
30
35
(a) 5h (b) 5f-1 (c) 7f-2
0 20 40 60 800
5
10
15
20
25
30
35
40
45
50
0 20 40 60 800
5
10
15
20
25
30
35
40
45
50
0 20 40 60 80 1000
5
10
15
20
25
30
35
40
45
50
(d) 7h (e) 7f-1 (f) 7f-2
Fig. 10.49 Load–deflection curves by ABAQUS
10.3 RAC Slabs 365
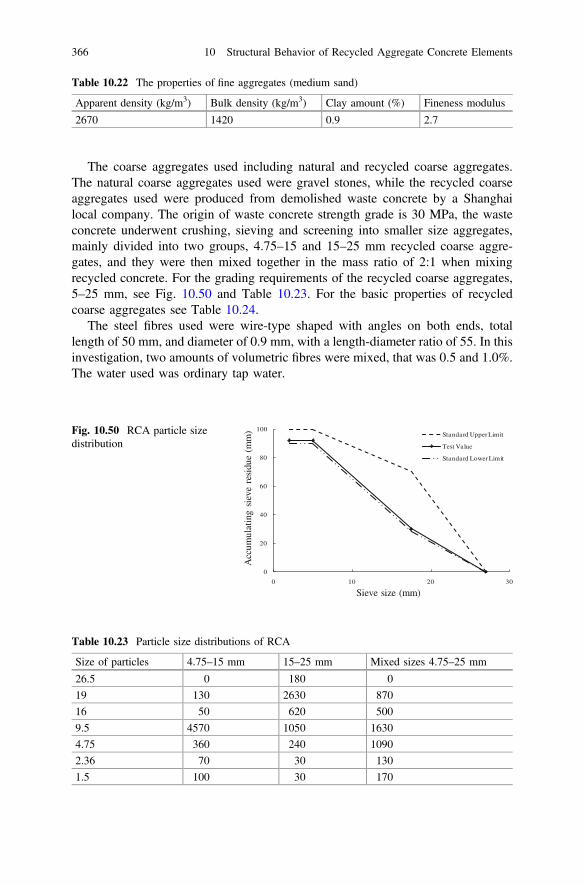
The coarse aggregates used including natural and recycled coarse aggregates.The natural coarse aggregates used were gravel stones, while the recycled coarseaggregates used were produced from demolished waste concrete by a Shanghailocal company. The origin of waste concrete strength grade is 30 MPa, the wasteconcrete underwent crushing, sieving and screening into smaller size aggregates,mainly divided into two groups, 4.75–15 and 15–25 mm recycled coarse aggre-gates, and they were then mixed together in the mass ratio of 2:1 when mixingrecycled concrete. For the grading requirements of the recycled coarse aggregates,5–25 mm, see Fig. 10.50 and Table 10.23. For the basic properties of recycledcoarse aggregates see Table 10.24.
The steel fibres used were wire-type shaped with angles on both ends, totallength of 50 mm, and diameter of 0.9 mm, with a length-diameter ratio of 55. In thisinvestigation, two amounts of volumetric fibres were mixed, that was 0.5 and 1.0%.The water used was ordinary tap water.
Table 10.22 The properties of fine aggregates (medium sand)
Apparent density (kg/m3) Bulk density (kg/m3) Clay amount (%) Fineness modulus
2670 1420 0.9 2.7
Table 10.23 Particle size distributions of RCA
Size of particles 4.75–15 mm 15–25 mm Mixed sizes 4.75–25 mm
26.5 0 180 0
19 130 2630 870
16 50 620 500
9.5 4570 1050 1630
4.75 360 240 1090
2.36 70 30 130
1.5 100 30 170
0
20
40
60
80
100
0 10 20 30
Standard Upper Limit
Test Value
Standard Lower Limit
Sieve size (mm)
Acc
umul
atin
g si
eve
resi
due
(mm
)Fig. 10.50 RCA particle sizedistribution
366 10 Structural Behavior of Recycled Aggregate Concrete Elements

(2) Test design
The test was carried out in the laboratory of Tongji University. The recycledcoarse aggregates replacement percentage used in the test was 30, 50, and 100%,respectively. See Table 10.25 for the mix proportion. The mean values of 28d cubecompressive strength and the modulus of elasticity are listed in Table 10.26.
The reinforcements used were HRB335 (Hot-rolled Ribbed Bar, fyk = 335 MPa),with a diameter of 12 mm. The steel reinforcement mechanical test done was a pulltest on 3 specimens, the average yield strength was 334.69 MPa, the average elasticmodulus was 2.0 � 105 MPa, and its average yield strain was about 1674 l�, seeTable 10.27.
Table 10.24 Properties of RCA
Bulk density(kg/m3)
Apparent density(kg/m3)
Waterabsorption (%)
Clay amount(%)
Crush value(%)
1460 2514 3.6 3.8 13.7
Table 10.25 Concrete mix proportion (Unit: kg/m3)
Specimen Cement Water Sand NCA RCA Additionalwater
Steelfibers
RAC0 433 210 630 1173 0 0 0
RAC30-0% 819 351 17.55 0
RAC50-0% 587 587 29.35 0
SFRAC50-0.5% 587 587 29.35 39.3
SFRAC50-1.0% 587 587 29.35 78.5
RAC100-0% 0 1173 58.65 0
SFRAC100-0.5% 0 1173 58.65 39.3
SFRAC100-1.0% 0 1173 58.65 78.5
Table 10.26 28d cube compressive strength and the elastic modulus of concrete
Specimen Cube compressivestrength (MPa)
Prism compressivestrength (MPa)
Elastic module(�104 MPa)
RAC0 52.25 39.90 3.73
RAC30-0% 44.65 31.35 3.50
RAC50-0% 38.95 33.25 2.96
SFRAC50-0.5% 42.75 38.95 3.20
SFRAC50-1% 43.70 36.10 3.05
RAC100-0% 37.05 28.50 2.74
SFRAC100-0.5% 38.00 31.35 2.32
SFRAC100-1% 40.85 32.30 2.47
10.3 RAC Slabs 367

The slab specimen was a flat concrete slab model. 8 concrete slabs were alldesigned with dimensions of 1500� 1500� 120mm, depth of h = 120mm, effectivedepth of h0 ¼ h� as ¼ h� cþ d
2
� ¼ 120� 15þ 122
� ¼ 99mm, reinforcement
ratio of q ¼ Asbh0
¼15�
p4�122
1500�99 ¼ 1:142%. The slab diagram and its reinforcements aredisplayed in Figs. 10.51 and 10.52, respectively.
The fabrication and curing of the specimen were done adopting the same con-ditions for an engineering project, each stage of fabrication, binding of reinforce-ments, nailing together of moulds, casting concrete, and curing of the concretespecimens were done accordingly.
Table 10.27 Tensile properties of steel /12
Type of reinforcement Yield strength (MPa) Elastic module (MPa)
/12 Actual value Average value 2:0� 105
318.47 334.69
349.43
336.16
Fig. 10.51 Slab dimensions
Fig. 10.52 Schematic diagram of reinforcement
368 10 Structural Behavior of Recycled Aggregate Concrete Elements

The loading setup was shown in Fig. 10.53. The slabs were set up on the samereinforced concrete frame. The slab properly fits on the area covered by an anglesteel frame, in order to simulate the boundary conditions of four simply supportededges. The concentrated load was applied on a concrete-filled square steel tubularshort column by hydraulic jacks, and the data was retrieved by using computerizedload sensors.
(3) The setup of the measuring apparatus
The measured aspects mainly included steel strain, concrete strain, the slabdisplacement in the vertical axis, as well as observing the crack propagation andfailure process during loading. During the test, the data from the load transducers,displacement transducers and strain gauges retrieved automatically through thecomputer static strain testing system. At the beginning of the test, a check-up tomake sure all the equipment function properly was done; in cases where abnor-malities appeared, adjustments were done.
(1) The setup of the strain gauges:
As Fig. 10.54 shows, in order to fully observe and properly analyse the changesin the reinforcement and concrete during the loading process, this test set up 5reinforcement strain gauges and 6 concrete strain gauges on each slab specimen.The distance between the reinforcement strain gauges was 200 mm; the concretestrain gauges on the top surface of each specimen were mainly arranged in a wayperpendicular and at an angle 45° to the loading column, the distances betweenthem being 200 and 283 mm respectively.
(a) Sketch (b) Photo
slab specimen
concrete-filled suqaresteel tubular column
pressure sensor
reaction frame
hydraulic jack
(200mmX200mm)
angle steel(100mmX100mm)
Fig. 10.53 Loading setup
10.3 RAC Slabs 369

(2) The setup of the displacement transducer:
During the loading test, each slab was fixed with 8 linear variable displacementtransducers (LVDTs). Among them, 6 were on the slab surface, and 2 were underthe slab (LVDTs No. D-5 and No. D-8 in Fig. 10.55).
(4) The loading program
The testing was controlled by the loading force. The load increased consistentlyuntil the failure of specimen. In order to maintain proper retrieval of data, theloading and unloading of force during the test process was maintained at a constant,this was also for the slab specimen to properly have full deformation.
10.3.2.2 Analysis of Punching Shear RAC Slabs
(1) The test phenomenon and failure characteristics
When the initial load was small, the slab surface did not appear any cracks, andthe specimen was under elastic state. As the load increased, the tensile area of theslab diagonal to the column first showed micro cracks. When the load continued toincrease, the cracks propagated towards the columns, and some cracks thendeveloped perpendicular to the slab edge, and later curved while increasing innumber towards the slab edge. During the process when the column load graduallyincreased, the curved cracks on the slab developing from the area around theloading column going outwards towards the edges of the slab were visible. At about0.8Pu, the slab surface cracks developing from the middle section and towards thecorner columns had fully developed, but because a plastic hinge line had not yet
(a) Strain gauge of reinforcement (b) Strain gauge of concrete
Fig. 10.54 Arrangement of strain gauges
370 10 Structural Behavior of Recycled Aggregate Concrete Elements
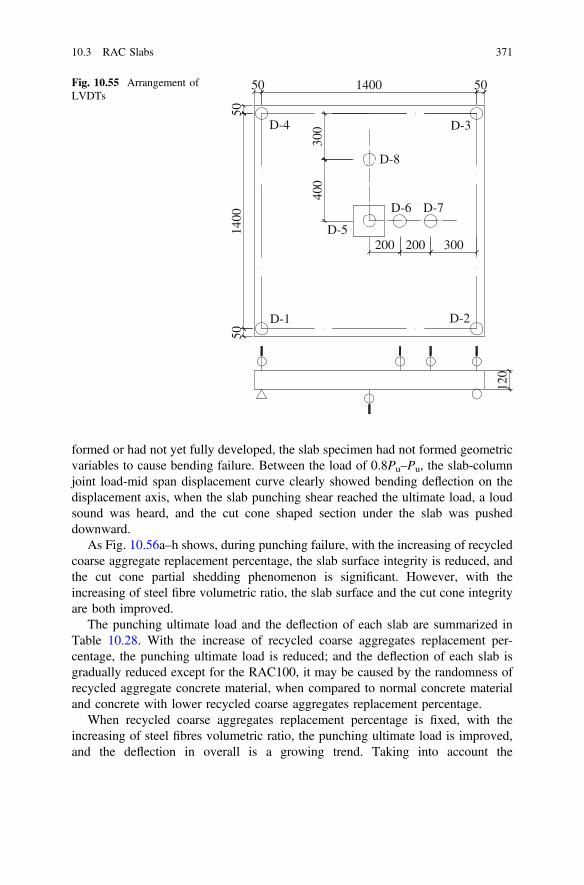
formed or had not yet fully developed, the slab specimen had not formed geometricvariables to cause bending failure. Between the load of 0.8Pu–Pu, the slab-columnjoint load-mid span displacement curve clearly showed bending deflection on thedisplacement axis, when the slab punching shear reached the ultimate load, a loudsound was heard, and the cut cone shaped section under the slab was pusheddownward.
As Fig. 10.56a–h shows, during punching failure, with the increasing of recycledcoarse aggregate replacement percentage, the slab surface integrity is reduced, andthe cut cone partial shedding phenomenon is significant. However, with theincreasing of steel fibre volumetric ratio, the slab surface and the cut cone integrityare both improved.
The punching ultimate load and the deflection of each slab are summarized inTable 10.28. With the increase of recycled coarse aggregates replacement per-centage, the punching ultimate load is reduced; and the deflection of each slab isgradually reduced except for the RAC100, it may be caused by the randomness ofrecycled aggregate concrete material, when compared to normal concrete materialand concrete with lower recycled coarse aggregates replacement percentage.
When recycled coarse aggregates replacement percentage is fixed, with theincreasing of steel fibres volumetric ratio, the punching ultimate load is improved,and the deflection in overall is a growing trend. Taking into account the
120
D-8
D-6 D-7
D-5
D-3D-4
D-1 D-2
50 1400 50
400
200 200 300
300
5014
0050
Fig. 10.55 Arrangement ofLVDTs
10.3 RAC Slabs 371
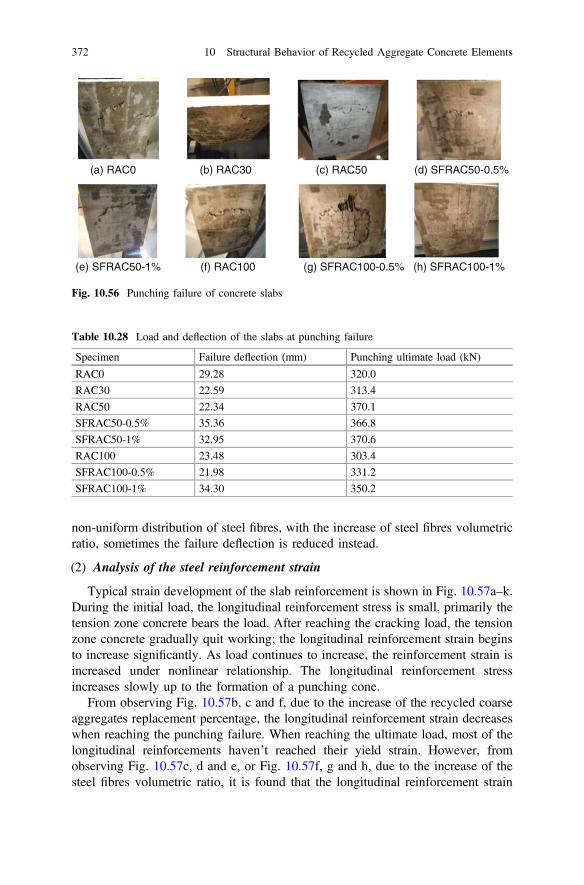
non-uniform distribution of steel fibres, with the increase of steel fibres volumetricratio, sometimes the failure deflection is reduced instead.
(2) Analysis of the steel reinforcement strain
Typical strain development of the slab reinforcement is shown in Fig. 10.57a–k.During the initial load, the longitudinal reinforcement stress is small, primarily thetension zone concrete bears the load. After reaching the cracking load, the tensionzone concrete gradually quit working; the longitudinal reinforcement strain beginsto increase significantly. As load continues to increase, the reinforcement strain isincreased under nonlinear relationship. The longitudinal reinforcement stressincreases slowly up to the formation of a punching cone.
From observing Fig. 10.57b, c and f, due to the increase of the recycled coarseaggregates replacement percentage, the longitudinal reinforcement strain decreaseswhen reaching the punching failure. When reaching the ultimate load, most of thelongitudinal reinforcements haven’t reached their yield strain. However, fromobserving Fig. 10.57c, d and e, or Fig. 10.57f, g and h, due to the increase of thesteel fibres volumetric ratio, it is found that the longitudinal reinforcement strain
Table 10.28 Load and deflection of the slabs at punching failure
Specimen Failure deflection (mm) Punching ultimate load (kN)
RAC0 29.28 320.0
RAC30 22.59 313.4
RAC50 22.34 370.1
SFRAC50-0.5% 35.36 366.8
SFRAC50-1% 32.95 370.6
RAC100 23.48 303.4
SFRAC100-0.5% 21.98 331.2
SFRAC100-1% 34.30 350.2
(a) RAC0 (b) RAC30 (c) RAC50 (d) SFRAC50-0.5%
(e) SFRAC50-1% (f) RAC100 (g) SFRAC100-0.5% (h) SFRAC100-1%
Fig. 10.56 Punching failure of concrete slabs
372 10 Structural Behavior of Recycled Aggregate Concrete Elements

(a) No. S-1~S-5 of RAC0 (b) No. S-1~S-5 of RAC30
(c) No. S-1~S-5 of RAC50 (d) No. S-1~S-5 of SFRAC50-0.5%
0
50
100
150
200
250
300
350
-500 0 500 1000 1500 2000 2500
P (
kN)
Reinforcement Strain (µε)
S-5 S-4S-1
S-3
Yie
ld L
ine
0
50
100
150
200
250
300
350
-500 0 500 1000 1500 2000 2500 3000
P (
kN
)
Reinforcement Strain (µε)
S-1S-5S-3 S-4
Yie
ldL
ine
0
50
100
150
200
250
300
350
-500 0 500 1000 1500 2000 2500
P (
kN)
Reinforcement Strain (µε)
S-1 S-3
S-5
S-4
Yie
ld L
ine
0
50
100
150
200
250
300
350
400
-500 500 1500 2500 3500
P (
kN)
Reinforcement Strain (µε)
S-1
S-3
S-4
S-5
Yie
ld L
ine
(e) No. S-1~S-5 of SFRAC50-1% (f) No. S-1~S-5 of RAC100
0
50
100
150
200
250
300
350
400
-500 0 500 1000 1500 2000
P (
kN)
Reinforcement Strain (με)
S-1 S-3
S-4
S-5
Yie
ld L
ine
0
50
100
150
200
250
300
-500 0 500 1000 1500
P (
kN)
Reinforcement Strain (με)
S-1 S-3S-5
Yie
ld L
ine
Fig. 10.57 Relationship between slab load and reinforcement strain
10.3 RAC Slabs 373

increases when reaching the punching failure, and a part of reinforcements havereached their yield strength.
The typical data of No. S-3 reinforcement strain gauge, and the result of com-parison among Fig. 10.57i, j and k were observed. From observing Fig. 10.57i, dueto the increase of the recycled coarse aggregate replacement percentage, it is foundthat the development rate of reinforcement strain tends to increase. Due to the
(g) No. S-1~S-5 of SFRAC100-0.5% (h) No. S-1~S-5 of SFRAC100-1%
(i) No. S-3 of Recycled aggregate concrete (j) No. S-3 of RAC50 with steel fibres
(k) No. S-3 of RAC100 with steel fibres
0
50
100
150
200
250
300
350
-500 0 500 1000 1500 2000
P (
kN)
Reinforcement Strain (με)
S-5 S-3S-4
Yie
ld L
ine
0
50
100
150
200
250
300
350
-500 0 500 1000 1500 2000 2500
P (
kN)
Reinforcement Strain (με)
S-1S-3 S-4S-5
Yie
ld L
ine
0
50
100
150
200
250
300
350
-500 0 500 1000 1500 2000
P (k
N)
No.S-3 Reinforcement Strain (με)
RAC100
RAC50
RAC0RAC30
Yie
ld L
ine
0
50
100
150
200
250
300
350
400
-500 0 500 1000 1500 2000 2500
P (
kN)
S-3 Reinforcement Strain (με)
SFRAC50-1%
SFRAC50-0.5%
RAC50
Yie
ld L
ine
0
50
100
150
200
250
300
350
400
-500 0 500 1000 1500 2000 2500
P (
kN)
S-3 Reinforcement Strain (με)
SFRAC100-1%
SFRAC100-0.5%
RAC100
Yie
ld L
ine
Fig. 10.57 (continued)
374 10 Structural Behavior of Recycled Aggregate Concrete Elements

increase of the recycled coarse aggregate replacement percentage, concrete elasticmodule decreases, the longitudinal reinforcement bears more force, and thedevelopment rate of reinforcement strain increases gradually. From observingFig. 10.57j, k, due to the incorporation of steel fibres, it is found that reinforcementstrain increases to its yield strain. It indicates that the longitudinal reinforcement cancontribute to punching capacity of steel fibred recycled concrete slabs.
(3) Analysis of the load-deflection curve
The load-displacement (P�D curves) of the concrete slab punching shear, asshown in Fig. 10.58a–f, reflects the slab punching capacity, deformation, ductilityand other characteristics. According to the slab’s mid-point displacement (No. D-5)and the rectified deflection of the slab’s 4 simply supported edges, it is easy toobtain each slab specimen’s P�D curve.
As the recycled coarse aggregate replacement percentage increases from 0, 30,50, and 100%, the slab punching shear failure occurs: During the initial load, theslab is basically in elastic stage. After reaching the cracking load, the slab deflectioncurves begin to deviate from the load axis, but P�D curves still vary linearly. Up toabout 85% Pu, the deflection curves begin to tend to deflection axis. When reachingthe ultimate load, punching cone forms, and slab’s bearing capacity declines sig-nificantly. Thereafter, the load gradually stabilizes at the 25–35% of the ultimateload, the deflection of slab continues to develop under the relative steady load up tofinally losing its bearing capacity.
When comparing Fig. 10.58, it can be observed that:
(1) As Fig. 10.58a, b demonstrate, as the recycled coarse aggregates replacementpercentage increases from 0–100%, the slab punching shear failure all occurs.In comparison to normal concrete, the increase in the recycled aggregatesreplacement percentage reduces the slab deformation and the ductility at failure,however, the occurrence chances of the brittle punching shear failure increases;and the chances of the bending failure occurs before the punching shear failuredecreases.
(2) As Fig. 10.58b, c demonstrate, for recycled aggregate concrete slab, theincrease in the volumetric ratio of steel fibres results in higher deformation atfailure, and the number of cracks in the punching shear cone obviouslyincreases. At failure the slab somehow still maintains its full shape withoutappearing a localized punching drop phenomenon, demonstrating a punchingshear failure at the same time showing bending failure trend transformation.The P�D curves gradually become gentle, the slab deformation abilityimproves, and the brittle property reduces.
(3) As Fig. 10.58d, e demonstrate, for the steel fibre reinforced recycled aggregateconcrete slab, the slab failure being punching shear failure becomes obviouswith the increase of the recycled coarse aggregates replacement percentage.Therefore, when the recycled coarse aggregates replacement percentage
10.3 RAC Slabs 375

decreases, it helps to improve the slab punching shear performance, at the sametime increases the slab ductility and deformation ability at failure.
(4) As Fig. 10.58f illustrates, when the steel fibres content is relatively high (i.e.,1%), the effect of recycled coarse aggregates replacement percentage will bereduced.
(a) 8 recycled concrete slabs (b) RAC without steel fibres
(c) RAC50 with steel fibres (d) RAC100 with steel fibres
(e) steel fibre reinforced RAC with V f = 0.5% (f) steel fibre reinforced RAC with 1.0%fV =
0
50
100
150
200
250
300
350
400
0 10 20 30 40 50 60
P(kN
)
mm)
SFRAC100-0.5%RAC50
RAC100
RAC0
RAC30
SFRAC50-1%
SFRAC100-1%
SFRAC50-0.5%
0
50
100
150
200
250
300
350
0 10 20 30 40 50 60
P(kN
)
mm)
RAC0
RAC30
RAC100
RAC50
0
50
100
150
200
250
300
350
400
0 10 20 30 40 50 60
P(kN
)
(mm)
SFRAC50 -1%
RAC50
SFRAC50 -0.5%
0
50
100
150
200
250
300
350
400
0 10 20 30 40 50
P(kN
)
mm)
SFRAC100 -1%
SFRAC100-0.5%
0
50
100
150
200
250
300
350
400
0 10 20 30 40 50 60
P(kN
)
mm)
SFRAC50 - 1%
SFRAC100-1%
0
50
100
150
200
250
300
350
400
0 10 20 30 40 50 60
P (kN
)
mm)
SFRAC50-0.5%
SFRAC100-0.5%
Fig. 10.58 P�D curves
376 10 Structural Behavior of Recycled Aggregate Concrete Elements

(4) The punching slab’s “equivalent ductility”
The ductility often refers to the member structure or cross-section from theyielding of the longitudinal reinforcement in tension to the deformation abilitywhen the bearing capacity is no longer significantly decreasing. The displacementductility coefficient expression is lD ¼ D0
Dy. For slabs that fail due to punching shear,
the yielding of the longitudinal reinforcement in tension in the slab has no directlink to the shape of the member at failure, but at punching shear failure the bearingcapacity suddenly decreases, therefore the definition of the ‘ductility’ should beadjusted, and this article refers it to ‘equivalent ductility’. In order to describe thepunching slab’s equivalent ductility, the ratio of the deflection D0 corresponding tothe ultimate load Pu and using the energy law to determine the yield deflection Dy,these were calculated and the comparison was made. The principle of determiningthe Dy is: replace the ideal linear elastic stage of the ascent stage of the actualmeasured P�D curve, this should be equal to the area covered by the deformationaxis, the corresponding displacement point where the two lines meet is the calcu-lated Dy, as demonstrated in Fig. 10.59, respectively.
Comparing the obtained displacement ductility coefficient (see Table 10.29),when the recycled coarse aggregates replacement percentage is the same, the slabswith steel fibres shows the higher displacement ductility coefficient, and thisincreases with the increase of the volumetric fibres. Whereas, the increase of therecycled coarse aggregates replacement percentage, sees a gradual decrease in thedisplacement ductility coefficient.
(5) The slab’s energy consumption
The energy consumption SD is the area formed by the equivalent ductility lineand the horizontal axis on the P�D curve (see Fig. 10.59). The calculation results(see Table 10.29) show that the steel fibre reinforced recycled aggregate concreteslab’s energy consumption ability is higher than that of the recycled concrete slabwithout steel fibres, and the increase in the steel fibres sees a gradual increase in theslab’s energy consumption. The increase in the recycled aggregates replacementpercentage sees a gradual decrease in the slab energy consumption.
(6) The calculation analysis of the punching shear capacity
Taking into account the versatility of formula, this paper utilizes the designequation of BS EN 1992-1-1 2004 for verification, and the design punching shearresistance may be calculated as follows:
VRd;c ¼ CRd;c � 1þffiffiffiffiffiffiffiffi200d
r !� ð100q1 � fckÞ
13 þ k1 � rcp
" #� l1 � d� mmin þ k1 � rcp
� � l1 � dð10:20Þ
10.3 RAC Slabs 377

(a) RAC0 (b) RAC30 (c) RAC50-0%
0
50
100
150
200
250
300
350
0 10 20 30
RC0
0
50
100
150
200
250
300
350
0 5 10 15 20 25
RAC30
0
50
100
150
200
250
300
350
0 5 10 15 20 25
(kN
)(k
N)
(kN
)
(kN
)
(kN
)(k
N)
(kN
)(k
N)
RAC50-0%
(d) SFRAC50-0.5% (e) SFRAC50-1% (f) RAC100
(g) SFRAC100-0.5% (h) SFRAC100-1%
0
50
100
150
200
250
300
350
400
0 10 20 30 40
RAC50-0.5%
Equivalent ductility
0
50
100
150
200
250
300
350
400
0 10 20 30
RAC50-1%
Equivalent ductility
0
50
100
150
200
250
300
350
0 5 10 15 20 25
RAC100
Equivalent ductility
0
50
100
150
200
250
300
350
0 5 10 15 20 25
RAC100-0.5%
Equivalent ductility
0
50
100
150
200
250
300
350
400
0 10 20 30 40
RAC100-1%
Equivalent ductility
Fig. 10.59 P�D curve and “equivalent ductility” line
Table 10.29 Displacement ductility coefficient and energy absorption
Specimen Displacement ductility coefficient Energy absorption SD (kNm)
RAC0 1.7706 6.6210
RAC30 1.7170 5.0504
RAC50 1.7132 4.8520
SFRAC50-0.5% 2.3500 10.2135
SFRAC50-1% 2.4917 9.6608
RAC100-0% 1.6502 4.3504
SFRAC100-0.5% 1.6908 5.1055
SFRAC100-1% 2.3655 9.4675
378 10 Structural Behavior of Recycled Aggregate Concrete Elements

Where, VRd;c is the design value of the punching shear resistance of a slab withoutpunching shear reinforcement along the control section considered. The recom-mended value for CRd;c is 0:18
ccðcc is the partial factor for concrete, its value could be
1.4), and that for k1 is 0.1, d is effective depth of a cross section and its value is about99 mm, q1 ¼ ffiffiffiffiffiffiffiffiffiffiffiffiffiffiffiqly � qlzp � 0:02 is the reinforcement ratio for longitudinal rein-forcement, qly and qlz are related to the bonded tension steel in y- and z- directionsrespectively, and the values should be calculated as mean values taking into account aslab width equal to the column width plus 3d in each side, in this paper, its value isabout 0.01142. fck is the characteristic compressive cylinder strength of concrete for28 days and it could be calculated. rcp ¼ rcy þrcz
2 is the compressive stress in concretefrom axial load or pre-stressing, rcy and rcz are the normal concrete stresses in thecritical section in y- and z- directions (MPa, positive if compression). l1 is the basiccontrol perimeter and its value here is about 2384 mm.
In consideration of steel fibres’ effective to the punching shear capacity, theformula could be written as follows:
VRd;c ¼ CRd;c � 1þffiffiffiffiffiffiffiffi200d
r !� ð100q1 � fckÞ
13 þ k1 � rcp
" #� l1 � d � 1þ bp � Vf � lfdf
� �
ð10:21Þ
Where, Vf and lfdf
are the volumetric of fibres and the length-diameter ratio,respectively. When kf [ 1:2, take kf ¼ 1:2. bp is the influencing factor of the steelfibres on the steel fibre reinforced recycled aggregate concrete, it can be easilydecided through the test, when the steel fibre reinforced concrete strength is CF20–CF40, take bp ¼ 0:5.
Equation (10.21) is adopted to be the recycled aggregate concrete slab punchingshear capacity calculation formula. All the variables are substituted in the formula,and the ultimate bearing capacity can be calculated, see Table 10.30 for details.
Table 10.30 shows the comparison of the slab test experiment punching shearcapacity calculated value Pu
cal and tested value Pu. In consideration of the safety of
Table 10.30 Punching calculations of the steel fibers reinforced recycled concrete slab
Slab fcu;k (MPa) fck (MPa) bP Vf Pcalu (kN) Pu (kN) Pcal
u =Pu
RAC0 52.25 43.72 0 0 270.62 320.0 0.846
RAC30 44.65 36.34 0 0 254.44 313.4 0.812
RAC50 38.95 31.16 0 0 241.73 307.1 0.787
RAC100 37.05 29.64 0 0 237.73 303.4 0.784
SFRAC50-0.5% 42.75 34.55 0.5 0.5 284.60 366.8 0.776
SFRAC50-1% 43.70 35.45 0.5 1 321.74 370.6 0.868
SFRAC100-0.5% 38.00 30.40 0.5 0.5 272.71 331.2 0.823
10.3 RAC Slabs 379

actual project application, Pucal should be lower than the Pu, as list in Table 10.30,
the average Pucal/Pu of recycled concrete is about 0.824, and the variance is about
0.001616. From observing the Table 10.30, we could find the trend between Pucal
and Pu are well in coordinate with each other. Based on this experiment data,Eq. (10.21) could be adopted to the design of actual project.
10.3.2.3 Summary of Punching Shear RAC Slabs
A test was carried out on the punching shear performance with 8 concrete slabs, ofwhich 7 were recycled aggregate concrete slabs and 1 was a natural aggregateconcrete slab which was also used as a control reference. Among the 7 recycledconcrete slabs, 4 of them were steel fibres reinforced recycled aggregate concreteslabs, while the remaining 3 were recycled aggregate concrete slabs without steelfibres. The steel fibre volumetric ratio was 0.5 and 1.0%, whereas recycledaggregate concrete slabs were made of 0, 50 and 100% recycled coarse aggregatesreplacing natural coarse aggregates. Through analyzing the steel fibres reinforcedrecycled concrete slabs, keen interest is paid on the loading characteristics and thepunching shear performance. The following conclusions are made:
(1) Combined with the development discipline of longitudinal reinforcement strainand slab top surface concrete strain, the mechanism of RAC slab and RAC slabwith a certain amount of steel fibres punching shear failure, are mainly, thecompression-shear area concrete reaches its ultimate compression strain, thenforms the punching cone, and finally leads to the punching failure. However,the mechanism of recycled aggregate concrete slab without steel fibres mainlytends to cable-stayed damage.
(2) The addition of steel fibres into the recycled aggregate concrete slab improvesthe punching shear capacity, in comparison with ordinary concrete, the steelfibres increases it by about 7–15%, and it is also concluded that the punchingshear capacity of RAC slabs is lower than those of NAC slabs.
(3) When the steel fibres are added into recycled aggregate concrete, not only doesthe punching shear capacity increases, but the slab’s ductility, deformation andenergy consumption are also improved.
(4) For the recycled aggregate concrete slab under punching shear, the addition ofsteel fibres helps to transform the failure pattern from shear failure tobending-shearing failure; the increase in the recycled coarse aggregatesreplacement percentage, sees a gradual decline in the punching shear capacity,shear resistance performance and ductility.
(5) Based on the test results, when calculating the punching shear ultimate bearingcapacity of RAC slab, this investigation proposed Eq. (10.21) on the basis ofthe punching failure calculation formula of BS EN 1992-1-1 2004.
380 10 Structural Behavior of Recycled Aggregate Concrete Elements

10.4 RAC Columns
Currently, there is less research work focusing the RAC column both in China andworldwide. This section will introduce the load mechanism test results and relia-bility analysis of the study done by the author on 12 RAC short columns, andintroduce the basic properties of the RAC columns.
10.4.1 Design of RAC Columns
The recycled aggregate replacement percentage r and the eccentricity e were themain considered parameters in the study. 12 RAC columns were designed, the crosssection, reinforcement, and column height were all the same (see Table 10.31 forthe column specimen arrangements).
10.4.2 Analysis of RAC Columns
(1) Test phenomenon(1) Specimen with eccentricity of 0 mm
On analysis of strain data showed that the loading on the cross-sectional area of3 concrete columns is evenly distributed. The concrete and steel strain values incompression are very close to each other. When the axial load is very small, theaxial compression and the vertical displacement increase linearly. When the axialload is much higher, due to the concrete nonlinear behavior, this causes the axialcompression and the vertical displacement to increase in a nonlinear trend, and thedeformation increases as the load increase. At the failure, the actual steel strain(under compression) did not yield, as shown in Fig. 10.60a, and this means thespecimen ends is not strong enough, therefore resulting in failure similar to localcompression destruction (see Fig. 10.60b, c and d). But before failure, during thewhole loading process, the RAC column and ordinary concrete column behavedsimilarly under the axial load.
Table 10.31 Columnspecimen markings
r e
0 mm 30 mm 82 mm 100 mm
0 C-0-1 C-1-1 C-2-1 C-3-1
50% C-0-2 C-1-2 C-2-2 C-3-2
100% C-0-3 C-1-3 C-2-3 C-3-3
10.4 RAC Columns 381

(2) Specimen with eccentricity of 30 mm
During the test, the displacement and reinforcement deformation increasedproportionally with an increase in load. Later with increasing load, many smallcracks developed in concrete tension area, but the development is quite gradual ascompared to the stress stress. Before the tensile reinforcement yielded, the com-pression reinforcement had yielded and plastic hinge in the concrete compressionarea had formed. The concrete failed suddenly, and the damaged scope was quitebig. It can therefore be seen that it is small eccentric compression failure. From thevariation in the lateral deflection, and the crack development, to the increase in thestrain, there was no warning before failure; therefore, it is brittle failure. This groupshowed small eccentric compression’s failure characteristics, whereby the recycledaggregate columns and the ordinary concrete columns are similar. The load–straincurves and failure pattern are shown in Fig. 10.61.
(a) Load-strain curves (b) C-0-1 (c) C-0-2 (d) C-0-3
0
100
200
300
400
500
600
-1500 -1200 600 -300 0-900 -
(kN
)
C-0-1
C-0-2
C-0-3
Strain
Fig. 10.60 Deformation and failure pattern for the eccentricity of 0 mm
(b) C-1-1 (c) C-1-2 (d) C-1-3
0
100
200
300
400
500
600
-3000 -2000 0 1000-1000
(kN
)
C-1-1
C-1-1
C-1-2
C-1-2
C-1-3
C-1-3
Strain
(a) Load-strain curves
Fig. 10.61 Deformation and failure pattern for the eccentricity of 30 mm
382 10 Structural Behavior of Recycled Aggregate Concrete Elements
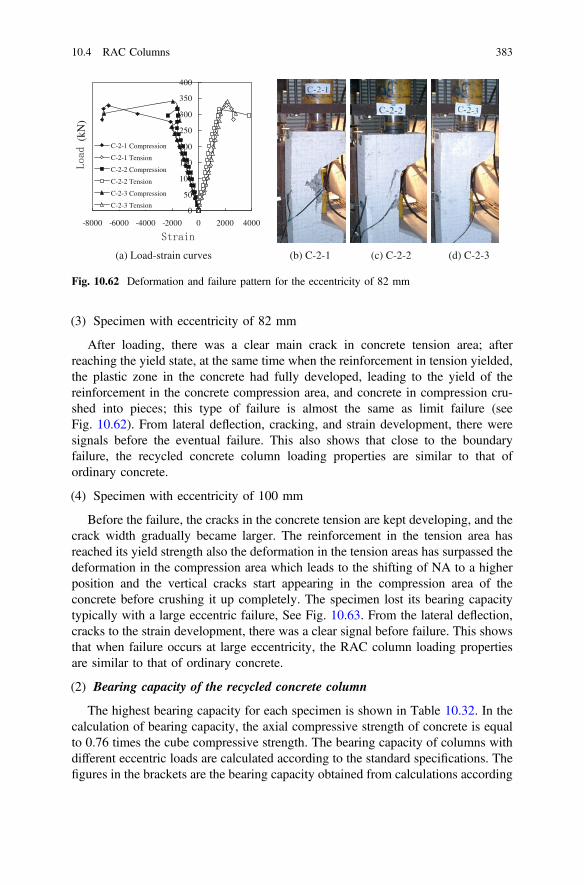
(3) Specimen with eccentricity of 82 mm
After loading, there was a clear main crack in concrete tension area; afterreaching the yield state, at the same time when the reinforcement in tension yielded,the plastic zone in the concrete had fully developed, leading to the yield of thereinforcement in the concrete compression area, and concrete in compression cru-shed into pieces; this type of failure is almost the same as limit failure (seeFig. 10.62). From lateral deflection, cracking, and strain development, there weresignals before the eventual failure. This also shows that close to the boundaryfailure, the recycled concrete column loading properties are similar to that ofordinary concrete.
(4) Specimen with eccentricity of 100 mm
Before the failure, the cracks in the concrete tension are kept developing, and thecrack width gradually became larger. The reinforcement in the tension area hasreached its yield strength also the deformation in the tension areas has surpassed thedeformation in the compression area which leads to the shifting of NA to a higherposition and the vertical cracks start appearing in the compression area of theconcrete before crushing it up completely. The specimen lost its bearing capacitytypically with a large eccentric failure, See Fig. 10.63. From the lateral deflection,cracks to the strain development, there was a clear signal before failure. This showsthat when failure occurs at large eccentricity, the RAC column loading propertiesare similar to that of ordinary concrete.
(2) Bearing capacity of the recycled concrete column
The highest bearing capacity for each specimen is shown in Table 10.32. In thecalculation of bearing capacity, the axial compressive strength of concrete is equalto 0.76 times the cube compressive strength. The bearing capacity of columns withdifferent eccentric loads are calculated according to the standard specifications. Thefigures in the brackets are the bearing capacity obtained from calculations according
3-2-C)d(2-2-C)c(1-2-C)b(sevrucniarts-daoL)a(
0
50
100
150
200
250
300
350
400
-8000 -6000 -4000 -2000 0 2000 4000
(kN
)
C-2-1 Compression
C-2-1 Tension
C-2-2 Compression
C-2-2 Tension
C-2-3 Compression
C-2-3 Tension
Fig. 10.62 Deformation and failure pattern for the eccentricity of 82 mm
10.4 RAC Columns 383

to the actual measured strain values. It can be observed from Table 10.32 thatexcept the difference in the test value and actual value being large when theeccentricity is quite large, other figures (when the eccentricity is 0, adopt the valuein the brackets) are closer to each other. In general, calculations according to thestandard specifications are suitable.
(3) N–M related curves
According to the test results, it can be seen that at different RCA replacementpercentages, different eccentricities’ actual N and M value, thereby allowing us to
(b) C-3-1 (c) C-3-2 (d) C-3-3
0
50
100
150
200
250
300
350
-4000 -2000 0 2000 4000
(a) Load-displacement curves
Strain
Loa
d (k
N)
C-3-1 Compression
C-3-1 Tension
C-3-2 Compression
C-3-2 Tension
C-3-3 Compression
C-3-3 Tension
Fig. 10.63 Strain and failure mechanism of eccentricity at 100 mm
Table 10.32 Test values and theoretical values of the bearing capacity
Eccentricity(mm)
Recycledaggregatereplacementpercentage (%)
Specimencode
Testbearingcapacityvalue (kN)
Calculatedbearingcapacityvalue (kN)
Calculatedvalue/testvalue
0 0 C-0-1 497 560(464) 1.13(0.93)
50 C-0-2 501 618(517) 1.23(1.03)
100 C-0-3 393 604(385) 1.54(0.98)
30 0 C-1-1 523 511 0.98
50 C-1-2 501 554 1.11
100 C-1-3 512 543 1.06
82 0 C-2-1 328 306 0.93
50 C-2-2 315 329 1.04
100 C-2-3 340 323 0.95
100 0 C-3-1 310 225 0.73
50 C-3-2 283 235 0.83
100 C-3-3 280 233 0.83
384 10 Structural Behavior of Recycled Aggregate Concrete Elements
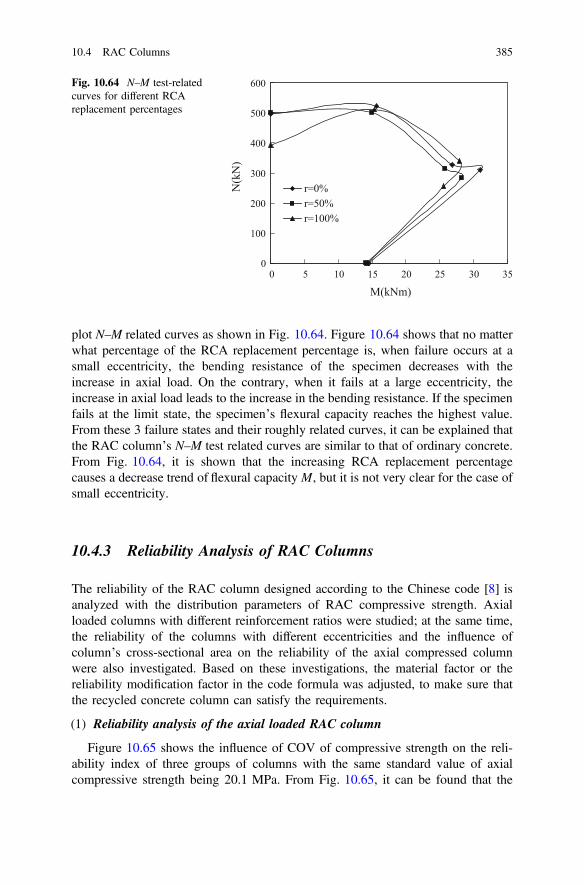
plot N–M related curves as shown in Fig. 10.64. Figure 10.64 shows that no matterwhat percentage of the RCA replacement percentage is, when failure occurs at asmall eccentricity, the bending resistance of the specimen decreases with theincrease in axial load. On the contrary, when it fails at a large eccentricity, theincrease in axial load leads to the increase in the bending resistance. If the specimenfails at the limit state, the specimen’s flexural capacity reaches the highest value.From these 3 failure states and their roughly related curves, it can be explained thatthe RAC column’s N–M test related curves are similar to that of ordinary concrete.From Fig. 10.64, it is shown that the increasing RCA replacement percentagecauses a decrease trend of flexural capacity M, but it is not very clear for the case ofsmall eccentricity.
10.4.3 Reliability Analysis of RAC Columns
The reliability of the RAC column designed according to the Chinese code [8] isanalyzed with the distribution parameters of RAC compressive strength. Axialloaded columns with different reinforcement ratios were studied; at the same time,the reliability of the columns with different eccentricities and the influence ofcolumn’s cross-sectional area on the reliability of the axial compressed columnwere also investigated. Based on these investigations, the material factor or thereliability modification factor in the code formula was adjusted, to make sure thatthe recycled concrete column can satisfy the requirements.
(1) Reliability analysis of the axial loaded RAC column
Figure 10.65 shows the influence of COV of compressive strength on the reli-ability index of three groups of columns with the same standard value of axialcompressive strength being 20.1 MPa. From Fig. 10.65, it can be found that the
0
100
200
300
400
500
600
0 5 10 15 20 25 30 35
M(kNm)
N(k
N)
r=0%r=50%r=100%
Fig. 10.64 N–M test-relatedcurves for different RCAreplacement percentages
10.4 RAC Columns 385

reliability of RAC column under axial compression shows a linear increase with theincrease in reinforcement ratio, which indicates that the columns with reinforcementratio between the scope of 0.6 and 3% have the same failure pattern. The otheraspect is that since there is an increase in the RAC compressive strength dis-creteness, the reliability decreases greatly, and when compared to the controlconcrete specimen, the COV of RAC compressive strength d is 0.15 and 0.17%, theb is 11.9 and 20.9%, respectively, roughly smaller than 3.7, and it does not satisfythe “code” requirements; therefore, some measures need to be adopted to increasethe reliability of the RAC column under axial compression.
Figure 10.66 shows the influence of COV of compressive strength on the reli-ability index of three groups of columns with the same average value of axial
2.8
3.2
3.6
4.0
4.4
0.4 0.8 1.2 1.6 2.0 2.4 2.8 3.2
(%)
Fig. 10.65 Influence of thereinforcement ratio q andstandard deviations r on thereliability index b at thecharacteristic compressivestrength of 20.1 MPa
2.8
3.2
3.6
4.0
4.4
0.4 0.8 1.2 1.6 2.0 2.4 2.8 3.2ρ (%)
β
fc,k=20.1,σ=5
fc,k=18.9,σ=6
fc,k=17.8,σ=7
Note: It should be noted that the characteristic strength and average strength of concrete prismare obtained from those of the concrete cube. The relationship between the strength of prism and cube areas follows according to Chinese code [8]: fc=0.67*fcu; fc,k=0.67*fcu,k. Here, fc and fcu is average strengthof prism and cube respectively, fcu,k is the characteristic strength of cube.
Fig. 10.66 Influence of the reinforcement ratio q and standard deviation r on the reliability indexb at the same average compressive strength of 25.6 MPa
386 10 Structural Behavior of Recycled Aggregate Concrete Elements

compressive strength being 25.6 MPa. Due to the increase in the RAC discreteness,the reliability decreases greatly; when compared to the control concrete specimen,the RAC variation coefficient is 0.16 and 0.18%, the corresponding b is decreasedby 16.2 and 24.4%; the reliability index was below 3.7 at all times, and it does notsatisfy the requirements. Figures 10.67 and 10.68 show the influence of standardvalue of compressive strength as well as its standard deviation on the reliabilityindex of column. From these figures, it can be observed that both the higherstandard value of compressive strength (Fig. 10.67) and the smaller COV ofcompressive strength (Fig. 10.68) will improve the reliability index b of column.Therefore, in order to reduce the negative effect of the RAC compressive strengthdiscreteness, actual engineering projects can suitably adjust and raise the standardvalue of compressive strength to make sure that the reliability index b is in-line withthe project requirements.
Table 10.33 shows the related factors r of 0, 0.2, 0.4, 0.6, 0.8 and 1.0 of thecross-sectional area height h and breadth b, and their influences on the componentreliability. From Table 10.33, it can be seen that under each reinforcement ratio, thereliability index decreases with the increase in the related factors r, the rate of
2.8
3.2
3.6
4.0
4.4
0.4 0.8 1.2 1.6 2.0 2.4 2.8 3.2ρ (%)
β
fc,k=20.1,σ=6
fc,k=18.9,σ=6
fc,k=21.1,σ=6
Fig. 10.67 Influence of thereinforcement ratio q andcompressive strength on thereliability index b at the samestandard deviation r value of6 MPa
2.8
3.2
3.6
4.0
4.4
0.4 0.8 1.2 1.6 2.0 2.4 2.8 3.2ρ (%)
β
fc,k=20.1,σ=7
fc,k=17.8,σ=7
fc,k=21.1,σ=7
Fig. 10.68 Influence of thereinforcement ratio q andcompressive strength on thereliability index b at the samestandard deviation r value of7 MPa
10.4 RAC Columns 387

decrease for different reinforcement ratios is basically the same, and the largestdecrease is less than 5%. Therefore, during the reliability calculation of such acomponent, if the influence of the related factors r are ignored while thecross-sectional area as an independent random variable is considered, the calcula-tion results will satisfy the required accuracy in real project.
(2) Reliability analysis of the eccentric loaded RAC column
Figure 10.69 compares the three groups of the axial compressive strengthstandard value of 20.1 MPa, considering the influence of different variation coef-ficients on the reliability index.
Figure 10.69 shows the influence of COV of compressive strength on the reli-ability index of three groups of columns under eccentric loading. The standardvalue of axial compressive strength is 20.1 MPa. It can be observed fromFig. 10.69 that as the discreteness of the compressive strength increases, the
Table 10.33 Influence of therelated cross-sectional areadimensions on the columnreliability
q r
0 0.2 0.4 0.6 0.8 1
0.6 3.121 3.119 3.117 3.114 3.112 3.110
0.7 3.151 3.149 3.146 3.144 3.142 3.139
0.8 3.180 3.178 3.175 3.173 3.171 3.169
0.9 3.209 3.207 3.204 3.202 3.200 3.197
1.0 3.237 3.235 3.233 3.230 3.228 3.226
1.1 3.265 3.263 3.261 3.258 3.256 3.254
1.2 3.293 3.291 3.288 3.286 3.284 3.282
1.3 3.320 3.318 3.315 3.313 3.311 3.309
1.4 3.347 3.344 3.342 3.340 3.338 3.336
1.5 3.373 3.371 3.369 3.366 3.364 3.362
1.6 3.399 3.397 3.394 3.392 3.390 3.388
1.7 3.424 3.422 3.420 3.418 3.416 3.414
1.8 3.449 3.447 3.445 3.443 3.441 3.439
1.9 3.474 3.472 3.470 3.468 3.466 3.463
2.0 3.498 3.496 3.494 3.492 3.490 3.488
2.1 3.522 3.520 3.518 3.516 3.514 3.512
2.2 3.545 3.543 3.541 3.539 3.537 3.535
2.3 3.568 3.566 3.564 3.562 3.560 3.558
2.4 3.591 3.589 3.587 3.585 3.583 3.581
2.5 3.613 3.611 3.609 3.607 3.605 3.603
2.6 3.635 3.633 3.631 3.629 3.627 3.625
2.7 3.656 3.654 3.652 3.650 3.648 3.646
2.8 3.677 3.675 3.673 3.671 3.669 3.667
2.9 3.698 3.696 3.694 3.692 3.690 3.688
3.0 3.718 3.716 3.714 3.712 3.710 3.708
388 10 Structural Behavior of Recycled Aggregate Concrete Elements

reliability index b of columns under different reinforcement ratio decreases.Furthermore, the smaller reinforcement ratio q causes the smaller relative height ofcompression zone n and thus leads to the decrease in b. When the COV of RACcompressive strength d is 0.16 and 0.18, for the case of n = 0.2, compared toordinary concrete column, the reliability index b of RAC column is decreased by9.6 and 17.2%, respectively. On the one hand, when the n = 0.8 and the rein-forcement ratio of column is larger 2.5%, the reliability indexes b of columns witheccentric load are almost the same. On the other hand, the decrease in b is differentbecause the n is different, and except for ordinary concrete, the rest of the distri-butions cannot satisfy the code requirements. Therefore, certain measures must betaken to improve the reliability of RAC column.
Figure 10.70 shows the influence of the COV of compressive strength on thereliability index of the columns in three groups. The average value of axial
2.4
2.8
3.2
3.6
4.0
(%)
2.4
2.8
3.2
3.6
4.0
4.4
4.8
5.2
0.4 0.8 1.2 1.6 2.0 2.4 2.8 3.2 0.4 0.8 1.2 1.6 2.0 2.4 2.8 3.2
(%)
=0.2 =0.8
Fig. 10.69 Influence of the reinforcement ratio q and standard deviation r on the reliability indexb at the same characteristic compressive strength of 20.1 MPa
ξ=0.2 ξ=0.8
2.4
2.8
3.2
3.6
4.0
0.4 0.8 1.2 1.6 2.0 2.4 2.8 3.2ρ (%)
β
fc,k=20.1,σ=5
fc,k=18.9,σ=6
fc,k=17.8,σ=7
2.4
2.8
3.2
3.6
4.0
4.4
4.8
5.2
0.4 0.8 1.2 1.6 2.0 2.4 2.8 3.2ρ (%)
β
fc,k=20.1,σ=5
fc,k=18.9,σ=6
fc,k=17.8,σ=7
Fig. 10.70 Influence of the reinforcement ratio q and standard deviation r on the reliability indexb at different relative height of compression zone n under the same average compressive strengthof 25.6 MPa
10.4 RAC Columns 389

compressive strength is 25.6 MPa. From Fig. 10.70, it can be observed that, as thecompressive strength discreteness increases, the reliability index b of column undereccentric load decreases. For instance, when the n = 0.2, compared to ordinaryconcrete, when the COV of RAC compressive strength d is 0.16 and 0.18, thereliability index is decreased by 13.1 and 19.0%, respectively. Figures 10.71 and10.72 show the influence of COV of compressive strength on the reliability ofcolumn. There are three groups in which the standard deviation of compressivestrength is 6 MPa and 7 MPa, respectively. From the figures, it is shown that withthe increase in the average value of concrete compressive strength, the COV ofcompressive strength decreases, which further increase the reliability of column. Inactual engineering projects, to make sure that the reliability index satisfies the coderequirements, the compressive strength could be increased by proper mixing designof RAC.
ξ=0.2 ξ=0.8
2.4
2.8
3.2
3.6
4.0
0.4 0.8 1.2 1.6 2.0 2.4 2.8 3.2ρ (%)
β
fc,k=20.1,σ=6
fc,k=18.9,σ=6
fc,k=21.1,σ=6
2.4
2.8
3.2
3.6
4.0
4.4
4.8
5.2
0.4 0.8 1.2 1.6 2.0 2.4 2.8 3.2ρ (%)
β
fc,k=20.1,σ=6
fc,k=18.9,σ=6
fc,k=21.1,σ=6
Fig. 10.71 Influence of the reinforcement ratio q and compressive strength on the reliability indexb at different relative height of compression zone n under the same standard deviation r of 6 MPa
ξ=0.2 ξ=0.8
2.4
2.8
3.2
3.6
4.0
0.4 0.8 1.2 1.6 2.0 2.4 2.8 3.2ρ (%)
β
fc,k=20.1,σ=7
fc,k=17.8,σ=7
fc,k=21.1,σ=7
2.4
2.8
3.2
3.6
4.0
4.4
4.8
5.2
0.4 0.8 1.2 1.6 2.0 2.4 2.8 3.2ρ (%)
β
fc,k=20.1,σ=7
fc,k=17.8,σ=7
fc,k=21.1,σ=7
Fig. 10.72 Influence of the reinforcement ratio q and compressive strength on the reliability indexb at different relative height of compression zone n under the same standard deviation r of 7 MPa
390 10 Structural Behavior of Recycled Aggregate Concrete Elements
10.5 Concluding Remarks
This chapter shed light on basic mechanical behaviors of recycled aggregate con-crete (RAC) components. Based on the studies carried out, some conclusions aregiven as follows:
(1) The feasibility of the code formulae to calculate the RAC bending and shearcapacity was verified.
(2) The reliability analysis of RAC beam shows that the RAC beams subjected tobending moment have similar performance with the ordinary concrete beams.The bending moment mechanism for RAC and ordinary concrete is basicallythe same. Therefore, analyzing the RAC beam bending moment according toordinary concrete beam bending moment theorem is feasible. On the otherhand, when it comes to the shear performance, it shows that the process of theRAC beam’s shear failure is similar to that of ordinary concrete, and itundergoes elastic and inelastic stages. Compared to ordinary concrete under thesame conditions, the RAC beam diagonal cross-sectional area cracking load issmaller than that of the ordinary concrete beam. As the RCA replacementpercentage increases, the cracking load shows a decrease trend and the diagonalaverage crack width of RAC beam is close to that of ordinary concrete. Thelimit shear capacity of the RAC beam decreases as the RCA replacementpercentage increases. The strain value of RAC stirrups is close to that ofordinary concrete. The analysis of the shear performance of RAC beam withand without stirrups can be analyzed according to the existing theory of theordinary concrete beam.
(3) Analysis of the cracking patterns, deflections, and bearing capacities of U andC-typed semi-precast beams were carried out. From the strain distribution,bearing capacity, and deformation ability, it is found that both U and C-typedsemi-precast beam work well and are similar to unity beam. Interface phe-nomenon between precast part and cast-in-situ part is presented in this studyand needs further studies to determine its effects on the shear behavior ofbeams.
(4) The experimental study and the FEM analysis of the gradient slabs show thatthe RAC gradient slabs with different RCA reinforcement ratios failed withgood ductility, and the slippage did not occur within the interface of the gra-dient slab with RAC constructed by layered casting and layered vibrating. Theresults show that the gradient construction method does not have negativeeffects on the flexural performance of RAC components.
(5) The influence of the RCA replacement percentage and steel fiber volume ratioon the punching shear performance of the slab were analyzed. The results showthat when steel fibers are added into recycled concrete, not only does thepunching shear capacity increases, but also the slab’s ductility, deformation,and energy consumption are also improved. For the RAC slab under punchingshear, the addition of steel fibers helps to transform the failure pattern fromshear failure to bending failure. The increase in the RCA replacement
10.5 Concluding Remarks 391
percentage sees a gradual decline in the punching shear capacity, shear resis-tance performance, and ductility.
(6) Both of the RAC columns under axial and eccentric compression were inves-tigated from the viewpoint of reliability. The results show that the RAC col-umn’s N–M test related curve is similar to that of ordinary concrete. From theloading process, cracking and up to the specimen failure pattern, it is observedthat as the vertical load increases the eccentricity, the RAC column showedfailure by axial compression, small eccentricity compression failure, limitfailure, and large eccentric compression failure, and the increase in the RCAreplacement percentage did not cause any change.
References
1. MOHURD. GB-50152-2012 standard for test methods for concrete structures. Beijing: ChinaArchitecture and Building Press; 2012.
2. Ishill K. Flexible characteristic of RC beam with RCA. In: Proceeding of the 25# JSCEAnnual Meeting; 1998. p. 886–7.
3. Mukai T, Kikuchi M. Properties of reinforced concrete beams containing recycled aggregate.Demolition and Reuse of Concrete and Masonry. 1988;2:670–9.
4. Andrzej BA, Alina TK. Behavior of RC beams from recycled aggregate concrete. In:Proceedings of the American Concrete Institute; 2002.
5. Ippei M, Masaru S, Takahisa S. Flexural properties of reinforced recycled concrete beams. In:Conference on the use of recycled materials in building and structures; Nov 2004.
6. Huang Q. Experimental research and finite element analysis on the flexural performance ofrecycled aggregate concrete components. Harbin Institute of Technology; 2005.
7. Song XW. Experimental research on recycled concrete beams bending performance.Zhengzhou University; 2006.
8. MOHURD. GB 50010-2010 code for design of concrete structures. Beijing: ChinaArchitecture and Building Press; 2010.
9. Rusch H. Tests on the strength of the flexural compression zone. Bulletin Berlin, DeutscherAusschuss Für Stahlbeton. 1955;120:94.
10. Hognestad E, Hanson NW, McHenry D. Concrete stress distribution in ultimate strengthdesign. J Proc 1955;52(12):455–80.
11. Masaru SO, Takahisa S, Maruyama I. Shear behavior of reinforced recycled concrete beams.In: Proceedings of the international RILEM conference on the use of recycled materials inbuildings and structures, 8 Nov 2004. p. 610–8.
12. González B, Martínez F. Shear strength of concrete with recycled aggregates. In: Proceedingsof international RILEM conference on the use of recycled materials in buildings andstructures, Barcelona; 2004. p. 619–28.
13. Etxeberria M, Vazquez E, Mari A. The role and influence of recycled aggregate concrete. In:Proceedings of the international RILEM conference on the use of recycled materials inbuildings and structures 8 Nov 2004. p. 612–622.
14. Yagishita F, Sano M, Yamada M. Behaviour of reinforced concrete beams containingrecycled coarse aggregate. Report of the Environmental Science Research Institute, KinkiUniversity; 1997, vol. 25, p. 1–12.
15. Han BC, Yun HD, Chung SY. Shear capacity of reinforced concrete beams made withrecycled-aggregate. Special Publication; 1 Jun 2001, vol. 200, p. 503–16.
392 10 Structural Behavior of Recycled Aggregate Concrete Elements

16. Zhang YM. Preliminary study on the proportion design of recycled aggregate concrete. ChinaConcrete and Cement Products. 2002;1:7–9 (only available in Chinese).
17. Hussien SA. The influence of the connection characteristics on the seismic performance ofprecast concrete structures. Master degree. Delft University of Technology; 2005.
18. Sergio MA, Carranza R, Perez-Navarrete D, Martinez R. Seismic tests of beam-to-columnconnections in a precast concrete frame. PCI. 2002:70–89.
19. Ertas O, Ozden S, Ozturan T. Ductile connections in precast concrete moment resistingframes. PCI. 2006.
20. Fatema T, Hossain T, Habib A. A novel approach of modeling precast concrete frame joint:modeling, numerical simulation and performance evaluation. J Civil Eng (IEB). 2007;35(2):105–18.
21. Yee PTL, Adnan AB, Mirasa AK, Rahman ABA. Performance of IBS precast concretebeam-column connections under earthquake effects: a literature review. Am J Eng Appl Sci.2011;4(1):93–101.
22. DG/TJ08-2018-2007 Technical code on the application of recycled concrete. Shanghai; 2007.23. Xiao JZ, Sun YD, Falkner H. Seismic performance of frame structures with recycled
aggregate concrete. Eng Struct. 2006;28(1):1–8.24. Paulay T, Park R, Phillips MH. Horizontal construction joints in cast-in-situ reinforced
concrete. Shear in Reinforced Concrete, ACI SP-42, Vol. 2: pp. 599–616; 1974.25. Zhu XH, Meng ZY. Current research status and prospect of functionally gradient materials.
J Funct Mater. 1998;29(2):121–7.26. Hansen TC. Recycling of demolished concrete and masonry. RILEM Report No. 6; 1992.27. Mandal S, Gupta A. Strength and durability of recycled aggregate concrete. In: IABSE
Symposium Report 14:33–46; 2002.28. Xiao JZ, Li WG, Fan YH, Huang X. An overview of study on recycled aggregate concrete in
China (1996–2011). Constr Build Mater. 2012;31:364–83.29. MOHURD. GB/T14684-2011 Sand for construction. Beijing: China Architecture and
Building Press; 2011.30. MOHURD. JGJ52-2006 Standard for technical requirements and test method of sand and
crushed stone (or gravel) for ordinary concrete. Beijing: China Architecture and BuildingPress; 2006.
References 393
Chapter 11Seismic Performance of RecycledAggregate Concrete Columns
Abstract In this chapter, the studies on the seismic performance of recycledaggregate concrete (RAC) columns and confined RAC columns are performed. Themain parameters in these studies are recycled coarse aggregate (RCA) replacementpercentage, construction sequence, bond–slip effect, and confining materials. Basedon these investigations, failure pattern, hysteresis curves, skeleton curves, energydissipation, and stiffness deterioration laws of RAC columns and confined RACcolumns are analyzed. The RCA effect on seismic performance of columns issignificant. The construction sequence can also affect the seismic behavior ofcolumns. It was discovered that the confining materials obviously improved theseismic performance of RAC columns.
11.1 Introduction
Recycled aggregate concrete (RAC) is concrete in which recycled coarse aggregates(RCA) replace part or all of the natural coarse aggregates (NCA). It is a kind ofgreen construction material that contributes to the sustainable development ofconcrete. Because of the old mortar adhered to RCA, the mechanical properties ofRAC are inferior than conventional concrete. Previous studies have generallyindicated that both the compressive and tensile strength of RAC are lower thanthose of conventional concrete. In particular, the elastic modulus of former is 40%lower than the latter. Although the mechanical properties of RAC are inferior thanconventional concrete, RAC can be applied in structures as long as the mix pro-portion design and construction work are properly carried out. So far, severalstudies on RAC structures have been performed. O’mahony [1] conducted shearstrength tests on both RAC and natural concrete specimens. Their test resultsindicated that the shear strength of RAC can match that of conventional concrete.Fathifazl et al. [2] studied the shear behavior of RAC beams without stirrups. Theirexperimental results proved that the related calculation procedures outlined in theAmerican Concrete Institute (ACI) and the Canadian Standards Association(CSA) are still suitable to the design of RAC beams. However, there is limited
© Springer-Verlag GmbH Germany 2018J. Xiao, Recycled Aggregate Concrete Structures,Springer Tracts in Civil Engineering, https://doi.org/10.1007/978-3-662-53987-3_11
395

research on the seismic behavior of RAC structures. Corinaldesi and Moriconi [3]conducted experimental studies on the seismic behavior of RAC beam–columnjoints under cyclic loading. Xiao et al. [4, 5] investigated the seismic behavior ofplane frame under low cyclic loads and conducted a shake table test of a six-storyRAC frame structure. Zhang et al. [6] performed experimental studies on theseismic behavior of RAC shear wall with different RCA replacement percentagesand construction details. These pioneer investigations have shown that RACstructures can be applied in civil engineering and structural engineering actualprojects.
On the other hand, some investigations have indicated that the durability of RACis inferior to that of conventional concrete and that the shrinkage of former is up to100% larger than the latter. It is found that the shrinkage of recycled concrete willincrease significantly with increase in the RCA content.
In the mean time, the seismic behavior of semi-precast conventional concretemembers has been preliminarily investigated. Lian et al. [7] conducted experimentalstudies and nonlinear analysis on the seismic performance of the semi-precast shearwall under low cyclic loadings. They found that the semi-precast shear wall had afine seismic behavior. Nishiura et al. [8] carried out a bending shear test of thesemi-precast U-typed beam with recycled concrete being added as the post-castconcrete layer. The test results indicated that the seismic behavior of thesemi-precast RAC beam could fully meet the performance requirements of themember structure. Based on the failure pattern, the bearing capacity, and the energydissipation capacity of RAC semi-precast columns, Sai et al. [9] found that themechanical performance of RAC columns would not decrease significantly ascompared with conventional concrete columns.
Confinement is considered as an effective method to improve the behavior ofRAC columns and that of steel tube columns. There are two types of confinedcolumns with RAC: RAC-filled steel tube (RCFS) in which RAC is filled into asteel tube, and RAC-filled GFRP tube (RCFF) in which a glass fiber-reinforcedplastic (GFRP) tube is filled with RAC. Both RCFS and RCFF lead RAC in a stateof strong confinement, which leads to no moisture exchange together with verylimited shrinkage of the core RAC 20; due to the presence of lateral confinement,the mechanical response of confined concrete is enhanced with respect to thedeformation and compressive strength. Konno et al. [10] performed axial com-pression tests on recycled concrete specimens confined with steel tubes. It wasfound that the mechanical properties are similar to those of the conventional con-crete confined by steel tubes. However, its modulus is lower than that of ordinaryconcrete confined by steel tubes. Yang and Han [11] conducted series of tests onRCFS columns and beams. Research findings showed that the bearing capacity andthe stiffness decreased with increase in RCA replacement percentage. Xiao et al.[12] carried out axial compression tests on RAC confined with both steel tubes andGFRP tubes. These tests proved that both the strength and the deformation of RACare significantly improved. Yang et al. [13] also performed an investigation on the
396 11 Seismic Performance of Recycled Aggregate Concrete Columns
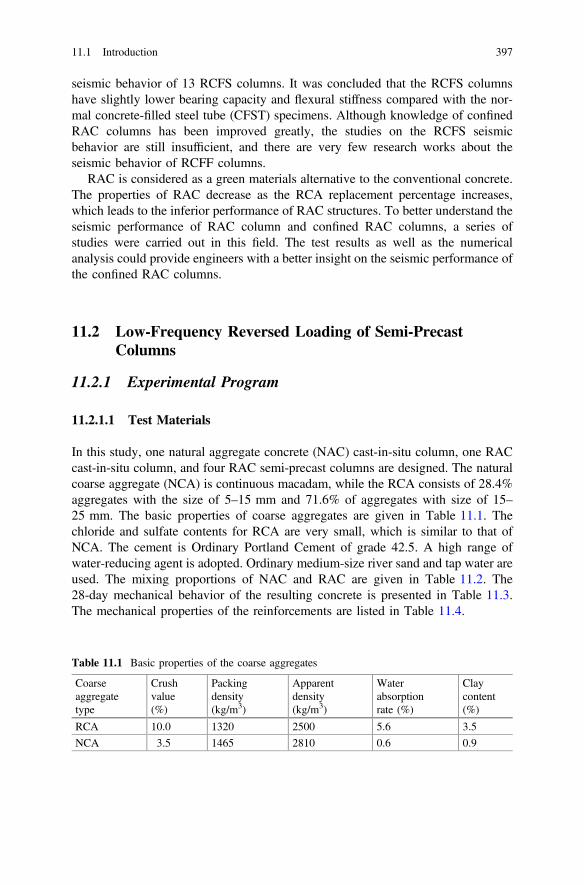
seismic behavior of 13 RCFS columns. It was concluded that the RCFS columnshave slightly lower bearing capacity and flexural stiffness compared with the nor-mal concrete-filled steel tube (CFST) specimens. Although knowledge of confinedRAC columns has been improved greatly, the studies on the RCFS seismicbehavior are still insufficient, and there are very few research works about theseismic behavior of RCFF columns.
RAC is considered as a green materials alternative to the conventional concrete.The properties of RAC decrease as the RCA replacement percentage increases,which leads to the inferior performance of RAC structures. To better understand theseismic performance of RAC column and confined RAC columns, a series ofstudies were carried out in this field. The test results as well as the numericalanalysis could provide engineers with a better insight on the seismic performance ofthe confined RAC columns.
11.2 Low-Frequency Reversed Loading of Semi-PrecastColumns
11.2.1 Experimental Program
11.2.1.1 Test Materials
In this study, one natural aggregate concrete (NAC) cast-in-situ column, one RACcast-in-situ column, and four RAC semi-precast columns are designed. The naturalcoarse aggregate (NCA) is continuous macadam, while the RCA consists of 28.4%aggregates with the size of 5–15 mm and 71.6% of aggregates with size of 15–25 mm. The basic properties of coarse aggregates are given in Table 11.1. Thechloride and sulfate contents for RCA are very small, which is similar to that ofNCA. The cement is Ordinary Portland Cement of grade 42.5. A high range ofwater-reducing agent is adopted. Ordinary medium-size river sand and tap water areused. The mixing proportions of NAC and RAC are given in Table 11.2. The28-day mechanical behavior of the resulting concrete is presented in Table 11.3.The mechanical properties of the reinforcements are listed in Table 11.4.
Table 11.1 Basic properties of the coarse aggregates
Coarseaggregatetype
Crushvalue(%)
Packingdensity(kg/m3)
Apparentdensity(kg/m3)
Waterabsorptionrate (%)
Claycontent(%)
RCA 10.0 1320 2500 5.6 3.5
NCA 3.5 1465 2810 0.6 0.9
11.1 Introduction 397

11.2.1.2 Design and Construction of the Specimens
The main construction details of the specimens are given in Table 11.5 with theirreinforcement diagram being shown in Fig. 11.1. Columns NCCC-1 and RCCC-2are fully cast-in-situ with NAC and RAC, respectively. For Columns RCCC-3 andRCCC-4, the external part is precast with NAC and cured for 28 days first, andthen, RAC of the core column is then poured and cured. For Columns RCCC-5 andRCCC-6, the internal part (core) is precast with RAC and cured for 28 days, and theNAC of external column is then poured and cured. Because the reinforcement barsin precast core extend into the base beam by only 40 mm (insufficient anchorage),their contributions to the bending capacity of the columns can be neglected.
Figure 11.2 demonstrates the construction procedure of the semi-precast col-umns. Similar to the construction in actual engineering projects, the constructionsteps of RAC semi-precast columns include the steel binding, the casting of basebeam concrete, the casting of precast part of the column, and the cast-in-situ part ofcolumn.
11.2.1.3 Loading Device
The test is performed using the multi-functional electro-hydraulic servo-structuretesting machine at Tongji University, Shanghai, China. The net height of the col-umn is 1000 mm, and the column is connected to a horizontal loading devicethrough a steel hinge support at the top. The special steel hinge enables the axialloading to be properly transferred under large lateral displacement. The calculationheight from the bottom of the column to the steel hinge center is 1280 mm, and thespecimen’s shear span-to-depth ratio (H=h0) is 4. The axial compression ratio(N=fcA) is 0.3. The vertical load is exerted by a 10,000-kN hydraulic jack, and thehorizontal load is exerted by a 1500-kN hydraulic jack. The base beam is fixed onthe geosynclines through two prestressed anchor bolts. Moreover, two horizontal tiebars are used to prevent the base of the specimen from sliding. A picture of theexperimental setup is shown in Fig. 11.3.
Table 11.2 Mix proportion of concrete
RCAreplacement(%)
Water–cementratio
Cement(kg/m3)
Sand(kg/m3)
NCA(kg/m3)
RCA(kg/m3)
Water(kg/m3)
Water-reducingagent (ml/m3)
0 0.488 372.8 730 1120 0 182 323.76
100 0.43 430 700 0 950 185 214.5
398 11 Seismic Performance of Recycled Aggregate Concrete Columns

11.2.1.4 Measurement and Data Acquisition Device
A schematic drawing of positions of displacement measurement devices is given inFig. 11.4. Five linear variable differential transducers (LVDTs), D1–D5, are dis-tributed along the height of the column to measure the in-plane lateral displace-ments of the column. D6 is fixed to monitor the lateral displacement of the basebeam. In addition, D7 is installed to measure the out-of-plane lateral displacementof the column.
Figure 11.5 shows the positions of the strain gauges pre-attached on the rein-forcement bars. Strain gauges S1–S4 on the longitudinal bars are located 80 mmabove the top of the base beam, and strain gauge S5 is fixed on the first stirrupabove the top of the base beam. To measure the strain of concrete in the plasticregion, two strain gauges S6 and S7 are bonded at the bottom of column.
Table 11.3 Compressive strength and elastic modulus of concrete after 28 days of curing age
Concrete-pouringsequence
RCAreplacement(%)
Compressivestrength(MPa)
Averagecompressivestrength(MPa)
Convertedaveragecompressivestrength (MPa)
Elastic modulus Ec(GPa)
Measuredvalue
Averagevalue
The firstbatch
0 27.0 30.5 28.98 35.42 36.30
33.6 34.70
30.9 38.78
100 29.2 28.4 26.98 23.74 25.04
30.5 24.82
25.5 26.56
Thesecondbatch
0 22.3 31.4 29.83 34.32 36.14
33.6 37.59
31.4 37.32
100 24.0 28.2 26.79 25.13 28.06
30.6 29.78
28.2 29.27
Table 11.4 Mechanical properties of the reinforcement bars
Diameter(mm)
Yield strength (MPa) Ultimate strength (MPa) Elastic modulus (GPa)
Measuredvalue
Averagevalue
Measuredvalue
Averagevalue
Measuredvalue
Averagevalue
8 (stirrup) 320.91 340.38 413.12 430.11 230.9 210.9
328.14 413.46 204.5
372.09 463.75 197.3
16(longitudinal)
348.29 352.72 452.78 464.99 210.2 196.0
363.42 478.14 192.7
346.45 464.05 185.1
11.2 Low-Frequency Reversed Loading of Semi-Precast Columns 399

11.2.1.5 Loading Program
The measured axial compressive strength is adopted to calculate the axial com-pression ratio of the column. The total axial loading capacity of the semi-precastcolumn is approximately obtained by superposing the capacities of the precast partand the cast-in-situ part. The vertical loads exerted on NCCC-1 and RCCC-2 toRCCC-6 are 809, 754, 789, 798, 807 and 819 kN, respectively. At the beginning ofthe test, a vertical load of 40–60% of the proposed vertical axial force is applied and
Table 11.5 Construction details of the semi-precast columns
Column No. Entirecross-sectionalsize (mm2)
Constructionmethod
RCAreplacementpercentage
Precastorder
Cross-sectionalsize of corecolumn (mm2)
NCCC-1 350 � 350 Cast-in-situ 0 – –
RCCC-2 100% – –
RCCC-3 Semi-precast Core: 100%;External: 0
Externallyprecast
150 � 150
RCCC-4 200 � 200
RCCC-5 Internallyprecast
150 � 150
RCCC-6 200 � 200
NCCC-1,RCCC-2
RCCC-3,RCCC-5
RCCC-4,RCCC-6
core
core
Core
Fig. 11.1 Reinforcement diagram of specimens (Unit: mm)
400 11 Seismic Performance of Recycled Aggregate Concrete Columns
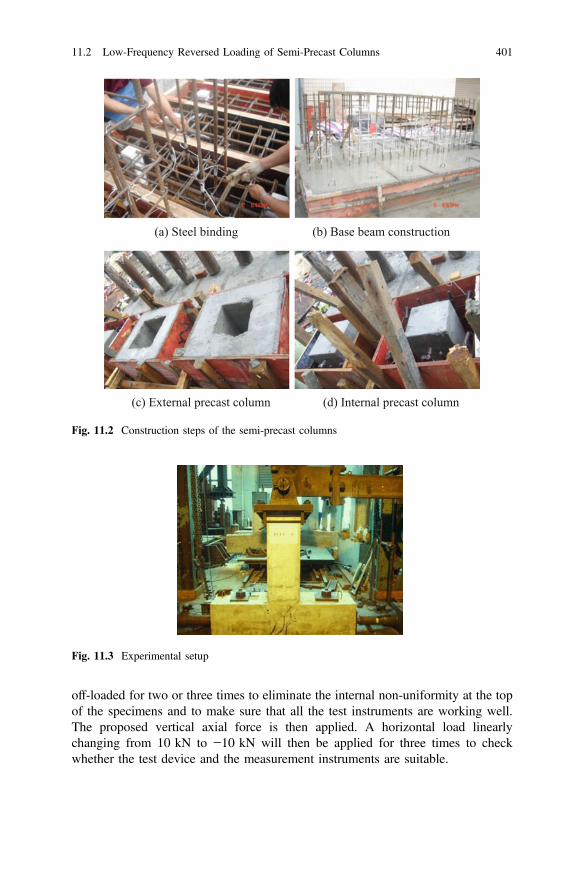
off-loaded for two or three times to eliminate the internal non-uniformity at the topof the specimens and to make sure that all the test instruments are working well.The proposed vertical axial force is then applied. A horizontal load linearlychanging from 10 kN to −10 kN will then be applied for three times to checkwhether the test device and the measurement instruments are suitable.
(a) Steel binding (b) Base beam construction
(c) External precast column (d) Internal precast column
Fig. 11.2 Construction steps of the semi-precast columns
Fig. 11.3 Experimental setup
11.2 Low-Frequency Reversed Loading of Semi-Precast Columns 401

The loading process, controlled by a computer, consists of two main steps,namely a load-controlled step and a displacement-controlled step, as shown inFig. 11.6. During the load-controlled stage, the load increment is 0.2 Py, where Py isthe calculated yield load of the column, and each load is repeated for three times.After the bottom longitudinal reinforcement bars have yielded, the loading processis changed to the displacement-controlled stage. The displacement increment is onetimes of the yield displacement Dy, and each load step is repeated for three timesuntil the specimen fails or its horizontal load drops below 80% of its peak value.During the proposed quasi-static tests, the loading and unloading rates are the same.
Jack and bolts
D2
D1
D3
D4
D5
D6
D7
Fig. 11.4 Schematic drawing of the positions for the displacement gauges (Unit: mm)
Strain gauges on stirrups
Strain gauges on longitudinal bars
Strain gauges on longitudinal bars S1,S2,S3
Strain gauges on longitudinal bars S4
Strain gauges on stirrups S5
Strain gauses on concrete S6 (S7)
Fig. 11.5 Schematic drawing of the positions for the strain gauges (Unit: mm)
402 11 Seismic Performance of Recycled Aggregate Concrete Columns
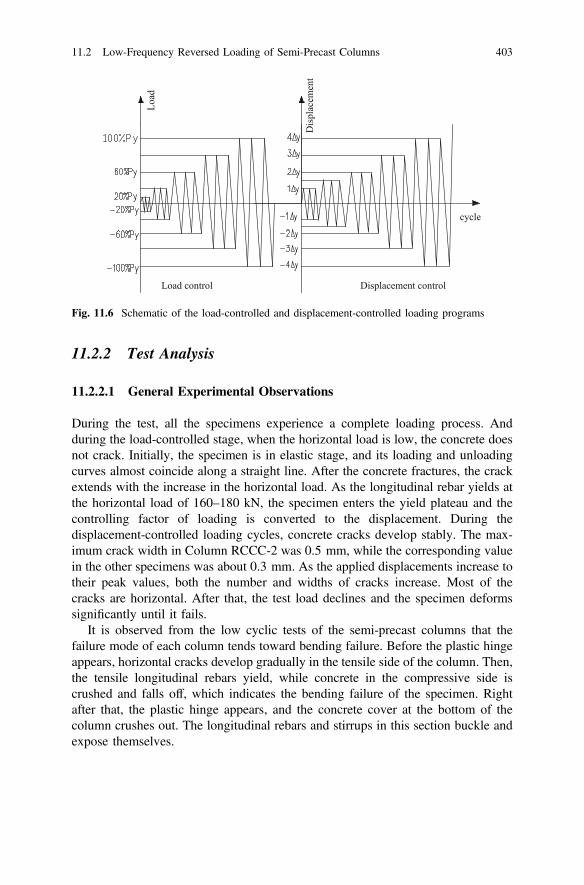
11.2.2 Test Analysis
11.2.2.1 General Experimental Observations
During the test, all the specimens experience a complete loading process. Andduring the load-controlled stage, when the horizontal load is low, the concrete doesnot crack. Initially, the specimen is in elastic stage, and its loading and unloadingcurves almost coincide along a straight line. After the concrete fractures, the crackextends with the increase in the horizontal load. As the longitudinal rebar yields atthe horizontal load of 160–180 kN, the specimen enters the yield plateau and thecontrolling factor of loading is converted to the displacement. During thedisplacement-controlled loading cycles, concrete cracks develop stably. The max-imum crack width in Column RCCC-2 was 0.5 mm, while the corresponding valuein the other specimens was about 0.3 mm. As the applied displacements increase totheir peak values, both the number and widths of cracks increase. Most of thecracks are horizontal. After that, the test load declines and the specimen deformssignificantly until it fails.
It is observed from the low cyclic tests of the semi-precast columns that thefailure mode of each column tends toward bending failure. Before the plastic hingeappears, horizontal cracks develop gradually in the tensile side of the column. Then,the tensile longitudinal rebars yield, while concrete in the compressive side iscrushed and falls off, which indicates the bending failure of the specimen. Rightafter that, the plastic hinge appears, and the concrete cover at the bottom of thecolumn crushes out. The longitudinal rebars and stirrups in this section buckle andexpose themselves.
Load control Displacement control
cycle
Load
Dis
plac
emen
tFig. 11.6 Schematic of the load-controlled and displacement-controlled loading programs
11.2 Low-Frequency Reversed Loading of Semi-Precast Columns 403

11.2.2.2 Failure Pattern of the Specimen
The failure patterns of the specimens are shown in Figs. 11.7 and 11.8. In general,the fully cast-in-situ column (RCCC-2) arrives at the lateral peak load first, fol-lowed by RAC semi-precast columns, and the last is the fully cast-in-situ NACcolumn (NCCC-1). All of the specimens experience an apparent failure processafter the lateral peak load is reached. In terms of the crushing pattern of the concreteat the column bottom, the fully cast-in-situ NAC column (NCCC-1) has the largest
(a) NCCC-1 (b) RCCC-2 (c) RCCC-3
(d) RCCC-4 (e) RCCC-5 (f) RCCC-6
Fig. 11.7 Failure patterns of the specimens
(a) NCCC-1 (b) RCCC-3
Fig. 11.8 Comparisons between the failure patterns of the integrated and semi-precast columns
404 11 Seismic Performance of Recycled Aggregate Concrete Columns

number of cracks. The failure scope of RAC semi-precast columns is smaller thanthat of the fully cast-in-situ NAC column, as shown in Fig. 11.8. To observe thecontact surface between the precast and the cast-in-situ concrete, Column RCCC-6is cut through to expose the core region. It is found that the contact surface is stillrelatively smooth, as demonstrated in Fig. 11.9.
11.2.2.3 Lateral Displacement
Figure 11.10 shows the lateral displacement distribution along the height of eachspecimen at the 80% yield load point, the 100% yield load point, and the failuredisplacement point, where the load declines to 85% of the peak load. It can beobserved from the figure that the specimen’s overall lateral displacement distri-bution indicates an apparent bending-type failure. As the load increases, cracksdevelop and the stiffness of the specimen declines. As a result, although the shapesof the lateral displacement curves are somehow different, they all tend toward abending-type failure. The above analysis is evidenced by the observed phenomenonthat the cracks are mostly horizontal in the beginning and only a small amount ofthem become oblique in the end.
11.2.2.4 Characteristic Loads
The yield load, peak load, and failure load of the specimens are summarized inTable 11.6. The yield load is defined by the yielding of longitudinal rebars orthrough the energy equivalent method, while the failure load corresponds to thepoint at which the load of the specimen declines to 85% of the peak load.
Fig. 11.9 Contact surfacebetween the precast andcast-in-situ concrete inRCCC-6 after failure
11.2 Low-Frequency Reversed Loading of Semi-Precast Columns 405

Table 11.6 shows that the yield load of Column NCCC-1 is 8.5% higher thanthat of Column RCCC-2, whereby either the construction sequence or the size ofthe core column does not affect the yield load obviously. The peak load of ColumnNCCC-1 is higher than that of Columns RCCC-2, RCCC-4 and RCCC-6 by 7.7,9.6 and 7.7%, respectively, and is lower than those of Columns RCCC-3 andRCCC-5 by 15.1 and 5.7%, respectively. It indicates that the moment bearingcapacity of the fully cast-in-situ RAC column is lower than that of the fullycast-in-situ NAC column. Furthermore, the construction order does not have mucheffect on the flexural capacity of the specimen, but the size of core column does.When the size of the core column is relatively large, the bearing capacity of thespecimen declines with the increase in RAC content. When the size of the corecolumn is relatively small, the external NAC has a constraint on RAC within thecore area, which makes up for the adverse effect of RAC and might even improvethe bearing capacity of the specimen.
0
200
400
600
800
1000
1200
1400
0 1 2 3 4 5 6 7
H (m
m)
Δ (mm)
0
200
400
600
800
1000
1200
1400
0 1 2 3 4 5 6 7
H (m
m)
Δ (mm)
0
200
400
600
800
1000
1200
1400
0 2 4 6 8 10
H (m
m)
Δ (mm)
(a) Pull at 80% yield load (b) Push at 80% yield load (c) Pull at yield load
NCCC-1RCCC-2RCCC-3RCCC-4RCCC-5RCCC-6
NCCC-1RCCC-2RCCC-3RCCC-4RCCC-5RCCC-6
NCCC-1
RCCC-2
RCCC-3
RCCC-4
RCCC-5
RCCC-6
Fig. 11.10 Lateral displacement distribution along the column height
406 11 Seismic Performance of Recycled Aggregate Concrete Columns
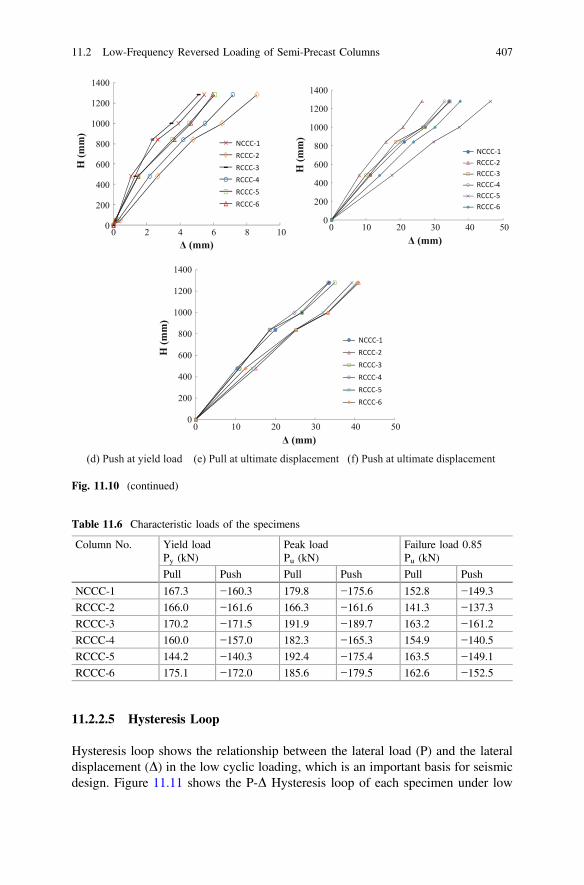
11.2.2.5 Hysteresis Loop
Hysteresis loop shows the relationship between the lateral load (P) and the lateraldisplacement (D) in the low cyclic loading, which is an important basis for seismicdesign. Figure 11.11 shows the P-D Hysteresis loop of each specimen under low
Table 11.6 Characteristic loads of the specimens
Column No. Yield loadPy (kN)
Peak loadPu (kN)
Failure load 0.85Pu (kN)
Pull Push Pull Push Pull Push
NCCC-1 167.3 −160.3 179.8 −175.6 152.8 −149.3
RCCC-2 166.0 −161.6 166.3 −161.6 141.3 −137.3
RCCC-3 170.2 −171.5 191.9 −189.7 163.2 −161.2
RCCC-4 160.0 −157.0 182.3 −165.3 154.9 −140.5
RCCC-5 144.2 −140.3 192.4 −175.4 163.5 −149.1
RCCC-6 175.1 −172.0 185.6 −179.5 162.6 −152.5
0
200
400
600
800
1000
1200
1400
0 2 4 6 8 10
H (m
m)
Δ (mm) Δ (mm)
0
200
400
600
800
1000
1200
1400
0 10 20 30 40 50
H (m
m)
0
200
400
600
800
1000
1200
1400
0 10 20 30 40 50
H (m
m)
Δ (mm)
(d) Push at yield load (e) Pull at ultimate displacement (f) Push at ultimate displacement
NCCC-1RCCC-2RCCC-3RCCC-4RCCC-5RCCC-6
NCCC-1RCCC-2RCCC-3RCCC-4RCCC-5RCCC-6
NCCC-1RCCC-2RCCC-3RCCC-4RCCC-5RCCC-6
Fig. 11.10 (continued)
11.2 Low-Frequency Reversed Loading of Semi-Precast Columns 407
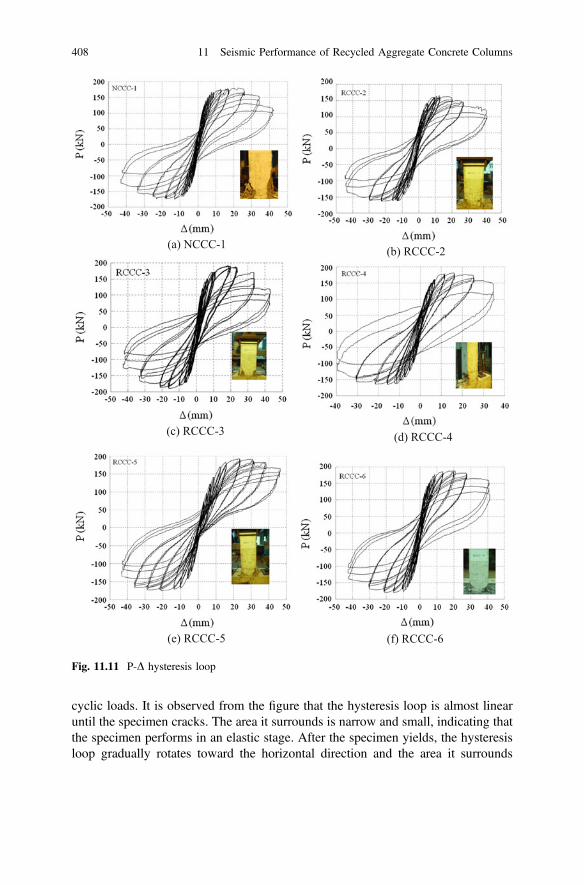
cyclic loads. It is observed from the figure that the hysteresis loop is almost linearuntil the specimen cracks. The area it surrounds is narrow and small, indicating thatthe specimen performs in an elastic stage. After the specimen yields, the hysteresisloop gradually rotates toward the horizontal direction and the area it surrounds
(a) NCCC-1 (b) RCCC-2
(c) RCCC-3 (d) RCCC-4
(e) RCCC-5 (f) RCCC-6
Fig. 11.11 P-D hysteresis loop
408 11 Seismic Performance of Recycled Aggregate Concrete Columns

gradually expands, which means that the energy consumed by the specimen in aloading cycle increases after the specimen yields.
In comparison, the fullness of the hysteresis loop of the fully cast-in-situ columnis the best, followed by that of the externally precast column, and that of internallyprecast column is the worst. Moreover, the fullness of the hysteresis loop ofColumn NCCC-1 is better than that of Column RCCC-1, which indicates that theenergy dissipation capacity of RAC column is worse than that of the NAC column.
In the same loading stage, the peak load of the late cycle is lower than that of theearly cycle, indicating that the bearing load, stiffness, and energy dissipationcapacity of the specimen are reduced as a result of the damage accumulation.
11.2.2.6 Skeleton Curve
The skeleton curve is the envelope curve obtained by connecting the peak points ofthe P-D hysteresis loop of the first cycle in each loading stage. Figure 11.12demonstrates the skeleton curves of the columns. As it can be seen from the figure,the shapes of the specimens’ skeleton curves are very similar to each other. Beforethe specimen cracks, the skeleton curve is almost linear, suggesting that the spec-imen is in the elastic state. After the specimen cracks, the skeleton curve becomesnonlinear, indicating that the specimen’s stiffness declines and the specimen is inthe elastic–plastic state. After the peak load, the skeleton curve enters the softeningstage, showing the apparent deteriorating of the bearing capacity and stiffness of thespecimen. The yield point, the peak load point, and the failure point can be clearlyidentified in the skeleton curve.
Fig. 11.12 Comparisons between skeleton curves
11.2 Low-Frequency Reversed Loading of Semi-Precast Columns 409

It can be found by comparing the skeleton curves of Columns NCCC-1 andRCCC-2 that RAC does not have significant influence on the specimens’ skeletoncurve and the initial stiffness is nearly the same before yielding. After yielding, theslope of Column RCCC-2’s skeleton curve is a little smaller than that of ColumnNCCC-1. At the peak point, the load of Column RCCC-2 decreases much morethan that of Column NCCC-1, indicating that its ductility is worse.
Before yielding, the influence of the core column size or the construction methodon the skeleton curve is not significant. After yielding, as the construction methodchanges from internally precast to externally precast and the size of core columndecreases, the softening stage of the skeleton curve becomes gentle and the dete-rioration of the bearing capacity after the peak load is inhibited. Moreover, thefailure deformation of the specimen increases significantly, meaning that its duc-tility becomes better.
To better understand the characteristics of the skeleton curves, a normalizedthree-line skeleton curve is plotted, with P/Pu being the y-coordinate and D/Do
being the x-coordinate. The average value of the five RAC columns’ normalizedskeleton curves is taken to represent the normalized skeleton curve of the recycledconcrete column, as shown in Fig. 11.13. The curve’s slopes in the elastic, elastic–plastic, and softening stages are 2.18, 0.25, and −0.14, respectively, which can beused to formulate the restoring force model.
11.2.2.7 Characteristic Displacement and Ductility
Both the failure rotation (Ru = Du/H) and the displacement ductility coefficient(l = Du/Dy) are calculated to represent the ductility of the specimens in this section,where Du is the displacement corresponding to the failure load, H is the net heightof the column. The yield displacement, the peak displacement, the failure dis-placement, the ductility coefficient, and the failure rotation of each column arereported in Table 11.7.
O(0.00,0.00)
A (0.39,0.85) B (1.00,1.00)
C (2.02,0.85)
0.00
0.20
0.40
0.60
0.80
1.00
1.20
0.00 0.50 1.00 1.50 2.00 2.50
P/Pu
Fig. 11.13 Triple linearskeleton curve
410 11 Seismic Performance of Recycled Aggregate Concrete Columns

As it can be seen from Table 11.7, the ductility coefficients of all the specimensare larger than 5, meeting the requirement of l � 3, which indicates that all thespecimens have excellent ductility with normal designed reinforcements. Theductility of the fully cast-in-situ columns is better than that of the semi-precastcolumns. When other factors are the same, the ductility of the externally precastcolumns is better than that of the internally precast columns.
Also, Table 11.7 shows that the failure rotations of all the six specimens arebetween 1/39 and 1/30, meeting the requirement for the limit value of framestructure elastic–plastic story drift, i.e., Ru > 1/50. This indicates that the specimenswith a normal axial compression ratio have excellent elastic–plastic deformationand anti-collapse abilities under strong earthquakes. Among these six columns, Ru
of the internally precast column is the smallest, followed by that of the fullycast-in-situ column and that of externally precast column, and the Ru of the fullycast-in-situ NAC column is close to that of RAC column. Moreover, Ru decreaseswith the increase in the core column size.
11.2.2.8 Deterioration of Stiffness
After the specimen yields, its stiffness deteriorates gradually as its lateral dis-placement increases in the low cyclic loading test. Figure 11.14 displays the secantstiffness of each column during the first cycle of each loading, which is often usedto explain the stiffness deteriorating behavior. As can be seen from the figure, thesecant stiffness of each specimen declines with the increase in its lateral displace-ment and the way it deteriorates is almost the same. Because of the development ofthe cracks, the stiffness of the specimen deteriorates seriously in the initial stage.The yield of the longitudinal rebars in the tensile region and the development ofcracks in the compression region cause the secant stiffness to drop again andbecome flat in the end, as shown in Fig. 11.14.
It is also discovered that the initial stiffness of Column NCCC-1 is a little higherthan those of other columns. Since the stiffness deterioration rates of ColumnsRCCC-3 and RCCC-5, and Columns RCCC-4 and RCCC-6 are similar, it seems
Table 11.7 Characteristic displacements and ductility of the specimens
Column No. Yield loadpoint Dy (mm)
Peak loadpoint D0 (mm)
Failure loadpoint Du (mm)
Ductilityl ¼ Du=Dy
Failurerotation Ru
Pull Push Pull Push Pull Push Pull Push Pull Push
NCCC-1 6.38 −5.57 22.91 −12.95 34.80 −34.74 5.74 6.23 1/27 1/27
RCCC-2 4.35 −8.63 12.45 −12.84 28.55 −41.35 6.55 4.79 1/22 1/32
RCCC-3 8.23 −5.10 18.56 −16.06 34.60 −34.95 4.21 6.85 1/27 1/27
RCCC-4 5.48 −7.18 15.69 −15.58 32.39 −33.38 5.91 4.65 1/25 1/26
RCCC-5 9.68 −6.58 22.71 −20.97 45.50 −39.81 4.70 6.05 1/36 1/31
RCCC-6 7.89 −6.07 19.81 −15.65 37.88 −34.15 4.80 5.63 1/30 1/27
11.2 Low-Frequency Reversed Loading of Semi-Precast Columns 411

that the construction method does not have apparent influence on the stiffness of thespecimen.
11.2.2.9 Energy Dissipation Capacity
The energy dissipation capacity of specimen is measured based on the area sur-rounded by the hysteresis loop. The larger the surrounded area is, the better thespecimen’s energy dissipation capacity and the seismic behavior are. In this chapter,the equivalent viscous damping ratio is used to evaluate the energy dissipationcapacity of the specimens.
The equivalent viscous damping ratio can be calculated by:
he ¼ 12p
� SABC þ SCDESOBG þ SODF
ð11:1Þ
where SABC, SCDE, SOBG, and SODF are the areas of regions ABC, CDE, OBG, andODF shown in Fig. 11.15, respectively.
The equivalent viscous damping ratios at the characteristic points of the sixspecimens are given in Table 11.8. It is discovered from the figure that when theColumns NCCC-1, RCCC-5, and RCCC-6 are loaded toward the peak load, theequivalent viscous damping ratio gradually increases and the specimens’ energydissipation capacity is strengthened continuously. However, the equivalent viscousdamping ratio of other specimens decreases slightly, indicating that the energydissipation capacity decreases slightly. For all of the specimens, the equivalentviscous damping ratio increases gradually and the energy dissipation capacity isstrengthened continuously between the peak load state and the failure load state.
Fig. 11.14 Comparisonbetween secant stiffness
412 11 Seismic Performance of Recycled Aggregate Concrete Columns

It is also discovered that the equivalent viscous damping ratio decreases as thecontent of recycled concrete increases. Among the six specimens, the equivalentviscous damping ratio of Column NCCC-1 is the largest at the failure load point,followed by the semi-precast columns and that of Column RCCC-1 is the smallest,which is 23.3% lower than Column NCCC-1.
As compared with the values of Columns RCCC-5 and RCCC-6, the equivalentviscous damping ratios of Columns RCCC-3 and RCCC-4 at the failure load pointare 13.7 and 5.9% lower, respectively. This indicates that the construction sequencehas influence on the energy dissipation of the semi-precast column.
The equivalent viscous damping ratio of each specimen in this study is between0.135 and 0.176, which is consistent with the finding that the equivalent viscousdamping ratio of concrete columns subject to bending failure is between 0.1 and0.2. It appears that all the specimens can meet the energy dissipation capacityrequirement for general concrete columns.
Table 11.8 Equivalent viscous damping ratios of each specimen at the critical states
Column No. Equivalent yield load point Peak load point Failure load point
NCCC-1 0.079 0.144 0.176
RCCC-2 0.109 0.102 0.135
RCCC-3 0.112 0.105 0.161
RCCC-4 0.123 0.117 0.152
RCCC-5 0.062 0.106 0.139
RCCC-6 0.078 0.097 0.143
¦ ¤
P
O GCAF E
B
D
Fig. 11.15 Definition of energy consumption
11.2 Low-Frequency Reversed Loading of Semi-Precast Columns 413

11.2.2.10 Analysis of Shear Capacity by Present Codes
According to the Design Code of Concrete Structures in China (GB50010-2010),the equation to calculate the diagonal section shear capacity of column V is given asfollows:
V � 1:75kþ 1
ftbh0 þ fyvAsv
sh0 þ 0:07N ð11:2Þ
where k represents the shear span-to-depth ratio; N is the axial compressive force; ftis axial tensile strength of the column’s concrete, which is calculated by ft = 0.26fcu
2/3, namely 2.34 MPa, in this analysis; b and h0 are the cross-sectional width andeffective height of column, respectively; Asv is the total cross-sectional area ofstirrups in the same cross section; s is the stirrup spacing along the longitudinaldirection of the member; and fyv is the tensile strength of stirrups. Because in thisstudy k > 3, therefore k = 3 is adopted in the calculations.
Table 11.9 presents the calculated and the test experiment shear capacity values.R1 in Table 11.9 is the ratio of the calculated value to the measured value.Table 11.9 also shows that that it is reasonable to confirm that the failure ofspecimens in this study is controlled by bending instead of shear.
11.3 Low-Frequency Reversed Loading on Tube-ConfinedColumns
11.3.1 Experimental Program
11.3.1.1 Test Materials
Ordinary Portland Cement was used in this study. Recycled coarse aggregates(RCA) were produced after crushing and sieving of waste concrete from ademolished building. For the purpose of comparisons, for both RCFS and RCFFcolumns, one conventional concrete specimen was cast with the natural coarseaggregates (NCA) with the aggregates maximum size of 31.5 mm. Table 11.10gives the basic properties of the RCA and NCA. For the RCA, the gradationadopted was similar to that of the NCA in this study. The fine aggregates were riversand and the NCA were gravel.
Table 11.9 Comparison between the measured and calculated values
Column No. NCCC-1 RCCC-2 RCCC-3 RCCC-4 RCCC-5 RCCC-6
Calculated (kN) 222.1 218.2 220.7 221.3 221.9 222.8
Tested (kN) 177.7 163.9 190.8 173.8 183.9 182.5
414 11 Seismic Performance of Recycled Aggregate Concrete Columns

For the RCFS columns, welded steel tubes were used. The average yield strengthof steel was 366 MPa, the tensile strength was 500 MPa, and the elastic moduluswas 190 GPa. The outer diameter of the steel tube was 220 mm, the tube thicknesswas 4 mm, and the tube height was 1400 mm.
The GFRP was made of glass fibers whose substrate was unsaturated polyesterresin. The GFRP tube’s average hoop and axial tensile strength were 350 and68 MPa, respectively. The outer diameter, the tube thickness, and the height were230, 5, and 1400 mm, respectively.
11.3.1.2 Mix Proportions
In order to investigate the effect of RCA replacement percentage, RAC fill-ins withfive different replacement percentages varying from 0 to 100% were designed withthe identical target strength. The detailed mix proportions are listed in Table 11.11.The 28-day cube compressive strength and elastic modulus of RAC are presented inTable 11.12. It can be found that, although there exists little scatter of data, thecompressive strength of concrete with different RCA replacement percentages issimilar and the elastic module decreased with the increase in the RCA replacementpercentage.
11.3.1.3 Specimen and Testing Arrangement
Altogether, 12 cylindrical specimens are designed and listed in Table 11.13. Eachspecimen was named according to the main test parameters. Taking RCSF-30 as anexample, “RCFS” denotes RAC Filled Steel tube, “30” represents 30% RCAreplacement percentage. For the two RCFS-100 columns, the bond–slip effect wasalso studied. For the specimen “RCFS-100-1,” “1” means considering the bond–slip effect. Therefore, when preparing this specimen, the inside of the tube was wirebrushed to remove any rust and loose debris and then coated with grease.RCFF-100-1 was prepared with the same procedure as RCFS-100-1.
The axial load ratio (No to Nu ratio) used in the tests was 0.3, where No was theaxial compressive load applied on the confined RAC columns; Nu was the axialcompressive capacity of the columns. The expression for Nu can be expressed asfollows:
Table 11.10 Physical properties of recycled coarse aggregates and natural coarse aggregates
Size(mm)
BulkDensity(kg/m3)
Apparentdensity(kg/m3)
Claycontent(%)
Waterabsorption(%)
Crushingvalue (%)
RCA 5–31.5 1320 2500 3.5 5.60 10.0
NCA 5–31.5 1410 2620 – 0.51 14.8
11.3 Low-Frequency Reversed Loading on Tube-Confined Columns 415

Tab
le11
.11
Con
cretemix
prop
ortio
n
Specim
enRCFF
-0/
RCFS
-0RCFF
-30/
RCFS
-30
RCFF
-50/
RCFS
-50
RCFF
-70/
RCFS
-70
RCFF
-100
/RCFS
-100
RCFF
-100
-1/
RCFS
-100
-1
RCA
replacem
ent(%
)0
3050
7010
010
0
w/c
ratio
0.48
80.46
30.45
60.44
60.43
00.43
0
Cem
ent(kg/m
3 )37
340
040
641
543
043
0
Sand
(kg/m
3 )73
071
073
072
070
070
0
NCA
(kg/m
3 )11
2078
456
033
60
0
RCA
(kg/m
3 )0
336
560
784
1120
1120
Water
(kg/m
3 )18
218
518
518
518
518
5
416 11 Seismic Performance of Recycled Aggregate Concrete Columns
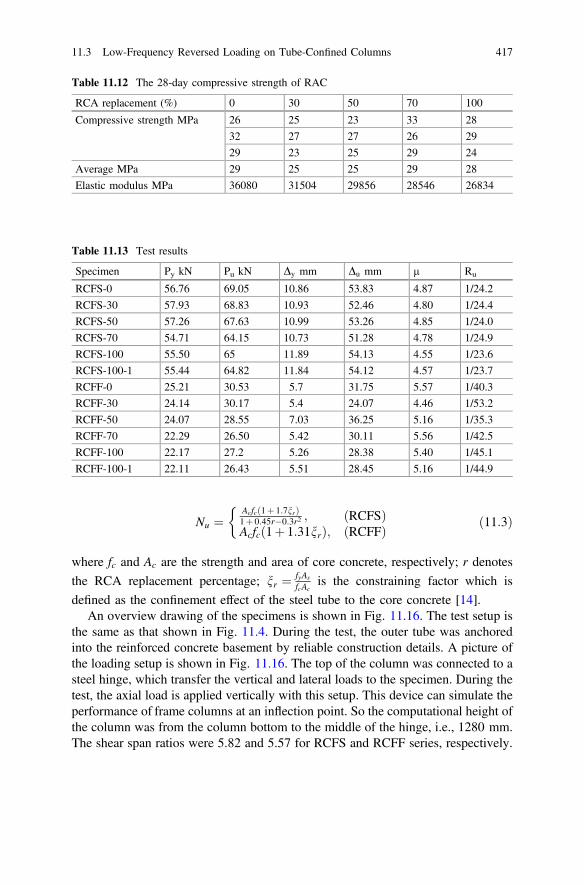
Nu ¼Acfcð1þ 1:7nrÞ1þ 0:45r�0:3r2 ; ðRCFSÞAcfcð1þ 1:31nrÞ; ðRCFFÞ
�ð11:3Þ
where fc and Ac are the strength and area of core concrete, respectively; r denotes
the RCA replacement percentage; nr ¼ fyAs
fcAcis the constraining factor which is
defined as the confinement effect of the steel tube to the core concrete [14].An overview drawing of the specimens is shown in Fig. 11.16. The test setup is
the same as that shown in Fig. 11.4. During the test, the outer tube was anchoredinto the reinforced concrete basement by reliable construction details. A picture ofthe loading setup is shown in Fig. 11.16. The top of the column was connected to asteel hinge, which transfer the vertical and lateral loads to the specimen. During thetest, the axial load is applied vertically with this setup. This device can simulate theperformance of frame columns at an inflection point. So the computational height ofthe column was from the column bottom to the middle of the hinge, i.e., 1280 mm.The shear span ratios were 5.82 and 5.57 for RCFS and RCFF series, respectively.
Table 11.12 The 28-day compressive strength of RAC
RCA replacement (%) 0 30 50 70 100
Compressive strength MPa 26 25 23 33 28
32 27 27 26 29
29 23 25 29 24
Average MPa 29 25 25 29 28
Elastic modulus MPa 36080 31504 29856 28546 26834
Table 11.13 Test results
Specimen Py kN Pu kN Dy mm Du mm l Ru
RCFS-0 56.76 69.05 10.86 53.83 4.87 1/24.2
RCFS-30 57.93 68.83 10.93 52.46 4.80 1/24.4
RCFS-50 57.26 67.63 10.99 53.26 4.85 1/24.0
RCFS-70 54.71 64.15 10.73 51.28 4.78 1/24.9
RCFS-100 55.50 65 11.89 54.13 4.55 1/23.6
RCFS-100-1 55.44 64.82 11.84 54.12 4.57 1/23.7
RCFF-0 25.21 30.53 5.7 31.75 5.57 1/40.3
RCFF-30 24.14 30.17 5.4 24.07 4.46 1/53.2
RCFF-50 24.07 28.55 7.03 36.25 5.16 1/35.3
RCFF-70 22.29 26.50 5.42 30.11 5.56 1/42.5
RCFF-100 22.17 27.2 5.26 28.38 5.40 1/45.1
RCFF-100-1 22.11 26.43 5.51 28.45 5.16 1/44.9
11.3 Low-Frequency Reversed Loading on Tube-Confined Columns 417

11.3.1.4 Loading Program
All specimens were tested at Tongji University’s Structural EngineeringLaboratory, Shanghai, China, under low-frequency cyclic loading consisting ofelastic and inelastic stages. The loading program followed the procedure shown inFig. 11.6.
11.3.2 Test Analysis
11.3.2.1 Crack Configuration and Hysteresis Loops
For the RCFS series, generally, similar phenomena were observed during the tests.Take RCFS-30 as an example, at the beginning of the loading, the specimen was inthe elastic stage and the outer tube deformed rather slightly. During the test, somerust exfoliated from the tube surface and the deformation of the steel tube increasedwhen the load increased to the yield load Py. After yielding, the load was controlledby the displacement. During the displacement control period, an outward indent orbulge formed at a distance of about 50 mm from the bottom of column at thecompressive side of the steel tube. The bulge propagated with the increase in lateraldisplacements and cycles. The range of bulge was obvious and gradually extendedto the hoop direction when the displacement reached 3Dy. After that, the bulgeformed a complete ring at the bottom of the column. When the specimen was closeto failure, a crack formed at the compressive side of the bulge. At the end of thetests, the steel tube fractured at the location of cracking. The failure modes of eachindividual RCFS column are displayed in Fig. 11.17. It can be observed that the
(a) RCFS columns (b) RCFF columns
Fig. 11.16 Test setup
418 11 Seismic Performance of Recycled Aggregate Concrete Columns

(a) RCFS-0
(b) RCFS-30
(c) RCFS-50
Fig. 11.17 Hysteresis curves of RCFS columns
11.3 Low-Frequency Reversed Loading on Tube-Confined Columns 419

(d) RCFS-70
(e) RCFS-100
(f) RCFS-100-1
Fig. 11.17 (continued)
420 11 Seismic Performance of Recycled Aggregate Concrete Columns
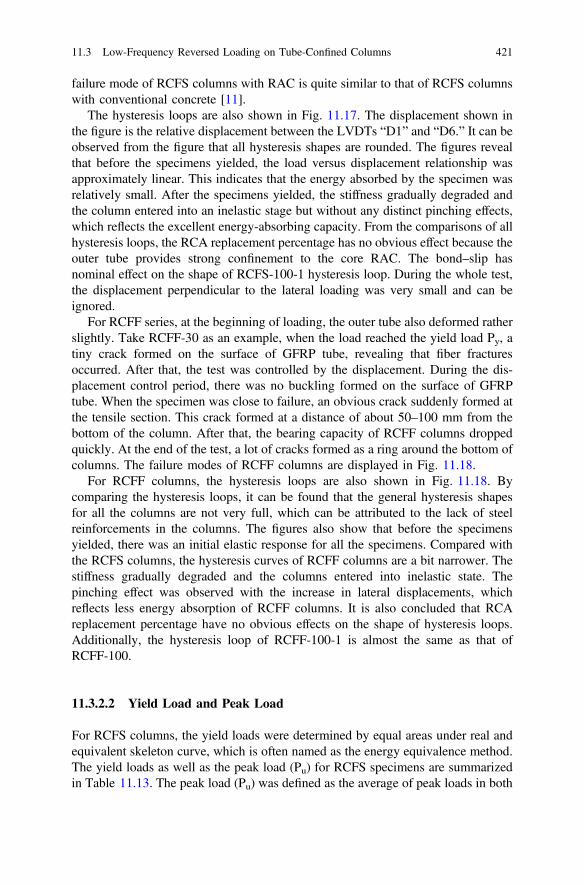
failure mode of RCFS columns with RAC is quite similar to that of RCFS columnswith conventional concrete [11].
The hysteresis loops are also shown in Fig. 11.17. The displacement shown inthe figure is the relative displacement between the LVDTs “D1” and “D6.” It can beobserved from the figure that all hysteresis shapes are rounded. The figures revealthat before the specimens yielded, the load versus displacement relationship wasapproximately linear. This indicates that the energy absorbed by the specimen wasrelatively small. After the specimens yielded, the stiffness gradually degraded andthe column entered into an inelastic stage but without any distinct pinching effects,which reflects the excellent energy-absorbing capacity. From the comparisons of allhysteresis loops, the RCA replacement percentage has no obvious effect because theouter tube provides strong confinement to the core RAC. The bond–slip hasnominal effect on the shape of RCFS-100-1 hysteresis loop. During the whole test,the displacement perpendicular to the lateral loading was very small and can beignored.
For RCFF series, at the beginning of loading, the outer tube also deformed ratherslightly. Take RCFF-30 as an example, when the load reached the yield load Py, atiny crack formed on the surface of GFRP tube, revealing that fiber fracturesoccurred. After that, the test was controlled by the displacement. During the dis-placement control period, there was no buckling formed on the surface of GFRPtube. When the specimen was close to failure, an obvious crack suddenly formed atthe tensile section. This crack formed at a distance of about 50–100 mm from thebottom of the column. After that, the bearing capacity of RCFF columns droppedquickly. At the end of the test, a lot of cracks formed as a ring around the bottom ofcolumns. The failure modes of RCFF columns are displayed in Fig. 11.18.
For RCFF columns, the hysteresis loops are also shown in Fig. 11.18. Bycomparing the hysteresis loops, it can be found that the general hysteresis shapesfor all the columns are not very full, which can be attributed to the lack of steelreinforcements in the columns. The figures also show that before the specimensyielded, there was an initial elastic response for all the specimens. Compared withthe RCFS columns, the hysteresis curves of RCFF columns are a bit narrower. Thestiffness gradually degraded and the columns entered into inelastic state. Thepinching effect was observed with the increase in lateral displacements, whichreflects less energy absorption of RCFF columns. It is also concluded that RCAreplacement percentage have no obvious effects on the shape of hysteresis loops.Additionally, the hysteresis loop of RCFF-100-1 is almost the same as that ofRCFF-100.
11.3.2.2 Yield Load and Peak Load
For RCFS columns, the yield loads were determined by equal areas under real andequivalent skeleton curve, which is often named as the energy equivalence method.The yield loads as well as the peak load (Pu) for RCFS specimens are summarizedin Table 11.13. The peak load (Pu) was defined as the average of peak loads in both
11.3 Low-Frequency Reversed Loading on Tube-Confined Columns 421
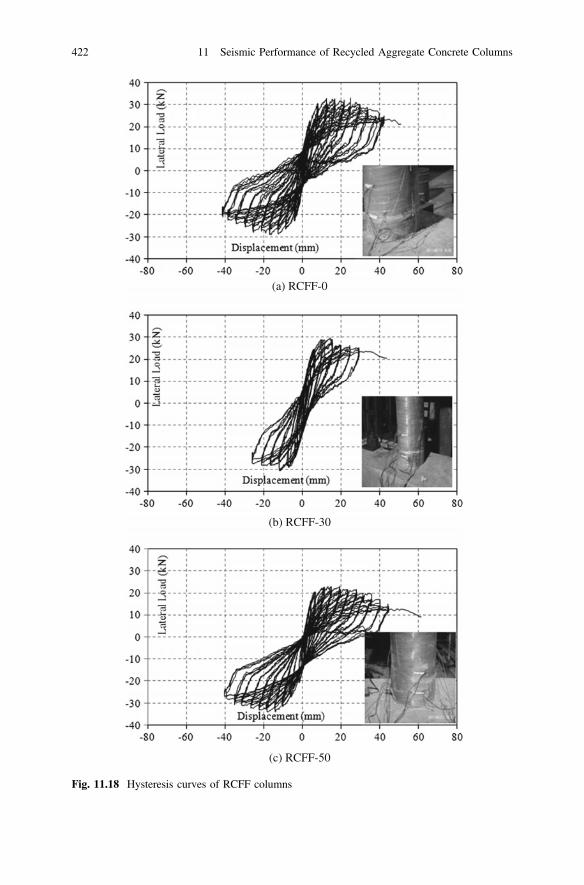
(a) RCFF-0
(b) RCFF-30
(c) RCFF-50
Fig. 11.18 Hysteresis curves of RCFF columns
422 11 Seismic Performance of Recycled Aggregate Concrete Columns
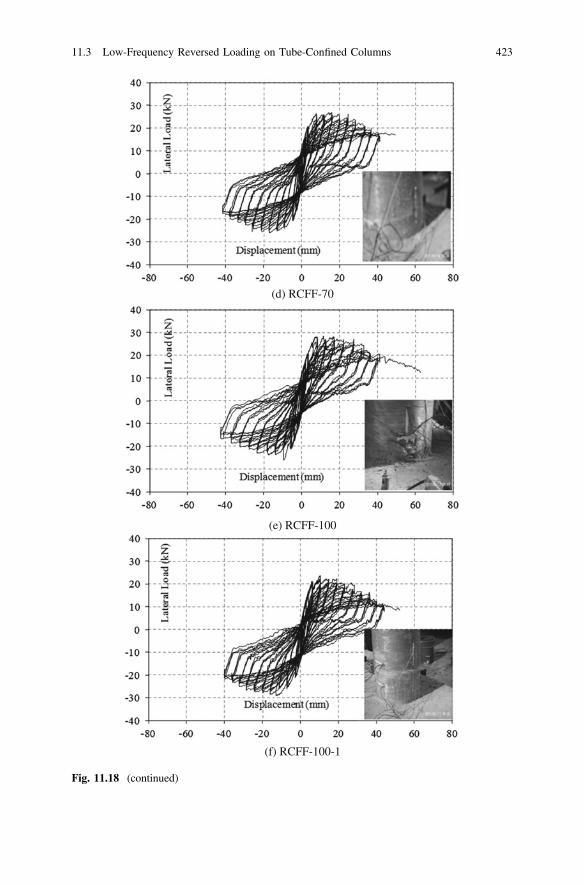
(d) RCFF-70
(e) RCFF-100
(f) RCFF-100-1
Fig. 11.18 (continued)
11.3 Low-Frequency Reversed Loading on Tube-Confined Columns 423

push and pull directions. It can be discovered that both the yield load and peak loadslightly decrease with an increase in the RCA replacement percentage with a similarcompressive strength of RAC. The cube compressive strength of NAC was −1.0and 7.4% higher than that of RAC containing 70 and 100% RCA, respectively.However, the peak load of RCFS-0 was 6.0, 6.2 and 6.5% higher than that ofRCFS-70, RCFS-100, and RCFS-100-1, respectively. The same phenomenon wasobserved in the RCFS-30 and RCFS-50 columns. It means that the Pu of RCFScolumns with the conventional concrete is a bit higher than that of RCFS columnswith RAC, and the RCA replacement percentage has some effects on the bearingcapacity of columns. Additionally, the bond–slip has negligible effects on theloading capacity of RCFS columns. The Pu of RCFS-100 was just 0.3% higher thanthat of RCFS-100-1.
For the RCFF series, the yield load that was also determined by the energyequivalence method and the peak load (Pu) is listed in Table 11.13 as well. It can beobserved that the peak load of RCFF-0 was 15.2, 12.2, and 15.5% higher than thatof RCFF-70, RCFF-100, and RCFF-100-1, respectively. Similarly, the bond–sliphas little effects on the loading capacity of RCFF columns. The Pu of RCFF-100was 2.9% higher than that of RCFF-100-1.
According to the above test results, it can be found that the bearing capacity ofthe confined columns decreases with the increase in RCA contents, and the bond–slip effect has negligible effect. There are two reasons for the phenomenon. Firstly,the strength of core concrete decreases with the RCA replacement percentage;secondly, the weaker ITZs between the original coarse aggregates and old cementpaste accelerate cracking and crushing development of core concrete.
11.3.2.3 Skeleton Curve
The typical lateral load-top displacement skeleton curves for RCFS and RCFFcolumns are plotted in Fig. 11.19a b, respectively. Based on these figures, it can berevealed that the skeleton curves of the columns can be divided into three parts:(1) the elastic part, before the specimen reaches the yield load Py (see Table 11.13),the P-△ curve is almost a straight line; (2) the elastic–plastic state, the P-△ curve ofspecimens is nonlinear between the Py and Pu (see Table 11.13) point; and (3) thedeclining part, after the peak load, the P-△ curve decreases with the increase inlateral displacement.
It can be found from the skeleton curves in Fig. 11.19 that the RCA replacementpercentage has relatively higher influence on the RCFF columns than on the RCFScolumn. Compared to RCFF columns, the skeleton curves of RCFS columns aremuch symmetrical in both push and pull directions. Furthermore, both the loadcapacity and deformation ability of RCFS are larger than those of RCFF, eventhough the diameter of the RCFF is bigger than that of RCFS. This may be due tothe better mechanical behavior of steel tube than GFRP tube.
424 11 Seismic Performance of Recycled Aggregate Concrete Columns

11.3.2.4 Stiffness Deterioration
Under low-frequency cyclic lateral loading condition, the stiffness decreases as thedrift increases after the yielding of specimens. The secant stiffness of the first cyclein each load step was used to analyze the stiffness degradation in this investigation.
Figure 11.20a, b shows the effects of concrete types and bond–slip on the secantstiffness that is obtained from hysteresis curves at different loading cycles. It can befound that with similar core concrete strength, the stiffness deterioration of speci-men with conventional concrete is similar to that of specimens with differentcontents of RCA. The bond–slip effect has negligible influence on the stiffnessdegradation of the specimens. By comparing Fig. 11.20a, b, it is also found that the
-80
-60
-40
-20
0
20
40
60
80
Late
ral l
oad
(kN
)
Displacement (mm)
(a) RCFS columns
(b) RCFF columns
RCFS-0RCFS-30RCFS-50RCFS-70RCFS-100RCFS-100-1
-40
-30
-20
-10
0
10
20
30
40
-100 -80 -60 -40 -20 0 20 40 60 80 100
-60 -40 -20 0 20 40 60
Late
ral L
oad
(kN
)
Displacement (mm)
RCFF-0
RCFF-30
RCFF-50
RCFF-70
RCFF-100
RCFF-100-1
Fig. 11.19 Skeleton curves
11.3 Low-Frequency Reversed Loading on Tube-Confined Columns 425

initial stiffness and stiffness deterioration of RCFS columns are better than those ofRCFF columns.
11.3.2.5 Ductility
The ductility coefficient l = Du/Dy and the plastic rotation ratio Ru = Du/H areoften used to reflect the ductility of columns, where Dy is the yield displacement, Du
is the ultimate displacement corresponding to the lateral load level of 85% of thepeak load, and H is the height of the column.
0
4000
8000
12000
16000
20000
24000
28000
Stiff
ness
(N/m
m)
Displacement (mm)
RCFS-0
RCFS-30
RCFS-50
RCFS-70
RCFS-100
RCFS-100-1
0
4000
8000
12000
16000
20000
24000
28000
-80 -60 -40 -20 0 20 40 60 80
-60 -40 -20 0 20 40 60
Stiff
ness
(N/m
m)
Displacement (mm)
RCFF-0
RCFF-30
RCFF-50
RCFF-70
RCFF-100
RCFF-100-1
(a) RCFS columns
(b) RCFF columns
Fig. 11.20 Stiffness degeneration curves
426 11 Seismic Performance of Recycled Aggregate Concrete Columns

The ductility coefficient l and plastic rotation ratio Ru of the RCFS specimensare listed in Table 11.13. It can be found that the l value ranges from 4.55 to 4.85and the Ru value ranges from 1/23.6 to 1/24.9, which show fine deformation abilityof RCFS columns. The ductility coefficient of RCFS decreases slightly with anincrease in RCA replacement percentage. However, bond–slip effect on the spec-imen ductility is not obvious.
The ductility coefficient l and the plastic rotation ratio Ru of the RCFF columnsare also given in Table 11.13. It shows that the l of the specimen ranges from 4.46to 5.56 and the Ru of specimen ranges from 1/53.2 to 1/42.5, which also indicatesgood deformation ability of RCFF columns. The ductility coefficient of RCFFdecreases with an increase in RCA replacement percentage. Compared with theRCFS, the RCFF specimens have relatively low capacity of plastic rotation.
11.3.2.6 Energy Dissipation
The energy dissipation is determined by the area enclosed by the overall hysteresisof the first loading cycle. The more rounded the hysteresis loop is, the higher theenergy-absorbing ability and the better the seismic behavior. Figure 11.21a showsthe energy dissipation of RCFS columns. It can be observed that, generally, theenergy dissipation increases with the increasing lateral displacement. The energydissipation capacity of specimen with NAC is somehow higher than those withRAC. The bond–slip has no obvious effect on the energy dissipation capacity ofRCFS columns.
The loops of the energy dissipation for RCFF columns are shown in Fig. 11.21b.The energy dissipation response of RCFF with different RCA contents is similar tothat of RCFS specimens. Additionally, the energy dissipation of RCFS columns ismuch higher than that of RCFF columns under the same conditions. This can beattributed to the characteristics of tubes, since steel is an elastic–plastic material,whereas the GFRP is a brittle one.
11.3.2.7 Strain Variation
During the whole test, the strains in the outer tubes were measured by embeddedstrain gauges. The bottom hoop and axial strain variation of RCFS and columns areshown in Figs. 11.22 and 11.23, respectively. The strain response of RCFF issimilar to that of RCFS, and the values of axial strain and hoop strain increase withthe increase in lateral displacement.
11.3 Low-Frequency Reversed Loading on Tube-Confined Columns 427
11.4 Concluding Remarks
The mechanical characteristics, failure pattern, and failure mechanism of recycledaggregate concrete (RAC) semi-precast columns under the low cyclic loading aresimilar to those of natural aggregate concrete (NAC) columns. The energy dissi-pation capacity of RAC columns is smaller than that of the NAC column. Theductility coefficient l of each specimen’s is higher than 5, and the failure rotation isbetween 1/39 and 1/30. The ductility coefficient of fully cast-in-situ column ishigher than that of semi-precast column. With other parameters being the same, theductility coefficient of the externally precast specimen is better than that of theinternally precast specimen, which means that the construction sequence has aninfluence on the ductility of columns.
0
2000
4000
6000
8000
10000
Ener
gy d
issi
patio
n (k
N.m
m)
Displacement (mm)(a) RCFS columns
(b) RCFF columns
RCFS-0
RCFS-30
RCFS-50
RCFS-70
RCFS-100
RCFS-100-1
0
200
400
600
800
1000
1200
1400
0 20 40 60 80
0 10 20 30 40 50
Ener
gy d
issi
patio
n (k
N.m
m)
Displacement (mm)
RCFF-0
RCFF-30
RCFF-50
RCFF-70
RCFF-100
RCFF-100-1
Fig. 11.21 Energy dissipation curves
428 11 Seismic Performance of Recycled Aggregate Concrete Columns
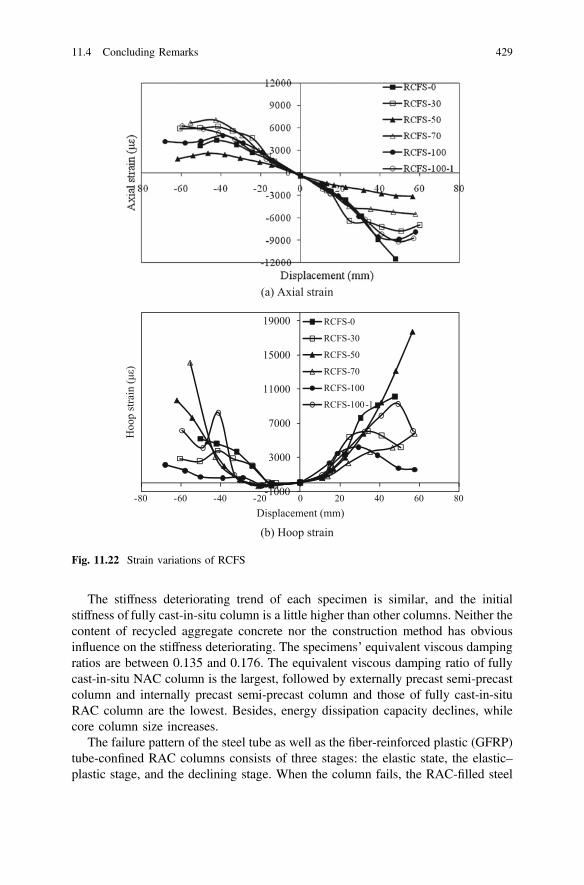
The stiffness deteriorating trend of each specimen is similar, and the initialstiffness of fully cast-in-situ column is a little higher than other columns. Neither thecontent of recycled aggregate concrete nor the construction method has obviousinfluence on the stiffness deteriorating. The specimens’ equivalent viscous dampingratios are between 0.135 and 0.176. The equivalent viscous damping ratio of fullycast-in-situ NAC column is the largest, followed by externally precast semi-precastcolumn and internally precast semi-precast column and those of fully cast-in-situRAC column are the lowest. Besides, energy dissipation capacity declines, whilecore column size increases.
The failure pattern of the steel tube as well as the fiber-reinforced plastic (GFRP)tube-confined RAC columns consists of three stages: the elastic state, the elastic–plastic stage, and the declining stage. When the column fails, the RAC-filled steel
-1000
3000
7000
11000
15000
19000
-80 -60 -40 -20 0 20 40 60 80
Hoo
p st
rain
(με)
Displacement (mm)
RCFS-0
RCFS-30
RCFS-50
RCFS-70
RCFS-100
RCFS-100-1
(a) Axial strain
(b) Hoop strain
Fig. 11.22 Strain variations of RCFS
11.4 Concluding Remarks 429

tube (RCFS) column has an obvious plastic deformation with the steel tubeundergoing local buckling. However, the RAC-filled GFRP tube (RCFF) specimenbehaves in a brittle manner and crack only forms on the GFRP tube. The coreconcrete in RCFF columns cracks in hoop direction without crushing.
With the similar strength of concrete, the seismic behavior of steel tube as wellas GFRP tube-confined RAC columns decreases as the recycled coarse aggregatecontent increases. Under the same conditions, the seismic behavior of steeltube-confined RAC is much better than that of the GFRP tube confine RAC col-umn. The bond–slip has only nominal effects on the seismic behavior of thetube-confined RAC column.
-8000
-6000
-4000
-2000
0
2000
4000
6000
8000
-60 -40 -20 0 20 40 60
Axi
al st
rain
(με)
Displacement (mm)(a) Axial strain
RCFF -0
RCFF -30
RCFF -50
RCFF -70
RCFF -100
RCFF -100 -1
-1000
0
1000
2000
3000
4000
5000
-60 -40 -20 0 20 40 60
Hoo
p st
rain
(με)
Displacement (mm)(b) Hoop strain
RCFF -0
RCFF -30
RCFF -50
RCFF -70
RCFF -100
RCFF -100 -1
Fig. 11.23 Strain variations of RCFF
430 11 Seismic Performance of Recycled Aggregate Concrete Columns

References
1. O’mahony MM. An analysis of the shear strength of recycled aggregates. Mater Struct.1997;30(10):599–606.
2. Fathifazl G, Razaqpur AG, Isgor OB, Abbas A, Fournier B, Foo S. Shear capacity evaluationof steel reinforced recycled concrete (RRC) beams. Eng Struct. 2011;33(3):1025–33.
3. Corinaldesi V, Moriconi G. Recycled aggregate concrete under cyclic loading. In:Proceedings of the international symposium on role of concrete in sustainable development;2003 Sep; Scotland: University of Dundee, Scotland 2003. (pp. 3–4).
4. Xiao J, Sun Y, Falkner H. Seismic performance of frame structures with recycled aggregateconcrete. Eng Struct. 2006;28(1):1–8.
5. Xiao J, Wang C, Li J, Tawana MM. Shake-table model tests on recycled aggregate concreteframe structure. ACI Struct J. 2012;109(6):777.
6. Zhang J, Cao W, Dong H, Zhu H. Experimental research of the recycled aggregate content’sinfluence on the seismic behavior of middle or high shear wall. China Civ Eng J. 2006;43:55–61.
7. Lian X, Ye XG, Zhang LJ, Wang DC, Jiang Q, Chang L. Finite element analysis of thesuperimposed slab shear walls. J Hefei Univ Technol (Natural Science). 2009;7:029.
8. Nishiura N, Kasamatsu T, Miyashita T, Tanaka R. Experimental study of recycled aggregateconcrete half-precast beams with lap joints. Trans Jpn Concrete Institute. 2001;23:295–302.
9. Sai S, Kanno K, Ohaga Y, Tanaka R. Research on the compression examination of halfprecast columns using recycled aggregate concrete. In: Summaries of technical papers ofannual meeting architectural institute of Japan, vol. 9, 2003, p. 271.
10. Konno K, Sato Y, Kakuta Y, Ohira M. The property of recycled concrete column encased bysteel tube subjected to axial compression. Trans Jpn Concrete Institute. 1998;1(19):231–8.
11. Yang YF, Han LH. Experimental behaviour of recycled aggregate concrete filled steel tubularcolumns. J Constr Steel Res. 2006;62(12):1310–24.
12. Xiao J, Huang Y, Yang J, Zhang C. Mechanical properties of confined recycled aggregateconcrete under axial compression. Constr Build Mater. 2012;26(1):591–603.
13. Yang YF, Han LH, Zhu LT. Experimental performance of recycled aggregate concrete-filledcircular steel tubular columns subjected to cyclic flexural loadings. Advances Structural Eng.2009;12(2):183–94.
14. Huang Y, Xiao J, Zhang C. Theoretical study on mechanical behavior of steel confinedrecycled aggregate concrete. J Constr Steel Res. 2012;30(76):100–11.
References 431

Chapter 12Seismic Performance of RecycledAggregate Concrete Structures
Abstract In this chapter, the seismic properties of recycled aggregate concrete(RAC) frame joints, plane frame, cast-in-situ space frame, and precast space framewere discussed. The detailed conclusion can be found in the following sections.Generally speaking, the failure modes of RAC structures are similar to those of naturalaggregate concrete (NAC) structures, but the seismic properties are slightly lower.
12.1 Introduction
Since the study on fundamental behaviors of RAC is well documented in thecurrent literature, its mechanical properties are accordingly explored. Along withmechanical properties of RAC, many studies on the structural performance of RAChave also been conducted such as beams [1–3], columns [1, 3], and slabs [4]. Thepositive results of these studies further support and strengthen the possibilities ofapplying RAC in civil engineering structures. However, the current literature onRAC reveals that most of the studies focus on static performance of RAC structuresand the topics of earthquake response seem to be ignored. Thus, in this chapter, theseismic behavior of frame joints, plane frame, cast-in-situ space frame, and precastspace frame was investigated by low-frequency reversed loading and shaking tabletest.
12.2 Low-Frequency Reversed Loading on Frame Joints
12.2.1 Experimental Program
Three 1/2-scale exterior joints with different recycled coarse aggregate (RCA)replacement percentage equal to 0, 50 and 100%, respectively, from a multi-storyframe structure were tested considering the equipment capacity, according to thedesign principle “Strong beam, strong column and weak joint.” It was expected that
© Springer-Verlag GmbH Germany 2018J. Xiao, Recycled Aggregate Concrete Structures,Springer Tracts in Civil Engineering, https://doi.org/10.1007/978-3-662-53987-3_12
433

the plastic hinge appears in the joint core area, with shear failure as the specimenfailure mode. The details of the joint and reinforcement are presented in Fig. 12.1.
The recycled concrete mixture of nominal strength grade C40 was applied inbeam–column exterior joints. The RAC mechanical properties of three specimensare listed in Table 12.1, where C represents cement, S represents sand, A representsaggregate and W represents water, respectively. In addition, Table 12.2 presents themechanical properties of steel reinforcement.
Figure 12.2 illustrates the test setup for simulating the loading state of the beam–
column frame joint. The test setup consisted of a constant axial loading N on the topof the column to simulate axial load (N) with axial compression ratio 0.25. Cyclicloading P was applied at the end of beams to simulate lateral seismic load.
The cyclic lateral loads were imposed vertically at the ends of beams using loadcontrol before the specimen yielded and then using displacement control after thespecimen yielded. Loading was repeated twice at each load control point before thespecimen yielded and repeated three times at each displacement-control point toobtain the degraded curve of restoring load after the specimen yielded. Test ended
Fig. 12.1 Specimen dimensions and reinforcement diagram (Unit: mm)
Table 12.1 Mix proportion of concrete
Specimen RCAreplacementpercentage(%)
Mix proportion(C/S/A/W)
Cubecompressivestrength fcu(MPa)
Axial compressivestrengthfc (MPa) (0.76 fcu)
J-1 0 430:555:1295:185 42.0 31.9
J-2 50 474:511:1192:185 42.5 32.3
J-3 100 500:476:1110:185 40.0 30.4
434 12 Seismic Performance of Recycled Aggregate Concrete Structures

at the time when the specimen’s capacity reached 85% of the maximum loading.The loading history used at the beam end is shown in Fig. 12.3.
The main contents of what is to be measured in this test experiment are: (1) thecyclic loading on the end of beams and axial loading on the column measured bythe loading system automatically; (2) vertical displacement D at the end of beams,horizontal displacement d at the top of columns, relative beam–column angle h, andshear deformation angle c at the core area of the joint measured by the displacementmeter; (3) strain of the longitudinal reinforcement, stirrups of beams, columns, andcore area of joints. In addition, the appearance and development of cracks is alsomeasured and observed.
Table 12.2 Mechanical properties of steel
Diameter Yield strength fy (MPa) Limit strength fu (MPa) Elastic modules Es (MPa)
25 369 551 2.1 � 105
8 349 516 2.1 � 105
6 560 696 2.3 � 105
Fig. 12.2 Test loadingsystem
Load level n
Load control Displacement control
Fig. 12.3 Loading pattern
12.2 Low-Frequency Reversed Loading on Frame Joints 435

12.2.2 Test Result
It is observed that the RAC joints and ordinary concrete joints have similar failurepatterns. They all went through the following stages: initial cracking, full cracking,yielding, limit, and failure.
The RAC joints and ordinary concrete joints have similar failure patterns:
1. When the load was applied on the beam’s free end for ±(2−3) t, the beam end(at joint) started to show initial cracking.
2. After applying loading for ±(6−7) t, the joint core area starts to show the firstvisible inclined cracks, with the crack width less than 0.04 mm.
3. The beam longitudinal reinforcement yielded when the specimens yield, and thejoint core area full cracked at the same time with the crack width more than0.3 mm. The displacement reached 15–17 mm when the loading was applied±(15–17) t at the end of beams. It is much more obviously that the diagonalcracks appeared on the core area of the 0 and 100% RCA replacement per-centage frame joints, while some more scattered cracks appeared in the jointcore area and some obvious shear cracks appeared at the central beam of the50% RCA replacement percentage specimen. The shape and distribution ofcracks when the joint yielded are shown in Fig. 12.4.
4. When the specimen reached the full cracking stage, many micro-unstable cracksdeveloped on the joint core area and the concrete started to get crushed. Thespecimen then reaches its maximum bearing capacity. The main crack in thecore areas ranges between (0.6–1.0) mm, while the longitudinal reinforcementshowed bond-slip during this process.
5. When the bearing capacity decreases by 15%, the concrete in joint core area iscrushed into small pieces; stirrup draws to outer drum; longitudinal reinforce-ment of the column was exposed by compression bending; and finally, thespecimen fails. Table 12.3 presents the test results.
(a) J-1 (b) J-2 (c) J-3
Fig. 12.4 The state of the crack and crack distribution at yielding
436 12 Seismic Performance of Recycled Aggregate Concrete Structures

12.2.3 Test Analysis
Hysteresis curve is the result obtained from the joint test. It is the force–deformationcurves achieved when the specimen is under cyclic loading, while the outer overalllayer of hysteresis curve is called capacity curves. As a result of transfixion slip ofthe longitudinal reinforcement in beams which interrupts the normal transmission ofshear force, the shear resistance at the joint core area decreases and the stiffness andenergy consumption of the joint also reduces.
Therefore, normally the hysteresis curve of beam–column joints is a process ofchange from the initial stage of rapid transition shuttle-shaped curve foranti-S-shaped curve, and the joint core area’s ductility and energy consumption areall poor. In addition, the seismic performance of joints can also be observed fromthe “pinch contraction” of hysteresis curve at the same time.
Figure 12.5 presents the load–displacement hysteresis curves at the end ofbeams.
Since all the shear failure occurred at the joint core area during this test, withwider inclined cracks, the hysteresis curves show an obvious “pinch contraction.”However, the pinch degree of the three specimens is almost the same.
It can be observed from Fig. 12.5d that the capacity curves coincide to eachother before the specimens yielded. Elastic stage, yielding stage, strengtheningstage, and dropping stage can also been observed from the curves.
With the area covered by P–D hysteresis curve, the energy dissipation Q can bederived. It is known that the greater value of Q, the better energy dissipationcapacity. The relationship between energy consumption Q and displacement D ofthe three specimens is shown in Fig. 12.6. Specimen J-3 had the fastest increase inenergy consumption after yielding stage, but energy consumption capacitydecreased obviously at the later test, due to the failure of joint core area. The energyconsumption capacity had decreased to 85% of the peak energy consumption value.In a general, the energy consumption of J-3 and J-1 was roughly equivalent. Thepeak energy consumption value of J-1 was a little higher than that of J-3. J-2 hadthe worst energy consumption, with all the energy consumption Q lower than thatof J-1 and J-3 of each loading cycle, at the stage after yielding.
Table 12.3 Test results (Unit: kN)
Specimen Loading direction Initialcrackingload
Fullcrackingload
Maximumload
Failureload
Failurepattern
J-1 Downward 60 110 140 92 Shear failurein core areaUpward 60 110 140 92
J-2 Downward 75 105 122 96 Shear failurein core areaUpward 75 105 130 99
J-3 Downward 55 103 119 82 Shear failurein core areaUpward 70 103 139 79
12.2 Low-Frequency Reversed Loading on Frame Joints 437

-150
-100
-50
0
50
100
150
-100 -50 0 50 100
mm
-150
-100
-50
0
50
100
150
-80 -60 -40 -20 0 20 40 60 80mm
(a) Hysteresis curve of J-1 (b) Hysteresis curve of J-2
-150
-100
-50
0
50
100
150
-80 -40 0 40 80mm
-200
-150
-100
-50
0
50
100
150
-100 -50 0 50 100
(c) Hysteresis curve of J-3 (d) Capacity curve of the three specimens
Fig. 12.5 Hysteresis curves and capacity curves
0
1000
2000
3000
4000
5000
6000
7000
8000
0 20 40 60 80
mm
Fig. 12.6 The whole energyconsumption process diagramof the specimens
438 12 Seismic Performance of Recycled Aggregate Concrete Structures

Ductility is an important index to illustrate non-elastic deformation of the joint,and the effective displacement ductility coefficient is used in this book, which is theratio of the ultimate displacement (Du) to the yielding displacement (Dy), namelyl = Du/Dy, where Dy is yielding displacement and Du is the ultimate displacementwhen the lateral load falls to 85% of the maximum lateral strength. Table 12.4shows the ductility coefficient calculation of the three specimens.
It can be seen from the table that the lD of each concrete frame joint specimen isgreater than 4.0 to meet the seismic design requirements. The ductility coefficient ofJ-1 is much greater than J-2 and J-3, which shows that the presence of recycledconcrete reduces the ductility of specimen.
Relationship between shear stress (s) and shear deformation (c) curve in the jointcore area is also got by this test, which is shown in Fig. 12.7.
Since the amount of reinforcement in the joint core area’s reinforcement is verylittle (Only one bar of 6 mm diameter), stirrup constraints on the joint core area arevery weak and can be ignored. The shear deformation in joint core area can beconsidered as plain concrete shear deformation. It can be observed from Fig. 12.7that the stiffness of recycled concrete joint core area (50 and 100% replacementpercentage) was quite large before full cracking stage, but decreased after fullcracking, with the shear deformation of joint core area (expressed by the defor-mation angle) increasing multiply. Analysis shows that by the time greatest load
Table 12.4 Joint’s ductility coefficient
JointNo.
Yield displacement Dy
(mm)Ultimate displacement Du
(mm)Ductility coefficientlD
J-1 14.793 71.783 4.85
J-2 15.669 67.053 4.28
J-3 16.733 72.662 4.34
-2
-1.5
-1
-0.5
0
0.5
1
1.5
2
-500 -400 -300 -200 -100 0 100 200
10E-3rad
MPa
-2
-1.5
-1
-0.5
0
0.5
1
1.5
-200 -100 0 100 200 300 4010E-3rad
(a) J-2 (b) J-3
Fig. 12.7 The shear stress (s)–shear deformation (c) curves of RAC joint core area
12.2 Low-Frequency Reversed Loading on Frame Joints 439
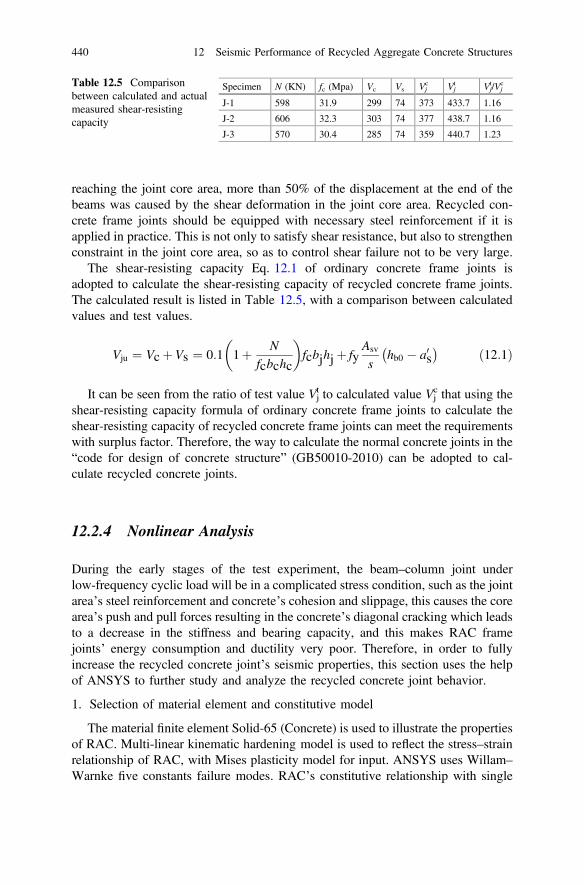
reaching the joint core area, more than 50% of the displacement at the end of thebeams was caused by the shear deformation in the joint core area. Recycled con-crete frame joints should be equipped with necessary steel reinforcement if it isapplied in practice. This is not only to satisfy shear resistance, but also to strengthenconstraint in the joint core area, so as to control shear failure not to be very large.
The shear-resisting capacity Eq. 12.1 of ordinary concrete frame joints isadopted to calculate the shear-resisting capacity of recycled concrete frame joints.The calculated result is listed in Table 12.5, with a comparison between calculatedvalues and test values.
Vju ¼ VcþVs ¼ 0:1 1þ Nfcbchc
� �fcbjhjþ fy
Asv
shb0 � a0s� � ð12:1Þ
It can be seen from the ratio of test value Vjt to calculated value Vj
c that using theshear-resisting capacity formula of ordinary concrete frame joints to calculate theshear-resisting capacity of recycled concrete frame joints can meet the requirementswith surplus factor. Therefore, the way to calculate the normal concrete joints in the“code for design of concrete structure” (GB50010-2010) can be adopted to cal-culate recycled concrete joints.
12.2.4 Nonlinear Analysis
During the early stages of the test experiment, the beam–column joint underlow-frequency cyclic load will be in a complicated stress condition, such as the jointarea’s steel reinforcement and concrete’s cohesion and slippage, this causes the corearea’s push and pull forces resulting in the concrete’s diagonal cracking which leadsto a decrease in the stiffness and bearing capacity, and this makes RAC framejoints’ energy consumption and ductility very poor. Therefore, in order to fullyincrease the recycled concrete joint’s seismic properties, this section uses the helpof ANSYS to further study and analyze the recycled concrete joint behavior.
1. Selection of material element and constitutive model
The material finite element Solid-65 (Concrete) is used to illustrate the propertiesof RAC. Multi-linear kinematic hardening model is used to reflect the stress–strainrelationship of RAC, with Mises plasticity model for input. ANSYS uses Willam–
Warnke five constants failure modes. RAC’s constitutive relationship with single
Table 12.5 Comparisonbetween calculated and actualmeasured shear-resistingcapacity
Specimen N (KN) fc (Mpa) Vc Vs Vjc Vj
t Vjt/Vj
c
J-1 598 31.9 299 74 373 433.7 1.16
J-2 606 32.3 303 74 377 438.7 1.16
J-3 570 30.4 285 74 359 440.7 1.23
440 12 Seismic Performance of Recycled Aggregate Concrete Structures
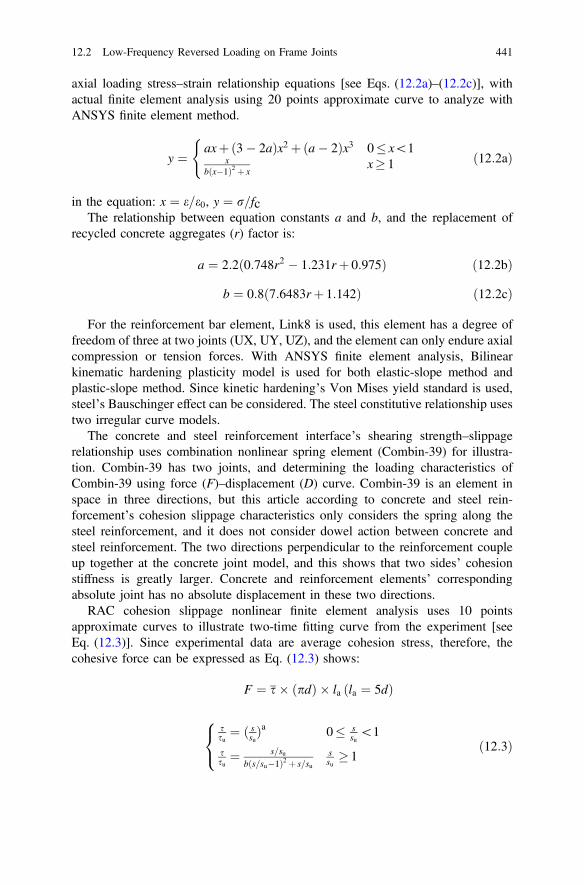
axial loading stress–strain relationship equations [see Eqs. (12.2a)–(12.2c)], withactual finite element analysis using 20 points approximate curve to analyze withANSYS finite element method.
y ¼ axþð3� 2aÞx2 þða� 2Þx3 0� x\1x
bðx�1Þ2 þ xx� 1
(ð12:2aÞ
in the equation: x ¼ e=e0, y ¼ r=fcThe relationship between equation constants a and b, and the replacement of
recycled concrete aggregates (r) factor is:
a ¼ 2:2ð0:748r2 � 1:231rþ 0:975Þ ð12:2bÞ
b ¼ 0:8ð7:6483rþ 1:142Þ ð12:2cÞ
For the reinforcement bar element, Link8 is used, this element has a degree offreedom of three at two joints (UX, UY, UZ), and the element can only endure axialcompression or tension forces. With ANSYS finite element analysis, Bilinearkinematic hardening plasticity model is used for both elastic-slope method andplastic-slope method. Since kinetic hardening’s Von Mises yield standard is used,steel’s Bauschinger effect can be considered. The steel constitutive relationship usestwo irregular curve models.
The concrete and steel reinforcement interface’s shearing strength–slippagerelationship uses combination nonlinear spring element (Combin-39) for illustra-tion. Combin-39 has two joints, and determining the loading characteristics ofCombin-39 using force (F)–displacement (D) curve. Combin-39 is an element inspace in three directions, but this article according to concrete and steel rein-forcement’s cohesion slippage characteristics only considers the spring along thesteel reinforcement, and it does not consider dowel action between concrete andsteel reinforcement. The two directions perpendicular to the reinforcement coupleup together at the concrete joint model, and this shows that two sides’ cohesionstiffness is greatly larger. Concrete and reinforcement elements’ correspondingabsolute joint has no absolute displacement in these two directions.
RAC cohesion slippage nonlinear finite element analysis uses 10 pointsapproximate curves to illustrate two-time fitting curve from the experiment [seeEq. (12.3)]. Since experimental data are average cohesion stress, therefore, thecohesive force can be expressed as Eq. (12.3) shows:
F ¼ s� ðpdÞ � la ðla ¼ 5dÞ
ssu¼ ð ssuÞ
a 0� ssu\1
ssu¼ s=su
bðs=su�1Þ2 þ s=sussu� 1
8<: ð12:3Þ
12.2 Low-Frequency Reversed Loading on Frame Joints 441

In Eq. (12.3), the constant “a” is 0.3, for the constant value “b” 0.10 was usedfor 0% RCA replacement, 0.10 was used for 50% recycled concrete aggregatesreplacement, and 0.15 was used for 50% RCA replacement.
2. RAC frame joint actual model
Solid concrete model uses the creation of a model from bottom to top format,and from point to line to plane, and then lastly using copying to create a model.Element Combin-39 is mainly used for the joint core area, the longitudinal rein-forcement in the beam, and the concrete interface; apart from this, the displacementof the concrete and reinforcement in the beam–column specimen is simultaneous,ignoring slippage between them. The finite element analysis’s geometry model,concrete finite model, and steel reinforcement finite model are shown in Fig. 12.8.
3. The loading method of an ANSYS finite element model
The system and process (pattern) of loading is basically the same as in an actualexperiment, the load controlling the whole process. But since the P–D curvesduring the acceleration stage the test specimen cracking is not very serious, mostlyin elastic state, cyclic loading does not affect the test results very much; therefore,this article’s analysis found it to be convergent. The load (system) patterns weremade similar (see Fig. 12.9); every stage was once repeated. Finite element analysismethod is a transient method, but since during the analysis there are also transienteffects, inertia and damping effect are not considered, therefore analyzing practicaland static problems to simulate the test specimen’s low-frequency loading pattern’seffect.
4. Analysis of calculations results
This study also calculated joint (J − 1) without considering the slippage situa-tion of the core area’s beam longitudinal reinforcement, and considering the corearea’s longitudinal reinforcement cohesion–slippage skeleton curves and experi-ment data curves can be used in the same way as shown in Fig. 12.10. From thediagram, it can be seen that without considering the core area’s reinforcement
(a) Geometry model (b) finite element model (c) reinforcements
Fig. 12.8 Recycled concrete frame joint simulation models
442 12 Seismic Performance of Recycled Aggregate Concrete Structures

cohesion–slippage of the finite element model at the same level of loading, thebeam displacement is in overall much less than the actual experiment’s beamdisplacement. As to whether or not to consider the cohesion–slippage betweenconcrete and steel reinforcement, the failure load calculations value has no mucheffect, but the effect to the displacement value calculation is greater. This analysisdoes not consider the core area beam section’s displacement cohesion–slippage, andit is 30% less than a situation where it is considered.
In overall, the above-mentioned core area beams longitudinal reinforcement’scohesion–slippage has a large influence on the loading properties of the recycledconcrete frame joint, and finite element method calculations cannot be ignored.
This part examined three different recycled concrete frame joints specimen ofthree different replacement percentage of recycled concrete aggregates finite ele-ment models, comparing the calculation of the beam section data curves with theactual experiment data curves. When the load increases, the beam section dis-placement increase rate is slower than that of the actual experiment, it does notreach 5% of the actual experiment, and this satisfies the calculation accuracyrequirement. But as it approaches the load peak point, the difference in displace-ment is larger and exceeds the actual experiment value by 15%. The reason ismainly that at this time the core area concrete has began to be smashed, anddisrupting the core area’s stress normal transfer, bearing capacity and stiffness are
Fig. 12.9 Loading pattern
(a) J-1 (b) J-2 (c) J-3
Fig. 12.10 The experiment skeleton curves and the simulating ones
12.2 Low-Frequency Reversed Loading on Frame Joints 443
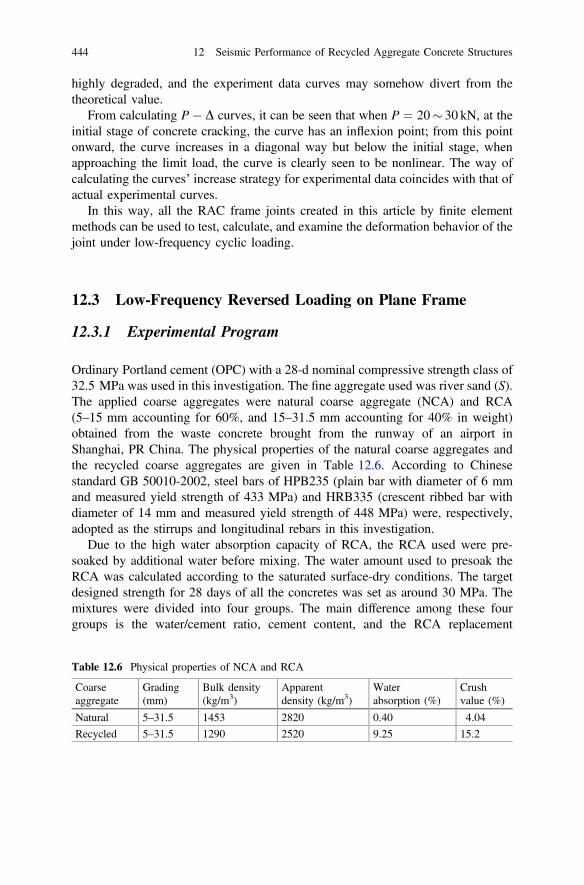
highly degraded, and the experiment data curves may somehow divert from thetheoretical value.
From calculating P� D curves, it can be seen that when P ¼ 20� 30 kN, at theinitial stage of concrete cracking, the curve has an inflexion point; from this pointonward, the curve increases in a diagonal way but below the initial stage, whenapproaching the limit load, the curve is clearly seen to be nonlinear. The way ofcalculating the curves’ increase strategy for experimental data coincides with that ofactual experimental curves.
In this way, all the RAC frame joints created in this article by finite elementmethods can be used to test, calculate, and examine the deformation behavior of thejoint under low-frequency cyclic loading.
12.3 Low-Frequency Reversed Loading on Plane Frame
12.3.1 Experimental Program
Ordinary Portland cement (OPC) with a 28-d nominal compressive strength class of32.5 MPa was used in this investigation. The fine aggregate used was river sand (S).The applied coarse aggregates were natural coarse aggregate (NCA) and RCA(5–15 mm accounting for 60%, and 15–31.5 mm accounting for 40% in weight)obtained from the waste concrete brought from the runway of an airport inShanghai, PR China. The physical properties of the natural coarse aggregates andthe recycled coarse aggregates are given in Table 12.6. According to Chinesestandard GB 50010-2002, steel bars of HPB235 (plain bar with diameter of 6 mmand measured yield strength of 433 MPa) and HRB335 (crescent ribbed bar withdiameter of 14 mm and measured yield strength of 448 MPa) were, respectively,adopted as the stirrups and longitudinal rebars in this investigation.
Due to the high water absorption capacity of RCA, the RCA used were pre-soaked by additional water before mixing. The water amount used to presoak theRCA was calculated according to the saturated surface-dry conditions. The targetdesigned strength for 28 days of all the concretes was set as around 30 MPa. Themixtures were divided into four groups. The main difference among these fourgroups is the water/cement ratio, cement content, and the RCA replacement
Table 12.6 Physical properties of NCA and RCA
Coarseaggregate
Grading(mm)
Bulk density(kg/m3)
Apparentdensity (kg/m3)
Waterabsorption (%)
Crushvalue (%)
Natural 5–31.5 1453 2820 0.40 4.04
Recycled 5–31.5 1290 2520 9.25 15.2
444 12 Seismic Performance of Recycled Aggregate Concrete Structures
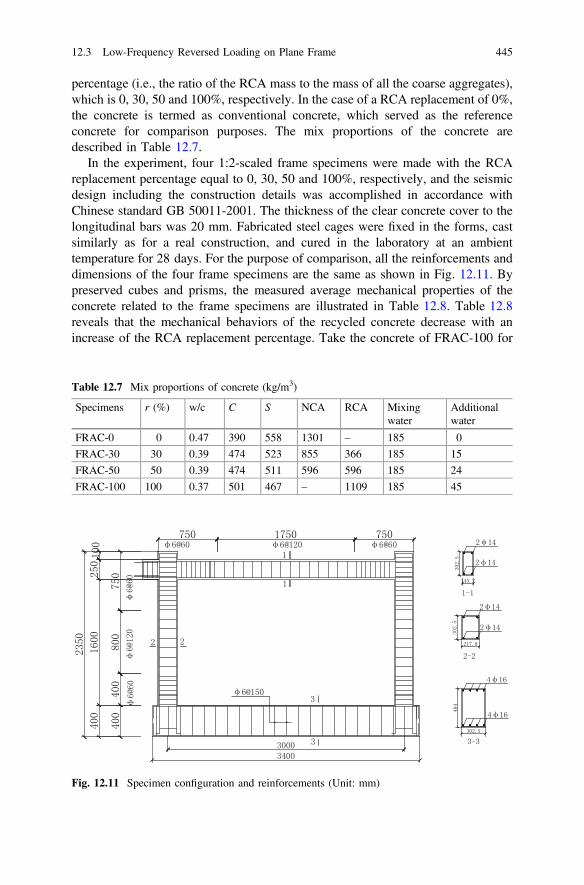
percentage (i.e., the ratio of the RCA mass to the mass of all the coarse aggregates),which is 0, 30, 50 and 100%, respectively. In the case of a RCA replacement of 0%,the concrete is termed as conventional concrete, which served as the referenceconcrete for comparison purposes. The mix proportions of the concrete aredescribed in Table 12.7.
In the experiment, four 1:2-scaled frame specimens were made with the RCAreplacement percentage equal to 0, 30, 50 and 100%, respectively, and the seismicdesign including the construction details was accomplished in accordance withChinese standard GB 50011-2001. The thickness of the clear concrete cover to thelongitudinal bars was 20 mm. Fabricated steel cages were fixed in the forms, castsimilarly as for a real construction, and cured in the laboratory at an ambienttemperature for 28 days. For the purpose of comparison, all the reinforcements anddimensions of the four frame specimens are the same as shown in Fig. 12.11. Bypreserved cubes and prisms, the measured average mechanical properties of theconcrete related to the frame specimens are illustrated in Table 12.8. Table 12.8reveals that the mechanical behaviors of the recycled concrete decrease with anincrease of the RCA replacement percentage. Take the concrete of FRAC-100 for
Table 12.7 Mix proportions of concrete (kg/m3)
Specimens r (%) w/c C S NCA RCA Mixingwater
Additionalwater
FRAC-0 0 0.47 390 558 1301 – 185 0
FRAC-30 30 0.39 474 523 855 366 185 15
FRAC-50 50 0.39 474 511 596 596 185 24
FRAC-100 100 0.37 501 467 – 1109 185 45
Fig. 12.11 Specimen configuration and reinforcements (Unit: mm)
12.3 Low-Frequency Reversed Loading on Plane Frame 445
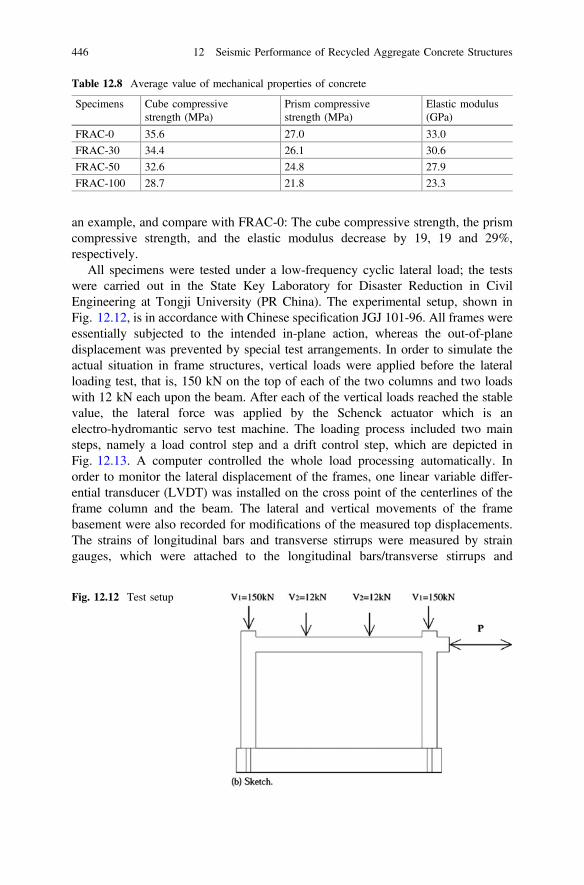
an example, and compare with FRAC-0: The cube compressive strength, the prismcompressive strength, and the elastic modulus decrease by 19, 19 and 29%,respectively.
All specimens were tested under a low-frequency cyclic lateral load; the testswere carried out in the State Key Laboratory for Disaster Reduction in CivilEngineering at Tongji University (PR China). The experimental setup, shown inFig. 12.12, is in accordance with Chinese specification JGJ 101-96. All frames wereessentially subjected to the intended in-plane action, whereas the out-of-planedisplacement was prevented by special test arrangements. In order to simulate theactual situation in frame structures, vertical loads were applied before the lateralloading test, that is, 150 kN on the top of each of the two columns and two loadswith 12 kN each upon the beam. After each of the vertical loads reached the stablevalue, the lateral force was applied by the Schenck actuator which is anelectro-hydromantic servo test machine. The loading process included two mainsteps, namely a load control step and a drift control step, which are depicted inFig. 12.13. A computer controlled the whole load processing automatically. Inorder to monitor the lateral displacement of the frames, one linear variable differ-ential transducer (LVDT) was installed on the cross point of the centerlines of theframe column and the beam. The lateral and vertical movements of the framebasement were also recorded for modifications of the measured top displacements.The strains of longitudinal bars and transverse stirrups were measured by straingauges, which were attached to the longitudinal bars/transverse stirrups and
Table 12.8 Average value of mechanical properties of concrete
Specimens Cube compressivestrength (MPa)
Prism compressivestrength (MPa)
Elastic modulus(GPa)
FRAC-0 35.6 27.0 33.0
FRAC-30 34.4 26.1 30.6
FRAC-50 32.6 24.8 27.9
FRAC-100 28.7 21.8 23.3
Fig. 12.12 Test setup
446 12 Seismic Performance of Recycled Aggregate Concrete Structures

embedded in concrete in advance. In addition, all the appearances and cracks wereobserved and evaluated carefully. The load cell recorded the lateral load in theloading process. All data were acquired through an automatic data acquisitionsystem (ADAS) installed on a PC.
12.3.2 Test Analysis
After the application of all vertical loads on both the column and the beam, noobvious changes were observed in the frame specimens. In the stage of load control,when the lateral load reached ±20 kN, cracks were found in the end and mid-spanof the beams in FRAC-0, FRAC-30, and FRAC-50 while for FRAC-100 only hairline cracks appeared in the beam end. Therefore, it could be concluded that allframes behave linearly. With the increase of the lateral load up to 40 kN, more andmore cracks appeared at the end as well as in the mid-span of the beams and theupper longitudinal rebars in the beam began to yield, which symbolized the elastic–plastic stage of the specimens. In the stage of drift control up to 35 mm, the cracksin the frames were somewhat stable and no new cracks appeared afterward; instead,the previous cracks developed longer and wider. When the top lateral displacementreached 60 mm, some horizontal and diagonal cracks were observed in the beam–
column joints. With the increase of the cycles, the above-mentioned cracks prop-agated progressively but the frames did not collapse in the end. The failure of all theframe specimens started with the peeling off of concrete cover at the bottom of thecolumns and the yield of tensile longitudinal bars in the columns. The typicalfailure characters can be summarized as “stronger joint followed by the column andthe weaker beam,” as shown in Fig. 12.14. From the above descriptions as well asfrom the pictures in Fig. 12.14, it can be concluded that the RCA replacementpercentage has no obvious effects on the failure pattern of frames under horizontalseismic loading.
Fig. 12.13 Loading pattern
12.3 Low-Frequency Reversed Loading on Plane Frame 447

Table 12.9 lists the measured crack load, yield load, maximum load, and ulti-mate load (i.e., 85% of the maximum load). It is noted from Table 12.9 that thecrack load is almost the same for all the four investigated frames. Compared toFRAC-0 with natural coarse aggregate, the yield load of FRAC-30, FRAC-50, andFRAC-100 decreases by 3, 11 and 8%, respectively, while the maximum load aswell as the ultimate load of FRAC-30, FRAC-50, and FRAC-100 decreases by6, 15 and 2%, respectively. Generally speaking, except for the crack loads, thepresence of the RCA will reduce the characteristic loads. It should be noted that(1) the reductions of RAC frames in the characteristic loads are less than at materiallevel, i.e., the mechanical properties of the RAC as described in Table 12.9; thismay due to the contributions of steel bars and the frame geometry configuration;and (2) the reason why the characteristic load reaches the lowest in FRAC-50 stillneeds to be investigated.
Table 12.10 summarizes the deformation features of the frames which includethe crack displacement, the yield displacement, the peak displacement, and theultimate displacement corresponding to the crack load, the yield load, the maximumload, and the ultimate load. In addition, the ductility coefficient, which is defined asthe ratio of the ultimate displacement to the yield displacement and the relative
(a) Beam end (b) Column end
Fig. 12.14 Typical failure pattern of FRAC-100
Table 12.9 Characteristicloads of frames (Unit: kN)
Loads FRAC-0 FRAC-30 FRAC-50 FRAC-100
Pcr Test 20.5 20.5 20.7 20.7
Ratio 1.00 1.00 1.01 1.01
Py Test 81.7 79.0 72.8 75.3
Ratio 1.00 0.97 0.89 0.92
Pmax Test 95.2 89.6 81.1 93.4
Ratio 1.0 0.94 0.85 0.98
Pu Test 80.9 76.2 68.9 79.4
Ratio 1.0 0.94 0.85 0.98
448 12 Seismic Performance of Recycled Aggregate Concrete Structures
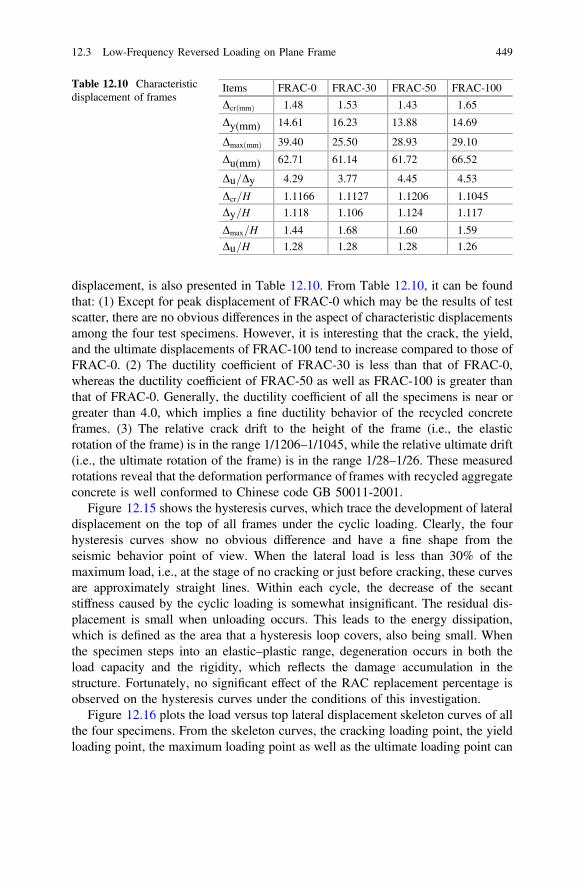
displacement, is also presented in Table 12.10. From Table 12.10, it can be foundthat: (1) Except for peak displacement of FRAC-0 which may be the results of testscatter, there are no obvious differences in the aspect of characteristic displacementsamong the four test specimens. However, it is interesting that the crack, the yield,and the ultimate displacements of FRAC-100 tend to increase compared to those ofFRAC-0. (2) The ductility coefficient of FRAC-30 is less than that of FRAC-0,whereas the ductility coefficient of FRAC-50 as well as FRAC-100 is greater thanthat of FRAC-0. Generally, the ductility coefficient of all the specimens is near orgreater than 4.0, which implies a fine ductility behavior of the recycled concreteframes. (3) The relative crack drift to the height of the frame (i.e., the elasticrotation of the frame) is in the range 1/1206–1/1045, while the relative ultimate drift(i.e., the ultimate rotation of the frame) is in the range 1/28–1/26. These measuredrotations reveal that the deformation performance of frames with recycled aggregateconcrete is well conformed to Chinese code GB 50011-2001.
Figure 12.15 shows the hysteresis curves, which trace the development of lateraldisplacement on the top of all frames under the cyclic loading. Clearly, the fourhysteresis curves show no obvious difference and have a fine shape from theseismic behavior point of view. When the lateral load is less than 30% of themaximum load, i.e., at the stage of no cracking or just before cracking, these curvesare approximately straight lines. Within each cycle, the decrease of the secantstiffness caused by the cyclic loading is somewhat insignificant. The residual dis-placement is small when unloading occurs. This leads to the energy dissipation,which is defined as the area that a hysteresis loop covers, also being small. Whenthe specimen steps into an elastic–plastic range, degeneration occurs in both theload capacity and the rigidity, which reflects the damage accumulation in thestructure. Fortunately, no significant effect of the RAC replacement percentage isobserved on the hysteresis curves under the conditions of this investigation.
Figure 12.16 plots the load versus top lateral displacement skeleton curves of allthe four specimens. From the skeleton curves, the cracking loading point, the yieldloading point, the maximum loading point as well as the ultimate loading point can
Table 12.10 Characteristicdisplacement of frames
Items FRAC-0 FRAC-30 FRAC-50 FRAC-100
DcrðmmÞ 1.48 1.53 1.43 1.65
Dy(mm) 14.61 16.23 13.88 14.69
DmaxðmmÞ 39.40 25.50 28.93 29.10
Du(mm) 62.71 61.14 61.72 66.52
Du=Dy 4.29 3.77 4.45 4.53
Dcr=H 1.1166 1.1127 1.1206 1.1045
Dy=H 1.118 1.106 1.124 1.117
Dmax=H 1.44 1.68 1.60 1.59
Du=H 1.28 1.28 1.28 1.26
12.3 Low-Frequency Reversed Loading on Plane Frame 449

(a) FRAC-0 (b) FRAC-30
(c) FRAC-50(d) FRAC-100
Fig. 12.15 Hysteresis curves
Fig. 12.16 Skeleton curves
450 12 Seismic Performance of Recycled Aggregate Concrete Structures
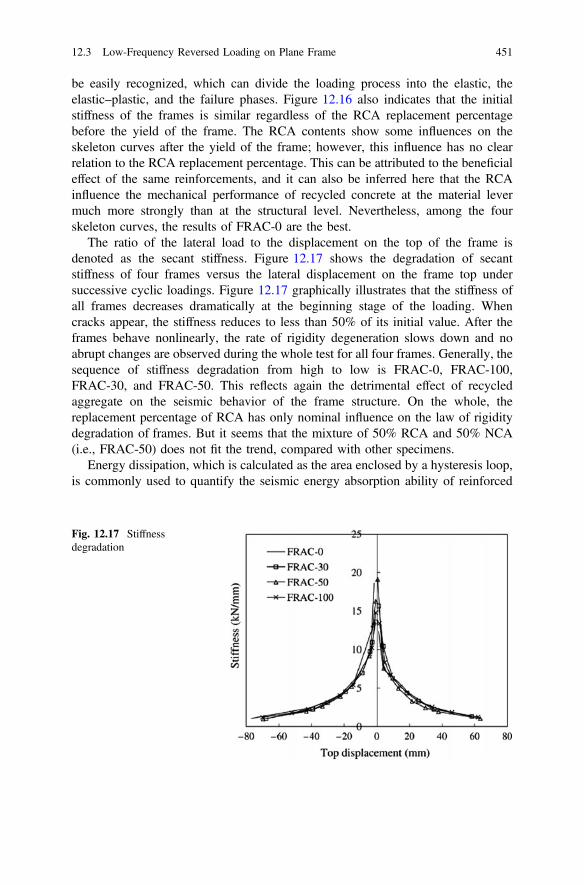
be easily recognized, which can divide the loading process into the elastic, theelastic–plastic, and the failure phases. Figure 12.16 also indicates that the initialstiffness of the frames is similar regardless of the RCA replacement percentagebefore the yield of the frame. The RCA contents show some influences on theskeleton curves after the yield of the frame; however, this influence has no clearrelation to the RCA replacement percentage. This can be attributed to the beneficialeffect of the same reinforcements, and it can also be inferred here that the RCAinfluence the mechanical performance of recycled concrete at the material levermuch more strongly than at the structural level. Nevertheless, among the fourskeleton curves, the results of FRAC-0 are the best.
The ratio of the lateral load to the displacement on the top of the frame isdenoted as the secant stiffness. Figure 12.17 shows the degradation of secantstiffness of four frames versus the lateral displacement on the frame top undersuccessive cyclic loadings. Figure 12.17 graphically illustrates that the stiffness ofall frames decreases dramatically at the beginning stage of the loading. Whencracks appear, the stiffness reduces to less than 50% of its initial value. After theframes behave nonlinearly, the rate of rigidity degeneration slows down and noabrupt changes are observed during the whole test for all four frames. Generally, thesequence of stiffness degradation from high to low is FRAC-0, FRAC-100,FRAC-30, and FRAC-50. This reflects again the detrimental effect of recycledaggregate on the seismic behavior of the frame structure. On the whole, thereplacement percentage of RCA has only nominal influence on the law of rigiditydegradation of frames. But it seems that the mixture of 50% RCA and 50% NCA(i.e., FRAC-50) does not fit the trend, compared with other specimens.
Energy dissipation, which is calculated as the area enclosed by a hysteresis loop,is commonly used to quantify the seismic energy absorption ability of reinforced
Fig. 12.17 Stiffnessdegradation
12.3 Low-Frequency Reversed Loading on Plane Frame 451
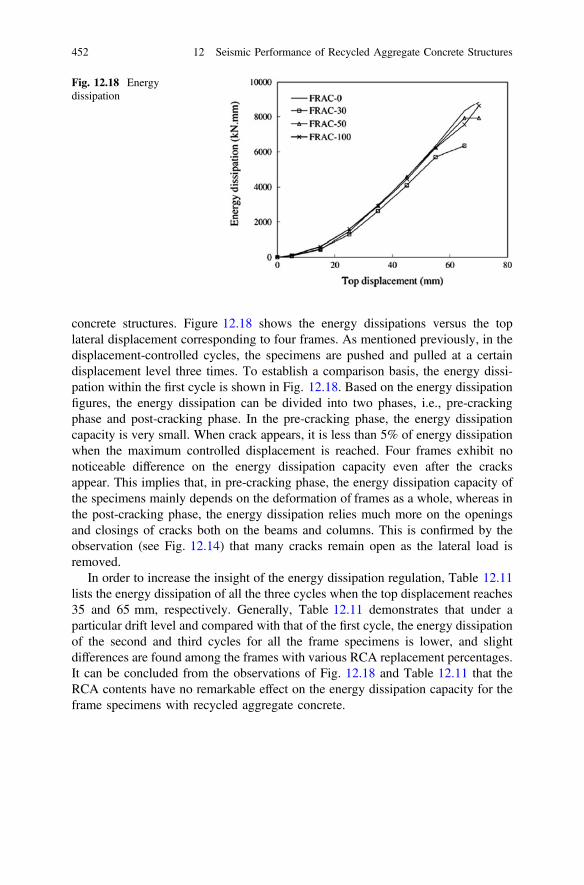
concrete structures. Figure 12.18 shows the energy dissipations versus the toplateral displacement corresponding to four frames. As mentioned previously, in thedisplacement-controlled cycles, the specimens are pushed and pulled at a certaindisplacement level three times. To establish a comparison basis, the energy dissi-pation within the first cycle is shown in Fig. 12.18. Based on the energy dissipationfigures, the energy dissipation can be divided into two phases, i.e., pre-crackingphase and post-cracking phase. In the pre-cracking phase, the energy dissipationcapacity is very small. When crack appears, it is less than 5% of energy dissipationwhen the maximum controlled displacement is reached. Four frames exhibit nonoticeable difference on the energy dissipation capacity even after the cracksappear. This implies that, in pre-cracking phase, the energy dissipation capacity ofthe specimens mainly depends on the deformation of frames as a whole, whereas inthe post-cracking phase, the energy dissipation relies much more on the openingsand closings of cracks both on the beams and columns. This is confirmed by theobservation (see Fig. 12.14) that many cracks remain open as the lateral load isremoved.
In order to increase the insight of the energy dissipation regulation, Table 12.11lists the energy dissipation of all the three cycles when the top displacement reaches35 and 65 mm, respectively. Generally, Table 12.11 demonstrates that under aparticular drift level and compared with that of the first cycle, the energy dissipationof the second and third cycles for all the frame specimens is lower, and slightdifferences are found among the frames with various RCA replacement percentages.It can be concluded from the observations of Fig. 12.18 and Table 12.11 that theRCA contents have no remarkable effect on the energy dissipation capacity for theframe specimens with recycled aggregate concrete.
Fig. 12.18 Energydissipation
452 12 Seismic Performance of Recycled Aggregate Concrete Structures
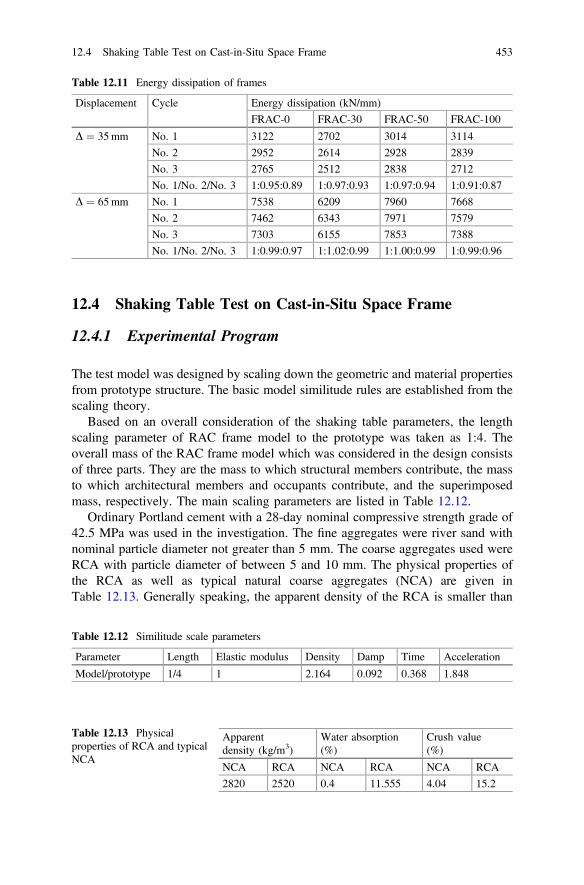
12.4 Shaking Table Test on Cast-in-Situ Space Frame
12.4.1 Experimental Program
The test model was designed by scaling down the geometric and material propertiesfrom prototype structure. The basic model similitude rules are established from thescaling theory.
Based on an overall consideration of the shaking table parameters, the lengthscaling parameter of RAC frame model to the prototype was taken as 1:4. Theoverall mass of the RAC frame model which was considered in the design consistsof three parts. They are the mass to which structural members contribute, the massto which architectural members and occupants contribute, and the superimposedmass, respectively. The main scaling parameters are listed in Table 12.12.
Ordinary Portland cement with a 28-day nominal compressive strength grade of42.5 MPa was used in the investigation. The fine aggregates were river sand withnominal particle diameter not greater than 5 mm. The coarse aggregates used wereRCA with particle diameter of between 5 and 10 mm. The physical properties ofthe RCA as well as typical natural coarse aggregates (NCA) are given inTable 12.13. Generally speaking, the apparent density of the RCA is smaller than
Table 12.11 Energy dissipation of frames
Displacement Cycle Energy dissipation (kN/mm)
FRAC-0 FRAC-30 FRAC-50 FRAC-100
D ¼ 35mm No. 1 3122 2702 3014 3114
No. 2 2952 2614 2928 2839
No. 3 2765 2512 2838 2712
No. 1/No. 2/No. 3 1:0.95:0.89 1:0.97:0.93 1:0.97:0.94 1:0.91:0.87
D ¼ 65mm No. 1 7538 6209 7960 7668
No. 2 7462 6343 7971 7579
No. 3 7303 6155 7853 7388
No. 1/No. 2/No. 3 1:0.99:0.97 1:1.02:0.99 1:1.00:0.99 1:0.99:0.96
Table 12.12 Similitude scale parameters
Parameter Length Elastic modulus Density Damp Time Acceleration
Model/prototype 1/4 1 2.164 0.092 0.368 1.848
Table 12.13 Physicalproperties of RCA and typicalNCA
Apparentdensity (kg/m3)
Water absorption(%)
Crush value(%)
NCA RCA NCA RCA NCA RCA
2820 2520 0.4 11.555 4.04 15.2
12.4 Shaking Table Test on Cast-in-Situ Space Frame 453
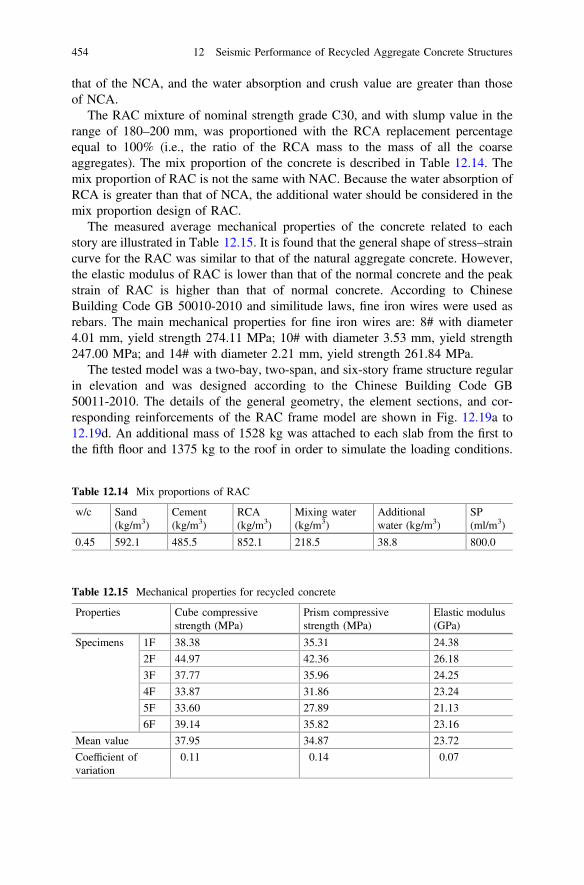
that of the NCA, and the water absorption and crush value are greater than thoseof NCA.
The RAC mixture of nominal strength grade C30, and with slump value in therange of 180–200 mm, was proportioned with the RCA replacement percentageequal to 100% (i.e., the ratio of the RCA mass to the mass of all the coarseaggregates). The mix proportion of the concrete is described in Table 12.14. Themix proportion of RAC is not the same with NAC. Because the water absorption ofRCA is greater than that of NCA, the additional water should be considered in themix proportion design of RAC.
The measured average mechanical properties of the concrete related to eachstory are illustrated in Table 12.15. It is found that the general shape of stress–straincurve for the RAC was similar to that of the natural aggregate concrete. However,the elastic modulus of RAC is lower than that of the normal concrete and the peakstrain of RAC is higher than that of normal concrete. According to ChineseBuilding Code GB 50010-2010 and similitude laws, fine iron wires were used asrebars. The main mechanical properties for fine iron wires are: 8# with diameter4.01 mm, yield strength 274.11 MPa; 10# with diameter 3.53 mm, yield strength247.00 MPa; and 14# with diameter 2.21 mm, yield strength 261.84 MPa.
The tested model was a two-bay, two-span, and six-story frame structure regularin elevation and was designed according to the Chinese Building Code GB50011-2010. The details of the general geometry, the element sections, and cor-responding reinforcements of the RAC frame model are shown in Fig. 12.19a to12.19d. An additional mass of 1528 kg was attached to each slab from the first tothe fifth floor and 1375 kg to the roof in order to simulate the loading conditions.
Table 12.14 Mix proportions of RAC
w/c Sand(kg/m3)
Cement(kg/m3)
RCA(kg/m3)
Mixing water(kg/m3)
Additionalwater (kg/m3)
SP(ml/m3)
0.45 592.1 485.5 852.1 218.5 38.8 800.0
Table 12.15 Mechanical properties for recycled concrete
Properties Cube compressivestrength (MPa)
Prism compressivestrength (MPa)
Elastic modulus(GPa)
Specimens 1F 38.38 35.31 24.38
2F 44.97 42.36 26.18
3F 37.77 35.96 24.25
4F 33.87 31.86 23.24
5F 33.60 27.89 21.13
6F 39.14 35.82 23.16
Mean value 37.95 34.87 23.72
Coefficient ofvariation
0.11 0.14 0.07
454 12 Seismic Performance of Recycled Aggregate Concrete Structures
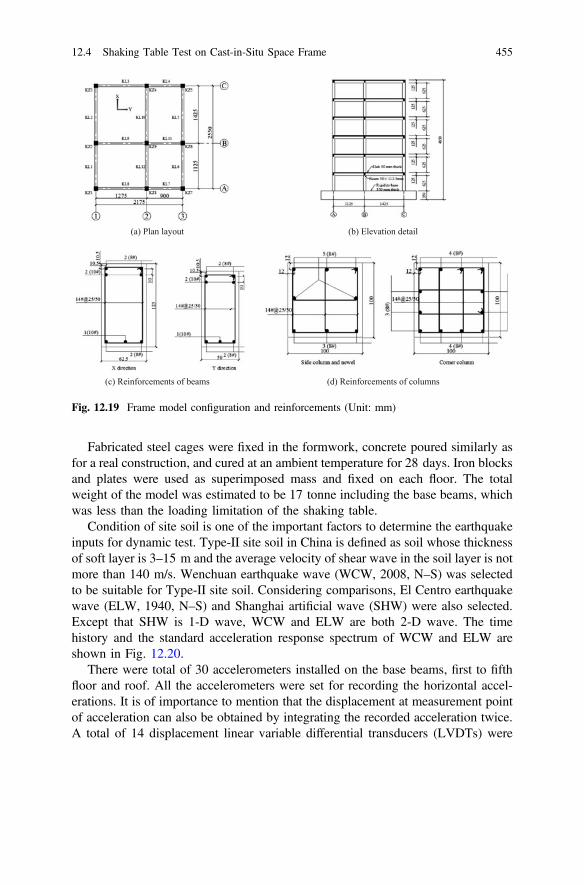
Fabricated steel cages were fixed in the formwork, concrete poured similarly asfor a real construction, and cured at an ambient temperature for 28 days. Iron blocksand plates were used as superimposed mass and fixed on each floor. The totalweight of the model was estimated to be 17 tonne including the base beams, whichwas less than the loading limitation of the shaking table.
Condition of site soil is one of the important factors to determine the earthquakeinputs for dynamic test. Type-II site soil in China is defined as soil whose thicknessof soft layer is 3–15 m and the average velocity of shear wave in the soil layer is notmore than 140 m/s. Wenchuan earthquake wave (WCW, 2008, N–S) was selectedto be suitable for Type-II site soil. Considering comparisons, El Centro earthquakewave (ELW, 1940, N–S) and Shanghai artificial wave (SHW) were also selected.Except that SHW is 1-D wave, WCW and ELW are both 2-D wave. The timehistory and the standard acceleration response spectrum of WCW and ELW areshown in Fig. 12.20.
There were total of 30 accelerometers installed on the base beams, first to fifthfloor and roof. All the accelerometers were set for recording the horizontal accel-erations. It is of importance to mention that the displacement at measurement pointof acceleration can also be obtained by integrating the recorded acceleration twice.A total of 14 displacement linear variable differential transducers (LVDTs) were
(a) Plan layout (b) Elevation detail
(c) Reinforcements of beams (d) Reinforcements of columns
Fig. 12.19 Frame model configuration and reinforcements (Unit: mm)
12.4 Shaking Table Test on Cast-in-Situ Space Frame 455

installed to record the horizontal displacements, whereby two LVDTs were placedon each floor from first to fifth floor and four LVDTs were placed on roof. A total ofeight strain gauges were installed on the bottom of corner columns from the secondto the third floor for the purpose of monitoring the variation of concrete strains. Anoverview of the model on the shaking table is shown in Fig. 12.21.
The test program consisted of nine phases, which were tested with peak groundacceleration (PGA) of 0.066, 0.130 (frequently occurring earthquake of intensity 8),0.185, 0.264, 0.370 (basic occurring earthquake of intensity 8), 0.415, 0.550, 0.750(rarely occurring earthquake of intensity 8), and 1.170 g (rarely occurring earth-quake of intensity 9). Before and after each test phase, white noise with accelerationamplitude of 0.05 g was input to check the dynamic characteristics of the model.WCW, ELW, and SHW are input in sequence to the model in each test phase. Thetests were performed with the main excitation in the X-direction.
(a) Time history (WCW, 2008, N-S) (b) Standard acceleration response spectrum (WCW)
(c) Time history (ELW, 1940, N-S) (d) Standard acceleration response spectrum (ELW)
Fig. 12.20 Time history and frequency spectrum of WCW and ELW
456 12 Seismic Performance of Recycled Aggregate Concrete Structures
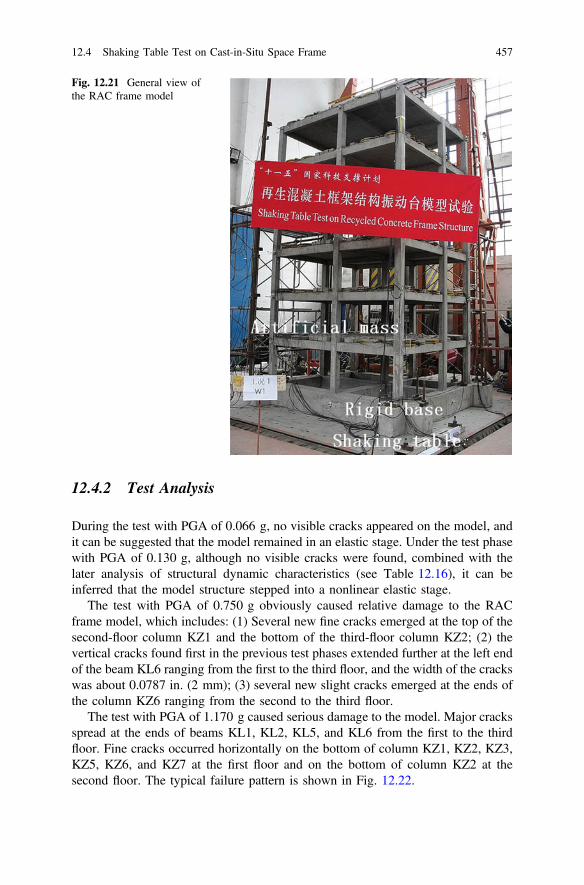
12.4.2 Test Analysis
During the test with PGA of 0.066 g, no visible cracks appeared on the model, andit can be suggested that the model remained in an elastic stage. Under the test phasewith PGA of 0.130 g, although no visible cracks were found, combined with thelater analysis of structural dynamic characteristics (see Table 12.16), it can beinferred that the model structure stepped into a nonlinear elastic stage.
The test with PGA of 0.750 g obviously caused relative damage to the RACframe model, which includes: (1) Several new fine cracks emerged at the top of thesecond-floor column KZ1 and the bottom of the third-floor column KZ2; (2) thevertical cracks found first in the previous test phases extended further at the left endof the beam KL6 ranging from the first to the third floor, and the width of the crackswas about 0.0787 in. (2 mm); (3) several new slight cracks emerged at the ends ofthe column KZ6 ranging from the second to the third floor.
The test with PGA of 1.170 g caused serious damage to the model. Major cracksspread at the ends of beams KL1, KL2, KL5, and KL6 from the first to the thirdfloor. Fine cracks occurred horizontally on the bottom of column KZ1, KZ2, KZ3,KZ5, KZ6, and KZ7 at the first floor and on the bottom of column KZ2 at thesecond floor. The typical failure pattern is shown in Fig. 12.22.
Fig. 12.21 General view ofthe RAC frame model
12.4 Shaking Table Test on Cast-in-Situ Space Frame 457
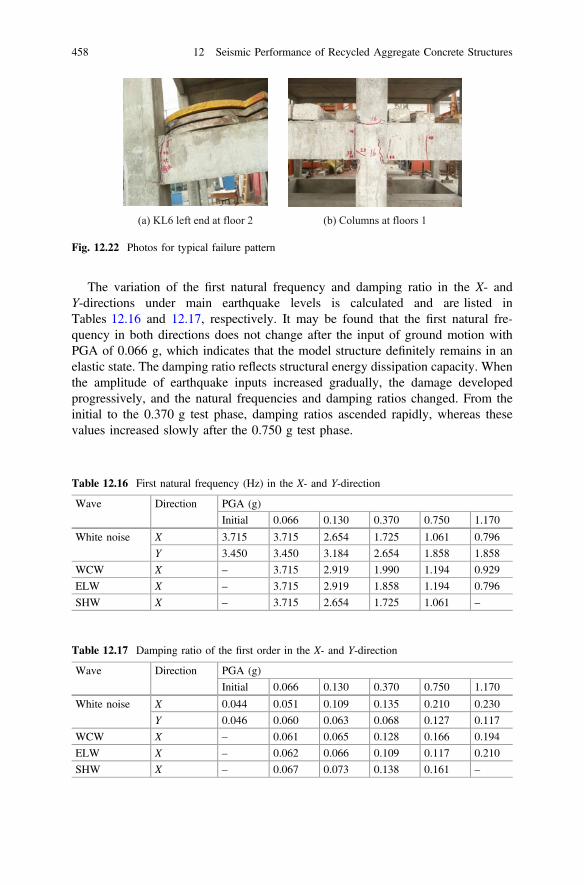
The variation of the first natural frequency and damping ratio in the X- andY-directions under main earthquake levels is calculated and are listed inTables 12.16 and 12.17, respectively. It may be found that the first natural fre-quency in both directions does not change after the input of ground motion withPGA of 0.066 g, which indicates that the model structure definitely remains in anelastic state. The damping ratio reflects structural energy dissipation capacity. Whenthe amplitude of earthquake inputs increased gradually, the damage developedprogressively, and the natural frequencies and damping ratios changed. From theinitial to the 0.370 g test phase, damping ratios ascended rapidly, whereas thesevalues increased slowly after the 0.750 g test phase.
(a) KL6 left end at floor 2 (b) Columns at floors 1
Fig. 12.22 Photos for typical failure pattern
Table 12.17 Damping ratio of the first order in the X- and Y-direction
Wave Direction PGA (g)
Initial 0.066 0.130 0.370 0.750 1.170
White noise X 0.044 0.051 0.109 0.135 0.210 0.230
Y 0.046 0.060 0.063 0.068 0.127 0.117
WCW X – 0.061 0.065 0.128 0.166 0.194
ELW X – 0.062 0.066 0.109 0.117 0.210
SHW X – 0.067 0.073 0.138 0.161 –
Table 12.16 First natural frequency (Hz) in the X- and Y-direction
Wave Direction PGA (g)
Initial 0.066 0.130 0.370 0.750 1.170
White noise X 3.715 3.715 2.654 1.725 1.061 0.796
Y 3.450 3.450 3.184 2.654 1.858 1.858
WCW X – 3.715 2.919 1.990 1.194 0.929
ELW X – 3.715 2.919 1.858 1.194 0.796
SHW X – 3.715 2.654 1.725 1.061 –
458 12 Seismic Performance of Recycled Aggregate Concrete Structures

The first two vibration modes in the X-direction are shown in Fig. 12.23. FromFig. 12.23, it can be seen that the lateral stiffness is uniformly distributed along theheight; and the first-order vibration mode shows a shear-type feature.
The ratio of acceleration measured to the corresponding input PGA is named asthe acceleration amplification factor. The distribution of acceleration amplificationfactor in the X-direction under the WCW, ELW, and SHW inputs for differentearthquake levels is shown in Fig. 12.24.
(a) The first order (b) The second order
Fig. 12.23 Variation of the vibration modes in the X-direction
Fig. 12.24 Distribution of acceleration amplification factor in X-direction
12.4 Shaking Table Test on Cast-in-Situ Space Frame 459
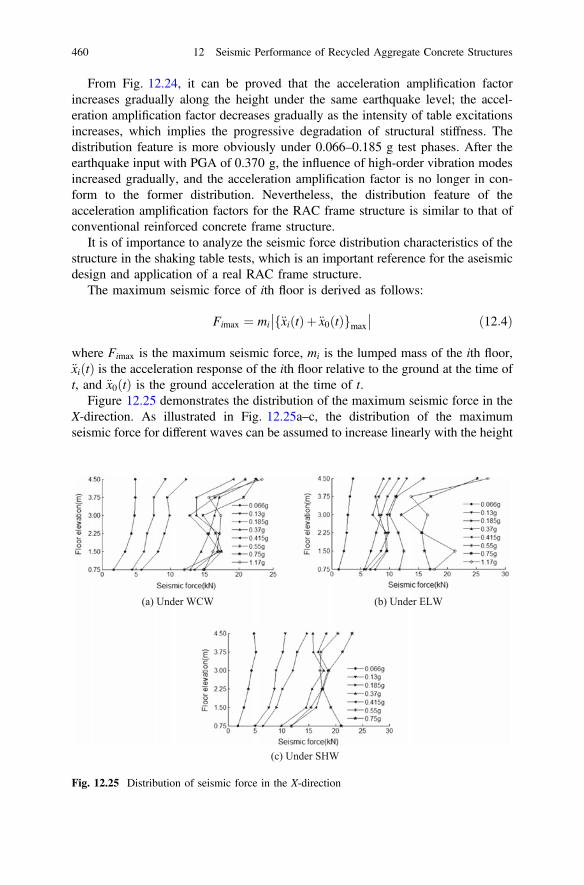
From Fig. 12.24, it can be proved that the acceleration amplification factorincreases gradually along the height under the same earthquake level; the accel-eration amplification factor decreases gradually as the intensity of table excitationsincreases, which implies the progressive degradation of structural stiffness. Thedistribution feature is more obviously under 0.066–0.185 g test phases. After theearthquake input with PGA of 0.370 g, the influence of high-order vibration modesincreased gradually, and the acceleration amplification factor is no longer in con-form to the former distribution. Nevertheless, the distribution feature of theacceleration amplification factors for the RAC frame structure is similar to that ofconventional reinforced concrete frame structure.
It is of importance to analyze the seismic force distribution characteristics of thestructure in the shaking table tests, which is an important reference for the aseismicdesign and application of a real RAC frame structure.
The maximum seismic force of ith floor is derived as follows:
Fimax ¼ mi f€xiðtÞþ€x0ðtÞgmax
�� �� ð12:4Þ
where Fimax is the maximum seismic force, mi is the lumped mass of the ith floor,€xiðtÞ is the acceleration response of the ith floor relative to the ground at the time oft, and €x0ðtÞ is the ground acceleration at the time of t.
Figure 12.25 demonstrates the distribution of the maximum seismic force in theX-direction. As illustrated in Fig. 12.25a–c, the distribution of the maximumseismic force for different waves can be assumed to increase linearly with the height
(a) Under WCW (b) Under ELW
(c) Under SHW
Fig. 12.25 Distribution of seismic force in the X-direction
460 12 Seismic Performance of Recycled Aggregate Concrete Structures

during the elastic analysis phase. It can reflect the actual seismic force distributionto some extents, and the influence of high-order vibration modes can be ignored.With the development of concrete cracks and non-elastic deformation of thestructure progressively, the influence of high-order vibration modes increasedgradually and the linearity no longer applies for the distribution of seismic force.Under the test phases with PGA from 0.066–0.185 g, the seismic force increasedprogressively with the gradually increasing acceleration amplitudes. The influenceof high-order vibration modes increased gradually after the input with PGA of0.370 g.
The maximum story displacement obtained from WCW, ELW, and SHW underthe test phases with PGA of 0.370 and 0.750 g was compared and is shown inFig. 12.26a, b, respectively. The input SHW stimulation causes the biggest struc-tural relative displacement response, followed by the WCW, while the ELW is thelowest. It is also found that the maximum story lateral displacement curves alongthe height show a shear-type distribution feature. Generally, the maximum storydisplacement curves are relatively smooth without obvious inflection points, whichmean that the distribution of equivalent stiffness along the height of the structure iswell proportioned.
The maximum values of inter-story drift ratios under different test phases arepresented in Table 12.18. From Table 12.18, it can be seen that the maximumcorresponding inter-story drift ratio is 1/266, 1/75, and 1/29 during earthquakesimulation tests with PGA of 0.130 g, 0.370 g and 0.750 g, respectively. Except forthe test phase with PGA of 0.130 g, the story drift of the second floor is bigger thanthat of all other floors under the same earthquake levels.
According to Eq. (12.4), the inter-story shear of the ith floor is derived asfollows:
(a) PGA of 0.370g (b) PGA of 0.750g
Fig. 12.26 Maximum story displacement
12.4 Shaking Table Test on Cast-in-Situ Space Frame 461

ViðtÞ ¼Xnj¼i
FjðtÞ ¼ �Xnj¼i
mj €xjðtÞþ€x0ðtÞ� � ð12:5Þ
where ViðtÞ is the inter-story shear of the ith floor at the time of t and n representsthe total number of floors in the structure. The other symbols share the samemeanings as in Eq. (12.5).
The maximum story shear distributions along the height in the X-direction aredemonstrated in Fig. 12.27. Through analysis of the inter-story shear forces of theRAC model as presented in Fig. 12.27, it can be proved that: In the elastic stage, the
Table 12.18 Maximum inter-story drift ratio
PAG (g) Floor
1 2 3 4 5 6 (roof)
0.130 1/405 1/280 1/266 1/292 1/444 1/844
0.370 1/89 1/75 1/100 1/116 1/182 1/455
0.415 1/67 1/58 1/82 1/101 1/188 1/426
0.550 1/38 1/34 1/58 1/88 1/164 1/300
0.750 1/29 1/29 1/41 1/61 1/111 1/293
(a) Under WCW (b) Under ELW
(c) Under SHW
Fig. 12.27 Distribution of inter-story shear force in X-direction
462 12 Seismic Performance of Recycled Aggregate Concrete Structures

maximum inter-story shear reduces proportionally along the height and increaseswith the gradually increasing acceleration amplitudes; but in the elastic–plasticstage, the variation trend is affected by the high-order vibration mode, and theinter-story shear may not strictly meet the distribution pattern.
The maximum shear coefficients (the maximum ratio of base shear to totalweight) for the RAC frame model structure are listed in Table 12.19. FromTable 12.19, it is found that the maximum base shear coefficients increase pro-gressively before 0.550 g test phase, however, decreases gradually during 0.550–1.170 g test phases. This phenomenon may result from the fact that RAC modelstructure was subjected to serious damages under the base excitations with PGA of0.550–0.750 g, and the influence of high-order vibration modes on the structuraldynamic response increases progressively.
According to the roof displacement in the X-direction and the correspondingbase shear of the model, the force–displacement relationships under the test 0.415 gand 0.750 g test phases, namely hysteresis curves, are obtained and shown inFig. 12.28.
The maximum base shear is close to the ultimate bearing capacity of thestructure when the maximum roof displacement reached 42.90 mm after theearthquake inputs with PGA of 0.415 g; the RAC frame model structure produced alarge elastic–plastic deformation when the maximum roof displacement reached
Table 12.19 Maximum ratioof base shear to total weightof the model
PGA (g) X-direction
Total base shear (kN) Shear coefficients (%)
0.370 70.35 51.60
0.415 73.66 54.02
0.550 72.80 53.40
0.750 68.47 50.22
1.170 57.46 42.14
(a) PGA of 0.415g (b) PGA of 0.750g
Fig. 12.28 Hysteresis curves in the X-direction
12.4 Shaking Table Test on Cast-in-Situ Space Frame 463
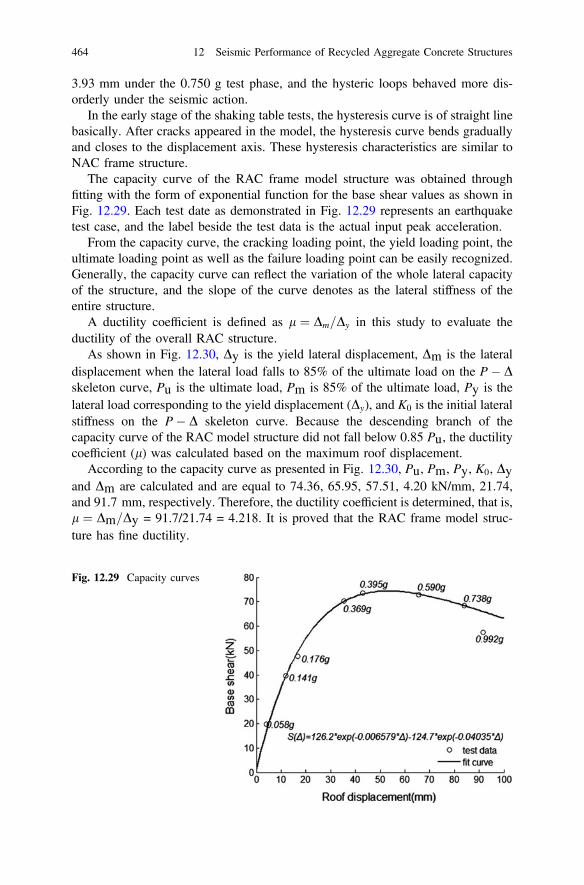
3.93 mm under the 0.750 g test phase, and the hysteric loops behaved more dis-orderly under the seismic action.
In the early stage of the shaking table tests, the hysteresis curve is of straight linebasically. After cracks appeared in the model, the hysteresis curve bends graduallyand closes to the displacement axis. These hysteresis characteristics are similar toNAC frame structure.
The capacity curve of the RAC frame model structure was obtained throughfitting with the form of exponential function for the base shear values as shown inFig. 12.29. Each test date as demonstrated in Fig. 12.29 represents an earthquaketest case, and the label beside the test data is the actual input peak acceleration.
From the capacity curve, the cracking loading point, the yield loading point, theultimate loading point as well as the failure loading point can be easily recognized.Generally, the capacity curve can reflect the variation of the whole lateral capacityof the structure, and the slope of the curve denotes as the lateral stiffness of theentire structure.
A ductility coefficient is defined as l ¼ Dm=Dy in this study to evaluate theductility of the overall RAC structure.
As shown in Fig. 12.30, Dy is the yield lateral displacement, Dm is the lateraldisplacement when the lateral load falls to 85% of the ultimate load on the P� Dskeleton curve, Pu is the ultimate load, Pm is 85% of the ultimate load, Py is thelateral load corresponding to the yield displacement (Dy), and K0 is the initial lateralstiffness on the P� D skeleton curve. Because the descending branch of thecapacity curve of the RAC model structure did not fall below 0.85 Pu, the ductilitycoefficient (l) was calculated based on the maximum roof displacement.
According to the capacity curve as presented in Fig. 12.30, Pu, Pm, Py, K0, Dyand Dm are calculated and are equal to 74.36, 65.95, 57.51, 4.20 kN/mm, 21.74,and 91.7 mm, respectively. Therefore, the ductility coefficient is determined, that is,l ¼ Dm=Dy = 91.7/21.74 = 4.218. It is proved that the RAC frame model struc-ture has fine ductility.
Fig. 12.29 Capacity curves
464 12 Seismic Performance of Recycled Aggregate Concrete Structures

The slope of the tangent of each point on the capacity curve is denoted as thelateral stiffness of the overall model structure. Figure 12.31 shows the degradationof the overall lateral stiffness of the structure, and the initial lateral stiffness K0 isequal to 4.20 kN/mm.
Figure 12.31 graphically illustrates that the overall lateral stiffness of the modelstructure obviously decreases at the beginning stage of the shaking table test. Whencracks appear, the lateral stiffness reduces to 69% of the initial value. After the RACframe model structure steps into nonlinear, the rate of lateral stiffness degenerationslows down and no abrupt changes are observed throughout the shaking table tests.
12.4.3 Nonlinear Analysis
1. Finite elements and mesh
The columns and beams are modeled by flexibility-based, two-node beam–
column fiber elements in OpenSees. The formulations of these elements are derived
Fig. 12.30 Definition ofductility coefficient
Fig. 12.31 Stiffnessdegradation
12.4 Shaking Table Test on Cast-in-Situ Space Frame 465
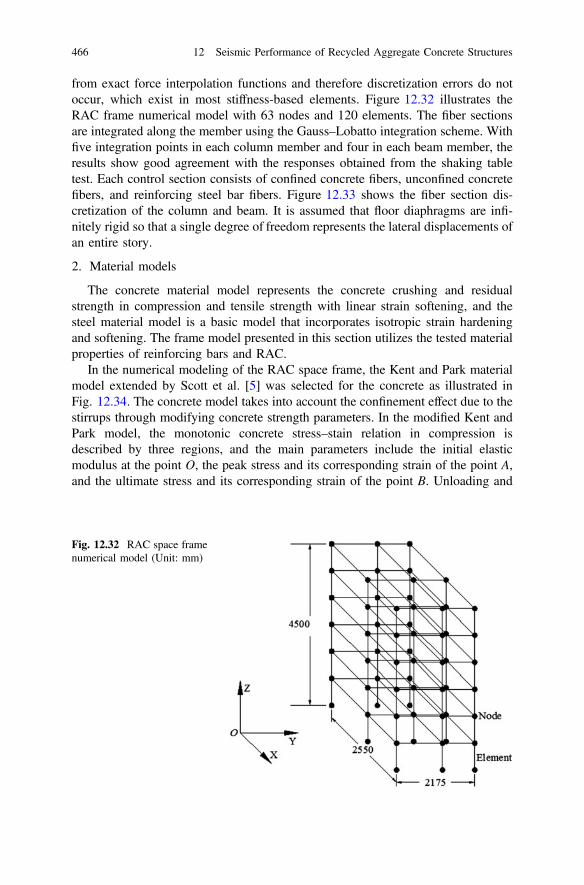
from exact force interpolation functions and therefore discretization errors do notoccur, which exist in most stiffness-based elements. Figure 12.32 illustrates theRAC frame numerical model with 63 nodes and 120 elements. The fiber sectionsare integrated along the member using the Gauss–Lobatto integration scheme. Withfive integration points in each column member and four in each beam member, theresults show good agreement with the responses obtained from the shaking tabletest. Each control section consists of confined concrete fibers, unconfined concretefibers, and reinforcing steel bar fibers. Figure 12.33 shows the fiber section dis-cretization of the column and beam. It is assumed that floor diaphragms are infi-nitely rigid so that a single degree of freedom represents the lateral displacements ofan entire story.
2. Material models
The concrete material model represents the concrete crushing and residualstrength in compression and tensile strength with linear strain softening, and thesteel material model is a basic model that incorporates isotropic strain hardeningand softening. The frame model presented in this section utilizes the tested materialproperties of reinforcing bars and RAC.
In the numerical modeling of the RAC space frame, the Kent and Park materialmodel extended by Scott et al. [5] was selected for the concrete as illustrated inFig. 12.34. The concrete model takes into account the confinement effect due to thestirrups through modifying concrete strength parameters. In the modified Kent andPark model, the monotonic concrete stress–stain relation in compression isdescribed by three regions, and the main parameters include the initial elasticmodulus at the point O, the peak stress and its corresponding strain of the point A,and the ultimate stress and its corresponding strain of the point B. Unloading and
Fig. 12.32 RAC space framenumerical model (Unit: mm)
466 12 Seismic Performance of Recycled Aggregate Concrete Structures
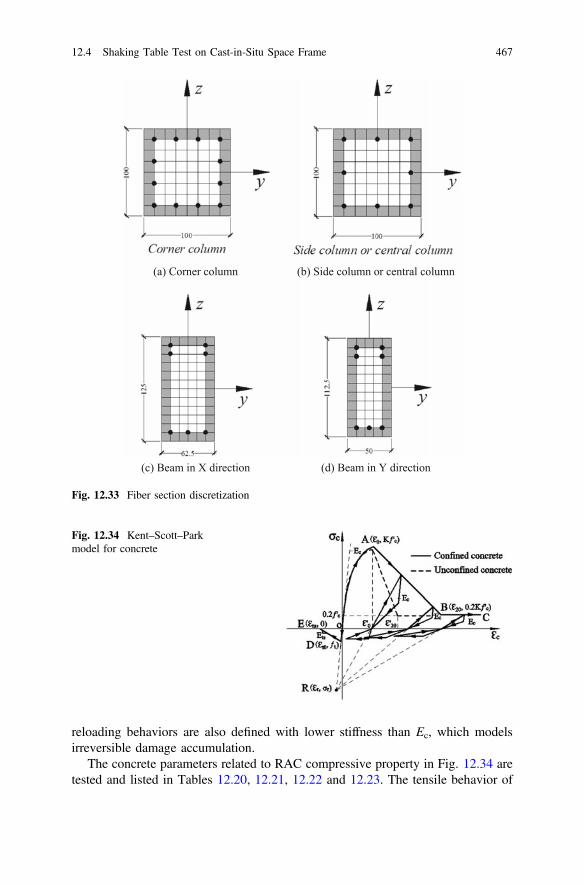
reloading behaviors are also defined with lower stiffness than Ec, which modelsirreversible damage accumulation.
The concrete parameters related to RAC compressive property in Fig. 12.34 aretested and listed in Tables 12.20, 12.21, 12.22 and 12.23. The tensile behavior of
(a) Corner column (b) Side column or central column
(c) Beam in X direction (d) Beam in Y direction
Fig. 12.33 Fiber section discretization
Fig. 12.34 Kent–Scott–Parkmodel for concrete
12.4 Shaking Table Test on Cast-in-Situ Space Frame 467
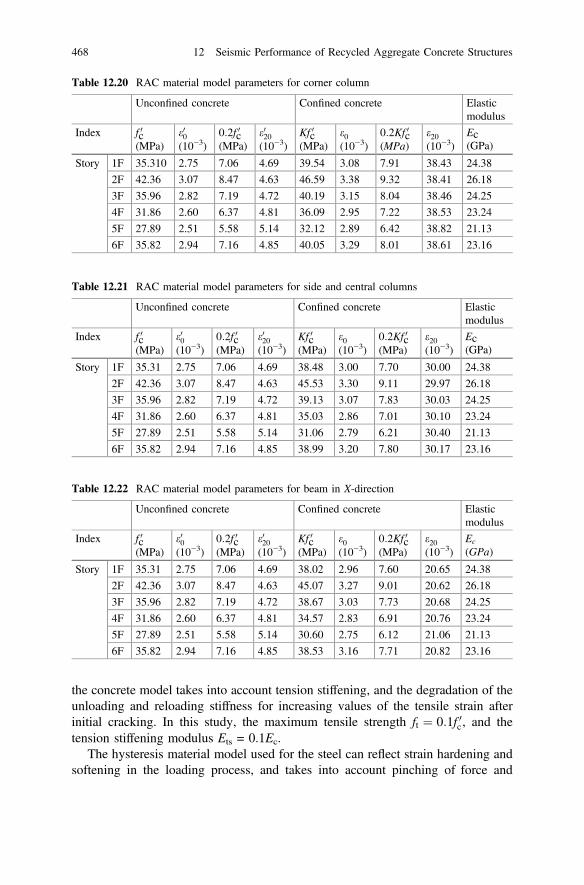
the concrete model takes into account tension stiffening, and the degradation of theunloading and reloading stiffness for increasing values of the tensile strain afterinitial cracking. In this study, the maximum tensile strength ft ¼ 0:1f 0c , and thetension stiffening modulus Ets = 0.1Ec.
The hysteresis material model used for the steel can reflect strain hardening andsoftening in the loading process, and takes into account pinching of force and
Table 12.20 RAC material model parameters for corner column
Unconfined concrete Confined concrete Elasticmodulus
Index f 0c(MPa)
e00(10−3)
0:2f 0c(MPa)
e020(10−3)
Kf 0c(MPa)
e0(10−3)
0:2Kf 0c(MPa)
e20(10−3)
Ec(GPa)
Story 1F 35.310 2.75 7.06 4.69 39.54 3.08 7.91 38.43 24.38
2F 42.36 3.07 8.47 4.63 46.59 3.38 9.32 38.41 26.18
3F 35.96 2.82 7.19 4.72 40.19 3.15 8.04 38.46 24.25
4F 31.86 2.60 6.37 4.81 36.09 2.95 7.22 38.53 23.24
5F 27.89 2.51 5.58 5.14 32.12 2.89 6.42 38.82 21.13
6F 35.82 2.94 7.16 4.85 40.05 3.29 8.01 38.61 23.16
Table 12.21 RAC material model parameters for side and central columns
Unconfined concrete Confined concrete Elasticmodulus
Index f 0c(MPa)
e00(10−3)
0:2f 0c(MPa)
e020(10−3)
Kf 0c(MPa)
e0(10−3)
0:2Kf 0c(MPa)
e20(10−3)
Ec(GPa)
Story 1F 35.31 2.75 7.06 4.69 38.48 3.00 7.70 30.00 24.38
2F 42.36 3.07 8.47 4.63 45.53 3.30 9.11 29.97 26.18
3F 35.96 2.82 7.19 4.72 39.13 3.07 7.83 30.03 24.25
4F 31.86 2.60 6.37 4.81 35.03 2.86 7.01 30.10 23.24
5F 27.89 2.51 5.58 5.14 31.06 2.79 6.21 30.40 21.13
6F 35.82 2.94 7.16 4.85 38.99 3.20 7.80 30.17 23.16
Table 12.22 RAC material model parameters for beam in X-direction
Unconfined concrete Confined concrete Elasticmodulus
Index f 0c(MPa)
e00(10−3)
0:2f 0c(MPa)
e020(10−3)
Kf 0c(MPa)
e0(10−3)
0:2Kf 0c(MPa)
e20(10−3)
Ec
(GPa)
Story 1F 35.31 2.75 7.06 4.69 38.02 2.96 7.60 20.65 24.38
2F 42.36 3.07 8.47 4.63 45.07 3.27 9.01 20.62 26.18
3F 35.96 2.82 7.19 4.72 38.67 3.03 7.73 20.68 24.25
4F 31.86 2.60 6.37 4.81 34.57 2.83 6.91 20.76 23.24
5F 27.89 2.51 5.58 5.14 30.60 2.75 6.12 21.06 21.13
6F 35.82 2.94 7.16 4.85 38.53 3.16 7.71 20.82 23.16
468 12 Seismic Performance of Recycled Aggregate Concrete Structures

deformation and unloading stiffness degradation based on the ductility, andinvolves a material damage model related to the material ductility and the energydissipation. The material model for the steel bar is shown in Fig. 12.35. As shownin Fig. 12.35a, (s1p, e1p), (s2p, e2p), and (s3p, e3p) represent stress and strain at first,second, and third point of the envelope in the positive direction, respectively,whereas (s1n, e1n), (s2n, e2n), and (s3n, e3n) represent stress and strain at first, secondand third point of the envelope in the negative direction, respectively. The steelrebar parameters related to Fig. 12.35a are tested and listed in Table 12.24.
In the steel model, the hysteresis behavior is described by a number of rules asshown in Fig. 12.35b. When loading from the point F, the strain changes from theoriginal point A to the point B resulting from the material damages. The strainamplification coefficient fdam is introduced to consider the variation of strain andexpressed as follows:
fdam ¼ Efdam2
EHþ fdam1ðuy � 1Þ ð12:6Þ
where fdam1 and fdam2 are input material ductility damage coefficient and materialenergy damage coefficient, respectively, E is the energy dissipation, EH is the totalhysteresis energy dissipation, and the uy is the ductility coefficient of the material.
The strain at the point B is then determined by:
eb ¼ eað1:0þ fdamÞ ð12:7Þ
The unloading stiffness of the hysteresis model is described by:
kunload ¼ kpE1p ð12:8Þ
kp ¼ ead1p
� �b
ð12:9Þ
Table 12.23 RAC material model parameters for beam in Y-direction
Unconfined concrete Confined concrete Elasticmodulus
Index f 0c(MPa)
e00(10−3)
0:2f 0c(MPa)
e020(10−3)
Kf 0c(MPa)
e0(10−3)
0:2Kf 0c(MPa)
e20(10−3)
Ec(GPa)
Story 1F 35.31 2.75 7.06 4.69 38.96 3.04 7.79 22.66 24.38
2F 42.36 3.07 8.47 4.63 46.01 3.34 9.20 22.63 26.18
3F 35.96 2.82 7.19 4.72 39.61 3.10 7.92 22.69 24.25
4F 31.86 2.60 6.37 4.81 35.51 2.90 7.10 22.76 23.24
5F 27.89 2.51 5.58 5.14 31.54 2.84 6.31 23.06 21.13
6F 35.82 2.94 7.16 4.85 39.47 3.24 7.89 22.83 23.16
12.4 Shaking Table Test on Cast-in-Situ Space Frame 469
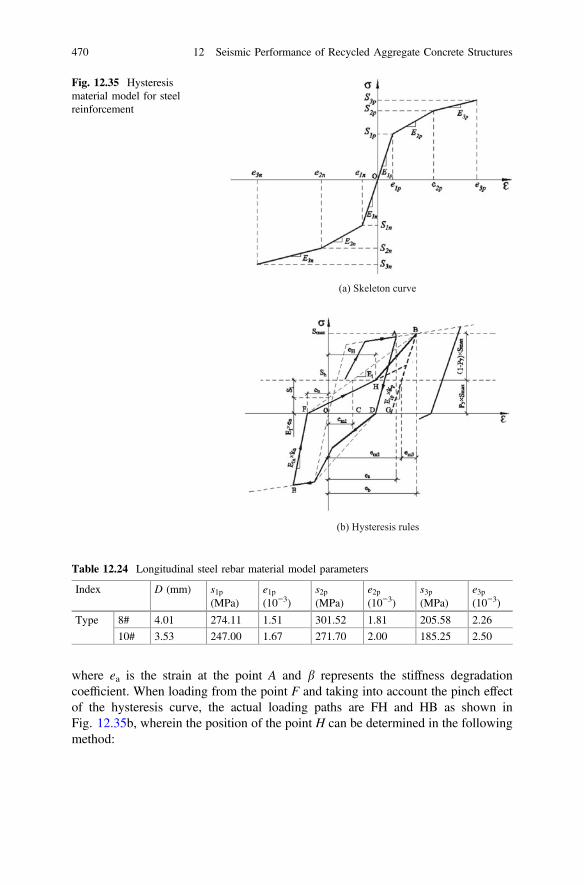
where ea is the strain at the point A and b represents the stiffness degradationcoefficient. When loading from the point F and taking into account the pinch effectof the hysteresis curve, the actual loading paths are FH and HB as shown inFig. 12.35b, wherein the position of the point H can be determined in the followingmethod:
(a) Skeleton curve
(b) Hysteresis rules
Fig. 12.35 Hysteresismaterial model for steelreinforcement
Table 12.24 Longitudinal steel rebar material model parameters
Index D (mm) s1p(MPa)
e1p(10−3)
s2p(MPa)
e2p(10−3)
s3p(MPa)
e3p(10−3)
Type 8# 4.01 274.11 1.51 301.52 1.81 205.58 2.26
10# 3.53 247.00 1.67 271.70 2.00 185.25 2.50
470 12 Seismic Performance of Recycled Aggregate Concrete Structures

Sh ¼ PySmax ð12:10Þ
S1 ¼ enE1 þPySmax ¼ enE1 þPyðeb � enÞE1 ð12:11Þ
em1 ¼ S1E1
¼ enþPyðeb � enÞ ð12:12Þ
em3 ¼ð1� PyÞSmax
kpE1pð12:13Þ
em2 ¼ eb � em3 ð12:14Þ
eH ¼ em1 þðem2 � em1ÞPx ð12:15Þ
where eH is the strain at the point H and Px and Py are the pinch factors of thestrain and the stress, respectively. The other symbols are explained in Fig. 12.35b.
3. Dynamic inputs
The same input earthquake waves and loading program as used in the shakingtable tests as mentioned above are followed in numerical modeling herein, so thatthe numerical and experimental results can be directly compared. Three earthquakewaves, i.e., the Wenchuan earthquake wave (WCW, 2008, N–S), the El Centroearthquake wave (ELW, 1940, N–S), and the Shanghai artificial wave (SHW), wereselected. The loading program consists of nine phases, that is, tests for peak groundacceleration (PGA) of 0.066, 0.130 g (frequently occurring earthquake of intensity8), 0.185, 0.264, 0.370 (basic occurring earthquake of intensity 8), 0.415, 0.550,0.750 (rarely occurring earthquake of intensity 8), and 1.17 g (rarely occurringearthquake of intensity 9). WCW, ELW, and SHW were input horizontally insequence in the different test phases. The gradually increasing amplitudes of baseexcitation were input successively in a manner of time-scaled earthquake waves.The test phase of SHW wave with PGA = 1.170 g was not input because of thedanger of possible collapse. After each dynamic time history analysis was com-pleted, a modal analysis was performed to capture the dynamic characteristicparameters of the numerical model, including natural frequencies and vibrationmodes.
4. Solution and convergence criteria
The implicit Newmark-b integration scheme is used in the dynamic nonlinearanalysis. A nonlinear solution method which accounts for the possible unbalance ofinternal forces between the different elements during the load step and an algorithmfor the efficient numerical implementation of this solution strategy was alreadyproposed in the earlier study. The finite element analysis program offers severalalternative strategies for the solution of the nonlinear global equilibrium equations.
12.4 Shaking Table Test on Cast-in-Situ Space Frame 471

In this study, the classical and the modified Newton–Raphson algorithms arecombined to be used. The energy increment is chosen as the convergence controlparameter. Convergence of iterations in a time step is reached when the ratiobetween the current work increment and the initial work increment is smaller than aspecified tolerance, namely
fDug ji
T ½K�j�1i fDug j
i
fDugj¼1i
h iT½K�j¼0
i fDugj¼1i
�Tol ðj[ 1Þ ð12:16Þ
where Duf g is the displacement increment vector, K½ � is the stiffness matrix, i is theith time step, and j is the jth iteration in the ith time step. Tol = 10−16 was used forall the simulations.
5. Validation of the numerical model
Structural dynamic characteristics are compared in Table 12.25 which shows thenatural frequencies of the first two vibration modes in both X- and Y-directions fromthe simulations and the shaking table tests. It can be seen that the calculatedfrequencies agree well with the experimental results. The first-order frequency inthe X-direction under different seismic inputs is mainly considered. The compar-isons between the tested and calculated natural frequency are displayed inFig. 12.36. As shown in Fig. 12.36, both the tested natural frequency and thecalculated results descend continuously during a series of base excitations withgradually increasing acceleration amplitudes subjected to different earthquakewaves under the test phases with PGA of 0.066–0.415 g. After 0.415 g test phase,the tested natural frequency still tends to decline, while the calculated naturalfrequency variation curve remains relatively steady. In general, among the threeearthquake waves, the best agreement between the calculated natural frequency andtested results is performed by WCW wave, followed by SHW and ELW waves,respectively, because of the different frequency spectrum characteristics of the threeearthquake waves. Most of the relative errors are less than 30%, and the maximumrelative error is 50.9% under ELW test phase with PGA of 1.170 g. This may bedue to the severe damage of the model when suffered from such a high PGAwhereas the calculation cannot take this damage into account very well [6].
Table 12.25 Natural frequency comparison between calculated and tested results
Items First-orderfrequency in theX-direction
First-orderfrequency in theY-direction
Second-orderfrequency in theX-direction
Second-orderfrequency in theY-direction
Tested 3.715 3.450 11.540 10.750
Calculated 3.756 3.392 11.432 10.486
Relativeerror (%)
1.1 1.7 0.9 2.5
*Relative error = (calculated value-tested value)/tested value
472 12 Seismic Performance of Recycled Aggregate Concrete Structures
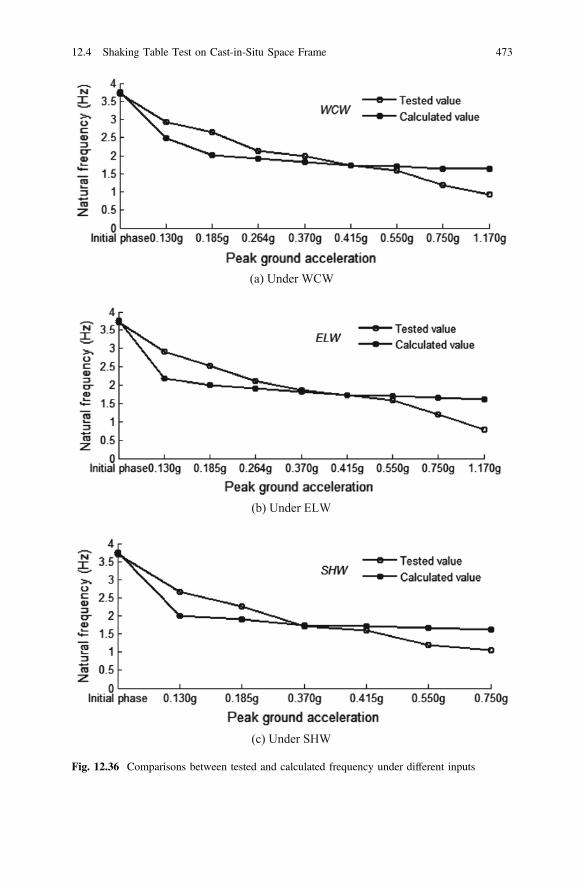
(b) Under ELW
(c) Under SHW
(a) Under WCW
Fig. 12.36 Comparisons between tested and calculated frequency under different inputs
12.4 Shaking Table Test on Cast-in-Situ Space Frame 473

The structural vibration modes obtained from shaking table tests and numericalanalysis under the initial test phase are shown in Fig. 12.37, respectively. Theresults show that numerical vibration modes are quite similar to the experimentalvibration modes, and the relative errors of the structural vibration mode coefficientsare within 19%. Both the tested and predicted first-order vibration modes inFig. 12.37 are all uniformly distributed along the height and show a typicalshear-type feature which usually occurs in a normal frame structure.
6. Validation of acceleration amplification factor
The acceleration amplification factors in linear elastic stage (0.066 g), crackingstage (0.130–0.185 g), yielding stage (0.370 g), maximum load stage (0.415 g),and severe damage stage (0.415–1.170 g) are shown in Fig. 12.38. As shown inFig. 12.38, the distribution forms of the acceleration amplification factors for boththe numerical model and the test model are in general similar: Accelerationamplification factor increases gradually along the floor with height under the sametest runs and decreases gradually with the increasing input ground motions, espe-cially in the early test stages when the PGA is low. This trend, however, is notstrictly followed in later stages with higher PGA, probably caused by the compli-cated higher vibration modes due to the accumulation of nonlinear damage in theframe. In the 0.066 g test phase, good agreement appears between the numericaland experimental results. Under the test phases from 0.130–0.185 g, most of therelative errors are less than 30%, and the maximum relative error is 36.8% at theroof under the 0.185 g test phase of ELW. The error between the numerical and theexperimental results is relatively large, and the maximum relative error exceeds50% in the serious elastic–plastic stage.
The errors may be due to the following facts: (1) the limitations of the model thatarise from inadvertent simplification of the actual behavior; (2) the complexity ofthe behavior of the reinforced concrete structure; and the uncertainty in the mea-surement of material properties and in the data acquisition during the test.
7. Validation of maximum story displacement
The maximum story displacements from numerical analysis and test are illus-trated in Fig. 12.39. Overall, the analytical and experimental relations comparereasonably well. In particular, in the stages of 0.066 g (elastic stage) and 0.130–0.185 g (cracking stage), the calculated maximum floor displacements more closelyreproduce the experimental response. The relative errors of the story displacementsare within 30%. The difference between the numerical and experimental resultsincreases as the input acceleration amplitudes increase gradually. However, thenumerical model captures the primary trend of story displacement distribution.
Both numerical and experimental results indicate that the structural displacementresponses of the RAC frame model behaved intensely with gradually increasingacceleration amplitudes. Both of the results demonstrate that different earthquakewaves slightly influenced the shape of the structural displacement response whilethey obviously influenced the amplitude of the structural displacement.
474 12 Seismic Performance of Recycled Aggregate Concrete Structures

(a) 1st order translational vibration mode in the X direction
(b) 2nd order translational vibration mode in the X direction
(c) 1st order translational vibration mode in the Y direction
(d) 2nd order translational vibration mode in the Y direction
Fig. 12.37 Vibration mode comparison between calculated and tested results under the initial testphase
12.4 Shaking Table Test on Cast-in-Situ Space Frame 475
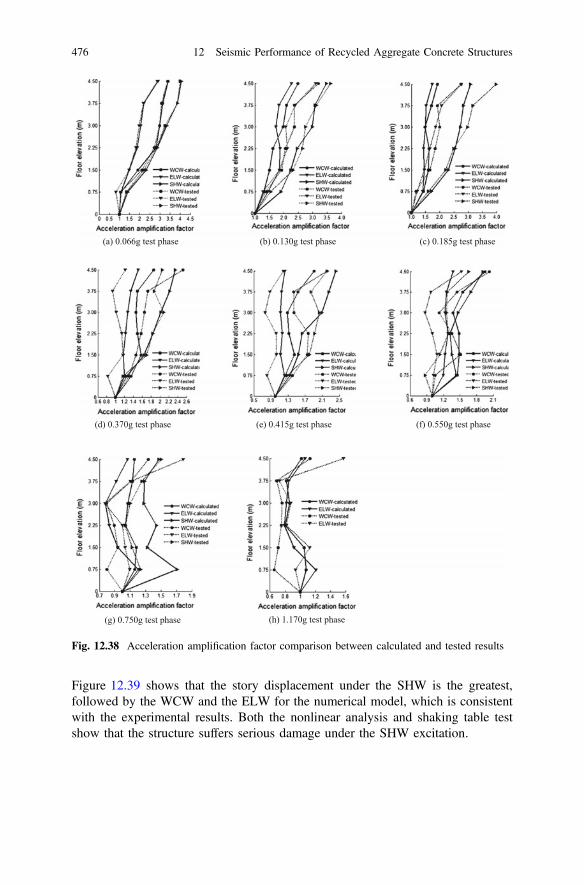
Figure 12.39 shows that the story displacement under the SHW is the greatest,followed by the WCW and the ELW for the numerical model, which is consistentwith the experimental results. Both the nonlinear analysis and shaking table testshow that the structure suffers serious damage under the SHW excitation.
(a) 0.066g test phase (b) 0.130g test phase (c) 0.185g test phase
(d) 0.370g test phase (e) 0.415g test phase (f) 0.550g test phase
(g) 0.750g test phase (h) 1.170g test phase
Fig. 12.38 Acceleration amplification factor comparison between calculated and tested results
476 12 Seismic Performance of Recycled Aggregate Concrete Structures
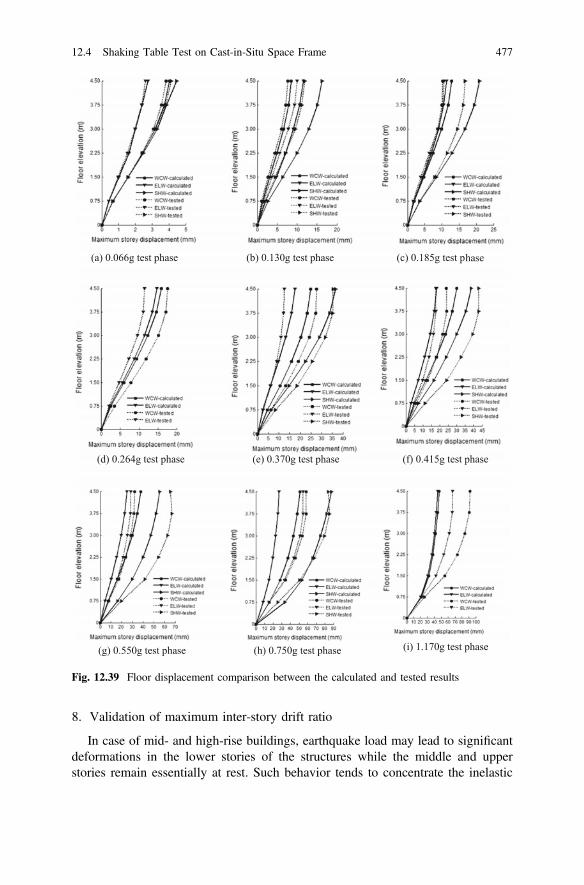
8. Validation of maximum inter-story drift ratio
In case of mid- and high-rise buildings, earthquake load may lead to significantdeformations in the lower stories of the structures while the middle and upperstories remain essentially at rest. Such behavior tends to concentrate the inelastic
(a) 0.066g test phase (b) 0.130g test phase (c) 0.185g test phase
(d) 0.264g test phase (e) 0.370g test phase (f) 0.415g test phase
(g) 0.550g test phase (h) 0.750g test phase (i) 1.170g test phase
Fig. 12.39 Floor displacement comparison between the calculated and tested results
12.4 Shaking Table Test on Cast-in-Situ Space Frame 477
behavior in the lower floors where the gravity loads are most significant. Thecross-sectional dimensions and reinforcements for each beam and column of theframe from floor 1 to the roof are the same. In addition, the structure is mainlycontrolled by the first vibration mode. Therefore, the lower stories of the structurewithstand greater seismic shear force than upper stories under the same groundmotion excitations and suffer more severe damage. Test results from Xiao et al. alsoshow that the first and the second story of the structure suffered more seriousdamage than other floors. Therefore, the inter-story drift of the first floor isinvestigated and discussed in this study.
The maximum inter-story drift ratios of the first floor obtained from numericaland experimental results are listed in Table 12.26, and the corresponding inter-storydrift ratio curves are illustrated in Fig. 12.40. As shown in Table 12.26 andFig. 12.40, the general variation trend between the calculated value and theexperimental result is that the relative error increases gradually with progressivelyenhancing acceleration amplitudes under different earthquake waves. Most of therelative error values are less than 30%, except for the 0.750 g test phase underELW, where the maximum relative error of the inter-story drift ratios between thenumerical and tested results approaches 45%. In general, the comparison resultbetween the calculated inter-story drift ratio and the experimental under WCWshows relatively better agreement than that under both ELW and SHW.
9. Summary
According to the results obtained from the nonlinear seismic response analysison the basis of OpenSees platform and the verification by results of shaking tabletest, it can be summarized that the nonlinear element type, section type, sectionbasic assumption, confined concrete material model, steel model, and analysiscomputational methods are reasonable and can reflect the structural responsebehavior. In general, most of the relative error values are less than 30% and thenumerical model captures the primary trend of the dynamic responses.
Based on many studies on development and validation on nonlinear dynamicanalysis in seismic performances, the numerical model developed in this studyshows good correlation with test results in terms of such parameters as the naturalfrequency and vibration mode, the acceleration amplification factor, the maximumstory displacement, and the inter-story drift. On the other hand, the causes of theerrors between numerical and tested results need further parametric studies due tothe complex interaction between ground motion features, structural properties andstructural response parameters, and the inelastic ductile behavior of structures towithstand severe earthquakes.
10. Comparison between calculated results of RAC and NAC space frame
Section 12.5 has demonstrated the capability of the numerical model of repro-ducing some key dynamic responses obtained from the shaking table tests underdifferent earthquake waves. It can now be applied in parametric studies. Herein our
478 12 Seismic Performance of Recycled Aggregate Concrete Structures
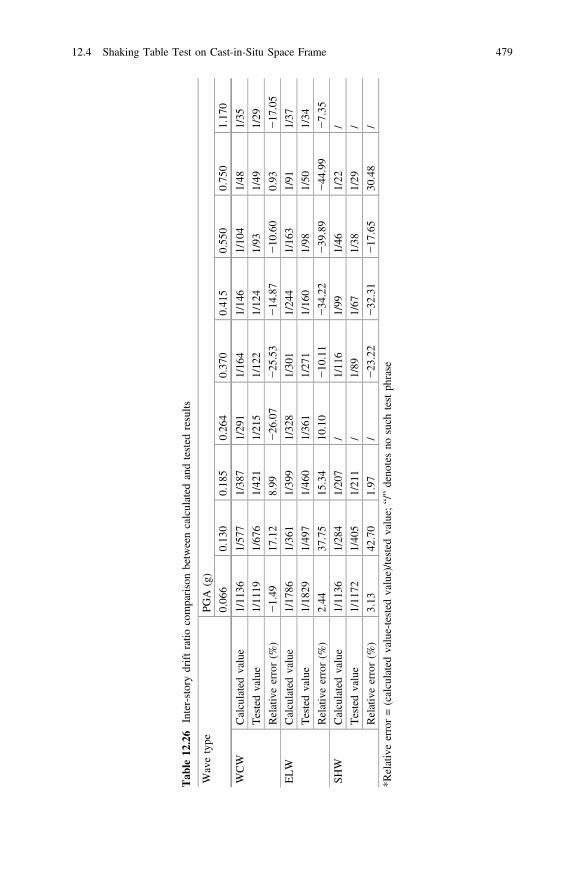
Tab
le12
.26
Inter-storydriftratio
comparisonbetweencalculated
andtested
results
Wavetype
PGA
(g)
0.06
60.13
00.18
50.26
40.37
00.41
50.55
00.75
01.17
0
WCW
Calculatedvalue
1/11
361/57
71/38
71/29
11/16
41/14
61/10
41/48
1/35
Testedvalue
1/11
191/67
61/42
11/21
51/12
21/12
41/93
1/49
1/29
Relativeerror(%
)−1.49
17.12
8.99
−26
.07
−25
.53
−14
.87
−10
.60
0.93
−17
.05
ELW
Calculatedvalue
1/17
861/36
11/39
91/32
81/30
11/24
41/16
31/91
1/37
Testedvalue
1/18
291/49
71/46
01/36
11/27
11/16
01/98
1/50
1/34
Relativeerror(%
)2.44
37.75
15.34
10.10
−10
.11
−34
.22
−39
.89
−44
.99
−7.35
SHW
Calculatedvalue
1/11
361/28
41/20
7/
1/11
61/99
1/46
1/22
/
Testedvalue
1/11
721/40
51/21
1/
1/89
1/67
1/38
1/29
/
Relativeerror(%
)3.13
42.70
1.97
/−23
.22
−32
.31
−17
.65
30.48
/
*Relativeerror=(calculatedvalue-tested
value)/tested
value;
“/”deno
tesno
such
testph
rase
12.4 Shaking Table Test on Cast-in-Situ Space Frame 479

particular interests are the effects of the replacement of NAC by RAC and thus thedifferent material properties on the seismic performances of the space frame. Thesame space frame was modeled again using the exact same mesh, constitutivemodels, and loading phases, except that stronger material properties were used tosimulate NAC instead of RAC. Based on the authors’ previous research by Xiaoet al., a 45% higher initial elastic modulus and a 20% lower peak strain (at the pointA in Fig. 12.34) than those of RAC were adopted to model NAC, whereas otherproperties of materials remained unchanged. The natural frequency, the structuralvibration mode, the acceleration amplification factor, the story displacement, and theinter-story drift of the NAC frame are compared below with those of the RAC frame.
11. Comparison of acceleration response
Figure 12.41 illustrates a comparison of calculated acceleration amplificationfactors of the RAC and NAC models in the linear elastic stage (0.066 g), crackingstage (0.185 g), yielding stage (0.370 g), maximum load stage (0.415 g), andultimate damage stage (0.550–1.170 g). It can be seen that the accelerationamplification factors for both the RAC model and the NAC model have the similardistribution feature (as mentioned in Sect. 5.2) under different test phases. Asshown in Fig. 12.41, except for a few acceleration measurement points, most of the
(a) Under WCW (b) Under ELW
(c) Under SHW
Fig. 12.40 Inter-story drift comparison between calculated and tested results
480 12 Seismic Performance of Recycled Aggregate Concrete Structures
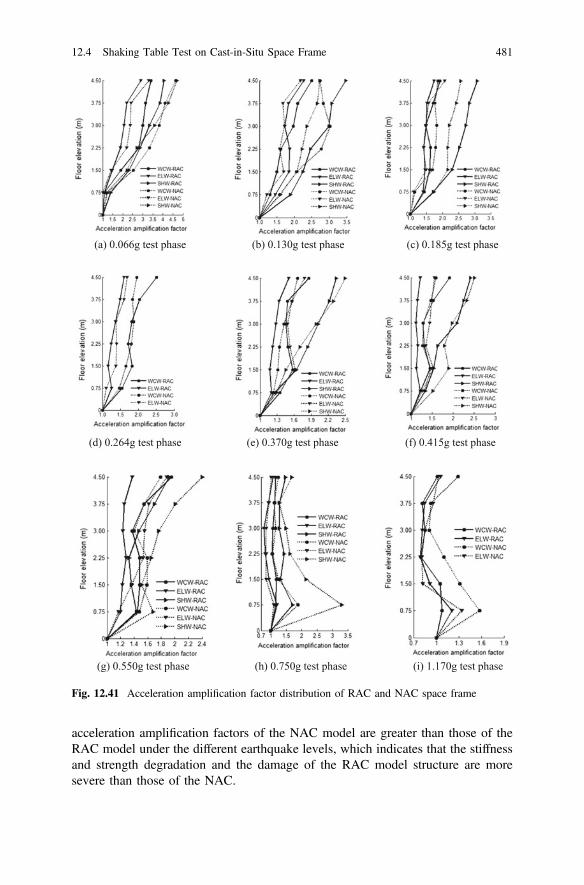
acceleration amplification factors of the NAC model are greater than those of theRAC model under the different earthquake levels, which indicates that the stiffnessand strength degradation and the damage of the RAC model structure are moresevere than those of the NAC.
(a) 0.066g test phase (b) 0.130g test phase (c) 0.185g test phase
(d) 0.264g test phase (e) 0.370g test phase (f) 0.415g test phase
(g) 0.550g test phase (h) 0.750g test phase (i) 1.170g test phase
Fig. 12.41 Acceleration amplification factor distribution of RAC and NAC space frame
12.4 Shaking Table Test on Cast-in-Situ Space Frame 481

(a) 0.066g test phase (b) 0.130g test phase (c) 0.185g test phase
(d) 0.264g test phase (e) 0.370g test phase (f) 0.415g test phase
(g) 0.550g test phase (h) 0.750g test phase (i) 1.170g test phase
Fig. 12.42 Maximum floor displacement comparison between RAC and NAC space frames
482 12 Seismic Performance of Recycled Aggregate Concrete Structures

12. Comparison of story displacement
The maximum story displacements under different test phases for the RAC andNAC frame model are compared in Fig. 12.42. Except in the test phases of 0.750 gand the 1.170 g under which the maximum story displacement of the first floor ofthe RAC frame model is smaller than that of the NAC frame model, the maximumstory displacement of each floor of the RAC numerical model is in general largerthan that of the NAC numerical model under the other test phases. The maximumdifference of the maximum story displacement between the RAC and NAC framesis 48.6% for the first floor and 46.6% for the second floor at the 0.130 g test phasewith ELW, 6.1% for the third floor at the 0.185 g test phase with ELW, and 46.2,46.2, and 46.3%, for the fourth, fifth, and sixth floor, respectively, at the 0.130 gtest phase with SHW. These relative errors are almost coincided with the differenceof initial elastic modulus between RAC and NAC. The reason is that the structurestill responses in the elastic stage under these test phases so the stiffness plays animportant role with deformation.
Generally, both maximum story displacement curves are relatively smoothwithout obvious inflexions, which means that the distribution of the equivalentrigidity along the height of the structure is well proportioned. Both story dis-placement curves along the height reflect the type of shear pattern.
Comparison of maximum inter-story drift ratio
The maximum inter-story drift ratios of the first floor obtained from RAC andNAC frame numerical model are listed in Table 12.27, and the correspondinginter-story drift ratio curves are illustrated in Fig. 12.43. As shown in Table 12.27and Fig. 12.43, generally, the inter-story drift ratios of the RAC space frame underWCW, ELW, and SHW are larger than those of the NAC space frame during the
Table 12.27 Maximuminter-story drift ratioscomparison between RACand NAC frames
PGA(g)
Maximum inter-story drift ratio (inter-storydrift/inter-story height)
RAC NAC
WCW ELW SHW WCW ELW SHW
0.066 1/1136 1/1786 1/1136 1/1384 1/2679 1/1659
0.130 1/577 1/361 1/284 1/520 1/703 1/519
0.185 1/387 1/399 1/207 1/513 1/740 1/382
0.264 1/291 1/328 / 1/398 1/374 /
0.370 1/164 1/301 1/116 1/226 1/300 1/162
0.415 1/146 1/244 1/99 1/232 1/208 1/141
0.550 1/104 1/163 1/46 1/175 1/148 1/64
0.750 1/48 1/91 1/22 1/48 1/89 1/19
1.170 1/35 1/37 / 1/26 1/34 /
“/” denotes no such test phrase
12.4 Shaking Table Test on Cast-in-Situ Space Frame 483

test phases from 0.066–0.550 g, respectively. However, after the 0.550 g test phase,the inter-story drift ratios of the RAC frame structure become smaller than those ofthe NAC frame structure. Among the three earthquake waves, the seismic responsecaused by SHW is the largest, followed by WCW and ELW. The seismic behaviorsfor both the RAC and NAC space frames are similar. However, from the nonlinearanalysis, the aseismic capacity of the NAC frame is better than that of the RACframe in the early stage (0.066–0.550 g test phases), and they behave almost thesame in the severe elastic–plastic response stage (0.750–1.170 g test phases).
12.5 Shaking Table Test on Precast Space Frame
12.5.1 Experimental Program
12.5.1.1 Precast RAC frame model
The tested model was designed by scaling down the geometric from prototypestructure and the dimension scaling parameter was taken as 1:4 due to the limitationof shake-table parameters of the test setup in Tongji University. The model wasdesigned with Chinese Standard GB50010-2002 code and the beam-column joints
(a) Under WCW (b) Under ELW
(c) Under SHW
Fig. 12.43 Maximum inter-story drift ratios comparison between RAC and NAC space frames
484 12 Seismic Performance of Recycled Aggregate Concrete Structures

were cast-in-place based on emulation approach [7–9] (Park 1986; Ericson andWarnes 1990; Mujumdar et al. 2001). Based on dimensional analysis-Buckingham’sPi theorem [10] (Buckingham 1914) and similitude requirements for dynamicloading, the variables that govern the behavior of vibrating structures reveals that inaddition to length (l) and force (F), which are considered in static load situations,now the time (t) must be included as one of the fundamental quantities. Therefore, itis logical to choose Sl, SE and Sa. The remaining scale factors are then calculated andgiven in Table 12.28. It is well-known that the shaking table test is conducted on theearth, so the gravity acceleration applied in the model and prototype are the same[11] (Andreas et al. 2010). So the similarity coefficient of gravity acceleration equals1. Based on the similarity coefficient, the time interval of original seismic waves wasscaled by 0.368.
The recycled aggregate concrete mixture of nominal strength grade C30 wasproportioned with the recycled coarse aggregates (RCA) replacement percentage equalto 100%. The mix proportion is water: cement: sand: RCA = 1:1.859:3.202:4.554.The fine iron wires of 8# (diameter of 3.94 mm) and 10# (diameter of 3.32 mm) wereadopted as the longitudinal reinforcement and 14# (diameter of 2.32 mm) fortransversal reinforcement in this model. The measured average mechanical propertiesof the fine iron wires are presented in Table 12.29.
The tested model was a two-bay, two-span and six-story frame structure regularin elevation. The RAC frame model was 2175 � 2550 mm in plan and had aconstant story height of 750 mm. Column sections were square with 100 mmdeep. The beams were 125 mm deep by 50 mm wide, cast monolithically with a
Table 12.28 Similitude factors between the prototype and the test model
Item Parameter Formula Relationship Remark
Geometry Length Sl 0.25 Control thedimension
Displacement Sd = Sl 0.25
Physics Elastic modulus SE 1.00 Control thematerialStress Sr = SE 1.00
Poisson’s ratio St 1.00
Strain Se = Sr/SE 1.00
Mass density Sq = Sr/SaSl 2.165
Mass Sm = SESl2/Sa 0.034
Load Area load Sp =Sr 1.00
Concentrated force SF = SESl2 0.063
Dynamiccharacteristics
Period St = Sl1/2/Sa
1/2 0.368
Frequency Sf ¼ S�1=2l =S�1=2
a 2.719
Velocity Sv = Sl1/2 ∙ Sa
1/2 0.680
Acceleration Sa 1.848 Control theshaking tabletest
Acceleration ofgravity
Sg 1.00
12.5 Shaking Table Test on Precast Space Frame 485

30 mm deep slab. The beams were doubly reinforced at the top and bottom. Thedetails of the general geometry, the element sections and the corresponding rein-forcements of the precast beams and columns in both X and Y-directions are shownin Fig. 12.44a–d. The details of the reinforcing bars in the beam-column joints bythe front view are shown in Fig. 12.44e.
An additional mass of 1528 kg was uniformly distributed to each slab from the1st to 5th floors, and 1375 kg to the roof with iron blocks and plates to simulatemass density and loading conditions based on calculation by similarity coefficientpresented in Table 12.28. The total mass of the model was estimated to be17,000 kg including the base beams, which was less than the capacity limitation ofthe shaking table.
12.5.1.2 Fabrication and construction of the model
The process of producing the model included two stages: (1) fabricate beam andcolumn elements in a factory, and (2) construct the precast model in the lab. Theprecast RAC elements consisted of 54 columns and 72 beams. The fabricationprocess was the same for two types of components. Firstly, reinforcing bars of bothcomponents were assembled into the reinforcing cages. Then the reinforcing cageswere placed into the wooden forms which were coated with form oil. All compo-nents were ready for pouring as presented in Fig. 12.45a–d. Ready-mix recycledconcrete grade of C30 was casted for all the specimens. The specimens were curedat the ambient temperature for 28 days and transported to the construction site in thelab.
Single story columns were erected at each floor level and the beams were seatedon the head of columns by beam rear. The continuity of longitudinal reinforcementthrough the beam-column joint was designed and connected by welding to ensurerigid beam-column connections. Three typical joints of the model were captured inFig. 12.46. With this method of precast construction, the model was erected onefloor at a time with beams placed at the head of columns on the one level floorbefore the columns of the upper level floor were erected, then two layers of slabreinforcement were fixed in the forms, and RAC was cast-in-place for the joints andslabs. The process of construction is shown step by step in Fig. 12.47.
Table 12.29 Mechanical properties of reinforcement
Specifications Diameter(mm)
Yield strength(MPa)
Ultimate strength(MPa)
Elastic modulus(GPa)
8# 3.94 358 407 200
10# 3.32 306 388 200
14# 2.32 252 363 200
486 12 Seismic Performance of Recycled Aggregate Concrete Structures

(a) Plan view (b) Elevation view
C B A
3
2
1
Frame 3
Fram
e A
Fram
e B
Fram
e C
Frame 2
Frame 1
X
Y
BC
±0.000
+0.750
+1.500
+2.250
+3.000
+3.750
+4.500
-0.300
A
(c) Reinforcement of beam sections
(d) Reinforcement of column sections
(e) Details of joints
16
18
12*
21
20
Beam section of Frame 1, 2, 3
A to B axis B to C axis
Beam section of Frame A, B, C
1 to 2 axis 2 to 3 axis
12
12*
10
15
13
Section of corner columns
Even floorsOdd floors
3b
3
3a
2
1
8
8b 8a
5
3c
3
8
10
8c
Section of central and side columns
Even floorsOdd floors
10
Interior jointsCorner joints Exterior joints
1 2
3
12 20 21
5
3
3
10
12 22 23
5
3
3
14
12 22 24
11
122224
Welding
10
Welding
Fig. 12.44 Configuration and reinforcement of the model
12.5 Shaking Table Test on Precast Space Frame 487

12.5.1.3 Instruments
In order to measure the acceleration and displacement which are considered as basicdata for the interpretation and analysis of test results, the instruments were set up onthe model. As shown in Fig. 12.48, a total of 30 accelerometers were installed, with2 on the ground floor on both the X and Y-directions, 4 on each floor from the 1st to
(a) Beam forms (b) Precast beams
(c) Column forms (d) Precast columns
Fig. 12.45 Process of fabrication precast elements
(a) Corner joint (b) Side joint (c) Central joint
Fig. 12.46 Configuration of joints assembled
(a) Lay up precast RAC beams and
columns (b) Welding rebars of joints
(c) Pouring RAC for joints and
slabs
Fig. 12.47 Process of construction
488 12 Seismic Performance of Recycled Aggregate Concrete Structures
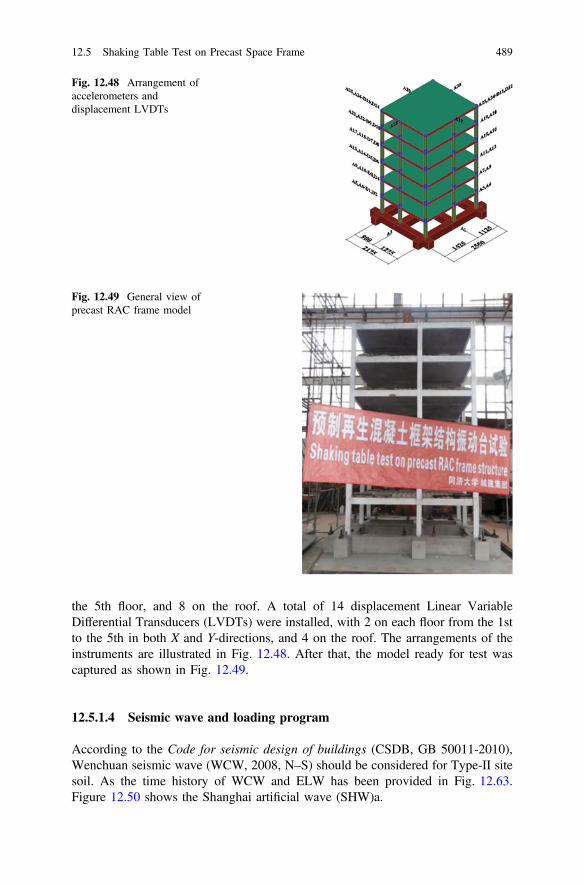
the 5th floor, and 8 on the roof. A total of 14 displacement Linear VariableDifferential Transducers (LVDTs) were installed, with 2 on each floor from the 1stto the 5th in both X and Y-directions, and 4 on the roof. The arrangements of theinstruments are illustrated in Fig. 12.48. After that, the model ready for test wascaptured as shown in Fig. 12.49.
12.5.1.4 Seismic wave and loading program
According to the Code for seismic design of buildings (CSDB, GB 50011-2010),Wenchuan seismic wave (WCW, 2008, N–S) should be considered for Type-II sitesoil. As the time history of WCW and ELW has been provided in Fig. 12.63.Figure 12.50 shows the Shanghai artificial wave (SHW)a.
Fig. 12.48 Arrangement ofaccelerometers anddisplacement LVDTs
Fig. 12.49 General view ofprecast RAC frame model
12.5 Shaking Table Test on Precast Space Frame 489

The test program consisted of 8 phases, that is, tests for Peak GroundAcceleration (PGA) of 0.066, 0.130 g (frequently occurring earthquake of intensity8), 0.185, 0.264, 0.370 g (moderately occurring earthquake of intensity 8), 0.415,0.550, 0.750 g (rarely occurring earthquake of intensity 8) were set to evaluate theoverall capacity and investigate the dynamic response of the precast RAC framestructure. WCW, ELW and SHW were inputted in sequence during the test process.After each level of ground acceleration were input in the X-direction, a white noisewas scanned in both X and Y-directions to determine the natural frequencies and thedamping ratios of the model structure. And in this case, the peak value of thewhite-noise input was designed as 0.05 g. The detailed test information is presentedin Table 12.30.
12.5.2 Test Results and Analysis
12.5.2.1 Cracking and failure pattern
Based on observing the progress of cracking after each test phase and the final stateof the model, the cracking propagation and width of cracks were recordedthroughout the shake table test with gradually increasing PGA amplitude of inputmotions. During the elastic stage with PGAs from 0.066 to 0.130 g, no visiblecracks appeared. Since the precast model stepped into the cracking stage with PGAsfrom 0.185 to 0.370 g, the cracks on the beams of the 1st and 2nd floor, wereclearly seen and propagated quickly. There were also some cracks at the foot ofcolumns of the 2nd floor with the crack width around 0.1 mm. The test phases withPGAs from 0.415 to 0.750 g indicated the damage and failure stage because theappearance of long and wide cracks as well as the crushing of concrete was found,which denoted relative obvious and serious damage. In particular, the first diagonalcracks appeared at joints of 1st and 2nd floor and the width of crack at the end ofthe beam reached 2 mm. Vertical flexural cracks appeared at the ends of beams on
(a) Time history of SHW (b) Fourier spectrum of SHW
Fig. 12.50 Earthquake input motions (the PGA s of original waves were scaled to 0.1 g)
490 12 Seismic Performance of Recycled Aggregate Concrete Structures
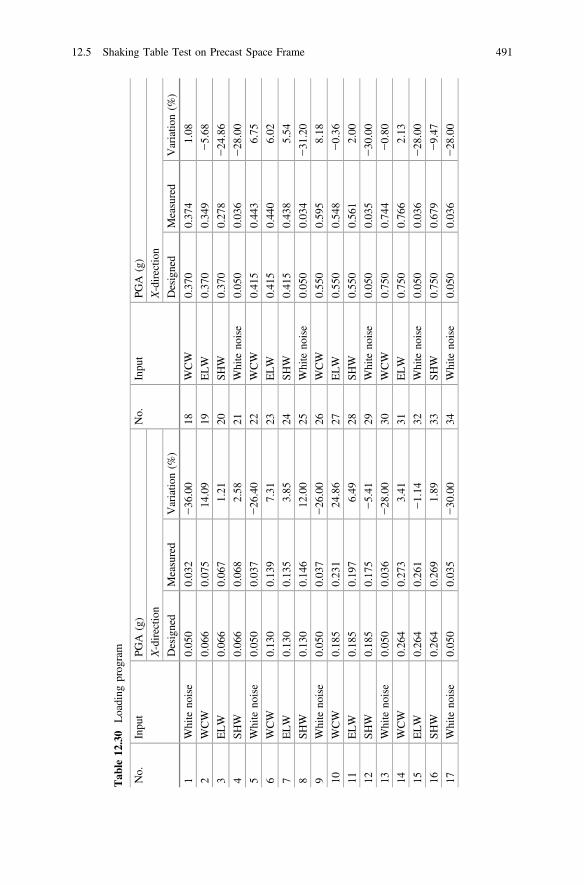
Tab
le12
.30
Loading
prog
ram
No.
Inpu
tPG
A(g)
No.
Inpu
tPG
A(g)
X-directio
nX-directio
n
Designed
Measured
Variatio
n(%
)Designed
Measured
Variatio
n(%
)
1White
noise
0.05
00.03
2−36
.00
18WCW
0.37
00.37
41.08
2WCW
0.06
60.07
514
.09
19ELW
0.37
00.34
9−5.68
3ELW
0.06
60.06
71.21
20SH
W0.37
00.27
8−24
.86
4SH
W0.06
60.06
82.58
21White
noise
0.05
00.03
6−28
.00
5White
noise
0.05
00.03
7−26
.40
22WCW
0.41
50.44
36.75
6WCW
0.13
00.13
97.31
23ELW
0.41
50.44
06.02
7ELW
0.13
00.13
53.85
24SH
W0.41
50.43
85.54
8SH
W0.13
00.14
612
.00
25White
noise
0.05
00.03
4−31
.20
9White
noise
0.05
00.03
7−26
.00
26WCW
0.55
00.59
58.18
10WCW
0.18
50.23
124
.86
27ELW
0.55
00.54
8−0.36
11ELW
0.18
50.19
76.49
28SH
W0.55
00.56
12.00
12SH
W0.18
50.17
5−5.41
29White
noise
0.05
00.03
5−30
.00
13White
noise
0.05
00.03
6−28
.00
30WCW
0.75
00.74
4−0.80
14WCW
0.26
40.27
33.41
31ELW
0.75
00.76
62.13
15ELW
0.26
40.26
1−1.14
32White
noise
0.05
00.03
6−28
.00
16SH
W0.26
40.26
91.89
33SH
W0.75
00.67
9−9.47
17White
noise
0.05
00.03
5−30
.00
34White
noise
0.05
00.03
6−28
.00
12.5 Shaking Table Test on Precast Space Frame 491
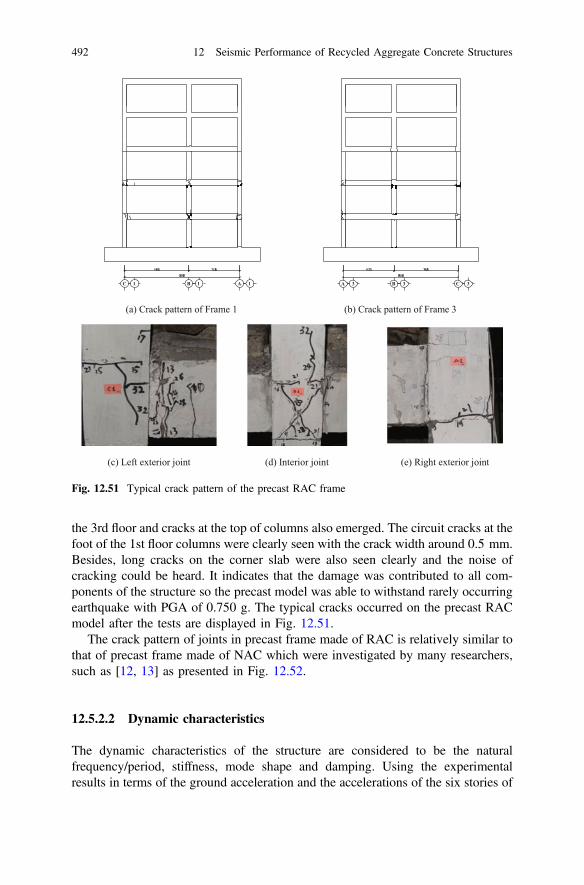
the 3rd floor and cracks at the top of columns also emerged. The circuit cracks at thefoot of the 1st floor columns were clearly seen with the crack width around 0.5 mm.Besides, long cracks on the corner slab were also seen clearly and the noise ofcracking could be heard. It indicates that the damage was contributed to all com-ponents of the structure so the precast model was able to withstand rarely occurringearthquake with PGA of 0.750 g. The typical cracks occurred on the precast RACmodel after the tests are displayed in Fig. 12.51.
The crack pattern of joints in precast frame made of RAC is relatively similar tothat of precast frame made of NAC which were investigated by many researchers,such as [12, 13] as presented in Fig. 12.52.
12.5.2.2 Dynamic characteristics
The dynamic characteristics of the structure are considered to be the naturalfrequency/period, stiffness, mode shape and damping. Using the experimentalresults in terms of the ground acceleration and the accelerations of the six stories of
(a) Crack pattern of Frame 1 (b) Crack pattern of Frame 3
(c) Left exterior joint (d) Interior joint (e) Right exterior joint
ABC 1 1 1 A B C3 3 3
Fig. 12.51 Typical crack pattern of the precast RAC frame
492 12 Seismic Performance of Recycled Aggregate Concrete Structures
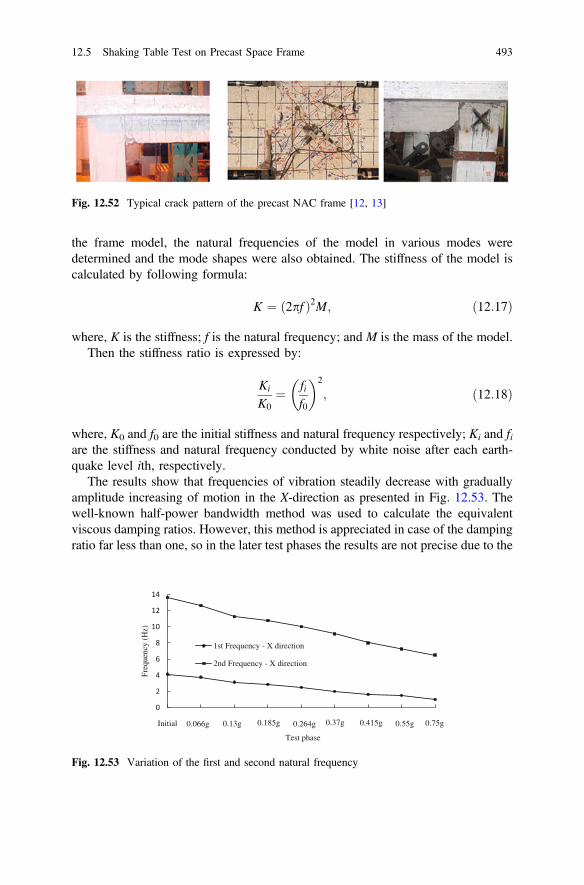
the frame model, the natural frequencies of the model in various modes weredetermined and the mode shapes were also obtained. The stiffness of the model iscalculated by following formula:
K ¼ ð2pf Þ2M; ð12:17Þ
where, K is the stiffness; f is the natural frequency; and M is the mass of the model.Then the stiffness ratio is expressed by:
Ki
K0¼ fi
f0
� �2
; ð12:18Þ
where, K0 and f0 are the initial stiffness and natural frequency respectively; Ki and fiare the stiffness and natural frequency conducted by white noise after each earth-quake level ith, respectively.
The results show that frequencies of vibration steadily decrease with graduallyamplitude increasing of motion in the X-direction as presented in Fig. 12.53. Thewell-known half-power bandwidth method was used to calculate the equivalentviscous damping ratios. However, this method is appreciated in case of the dampingratio far less than one, so in the later test phases the results are not precise due to the
Fig. 12.52 Typical crack pattern of the precast NAC frame [12, 13]
0
2
4
6
8
10
12
14
Freq
uenc
y (H
z)
Test phase
1st Frequency - X direction
2nd Frequency - X direction
Initial 0.75g0.55g0.415g0.37g0.264g0.185g0.13g0.066g
Fig. 12.53 Variation of the first and second natural frequency
12.5 Shaking Table Test on Precast Space Frame 493

high damping ratio of the model in the nonlinear range. Thus, the values ofdamping ratios which are extremely high in the later test phases are presented hereinonly as references. The damping ratios increase more rapidly in the X-direction inthe later test phases as given in Table 12.31.
It can be seen from Fig. 12.54 that the damping ratio increases as the frequencydecreases whereas the stiffness ratio decreases. After the test phase with PGA of0.185 g, the frequency reduced to 2.875 Hz and the damping ratio increased rel-atively rapidly, especially after the 0.370 g test phase, because the structure steppedinto an inelastic stage. It helps reduce the energy of seismic input at a faster ratethan the reduction in stiffness, so the structure will be safe in a strong earthquake.The model then simply readjusted itself to oscillate in an elastic manner around newequilibrium position having a reduced stiffness and an increased damping with acertain frequency as shown in Fig. 12.54. For an example, the initially equilibriumposition is verified with the first natural frequency of 4.125 Hz and correspondingwith the damping ratio of 0.040. After the test phase with PGA of 0.066 g, theequilibrium position is verified with the first natural frequency of 3.750 Hz andcorresponding with the damping ratio of 0.051 and stiffness ratio of 0.826 and soon. However, from the test phase with PGA of 0.185 g, the damage was visible andthe damaged model was continuously carried out with higher PGAs. Therefore, theexisted damaged of the model caused influences on the natural frequency of the
Table 12.31 Natural frequency, damping ratio and stiffness ratio in the X-direction
PGA (g) Initial 0.066 0.130 0.185 0.264 0.370 0.415 0.550 0.750
1st frequency (Hz) 4.125 3.75 3.125 2.875 2.50 2.125 1.75 1.625 1.00
2nd frequency (Hz) 13.625 12.625 11.25 10.75 9.875 9.125 8.00 7.25 6.75
Damping ratio 0.040 0.051 0.060 0.055 0.096 0.192 0.234 0.330 0.451
Stiffness ratio 1 0.826 0.574 0.486 0.367 0.235 0.155 0.132 0.059
(Initial)
(0.066g)
(0.130g)
(0.185g)
(0.264g)
(0.370g)
(0.550g)(0.415g)
(0.750g)0.00
0.20
0.40
0.60
0.80
1.00
1.001.502.002.503.003.504.00
Rat
io
Frequency (Hz)
Damping ratio-X
Stiffness ratio -X
Fig. 12.54 Damping andstiffness ratio versusfrequency in X-direction
494 12 Seismic Performance of Recycled Aggregate Concrete Structures

model. It can be considered that the model tested (from PGAs of 0.185 g) has ahigher damping ratio than that of the initial model. It is likely to cause the reductionof frequency compared to the result if it would be obtained from test on the initialmodel.
The first two vibration modes in the X-direction are shown in Fig. 12.55. It canbe seen that the lateral stiffness uniformly distributes along the height and thefirst-order vibration mode shows a shear-type feature. The results show that thenatural frequencies, stiffness ratios and damping ratios gradually change as theamplitude of earthquake inputs increase gradually.
12.5.2.3 Acceleration amplification
The acceleration amplification was determined by dividing the maximum responseacceleration measured on each floor by an input PGA during each test phase. Asshown in Fig. 12.56, the acceleration amplifying coefficient gradually increasesalong the height under the same earthquake level and decreases as the PGA ofexcitations increases due to the progressive degradation of structural stiffness. Thisdistribution feature is more obviously seen from the test phases with PGAs from0.066 to 0.185 g. The influence of high-order vibration modes increases after thetest phase with PGA of 0.370 g so the acceleration amplifying coefficient is nomore conforming with that distribution. The maximum acceleration amplifyingcoefficient obtained during these test phases was 4.587 at 6th floor for the ELWwith PGA of 0.066 g.
(a) First mode shape (b) Second mode shape
0.00
0.75
1.50
2.25
3.00
3.75
4.50
-1 -0.5 0 0.5 1
Floo
r le
vel (
m)
Mode Coefficient
Initially
0.066g
0.130g
0.185g
0.264g
0.370g
0.415g
0.550g
0.750g
0.00
0.75
1.50
2.25
3.00
3.75
4.50
-1 -0.5 0 0.5 1
Floo
r le
vel (
m)
Mode Coefficient
Initially
0.066g
0.130g
0.185g
0.264g
0.370g
0.415g
0.550g
0.750g
Fig. 12.55 First and second mode shapes in X-direction
12.5 Shaking Table Test on Precast Space Frame 495

12.5.2.4 Earthquake action
The seismic forces were calculated based on the mass distribution at each floor andthe measured accelerations at the measurement points on each floor of the modelstructure.
Figure 12.57 describes the distribution of the maximum seismic force in the X-direction. From the figure, it can be seen that the distribution of the maximumseismic force is accepted to the inverted triangular form along the height during thetest phases with PGAs from 0.066 to 0.130 g, and the seismic force increasesprogressively with the gradually increasing acceleration amplitude. Since the testphase with PGA of 0.185 g, the influence of high-order vibration modes developsand consequently the inverted triangular form is not appropriate any more for thedistribution of the maximum seismic force. The maximum seismic force obtainedduring these test phases was 21.679 kN at 6th floor for the SHW with PGA of0.415 g. Although the PGAs of the later test phases were greater, the maximumseismic forces were all smaller than that of SHW with PGA of 0.415 g as shown inFig. 12.59c. This trend is followed under WCW, after reaching the highest value of18.43 kN at 2nd floor with PGA of 0.550 g, the seismic forces decrease whilePGAs increase as shown in Fig. 12.57a. However, the seismic force under ELWinputs behaves differently as shown in Fig. 12.57b. During the test phase with PGAof 0.066 g, the distribution presents a quite linear increase and then the seismicforce increases relatively slowly during the later test phases. However, the testphase with PGA of 0.750 g reveals that the seismic force dramatically increases.
Based on the three factors of primary importance determining the earthquakeresponse of a structure, which are the type of framing, the mass distribution, and therelative contribution of the higher modes of vibration, it can be considered that thedistribution of the maximum seismic force of the precast RAC model was mainlyimpacted not only by different seismic waves but also different higher modes underdifferent input motions.
0.0
0.5
1.0
1.5
2.0
2.5
3.0
3.5
4.0
4.5
WCW
ELW
SHW
WCW
ELW
SHW
WCW
ELW
SHW
WCW
ELW
SHW
WCW
ELW
SHW
WCW
ELW
SHW
WCW
ELW
SHW
WCW
ELW
SHW
tn eicif feo cgni yfi lp
man oitare lec c
A
Peak ground acceleration
1st floor2nd floor3rd floor4th foor5th floorRoof
0.066g 0.185g0.130g 0.750g0.550g0.450g0.370g0.264g
Fig. 12.56 Distribution ofacceleration amplifyingcoefficient in X-direction
496 12 Seismic Performance of Recycled Aggregate Concrete Structures

Structural story shear force is one of the important studying parameters inearthquake response analysis because it reflects the amount of seismic internalforce. The values of story shear force were calculated based on the measuredaccelerations and the mass distribution at floors.
Figure 12.58 displays the distribution of the maximum story shear distribution inthe X-direction. As shown in this figure, the maximum story shear reduces steadilyalong the height and the triangular form is appropriate for these distributions duringthe test phases with PGAs from 0.066 to 0.130 g (elastic stage). In the later testphases (elastic-plastic stage), the variation trend is partly affected by high-ordervibration modes so the distributions do not follow triangular form but still tend toreduce along the height.
(a) Seismic force under WCW (b) Seismic force under ELW
0.75
1.50
2.25
3.00
3.75
4.50
0 5 10 15 20 25
Flo
or
leve
l (m
)
Seismic force (kN)
0.066g
0.130g
0.185g
0.264g
0.370g
0.415g
0.550g
0.750g
0.75
1.50
2.25
3.00
3.75
4.50
0 5 10 15 20 25
Floo
r le
vel (
m)
Seismic force (kN)
0.066g
0.130g
0.185g
0.264g
0.370g
0.415g
0.550g
0.750g
(c) Seismic force under SHW
0.75
1.50
2.25
3.00
3.75
4.50
0 5 10 15 20 25
Flo
or
lev
el (
m)
Seismic force (kN)
0.066g
0.130g
0.185g
0.264g
0.370g
0.415g
0.550g
0.750g
Fig. 12.57 Distribution of seismic force in X-direction
12.5 Shaking Table Test on Precast Space Frame 497
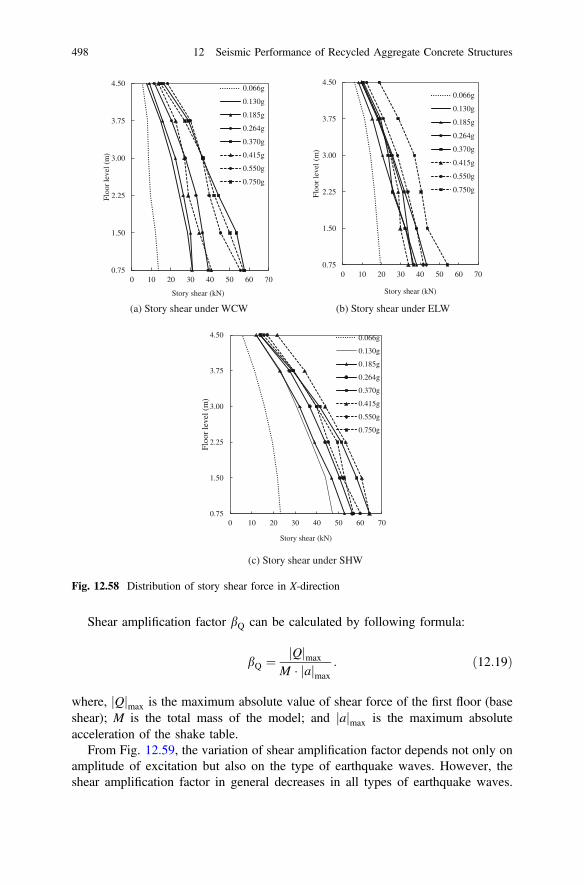
Shear amplification factor bQ can be calculated by following formula:
bQ ¼ Qj jmax
M � aj jmax: ð12:19Þ
where, Qj jmax is the maximum absolute value of shear force of the first floor (baseshear); M is the total mass of the model; and aj jmax is the maximum absoluteacceleration of the shake table.
From Fig. 12.59, the variation of shear amplification factor depends not only onamplitude of excitation but also on the type of earthquake waves. However, theshear amplification factor in general decreases in all types of earthquake waves.
(a) Story shear under WCW (b) Story shear under ELW
0.75
1.50
2.25
3.00
3.75
4.50
0 10 20 30 40 50 60 70
Floo
r le
vel (
m)
Story shear (kN)
0.066g
0.130g
0.185g
0.264g
0.370g
0.415g
0.550g
0.750g
0.75
1.50
2.25
3.00
3.75
4.50
0 10 20 30 40 50 60 70
Flo
or le
vel (
m)
Story shear (kN)
0.066g
0.130g
0.185g
0.264g
0.370g
0.415g
0.550g
0.750g
0.75
1.50
2.25
3.00
3.75
4.50
0 10 20 30 40 50 60 70
Floo
r le
vel (
m)
Story shear (kN)
0.066g
0.130g
0.185g
0.264g
0.370g
0.415g
0.550g
0.750g
(c) Story shear under SHW
Fig. 12.58 Distribution of story shear force in X-direction
498 12 Seismic Performance of Recycled Aggregate Concrete Structures

There is a rapid descent with ELW up to the test phase with PGA of 0.370 g, afterthat the shear amplification factor decreases more slowly. Meanwhile, the shearamplification factors under WCW and SHW show a similar trend in the shape of awave. After the test phase with PGA of 0.415 g, the difference of shear amplifi-cation factors among three seismic waves is small and mostly converges in the finaltest phase.
12.5.2.5 Deformation
LVDTs were installed on each floor to monitor the lateral displacement response. Inorder to investigate the structural deformation response under different earthquakelevels, the maximum story displacements obtained were illustrated and the maxi-mum story drift distributions along the height were also demonstrated as shown inFigs. 12.63 and 12.64, respectively.
It is clearly seen from Fig. 12.60 that the curves of the maximum story dis-placement in all types of earthquake waves show a shear-type distribution feature.Compared with WCW and ELW, the maximum story displacement of 97.76 mmcaused by SHW is the largest relative displacement. Generally, the maximum storydisplacement curves are relatively smooth without inflexions, which mean that thedistribution of equivalent rigidities along the height of the structure is well pro-portioned. Structural deformation curves are similar in shape with the first-ordervibration mode shown in Fig. 12.55 for the precast RAC frame structure.
Figure 12.61 shows the shape of the maximum inter-story drift curves which issimilar in all three types of earthquake wave. There is a slow rise in the maximuminter-story drift until the test phase with PGA of 0.370 g was carried out, but afterthat the maximum inter-story drift increases more rapidly. For all of the test phases,the maximum inter-story drift of the second floor is bigger than that of all otherfloors under the same earthquake level. The maximum inter-story drift of the secondfloor reached 1/17 (45.131/750) in the final test phase caused by SHW because theprecast RAC frame model undergone a large deformation during this test phase.
0.0
0.5
1.0
1.5
2.0
2.5
3.0
βQPGA (g)
WCW
ELW
SHW
0.066g 0.750g0.550g0.415g0.370g0.264g0.185g0.130g
Fig. 12.59 Variation of shearamplification factor
12.5 Shaking Table Test on Precast Space Frame 499
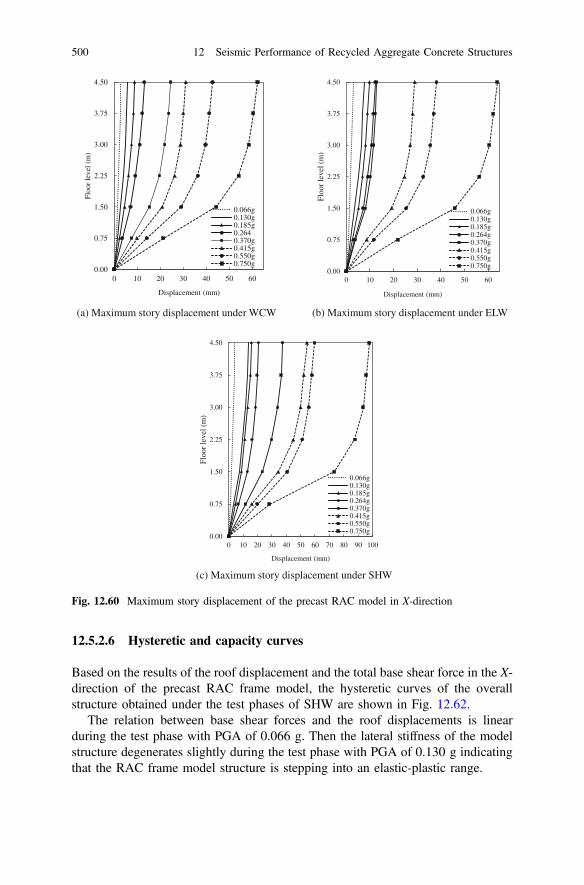
12.5.2.6 Hysteretic and capacity curves
Based on the results of the roof displacement and the total base shear force in the X-direction of the precast RAC frame model, the hysteretic curves of the overallstructure obtained under the test phases of SHW are shown in Fig. 12.62.
The relation between base shear forces and the roof displacements is linearduring the test phase with PGA of 0.066 g. Then the lateral stiffness of the modelstructure degenerates slightly during the test phase with PGA of 0.130 g indicatingthat the RAC frame model structure is stepping into an elastic-plastic range.
(a) Maximum story displacement under WCW (b) Maximum story displacement under ELW
0.00
0.75
1.50
2.25
3.00
3.75
4.50
0 10 20 30 40 50 60
Floo
r le
vel (
m)
Displacement (mm)
0.066g0.130g0.185g0.2640.370g0.415g0.550g0.750g
0.00
0.75
1.50
2.25
3.00
3.75
4.50
0 10 20 30 40 50 60
Floo
r le
vel (
m)
Displacement (mm)
0.066g0.130g0.185g0.264g0.370g0.415g0.550g0.750g
(c) Maximum story displacement under SHW
0.00
0.75
1.50
2.25
3.00
3.75
4.50
0 10 20 30 40 50 60 70 80 90 100
Floo
r le
vel (
m)
Displacement (mm)
0.066g0.130g0.185g0.264g0.370g0.415g0.550g0.750g
Fig. 12.60 Maximum story displacement of the precast RAC model in X-direction
500 12 Seismic Performance of Recycled Aggregate Concrete Structures

The pinching phenomenon is slightly observed during the phase with PGA of0.185 g. The lateral stiffness of the model degrades significantly during the testphase caused by SHW with PGA of 0.370 g and the pinching phenomenon can berecognized. The maximum base shear of the model is close to the maximum loadbearing capacity of the structure in the test phase with PGA of 0.415 g. Thepinching effect on the hysteric curves is more obvious in the later test phasesbecause of shear deformations. However, the hysteretic curves perform somewhatdisorderly; also it still reveals the stiffness and strength deterioration of the precastRAC frame structure under the final test phase as shown in Fig. 12.62.
(a) Maximum inter-story drift under WCW (b) Maximum inter-story drift under ELW
0.00
0.75
1.50
2.25
3.00
3.75
4.50
0 5 10 15 20 25
Floo
r le
vel (
m)
Story drift (mm)
0.066g0.130g0.185g0.264g0.370g0.415g0.550g0.750g
0.00
0.75
1.50
2.25
3.00
3.75
4.50
0 5 10 15 20 25
Floo
r le
vel (
m)
Story drift (mm)
0.066g0.130g0.185g0.264g0.370g0.415g0.550g0.750g
(c) Maximum inter-story drift under SHW
0.00
0.75
1.50
2.25
3.00
3.75
4.50
0 10 20 30 40 50
Floo
r le
vel (
m)
Story drift (mm)
0.066g0.130g0.185g0.264g0.370g0.415g0.550g0.750g
Fig. 12.61 Maximum inter-story drift of the precast RAC model in X-direction
12.5 Shaking Table Test on Precast Space Frame 501

It is noted that from the test phase with PGA of 0.185 g, the damage was visibleand the damaged model was continuously carried out with higher PGAs. It can beconsidered that the model tested (from PGAs of 0.185 g) has a higher damping ratiothan that of the initial model. It is likely to cause the increase of energy dissipationwhich was represented by hysteresis loops.
The form of exponential function for the base shear was selected to express thecapacity curve of the precast RAC frame model as obtained in the following for-mula and drawn in Fig. 12.63.
-70
-50
-30
-10
10
30
50
70
-100-80-60-40-20020406080100
Bas
e sh
ear
(kN
)
Roof displacement (mm)
SHW-0.066g
SHW-0.185g
SHW-0.370g
SHW-0.415g
SHW-0.550g
SHW-0.750g
Fig. 12.62 Hysteretic curves of the precast RAC model
0
10
20
30
40
50
60
70
0 10 20 30 40 50 60 70 80
Bas
e sh
ear
(kN
)
Roof displacement (mm)
Test
Fitting
Fig. 12.63 Capacity curve ofthe precast RAC model
502 12 Seismic Performance of Recycled Aggregate Concrete Structures
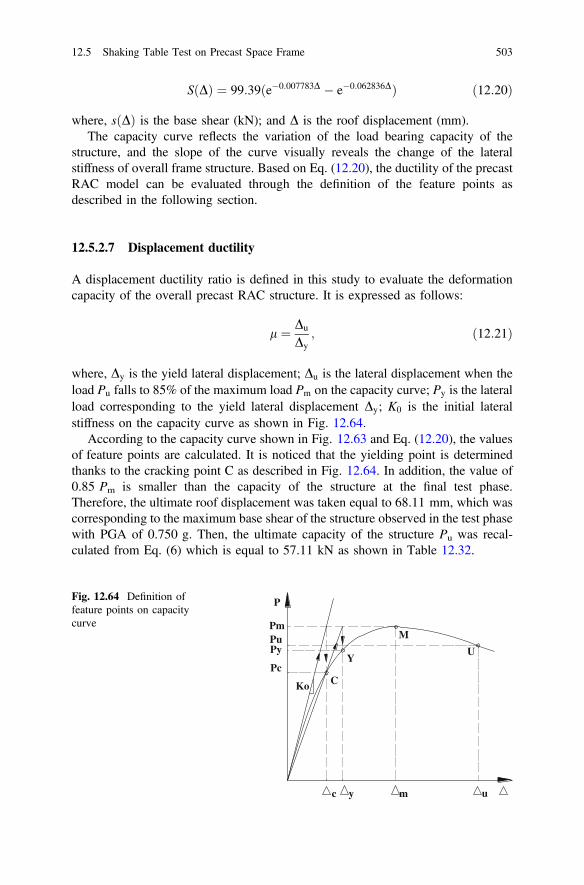
SðDÞ ¼ 99:39ðe�0:007783D � e�0:062836DÞ ð12:20Þ
where, sðDÞ is the base shear (kN); and D is the roof displacement (mm).The capacity curve reflects the variation of the load bearing capacity of the
structure, and the slope of the curve visually reveals the change of the lateralstiffness of overall frame structure. Based on Eq. (12.20), the ductility of the precastRAC model can be evaluated through the definition of the feature points asdescribed in the following section.
12.5.2.7 Displacement ductility
A displacement ductility ratio is defined in this study to evaluate the deformationcapacity of the overall precast RAC structure. It is expressed as follows:
l ¼ Du
Dy; ð12:21Þ
where, Dy is the yield lateral displacement; Du is the lateral displacement when theload Pu falls to 85% of the maximum load Pm on the capacity curve; Py is the lateralload corresponding to the yield lateral displacement Dy; K0 is the initial lateralstiffness on the capacity curve as shown in Fig. 12.64.
According to the capacity curve shown in Fig. 12.63 and Eq. (12.20), the valuesof feature points are calculated. It is noticed that the yielding point is determinedthanks to the cracking point C as described in Fig. 12.64. In addition, the value of0.85 Pm is smaller than the capacity of the structure at the final test phase.Therefore, the ultimate roof displacement was taken equal to 68.11 mm, which wascorresponding to the maximum base shear of the structure observed in the test phasewith PGA of 0.750 g. Then, the ultimate capacity of the structure Pu was recal-culated from Eq. (6) which is equal to 57.11 kN as shown in Table 12.32.
Ko
y u
Pc
PuPm
mc
Py
P
C
Y
M
U
Fig. 12.64 Definition offeature points on capacitycurve
12.5 Shaking Table Test on Precast Space Frame 503

Finally, the ductility ratio is determined as 3.852 by Eq. (12.21). It is reveals thatthe precast RAC frame model has a good capacity to undergo deformation after itsinitial yield without any significant reduction in loading capacity. It also proves theenough aseismic capacity of the precast RAC frame structure.
12.5.3 Simulation Modeling
1. Principles and assumptions
The factors necessary to be taken into considerations in modeling precast framemade of RAC are: (1) the difference of precast concrete section from cast-in-situconcrete section, including the location of longitudinal bar, cover concrete thick-ness, (2) the difference in compressive strength of concrete for cast-in-situ concreteand precast concrete, (3) the interface between head of column and CIP joint whichcauses reduction of strength and stiffness of the joint where the lower columnframing into due to the reduced contribution of the moment resistance of the lowercolumn, and (4) constitutive model for concrete with recycled coarse aggregates.
The considerations (1) and (2) were governed well by modeling sections ofprecast beam and column elements precisely as sections designed. The third con-sideration, thanks to the assumption of rigid joint which is presented by rigid endzones in the beams and columns framing into the joint, the head and foot columnsections were modeled.
The head cross sections of columns were reduced 30% compared with middlesection of columns in order to reflect the interface behavior between precast col-umns and CIP joints. The foot cross section of columns was increased 20% in orderto take the contribution of monolithic structural parts including foot of column,beam, and slab, to stiffness of joints.
The cross sections of head and foot columns were calibrated with the followingrules:
(1) The initial natural frequency must be close to initial natural frequenciesobtained from test result.
(2) Mode shape coefficients of the first vibration in both X- and Y-directions mustbe close to those obtained from shaking table test.
The last consideration was highly respected by material parameters used inmodeling concrete model such as compressive strength and modulus elastic.
Table 12.32 Values of feature points on the capacity curve
Yield load Yielddisplacement
Maximumload
Ultimateload
Displacementcorresponding to Pu
Initial stiffness
Py (kN) Dy (mm) Pm (kN) Pu (kN) Du (mm) K0 (kN/mm)
53.89 17.68 64.82 57.11 68.11 5.47
504 12 Seismic Performance of Recycled Aggregate Concrete Structures

2. Material properties and models
The monotonic envelope curve of the hysteresis model for concrete in com-pression follows the monotonic stress-strain relation model of Kent and Park [14] asextended by Scott et al. [5]. Even though more accurate and complete monotonicstress–strain models have been published before, the so-called modified Kent andPark model offers a good balance between simplicity and accuracy and is widelyused. Then the hysteresis unloading and reloading rules proposed by Yassin [15] area set of linear stress–strain relations. Finally, in the numerical modeling of the RACspace frame, the hysteresis material model of concrete is illustrated in Fig. 12.34.
The concrete model takes into account the confinement effect due to the stirrupsthrough modifying concrete strength parameters, because it is well known that theconfined concrete by suitable arrangements of transverse reinforcement achieves asignificant increase in both the strength and the ductility of compressed concrete[16, 17]. The tensile behavior of the concrete model takes into account tensionstiffening, and the degradation of the unloading and reloading stiffness forincreasing values of the tensile strain after initial cracking. In this study, themaximum tensile strength ft = 0.07f′c and the tension stiffening modulusEts = 0.05Ec were adopted. The other parameters of material properties used inmodeling beams and columns are detailed in Tables 12.33 and 12.34.
Table 12.33 RAC material model parameters of beams
Index Unconfined concrete elastic modulus Unconfined concrete elastic modulus
f 0c(MPa)
e00(MPa)
0:2f 0c(MPa)
e02010�3ð Þ
Ec(GPa)
K � f 0c(MPa)
e00(10−3)
0:2Kf 0c(MPa)
e020(10−3)
Ec(GPa)
Precast RAC Cast-in-situ RAC
Floor 1F 32.53 2.09 6.51 3.27 24.80 30.35 2.05 6.07 3.32 24.26
2F 25.99 1.98 5.20 3.45 23.03 37.17 2.16 7.43 3.16 25.78
3F 27.99 2.01 5.60 3.39 23.63 32.02 2.08 6.40 3.28 24.68
4F 26.29 1.98 5.26 3.44 23.12 32.61 2.09 6.52 3.26 24.82
5F 23.96 1.94 4.79 3.53 22.35 29.08 2.03 5.82 3.36 23.93
6F 31.98 2.08 6.40 3.28 24.67 28.10 2.01 5.62 3.39 23.66
Table 12.34 RAC material model parameters for columns
Index Unconfined concrete elastic modulus Confined concrete elastic modulus
f 0c(MPa)
e00(10−3)
0:2f 0c(MPa)
e020(10−3)
Ec(GPa)
Kf 0c(MPa)
e00(10−3)
0:2Kf 0c(MPa)
e020(10−3)
Ec(GPa)
Precast RAC Cast-in-situ RAC
Floor 1F 27.842 2.000 5.568 4.634 23.58 35.87 2.577 7.175 53.369 23.58
2F 26.315 2.000 5.263 4.841 23.13 34.35 2.611 6.869 53.556 23.13
3F 29.009 2.000 5.802 4.495 23.91 37.04 2.554 7.408 53.244 23.91
4F 28.882 2.000 5.776 4.510 23.88 36.91 2.556 7.383 53.257 23.88
5F 28.309 2.000 5.662 4.577 23.72 36.34 2.568 7.268 53.317 23.72
6F 27.718 2.000 5.544 4.650 23.55 35.75 2.580 7.150 53.383 23.55
12.5 Shaking Table Test on Precast Space Frame 505

The hysteresis material model used for the steel can reflect strain hardening andsoftening in the loading process, takes into account pinching of force and defor-mation and unloading stiffness degradation based on the ductility, and involves amaterial damage model related to the material ductility and the energy dissipation.The material model [18] for the steel bar is shown in Table 12.35 and Fig. 12.65.As shown in Fig. 12.65, (s1p, e1p), (s2p, e2p), and (s3p, e3p) represent stress and strainat yielding, maximum, and ultimate point of the backbone curve in the positivedirection, respectively, whereas (s1n, e1n), (s2n, e2n), and (s3n, e3n) represent stressand strain at yielding, maximum, and ultimate point of the backbone curve in thenegative direction, respectively.
3. Flexibility-based fiber elements
There were no slabs modeled in the 3-D frame structure, so effective flangewidth has to be evaluated to consider the contribution of slabs to the behavior of theframe structure as real situation. Therefore, L- and T-beams were modeled in thisstudy with the effective flange width contributing to both flexural compressivestrength and stiffness [19]. The effective flange width was taken into account byeight times of slab thickness for T-beams and by three times for L-beams in theanalysis.
In order to avoid conflicts of longitudinal bars located in upper and lower precastcolumns, left-side and right-side precast beams, the different covers of beam andcolumn elements were considered and designed. In addition, all beam–columnjoints were assumed to be completely rigid, with the physical size of the joint beingrepresented by rigid end zones in the beams and columns. Thus, the head sectionsof columns were modeled in order to reflect the interface behavior between precastcolumns and joint core of CIP joints. Head cross sections of column were reduced30% compared with the middle sections of columns. In addition, foot cross sectionsof columns were increased 20% in order to take the contribution of monolithic
Table 12.35 Longitudinal steel rebar material model parameters
Index D (mm) s1p (MPa) e1p s2p (MPa) e2p s3p (MPa) e3pType 8# 3.94 329.36000 0.00165 431.79096 0.05117 230.55200 0.25000
10# 3.32 281.52000 0.00175 411.15996 0.08248 287.81197 0.25000
Fig. 12.65 Hysteresismaterial model for steelreinforcement
506 12 Seismic Performance of Recycled Aggregate Concrete Structures

structural parts including foot of column, beam, and slab, to stiffness of joints asshown in Fig. 12.66a. The length of such elements is equal to the depth of beamwhich represents for rigid end zones of columns framing into a joint. The overallprecast structure is modeled in Fig. 12.66b.
12.5.4 Simulated Results and Validation
1. Dynamic characteristics
Table 12.36 compares the natural frequencies of the first two vibration modes inX- and Y-directions obtained from the simulations and the shaking table tests. It canbe seen that the simulated frequencies agree well with the test results, especially theinitial frequencies in X-direction of the first mode. The comparisons between thetested and simulated natural frequencies are displayed in Fig. 12.67.
As shown in Fig. 12.67, in the X-direction, both the tested natural frequency andthe simulated results descend continuously during a series of excitations withgradually increasing acceleration amplitudes. However, after 0.415 g test phase, thetested natural frequency still tends to decline, while the simulated natural fre-quencies remain relatively steadily. This may be due to the severe damage of themodel when suffered from such a high PGA whereas the simulation cannot take thisdamage into account very well [20]. In addition, the interaction between shakingtable and structure also causes a reduction in the structural frequency [21]. In the
(a) Beam-column joint (b) Overall precast structure modeled
Fig. 12.66 Simulated model
12.5 Shaking Table Test on Precast Space Frame 507
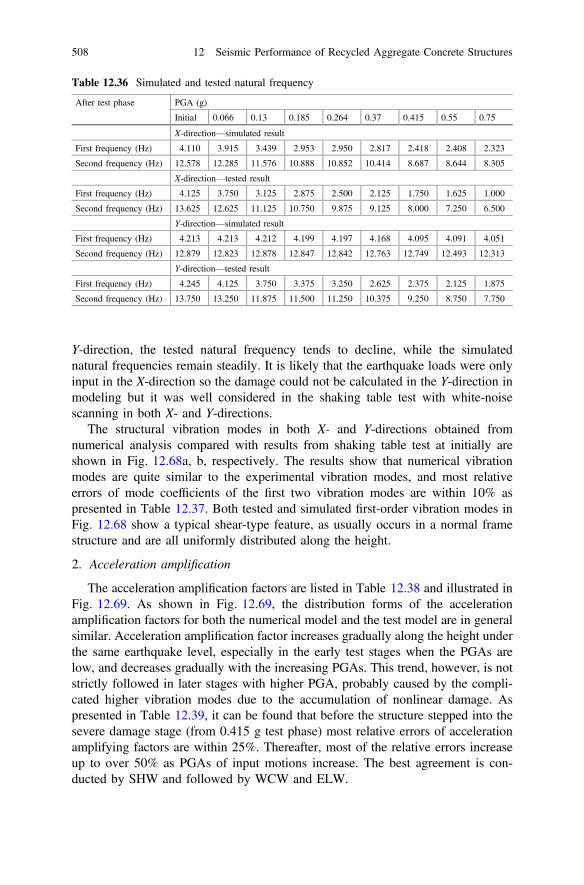
Y-direction, the tested natural frequency tends to decline, while the simulatednatural frequencies remain steadily. It is likely that the earthquake loads were onlyinput in the X-direction so the damage could not be calculated in the Y-direction inmodeling but it was well considered in the shaking table test with white-noisescanning in both X- and Y-directions.
The structural vibration modes in both X- and Y-directions obtained fromnumerical analysis compared with results from shaking table test at initially areshown in Fig. 12.68a, b, respectively. The results show that numerical vibrationmodes are quite similar to the experimental vibration modes, and most relativeerrors of mode coefficients of the first two vibration modes are within 10% aspresented in Table 12.37. Both tested and simulated first-order vibration modes inFig. 12.68 show a typical shear-type feature, as usually occurs in a normal framestructure and are all uniformly distributed along the height.
2. Acceleration amplification
The acceleration amplification factors are listed in Table 12.38 and illustrated inFig. 12.69. As shown in Fig. 12.69, the distribution forms of the accelerationamplification factors for both the numerical model and the test model are in generalsimilar. Acceleration amplification factor increases gradually along the height underthe same earthquake level, especially in the early test stages when the PGAs arelow, and decreases gradually with the increasing PGAs. This trend, however, is notstrictly followed in later stages with higher PGA, probably caused by the compli-cated higher vibration modes due to the accumulation of nonlinear damage. Aspresented in Table 12.39, it can be found that before the structure stepped into thesevere damage stage (from 0.415 g test phase) most relative errors of accelerationamplifying factors are within 25%. Thereafter, most of the relative errors increaseup to over 50% as PGAs of input motions increase. The best agreement is con-ducted by SHW and followed by WCW and ELW.
Table 12.36 Simulated and tested natural frequency
After test phase PGA (g)
Initial 0.066 0.13 0.185 0.264 0.37 0.415 0.55 0.75
X-direction—simulated result
First frequency (Hz) 4.110 3.915 3.439 2.953 2.950 2.817 2.418 2.408 2.323
Second frequency (Hz) 12.578 12.285 11.576 10.888 10.852 10.414 8.687 8.644 8.305
X-direction—tested result
First frequency (Hz) 4.125 3.750 3.125 2.875 2.500 2.125 1.750 1.625 1.000
Second frequency (Hz) 13.625 12.625 11.125 10.750 9.875 9.125 8.000 7.250 6.500
Y-direction—simulated result
First frequency (Hz) 4.213 4.213 4.212 4.199 4.197 4.168 4.095 4.091 4.051
Second frequency (Hz) 12.879 12.823 12.878 12.847 12.842 12.763 12.749 12.493 12.313
Y-direction—tested result
First frequency (Hz) 4.245 4.125 3.750 3.375 3.250 2.625 2.375 2.125 1.875
Second frequency (Hz) 13.750 13.250 11.875 11.500 11.250 10.375 9.250 8.750 7.750
508 12 Seismic Performance of Recycled Aggregate Concrete Structures

3. Displacement
The maximum story displacements from numerical analysis and test results areillustrated in Fig. 12.70. Overall, the simulated and tested relations are shown avery good correlation. Particularly, before the structure stepped into the severedamage stage (from 0.415 g test phase) most relative errors of accelerationamplifying factors are within 15% as shown in Table 12.39. Thereafter, the dif-ference between the simulated and tested results increases as the input accelerationamplitudes increase gradually and most of the relative errors within 25% as
0
2
4
6
8
10
12
14
Freq
uenc
y (H
z)
Test level (g)
1st Frequency-S1st Frequency-T2nd Frequency-S2nd Frequency-T
Initial 0.7500.5500.4150.3700.2640.1850.1300.066
(a) Simulated and tested natural frequencies in X-direction
0
2
4
6
8
10
12
14
Freq
uenc
y (H
z)
Test level (g)
1st Frequency-S1st Frequency-T2nd Frequency-S2nd Frequency-T
Initial 0.7500.5500.4150.3700.26400.18500.1300.066
(b) Simulated and tested natural frequencies in Y-direction
Fig. 12.67 Simulated and tested natural frequency (Note T – test results, S – simulation results)
12.5 Shaking Table Test on Precast Space Frame 509
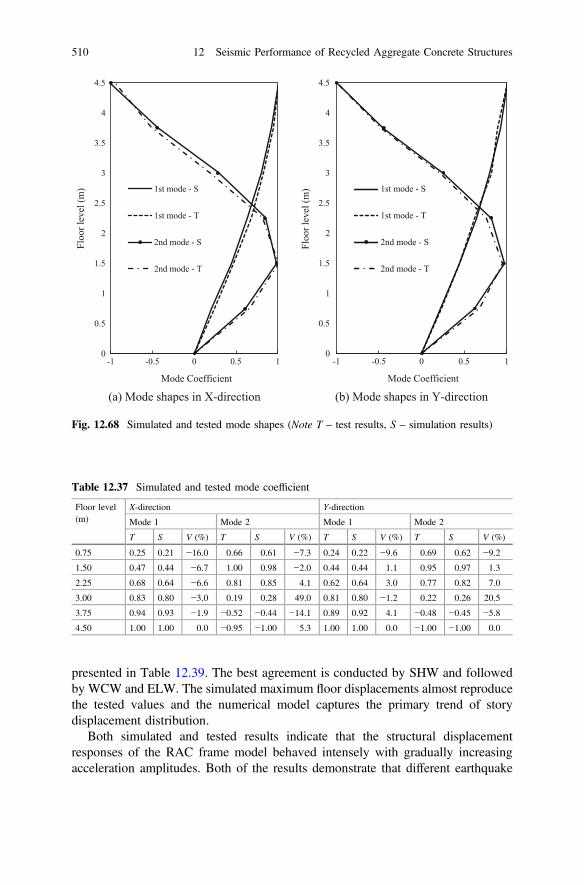
presented in Table 12.39. The best agreement is conducted by SHW and followedby WCW and ELW. The simulated maximum floor displacements almost reproducethe tested values and the numerical model captures the primary trend of storydisplacement distribution.
Both simulated and tested results indicate that the structural displacementresponses of the RAC frame model behaved intensely with gradually increasingacceleration amplitudes. Both of the results demonstrate that different earthquake
0
0.5
1
1.5
2
2.5
3
3.5
4
4.5
-1 -0.5 0 0.5 1
Floo
r lev
el (m
)
Mode Coefficient
1st mode - S
1st mode - T
2nd mode - S
2nd mode - T
(a) Mode shapes in X-direction
0
0.5
1
1.5
2
2.5
3
3.5
4
4.5
-1 -0.5 0 0.5 1
Floo
r lev
el (m
)
Mode Coefficient
1st mode - S
1st mode - T
2nd mode - S
2nd mode - T
(b) Mode shapes in Y-direction
Fig. 12.68 Simulated and tested mode shapes (Note T – test results, S – simulation results)
Table 12.37 Simulated and tested mode coefficient
Floor level(m)
X-direction Y-direction
Mode 1 Mode 2 Mode 1 Mode 2
T S V (%) T S V (%) T S V (%) T S V (%)
0.75 0.25 0.21 −16.0 0.66 0.61 −7.3 0.24 0.22 −9.6 0.69 0.62 −9.2
1.50 0.47 0.44 −6.7 1.00 0.98 −2.0 0.44 0.44 1.1 0.95 0.97 1.3
2.25 0.68 0.64 −6.6 0.81 0.85 4.1 0.62 0.64 3.0 0.77 0.82 7.0
3.00 0.83 0.80 −3.0 0.19 0.28 49.0 0.81 0.80 −1.2 0.22 0.26 20.5
3.75 0.94 0.93 −1.9 −0.52 −0.44 −14.1 0.89 0.92 4.1 −0.48 −0.45 −5.8
4.50 1.00 1.00 0.0 −0.95 −1.00 5.3 1.00 1.00 0.0 −1.00 −1.00 0.0
510 12 Seismic Performance of Recycled Aggregate Concrete Structures
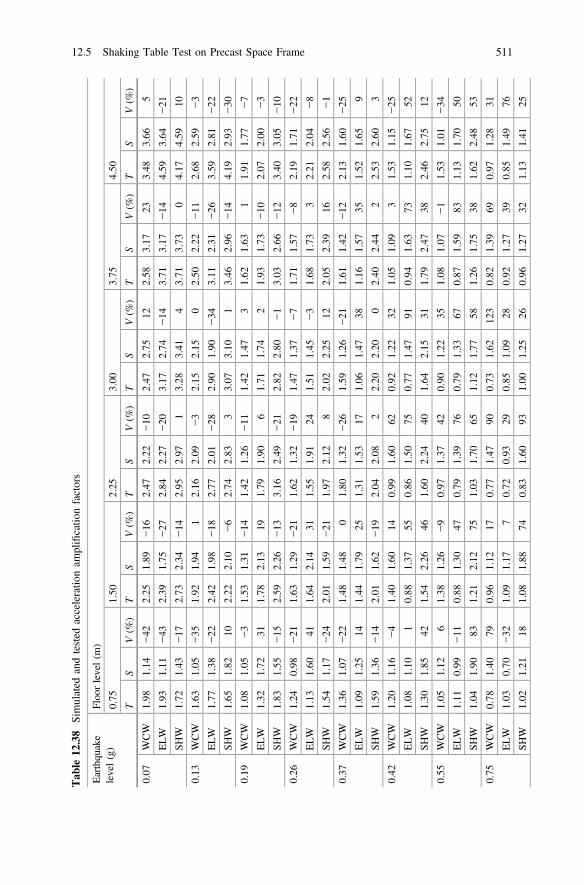
Tab
le12
.38
Simulated
andtested
acceleratio
nam
plificatio
nfactors
Earthqu
ake
level(g)
Floo
rlevel(m
)
0.75
1.50
2.25
3.00
3.75
4.50
TS
V(%
)T
SV(%
)T
SV(%
)T
SV(%
)T
SV(%
)T
SV(%
)
0.07
WCW
1.98
1.14
−42
2.25
1.89
−16
2.47
2.22
−10
2.47
2.75
122.58
3.17
233.48
3.66
5
ELW
1.93
1.11
−43
2.39
1.75
−27
2.84
2.27
−20
3.17
2.74
−14
3.71
3.17
−14
4.59
3.64
−21
SHW
1.72
1.43
−17
2.73
2.34
−14
2.95
2.97
13.28
3.41
43.71
3.73
04.17
4.59
10
0.13
WCW
1.63
1.05
−35
1.92
1.94
12.16
2.09
−3
2.15
2.15
02.50
2.22
−11
2.68
2.59
−3
ELW
1.77
1.38
−22
2.42
1.98
−18
2.77
2.01
−28
2.90
1.90
−34
3.11
2.31
−26
3.59
2.81
−22
SHW
1.65
1.82
102.22
2.10
−6
2.74
2.83
33.07
3.10
13.46
2.96
−14
4.19
2.93
−30
0.19
WCW
1.08
1.05
−3
1.53
1.31
−14
1.42
1.26
−11
1.42
1.47
31.62
1.63
11.91
1.77
−7
ELW
1.32
1.72
311.78
2.13
191.79
1.90
61.71
1.74
21.93
1.73
−10
2.07
2.00
−3
SHW
1.83
1.55
−15
2.59
2.26
−13
3.16
2.49
−21
2.82
2.80
−1
3.03
2.66
−12
3.40
3.05
−10
0.26
WCW
1.24
0.98
−21
1.63
1.29
−21
1.62
1.32
−19
1.47
1.37
−7
1.71
1.57
−8
2.19
1.71
−22
ELW
1.13
1.60
411.64
2.14
311.55
1.91
241.51
1.45
−3
1.68
1.73
32.21
2.04
−8
SHW
1.54
1.17
−24
2.01
1.59
−21
1.97
2.12
82.02
2.25
122.05
2.39
162.58
2.56
−1
0.37
WCW
1.36
1.07
−22
1.48
1.48
01.80
1.32
−26
1.59
1.26
−21
1.61
1.42
−12
2.13
1.60
−25
ELW
1.09
1.25
141.44
1.79
251.31
1.53
171.06
1.47
381.16
1.57
351.52
1.65
9
SHW
1.59
1.36
−14
2.01
1.62
−19
2.04
2.08
22.20
2.20
02.40
2.44
22.53
2.60
3
0.42
WCW
1.20
1.16
−4
1.40
1.60
140.99
1.60
620.92
1.22
321.05
1.09
31.53
1.15
−25
ELW
1.08
1.10
10.88
1.37
550.86
1.50
750.77
1.47
910.94
1.63
731.10
1.67
52
SHW
1.30
1.85
421.54
2.26
461.60
2.24
401.64
2.15
311.79
2.47
382.46
2.75
12
0.55
WCW
1.05
1.12
61.38
1.26
−9
0.97
1.37
420.90
1.22
351.08
1.07
−1
1.53
1.01
−34
ELW
1.11
0.99
−11
0.88
1.30
470.79
1.39
760.79
1.33
670.87
1.59
831.13
1.70
50
SHW
1.04
1.90
831.21
2.12
751.03
1.70
651.12
1.77
581.26
1.75
381.62
2.48
53
0.75
WCW
0.78
1.40
790.96
1.12
170.77
1.47
900.73
1.62
123
0.82
1.39
690.97
1.28
31
ELW
1.03
0.70
−32
1.09
1.17
70.72
0.93
290.85
1.09
280.92
1.27
390.85
1.49
76
SHW
1.02
1.21
181.08
1.88
740.83
1.60
931.00
1.25
260.96
1.27
321.13
1.41
25
12.5 Shaking Table Test on Precast Space Frame 511
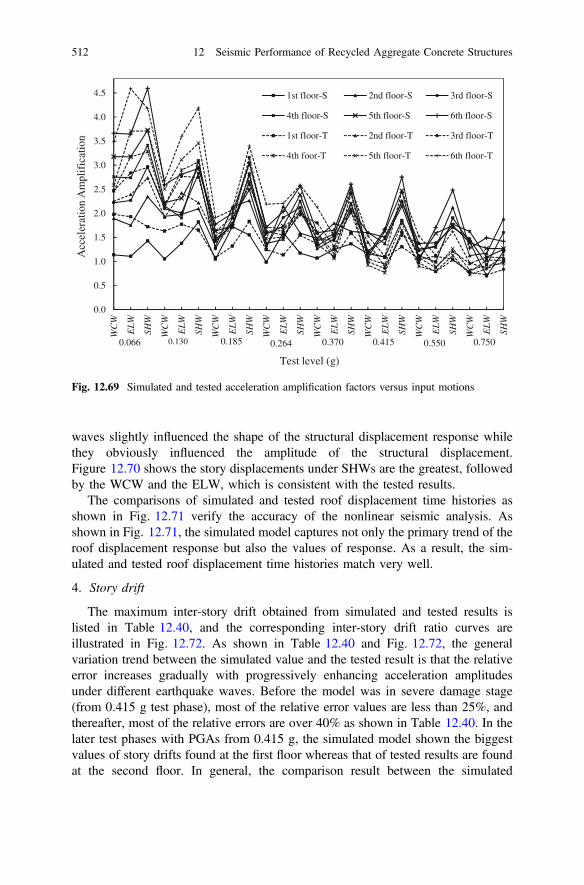
waves slightly influenced the shape of the structural displacement response whilethey obviously influenced the amplitude of the structural displacement.Figure 12.70 shows the story displacements under SHWs are the greatest, followedby the WCW and the ELW, which is consistent with the tested results.
The comparisons of simulated and tested roof displacement time histories asshown in Fig. 12.71 verify the accuracy of the nonlinear seismic analysis. Asshown in Fig. 12.71, the simulated model captures not only the primary trend of theroof displacement response but also the values of response. As a result, the sim-ulated and tested roof displacement time histories match very well.
4. Story drift
The maximum inter-story drift obtained from simulated and tested results islisted in Table 12.40, and the corresponding inter-story drift ratio curves areillustrated in Fig. 12.72. As shown in Table 12.40 and Fig. 12.72, the generalvariation trend between the simulated value and the tested result is that the relativeerror increases gradually with progressively enhancing acceleration amplitudesunder different earthquake waves. Before the model was in severe damage stage(from 0.415 g test phase), most of the relative error values are less than 25%, andthereafter, most of the relative errors are over 40% as shown in Table 12.40. In thelater test phases with PGAs from 0.415 g, the simulated model shown the biggestvalues of story drifts found at the first floor whereas that of tested results are foundat the second floor. In general, the comparison result between the simulated
0.0
0.5
1.0
1.5
2.0
2.5
3.0
3.5
4.0
4.5
WCW
ELW
SHW
WCW
ELW
SHW
WCW
ELW
SHW
WCW
ELW
SHW
WCW
ELW
SHW
WCW
ELW
SHW
WCW
ELW
SHW
WCW
ELW
SHW
Acc
eler
atio
n A
mpl
ific
atio
n
Test level (g)
1st floor-S 2nd floor-S 3rd floor-S
4th floor-S 5th floor-S 6th floor-S
1st floor-T 2nd floor-T 3rd floor-T
4th foor-T 5th floor-T 6th floor-T
0.066 0.1850.130 0.7500.5500.4150.3700.264
Fig. 12.69 Simulated and tested acceleration amplification factors versus input motions
512 12 Seismic Performance of Recycled Aggregate Concrete Structures
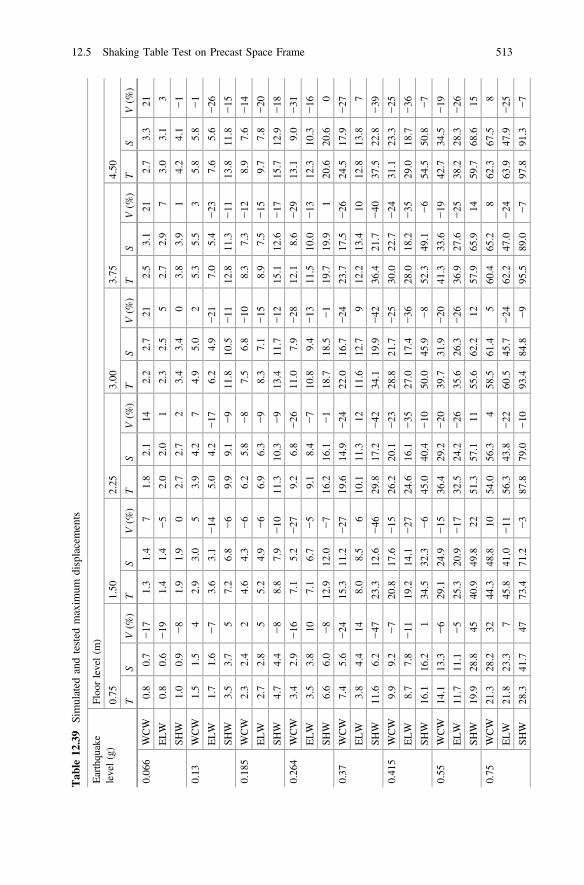
Tab
le12
.39
Simulated
andtested
maxim
umdisplacements
Earthqu
ake
level(g)
Floo
rlevel(m
)
0.75
1.50
2.25
3.00
3.75
4.50
TS
V(%
)T
SV(%
)T
SV(%
)T
SV(%
)T
SV(%
)T
SV(%
)
0.06
6WCW
0.8
0.7
−17
1.3
1.4
71.8
2.1
142.2
2.7
212.5
3.1
212.7
3.3
21
ELW
0.8
0.6
−19
1.4
1.4
−5
2.0
2.0
12.3
2.5
52.7
2.9
73.0
3.1
3
SHW
1.0
0.9
−8
1.9
1.9
02.7
2.7
23.4
3.4
03.8
3.9
14.2
4.1
−1
0.13
WCW
1.5
1.5
42.9
3.0
53.9
4.2
74.9
5.0
25.3
5.5
35.8
5.8
−1
ELW
1.7
1.6
−7
3.6
3.1
−14
5.0
4.2
−17
6.2
4.9
−21
7.0
5.4
−23
7.6
5.6
−26
SHW
3.5
3.7
57.2
6.8
−6
9.9
9.1
−9
11.8
10.5
−11
12.8
11.3
−11
13.8
11.8
−15
0.18
5WCW
2.3
2.4
24.6
4.3
−6
6.2
5.8
−8
7.5
6.8
−10
8.3
7.3
−12
8.9
7.6
−14
ELW
2.7
2.8
55.2
4.9
−6
6.9
6.3
−9
8.3
7.1
−15
8.9
7.5
−15
9.7
7.8
−20
SHW
4.7
4.4
−8
8.8
7.9
−10
11.3
10.3
−9
13.4
11.7
−12
15.1
12.6
−17
15.7
12.9
−18
0.26
4WCW
3.4
2.9
−16
7.1
5.2
−27
9.2
6.8
−26
11.0
7.9
−28
12.1
8.6
−29
13.1
9.0
−31
ELW
3.5
3.8
107.1
6.7
−5
9.1
8.4
−7
10.8
9.4
−13
11.5
10.0
−13
12.3
10.3
−16
SHW
6.6
6.0
−8
12.9
12.0
−7
16.2
16.1
−1
18.7
18.5
−1
19.7
19.9
120
.620
.60
0.37
WCW
7.4
5.6
−24
15.3
11.2
−27
19.6
14.9
−24
22.0
16.7
−24
23.7
17.5
−26
24.5
17.9
−27
ELW
3.8
4.4
148.0
8.5
610
.111
.312
11.6
12.7
912
.213
.410
12.8
13.8
7
SHW
11.6
6.2
−47
23.3
12.6
−46
29.8
17.2
−42
34.1
19.9
−42
36.4
21.7
−40
37.5
22.8
−39
0.41
5WCW
9.9
9.2
−7
20.8
17.6
−15
26.2
20.1
−23
28.8
21.7
−25
30.0
22.7
−24
31.1
23.3
−25
ELW
8.7
7.8
−11
19.2
14.1
−27
24.6
16.1
−35
27.0
17.4
−36
28.0
18.2
−35
29.0
18.7
−36
SHW
16.1
16.2
134
.532
.3−6
45.0
40.4
−10
50.0
45.9
−8
52.3
49.1
−6
54.5
50.8
−7
0.55
WCW
14.1
13.3
−6
29.1
24.9
−15
36.4
29.2
−20
39.7
31.9
−20
41.3
33.6
−19
42.7
34.5
−19
ELW
11.7
11.1
−5
25.3
20.9
−17
32.5
24.2
−26
35.6
26.3
−26
36.9
27.6
−25
38.2
28.3
−26
SHW
19.9
28.8
4540
.949
.822
51.3
57.1
1155
.662
.212
57.9
65.9
1459
.768
.615
0.75
WCW
21.3
28.2
3244
.348
.810
54.0
56.3
458
.561
.45
60.4
65.2
862
.367
.58
ELW
21.8
23.3
745
.841
.0−11
56.3
43.8
−22
60.5
45.7
−24
62.2
47.0
−24
63.9
47.9
−25
SHW
28.3
41.7
4773
.471
.2−3
87.8
79.0
−10
93.4
84.8
−9
95.5
89.0
−7
97.8
91.3
−7
12.5 Shaking Table Test on Precast Space Frame 513

inter-story drift ratio and the experimental under SHW and WCW shows muchbetter agreement than that under ELW.
5. Capacity curve
Table 12.41 presents the values of the comparison of the maximum base shearsbetween simulation and test. The comparison shows that the simulated maximum
0
0.75
1.5
2.25
3
3.75
4.5
0 10 20 30 40 50 60 70 80 90 100
Floo
r lev
el (m
)
Maximum roof displacement (mm)
0.130g-T0.264g-T0.415g-T0.750g-T0.130g-S0.264g-S0.415g-S0.750g-S
(a) Simulated and tested maximum displacement under WCW
0
0.75
1.5
2.25
3
3.75
4.5
0 10 20 30 40 50 60 70 80 90 100Fl
oor l
evel
(m)
Maximum roof displacement (mm)
0.130g-T0.264g-T0.415g-T0.750g-T0.130g-S0.264g-S0.415g-S0.750g-S
(b) Simulated and tested maximum displacement under ELW
0
0.75
1.5
2.25
3
3.75
4.5
0 10 20 30 40 50 60 70 80 90 100
Floo
r lev
el (m
)
Maximum roof displacement (mm)
0.130g-T 0.264g-T0.415g-T 0.750g-T0.130g-S 0.264g-S0.415g-S 0.750g-S
(c) Simulated and tested maximum displacement under SHW
Fig. 12.70 Simulated and tested maximum displacement of precast RAC model (Note T – testresults, S – simulation results)
514 12 Seismic Performance of Recycled Aggregate Concrete Structures

base shears follow the trend of tested values but smaller than those of test. Forinstance, most of the relative errors are within 30% until the test phase with PGA of0.415 g was input. Thereafter, the relative errors increase as the amplitude of PGAsincreases, especially in case of WCW and ELW. From Table 12.41, it is clearlyseen that the best correlation between simulated and tested maximum base shear isunder SHW and followed WCW and ELW.
By tracking the maximum base shear and the corresponding roof displacement,the simulated and tested capacity curve in the form of exponential function is alsoconstructed, respectively, as in Eqs. (12.22a) and (12.22b) in order to compare witheach other as shown in Fig. 12.73.
-25
-15
-5
5
15
25
0 5 10 15 20 25 30
Roo
f di
spla
cem
ent (
mm
)
Time (s)
SHW 0.264g-S
SHW 0.264g-T
a) Test phase SHW with PGA of 0.264g
-60
-40
-20
0
20
40
60
0 5 10 15 20 25 30
Roo
f dis
plac
emen
t (m
m)
Time (s)
SHW 0.415g-S
SHW 0.415g-T
b) Test phase SHW with PGA of 0.415g
-100
-50
0
50
100
0 5 10 15 20 25 30
Roo
f dic
plac
emen
t (m
m)
Time (s)
SHW 0.750g-S
SHW 0.750g-T
c) Test phase SHW with PGA of 0.750g
Fig. 12.71 Comparisons between simulated and tested roof displacement time histories
12.5 Shaking Table Test on Precast Space Frame 515
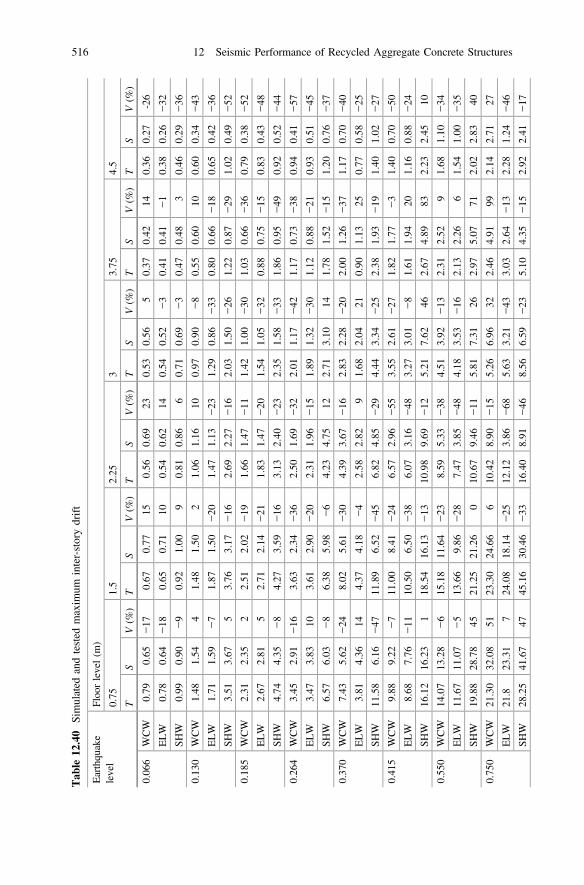
Tab
le12
.40
Simulated
andtested
maxim
uminter-storydrift
Earthqu
ake
level
Floo
rlevel(m
)
0.75
1.5
2.25
33.75
4.5
TS
V(%
)T
SV(%
)T
SV(%
)T
SV(%
)T
SV(%
)T
SV(%
)
0.06
6WCW
0.79
0.65
−17
0.67
0.77
150.56
0.69
230.53
0.56
50.37
0.42
140.36
0.27
-26
ELW
0.78
0.64
−18
0.65
0.71
100.54
0.62
140.54
0.52
−3
0.41
0.41
−1
0.38
0.26
−32
SHW
0.99
0.90
−9
0.92
1.00
90.81
0.86
60.71
0.69
−3
0.47
0.48
30.46
0.29
−36
0.13
0WCW
1.48
1.54
41.48
1.50
21.06
1.16
100.97
0.90
−8
0.55
0.60
100.60
0.34
−43
ELW
1.71
1.59
−7
1.87
1.50
−20
1.47
1.13
−23
1.29
0.86
−33
0.80
0.66
−18
0.65
0.42
−36
SHW
3.51
3.67
53.76
3.17
−16
2.69
2.27
−16
2.03
1.50
−26
1.22
0.87
−29
1.02
0.49
−52
0.18
5WCW
2.31
2.35
22.51
2.02
−19
1.66
1.47
−11
1.42
1.00
−30
1.03
0.66
−36
0.79
0.38
−52
ELW
2.67
2.81
52.71
2.14
−21
1.83
1.47
−20
1.54
1.05
−32
0.88
0.75
−15
0.83
0.43
−48
SHW
4.74
4.35
−8
4.27
3.59
−16
3.13
2.40
−23
2.35
1.58
−33
1.86
0.95
−49
0.92
0.52
−44
0.26
4WCW
3.45
2.91
−16
3.63
2.34
−36
2.50
1.69
−32
2.01
1.17
−42
1.17
0.73
−38
0.94
0.41
−57
ELW
3.47
3.83
103.61
2.90
−20
2.31
1.96
−15
1.89
1.32
−30
1.12
0.88
−21
0.93
0.51
−45
SHW
6.57
6.03
−8
6.38
5.98
−6
4.23
4.75
122.71
3.10
141.78
1.52
−15
1.20
0.76
−37
0.37
0WCW
7.43
5.62
−24
8.02
5.61
−30
4.39
3.67
−16
2.83
2.28
−20
2.00
1.26
−37
1.17
0.70
−40
ELW
3.81
4.36
144.37
4.18
−4
2.58
2.82
91.68
2.04
210.90
1.13
250.77
0.58
−25
SHW
11.58
6.16
−47
11.89
6.52
−45
6.82
4.85
−29
4.44
3.34
−25
2.38
1.93
−19
1.40
1.02
−27
0.41
5WCW
9.88
9.22
−7
11.00
8.41
−24
6.57
2.96
−55
3.55
2.61
−27
1.82
1.77
−3
1.40
0.70
−50
ELW
8.68
7.76
−11
10.50
6.50
−38
6.07
3.16
−48
3.27
3.01
−8
1.61
1.94
201.16
0.88
−24
SHW
16.12
16.23
118
.54
16.13
−13
10.98
9.69
−12
5.21
7.62
462.67
4.89
832.23
2.45
10
0.55
0WCW
14.07
13.28
−6
15.18
11.64
−23
8.59
5.33
−38
4.51
3.92
−13
2.31
2.52
91.68
1.10
−34
ELW
11.67
11.07
−5
13.66
9.86
−28
7.47
3.85
−48
4.18
3.53
−16
2.13
2.26
61.54
1.00
−35
SHW
19.88
28.78
4521
.25
21.26
010
.67
9.46
−11
5.81
7.31
262.97
5.07
712.02
2.83
40
0.75
0WCW
21.30
32.08
5123
.30
24.66
610
.42
8.90
−15
5.26
6.96
322.46
4.91
992.14
2.71
27
ELW
21.8
23.31
724
.08
18.14
−25
12.12
3.86
−68
5.63
3.21
−43
3.03
2.64
−13
2.28
1.24
−46
SHW
28.25
41.67
4745
.16
30.46
−33
16.40
8.91
−46
8.56
6.59
−23
5.10
4.35
−15
2.92
2.41
−17
516 12 Seismic Performance of Recycled Aggregate Concrete Structures

s Dð Þ ¼ 55:55 e�0:00293D � e�0:1148D� �0�D� 76:55 ð12:22aÞ
s Dð Þ ¼ 99:39 e�0:007783D � e�0:062836D� �
0�D� 68:11 ð12:22bÞ
where, sðDÞ is the base shear (kN) and D is the roof displacement (mm).The illustration from Fig. 12.73 reveals that the simulated capacity curve
coincides with the tested capacity curves when the model behaves in the linearstage. After the cracks appeared, which is determined by cracking point as pre-sented in Table 12.42, the simulated structure passed the yield load and reached themaximum load, which are 27 and 24% smaller than those of test results, respec-tively. Then, the load capacity and lateral stiffness of the overall structure of thesimulated curve reduce less than those of test results. Although the values of feature
0
0.75
1.5
2.25
3
3.75
4.5
0 5 10 15 20 25 30 35
Floo
r lev
el (m
)
Maximum story drift (mm)
0.130g-T 0.264g-T
0.415g-T 0.750g-T
0.130g-S 0.264g-S
0.415g-S 0.750g-S
(a) Simulated and tested maximum inter-story drifts under WCW
0
0.75
1.5
2.25
3
3.75
4.5
0 5 10 15 20 25
Floo
r lev
el (m
)
Maximum story drift (mm)
0.130g-T 0.264g-T
0.415g-T 0.750g-T
0.130g-S 0.264g-S
0.415g-S 0.750g-S
(b) Simulated and tested maximum inter-story drifts under ELW
0
0.75
1.5
2.25
3
3.75
4.5
0 5 10 15 20 25 30 35 40 45 50
Floo
r lev
el (m
)
Maximum story drift (mm)
0.130g-T 0.264g-T
0.415g-T 0.750g-T
0.130g-S 0.264g-S
0.415g-S 0.750g-S
(c) Simulated and tested maximum inter-story drifts under SHW
Fig. 12.72 Simulated and tested maximum inter-story drift of precast RAC model (Note T – testresults, S – simulation results)
12.5 Shaking Table Test on Precast Space Frame 517
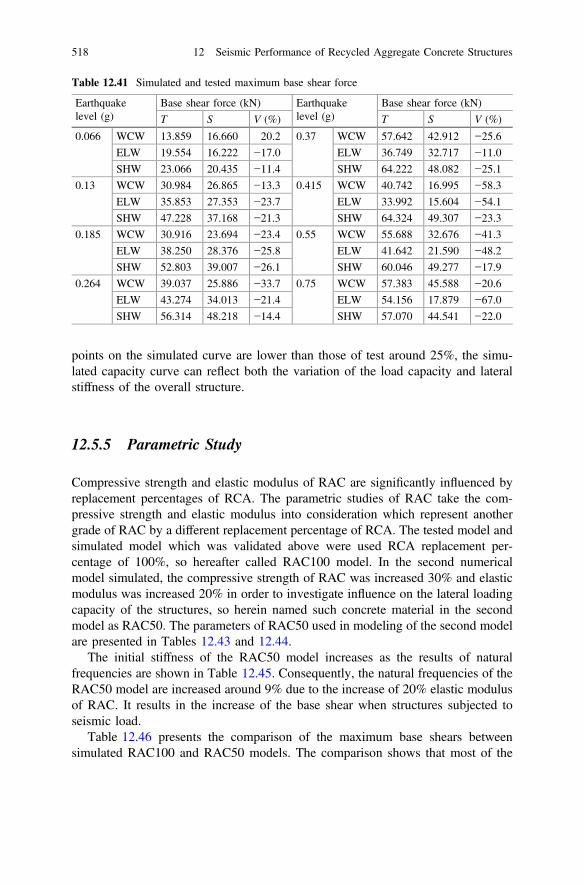
points on the simulated curve are lower than those of test around 25%, the simu-lated capacity curve can reflect both the variation of the load capacity and lateralstiffness of the overall structure.
12.5.5 Parametric Study
Compressive strength and elastic modulus of RAC are significantly influenced byreplacement percentages of RCA. The parametric studies of RAC take the com-pressive strength and elastic modulus into consideration which represent anothergrade of RAC by a different replacement percentage of RCA. The tested model andsimulated model which was validated above were used RCA replacement per-centage of 100%, so hereafter called RAC100 model. In the second numericalmodel simulated, the compressive strength of RAC was increased 30% and elasticmodulus was increased 20% in order to investigate influence on the lateral loadingcapacity of the structures, so herein named such concrete material in the secondmodel as RAC50. The parameters of RAC50 used in modeling of the second modelare presented in Tables 12.43 and 12.44.
The initial stiffness of the RAC50 model increases as the results of naturalfrequencies are shown in Table 12.45. Consequently, the natural frequencies of theRAC50 model are increased around 9% due to the increase of 20% elastic modulusof RAC. It results in the increase of the base shear when structures subjected toseismic load.
Table 12.46 presents the comparison of the maximum base shears betweensimulated RAC100 and RAC50 models. The comparison shows that most of the
Table 12.41 Simulated and tested maximum base shear force
Earthquakelevel (g)
Base shear force (kN) Earthquakelevel (g)
Base shear force (kN)
T S V (%) T S V (%)
0.066 WCW 13.859 16.660 20.2 0.37 WCW 57.642 42.912 −25.6
ELW 19.554 16.222 −17.0 ELW 36.749 32.717 −11.0
SHW 23.066 20.435 −11.4 SHW 64.222 48.082 −25.1
0.13 WCW 30.984 26.865 −13.3 0.415 WCW 40.742 16.995 −58.3
ELW 35.853 27.353 −23.7 ELW 33.992 15.604 −54.1
SHW 47.228 37.168 −21.3 SHW 64.324 49.307 −23.3
0.185 WCW 30.916 23.694 −23.4 0.55 WCW 55.688 32.676 −41.3
ELW 38.250 28.376 −25.8 ELW 41.642 21.590 −48.2
SHW 52.803 39.007 −26.1 SHW 60.046 49.277 −17.9
0.264 WCW 39.037 25.886 −33.7 0.75 WCW 57.383 45.588 −20.6
ELW 43.274 34.013 −21.4 ELW 54.156 17.879 −67.0
SHW 56.314 48.218 −14.4 SHW 57.070 44.541 −22.0
518 12 Seismic Performance of Recycled Aggregate Concrete Structures
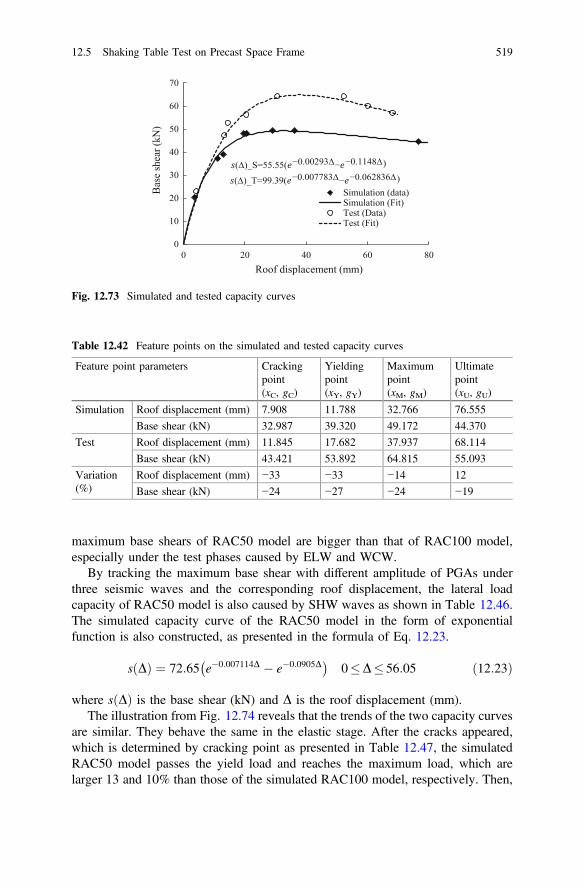
maximum base shears of RAC50 model are bigger than that of RAC100 model,especially under the test phases caused by ELW and WCW.
By tracking the maximum base shear with different amplitude of PGAs underthree seismic waves and the corresponding roof displacement, the lateral loadcapacity of RAC50 model is also caused by SHW waves as shown in Table 12.46.The simulated capacity curve of the RAC50 model in the form of exponentialfunction is also constructed, as presented in the formula of Eq. 12.23.
s Dð Þ ¼ 72:65 e�0:007114D � e�0:0905D� �0�D� 56:05 ð12:23Þ
where sðDÞ is the base shear (kN) and D is the roof displacement (mm).The illustration from Fig. 12.74 reveals that the trends of the two capacity curves
are similar. They behave the same in the elastic stage. After the cracks appeared,which is determined by cracking point as presented in Table 12.47, the simulatedRAC50 model passes the yield load and reaches the maximum load, which arelarger 13 and 10% than those of the simulated RAC100 model, respectively. Then,
0
10
20
30
40
50
60
70
0 20 40 60 80
Base
shea
r (kN
)
Roof displacement (mm)
Simulation (data)Simulation (Fit)Test (Data)Test (Fit)
(∆)_T=99.39( − )(∆)_S=55.55( − )
Fig. 12.73 Simulated and tested capacity curves
Table 12.42 Feature points on the simulated and tested capacity curves
Feature point parameters Crackingpoint(xC, gC)
Yieldingpoint(xY, gY)
Maximumpoint(xM, gM)
Ultimatepoint(xU, gU)
Simulation Roof displacement (mm) 7.908 11.788 32.766 76.555
Base shear (kN) 32.987 39.320 49.172 44.370
Test Roof displacement (mm) 11.845 17.682 37.937 68.114
Base shear (kN) 43.421 53.892 64.815 55.093
Variation(%)
Roof displacement (mm) −33 −33 −14 12
Base shear (kN) −24 −27 −24 −19
12.5 Shaking Table Test on Precast Space Frame 519

the load capacity of the overall RAC50 structure reduces but still higher than thoseof RAC100 model.
Based on Table 12.47, it can be seen that the increase of compressive strengthand elastic modulus of RAC results in the increase of the lateral load capacity andreduction of the roof displacement. As a result, the simulated capacity curves ofboth two models can reflect both the variation of the load capacity and lateralstiffness of the overall structure.
Table 12.43 Parameters of RAC50 material model for beams
Index Unconfined concrete Unconfined concrete
f 0c(MPa)
e00(10−3)
0:2f 0c(MPa)
e020(10−3)
Ec(GPa)
K � f 0c(MPa)
e00(10−3)
0:2Kf 0c(MPa)
e020(10−3)
Ec(GPa)
Precast RAC Cast-in-situ RAC
Story 1F 42.29 2.20 8.46 3.27 29.76 39.46 2.20 7.89 3.32 29.11
2F 33.79 2.20 6.76 3.45 27.64 48.32 2.20 9.66 3.16 30.94
3F 36.39 2.20 7.28 3.39 28.36 41.63 2.20 8.33 3.28 29.62
4F 34.18 2.20 6.84 3.44 27.74 42.39 2.20 8.48 3.26 29.78
5F 31.15 2.20 6.23 3.53 26.82 37.80 2.20 7.56 3.36 28.72
6F 41.57 2.20 8.31 3.28 29.60 36.53 2.20 7.31 3.39 28.39
Table 12.44 Parameters of RAC50 material model for columns
Index Unconfined concreteElastic modulus
Confined concreteElastic modulus
f 0c(MPa)
e0o(10−3)
0:2f 0c(MPa)
e020(10−3)
Ec(GPa)
K � f 0c(MPa)
e0o(10−3)
0:2Kf 0c(MPa)
e020(10−3)
Ec(GPa)
Precast RAC Cast-in-situ RAC
Story 1F 36.19 2.20 7.24 4.63 28.30 40.82 2.48 8.16 53.05 28.30
2F 34.21 2.20 6.84 4.84 27.76 38.60 2.48 7.72 53.20 27.76
3F 37.71 2.20 7.54 4.50 28.69 42.52 2.48 8.50 52.95 28.69
4F 37.55 2.20 7.51 4.51 28.66 42.34 2.48 8.47 52.96 28.66
5F 36.80 2.20 7.36 4.58 28.46 41.50 2.48 8.30 53.01 28.46
6F 36.03 2.20 7.21 4.65 28.26 40.64 2.48 8.13 53.06 28.26
Table 12.45 Natural frequencies of model RAC100 and RAC50
Initial X-direction Y-direction
First frequency(Hz)
Second frequency(Hz)
First frequency(Hz)
Second frequency(Hz)
RAC50 model 4.475 13.691 4.565 13.963
RAC100 model 4.110 12.578 4.210 12.879
Variation (%) 8.9 8.9 8.4 8.4
520 12 Seismic Performance of Recycled Aggregate Concrete Structures
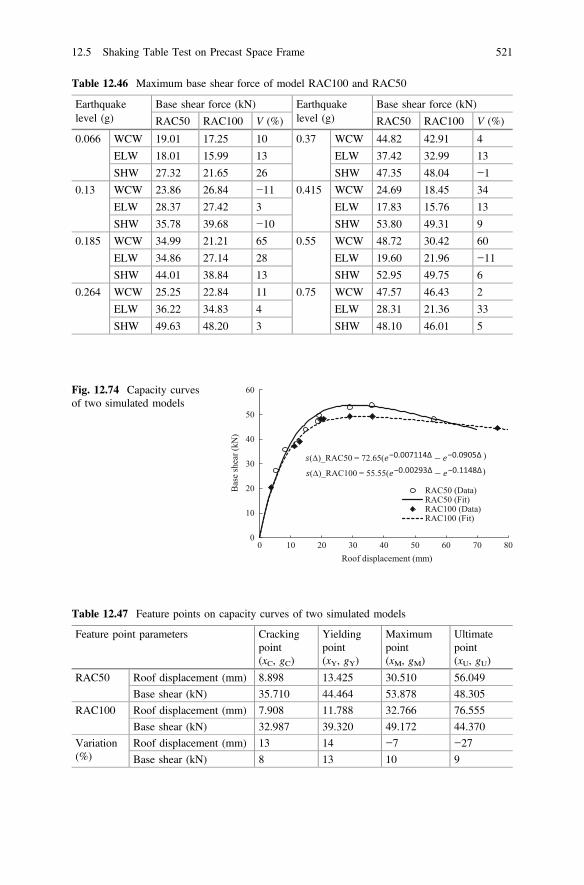
Table 12.46 Maximum base shear force of model RAC100 and RAC50
Earthquakelevel (g)
Base shear force (kN) Earthquakelevel (g)
Base shear force (kN)
RAC50 RAC100 V (%) RAC50 RAC100 V (%)
0.066 WCW 19.01 17.25 10 0.37 WCW 44.82 42.91 4
ELW 18.01 15.99 13 ELW 37.42 32.99 13
SHW 27.32 21.65 26 SHW 47.35 48.04 −1
0.13 WCW 23.86 26.84 −11 0.415 WCW 24.69 18.45 34
ELW 28.37 27.42 3 ELW 17.83 15.76 13
SHW 35.78 39.68 −10 SHW 53.80 49.31 9
0.185 WCW 34.99 21.21 65 0.55 WCW 48.72 30.42 60
ELW 34.86 27.14 28 ELW 19.60 21.96 −11
SHW 44.01 38.84 13 SHW 52.95 49.75 6
0.264 WCW 25.25 22.84 11 0.75 WCW 47.57 46.43 2
ELW 36.22 34.83 4 ELW 28.31 21.36 33
SHW 49.63 48.20 3 SHW 48.10 46.01 5
0
10
20
30
40
50
60
0 10 20 30 40 50 60 70 80
Bas
e sh
ear (
kN)
Roof displacement (mm)
RAC50 (Data)RAC50 (Fit)RAC100 (Data)RAC100 (Fit)
(∆)_RAC50 = 72.65( )
(∆)_RAC100 = 55.55( )
Fig. 12.74 Capacity curvesof two simulated models
Table 12.47 Feature points on capacity curves of two simulated models
Feature point parameters Crackingpoint(xC, gC)
Yieldingpoint(xY, gY)
Maximumpoint(xM, gM)
Ultimatepoint(xU, gU)
RAC50 Roof displacement (mm) 8.898 13.425 30.510 56.049
Base shear (kN) 35.710 44.464 53.878 48.305
RAC100 Roof displacement (mm) 7.908 11.788 32.766 76.555
Base shear (kN) 32.987 39.320 49.172 44.370
Variation(%)
Roof displacement (mm) 13 14 −7 −27
Base shear (kN) 8 13 10 9
12.5 Shaking Table Test on Precast Space Frame 521
12.6 Concluding Remarks
1. All the investigated frames behave similarly in the aspects of the failure patternunder low-frequency lateral loading regardless of the recycled coarse aggregatereplacement percentage. That is, the frames failed at the end of beams then at thebottom of columns, which is characterized in a manner of “strongest joints,stronger columns and weaker beams.” The presence of recycled coarse aggre-gates (RCA) reduces the yield, maximum, and ultimate loads of frames madewith RAC; however, this reduction is less than that of the mechanical propertiesof the RAC material. From the hysteresis loops, the energy dissipation, and therigidity degradation points of view, the seismic performance of frames withrecycled aggregate concrete is comparable to that with conventional concrete.The frames with properly mix-designed recycled aggregate concrete are goodenough to resist an earthquake according to Chinese code GB 50011-2001, andit is feasible to apply the recycled aggregate concrete (RAC) structures in civilengineering.
2. In shake-table model tests, for the RAC frame structure with 100% RCA, failurefirst occurred at the end of the beams and then at the bottom of columns, whichis characterized in a manner of “strongest joints, stronger columns and weakerbeams.” The distribution of the maximum seismic force can be assumed toincrease linearly with height during the elastic analysis stage and is in accor-dance with the distribution of the seismic force in an equivalent base shearmethod. With the amplitude of earthquake inputs increased, the structure step-ped into the elastic–plastic range. The influence of high-order vibration modesthen increased gradually and the distribution of seismic force was no longerlinear. After the 0.550 g test phase, the elements at the first story for both theRAC frame model and NAC frame model under intense ground shaking reachtheir capacity and start experiencing strength softening, which plays animportant role in the assessment of global and local damage of the structures.
3. The cracking propagation and failure pattern of the precast RAC model indicatethat all precast RAC components of the structure work together well thanks toCIP joints. The crack pattern of joints in precast frame made of RAC is rela-tively similar to that of precast frame made of natural aggregate concrete (NAC).The seismic responses including acceleration amplifying coefficient, seismicforce, and base shear show the distributions with the recognized rules along theheight of the model in the elastic stage. The capacity curve reveals good seismicbehavior with a ductility coefficient of 3.852 and the reduction in lateral stiffnesswithout any abrupt changes associated with sufficient load-bearing capacity.Although some joints cracked, satisfactory hysteresis behavior was obtained.The result indicates that the CIP joints between precast RAC elements willsupply sufficient shear capacity and ensure a certain level of seismic resistance.
4. Both experimental and numerical simulation analysis shown that the precastRAC frame structure, in which precast RAC beams and columns elements wereconnected by cast-in-situ RAC, has enough capacity to resist a severe
522 12 Seismic Performance of Recycled Aggregate Concrete Structures

earthquake load. The good seismic resistance of the model has been convec-tively proved by the results of the shaking table test and a further report onanalysis and evaluation of seismic performance of the precast RAC framestructure will be devoted to enhance the emulation of such kind of precast framestructure. Therefore, the construction process and designing of the model couldbe considered as a reference for aseismic precast frame structures made of RAC.
References
1. Xiao JZ, Li WG, Fan YH, et al. An overview of study on recycled aggregate concrete inChina (1996–2011). Constr Build Mater. 2012;31(6):364–83.
2. Han BC, Yun HD, Chung SY. Shear capacity of reinforced concrete beams made withrecycled aggregate. In: CANMET/ACI international conference on recent advances inconcrete technology. 2001.
3. Andrzej A. Long-term behaviour of reinforced-concrete beams and columns made of recycledaggregate concrete. In: Symposium PRAGUE. Czech; 2011.
4. Zhou JH, Wang XB, Yu TH. Mechanic behavior test on recycled concrete simply-supportedrectangular slabs. J Shenyang Jianzhu Univ (Nat Sci Ed). 2008;4(3):411–5 (in Chinese).
5. Scott BD, Park R, Priestley MJN. Stress-strain behavior of concrete confined by overlappinghoops at low and high strain rates. ACI J. 1982;79(1):13–27.
6. Filippou FC, Ambrisi AD, Issa A. Effects of reinforcement slip on hysteretic behavior ofreinforced concrete frame members. ACI Struct J. 1999;96(3):327–35.
7. Park R. Seismic design considerations for precast concrete construction in seismic zones, vol.1. Seminar on precast concrete construction in seismic zones, Japan Society for the Promotionof Science—United States National Science Foundation, Tokyo; 1986. pp 1–38.
8. Ericson AC, Warnes CE. Seismic technology for precast concrete systems. Concrete IndustryBulletin, Concrete Industry Board, Inc.; 1990.
9. Mujumdar V et al. Emulating cast-in-place detailing in precast concrete structures (ACI550.1R-01). American Concrete Institute; 2001.
10. Buckingham E. On physically similar system. Phys Rev. 1914;4(4):345–76.11. Andreas S, Benson S, Joel C. Design, scaling, similitude, and modeling of shake-table test
structures. Shake Table Training Workshop 2010—San Diego, CA; 2010.12. Alcocer SM, Carranza R, Navarrete DP, Martinez R. Seismic tests of beam-to-column
connections in a precast concrete frame. PCI J. 2002;47(3):70–89.13. Xue WC, Yang XL. Seismic tests of precast concrete, moment-resisting frames and
connections. PCI J. 2010;55(3):102–21.14. Kent DC, Park R. Flexural members with confined concrete. J Struct Div. 1971;97(7):
1969–90.15. Yassin MHM. Nonlinear analysis of prestressed concrete structures under monotonic and
cyclic loads. California: University of California. Berkeley; 1994.16. Mander B, Priestley MJN, Park R. Observed stress-strain behavior of confined concrete.
J Struct Eng. 1998;114(8):1827–49.17. Montya E. Modeling of confined concrete, in department of civil engineering. National
Library of Canada: University of Toronto; 2000.18. Mazzoni S, Mckenna F, Fenves GL. Open system for earthquake engineering simulation user
command language manual, Version 2.3.2. Berkeley: Pacific Earthquake EngineeringResearch Center, University of California; 2011.
12.6 Concluding Remarks 523

19. Paulay T, Priestley MJN. Seismic design of reinforced concrete and masonary buildings.USA: John Wiley & Sons Inc; 1992.
20. Filippou F.C., D’Ambrisi A., and Issa A. Nonlinear static and dynamic analysis of reinforcedconcrete subassemblages. Report No. UCB/EERC–92/08. Berkeley: Earthquake EngineeringResearch Center, University of California; 1992.
21. Rinawi AM, Clough RW. Shaking table-structure interaction. Report to the national ScienceFoundation 1991. Report No.UCB/EERC-91/13; 1991.
524 12 Seismic Performance of Recycled Aggregate Concrete Structures
Chapter 13Seismic Performance of RecycledAggregate Concrete Block Structures
Abstract The experimental study was focused on the seismic performance ofrecycled aggregate concrete (RAC) hollow block walls confined by ring beam andtie column under low cyclic horizontal loading. Investigations on the damageprocess, failure mode, load-bearing, and deformation capacity show that the hollowblock wall with RAC has favorable displacement ductility and energy dissipationcapacity. Furthermore, the contribution of ring beam-tie column system on theseismic performance of RAC hollow block walls was also examined. The resultsshow that the vertical compression stress of RAC hollow blocks is the main factorinfluencing the seismic performance, whereas the reinforcement ratio for ringbeams and tie columns only has limited effect. Compared to the hollow block wallwith NAC, the hollow block wall with RAC has similar seismic performance.Furthermore, a full-scale model of a RAC block masonry building with the tiecolumn + ring beam + cast-in-situ slab system, was tested on the MTS shake table.The natural frequency, equivalent stiffness, structural damping ratio, accelerationresponse, seismic force response, displacement response, base shear response,structural fragility, etc. were analyzed and discussed. The test results demonstratethat RAC block masonry structure confined by the “tie column + ring beam”system is a good solution to withstand earthquakes. The storey drift ratio and theoverall behavior satisfy requirements of the Chinese design code. And generally,RAC block masonry structure bounded by the tie column-ring beam system withproper design exhibits good seismic behavior and can resist earthquake attacksunder different seismic levels.
13.1 Design of the RAC Hollow Block Walls
13.1.1 Test Specimens
A total of 4 full-scale specimens were tested. The specimen section size andreinforcement details are shown in Fig. 13.1. RAC hollow blocks in Fig. 13.2 are
© Springer-Verlag GmbH Germany 2018J. Xiao, Recycled Aggregate Concrete Structures,Springer Tracts in Civil Engineering, https://doi.org/10.1007/978-3-662-53987-3_13
525

classified into three categories denoted by A, B, and C. Materials and mechanicalproperties of hollow blocks and RAC are listed in Tables 13.1, 13.2, and 13.3according to [1], respectively. Moreover, mechanical properties of the steel rebarsare listed in Table 13.4.
In order to simulate the fixed boundary of RAC hollow block wall, a400 � 400 mm base beam was designed. The masonry work of the 4 specimenswas completed by the same worker to insure consistency. Horizontal mortar seamsbetween RAC hollow block with either of the base beam or the ring beam wereM10.0 so that a reliable delivery of horizontal seismic shear can be insured [2]. Thejunctions of tie columns and RAC hollow blocks consisted of mortar and rebars.
Fig. 13.1 Sections and reinforcement details of the specimens (Unit: mm)
Fig. 13.2 RAC hollow block
526 13 Seismic Performance of Recycled Aggregate Concrete …
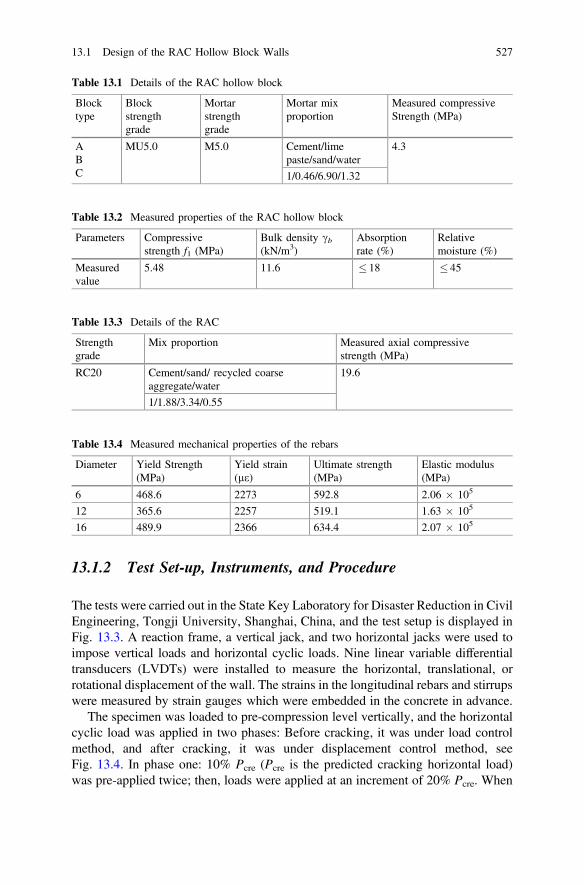
13.1.2 Test Set-up, Instruments, and Procedure
The tests were carried out in the State Key Laboratory for Disaster Reduction in CivilEngineering, Tongji University, Shanghai, China, and the test setup is displayed inFig. 13.3. A reaction frame, a vertical jack, and two horizontal jacks were used toimpose vertical loads and horizontal cyclic loads. Nine linear variable differentialtransducers (LVDTs) were installed to measure the horizontal, translational, orrotational displacement of the wall. The strains in the longitudinal rebars and stirrupswere measured by strain gauges which were embedded in the concrete in advance.
The specimen was loaded to pre-compression level vertically, and the horizontalcyclic load was applied in two phases: Before cracking, it was under load controlmethod, and after cracking, it was under displacement control method, seeFig. 13.4. In phase one: 10% Pcre (Pcre is the predicted cracking horizontal load)was pre-applied twice; then, loads were applied at an increment of 20% Pcre. When
Table 13.1 Details of the RAC hollow block
Blocktype
Blockstrengthgrade
Mortarstrengthgrade
Mortar mixproportion
Measured compressiveStrength (MPa)
ABC
MU5.0 M5.0 Cement/limepaste/sand/water
4.3
1/0.46/6.90/1.32
Table 13.2 Measured properties of the RAC hollow block
Parameters Compressivestrength f1 (MPa)
Bulk density cb(kN/m3)
Absorptionrate (%)
Relativemoisture (%)
Measuredvalue
5.48 11.6 � 18 � 45
Table 13.3 Details of the RAC
Strengthgrade
Mix proportion Measured axial compressivestrength (MPa)
RC20 Cement/sand/ recycled coarseaggregate/water
19.6
1/1.88/3.34/0.55
Table 13.4 Measured mechanical properties of the rebars
Diameter Yield Strength(MPa)
Yield strain(le)
Ultimate strength(MPa)
Elastic modulus(MPa)
6 468.6 2273 592.8 2.06 � 105
12 365.6 2257 519.1 1.63 � 105
16 489.9 2366 634.4 2.07 � 105
13.1 Design of the RAC Hollow Block Walls 527

the load reached 80% Pcre, the loading step was reduced to 10% Pcre. In phase two:Displacement increment at each step was 1 mm, and both push and pull loads wereapplied twice. After Pmax, displacement increment at each step was increased to2–4 mm until the specimen’s failure.
13.2 Test Results of the RAC Hollow Block Walls
13.2.1 Failure Patterns
Figure 13.5 shows the cracking patterns of the specimens. The three stages aredescribed as follows: The first stage was within the load control period before theappearance of the first crack and the load-displacement curves were approximatelylinear. The second stage was within the displacement control period from crack-ing load to the peak load within this stage, several horizontal ladder shaped cracks
Fig. 13.3 Test setup
Fig. 13.4 Loading procedure
528 13 Seismic Performance of Recycled Aggregate Concrete …
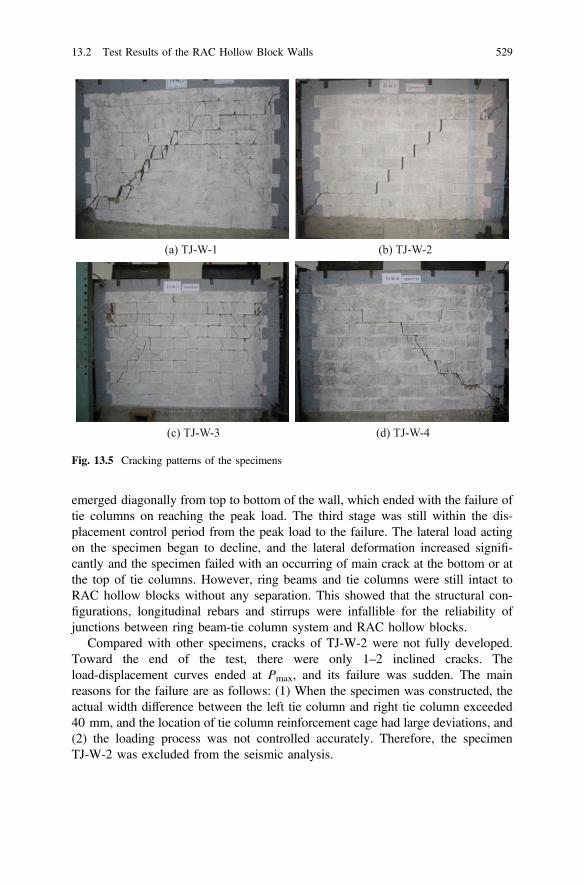
emerged diagonally from top to bottom of the wall, which ended with the failure oftie columns on reaching the peak load. The third stage was still within the dis-placement control period from the peak load to the failure. The lateral load actingon the specimen began to decline, and the lateral deformation increased signifi-cantly and the specimen failed with an occurring of main crack at the bottom or atthe top of tie columns. However, ring beams and tie columns were still intact toRAC hollow blocks without any separation. This showed that the structural con-figurations, longitudinal rebars and stirrups were infallible for the reliability ofjunctions between ring beam-tie column system and RAC hollow blocks.
Compared with other specimens, cracks of TJ-W-2 were not fully developed.Toward the end of the test, there were only 1–2 inclined cracks. Theload-displacement curves ended at Pmax, and its failure was sudden. The mainreasons for the failure are as follows: (1) When the specimen was constructed, theactual width difference between the left tie column and right tie column exceeded40 mm, and the location of tie column reinforcement cage had large deviations, and(2) the loading process was not controlled accurately. Therefore, the specimenTJ-W-2 was excluded from the seismic analysis.
(a) TJ-W-1 (b) TJ-W-2
(c) TJ-W-3 (d) TJ-W-4
Fig. 13.5 Cracking patterns of the specimens
13.2 Test Results of the RAC Hollow Block Walls 529

13.2.2 The Role of Tie Column
In the second phase, the horizontal cracks appeared on the wall and the tie columns.Meanwhile, the strains of longitudinal rebars developed, which showed that tiecolumns constrained RAC hollow block wall. When the ladder-shaped diagonalcrack reached the wall edge, several shear cracks appeared along the diagonaldirection at the top and bottom of tie columns leading to the failure of tie columnswith increase in the horizontal load. The shear cracking patterns indicated that tiecolumns contributed to the shearing capacity of specimens.
13.2.3 Main Results
The average values of loads and displacements at different stages are summarized inTable 13.5, where Pcr, Pu, and Pmax represent cracking load, 85% peak load andpeak load, respectively. Dcr, Du, and Dmax are the displacement corresponding toPcr, Pu, and Pmax respectively. In comparison with TJ-W-1, the Pcr and Pmax ofTJ-W-3 increased by 25 and 27% respectively. It can be seen that the loadingcapacity of RAC hollow block walls increased with the longitudinal reinforce-ment ratio in tie columns. Compared to those of TJ-W-1, the Pcr and Pmax ofTJ-W-4 increased by 37 and 50%. The loading capacity of RAC hollow block wallswere significantly increased with the increase in vertical compression load.
13.3 Seismic Performance Analysis
13.3.1 Hysteresis Curve
The measured load-displacement (P–D) hysteresis curves for the tested walls areshown in Fig. 13.6. There were some similarities among them except for TJ-W-2which are described as follows: (1) In the first phase, the load-displacement curveswere almost linear, and its hysteresis loops were long and narrow; (2) in the secondphase, cracks developed quickly and the hysteresis loop increased rapidly with anincrease in displacement; and (3) in the last phase, the load started to drop after thepeak and X-shaped diagonal cracks appeared. The bottom of tie columns was cut
Table 13.5 Average load and displacement of specimens
Specimen no. Pcr (kN) Pu (kN) Pmax (kN) Dcr (mm) Du (mm) Dmax (mm)
TJ-W-1 239.29 303.16 357.09 0.666 10.113 5.263
TJ-W-3 305.44 387.64 456.22 1.056 15.064 5.266
TJ-W-4 328.64 455.68 536.23 1.056 8.593 5.874
530 13 Seismic Performance of Recycled Aggregate Concrete …
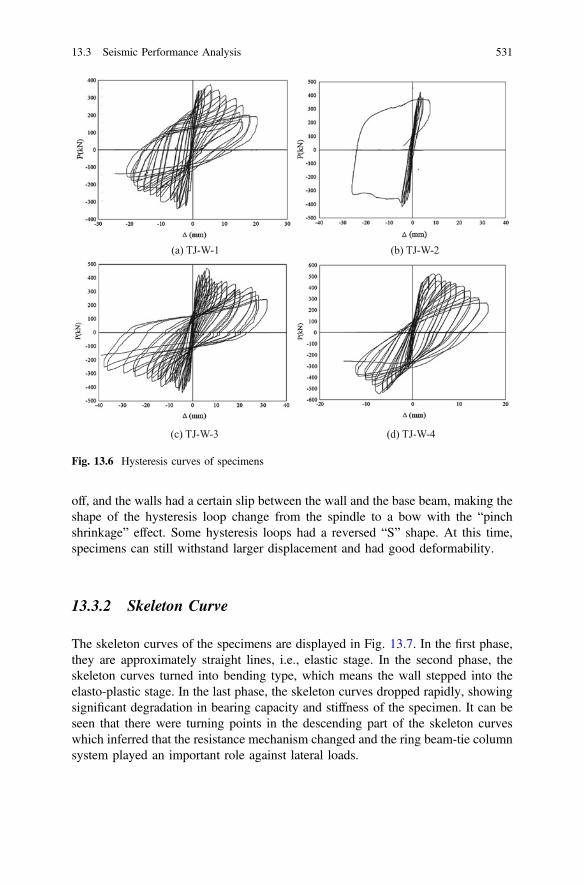
off, and the walls had a certain slip between the wall and the base beam, making theshape of the hysteresis loop change from the spindle to a bow with the “pinchshrinkage” effect. Some hysteresis loops had a reversed “S” shape. At this time,specimens can still withstand larger displacement and had good deformability.
13.3.2 Skeleton Curve
The skeleton curves of the specimens are displayed in Fig. 13.7. In the first phase,they are approximately straight lines, i.e., elastic stage. In the second phase, theskeleton curves turned into bending type, which means the wall stepped into theelasto-plastic stage. In the last phase, the skeleton curves dropped rapidly, showingsignificant degradation in bearing capacity and stiffness of the specimen. It can beseen that there were turning points in the descending part of the skeleton curveswhich inferred that the resistance mechanism changed and the ring beam-tie columnsystem played an important role against lateral loads.
(a) TJ-W-1 (b) TJ-W-2
(c) TJ-W-3 (d) TJ-W-4
Fig. 13.6 Hysteresis curves of specimens
13.3 Seismic Performance Analysis 531

13.3.3 Ductility Analysis
13.3.3.1 Displacement Ductility Coefficients
There are several displacement ductility coefficients commonly used to describe theductility of the walls. The following four coefficients were analyzed in thisinvestigation [2, 3]: (1) the ratio of Dmax to Dcr denoted by l1 (l1 = Dmax/Dcr);(2) the ratio of Du to Dcr denoted by l2 (l2 = Du/Dcr); (3) the ratio of Dmax to Dy (thedisplacement at yield point) denoted by l3 (l3 = Dmax/Dy); and (4) the ratio of Du toDy denoted by l4 (l4 = Du/Dy).
There was no obvious yielding point on P–D curves. Dy was difficult to bedirectly obtained, so the following two kinds of methods were adopted to determinethe equivalent yielding point in the P–D curve: (1) energy equivalence principlemethod (see Fig. 13.8a) and (2) general yield moment method (see Fig. 13.8b). Thecalculated ductility coefficients are presented in Table 13.6. It can be seen fromTable 13.6 that (1) specimen ductility coefficient l1 varied between 5 and 8, l2varied between 8 and 16, l3 varied between 2 and 4 and l4 varied between 3 and 8,indicating that RAC hollow block walls had a good ductility and deformationcapacity; (2) while comparing TJ-W-1 with TJ-W-3, it was seen that the basicductility coefficients (l1 and l3) were reduced by 36.8 and 26.3% respectively,while the expanded ductility coefficient (l2 and l4) changed only a little, with thelongitudinal reinforcement ratio in tie columns increased by 78%. Therefore, we
Fig. 13.7 Skeleton curves of specimens. Notes A1 is the turning point in the skeleton curve ofTJ-W-1; A3 is the turning point in the skeleton curve of TJ-W-3; and A4 is the turning point in theskeleton curve of TJ-W-4
532 13 Seismic Performance of Recycled Aggregate Concrete …
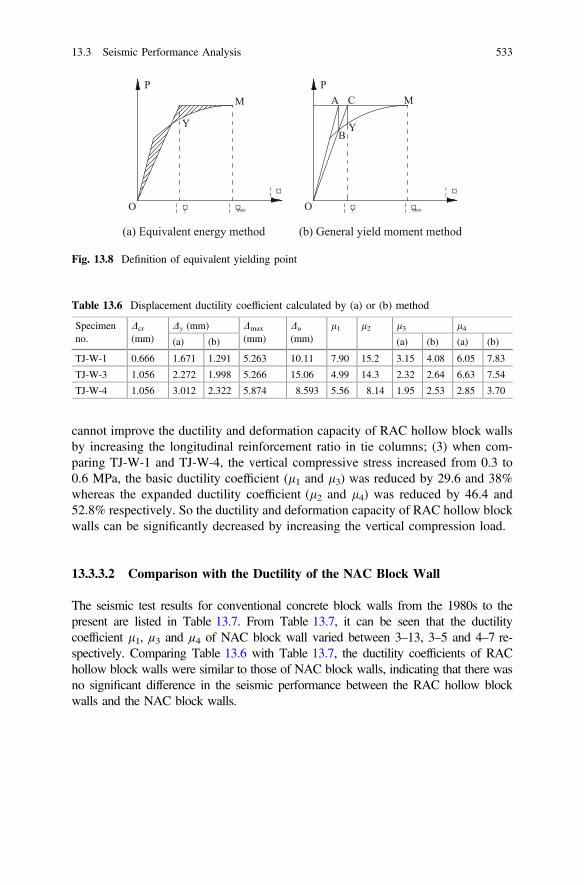
cannot improve the ductility and deformation capacity of RAC hollow block wallsby increasing the longitudinal reinforcement ratio in tie columns; (3) when com-paring TJ-W-1 and TJ-W-4, the vertical compressive stress increased from 0.3 to0.6 MPa, the basic ductility coefficient (l1 and l3) was reduced by 29.6 and 38%whereas the expanded ductility coefficient (l2 and l4) was reduced by 46.4 and52.8% respectively. So the ductility and deformation capacity of RAC hollow blockwalls can be significantly decreased by increasing the vertical compression load.
13.3.3.2 Comparison with the Ductility of the NAC Block Wall
The seismic test results for conventional concrete block walls from the 1980s to thepresent are listed in Table 13.7. From Table 13.7, it can be seen that the ductilitycoefficient l1, µ3 and µ4 of NAC block wall varied between 3–13, 3–5 and 4–7 re-spectively. Comparing Table 13.6 with Table 13.7, the ductility coefficients of RAChollow block walls were similar to those of NAC block walls, indicating that there wasno significant difference in the seismic performance between the RAC hollow blockwalls and the NAC block walls.
¦ ¤
PM
¦ ¤y ¦ ¤maxO
Y
P
¦ ¤y
M
O ¦ ¤max
A C
BY
¦ ¤
(a) Equivalent energy method (b) General yield moment method
Fig. 13.8 Definition of equivalent yielding point
Table 13.6 Displacement ductility coefficient calculated by (a) or (b) method
Specimenno.
Dcr
(mm)Dy (mm) Dmax
(mm)Du
(mm)l1 l2 l3 l4
(a) (b) (a) (b) (a) (b)
TJ-W-1 0.666 1.671 1.291 5.263 10.11 7.90 15.2 3.15 4.08 6.05 7.83
TJ-W-3 1.056 2.272 1.998 5.266 15.06 4.99 14.3 2.32 2.64 6.63 7.54
TJ-W-4 1.056 3.012 2.322 5.874 8.593 5.56 8.14 1.95 2.53 2.85 3.70
13.3 Seismic Performance Analysis 533
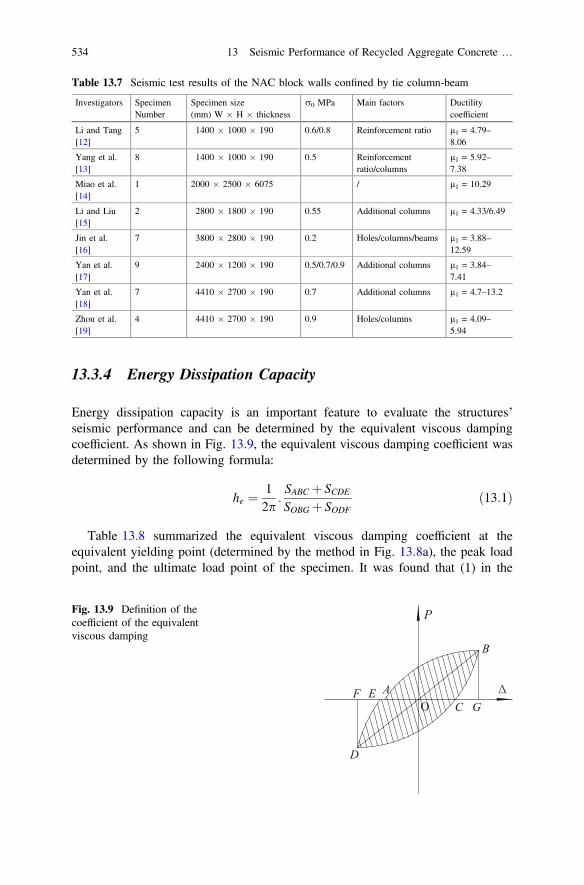
13.3.4 Energy Dissipation Capacity
Energy dissipation capacity is an important feature to evaluate the structures’seismic performance and can be determined by the equivalent viscous dampingcoefficient. As shown in Fig. 13.9, the equivalent viscous damping coefficient wasdetermined by the following formula:
he ¼ 12p
:SABC þ SCDESOBG þ SODF
ð13:1Þ
Table 13.8 summarized the equivalent viscous damping coefficient at theequivalent yielding point (determined by the method in Fig. 13.8a), the peak loadpoint, and the ultimate load point of the specimen. It was found that (1) in the
Table 13.7 Seismic test results of the NAC block walls confined by tie column-beam
Investigators SpecimenNumber
Specimen size(mm) W � H � thickness
r0 MPa Main factors Ductilitycoefficient
Li and Tang[12]
5 1400 � 1000 � 190 0.6/0.8 Reinforcement ratio l1 = 4.79–8.06
Yang et al.[13]
8 1400 � 1000 � 190 0.5 Reinforcementratio/columns
l1 = 5.92–7.38
Miao et al.[14]
1 2000 � 2500 � 6075 / l1 = 10.29
Li and Liu[15]
2 2800 � 1800 � 190 0.55 Additional columns l1 = 4.33/6.49
Jin et al.[16]
7 3800 � 2800 � 190 0.2 Holes/columns/beams l1 = 3.88–12.59
Yan et al.[17]
9 2400 � 1200 � 190 0.5/0.7/0.9 Additional columns l1 = 3.84–7.41
Yan et al.[18]
7 4410 � 2700 � 190 0.7 Additional columns l1 = 4.7–13.2
Zhou et al.[19]
4 4410 � 2700 � 190 0.9 Holes/columns l1 = 4.09–5.94
P
D
B
AO
EFGC
Fig. 13.9 Definition of thecoefficient of the equivalentviscous damping
534 13 Seismic Performance of Recycled Aggregate Concrete …

second stage, the equivalent viscous damping coefficient increased gradually; (2) itcan be seen that when TJ-W-1 and TJ-W-4 were loaded to Pu, the equivalentviscous damping coefficient continued to increase, while the equivalent viscousdamping coefficient of the TJ-W-3 specimen began to decrease. It could be deducedthat the energy dissipation capacity of RAC hollow block walls keeps the same withimproving the ratio of longitudinal rebars in tie columns; and (3) on comparingTJ-W-1 with TJ-W-4, it can be seen that the viscous damping coefficient decreasedby 15% while r0 increased by 100%. Therefore, the energy dissipation capacity ofthe RAC hollow block walls decreased when the vertical compressive stressincreased.
13.3.5 Stiffness Degradation
The secant stiffness of wall specimen was determined by the below formula:
Ki ¼ þPij j þ �Pij jþDij j þ �Dij j ð13:2Þ
where Ki is the secant stiffness; þPi and �Pi are the pull and push peak loadvalues, respectively; þDi and �Di are the pull and push peak displacement values,respectively.
The secant stiffness of the specimen at the characteristic points including theinitial stiffness K0, cracking stiffness Kcr, equivalent yield stiffness Ky, peak loadpoint stiffness Kmax and the ultimate load point stiffness Ku are all summarized inTable 13.9. In order to facilitate the contrasts of stiffness degradation curve of thespecimens a non-dimensional treatment was adopted. The standardized stiffnessdegradation curve was drawn and is shown in Fig. 13.10.
Table 13.8 Equivalent viscous damping ratios of specimens
Specimen no. Equivalent yield point Maximum load point Ultimate load point
TJ-W-1 0.137 0.199 0.232
TJ-W-3 0.125 0.159 0.145
TJ-W-4 0.115 0.170 0.204
Table 13.9 Characteristic secant stiffness of specimens (kN/mm)
Specimen no. K0 Kcr Ky Kmax Ku
TJ-W-1 393.01 359.29 111.61 70.81 32.05
TJ-W-3 373.68 289.24 145.80 86.63 27.40
TJ-W-4 352.73 311.22 121.77 87.24 54.67
13.3 Seismic Performance Analysis 535

In the first stage, the secant stiffness decreased only by 15% mainly due to theformation of micro-cracks. In the second stage, stiffness had a fierce degradation. Atthe equivalent yielding point, the average of wall stiffness was equal to 40.2% Kcr,while at peak load point the average of wall stiffness was equal to 25.9% Kcr. Afterdevelopment of the main crack throughout the wall, secondary cracks had a furtherdevelopment and the degradation of stiffness was stabilized. Comparing TJ-W-1with TJ-W-3, the stiffness degradations were basically the same, indicating that theratio of longitudinal rebars in tie columns has limited effect on the stiffnessdegradation of RAC hollow block walls. Comparing TJ-W-1, TJ-W-3, and TJ-W-4,it was observed that the stiffness degradation decreased as the vertical compressivestress increased because of the limitation on the development of cracks from thevertical stress.
13.3.6 Overall Deformation
Three kinds of deformation characteristics representing the generalized overalllateral displacement curves and the measured overall lateral displacement curves areshown in Figs. 13.11 and 13.12 respectively. In the first phase, the overall lateraldisplacement curves are characterized by bending type, indicating that the hori-zontal load was mainly taken by RAC hollow block walls, which exhibit greaterlateral stiffness. Although, the cracks appeared gradually within the second phase.In the last phase, the horizontal load began to decline, and the shape of overalllateral displacement curve of specimen changed into a shear type curve. This
0.0 0.2 0.4 0.6 0.8 1.00.0
0.2
0.4
0.6
0.8
1.0
K /
Km
ax
/
TJ-W-1 TJ-W-3 TJ-W-4
Fig. 13.10 Stiffness degradation curves of specimens
536 13 Seismic Performance of Recycled Aggregate Concrete …

signifies that the severe damage of blocks, the ring beam-tie column system wasmore involved into withstanding the horizontal load and formed a certain “weakframe” effect.
13.3.7 Steel Strain
The detailed strain developments of longitudinal rebars and stirrups in tie columnsare displayed in Fig. 13.13. Due to the vertical compressive stress imposed bywalls, a slight compressive strain existed in tie columns. Afterwards, the longitu-dinal cracks developed upward in the tie column and also the strain of longitudinalrebars developed rapidly. The bottom longitudinal rebars yielded in the secondphase, while the upper and middle ones yielded at the last stage. The strain of thelongitudinal rebars developed at the same rate as it was in the second phase, while itwas significantly different in the third phase proving to have a “weak frame” effectas mentioned above (see Fig. 13.13a, b). Finally, the yielding of stirrups of tiecolumns are shown in Fig. 13.13c.
13.4 Verification of Shear Bearing Capacity Formulafor Hollow Block Walls
According to the Chinese codes “Seismic Design of Buildings” [4] and “TechnicalSpecification for Concrete Small-size Hollow Block Buildings” [5], the hollowblock wall cross-section seismic shear capacity is calculated by Eq. (13.3).
Fig. 13.11 Deformationcharacterstics of overalllateral displacement curves
13.3 Seismic Performance Analysis 537
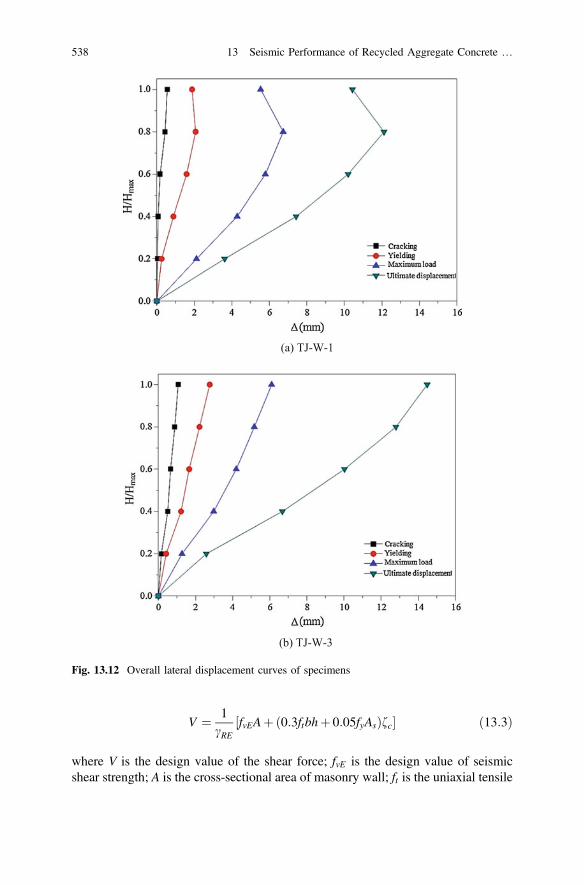
V ¼ 1cRE
½fvEAþð0:3ftbhþ 0:05fyAsÞfc� ð13:3Þ
where V is the design value of the shear force; fvE is the design value of seismicshear strength; A is the cross-sectional area of masonry wall; ft is the uniaxial tensile
(a) TJ-W-1
(b) TJ-W-3
Fig. 13.12 Overall lateral displacement curves of specimens
538 13 Seismic Performance of Recycled Aggregate Concrete …
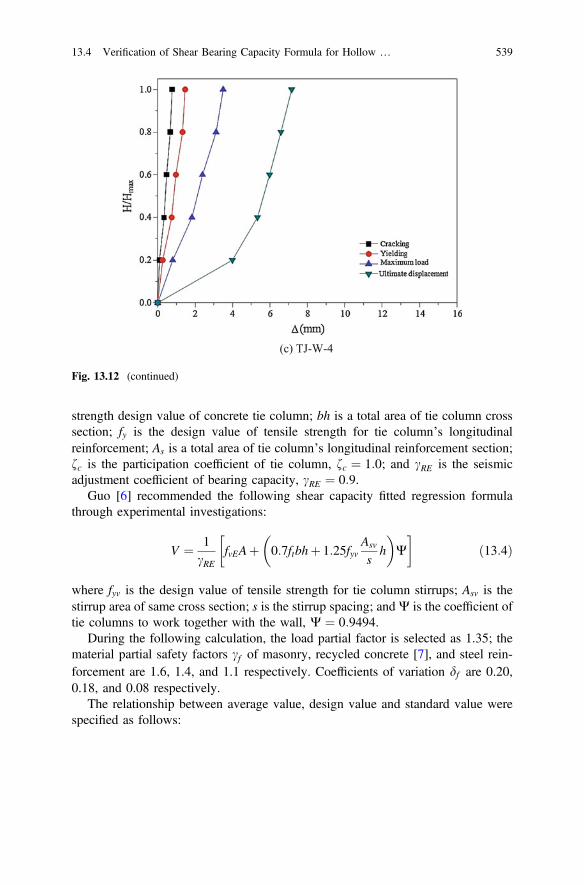
strength design value of concrete tie column; bh is a total area of tie column crosssection; fy is the design value of tensile strength for tie column’s longitudinalreinforcement; As is a total area of tie column’s longitudinal reinforcement section;fc is the participation coefficient of tie column, fc ¼ 1:0; and cRE is the seismicadjustment coefficient of bearing capacity, cRE ¼ 0:9.
Guo [6] recommended the following shear capacity fitted regression formulathrough experimental investigations:
V ¼ 1cRE
fvEAþ 0:7ftbhþ 1:25fyvAsv
sh
� �W
� �ð13:4Þ
where fyv is the design value of tensile strength for tie column stirrups; Asv is thestirrup area of same cross section; s is the stirrup spacing; andW is the coefficient oftie columns to work together with the wall, W ¼ 0:9494.
During the following calculation, the load partial factor is selected as 1.35; thematerial partial safety factors cf of masonry, recycled concrete [7], and steel rein-forcement are 1.6, 1.4, and 1.1 respectively. Coefficients of variation df are 0.20,0.18, and 0.08 respectively.
The relationship between average value, design value and standard value werespecified as follows:
(c) TJ-W-4
Fig. 13.12 (continued)
13.4 Verification of Shear Bearing Capacity Formula for Hollow … 539
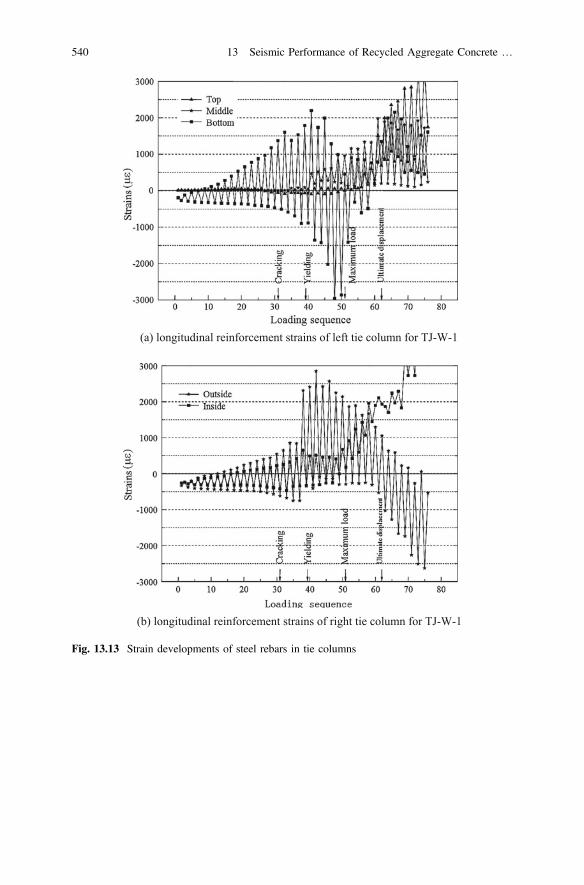
(a) longitudinal reinforcement strains of left tie column for TJ-W-1
(b) longitudinal reinforcement strains of right tie column for TJ-W-1
Fig. 13.13 Strain developments of steel rebars in tie columns
540 13 Seismic Performance of Recycled Aggregate Concrete …
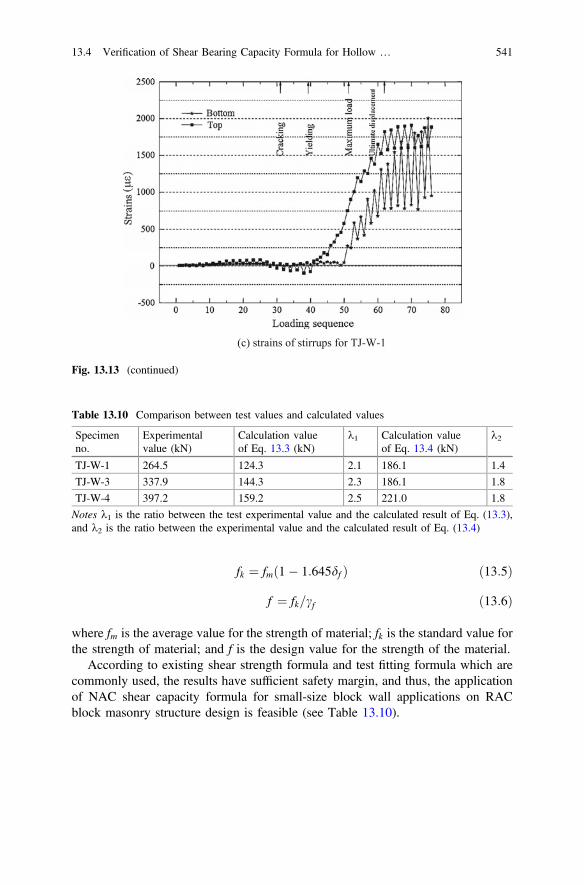
fk ¼ fmð1� 1:645df Þ ð13:5Þ
f ¼ fk=cf ð13:6Þ
where fm is the average value for the strength of material; fk is the standard value forthe strength of material; and f is the design value for the strength of the material.
According to existing shear strength formula and test fitting formula which arecommonly used, the results have sufficient safety margin, and thus, the applicationof NAC shear capacity formula for small-size block wall applications on RACblock masonry structure design is feasible (see Table 13.10).
Table 13.10 Comparison between test values and calculated values
Specimenno.
Experimentalvalue (kN)
Calculation valueof Eq. 13.3 (kN)
k1 Calculation valueof Eq. 13.4 (kN)
k2
TJ-W-1 264.5 124.3 2.1 186.1 1.4
TJ-W-3 337.9 144.3 2.3 186.1 1.8
TJ-W-4 397.2 159.2 2.5 221.0 1.8
Notes k1 is the ratio between the test experimental value and the calculated result of Eq. (13.3),and k2 is the ratio between the experimental value and the calculated result of Eq. (13.4)
(c) strains of stirrups for TJ-W-1
Fig. 13.13 (continued)
13.4 Verification of Shear Bearing Capacity Formula for Hollow … 541

13.5 Design of the RAC Block Masonry Building
13.5.1 Materials
13.5.1.1 RAC Blocks
The recycled concrete hollow block is made of building waste, cement, slag, and flyash and the building waste may be waste concrete or waste tiles. The length, width,and height of the small-size RAC block are 390, 220 and 190 mm respectively asshown in Fig. 13.14. By laboratory tests, the measured average mechanical prop-erties of the RAC block, of nominal strength grade MU5.0 are illustrated inTable 13.11. The mortar of nominal strength grade M7.5 was used in the masonrymodel and the average compressive strength of the mortar cubes is 7.03 MPa.According to Chinese standard code [8], steel bars of HPB235 (plain bar withdiameter of 6 mm and measured yield strength of 468 MPa) and HRB335 (crescentribbed bar with diameter of 12 mm and measured yield strength of 460 MPa) were,respectively, adopted as the stirrups and longitudinal rebars of the tie columns andring beams, and the corresponding measured elastic modulus were 2.06 � 105 MPaand 2.04 � 105 MPa, respectively.
Fig. 13.14 Appearance ofthe RAC block
Table 13.11 Mechanical properties for RAC block
Properties Compressivestrength (MPa)
Bulk density(kN m−3)
Specificabsorption (%)
Relative watercontent (%)
Measuredvalue
5.48 11.6 � 18 � 45
542 13 Seismic Performance of Recycled Aggregate Concrete …

Table 13.12 Mix design forRAC
w/c(%)
S/A(%)
S(kg)
RCA(kg)
C(kg)
W(kg)
55 36 188 334 100 55
13.5.1.2 The RAC Mix Proportion
The RAC mix proportion used for the tie columns and ring beams of the blockmasonry structure, of nominal strength grade C20, was proportioned with theRCA’s replacement percentage of 100% (i.e., the ratio of the RCA’s mass to themass of all the coarse aggregates). The mix proportion of the concrete as describedin Table 13.12 was determined according to a foregoing investigation.Compression tests were also conducted on RAC cubes and prisms to evaluate theRAC’s strengths in compression. The measured average cube compressive strength,prism compressive strength, and elastic modulus of the RAC were 24.78, 19.6, and2.07 � 104 MPa, respectively.
13.5.2 Construction
The height, the bay width and the local depth of the RAC block masonry model are2480, 3000 and 2400 mm respectively. The thickness of the wall of the structure is220 mm and the thickness of the roof slab is 80 mm. The cross-sectional dimensionsof tie column and ring beam are 220 � 220 mm and 220 � 200 mm respectively.
The plane layout, elevation, and connection details for the RAC block masonrymodel are shown in Fig. 13.15. An additional mass of 1600 kg was attached to theroof of the model in order to simulate real loading conditions. Iron blocks and plateswere used as artificial mass and fixed on the roof of the model structure. The totalweight of the model is estimated to be 15.774 tonnes including the foundationbeams, which is less than the loading limitation of the shake table. The block layoutduring the construction of walls is particularly noteworthy. The construction pro-cess of the wall is presented in Fig. 13.16.
13.6 Shake Table Tests
13.6.1 Description of Shake Table
The shake table model test is carried out using MTS shake table facility at the StateKey Laboratory for Disaster Reduction in Civil Engineering, Tongji University,Shanghai, China. The table can input three-dimensional and six degree-of-freedommotions. The dimension of the table is 4000 � 4000 mm. The shake table canvibrate with two maximum accelerations of 1.2 g and 0.8 g horizontally and with amaximum acceleration of 0.7 g vertically.
13.5 Design of the RAC Block Masonry Building 543

13.6.2 Seismic Wave Selection and Arrangementof Instruments
The condition of site soil is one of the important factors to determine the earthquakeinputs for the dynamic test. Type-II site soil in China is defined as soil whosethickness of the soft layer is 3–15 m and the average velocity of the shear wave inthe soil layer is not more than 140 m/s [9]. According to code for seismic design ofbuildings [9], Wenchuan earthquake wave (WCW) should be considered for
(c) Connection detail of tie column - foundation beam
(d) Connection detail of ring beam - tie column
(a) Plan layout (b) Elevation drawing
Fig. 13.15 Plane layout and elevation detail and structural member detail drawing
544 13 Seismic Performance of Recycled Aggregate Concrete …

Type-II site soil. The time history, standard acceleration response spectrum, and fastFourier transfer (FFT) of Wenchuan earthquake wave are shown in Fig. 13.17.Considering the spectral density properties of Type-II site soil, El Centro earth-quake wave (ELW) and Shanghai artificial wave (SHW) were selected. Except thatthe SHW accelerogram which is one-dimensional input, the Wenchuan and ElCentro earthquake records are both two-dimensional inputs. Thus, as stipulated fortwo-dimension horizontal inputs by code for seismic design of buildings [9], theratio of peak ground acceleration (PGA) in the main direction to that in the sec-ondary direction is set as 1:0.85. All accelerograms were scaled to different PGAvalues to represent varying levels of seismic severity. E–W component of theWenchuan earthquake wave and the N–S component of the El Centro earthquakewere matched along with the X-direction of the RAC block masonry model.
In order to monitor the global response of the model structure during tests aswell as the local state including crack developing, etc., a variety of instruments wereinstalled on the model structure before testing. The accelerations, displacements andstrains were measured by accelerometers (A), displacement (D) gauges and straingauges respectively. These transducers were installed and with priority given to themonitoring of key positions. The accelerometers arrangement on the roof is dis-played in Fig. 13.18a.
(a) Wall Q1 (b) Wall Q2
(c) Wall Q3 and Q5 (d) Wall Q4 and Q6
Fig. 13.16 RAC block masonry model construction
13.6 Shake Table Tests 545
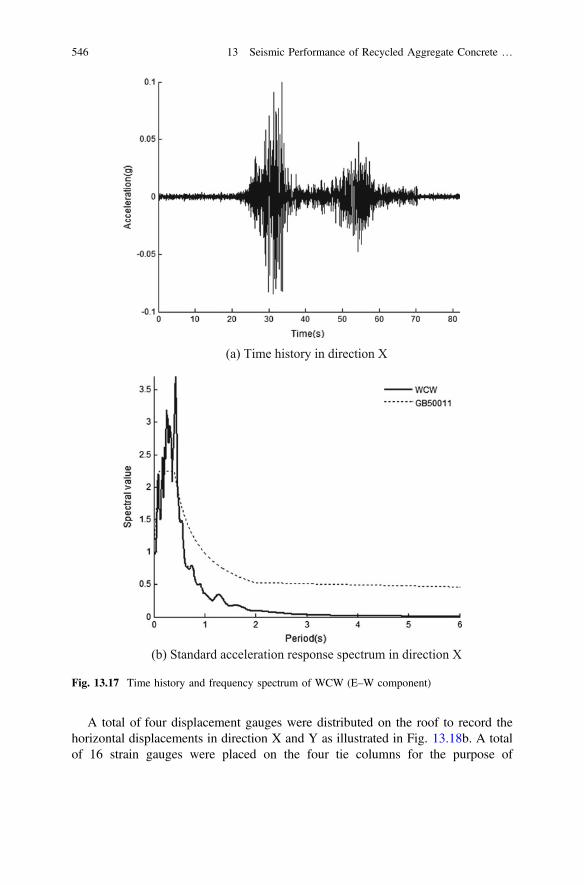
A total of four displacement gauges were distributed on the roof to record thehorizontal displacements in direction X and Y as illustrated in Fig. 13.18b. A totalof 16 strain gauges were placed on the four tie columns for the purpose of
(a) Time history in direction X
(b) Standard acceleration response spectrum in direction X
Fig. 13.17 Time history and frequency spectrum of WCW (E–W component)
546 13 Seismic Performance of Recycled Aggregate Concrete …

monitoring the variation of their strains, including 2 distributed on longitudinalreinforcements and 2 distributed on stirrups of the top and the bottom of each tiecolumn, respectively. All the test data were collected by a computer-controlled dataacquisition system and can be easily transferred to other computers for further
(c) Fast Fourier Transfer in direction X
Fig. 13.17 (continued)
(a) Arrangement of accelerometers at roof level
(b) Displacement gauge arrangement
Fig. 13.18 Arrangement of accelerometers, displacement gauges
13.6 Shake Table Tests 547

analysis. An overview of the model after installation on the shake table facility andthe experimental set-up are shown in Fig. 13.19.
13.6.3 Loading Program
The test program consists of six phases, that is, tests with PGA of 0.071 g (fre-quently occurred earthquake for fortification intensity 8), 0.136, 0.200 g (basicoccurrence for fortification intensity 8), 0.310, 0.410 g (rarely occurred earthquakefor fortification intensity 8), and 0.630 g (rarely occurred earthquake for fortifica-tion intensity 9). The rare intensity 9 test phase was conducted for further inves-tigation of the dynamic response of the targeted structure under quite strongearthquakes. As mentioned in the Sect. 3.2, the RAC block masonry building is afull-scale model, and the time scale is 1. The WCW, ELW, and SHW were inputtedin sequence in the test process. The gradually increasing amplitudes of base exci-tation, which are determined according to the code for seismic design of buildings[9], are inputted successively with the sample period of 0.02 s. White noise stim-ulation with PGA of 0.05 g was input before and after each test phase to determinethe natural frequencies and the damping ratios of the model structure. The detailedtest program, the measured acceleration amplitudes of the shake table, and thevariations between the designed and the measured amplitudes are listed inTable 13.13. It should be noted that the mean value of the variations is around 8.5%and the main excitation is in the X-direction. For each earthquake record oraccelerogram, two tests were performed with the main excitation firstly in theX-direction and then in the Y-direction. The objective of this kind of test schemes isto investigate the influence of evident difference of lateral stiffness in two directionson structural response to ground motions.
Fig. 13.19 General view ofthe RAC block masonrymodel
548 13 Seismic Performance of Recycled Aggregate Concrete …

Table 13.13 Test program
Seriesno.
Input Peak ground acceleration (g)
Direction X Direction Y
Designed Measured Variation(%)
Designed Measured Variation(%)
1 White noise 0.050 – 0.050 –
2 ELWXY 0.071 0.083 16.90 0.061 0.047 22.95
3 ELWYX 0.061 0.086 40.98 0.071 0.096 37.14
4 WCWXY 0.071 0.071 0.00 0.061 0.056 8.20
5 WCWYX 0.061 0.064 4.92 0.071 0.088 23.94
6 SHWX 0.071 0.073 2.82 –
7 SHWY – 0.071 0.091 28.17
8 White noise 0.050 – 0.050 –
9 ELWXY 0.136 0.145 6.62 0.116 0.127 9.48
10 ELWYX 0.116 0.124 6.90 0.136 0.136 0.00
11 WCWXY 0.136 0.138 1.47 0.116 0.108 6.90
12 WCWYX 0.116 0.110 5.17 0.136 0.156 14.71
13 SHWX 0.136 0.122 10.29 –
14 SHWY – 0.136 0.146 7.35
15 White noise 0.050 – 0.050 –
16 ELWXY 0.200 0.191 4.50 0.170 0.131 22.94
17 ELWYX 0.170 0.178 4.71 0.200 0.208 4.00
18 WCWXY 0.200 0.200 0.00 0.170 0.163 4.12
19 WCWYX 0.170 0.174 2.35 0.200 0.237 18.50
20 SHWX 0.200 0.192 4.00 –
21 SHWY – 0.200 0.171 14.50
22 White noise 0.050 – 0.050 –
23 ELWXY 0.310 0.303 2.26 0.264 0.275 4.17
24 ELWYX 0.264 0.260 1.52 0.310 0.334 7.74
25 WCWXY 0.310 0.322 3.87 0.264 0.258 2.27
26 WCWYX 0.264 0.261 1.14 0.310 0.338 9.03
27 SHWX 0.310 0.349 12.58 –
28 White noise 0.050 – 0.050 –
29 ELWXY 0.410 0.441 7.56 0.349 0.346 0.86
30 WCWXY 0.410 0.444 8.29 0.349 0.363 4.01
31 WCWYX 0.349 0.351 0.57 0.410 0.421 2.68
32 SHWX 0.410 0.414 0.98 –
33 White noise 0.050 – 0.050 –
34 WCWXY 0.630 0.734 16.51 0.536 0.539 0.56
35 WCWYX 0.536 0.526 1.87 0.630 0.655 3.97
36 White noise 0.050 – 0.050 –
13.6 Shake Table Tests 549

13.6.4 Cracking and Failure Pattern
After each excitation, the cracks were accurately mapped and plotted. The damagesuffered by the tested RAC block masonry building model after different shakingsin direction X and Y is schematically shown in Fig. 13.20.
(a) Wall Q1 and GZ1
(b) Wall Q2 and GZ2
(c) Wall Q4 (d) Wall Q5
(e) Wall Q6
Fig. 13.20 Failure pattern of the RAC block masonry
550 13 Seismic Performance of Recycled Aggregate Concrete …

From the initial to basic intensity test phase, no visible cracks appeared on theRAC block structure, it can be suggested that the structure remained in an elasticstage. Combined with the analysis of structural dynamic characteristics(Table 13.14), it can be inferred that the structure behaved in a linear elastic stage.
During the fourth series of tests, three hairline diagonal cracks emerged at thebottom of the tie column GZ1, and a hairline diagonal crack was observed in theblock just below the window opening of the wall Q1 and shown in Fig. 13.20a.Two hairline diagonal cracks emerged at the bottom of the tie column GZ2, and ahorizontally hairline crack was observed in the mortar joint of the block in the wallQ2 just above the foundation beam and shown in Fig. 13.20b.
During the earthquake simulation tests of rare intensity 8, the intrinsic damagewithin the structure developed progressively, which includes: (1) The cracks whichoccurred first in the previous phases extended further; (2) a hairline stair-up crackwas observed in the mortar joint of the block just below the window opening of thewall Q1 (Fig. 13.20a); and (3) several vertically hairline cracks emerged on the wallQ2 and Q6 (Fig. 13.20b, e), respectively.
The earthquake simulation tests of intensity 9 caused relatively damage to theblock masonry building model, which includes: (1) The diagonal cracks were foundfirst in the previous phases widened and extended further at the bottom of the tiecolumn GZ1 and GZ2; (2) a vertical crack was observed in the mortar joint of theblock just below the ring beam of the wall Q2 and shown in Fig. 13.20b; (3) astair-step crack was observed in the mortar joint of the block below the windowopening of the wall Q4 (Fig. 13.20c); (4) a horizontal crack developed in the mortarjoint of the block of the wall Q5 (Fig. 13.20d); and (5) a horizontal crack alsoobserved in the block interface in the wall Q6 just above the foundation beam, andthe length of the crack approached 400 mm (Fig. 13.20e). Cracks distribution on
Table 13.14 The dynamic properties of the RAC block masonry model
PGA(g)
Direction Frequencyf (Hz)
StiffnessK (kN/mm)
Intrinsicdamping n (%)
Dampingc (kg rad/s)
Initial X 15.88 141.1085 1.30 36,770.2
Y 19.88 221.1490 0.44 15,580.1
0.071 X 15.88 141.1085 2.67 75.5204
Y 19.88 221.1490 1.15 40,720.8
0.136 X 15.75 138.8076 2.86 80,232.2
Y 19.63 215.6218 1.24 43,355.5
0.200 X 15.25 130.1343 3.06 83,117.7
Y 19.00 202.0037 1.33 45,009.8
0.310 X 14.63 119.7680 3.55 92,507.1
Y 17.63 173.9229 1.63 51,184.9
0.410 X 14.25 113.6271 4.35 110,409.5
Y 17.00 161.7149 1.68 50,869.9
0.630 X 13.63 103.9546 5.80 140,807.6
Y 16.50 152.3421 2.10 61,717.1
13.6 Shake Table Tests 551
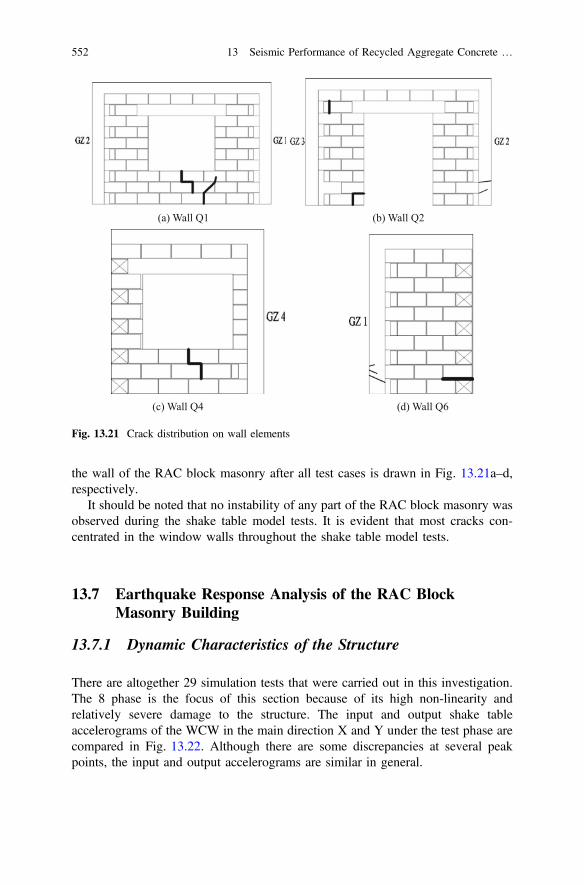
the wall of the RAC block masonry after all test cases is drawn in Fig. 13.21a–d,respectively.
It should be noted that no instability of any part of the RAC block masonry wasobserved during the shake table model tests. It is evident that most cracks con-centrated in the window walls throughout the shake table model tests.
13.7 Earthquake Response Analysis of the RAC BlockMasonry Building
13.7.1 Dynamic Characteristics of the Structure
There are altogether 29 simulation tests that were carried out in this investigation.The 8 phase is the focus of this section because of its high non-linearity andrelatively severe damage to the structure. The input and output shake tableaccelerograms of the WCW in the main direction X and Y under the test phase arecompared in Fig. 13.22. Although there are some discrepancies at several peakpoints, the input and output accelerograms are similar in general.
(a) Wall Q1 (b) Wall Q2
(c) Wall Q4 (d) Wall Q6
Fig. 13.21 Crack distribution on wall elements
552 13 Seismic Performance of Recycled Aggregate Concrete …
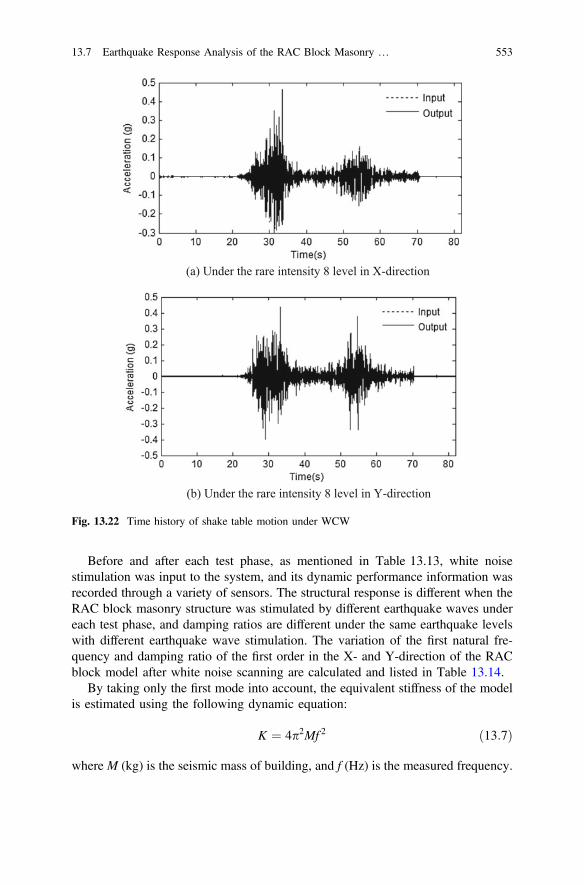
Before and after each test phase, as mentioned in Table 13.13, white noisestimulation was input to the system, and its dynamic performance information wasrecorded through a variety of sensors. The structural response is different when theRAC block masonry structure was stimulated by different earthquake waves undereach test phase, and damping ratios are different under the same earthquake levelswith different earthquake wave stimulation. The variation of the first natural fre-quency and damping ratio of the first order in the X- and Y-direction of the RACblock model after white noise scanning are calculated and listed in Table 13.14.
By taking only the first mode into account, the equivalent stiffness of the modelis estimated using the following dynamic equation:
K ¼ 4p2Mf 2 ð13:7Þ
where M (kg) is the seismic mass of building, and f (Hz) is the measured frequency.
(a) Under the rare intensity 8 level in X-direction
(b) Under the rare intensity 8 level in Y-direction
Fig. 13.22 Time history of shake table motion under WCW
13.7 Earthquake Response Analysis of the RAC Block Masonry … 553
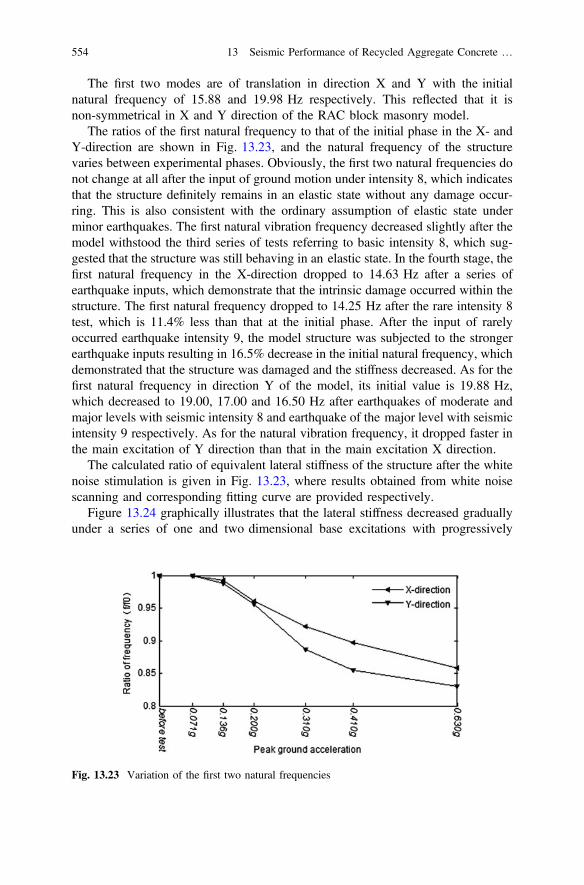
The first two modes are of translation in direction X and Y with the initialnatural frequency of 15.88 and 19.98 Hz respectively. This reflected that it isnon-symmetrical in X and Y direction of the RAC block masonry model.
The ratios of the first natural frequency to that of the initial phase in the X- andY-direction are shown in Fig. 13.23, and the natural frequency of the structurevaries between experimental phases. Obviously, the first two natural frequencies donot change at all after the input of ground motion under intensity 8, which indicatesthat the structure definitely remains in an elastic state without any damage occur-ring. This is also consistent with the ordinary assumption of elastic state underminor earthquakes. The first natural vibration frequency decreased slightly after themodel withstood the third series of tests referring to basic intensity 8, which sug-gested that the structure was still behaving in an elastic state. In the fourth stage, thefirst natural frequency in the X-direction dropped to 14.63 Hz after a series ofearthquake inputs, which demonstrate that the intrinsic damage occurred within thestructure. The first natural frequency dropped to 14.25 Hz after the rare intensity 8test, which is 11.4% less than that at the initial phase. After the input of rarelyoccurred earthquake intensity 9, the model structure was subjected to the strongerearthquake inputs resulting in 16.5% decrease in the initial natural frequency, whichdemonstrated that the structure was damaged and the stiffness decreased. As for thefirst natural frequency in direction Y of the model, its initial value is 19.88 Hz,which decreased to 19.00, 17.00 and 16.50 Hz after earthquakes of moderate andmajor levels with seismic intensity 8 and earthquake of the major level with seismicintensity 9 respectively. As for the natural vibration frequency, it dropped faster inthe main excitation of Y direction than that in the main excitation X direction.
The calculated ratio of equivalent lateral stiffness of the structure after the whitenoise stimulation is given in Fig. 13.23, where results obtained from white noisescanning and corresponding fitting curve are provided respectively.
Figure 13.24 graphically illustrates that the lateral stiffness decreased graduallyunder a series of one and two dimensional base excitations with progressively
Fig. 13.23 Variation of the first two natural frequencies
554 13 Seismic Performance of Recycled Aggregate Concrete …

increasing acceleration amplitudes. The overall lateral stiffness of the modelstructure obtained from white noise scanning decreased dramatically at the begin-ning stage of the shake table model tests. When cracks appeared, the lateral stiffnessin the X and Y directions reduces to 86.5 and 82.9% of that at the initial phaserespectively. After the RAC block masonry structure behaved non-linearly, the rateof stiffness degeneration slowed down, and no abrupt changes were observedthroughout the shake table tests. After the rare intensity 9 tests, the lateral stiffnessin the X direction drops to 73.7% of the initial stiffness, and the lateral stiffness inthe Y direction decreases to 67.3% of the initial stiffness. It can be inferred that themodel structure was subjected to a large loss of lateral load resistance. The lateralstiffness during the main excitation in Y direction degraded more rapidly than thatof X direction under different earthquake levels.
The variation of the first order damping ratio in X and Y direction at the end ofeach occurrence phase is illustrated in Fig. 13.25.
The damping ratio of the model structure reflects structural energy dissipationcapacity. With the amplitude of earthquake inputs increased gradually, the damageof the RAC block masonry developed progressively, and the natural frequenciesand damping ratios of the structure changed. From the initial to the basic intensity 8test phase, the damping ratio ascended slowly, whereas the values increased during
(a) The X-direction
(b) The Y-direction
( 0.1397)( ) 0.6911K x x −=
( 0.1815)( ) 0.6187K x x
−=
Fig. 13.24 Stiffness degradation
13.7 Earthquake Response Analysis of the RAC Block Masonry … 555
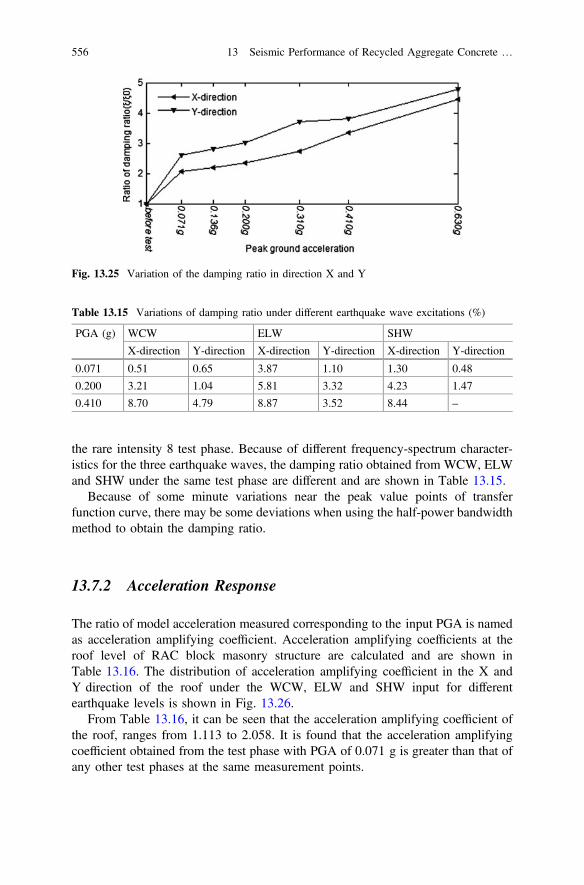
the rare intensity 8 test phase. Because of different frequency-spectrum character-istics for the three earthquake waves, the damping ratio obtained from WCW, ELWand SHW under the same test phase are different and are shown in Table 13.15.
Because of some minute variations near the peak value points of transferfunction curve, there may be some deviations when using the half-power bandwidthmethod to obtain the damping ratio.
13.7.2 Acceleration Response
The ratio of model acceleration measured corresponding to the input PGA is namedas acceleration amplifying coefficient. Acceleration amplifying coefficients at theroof level of RAC block masonry structure are calculated and are shown inTable 13.16. The distribution of acceleration amplifying coefficient in the X andY direction of the roof under the WCW, ELW and SHW input for differentearthquake levels is shown in Fig. 13.26.
From Table 13.16, it can be seen that the acceleration amplifying coefficient ofthe roof, ranges from 1.113 to 2.058. It is found that the acceleration amplifyingcoefficient obtained from the test phase with PGA of 0.071 g is greater than that ofany other test phases at the same measurement points.
Table 13.15 Variations of damping ratio under different earthquake wave excitations (%)
PGA (g) WCW ELW SHW
X-direction Y-direction X-direction Y-direction X-direction Y-direction
0.071 0.51 0.65 3.87 1.10 1.30 0.48
0.200 3.21 1.04 5.81 3.32 4.23 1.47
0.410 8.70 4.79 8.87 3.52 8.44 –
Fig. 13.25 Variation of the damping ratio in direction X and Y
556 13 Seismic Performance of Recycled Aggregate Concrete …

From Fig. 13.26, it can be proved that the acceleration amplifying coefficientdecreases gradually as the intensity of excitations increases, implying the pro-gressive degradation of structural stiffness. It is evident that the accelerationresponse in X direction is much larger than that in the Y direction. The reason isthat the model structure is designed asymmetrically (see Fig. 13.15), and the designstiffness in the X direction is smaller than that in the Y direction. The distributionfeature of the acceleration amplifying coefficients for the RAC block masonrystructure is similar to that of NAC masonry structure [10].
(a) The X-direction
(b) The Y-direction
Fig. 13.26 Distribution of acceleration amplifying coefficient in the X and Y directions
Table 13.16 Acceleration amplifying coefficient in the X- and Y-directions
Seismic waves PGA (g)
0.071 0.136 0.200 0.310 0.410 0.630
WCW X 2.058 1.759 1.391 1.388 1.357 1.354
Y 1.462 1.433 1.141 1.352 1.289 1.282
ELW X 1.625 1.457 1.447 1.415 1.304 –
Y 1.394 1.338 1.196 1.190 1.113 –
SHW X 1.545 1.436 1.396 1.281 1.183 –
13.7 Earthquake Response Analysis of the RAC Block Masonry … 557
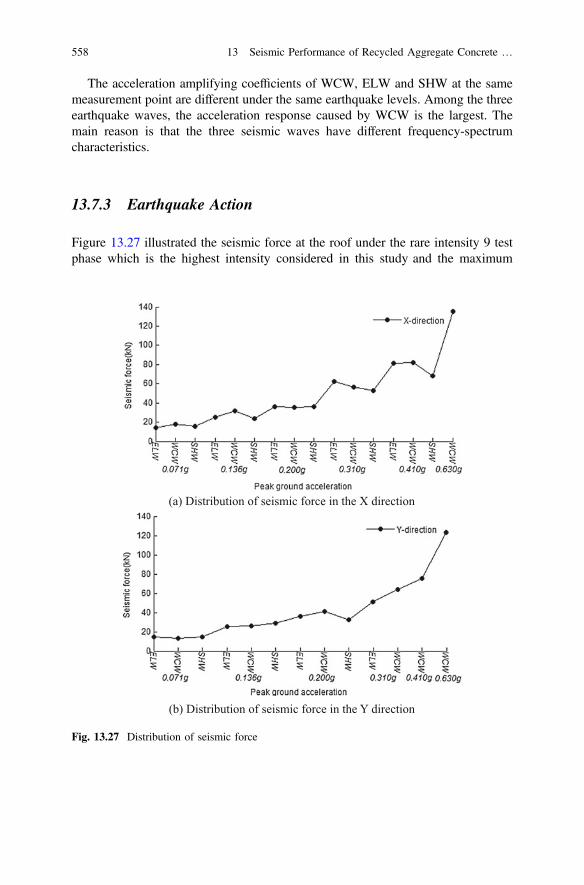
The acceleration amplifying coefficients of WCW, ELW and SHW at the samemeasurement point are different under the same earthquake levels. Among the threeearthquake waves, the acceleration response caused by WCW is the largest. Themain reason is that the three seismic waves have different frequency-spectrumcharacteristics.
13.7.3 Earthquake Action
Figure 13.27 illustrated the seismic force at the roof under the rare intensity 9 testphase which is the highest intensity considered in this study and the maximum
(a) Distribution of seismic force in the X direction
(b) Distribution of seismic force in the Y direction
Fig. 13.27 Distribution of seismic force
558 13 Seismic Performance of Recycled Aggregate Concrete …

seismic force in the X and Y directions are 135 and 124 kN respectively. Generally,the seismic force increased progressively under a series of one and two dimensionalbase excitations with the gradually increasing acceleration amplitudes. It can beseen from Fig. 13.27 that the seismic force response in the X direction is slightlylarger than that in the Y direction, which coincides with the measured naturalfrequencies in the X and Y directions.
The frequency-spectrum characteristics of different earthquake waves have agreat influence not only on the amplitude but also on the distribution of the seismicforce. Among the three earthquake waves, the seismic force response caused byWCW is the largest.
13.7.4 Displacement Response
The time history of the lateral displacements of the roof in the X direction with theWenchuan earthquake accelerogram excitation under minor, moderate and majorlevels of seismic intensity 8 is displayed in Fig. 13.28a, b and c respectively. It canbe seen in these figures that the lateral displacement increased with graduallyincreasing in the shaking intensity.
The maximum roof displacement in the X and Y directions obtained fromWCW, ELW and SHW under different test phases was illustrated in Fig. 13.29aand b respectively. It is found that the maximum roof displacement responseobtained from ELW is larger than that from WCW and SHW under the sameearthquake levels. Generally, the roof displacement responses in the X directionunder different test phases are larger than those in the Y direction, by comparison,see Fig. 13.29a and b which coincides with the measured natural vibration fre-quencies in the X and Y directions. It should be noted that the excitations of ELWand SHW under the rare intensity 9 test phase were canceled because of thecapacity limit of the shake table.
The values of maximum displacement and ratio of displacement at the roof levelto the overall structural height are summarized in Table 13.17. Combined withcrack patterns and the analysis of structural dynamic characteristics as presented inTable 13.14, and can be inferred that the damage within the structure developedprogressively with the gradually increasing acceleration amplitudes; the ratio of themaximum roof displacement to the total height in the X direction is 1/535 duringthe rare intensity 8 test phase, which is smaller than the allowable value of 1/120stipulated in the code for seismic design of buildings [9]. This is consistent with theordinary assumption that the structure will neither collapse nor suffer damage thatwould endanger human lives when subjected to rarely occurred earthquakes withintensities higher than the design one.
13.7 Earthquake Response Analysis of the RAC Block Masonry … 559
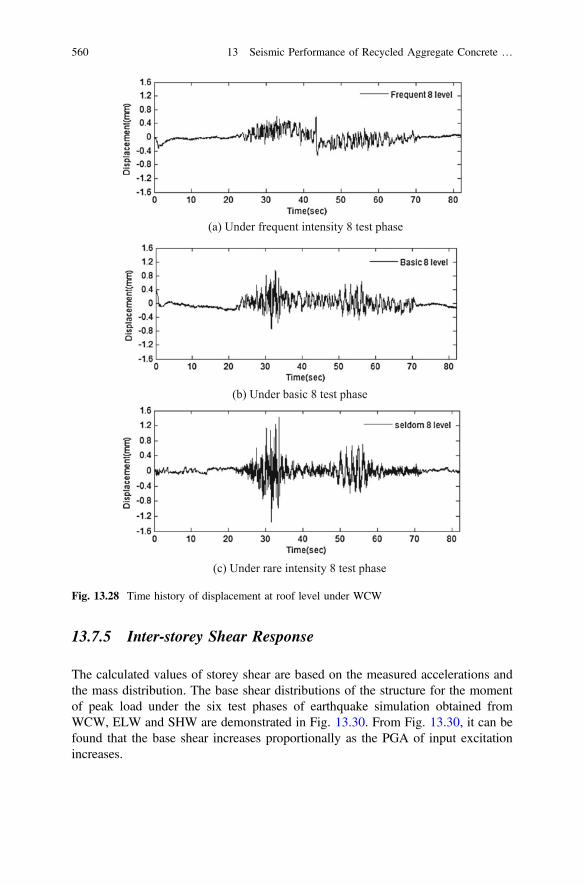
13.7.5 Inter-storey Shear Response
The calculated values of storey shear are based on the measured accelerations andthe mass distribution. The base shear distributions of the structure for the momentof peak load under the six test phases of earthquake simulation obtained fromWCW, ELW and SHW are demonstrated in Fig. 13.30. From Fig. 13.30, it can befound that the base shear increases proportionally as the PGA of input excitationincreases.
(b) Under basic 8 test phase
(c) Under rare intensity 8 test phase
(a) Under frequent intensity 8 test phase
Fig. 13.28 Time history of displacement at roof level under WCW
560 13 Seismic Performance of Recycled Aggregate Concrete …

(a) Maximum roof displacement in the X-direction
(b) Maximum roof displacement in the Y-direction
Fig. 13.29 Maximum roof displacement under different test phases
Table 13.17 Maximum value of the roof displacement and the total displacement/height
PGA (g) Roof displacement (mm) Total displacement/height
X-direction Y-direction X-direction Y-direction
0.071 0.611 0.612 1/3599 1/3594
0.136 1.568 0.645 1/1402 1/3411
0.200 1.838 0.891 1/1197 1/2468
0.310 3.457 1.344 1/636 1/1637
0.410 4.111 1.498 1/535 1/1469
13.7 Earthquake Response Analysis of the RAC Block Masonry … 561

The average shear coefficients (ratio of base shear to the weight of the structure)are calculated and listed in Table 13.18. The minimum shear coefficient in the Xand Y directions is 0.1242 and 0.1106 respectively, which are larger than theminimum limit of the seismic shear coefficient according to code for seismic designof buildings [9]. Fundamentally, those coefficients are within rational rangesaccording to engineering experiences.
The calculated average shear–weight ratio of the RAC masonry structure underdifferent test phases is given in Fig. 13.31, where results obtained from experimentand corresponding fitting curve are provided respectively. Figure 13.31 graphicallyillustrates that the relation between peak ground acceleration and shear–weight ratiois approximately linear. The mathematical relationship is obtained through fitting ofa polynomial function is expressed as follows:
(a) Base shear in the X-direction
(b) Base shear in the Y-direction
Fig. 13.30 Distribution of maximum base shear under different test phase
562 13 Seismic Performance of Recycled Aggregate Concrete …
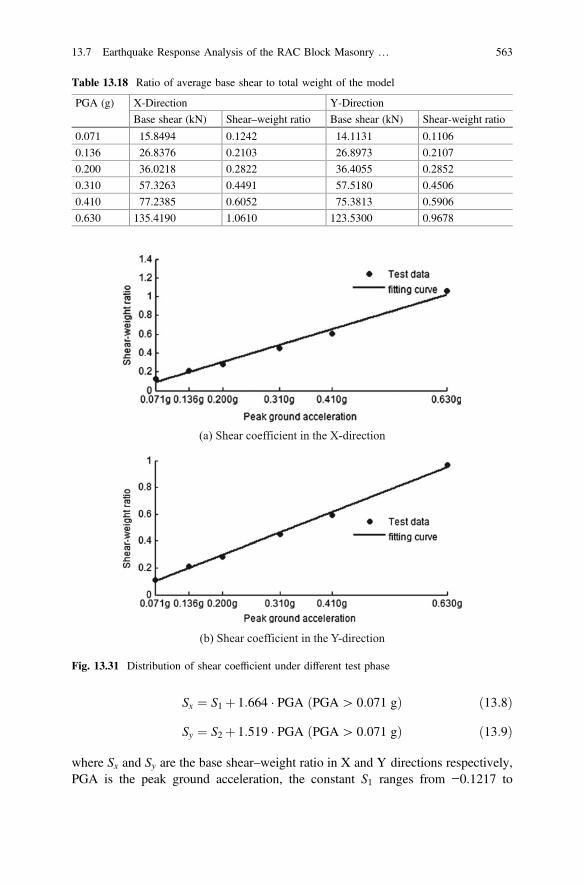
Sx ¼ S1 þ 1:664 � PGA PGA[ 0:071 gð Þ ð13:8Þ
Sy ¼ S2 þ 1:519 � PGA PGA[ 0:071 gð Þ ð13:9Þ
where Sx and Sy are the base shear–weight ratio in X and Y directions respectively,PGA is the peak ground acceleration, the constant S1 ranges from −0.1217 to
Table 13.18 Ratio of average base shear to total weight of the model
PGA (g) X-Direction Y-Direction
Base shear (kN) Shear–weight ratio Base shear (kN) Shear-weight ratio
0.071 15.8494 0.1242 14.1131 0.1106
0.136 26.8376 0.2103 26.8973 0.2107
0.200 36.0218 0.2822 36.4055 0.2852
0.310 57.3263 0.4491 57.5180 0.4506
0.410 77.2385 0.6052 75.3813 0.5906
0.630 135.4190 1.0610 123.5300 0.9678
(a) Shear coefficient in the X-direction
(b) Shear coefficient in the Y-direction
Fig. 13.31 Distribution of shear coefficient under different test phase
13.7 Earthquake Response Analysis of the RAC Block Masonry … 563

0.05789, and the constant S2 ranges from −0.04912 to 0.03133. The Eqs. (13.2) and(13.3) are important for referencing in the seismic design of the RAC blockmasonry structure. Knowing the peak ground acceleration, the maximum baseshear–weight ratio can be determined according to the above formulas in the pre-liminary structure design phase. It should be noted that the constants (S1, S2) andthe coefficients (1.664, 1.519) may change along with the different distribution ofthe structural mass.
13.7.6 Fragility Curves for RAC Block Masonry Building
To facilitate the occupancy of a building after an earthquake strike, buildings shouldbe tagged based on damage suffered by the building and its contents in adamage-state format are summarized in Table 13.19. For the damage-state format,buildings are assigned a damage state number from 1 to 5 based on the observeddegree of damage to the masonry building.
During the experiment, the level of damage for the tested masonry building wascharacterized according to the damage-state format are presented in Table 13.20[11]. As the limits drift, different damage levels in terms of the damage-state format
Table 13.19 Description of damage and post-earthquake utility
Damage state Degree of damage Post-earthquake utility
1 None (pre-yielding) Normal
2 Minor/slight Tolerable damage
3 Moderate Reparable damage
4 Major/extensive Irreparable damage
5 Complete collapse Collapse
Table 13.20 Structural performance levels and drift ratio limits
Damage state 1–2 2–3 3–4 4–5
Performancelevel
Normaloccupancy (NO)
Immediateoccupancy (IO)
Life-safety(LF)
Collapseprevention (CP)
Demand No damage orslight damage forstructural andnon-structuralelements
Need a smallamount ofrestoration forstructural andnon-structuralelements
Thestructureremainsstable andhas enoughbearingcapacity
Buildingsneither collapsenor sufferdamage thatwould endangerhuman lives
Drift ratiolimit LSi (%)
0.1 0.5 0.9 1.3
564 13 Seismic Performance of Recycled Aggregate Concrete …
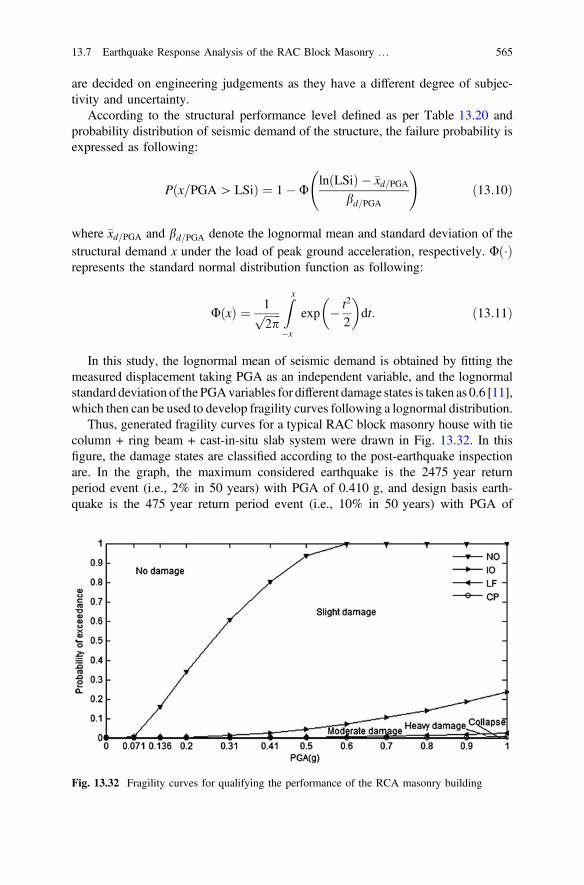
are decided on engineering judgements as they have a different degree of subjec-tivity and uncertainty.
According to the structural performance level defined as per Table 13.20 andprobability distribution of seismic demand of the structure, the failure probability isexpressed as following:
Pðx=PGA[LSiÞ ¼ 1� UlnðLSiÞ � �xd=PGA
bd=PGA
!ð13:10Þ
where �xd=PGA and bd=PGA denote the lognormal mean and standard deviation of thestructural demand x under the load of peak ground acceleration, respectively. Uð�Þrepresents the standard normal distribution function as following:
UðxÞ ¼ 1ffiffiffiffiffiffi2p
pZx�x
exp � t2
2
� �dt: ð13:11Þ
In this study, the lognormal mean of seismic demand is obtained by fitting themeasured displacement taking PGA as an independent variable, and the lognormalstandard deviation of the PGAvariables for different damage states is taken as 0.6 [11],which then can be used to develop fragility curves following a lognormal distribution.
Thus, generated fragility curves for a typical RAC block masonry house with tiecolumn + ring beam + cast-in-situ slab system were drawn in Fig. 13.32. In thisfigure, the damage states are classified according to the post-earthquake inspectionare. In the graph, the maximum considered earthquake is the 2475 year returnperiod event (i.e., 2% in 50 years) with PGA of 0.410 g, and design basis earth-quake is the 475 year return period event (i.e., 10% in 50 years) with PGA of
Fig. 13.32 Fragility curves for qualifying the performance of the RCA masonry building
13.7 Earthquake Response Analysis of the RAC Block Masonry … 565
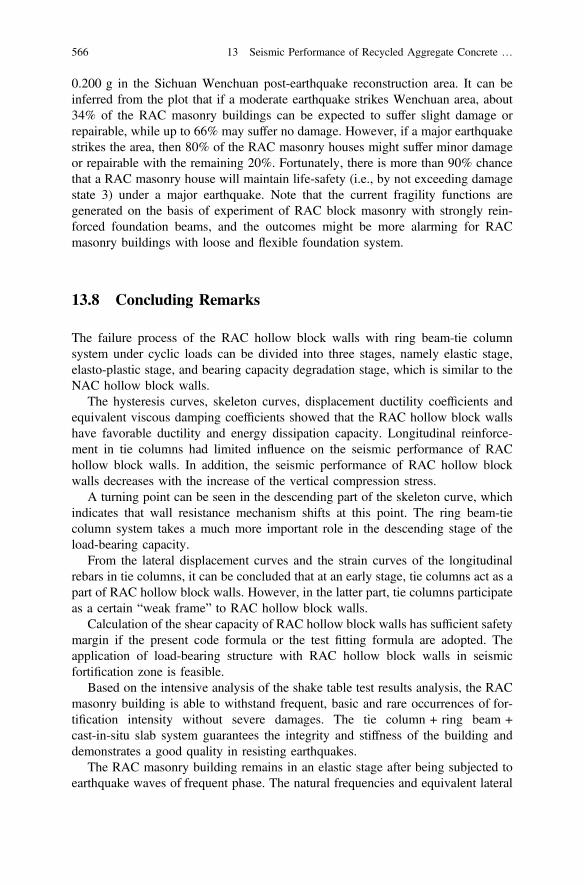
0.200 g in the Sichuan Wenchuan post-earthquake reconstruction area. It can beinferred from the plot that if a moderate earthquake strikes Wenchuan area, about34% of the RAC masonry buildings can be expected to suffer slight damage orrepairable, while up to 66% may suffer no damage. However, if a major earthquakestrikes the area, then 80% of the RAC masonry houses might suffer minor damageor repairable with the remaining 20%. Fortunately, there is more than 90% chancethat a RAC masonry house will maintain life-safety (i.e., by not exceeding damagestate 3) under a major earthquake. Note that the current fragility functions aregenerated on the basis of experiment of RAC block masonry with strongly rein-forced foundation beams, and the outcomes might be more alarming for RACmasonry buildings with loose and flexible foundation system.
13.8 Concluding Remarks
The failure process of the RAC hollow block walls with ring beam-tie columnsystem under cyclic loads can be divided into three stages, namely elastic stage,elasto-plastic stage, and bearing capacity degradation stage, which is similar to theNAC hollow block walls.
The hysteresis curves, skeleton curves, displacement ductility coefficients andequivalent viscous damping coefficients showed that the RAC hollow block wallshave favorable ductility and energy dissipation capacity. Longitudinal reinforce-ment in tie columns had limited influence on the seismic performance of RAChollow block walls. In addition, the seismic performance of RAC hollow blockwalls decreases with the increase of the vertical compression stress.
A turning point can be seen in the descending part of the skeleton curve, whichindicates that wall resistance mechanism shifts at this point. The ring beam-tiecolumn system takes a much more important role in the descending stage of theload-bearing capacity.
From the lateral displacement curves and the strain curves of the longitudinalrebars in tie columns, it can be concluded that at an early stage, tie columns act as apart of RAC hollow block walls. However, in the latter part, tie columns participateas a certain “weak frame” to RAC hollow block walls.
Calculation of the shear capacity of RAC hollow block walls has sufficient safetymargin if the present code formula or the test fitting formula are adopted. Theapplication of load-bearing structure with RAC hollow block walls in seismicfortification zone is feasible.
Based on the intensive analysis of the shake table test results analysis, the RACmasonry building is able to withstand frequent, basic and rare occurrences of for-tification intensity without severe damages. The tie column + ring beam +cast-in-situ slab system guarantees the integrity and stiffness of the building anddemonstrates a good quality in resisting earthquakes.
The RAC masonry building remains in an elastic stage after being subjected toearthquake waves of frequent phase. The natural frequencies and equivalent lateral
566 13 Seismic Performance of Recycled Aggregate Concrete …
stiffness decrease very slightly after the basic intensity earthquake, which indicatesthat the RAC masonry building structure still remains in an elastic stage.
After the rarely occurred earthquake for fortification intensity 8, visible cracksoccur and the natural frequencies and equivalent stiffness decrease apparently. Theratio of the maximum roof displacement to the total height in X direction is 1/535and that in Y direction is 1/1469, which is smaller than the allowable value of 1/120according to GB 50011. The structure meets the requirements of GB 50011 for nocollapse under rarely occurring earthquakes.
Fragility curves for RAC masonry building are also generated for damage-stateformats based on the experimental observations. If the experimental fragility curvesare used to assess safety of similar RAC masonry building in Wenchuan area, in amoderate earthquake some 34% of the RAC masonry buildings are likely to sufferslight damage or repairable. However, for a major earthquake, some 80% of theRAC masonry buildings are likely to suffer minor damage or repairable.
It is feasible to apply and popularize the RAC hollow block and masonrybuildings in the seismic region and the Sichuan Wenchuan post-earthquakereconstruction area.
References
1. GB/T50743-2012. Code for recycling of construction & demolition waste. Beijing: Press ofChinese Building Industry, China (in Chinese).
2. JGJ 101-1996. Chinese specification of testing methods for earthquake resistant building.Beijing: Press of Chinese Building Industry, China (in Chinese).
3. Xiao J, Pu J, Hu Y. Experimental study on the seismic performance of new sandwich masonrywalls. Earthq Eng Eng Vib. 2013;12(1):77–86.
4. GB 50011–2001. Chinese code for seismic design of buildings. Beijing: Press of ChineseBuilding Industry, China (in Chinese).
5. JGJ/T 14-2004. Chinese technical specification for concrete small-sized hollow blockmasonry building. Beijing: Press of Chinese Building Industry, China (in Chinese).
6. Guo J. Experimental research on seismic behavior of small-sized hollow concrete blockfull-sized wall. Beijing: Department of Civil Engineering of Tsinghua University; 2005 (inChinese).
7. Xiao Jianzhuang, Li W, Fan Y, Huang X. An overview of study on recycled aggregateconcrete in China (1996–2011). Constr Build Mater. 2012;31(6):364–83.
8. Chinese Standard GB 50010. Code for design of concrete structures. Beijing: ChineseBuilding Press; 2010 (in Chinese).
9. Chinese Standard GB 50011. Code for seismic design of buildings. Beijing: Chinese BuildingPress 2008 (in Chinese).
10. Xiong LH, David X, Wu RF, Xia JQ. Shaking table tests and dynamic analyses of masonrywall buildings with frame-shear walls at lower stories. Earthq Eng Eng Vibr. 2008;7(3):271–83.
11. Jitendra KB, Rajesh PD, John BM. Seismic performance of an unreinforced masonrybuilding: an experimental investigation. Earthq Eng Struct Dynam. 2010;39:45–68.
12. Li XA, Tang DX. Experimental studies on the aseismatic behavior of volcanic cindersconcrete block walls bounded by R/C frame. J Harbin Archit Civil Eng Inst. 1993;26(1):63–8(in Chinese).
13.8 Concluding Remarks 567

13. Yang DJ, Gao YF, Sun JB, Wang SH, Cheng QX. Experimental study on aseismic behaviorof concrete block walls with construction-core column system. J Build Struct. 2000;21(4):22–7 (in Chinese).
14. Miao QS, He XL, Zhou BZ, Liu TC, Wang ZP, Gu TZ. Experimental study on aseismicbehavior of nine-story masonry building with small-size hollow concrete blocks. J BuildStruct 2000; 21(4):13–21 (in Chinese).
15. Li LQ, Liu WQ. Experimental study on seismic behavior of small-size concrete hollow blockmasonry with constructional columns. Earthq Resistant Eng. 2001;4:16–20 (in Chinese).
16. Jin WL, Xu QB, Pan JL, Yan JX, Ye JC. Experimental study on lateral resistance behavior ofsmall concrete hollow block wall with different constructional measures. J Build Struct.2001;22(6):64–72 (in Chinese).
17. Yan ML, Gao YZ, Wu WN. Experimental study on seismic behavior of block masonrybuildings with reinforced concrete constructional columns. Build Block Block Build.2002;1:28–31 (in Chinese).
18. Yan WM, Zhou HY, Zhou XY, Xun QZ. Experimental study on seismic behavior of smallconcrete hollow block walls restricted by constructional columns. J Build Struct. 2005;26(4):64–9 (in Chinese).
19. Zhou XY, Li WJ, Yan WM, Guo LN, Zhou HY. An experimental study on the seismicbehavior of small concrete block walls confined by tie columns and beams. China CivilEng J. 2006;39(8):45–50 (in Chinese).
568 13 Seismic Performance of Recycled Aggregate Concrete …

Chapter 14Products and Constructions with RecycledAggregate Concrete
Abstract In this chapter, the premix recycled concrete and recycled aggregatemortar are introduced from the viewpoint of strength, slump, pumping performanceand other technical points firstly. Then the precast products of recycled aggregateconcrete (RAC), such as the brick, block, hollow block masonry and panel areintroduced, and all of these products are investigated for application in real engi-neering project. The performance of mentioned RAC products and constructionmethod has been evaluated through some case studies including pavements—FudanRoad, cast-in-situ frame, precast RAC frame, RAC masonry structure, steel framefilled with recycled aggregate bricks and RAC frame-shear wall in high-risebuilding. The results indicated that the RAC is feasible to be used in engineering.Finally, the construction of RAC is analyzed from the aspects of economic benefits,environmental benefits, and management strategies. The quality control of RACproducts and scientific management of construction of RAC will ensure theapplication of RAC on a wider scale.
14.1 Premix
If the emphasis is to be given on the wide application of RAC, advanced mixingand precast techniques should be considered, and this can be explained from twoways. Firstly, due to unstable properties of RAC the deviation is very large andtherefore using plant ready-mix and precast methods are necessary. This will lead tohigh quality control, proper mixing and can help in controlling the quality of RAC,and this will lead to an improvement in the shortcomings of RAC.
Secondly, from a city’s viewpoint or an area’s chain of the recycled concreteindustry, waste concrete often needs to be collected and transported to a certainplant for crushing and also, some demolition projects will produce large amounts ofwaste concrete. Such projects can consider using mobile crushing equipment andthe concrete produced from crushing equipment can directly be allowed to enter theconcrete mixing stage, to be made into concrete and then be ready for use either for
© Springer-Verlag GmbH Germany 2018J. Xiao, Recycled Aggregate Concrete Structures,Springer Tracts in Civil Engineering, https://doi.org/10.1007/978-3-662-53987-3_14
569
in-situ concrete or precast concrete. This will reduce transportation costs andincrease the economic benefits of RAC.
Using the above-mentioned methods as a guide, Shanghai municipality in 2006carried out a Demonstration Project for the Recycled Concrete Application. Underthe supervision of this research group, Fudan University constructed a pavement oncampus passing by its News College Building using RAC. The technique andpreparation stages are as follows:
Firstly, the RA should be soaked in water and surface should be dried to achievea saturated surface dry (SSD) condition, then recycled aggregates, natural aggre-gates, cement and all mineral admixtures are mesaured and stored in differenthoppers, then they are put into a mixing machine and mixed up, and lastly waterand admixture (the admixture is first put into the water) should be added. Themixing time should not be less than 2 min. For the mixing machine “twin shaftcompulsory mixer” can be used. For the concrete pump, the “S valve pump con-crete vehicle” can be selected.
The above concrete mixing technique will enable RAC to have improved dura-bility and higher strength. It can replace ordinary concrete and can widely be used inroad construction, structural engineering projects and other infrastructures.
14.1.1 Premix Recycled Concrete
1. Premix recycled concrete strength
The average strength of RAC decreases with the increase in RCA replacementpercentage. The compressive strength’s standard deviation is less than 5 MPa,which is the same as normal concrete. The mean, standard deviation and coefficientof variation of strength of RAC are decreased with the increase in RCA replacementpercentage. The RAC size conversion factor can be taken as 0.94.
2. Premix recycled concrete slump loss mechanism and control measures
For premix RAC, the time difference between the start of mixing concrete totransporting it to site just before pouring it into the prepared onsite molds will causethe loss of concrete slump, especially in the preparation of high strength, highfluidity of RAC, because the slump loss is one of the serious problems. Analysis onthe impact of the slump loss mechanism and other factors has a practicalsignificance.
(a) Premix RAC slump loss mechanisms
Concrete slump loss can essentially change the fluidity of concrete materialcement paste, which is the cement particle dispersion and condensation process.After incorporation of a water-reducing agent, cement particles rapidly dispersed,slurry consistency changed and mobility increased. As the hydration reactionproceeds, the water-reducing agent is adsorbed on the surface of cement particles,
570 14 Products and Constructions with Recycled Aggregate Concrete

and the earlier hydrates will be surrounded by the new hydrates which hinder themto play a dispersion capacity. Cement particles unite and the slump loss is accel-erated. This is the main reason for the water reduction in concrete, especially withthe high-efficiency water reducing agent.
Another reason for the premix recycled concrete slump loss is the large waterabsorption by RCA. In the mixing process, due to the high water absorption byRCA, free water in recycled concrete mixture is gradually reduced and the slumploss is amplified. This is an important difference between ordinary concrete andRAC.
(b) Premix RAC slump loss control measures
From premixed concrete slump loss mechanism, for ordinary plastic concrete,slump loss control technical approaches are mainly: (1) Use retarders, delayingearly hydration reaction speed; (2) Retempering of concrete, destruction of thecohesion structure; (3) Cooling, take measures to reduce the temperature of mixing.
The premixed concrete slump loss control measures are also applied to premixedRAC. It should be noted that, due to the high water absorption by RCA, RACslump was reduced to a further extent. According to research Ref. [1], the greaterthe initial slump, the greater the slump loss. So, the method that raise initial slumpunilaterally to offset the slump loss should not be used. In the preparation ofpremixed recycled concrete, pre-wetted RCA can reduce the RAC water absorption,therefore reducing the recycled concrete slump loss.
3. Premix recycled concrete pumping performance
The factors that affect the recycled concrete pumping performance are: cement,RCA surface properties, particle size, size distribution, water-cement ratio, sandratio, additives, admixtures species, dosage, etc. According to the test results, due tothe high water absorption of RCA, the recycled concrete slump is reduced, butcohesion performance is improved. From the experimental results, it can be seenthat premixed recycled concrete pumping performance can meet the requirementsby a reasonable mix design.
4. Technical points
(a) Recycled concrete cube compressive strength is normally distributed, and itsstandard deviation is less than 5 MPa, which is the same as natural concrete.The strength of the RAC mean value, standard deviation, and coefficient ofvariation decreases with the increase in the RCA replacement percentage.
(b) By using rational proportion design, especially for RCA pre-wetted treat-ment, RAC slump loss and pumping performance can meet the desiredrequirements.
14.1 Premix 571

(c) And by using the rational proportion design, construction techniques, anddesign structural reinforcement, the early shrinkage cracking of premixrecycled concrete can be reduced up-to a certain level.
14.1.2 RA Mortar
If recycled fine aggregates can be used to produce mortar, they can greatly help toimprove the utilization of waste concrete. So developing recycled mortar, especiallypremix recycled mortar has important environmental and economic benefits.
Recycled fine aggregates were mainly used in premix recycled mortar, partialincorporation with natural sand. The main components of recycled fine aggregatesare natural sand which has attached cement, cement debris, stone chips and clayduring NA crushing process and various impurities. Recycled fine aggregates’surface is rough and contains a lot of micro-cracks, resulting in high waterabsorption, low density and low bulk density.
In order to improve the workability of recycled mortar, certain admixtures can beoptionally added, such as thickening powder. Thickening lime powder is a type offine composite material, through the physical adsorption of water molecules it canachieve the mortar thickening water retention property. Lime paste admixtures usedin masonry mortars can be substituted as thickening powder.
By carrying out recycled mortar test, the following conclusions can be drawn:
(a) Experimental studies have shown that the influence of recycled fine aggregateson recycled mortars is mainly due to the low density and high water absorptioncapacity;
(b) Use the recycled fine aggregates to partially replace natural sand can improvethe strength of recycled mortar and helps reducing the cost, which will promotethe use of recycled mortar;
(c) The recycled fine aggregates can be used to produce masonry mortar forrecycled concrete masonry structures, this can greatly improve the wasterecycling rate and has important environmental and economic benefits.
14.1.3 Cement Stabilizing RA
Many researchers have analyzed the performance of cement stabilizing RA. Tahaet al. [2] presented the results of a laboratory evaluation of cement-stabilizedreclaimed asphalt pavement (RAP) and RAP/virgin aggregate blends as basematerials. In this experiment, the samples were prepared using 0, 3, 5, and 7%Type I Portland cement and were cured for 3, 7, and 28 days in plastic bags at roomtemperature. Results indicate that the ability of RAP aggregate to function as a
572 14 Products and Constructions with Recycled Aggregate Concrete

structural component of the pavement is more definative when it is stabilized withcement rather than blending only with virgin aggregate. A 100% RAP aggregateshould not be recommended for use as a base material unless stabilized withcement. Cement-stabilized RAP/virgin aggregate mixtures seem to be a viablealternative to dense-graded aggregate used in road base construction. Disfani et al.[3] evaluated the performance of crushed brick as a supplementary material incement-stabilized recycled concrete aggregates. The results of repeated load triaxialtests indicated that the recycled crushed aggregate/crushed brick (RCA/CB) blendsperformed well with 50% CB content just on the border line for bound pavementmaterial. Unconfined compressive strengths met the minimum requirement for7 days of curing for all blends, while the 28-day strength of the blends alsoimproved significantly. The results of the flexural beam tests were noted to beconsistent with past works with cement stabilized quarry produced crushed rockproducts. The modulus of rupture and flexural modulus for all the cement-stabilizedblends were found to be consistent with the previous works, which indicate thatthese blends are suitable for applications such as cement-stabilized pavementsub-bases. The fatigue life was also within the range that has been previouslyreported for quarry materials. The cement-stabilized blends with CB as a supple-mentary material with up to 50% brick content and 3% cement were found to havephysical properties, which would comply with road authority requirements.
14.2 Precast
14.2.1 Brick and Block
RAC hollow blocks
1. Production of recycled concrete hollow blocks
The recycled concrete hollow blocks’ production equipment is basically aupgraded version of ordinary concrete hollow bricks’ equipment. The aggregatesused are recycled fine aggregates, but these aggregates do have a high amount ofclay, and therefore its (recycled fine aggregates) full use on the production of aconcrete product will result in a low-strength product. For this reason, in mostcases, only a small amount of recycled fine aggregates is used.
There are many different types of recycled hollow bricks which are used inbuilding projects, and the most used ones are of the sizes, 190 series (mm):390 � 190 � 190, 290 � 190 � 190, 190 � 190 � 190, 90 � 190 � 190,390 � 90 � 190, etc., 240 series (mm): 390 � 240 � 190, 190 � 240 � 190,53 � 240 � 115, etc. See Fig. 14.1 for a recycled hollow brick production line.
14.1 Premix 573

A certain precast structures’ production line in Henan province, China, produces20 million hollow brick products annually, and these production lines are also usedin the production of recycled concrete hollow brick, with a 30% production rate ofhollow bricks in total, and ultimate strength of these recycled hollow bricksreaching above MU15, as shown in Fig. 14.2.
Researchers such as Poon et al. [4], in Hong Kong, and others have doneadvanced studies in order for RAC to be used in pavements as shown in Fig. 14.3.
2. The compressive strength of recycled concrete hollow bricks
The RAC hollow bricks mix-proportion should be analyzed and optimized; seeTable 14.1.
For each kind of mix ratio/mix proportion, the average compressive strength,standard deviation and the coefficient of variance for five briquettes are shown inTable 14.2. It may be seen that besides RCB-1 the compressive strength value of all
(a) Ordinary brick producing machine (b) Finished products
Fig. 14.1 Hollow bricks production line
(a) The Henan province hollow brick project (b) The wall of the demonstration project
Fig. 14.2 Demonstration project of hollow bricks
574 14 Products and Constructions with Recycled Aggregate Concrete

Table 14.1 Mix-proportions of RAC hollow blocks (kg/m3)
Serialno.
Fineaggregates
Coarseaggregates
Cement Flyash
Polypropylenetextile fiber
Water
0.16–5 mm
5–10 mm
RCB-1 400 600 170 – – 65
RCB-2 500 500 170 – – 65
RCB-3 600 400 170 – – 65
RCB-4 700 300 170 – – 65
RCB-1F 500 500 153 25 – 65
RCB-2F 500 500 145 34 – 65
RCB-3F 500 500 136 51 – 65
RCB-2X 500 500 170 – 1 65
NCB 500 500 170 – – 57
Note Besides NCB, all aggregates are RA
Table 14.2 Compressive strength of different mix-proportions (mix ratios) of RAC hollow bricks
Serial no. RCB-1 RCB-2 RCB-3 RCB-4 RCB-1F RCB-2F RCB-3F RCB-2X NCB
Mean valuel (MPa)
10.32 7.60 7.68 7.58 7.66 7.28 7.50 6.62 8.08
Standarddeviation r(MPa)
0.50 0.22 0.80 0.60 0.71 0.79 0.93 0.46 0.41
Coefficientof variance(%)
4.8 2.9 10.4 7.9 9.3 10.9 12.4 6.9 5.1
l − 1.645 r 9.50 7.24 6.36 6.59 6.49 5.98 5.97 5.86 7.4
(a) Recycled concrete road brick tiles (b) Appearance of a single road brick tile
Fig. 14.3 RAC road brick tiles
14.2 Precast 575
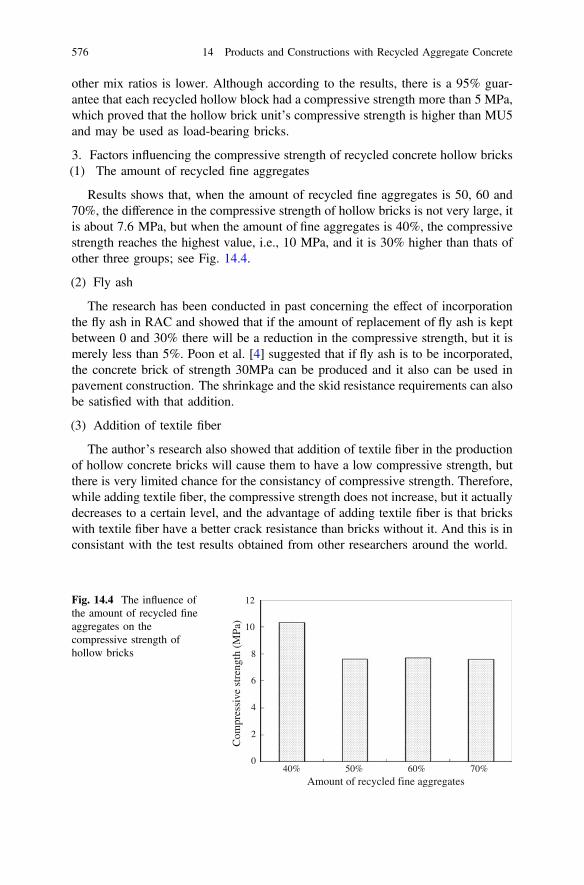
other mix ratios is lower. Although according to the results, there is a 95% guar-antee that each recycled hollow block had a compressive strength more than 5 MPa,which proved that the hollow brick unit’s compressive strength is higher than MU5and may be used as load-bearing bricks.
3. Factors influencing the compressive strength of recycled concrete hollow bricks(1) The amount of recycled fine aggregates
Results shows that, when the amount of recycled fine aggregates is 50, 60 and70%, the difference in the compressive strength of hollow bricks is not very large, itis about 7.6 MPa, but when the amount of fine aggregates is 40%, the compressivestrength reaches the highest value, i.e., 10 MPa, and it is 30% higher than thats ofother three groups; see Fig. 14.4.
(2) Fly ash
The research has been conducted in past concerning the effect of incorporationthe fly ash in RAC and showed that if the amount of replacement of fly ash is keptbetween 0 and 30% there will be a reduction in the compressive strength, but it ismerely less than 5%. Poon et al. [4] suggested that if fly ash is to be incorporated,the concrete brick of strength 30MPa can be produced and it also can be used inpavement construction. The shrinkage and the skid resistance requirements can alsobe satisfied with that addition.
(3) Addition of textile fiber
The author’s research also showed that addition of textile fiber in the productionof hollow concrete bricks will cause them to have a low compressive strength, butthere is very limited chance for the consistancy of compressive strength. Therefore,while adding textile fiber, the compressive strength does not increase, but it actuallydecreases to a certain level, and the advantage of adding textile fiber is that brickswith textile fiber have a better crack resistance than bricks without it. And this is inconsistant with the test results obtained from other researchers around the world.
0
2
4
6
8
10
12
40% 50%Amount of recycled fine aggregates
60% 70%
Com
pres
sive
str
engt
h (M
Pa)
Fig. 14.4 The influence ofthe amount of recycled fineaggregates on thecompressive strength ofhollow bricks
576 14 Products and Constructions with Recycled Aggregate Concrete

(4) Others
Practical projects and research achievements show that cement-to-water ratioand aggregate size do influence the compressive strength of hollow concrete bricks.Poon’s test [5] results have shown that if RA replace 25–50% of natural coarse andfine aggregates, the compressive strength of hollow concrete bricks will only beslightly affected, but an increase in the RA replacement percentage such as 70% andabove will decrease the compressive strength of hollow concrete bricks, but theflexural strength increases with an increase in the amount of RA.
14.2.2 Recycled Concrete Hollow Block Masonry
1. The compressive strength of recycled concrete hollow bricks
The author conducted a test on the large block of size 600 x 590 x 190 mm3 withseveral hollow bricks as shown in Fig. 14.5. The manual casting of the largerspecimen was done with a mortar of M7.5 and the thickness of the mortar was keptat 10 mm. When compressive load is applied, the failure process of recycledconcrete hollow bricks was similar to that of ordinary concrete hollow bricks, and itwent through cracking, propagation of cracks, and overall instability. This showsthat the recycled concrete hollow bricks’ compressive strength pattern is close tothat of ordinary concrete hollow bricks.
Research showed that the compressive strength of recycled concrete hollowbricks is less than that of ordinary concrete hollow bricks, and with the addition offly ash or polypropylene textile fiber in recycled concrete hollow bricks does notaffect the bricks compressive strength; therefore, the formula used of for the cal-culation of compressive strength for ordinary concrete hollow bricks can be used indetermining the recycled concrete hollow bricks compressive strength.
(a) Specimen of hollow bricks (b) Typical image of a hollow brick (Cracking on the left bottom)
Fig. 14.5 Hollow bricks
14.2 Precast 577

2. Recycled concrete brick column
In order to investigate the actual usage of recycled concrete hollow bricks, theauthor designed three recycled concrete hollow brick columns of dimensions,390 � 390 � 2000 mm3, as shown in Fig. 14.6.
There was no visible change observed at the initial stage of loading, but as theload was increased, the brick columns presented some visible cracks and withfurther loading, the cracks increased and the crack-width expanded. Moreover, thecracks linked to the edge of bricks started to move parallel in the direction of load.As the loading was increased further, the formation of cracks is at a high rategradually linking the verticle cracks along with a formation of horizontal cracks aswell. At this stage, a slight increase in the loading leads to the formation of verticlecracks even at a higher rate than before, leading to the failure of the specimen.
Various researchers have shown that the building codes for calculating thebearing capacity of the ordinary hollow brick column can be used to calculate thebearing capacity of recycled concrete hollow brick columns. But the compressivestrength design value of recycled concrete hollow brick still needs to be decided bycarrying out various test experiments and reliability analysis in future.
(a) Brick column dimensions and loading diagram
(b) Typical brick column failure image
Dis
plac
emen
tga
uge
Displacem
entgauge
Fig. 14.6 Hollow brick column
578 14 Products and Constructions with Recycled Aggregate Concrete
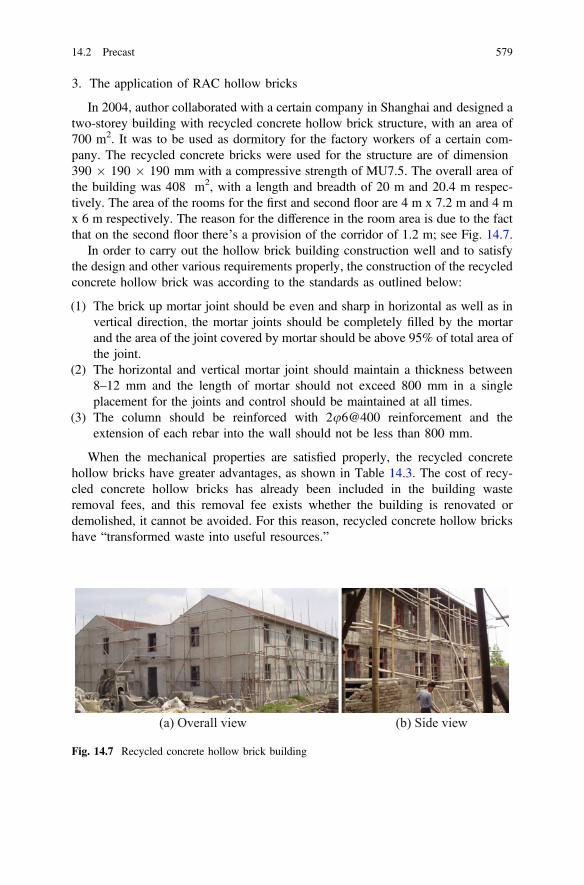
3. The application of RAC hollow bricks
In 2004, author collaborated with a certain company in Shanghai and designed atwo-storey building with recycled concrete hollow brick structure, with an area of700 m2. It was to be used as dormitory for the factory workers of a certain com-pany. The recycled concrete bricks were used for the structure are of dimension390 � 190 � 190 mm with a compressive strength of MU7.5. The overall area ofthe building was 408 m2, with a length and breadth of 20 m and 20.4 m respec-tively. The area of the rooms for the first and second floor are 4 m x 7.2 m and 4 mx 6 m respectively. The reason for the difference in the room area is due to the factthat on the second floor there’s a provision of the corridor of 1.2 m; see Fig. 14.7.
In order to carry out the hollow brick building construction well and to satisfythe design and other various requirements properly, the construction of the recycledconcrete hollow brick was according to the standards as outlined below:
(1) The brick up mortar joint should be even and sharp in horizontal as well as invertical direction, the mortar joints should be completely filled by the mortarand the area of the joint covered by mortar should be above 95% of total area ofthe joint.
(2) The horizontal and vertical mortar joint should maintain a thickness between8–12 mm and the length of mortar should not exceed 800 mm in a singleplacement for the joints and control should be maintained at all times.
(3) The column should be reinforced with 2u6@400 reinforcement and theextension of each rebar into the wall should not be less than 800 mm.
When the mechanical properties are satisfied properly, the recycled concretehollow bricks have greater advantages, as shown in Table 14.3. The cost of recy-cled concrete hollow bricks has already been included in the building wasteremoval fees, and this removal fee exists whether the building is renovated ordemolished, it cannot be avoided. For this reason, recycled concrete hollow brickshave “transformed waste into useful resources.”
(a) Overall view (b) Side view
Fig. 14.7 Recycled concrete hollow brick building
14.2 Precast 579
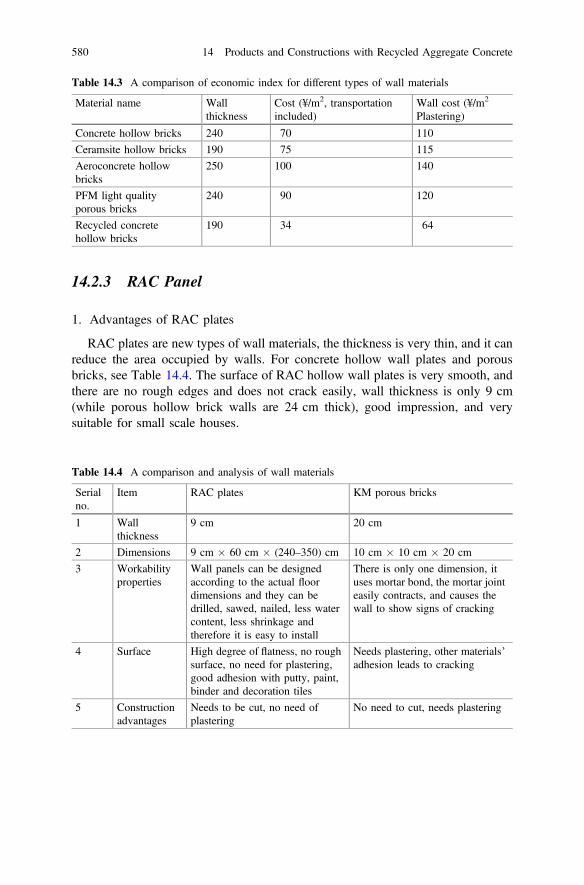
14.2.3 RAC Panel
1. Advantages of RAC plates
RAC plates are new types of wall materials, the thickness is very thin, and it canreduce the area occupied by walls. For concrete hollow wall plates and porousbricks, see Table 14.4. The surface of RAC hollow wall plates is very smooth, andthere are no rough edges and does not crack easily, wall thickness is only 9 cm(while porous hollow brick walls are 24 cm thick), good impression, and verysuitable for small scale houses.
Table 14.3 A comparison of economic index for different types of wall materials
Material name Wallthickness
Cost (¥/m2, transportationincluded)
Wall cost (¥/m2
Plastering)
Concrete hollow bricks 240 70 110
Ceramsite hollow bricks 190 75 115
Aeroconcrete hollowbricks
250 100 140
PFM light qualityporous bricks
240 90 120
Recycled concretehollow bricks
190 34 64
Table 14.4 A comparison and analysis of wall materials
Serialno.
Item RAC plates KM porous bricks
1 Wallthickness
9 cm 20 cm
2 Dimensions 9 cm � 60 cm � (240–350) cm 10 cm � 10 cm � 20 cm
3 Workabilityproperties
Wall panels can be designedaccording to the actual floordimensions and they can bedrilled, sawed, nailed, less watercontent, less shrinkage andtherefore it is easy to install
There is only one dimension, ituses mortar bond, the mortar jointeasily contracts, and causes thewall to show signs of cracking
4 Surface High degree of flatness, no roughsurface, no need for plastering,good adhesion with putty, paint,binder and decoration tiles
Needs plastering, other materials’adhesion leads to cracking
5 Constructionadvantages
Needs to be cut, no need ofplastering
No need to cut, needs plastering
580 14 Products and Constructions with Recycled Aggregate Concrete
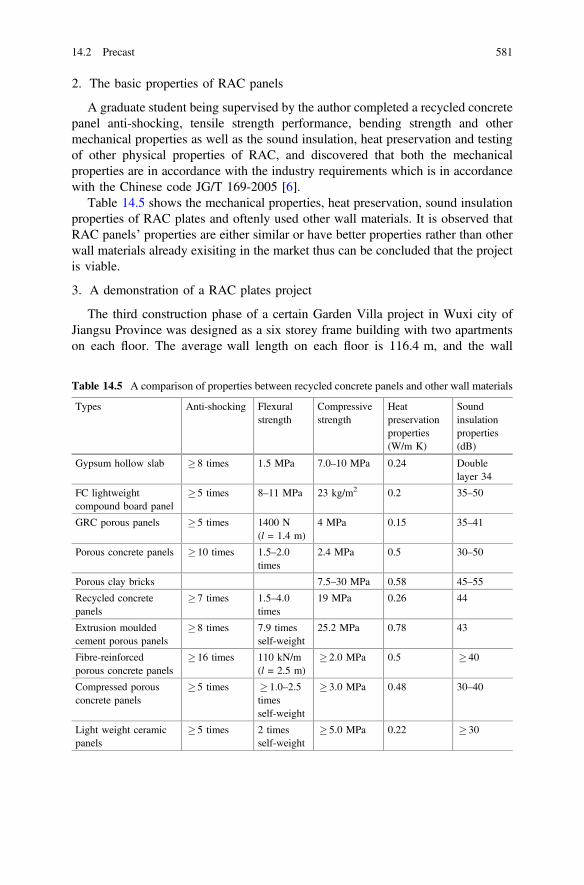
2. The basic properties of RAC panels
A graduate student being supervised by the author completed a recycled concretepanel anti-shocking, tensile strength performance, bending strength and othermechanical properties as well as the sound insulation, heat preservation and testingof other physical properties of RAC, and discovered that both the mechanicalproperties are in accordance with the industry requirements which is in accordancewith the Chinese code JG/T 169-2005 [6].
Table 14.5 shows the mechanical properties, heat preservation, sound insulationproperties of RAC plates and oftenly used other wall materials. It is observed thatRAC panels’ properties are either similar or have better properties rather than otherwall materials already exisiting in the market thus can be concluded that the projectis viable.
3. A demonstration of a RAC plates project
The third construction phase of a certain Garden Villa project in Wuxi city ofJiangsu Province was designed as a six storey frame building with two apartmentson each floor. The average wall length on each floor is 116.4 m, and the wall
Table 14.5 A comparison of properties between recycled concrete panels and other wall materials
Types Anti-shocking Flexuralstrength
Compressivestrength
Heatpreservationproperties(W/m K)
Soundinsulationproperties(dB)
Gypsum hollow slab � 8 times 1.5 MPa 7.0–10 MPa 0.24 Doublelayer 34
FC lightweightcompound board panel
� 5 times 8–11 MPa 23 kg/m2 0.2 35–50
GRC porous panels � 5 times 1400 N(l = 1.4 m)
4 MPa 0.15 35–41
Porous concrete panels � 10 times 1.5–2.0times
2.4 MPa 0.5 30–50
Porous clay bricks 7.5–30 MPa 0.58 45–55
Recycled concretepanels
� 7 times 1.5–4.0times
19 MPa 0.26 44
Extrusion mouldedcement porous panels
� 8 times 7.9 timesself-weight
25.2 MPa 0.78 43
Fibre-reinforcedporous concrete panels
� 16 times 110 kN/m(l = 2.5 m)
� 2.0 MPa 0.5 � 40
Compressed porousconcrete panels
� 5 times � 1.0–2.5timesself-weight
� 3.0 MPa 0.48 30–40
Light weight ceramicpanels
� 5 times 2 timesself-weight
� 5.0 MPa 0.22 � 30
14.2 Precast 581

occupies an area of about 5.47% of the total area. This Garden Villa’s first andsecond phases used a series of KM Porous Bricks. According to the investigationcarried out in 2002 with the home owners regarding the construction, which wascompleted in the second phase and the results were filed and changes were made,the most important opinion made was the area occupied by the wall. In order toreduce the area occupied by the wall, there should be new wall building techniques.
Therefore, for the third phase, the RAC panels were used as materials for themiddle walls in the construction.
After using recycled concrete panels, the area of each floor increased by anaverage of 12.80 m2, and the middle walls area reduced by 2.62%. As to the usersof the building, they did not only get an increased space area but with an averagesaving cost of 4000 ¥/m2, which means with every increasing in floor area therewas a saving of 307,200 ¥. And this brought an advantage to real estate companies,as they can make the best profit. Figure 14.8 shows an example of a RAC panelwall. Using the RAC panel as a wall material does not only solve the city’s largewaste material problems, but it also has a greater advantage when compared totraditional wall materials.
14.3 Quality Control by Nondestructive Inspection
14.3.1 Rebound Hammer Test
Non-destructive test (NDT) methods such as rebound hammer test method are usedmainly for compressive strength of concrete. The test results can only be evaluatedfor on-site concrete strength and can serve as a base to deal with concrete qualityproblems, and it cannot always be used for the assessment of the concrete com-pressive strength. The rebound hammer test method has lots of advantages, such asthe detection equipment is lightweight, flexible, have high precision, unification in
(a) Openings in Plates (b) Placing together of Plates
Fig. 14.8 Recycled concrete panel walls
582 14 Products and Constructions with Recycled Aggregate Concrete
detection and easy with representative sampling. This method has been widely usedin quality assurance and quality control of concrete.
In actual testing, testing personnel should work in strict accordance with thestandard specified. Generally, the concrete structures that need rebound hammer testoften lack some standard specimens or have an insufficient number of standardspecimens. Test results will be used as the basis for assessment of concrete strength.Therefore, the test must be in strict accordance with the “Standard Specification”.
14.3.2 Ultrasonic Pulse Velocity Test (UPV)
UPV is one of the NDT methods to test the concrete strength. Ultrasound can detectthe dynamic elastic modulus of concrete, strength, thickness and defects. Themethod of ultrasonic testing for concrete defects in many countries has formed arelatively mature standard.
UPV testing for concrete defects uses lower emission frequency. When thematerial composition, internal quality and testing distance of concrete in taken intoaccount with other acoustic parameters then the wave amplitude and frequency hasno significant differences when transferred through the concrete. But, whenever theconcrete section has voids, cracks or other defects then the integrity of concrete isdestroyed and the amplitude and frequency value of wave is disturbed as comparedto the testing value of homogeneous concrete. According to the basic principle,UPV testing of concrete is the checking of sound velocity amplitude and frequencyunder the standard condition to find the relative changes in the concrete specimenwith and without defects.
14.4 Case Study
14.4.1 Pavements—In China
In China, beginning from 2002, the waste concrete from Shanghai'sJiangwan Airport was processed into RA and used to build New Jiangwan town’sroad. In 2003, Tongji University constructed a pavement on its Siping campususing recycled concrete aggregates; see Fig. 14.9. In 2006, another campuspavement in Fudan University passing along the News College Building wasbuilt using RA, see Fig. 14.10. In 2007, the middle section of Nanjing city’s Youthstreet was built using NA with RA for road base layer. Also, in 2007, thedemolishing of Wuhan city’s Wangjiadun Airport resulted in large amounts ofconcrete waste, which was later crushed into different sizes of aggregates and wasmainly used in base and surface layers of road construction.
14.3 Quality Control by Nondestructive Inspection 583

The following introduces the author’s research application of RA in concreteroad base and surface layers.
Dual-stable aggregates being the high-grade road surface materials with goodmechanical properties like water absorption limit and with resistance to freeze andthaw were in view among various project technicians. In order to investigate andshow properties of dual-stable RA, the author underwent some research for mix
Fig. 14.9 A view of road in Tongji University constructed using RA
Fig. 14.10 A view of construction in progress of road with RA in Fudan University
584 14 Products and Constructions with Recycled Aggregate Concrete
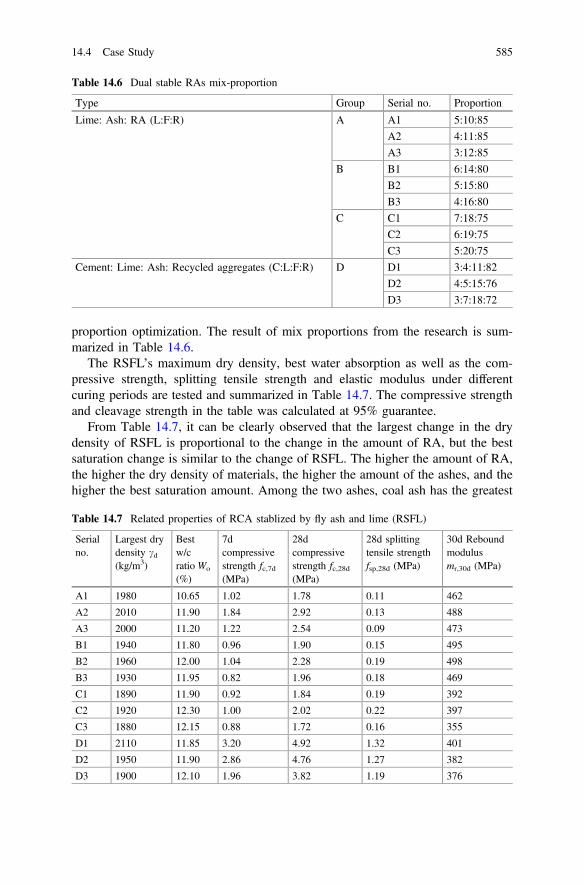
proportion optimization. The result of mix proportions from the research is sum-marized in Table 14.6.
The RSFL’s maximum dry density, best water absorption as well as the com-pressive strength, splitting tensile strength and elastic modulus under differentcuring periods are tested and summarized in Table 14.7. The compressive strengthand cleavage strength in the table was calculated at 95% guarantee.
From Table 14.7, it can be clearly observed that the largest change in the drydensity of RSFL is proportional to the change in the amount of RA, but the bestsaturation change is similar to the change of RSFL. The higher the amount of RA,the higher the dry density of materials, the higher the amount of the ashes, and thehigher the best saturation amount. Among the two ashes, coal ash has the greatest
Table 14.6 Dual stable RAs mix-proportion
Type Group Serial no. Proportion
Lime: Ash: RA (L:F:R) A A1 5:10:85
A2 4:11:85
A3 3:12:85
B B1 6:14:80
B2 5:15:80
B3 4:16:80
C C1 7:18:75
C2 6:19:75
C3 5:20:75
Cement: Lime: Ash: Recycled aggregates (C:L:F:R) D D1 3:4:11:82
D2 4:5:15:76
D3 3:7:18:72
Table 14.7 Related properties of RCA stablized by fly ash and lime (RSFL)
Serialno.
Largest drydensity cd(kg/m3)
Bestw/cratioWo
(%)
7dcompressivestrength fc,7d(MPa)
28dcompressivestrength fc,28d(MPa)
28d splittingtensile strengthfsp,28d (MPa)
30d Reboundmodulusmr,30d (MPa)
A1 1980 10.65 1.02 1.78 0.11 462
A2 2010 11.90 1.84 2.92 0.13 488
A3 2000 11.20 1.22 2.54 0.09 473
B1 1940 11.80 0.96 1.90 0.15 495
B2 1960 12.00 1.04 2.28 0.19 498
B3 1930 11.95 0.82 1.96 0.18 469
C1 1890 11.90 0.92 1.84 0.19 392
C2 1920 12.30 1.00 2.02 0.22 397
C3 1880 12.15 0.88 1.72 0.16 355
D1 2110 11.85 3.20 4.92 1.32 401
D2 1950 11.90 2.86 4.76 1.27 382
D3 1900 12.10 1.96 3.82 1.19 376
14.4 Case Study 585
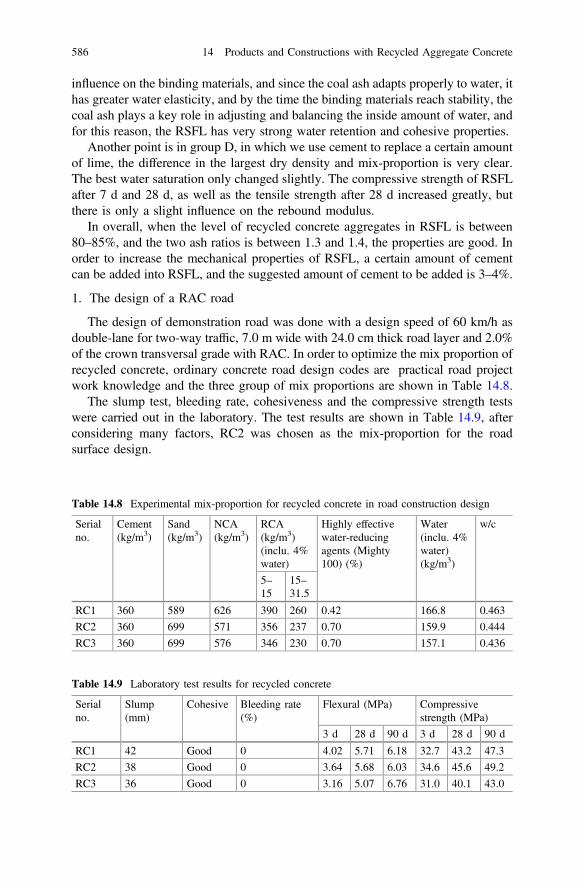
influence on the binding materials, and since the coal ash adapts properly to water, ithas greater water elasticity, and by the time the binding materials reach stability, thecoal ash plays a key role in adjusting and balancing the inside amount of water, andfor this reason, the RSFL has very strong water retention and cohesive properties.
Another point is in group D, in which we use cement to replace a certain amountof lime, the difference in the largest dry density and mix-proportion is very clear.The best water saturation only changed slightly. The compressive strength of RSFLafter 7 d and 28 d, as well as the tensile strength after 28 d increased greatly, butthere is only a slight influence on the rebound modulus.
In overall, when the level of recycled concrete aggregates in RSFL is between80–85%, and the two ash ratios is between 1.3 and 1.4, the properties are good. Inorder to increase the mechanical properties of RSFL, a certain amount of cementcan be added into RSFL, and the suggested amount of cement to be added is 3–4%.
1. The design of a RAC road
The design of demonstration road was done with a design speed of 60 km/h asdouble-lane for two-way traffic, 7.0 m wide with 24.0 cm thick road layer and 2.0%of the crown transversal grade with RAC. In order to optimize the mix proportion ofrecycled concrete, ordinary concrete road design codes are practical road projectwork knowledge and the three group of mix proportions are shown in Table 14.8.
The slump test, bleeding rate, cohesiveness and the compressive strength testswere carried out in the laboratory. The test results are shown in Table 14.9, afterconsidering many factors, RC2 was chosen as the mix-proportion for the roadsurface design.
Table 14.8 Experimental mix-proportion for recycled concrete in road construction design
Serialno.
Cement(kg/m3)
Sand(kg/m3)
NCA(kg/m3)
RCA(kg/m3)(inclu. 4%water)
Highly effectivewater-reducingagents (Mighty100) (%)
Water(inclu. 4%water)(kg/m3)
w/c
5–15
15–31.5
RC1 360 589 626 390 260 0.42 166.8 0.463
RC2 360 699 571 356 237 0.70 159.9 0.444
RC3 360 699 576 346 230 0.70 157.1 0.436
Table 14.9 Laboratory test results for recycled concrete
Serialno.
Slump(mm)
Cohesive Bleeding rate(%)
Flexural (MPa) Compressivestrength (MPa)
3 d 28 d 90 d 3 d 28 d 90 d
RC1 42 Good 0 4.02 5.71 6.18 32.7 43.2 47.3
RC2 38 Good 0 3.64 5.68 6.03 34.6 45.6 49.2
RC3 36 Good 0 3.16 5.07 6.76 31.0 40.1 43.0
586 14 Products and Constructions with Recycled Aggregate Concrete
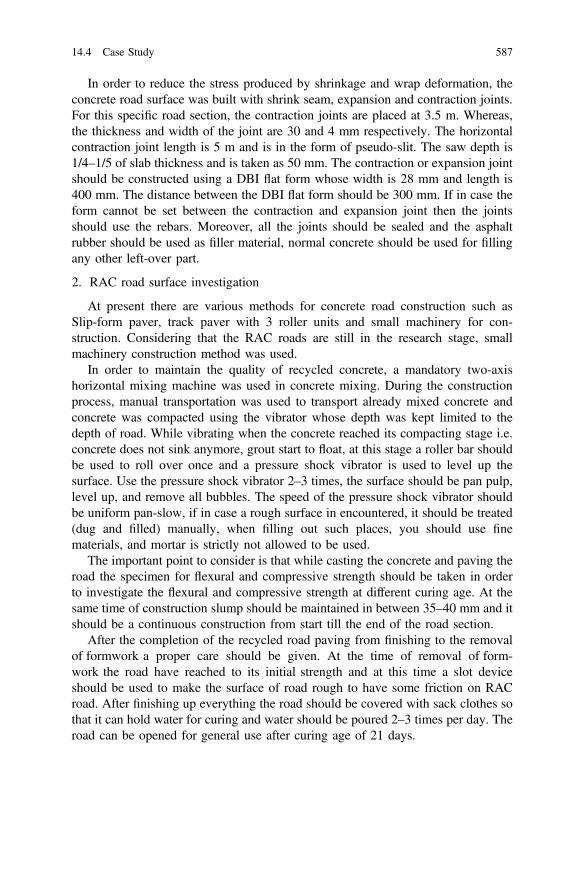
In order to reduce the stress produced by shrinkage and wrap deformation, theconcrete road surface was built with shrink seam, expansion and contraction joints.For this specific road section, the contraction joints are placed at 3.5 m. Whereas,the thickness and width of the joint are 30 and 4 mm respectively. The horizontalcontraction joint length is 5 m and is in the form of pseudo-slit. The saw depth is1/4–1/5 of slab thickness and is taken as 50 mm. The contraction or expansion jointshould be constructed using a DBI flat form whose width is 28 mm and length is400 mm. The distance between the DBI flat form should be 300 mm. If in case theform cannot be set between the contraction and expansion joint then the jointsshould use the rebars. Moreover, all the joints should be sealed and the asphaltrubber should be used as filler material, normal concrete should be used for fillingany other left-over part.
2. RAC road surface investigation
At present there are various methods for concrete road construction such asSlip-form paver, track paver with 3 roller units and small machinery for con-struction. Considering that the RAC roads are still in the research stage, smallmachinery construction method was used.
In order to maintain the quality of recycled concrete, a mandatory two-axishorizontal mixing machine was used in concrete mixing. During the constructionprocess, manual transportation was used to transport already mixed concrete andconcrete was compacted using the vibrator whose depth was kept limited to thedepth of road. While vibrating when the concrete reached its compacting stage i.e.concrete does not sink anymore, grout start to float, at this stage a roller bar shouldbe used to roll over once and a pressure shock vibrator is used to level up thesurface. Use the pressure shock vibrator 2–3 times, the surface should be pan pulp,level up, and remove all bubbles. The speed of the pressure shock vibrator shouldbe uniform pan-slow, if in case a rough surface in encountered, it should be treated(dug and filled) manually, when filling out such places, you should use finematerials, and mortar is strictly not allowed to be used.
The important point to consider is that while casting the concrete and paving theroad the specimen for flexural and compressive strength should be taken in orderto investigate the flexural and compressive strength at different curing age. At thesame time of construction slump should be maintained in between 35–40 mm and itshould be a continuous construction from start till the end of the road section.
After the completion of the recycled road paving from finishing to the removalof formwork a proper care should be given. At the time of removal of form-work the road have reached to its initial strength and at this time a slot deviceshould be used to make the surface of road rough to have some friction on RACroad. After finishing up everything the road should be covered with sack clothes sothat it can hold water for curing and water should be poured 2–3 times per day. Theroad can be opened for general use after curing age of 21 days.
14.4 Case Study 587

3. Recycled concrete road surface investigation
After completion of the road project, a proper investigation should be carried outaccording to nation’s standard JTG E60-2008 [7]. It should include the geometricdimensions, thickness, and level of road surface. While investigating the on-campusroad constructed in Tongji University, the author mentioned all the above-saidindexes in Table 14.10. The results show that the recycled concrete road surface hadno cellular, rough surface, peeling of the upper layer and nor RCA is exposed abovethe flat surface. Also, there was no shortage of edges and cut angle phenomenon.The road curb stone used in the construction of the road is straight with sleekcurved and build quality is good. As as result, no differences were seen as comparedto the ordinary concrete road and the investigation results in satisfying the con-struction regulation of ordinary concrete road.
As the nondestructive testing method is convenient, rebound hammer test wasadopted for the investigation of the recycled concrete road. Table 14.11 showed the
Table 14.10 Test results for geometric dimensions, thickness and surface level of a recycledconcrete road
Investigatesitem
Deviationcompared to theregulation codes
Actualdeviation
Investigation method
Flatness ofsurface level(mm)
3 2.2 3 m measuring tape, for every100 m to be measured 5 times
Heights ofplates puttogether (mm)
2 1.3 Measure 5 sections on every 100 m,and 3 points on each section
The height inelevation (mm)
±10 +8, −3 Measure 5 times the horizontal levelon every 100 m
Road humpsslope (%)
±0.15 +0.12, −0.09 Measure 3 sections on every 100 m
Road width(mm)
10 7 Measure 3 sections at random onevery 100 m
Road surfacethickness(mm)
±10 +5, −8 Using the Coring method measureonce every 100 m
Degree ofstraighttransverse joint(mm)
10 7.6, Nodifference inexpansionjoints
In every 20 contraction joints,randomly choose 2, and measurealong the plate width for the widestvalue
Table 14.11 Compressive strength of RAC road surface using rebound hammer test
Curing 7 d 28 d 90 d Explanation
Mean value (MPa) ofdifferent points at samecuring age
42.5 44.6 45.8 Model of rebound hammer is ZC3-Aand test in accordance with Chap. 6 ofthis book.
588 14 Products and Constructions with Recycled Aggregate Concrete

mean value for the compressive strength of RAC road surface at different curingages. Test results proved that the compressive strength of rebound hammer issimilar to that of results in laboratory experimental results.
14.4.2 Cast-in-situ RAC Frame Structure
The building presented in Fig. 14.11 is Shanghai ecological house, which is locatedin Shanghai World Expo Park build for 2010 EXPO Urban Best Practice Area. As ademonstrative ecological green building, a large number of green constructiontechniques are applied and it is also the first “zero energy consumption” ecologicaldemonstration building in China.
The building is a reinforced concrete frame structure with total construction areaof 3000 m2, which includes 4 floors above ground and 1 underground floor. It is
(a) Construction on lower part of Shanghai ecological house
(b) Construction on upper part of Shanghai ecological house
(c) General view of the Shanghai ecological house
Fig. 14.11 “Shanghai Eco-House” located in Shanghai World Expo Park
14.4 Case Study 589

noteworthy that the whole structure is made of RAC. The mass ratio of the RCA tothe whole coarse aggregates is 100%, with a concrete strength grade C30 and C40is used in construction of building as per specifications. The field samplinginspection shows that the strength, durability and construction performance of RACcan meet the design requirements completely.
This building is a typical application of RAC as structural material forcast-in-situ reinforced concrete frame structures.
14.4.3 Precast RAC Frame Structure
The Shanghai Urban Construction No. 2 demonstration building shown inFig. 14.12 adopted a full precast frame structure system. Experimental studies werecarried out during this project, which focuses on the further development of precastconcrete (PC) including precast RAC technology.
This three-storey building is an assembled monolithic reinforced concrete framestructure, with a storey height of 3.60 m. In particular, RAC with a 100% RCAreplacement percentage was put into use in half of the building at the easternpart. The frame columns used in this test building were prefabricated in a factory,while grout sleeve technology was used to connect the longitudinal reinforcementof the columns. Meanwhile, in this project, frame beams and columns both werecomposite. PC rate reached above 70%, while the energy-saving rate was 75%.Because of RAC in construction, this project not only brings environmental andecological benefits but also brings an economic benefit to the contractor. In addi-tion, since this test building used RAC and normal concrete as its structuralmaterials in different parts at the same time, a clear comparison can be made as tostrengthen residents’ confidence concerning the precast RAC structure.
(a) Cast-in-situ RAC joint of this building (b) Shanghai Urban Construction No.2building in construction process
Fig. 14.12 Construction of a Shanghai Urban RAC structure as a test building with concretemade of 50% RA
590 14 Products and Constructions with Recycled Aggregate Concrete
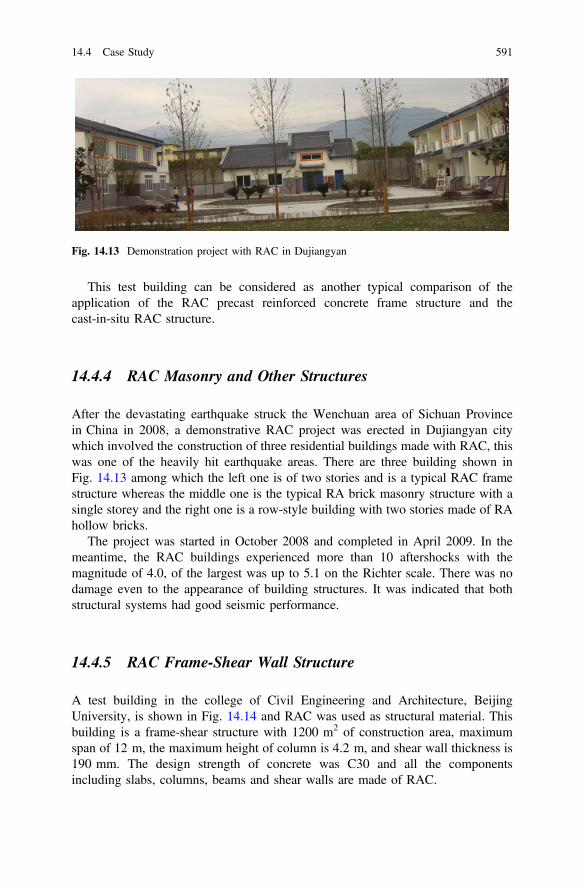
This test building can be considered as another typical comparison of theapplication of the RAC precast reinforced concrete frame structure and thecast-in-situ RAC structure.
14.4.4 RAC Masonry and Other Structures
After the devastating earthquake struck the Wenchuan area of Sichuan Provincein China in 2008, a demonstrative RAC project was erected in Dujiangyan citywhich involved the construction of three residential buildings made with RAC, thiswas one of the heavily hit earthquake areas. There are three building shown inFig. 14.13 among which the left one is of two stories and is a typical RAC framestructure whereas the middle one is the typical RA brick masonry structure with asingle storey and the right one is a row-style building with two stories made of RAhollow bricks.
The project was started in October 2008 and completed in April 2009. In themeantime, the RAC buildings experienced more than 10 aftershocks with themagnitude of 4.0, of the largest was up to 5.1 on the Richter scale. There was nodamage even to the appearance of building structures. It was indicated that bothstructural systems had good seismic performance.
14.4.5 RAC Frame-Shear Wall Structure
A test building in the college of Civil Engineering and Architecture, BeijingUniversity, is shown in Fig. 14.14 and RAC was used as structural material. Thisbuilding is a frame-shear structure with 1200 m2 of construction area, maximumspan of 12 m, the maximum height of column is 4.2 m, and shear wall thickness is190 mm. The design strength of concrete was C30 and all the componentsincluding slabs, columns, beams and shear walls are made of RAC.
Fig. 14.13 Demonstration project with RAC in Dujiangyan
14.4 Case Study 591

The results proved that RAC can meet the performance criteria as per therequirements of ordinary concrete structures. The RAC shows a good performancein the construction process having favorable fluidity, water retention and cohe-siveness. The appearance quality is fine without any obvious cracks on the surfaceafter the completion of building. The building has been put into use for teachingand testing for more than 3 years, and no quality problems are observed.
This building is a typical application of RAC as a structural material inframe-shear wall structures which proves the viability of RAC to be used in suchkind of structures.
The project 133 world square is located at Wujiaochang town, Yangpu county,Shanghai. The No. 2 building is a fram-shear wall structure, consisting of the towerA, which is constructed with reinforced RAC structure, and tower B, which isconstructed with reinforced NAC structure. The basement and the lowest 3 floors oftower A and tower B are used for parking. The building plane reduces beyondfourth floor, used as office building. The height of No. 2 building is 49.2 m. Designsketch and image of tower A of No. 2 building are shown in Figs. 14.15 and 14.16.
RAC was applied beyond the first floor. The main structural components below±0.000 level i.e., beams, slabs, columns and walls were built with NAC. To assurethe ductility of the structure, the vertical components, including shear walls andcolumns, of the first and second floor were also built with NAC, and those beyondthe third floor were built with RAC. The horizontal component such as beams andslabs were made of RAC beyond ±0.000 level. The replacement percentage ofRCA depends on the strength grade of RAC. The replacement percentage was 10,30 and 30% for RC50, RC40 and RC30 respectively. Cross section and the strengthgrade distribution of RAC structure are shown in Fig. 14.17.
Reinforced NAC structure was used in tower B, whose load components dis-tribution and usage are similar to those of tower A, and this provide an opportunityto compare the time-dependent performance of structure and components betweenRAC structure and NAC structure.
(a) Construction of No.6 building with RAC in Beijing, China
(b) The view of No.6 building built with RAC after completion in Beijing, China
Fig. 14.14 A test building in Beijing University of Civil Engineering and Architecture
592 14 Products and Constructions with Recycled Aggregate Concrete
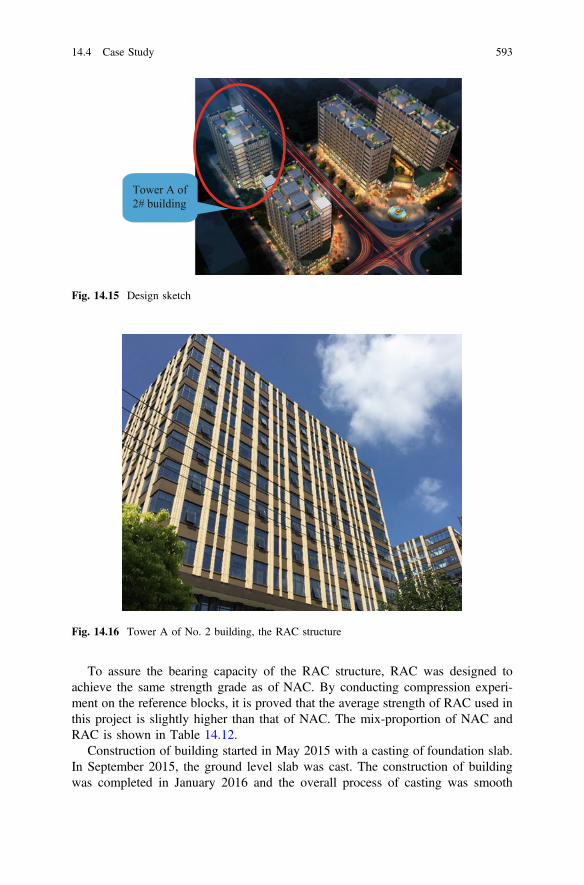
To assure the bearing capacity of the RAC structure, RAC was designed toachieve the same strength grade as of NAC. By conducting compression experi-ment on the reference blocks, it is proved that the average strength of RAC used inthis project is slightly higher than that of NAC. The mix-proportion of NAC andRAC is shown in Table 14.12.
Construction of building started in May 2015 with a casting of foundation slab.In September 2015, the ground level slab was cast. The construction of buildingwas completed in January 2016 and the overall process of casting was smooth
Fig. 14.16 Tower A of No. 2 building, the RAC structure
Tower A of 2# building
Fig. 14.15 Design sketch
14.4 Case Study 593

indicating that the mix proportion optimization of workability of RAC is same asthat of NAC (Figs. 14.18 and 14.19).
14.4.6 Steel Frame Filled with RA Bricks
The photograph shown in Fig. 14.20 is an office building located in Pudong,Shanghai, China. This two-storey office building was built in 2010 with a 1200 m2
construction area. In particular, this office building is a steel frame structure withinfilled walls built of RA bricks.
Fig. 14.17 Cross section and the strength grade distribution of RAC structure
Table 14.12 Mix proportion of NAC and RAC
Rawmaterial
Water Cement Sand NCA RCA Fly ash Mineralpowder
Admixture
Category Middle 5–25 5–25 Second S95 P-2 P-1
C30 178 231 (42.5) 793 1030 0 53 71 5.15
RC30(30%)
178 235 (42.5) 793 721 309 53 71 5.20
C40 168 257 (42.5) 789 1024 0 59 79 3.75
RC40(30%)
168 270 (42.5) 789 717 307 59 79 3.88
C50 161 254 (52.5) 771 1022 0 72 97 4.23
RC50(10%)
161 273 (52.5) 771 920 102 72 97 4.42
594 14 Products and Constructions with Recycled Aggregate Concrete
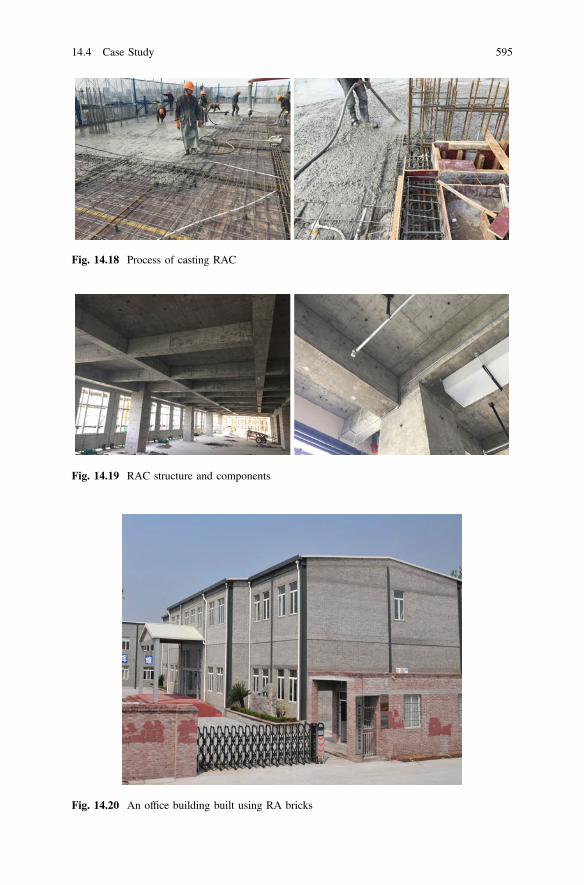
Fig. 14.18 Process of casting RAC
Fig. 14.19 RAC structure and components
Fig. 14.20 An office building built using RA bricks
14.4 Case Study 595
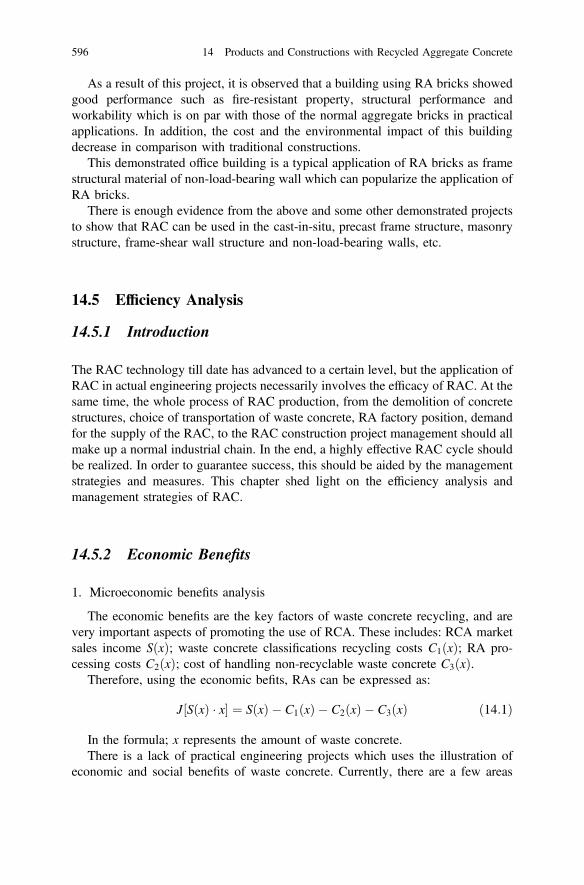
As a result of this project, it is observed that a building using RA bricks showedgood performance such as fire-resistant property, structural performance andworkability which is on par with those of the normal aggregate bricks in practicalapplications. In addition, the cost and the environmental impact of this buildingdecrease in comparison with traditional constructions.
This demonstrated office building is a typical application of RA bricks as framestructural material of non-load-bearing wall which can popularize the application ofRA bricks.
There is enough evidence from the above and some other demonstrated projectsto show that RAC can be used in the cast-in-situ, precast frame structure, masonrystructure, frame-shear wall structure and non-load-bearing walls, etc.
14.5 Efficiency Analysis
14.5.1 Introduction
The RAC technology till date has advanced to a certain level, but the application ofRAC in actual engineering projects necessarily involves the efficacy of RAC. At thesame time, the whole process of RAC production, from the demolition of concretestructures, choice of transportation of waste concrete, RA factory position, demandfor the supply of the RAC, to the RAC construction project management should allmake up a normal industrial chain. In the end, a highly effective RAC cycle shouldbe realized. In order to guarantee success, this should be aided by the managementstrategies and measures. This chapter shed light on the efficiency analysis andmanagement strategies of RAC.
14.5.2 Economic Benefits
1. Microeconomic benefits analysis
The economic benefits are the key factors of waste concrete recycling, and arevery important aspects of promoting the use of RCA. These includes: RCA marketsales income SðxÞ; waste concrete classifications recycling costs C1ðxÞ; RA pro-cessing costs C2ðxÞ; cost of handling non-recyclable waste concrete C3ðxÞ.
Therefore, using the economic befits, RAs can be expressed as:
J½SðxÞ � x� ¼ SðxÞ � C1ðxÞ � C2ðxÞ � C3ðxÞ ð14:1Þ
In the formula; x represents the amount of waste concrete.There is a lack of practical engineering projects which uses the illustration of
economic and social benefits of waste concrete. Currently, there are a few areas
596 14 Products and Constructions with Recycled Aggregate Concrete
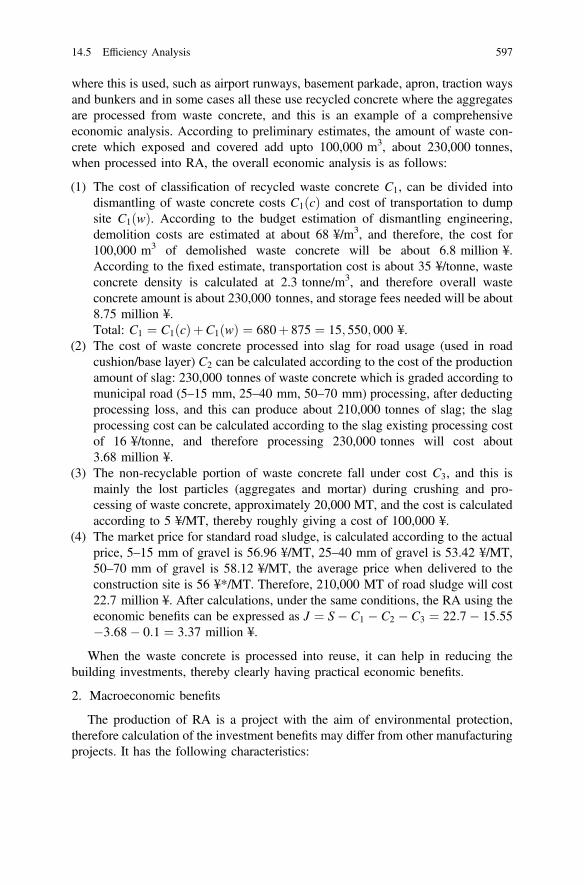
where this is used, such as airport runways, basement parkade, apron, traction waysand bunkers and in some cases all these use recycled concrete where the aggregatesare processed from waste concrete, and this is an example of a comprehensiveeconomic analysis. According to preliminary estimates, the amount of waste con-crete which exposed and covered add upto 100,000 m3, about 230,000 tonnes,when processed into RA, the overall economic analysis is as follows:
(1) The cost of classification of recycled waste concrete C1, can be divided intodismantling of waste concrete costs C1ðcÞ and cost of transportation to dumpsite C1ðwÞ. According to the budget estimation of dismantling engineering,demolition costs are estimated at about 68 ¥/m3, and therefore, the cost for100,000 m3 of demolished waste concrete will be about 6.8 million ¥.According to the fixed estimate, transportation cost is about 35 ¥/tonne, wasteconcrete density is calculated at 2.3 tonne/m3, and therefore overall wasteconcrete amount is about 230,000 tonnes, and storage fees needed will be about8.75 million ¥.Total: C1 ¼ C1ðcÞþC1ðwÞ ¼ 680þ 875 ¼ 15; 550; 000 ¥.
(2) The cost of waste concrete processed into slag for road usage (used in roadcushion/base layer) C2 can be calculated according to the cost of the productionamount of slag: 230,000 tonnes of waste concrete which is graded according tomunicipal road (5–15 mm, 25–40 mm, 50–70 mm) processing, after deductingprocessing loss, and this can produce about 210,000 tonnes of slag; the slagprocessing cost can be calculated according to the slag existing processing costof 16 ¥/tonne, and therefore processing 230,000 tonnes will cost about3.68 million ¥.
(3) The non-recyclable portion of waste concrete fall under cost C3, and this ismainly the lost particles (aggregates and mortar) during crushing and pro-cessing of waste concrete, approximately 20,000 MT, and the cost is calculatedaccording to 5 ¥/MT, thereby roughly giving a cost of 100,000 ¥.
(4) The market price for standard road sludge, is calculated according to the actualprice, 5–15 mm of gravel is 56.96 ¥/MT, 25–40 mm of gravel is 53.42 ¥/MT,50–70 mm of gravel is 58.12 ¥/MT, the average price when delivered to theconstruction site is 56 ¥*/MT. Therefore, 210,000 MT of road sludge will cost22.7 million ¥. After calculations, under the same conditions, the RA using theeconomic benefits can be expressed as J ¼ S� C1 � C2 � C3 ¼ 22:7� 15:55�3:68� 0:1 ¼ 3.37 million ¥.
When the waste concrete is processed into reuse, it can help in reducing thebuilding investments, thereby clearly having practical economic benefits.
2. Macroeconomic benefits
The production of RA is a project with the aim of environmental protection,therefore calculation of the investment benefits may differ from other manufacturingprojects. It has the following characteristics:
14.5 Efficiency Analysis 597

(1) The indirect benefits
All the benefits of the investment only help in improving the production level,the socioeconomic loss decreases, but the actual benefits for waste concrete pro-cessing are very small.
(2) The dispersibility of the benefits
The dangers of the pollution of building waste on different stages of society,includes production, human life, landscape and human health, and all these helpdecide the processing of waste concrete using the dispersibility of the benefits.
(3) The hidden benefits
The hidden benefits may not be tangible to people, but there is a guarantee fornormal production, making life easier for people and preventing pollution. If peopleignore these benefits, there will be a high price to pay in future. Many localauthorities have emphasized other industrial products and not the building wasteprocessing factory, the reason is that the current government strategies are bene-ficial to the former, while they are not beneficial to the latter.
Most industrial projects produce commodities on the market and take money inreturn for production, the economic benefits are obvious, while RAC project has thethree characteristics which are mentioned above and cannot be compared andignored.
Therefore, the evaluation analysis for the economic benefits of public projectssuch as RA production should be treated in an objective manner. It should not onlybe looked at the project’s economic factor, but its environmental economic factormust also be considered. After overall analysis of the project’s total cost andbenefits, the economic index can be calculated. In this way, the economic index willbe objectively and give an overall view.
14.5.3 Overall Environmental Benefits
The overall benefits of RAC application refer to the complete economic andenvironmental benefits under certain socioeconomic and technical conditions forrecycling and processing of waste concrete into RA.
This can be expressed as:
RðxÞ ¼ JðxÞþ a � HðxÞ ð14:2Þ
In the formula: RðxÞ is the total benefits of the use of RA; JðxÞ economic benefitsfor the use of RA; HðxÞ environmental benefits for the use of RA; a is a coefficientfor environmental influencing factors.
The total cost for RAs refers to the investment under certain socioeconomic andtechnical conditions for recycling and processing of waste concrete into RA.
598 14 Products and Constructions with Recycled Aggregate Concrete

The total cost and the total benefits are the keys to analyzing the benefits of RCAapplication. Under different technical solutions and scales, the cost benefits willundergo a change too. First of all, collect and analyze all the necessary technicaleconomic data and background reference, and then divide them into project eco-nomic and environmental benefits for calculations, and the calculations should bebased on the same standards, currency and time.
If you use the present day product evaluation, the project economic and envi-ronmental benefits can be reduced, and lastly divide the cost into two parts, totalcost and total benefits, and find the ratio of two. If the benefits are larger than thecost, the project evaluation passes the evaluation; otherwise, the project fails; seeFig. 14.21.
Taking Shanghai as an example, the data statistics show that in recent years,concrete area for urban demolitions projects exceeds 2 million m2. As the citydevelops, waste amount of concrete will keep on increasing and at same time theannual demand for commercial concrete will keep on increasing. Currently, city’sanuual demand for concrete strength grade C10 and C15 is approximately300,000 m3, the annual demand for C20 and C25 is 400,000 m3 and for C30 andC35 is 4 million m3. Therefore, if RAC can be used to replace ordinary concretestrength grade below C35, it will achieve good economic and social benefits.
1. The analysis of economic benefits
Table 14.13 shows an example for the annual production of 400,000 m3 ofRAC. According to the above research, RAC uses the mix-proportion calculationresults as shown in Table 14.14. And according to the Shanghai city’s buildingmaterials market investigation, the prices for the original materials are shown inTable 14.15.
Fig. 14.21 An analysis model for total benefits of RA application
Table 14.13 The investment composition (Investment estimations) (million ¥)
Building project Equipment Installation project Other Total
2 60 1 40 103
14.5 Efficiency Analysis 599
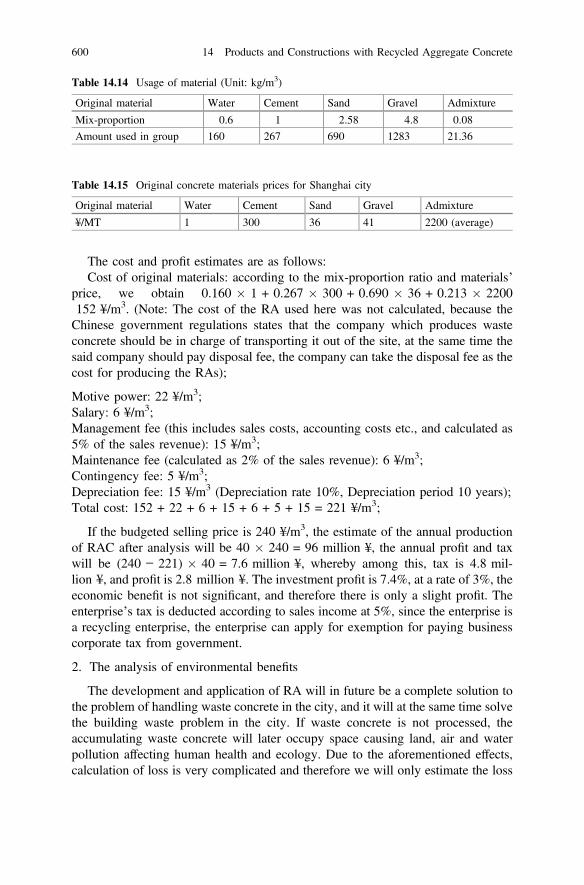
The cost and profit estimates are as follows:Cost of original materials: according to the mix-proportion ratio and materials’
price, we obtain 0.160 � 1 + 0.267 � 300 + 0.690 � 36 + 0.213 � 2200152 ¥/m3. (Note: The cost of the RA used here was not calculated, because theChinese government regulations states that the company which produces wasteconcrete should be in charge of transporting it out of the site, at the same time thesaid company should pay disposal fee, the company can take the disposal fee as thecost for producing the RAs);
Motive power: 22 ¥/m3;Salary: 6 ¥/m3;Management fee (this includes sales costs, accounting costs etc., and calculated as5% of the sales revenue): 15 ¥/m3;Maintenance fee (calculated as 2% of the sales revenue): 6 ¥/m3;Contingency fee: 5 ¥/m3;Depreciation fee: 15 ¥/m3 (Depreciation rate 10%, Depreciation period 10 years);Total cost: 152 + 22 + 6 + 15 + 6 + 5 + 15 = 221 ¥/m3;
If the budgeted selling price is 240 ¥/m3, the estimate of the annual productionof RAC after analysis will be 40 � 240 = 96 million ¥, the annual profit and taxwill be (240 − 221) � 40 = 7.6 million ¥, whereby among this, tax is 4.8 mil-lion ¥, and profit is 2.8 million ¥. The investment profit is 7.4%, at a rate of 3%, theeconomic benefit is not significant, and therefore there is only a slight profit. Theenterprise’s tax is deducted according to sales income at 5%, since the enterprise isa recycling enterprise, the enterprise can apply for exemption for paying businesscorporate tax from government.
2. The analysis of environmental benefits
The development and application of RA will in future be a complete solution tothe problem of handling waste concrete in the city, and it will at the same time solvethe building waste problem in the city. If waste concrete is not processed, theaccumulating waste concrete will later occupy space causing land, air and waterpollution affecting human health and ecology. Due to the aforementioned effects,calculation of loss is very complicated and therefore we will only estimate the loss
Table 14.14 Usage of material (Unit: kg/m3)
Original material Water Cement Sand Gravel Admixture
Mix-proportion 0.6 1 2.58 4.8 0.08
Amount used in group 160 267 690 1283 21.36
Table 14.15 Original concrete materials prices for Shanghai city
Original material Water Cement Sand Gravel Admixture
¥/MT 1 300 36 41 2200 (average)
600 14 Products and Constructions with Recycled Aggregate Concrete

due to land occupation, with Shanghai city as an example. In 2007, Shanghai cityproduced about 9 million tonnes of waste concrete with a density of 2 tonne/m3,the annual volume of waste concrete would occupy a total of 4.5 million m3. If thecompany transports 20% of waste concrete and throw it at an open space as rubbish,there would be 900 m3 of waste thrown away. If this waste concrete is not pro-cessed, rather only thrown at the city’s outskirts, according to a height of 10 meters,it will occupy an area of 90 m2 (approximately 135 ha). According to the estimatedcity suburbs land price of 10,000 ¥/ha, the land occupied by waste concrete willcause a loss of 13.5 million ¥. The other reason is that with the reuse of wasteconcrete, there will be a large amount of NA saved annually, and in turn helpsnatural environment protection. To produce 400,000 m3 of RAC, if NCAs are used,we will need (40 � 1.283 � 51) 51 million tonnes of gravel. The use of RAC willshow a reduction in the use of gravel, this will reduce the cost by (51 million tonne� 0.41 ¥/tonne � 20 million ¥) 20 million ¥. From an environmental and eco-nomic perspective, the overall benefits of the project are very high.
3. The analysis of the overall benefits
If the said project runs for a duration of 10 years, its cost of 10 years as well asthe sales income and environmental benefits are shown in Table 14.16. From thetable, it can be clearly seen that, without considering the air and water losses, byjust calculating the estimate for setting up a RAC factory which will avoid wasteconcrete occupying land surface and reducing the use of NA costs, the ratio of thebenefits to the cost is greater than 3, the average annual income is above 30%, thisis a uniquely high-benefit project (¥ = Chinese Yuan).
14.6 Management Strategies
The research of RAC is only from a technical point of view, and there has been lesswork done on promoting its use, and therefore, there are still many factors whichstill needs to be studied. Currently, the main factors which influence the technicaldevelopment of RAC are: industry chain structure and policy guidance.
Table 14.16 The project cost benefits
No. Item (Million ¥)
1 Total cost (overallinvestment)
103
2 Total benefits Economic benefits 2.80 � 10 = 2.800
Environmental benefits(partly)
1350 � 10 = 13,5002000 � 10 = 20,000
Total33,500
3 Total benefits/Total cost (34,500 + 2800)/10,300 = 3.5
14.5 Efficiency Analysis 601

14.6.1 The Recycled Concrete Industry Chain
The cyclic economic model for the reuse of waste concrete is mainly a chainstructure that includes three steps: company, area and natural ecology system.
1. Company stage
Cyclic economy stresses the prevention of waste production. First of all, theamount of waste discharged and discharge standards should be first controlled at acompany level, strictly controlling the amount of waste discharged into the city.This requires the company to stress the amount of building waste it produces anddischarge, it is the building waste overall management in terms of amount, volume,type, hazard and other aspects leading to clean production. It does not only requirethe reduction of building waste quantity and volume, it also includes reducing thetypes of building waste, reducing the hazardous concentration and reducing oreliminating harmful substances.
It requires a feedback mechanism within the company and should be increasedbased on the traditional industry economic technical scope. It is required that thecompany should extend the production chain, extending it from not only producingthe product to reuse and recycling of waste product. The broadening of the hori-zontal technology system and the reuse and treating of hazardous waste should bedone during waste production. The companies should be encouraged to promoteclean production, ecological design, promoting conservation of resources, sav-ing energy, as well as the new technology of recycling and reuse, thereby achievingavoiding production of waste requirement. On one hand, the consideration of anindustrial chain which uses the reduction of building waste technique from the startof the production of building waste up to the end, and on the other hand, it alsoconsiders the issue of building waste in the vertical industrial chain and cycle ofreuse of resources within the company, therefore forming up horizontal chain andcompany minor cycle. The specialist demolition company can sort out the buildingwaste which can still be used and give it to the construction company for recyclingand reuse or transport it to other construction sites for reuse. The waste concrete isprocessed into RA in a RA plant and transported to the construction site where it isneeded for use.
2. Area stage
The company’s reduction stage can highly reduce the waste concrete quantityand the classification of building waste during collection will increase the value forreuse of resources. At the same time, according to reuse functions of resources ofbuilding waste, ecology industrial chain for different types of RA can be created(see Fig. 14.22), in this way waste concrete can be transformed into recycledproducts, this will not only solve the waste concrete problem in the city at an areamanaging stage, but will also realize the value addition to waste concrete.
The RA ecological industry chain should be according to the local buildingsystems, with special characteristics of different building waste in different areas of
602 14 Products and Constructions with Recycled Aggregate Concrete
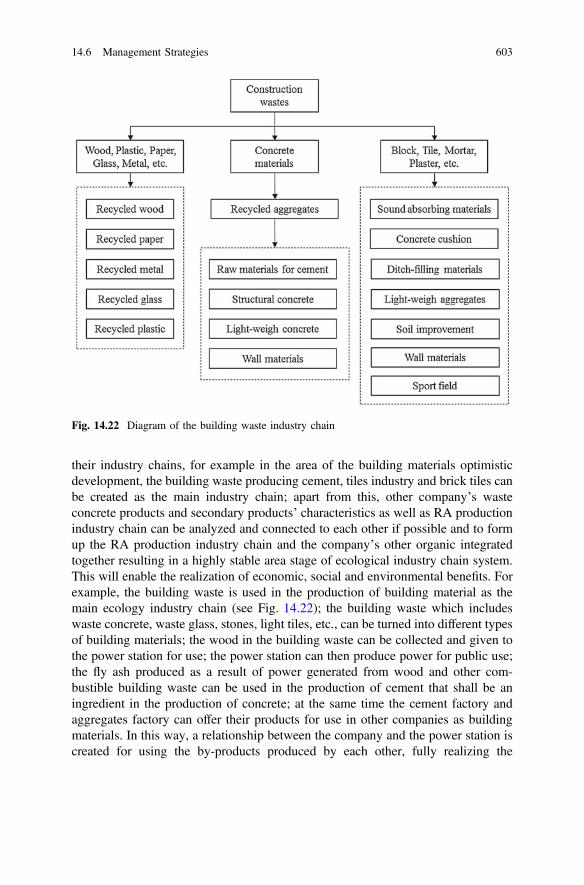
their industry chains, for example in the area of the building materials optimisticdevelopment, the building waste producing cement, tiles industry and brick tiles canbe created as the main industry chain; apart from this, other company’s wasteconcrete products and secondary products’ characteristics as well as RA productionindustry chain can be analyzed and connected to each other if possible and to formup the RA production industry chain and the company’s other organic integratedtogether resulting in a highly stable area stage of ecological industry chain system.This will enable the realization of economic, social and environmental benefits. Forexample, the building waste is used in the production of building material as themain ecology industry chain (see Fig. 14.22); the building waste which includeswaste concrete, waste glass, stones, light tiles, etc., can be turned into different typesof building materials; the wood in the building waste can be collected and given tothe power station for use; the power station can then produce power for public use;the fly ash produced as a result of power generated from wood and other com-bustible building waste can be used in the production of cement that shall be aningredient in the production of concrete; at the same time the cement factory andaggregates factory can offer their products for use in other companies as buildingmaterials. In this way, a relationship between the company and the power station iscreated for using the by-products produced by each other, fully realizing the
Fig. 14.22 Diagram of the building waste industry chain
14.6 Management Strategies 603

material and energy integration in the area stage, forming up a special buildingwaste ecological industry chain network model.
3. Natural ecology system stage
Cyclic economy sees human beings is part of a natural ecology system, andinitiating economic development should be within the ecological scope, and notdamage the equilibrium of the natural ecological system. In construction, the dig-ging of the foundation, underground floor levels, and underground pipework pro-duce a large amount of earth and stones, as well as large amounts of earth, wasteconcrete pieces, waste bricks and tiles waste produced in concrete structuredemolition, these are all important parts of organic matter in the biosphere. Thesand, gravel and earth produced in one area or district, in the long run will belacking in this district, and thereby breaking the ecological environment, leading tothe non equilibrium of the said area’s ecological system.
Therefore, in the natural ecology system stage, the whole society technicalsystem is required to realize functioning as a network, resources being turned intothe industry cyclic reuse, formulating support mechanism, laws and regulations,strategies and standards, etc., in order to realize building waste resource recoverybased on the social cycle stage. The sand, gravel and earth characteristics inbuilding waste must be fully utilized, to allow the building to re-enter the naturalecology system through material and energy cycle, thereby forming up the cycle ofbuilding waste in the natural ecology system stage.
14.6.2 Management Strategies of RAC
1. The management strategies for waste concrete recycling and reuse
Some European countries, USA and other developed countries have imple-mented the recovery of building waste for many years, they have gathered expe-rience and formulated regulations in the recycling and reuse of waste concrete.
Apart from these countries, Asia and some other regions such as Japan, HongKong, Singapore and others have also developed systems that are worth learningfrom, mostly the processing of waste concrete. According to the stages of the wasteconcrete recycling process (production, transportation, recycling/reuse and infor-mation management system), management strategies adopted by developed coun-tries can be elaborated as follows:
(1) Waste concrete production stage
① Booklet for handling the waste concrete calculations: The business owner isrequired to make proper calculations of the building waste which will beproduced during the construction or demolition and hand the booklet to
604 14 Products and Constructions with Recycled Aggregate Concrete

relevant authorities for inspection, the business owner without such workshall be regarded as having broken the law.
② Implementing the system whereby the producer of waste concrete pays afee: According to the quantity of waste concrete produced, a certain feemust be payable. It should also be stressed here than the business ownershould strengthen the recycling of waste concrete.
③ Stressing the onsite waste concrete recycling and reuse. New engineeringprojects must be compelled to use a certain amount of RA, in this way theprocessed waste concrete quantity can be reduced, and at the same time thebusiness owner can be force to carry out onsite processing of wasteconcrete.
(2) Cleaning and transporting waste concrete stage
① Implementing transporting flow control, making use of receipt approvalmethod to make sure the transported waste concrete reaches its final des-tination properly, and the quantity of waste concrete into and out of theprocessing factory and the site should be checked to make sure it is correct,and whether all the regulations were followed.
② Stressing the waste concrete to be transported to the final destination.③ Improving the collection of fees at the waste concrete dump site. The
quantity of waste concrete to be finally processed can be reduced throughimproving the dump site fee collection.
(3) The recycling and reuse of waste concrete stage
① Compelling public engineering projects to use RAs.② Draw up RA standards.③ Companies which use RA must be rewarded.④ Draw up building waste recycling and reuse regulations. Research of waste
concrete recycling and reuse must be carried out, in order to find possibleways of waste concrete reduction and creating the recycling and reusemethods and regulations.
⑤ The implementation of recycling and reuse of building waste educationalpromotions. The business owners and related organizations must organizeactivities to promote the education of waste concrete, and reporting on theresearch of waste concrete by companies and research institutes, in order tohelp promote communications between the two, and increase the recyclingand reuse benefits.
⑥ Creating a waste concrete information center. The waste concrete produc-tion quantity, area produced, type, flow can all be understood clearlythrough creating a waste concrete information center. On the one hand, itcan be seen as reference to promoting the strategies, while on the otherhand, it be seen as improving all the relevant organizations, the businessowner and the public, with information concerning building waste recyclingand reuse.
14.6 Management Strategies 605

2. Suggestions on the management strategies and creation of a model of recyclingof waste concrete in China
Currently, no matter from which point of view, China’s waste concrete man-agement and the procedures for the recycling and reuse of waste concrete, strate-gies, related technology and equipment are all still at an early stage. Standards, lawsand regulation strategies as well as the technical codes for promoting the recyclingand reuse of waste concrete still has many weaknesses, and the forms of wasteconcrete management have not been fully created. The basic information for wasteconcrete is not complete. The experience and technical ability for the recycling andreuse of waste concrete must to be strengthened. The difficulties encountered bytreatment facilities in China have led to the sluggisness in the processing capacity ofrecycling and reusing waste concrete countrywide, thereby rendering the wholeprocess not being ideal. The work is referenced in this book for the managementstrategies and application of recycling and reuse of waste concrete from somecountries worldwide, and suggestions are given on the waste concrete managementstrategies and management model. Related organizations may use the suggestionsas reference, and they are as follows:
(1) Creating funds to aid the research of the recycling and reuse of waste concrete.Doing throughout systematic research in order to formulate related specifica-tions and regulations, and thereby taking waste concrete recycling and reuse toan advanced technological stage.
(2) Strengthening legislations. Using economic levers to adjust and fully imple-ment the application of RA. Legislations must give key support to the recyclingand reuse of waste concrete. Waste concrete recycling and reuse must be a newindustry and a new applied technique.
(3) Positively developing the research of waste concrete crushing facilities andcrushing technology. The creation of at least one factory for the RA processing,waste concrete recycling and reuse, or a RAC mixing plant within a radius of10 km is suggested. This will enable the achievement of fully recycling andreuse of waste concrete.
(4) Reducing the dump sites for building waste, and raising the cost of the city’sbuilding waste handling. The actual dump sites, facilities, and amount ofbuilding waste they can store should be set out in the city plans, and shoulddirectly influence the cost of cleaning and transporting building waste, throughraising the building waste handling costs, the business owner and demolishingcompany’s practice of easily demolishing structures and dumping waste con-crete anywhere can be restricted or limited.
(5) The rules and regulations of waste concrete recycling and reuse must appro-priately assist the state in protecting resources through proper use of the gov-ernment strategies and financial support. If there will be reduced costs fordemolishing old building structures by the business owner and demolishingcompany, there may be a fair competition between the cost of RA and NA.
606 14 Products and Constructions with Recycled Aggregate Concrete
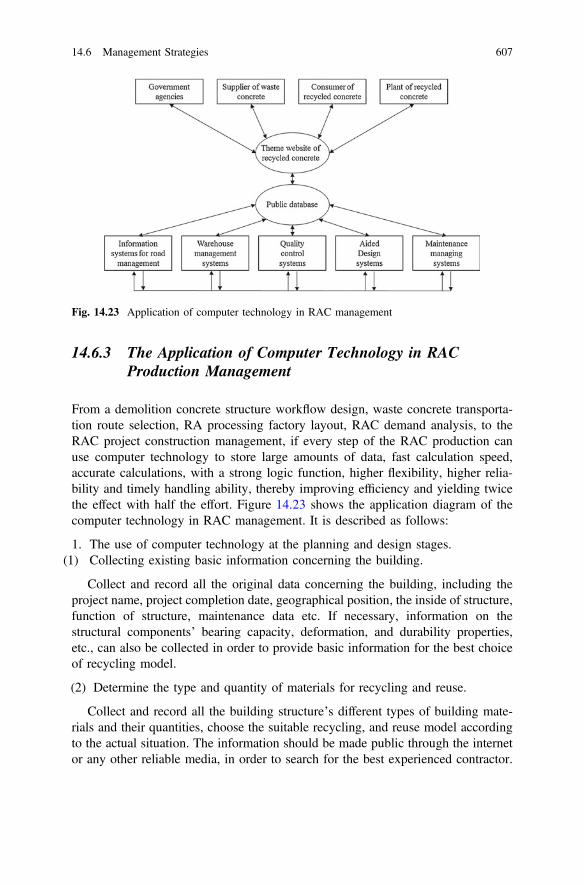
14.6.3 The Application of Computer Technology in RACProduction Management
From a demolition concrete structure workflow design, waste concrete transporta-tion route selection, RA processing factory layout, RAC demand analysis, to theRAC project construction management, if every step of the RAC production canuse computer technology to store large amounts of data, fast calculation speed,accurate calculations, with a strong logic function, higher flexibility, higher relia-bility and timely handling ability, thereby improving efficiency and yielding twicethe effect with half the effort. Figure 14.23 shows the application diagram of thecomputer technology in RAC management. It is described as follows:
1. The use of computer technology at the planning and design stages.(1) Collecting existing basic information concerning the building.
Collect and record all the original data concerning the building, including theproject name, project completion date, geographical position, the inside of structure,function of structure, maintenance data etc. If necessary, information on thestructural components’ bearing capacity, deformation, and durability properties,etc., can also be collected in order to provide basic information for the best choiceof recycling model.
(2) Determine the type and quantity of materials for recycling and reuse.
Collect and record all the building structure’s different types of building mate-rials and their quantities, choose the suitable recycling, and reuse model accordingto the actual situation. The information should be made public through the internetor any other reliable media, in order to search for the best experienced contractor.
Fig. 14.23 Application of computer technology in RAC management
14.6 Management Strategies 607
2. The use of the computer technology in the process of classification of wasteconcrete recycling and reuse.
Determine the waste concrete recycling model according to the actual situationof the building being demolished and carry out onsite classification. All thematerials’ quality and quantity must be precisely recorded. If possible, RA pro-cessing must be done onsite.
3. The use of the computer technology in the transportation and storage of wasteconcrete.
(1) The selection of the processing and transportation route.
Choose the suitable RA processing plant according to the quality and quantity ofthe building structure’s materials to be recycled and reused, integrated with the useof the traffic information management system to choose the best route fortransportation.
(2) Storage management.
Create a computer ledger for storing waste concrete materials, semi-finishedproducts, finished products, and components. It should be convenient to use forsearching and statistical analysis, and it should be adjustable according to thecompany’s needs.
4. The use of the computer technology in the quality control management.
(1) The product quality management.
All the product’s various performance indicators must be recorded using thecomputer management system for the RAC processing technique and workflow.Regular sampling must give detailed quality control reports.
(2) The release of product information.
The responsible company or organizer must create a RAC website to publishinformation related to the processing techniques and research results regularly;searching for waste concrete materials to supply; publishing the quality of theprocessed materials’ information; search for potential consumers; and speciallyprocessing the products according the client’s requirements.
5. The use of the computer technology in the building construction stage.(1) Expert system of aided design and construction.
Compile an expert system’s manual according to the research results andbuilding experience, in order to aid the design of the RAC structure. The key areasin construction must be monitored, to help improve the construction process.
608 14 Products and Constructions with Recycled Aggregate Concrete
(2) The dynamic control of the building process.
The dynamic control of the building process must be realized during theimplementation of the building project process. Different building inspectors shouldprovide different reports and statements according to different requirements.
(3) Quality evaluation of the RAC structure.
The quality of the RAC including ordinary concrete material structure as wellcan be done according to the overall or partial evaluation results of the relatedquality inspection evaluation standards, which will finally offer a foundation for thequality reliability of the project.
6. The use of computer technology in the usage stage.
(1) Create a file for the RAC structure.
Create a file for the RAC structure with basic information data in order for alonger control of the structural performance, at the same time it will provide data forscientific research.
(2) Maintenance management.
Choose a suitable maintenance period and an effective maintenance methodaccording the RAC structural characteristics. Optimize the maintenance resourcesallocation in order to aid maintenance strategies.
14.7 Concluding Remarks
This chapter mainly introduced the author’s application of RAC and RA, as well asan illustration of already completed demonstration projects. These included recy-cled concrete hollow bricks’ application, RAC application on road base layer androad surface layer, and its application in foundation projects. Since the use of RACin structures is very limited, this chapter did not treat this part as a separate topic onits own, and this roughly shows that RAC’s application in structures needs furtherresearch. At the same time, this chapter illustrated the advantages and disadvantagesof RAC in order to lay out its future advancement trend, and promoting its widerapplication in both civil and structural projects.
This chapter positively investigated the RAC benefit analysis and managementstrategies, and the use of computer technology in the production process of RAC.This formed a complete industry chain in promoting the application of RAC andrealized the cyclic usage of RAC, and hence, has a very significant meaning. Sincethere is a limit in practical and experience, the above suggestions and methods needto be continuously improved in practical work.
14.6 Management Strategies 609
References
1. Poon CS, Shui ZH, Lam L, Fok H, Kou SC. Influence of moisture states of natural and recycledaggregates on the slump and compressive strength of concrete. Cem Concr Res. 2004;34(1):31–6.
2. Taha R, Al-Harthy A, Al-Shamsi K, Al-Zubeidi M. Cement stabilization of reclaimed asphaltpavement aggregate for road bases and subbases. J Mater Civ Eng. 2002;14(3):239–45.
3. Disfani MM, Arulrajah A, Haghighi H, Mohammadinia A, Horpibulsuk S. Flexural beamfatigue strength evaluation of crushed brick as a supplementary material in cement stabilizedrecycled concrete aggregates. Constr Build Mater. 2014;15(68):667–76.
4. Poon CS, Kou SC, Lam L. Use of recycled aggregates in molded concrete bricks and blocks.Constr Build Mater. 2002;16(5):281–9.
5. Poon CS, Lam CS. The effect of aggregate-to-cement ratio and types of aggregates on theproperties of pre-cast concrete blocks. Cement Concr Compos. 2008;30(4):283–9.
6. JG/T 169-2005. Light weight plates for partition walls used in buildings. Beijing: StandardsPress of China; 2005.
7. JTG E60-2008. Field test methods of subgrade and pavement for highway engineering.Beijing: China Communications Press; 2008.
610 14 Products and Constructions with Recycled Aggregate Concrete
Chapter 15Guidelines for Recycled AggregateConcrete Materials and Structures
Abstract At present, many countries and regions worldwide have already for-mulated recycled concrete technology standards and guidelines. This chapter isbased on the research results from the aforementioned chapters and the recycledconcrete practical work. In brief, the recycled concrete applied technology guide-lines will help in the application of recycled aggregate concrete material andstructures.
15.1 Waste Concrete
Waste concrete can be divided into two main categories, recyclable waste concreteand non-recyclable waste concrete. Furthermore, waste concrete can be subdividedinto different categories depending on its origin, such as initial usage, initial usageenvironment, exposed conditions, carbonation, etc.
Inimical impurities contained in waste concrete do not affect the recycling ofwaste concrete, but waste concrete in the following states must not be recycled [1]:
(1) The waste concrete coming from lightweight aggregate concrete; or aeratedconcrete;
(2) The waste concrete coming from special function concrete structures (coast/portengineering, nuclear power station, hospital radiology waste concrete, etc.);
(3) The waste concrete that has been corroded by the sulfate;(4) The waste concrete which already has been polluted by heavy metal;(5) The waste concrete with existence of alkali—aggregate reaction;(6) The waste concrete which may contain some impurities such as sawdust, sludge
and asphalt which sometimes are so massive and not easy to separate;(7) The waste concrete which has been seriously corroded by chlorine salt;(8) The waste concrete which has already been polluted by organic matter
© Springer-Verlag GmbH Germany 2018J. Xiao, Recycled Aggregate Concrete Structures,Springer Tracts in Civil Engineering, https://doi.org/10.1007/978-3-662-53987-3_15
611

During demolition and processing of concrete waste, the selection and catego-rizing should be according to the service environment and original designedstrength grade of waste concrete.
15.2 Crush and Sieving
15.2.1 Processing and Grading of Recycled Aggregates
Figure 15.1 illustrates the production and processing of recycled aggregates. Therecycled aggregates are classified into recycled coarse aggregates and recycled fineaggregates. Normally recycled aggregate particle sizes between 4.75 and 31.5 mmare referred to as recycled coarse aggregates, and recycled aggregate particle sizessmaller than 4.75 mm are referred to as recycled fine aggregates.
crusher( jaw crusher)
0~40mmrecycled macadam
storage yard
0~0.08mmrecycledpowder
0~31.5mm
0.08~4.75mmrecycled fine
aggregate
4.75~31.5mmrecycled coarse
aggregate
The waste concretestorage yard
waste concrete putinto the hopper
reciprocating feedersorting
magneticseparator
ironfilings
iron
sievingmachine
crusher( impacting crasher )
magneticseparator
NO
YES
The first vibrating screen
The second vibrating screen
finepowdercollector
The third vibrating screen
washing equipment
Circular cleaning sievediameter 40mm
the aggregate through thiswill all be used asroadbed material
Fig. 15.1 Production and processing of recycled aggregates
612 15 Guidelines for Recycled Aggregate Concrete Materials and Structures
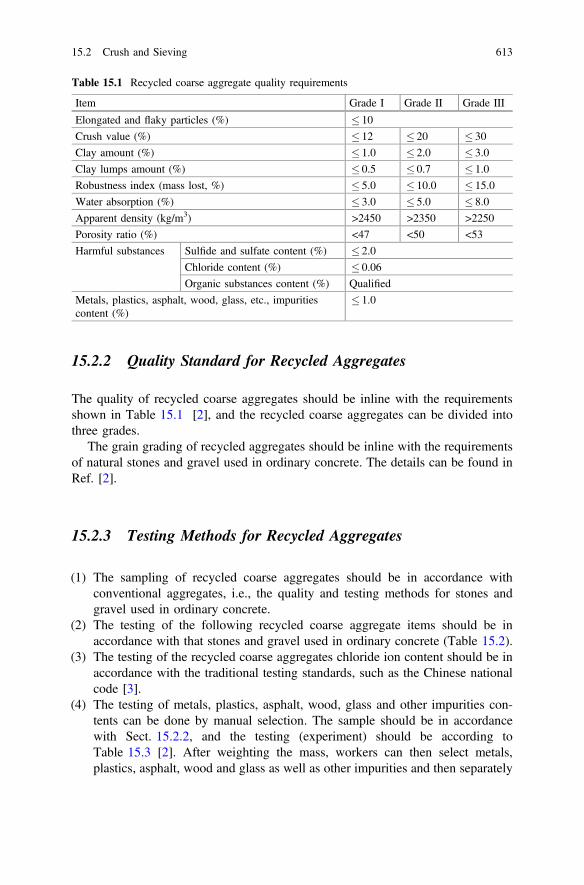
15.2.2 Quality Standard for Recycled Aggregates
The quality of recycled coarse aggregates should be inline with the requirementsshown in Table 15.1 [2], and the recycled coarse aggregates can be divided intothree grades.
The grain grading of recycled aggregates should be inline with the requirementsof natural stones and gravel used in ordinary concrete. The details can be found inRef. [2].
15.2.3 Testing Methods for Recycled Aggregates
(1) The sampling of recycled coarse aggregates should be in accordance withconventional aggregates, i.e., the quality and testing methods for stones andgravel used in ordinary concrete.
(2) The testing of the following recycled coarse aggregate items should be inaccordance with that stones and gravel used in ordinary concrete (Table 15.2).
(3) The testing of the recycled coarse aggregates chloride ion content should be inaccordance with the traditional testing standards, such as the Chinese nationalcode [3].
(4) The testing of metals, plastics, asphalt, wood, glass and other impurities con-tents can be done by manual selection. The sample should be in accordancewith Sect. 15.2.2, and the testing (experiment) should be according toTable 15.3 [2]. After weighting the mass, workers can then select metals,plastics, asphalt, wood and glass as well as other impurities and then separately
Table 15.1 Recycled coarse aggregate quality requirements
Item Grade I Grade II Grade III
Elongated and flaky particles (%) � 10
Crush value (%) � 12 � 20 � 30
Clay amount (%) � 1.0 � 2.0 � 3.0
Clay lumps amount (%) � 0.5 � 0.7 � 1.0
Robustness index (mass lost, %) � 5.0 � 10.0 � 15.0
Water absorption (%) � 3.0 � 5.0 � 8.0
Apparent density (kg/m3) >2450 >2350 >2250
Porosity ratio (%) <47 <50 <53
Harmful substances Sulfide and sulfate content (%) � 2.0
Chloride content (%) � 0.06
Organic substances content (%) Qualified
Metals, plastics, asphalt, wood, glass, etc., impuritiescontent (%)
� 1.0
15.2 Crush and Sieving 613
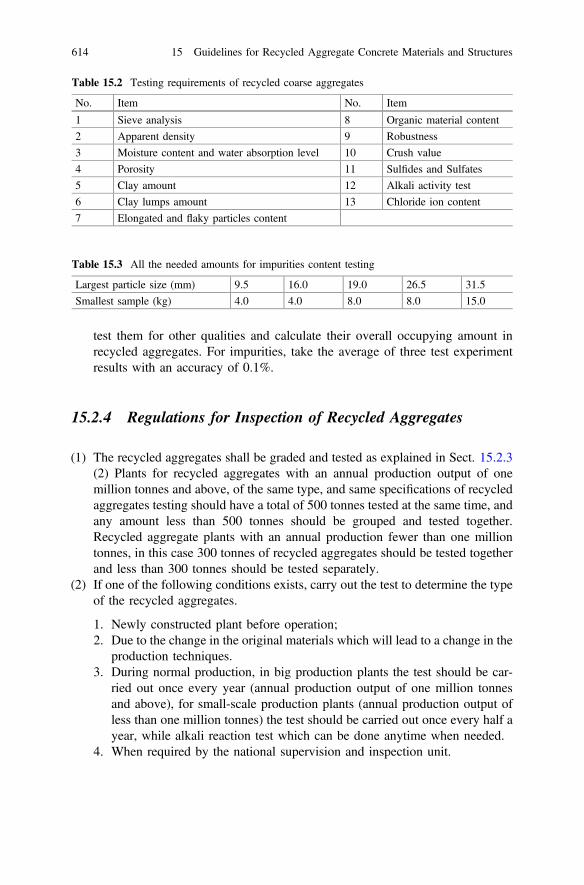
test them for other qualities and calculate their overall occupying amount inrecycled aggregates. For impurities, take the average of three test experimentresults with an accuracy of 0.1%.
15.2.4 Regulations for Inspection of Recycled Aggregates
(1) The recycled aggregates shall be graded and tested as explained in Sect. 15.2.3(2) Plants for recycled aggregates with an annual production output of onemillion tonnes and above, of the same type, and same specifications of recycledaggregates testing should have a total of 500 tonnes tested at the same time, andany amount less than 500 tonnes should be grouped and tested together.Recycled aggregate plants with an annual production fewer than one milliontonnes, in this case 300 tonnes of recycled aggregates should be tested togetherand less than 300 tonnes should be tested separately.
(2) If one of the following conditions exists, carry out the test to determine the typeof the recycled aggregates.
1. Newly constructed plant before operation;2. Due to the change in the original materials which will lead to a change in the
production techniques.3. During normal production, in big production plants the test should be car-
ried out once every year (annual production output of one million tonnesand above), for small-scale production plants (annual production output ofless than one million tonnes) the test should be carried out once every half ayear, while alkali reaction test which can be done anytime when needed.
4. When required by the national supervision and inspection unit.
Table 15.3 All the needed amounts for impurities content testing
Largest particle size (mm) 9.5 16.0 19.0 26.5 31.5
Smallest sample (kg) 4.0 4.0 8.0 8.0 15.0
Table 15.2 Testing requirements of recycled coarse aggregates
No. Item No. Item
1 Sieve analysis 8 Organic material content
2 Apparent density 9 Robustness
3 Moisture content and water absorption level 10 Crush value
4 Porosity 11 Sulfides and Sulfates
5 Clay amount 12 Alkali activity test
6 Clay lumps amount 13 Chloride ion content
7 Elongated and flaky particles content
614 15 Guidelines for Recycled Aggregate Concrete Materials and Structures

(3) For each recycled aggregates test, the following items should be tested:
1. Particle size,2. Surface apparent density,3. Water absorption,4. Brick content,5. Clay amount,6. Elongated and flaky content,7. Clay lumps amount,8. Crush value.
(4) The production plant should make sure that the produced recycled coarseaggregates maintain a certain technical level and issue a standard certification.The certified contents should include:
1. The type of the recycled aggregates, specifications, grade, code, etc.2. The name of the plant producing the recycled aggregates.3. Production code and date.4. Quantity of aggregate.5. Test results.6. Inspecting unit and person in charge.
15.2.5 Production and Management of Recycled CoarseAggregates
(1) The recycled aggregates are produced and processed by specialized machinery,the first crushing process uses jaw crushers, and the second process uses impactcrushers. The steel in waste concrete is separated by a magnet. If waste concretehas high contents of wood, clay, and clay lumps, a process which involveswashing the recycled aggregates with water should be used to clean them.
(2) The packing and transportation of recycled aggregates should comply with thefollowing:
1. The different classifications and different size particles of recycled coarseaggregates should be packed and transported separately.
2. The recycled aggregates must not be mixed with natural aggregates.3. The packing and transportation of recycled aggregates should prevent the
mixing of clay or other materials which will influence its properties.4. The department responsible for the production of recycled aggregates
should keep data concerning the sources and any other original informationof concrete waste properly. This should mainly include the former service orpurpose of the demolished structure, age of service and original concretestrength grade.
15.2 Crush and Sieving 615

15.2.6 Application of Recycled Fine Aggregates
(1) The recycled fine aggregates can be used to fully replace natural fine aggregatesor replace natural aggregates only in part to produce recycled concrete hollowbricks and non-load-bearing heat preservation blocks or panels.
(2) Recycled fine aggregates can be mixed with other materials to be used in theconstruction of concrete foundations, road sub-grades, and base layers, and canalso be used in municipal pipeline filling materials.
(3) Through the proper processing of recycled fine aggregates, they can also beused for backfilling, revetment, and improving the cohesion of the soil. It canalso be constructed as the base of a sports field.
15.3 Mix Proportion
15.3.1 Methods for the Design of the Mix Proportion
Use Chap. 4 as a reference to the design of the mix proportion of the recycledaggregate concrete.
15.3.2 Preparation and Transportation
(1) The original raw materials should be stored according to the followingregulations:
1. All the different types of raw materials should be stored separately.2. The cement should be stored according to the production company, type,
and strength grade, and at the same time, it should be protected from gettingwet and getting adulterated.
3. The aggregates with different types and sizes should be stored separately, toavoid intermixing. The ground of storage should avoid water accumulation.
4. Mineral admixtures should be stored according to their different types andthey must strictly not be stored with cement or other materials.
5. Additives should be stored according to the producing company, and thereshould be strict measurements in order to prevent any influence to theirproperties.
616 15 Guidelines for Recycled Aggregate Concrete Materials and Structures

(2) The mixing, selection, and weighing machinery used in the production ofrecycled aggregate concrete should be in accordance with the following:
1. Mixing machinery should be in accordance with standard regulations offixed machinery “Concrete mixing machinery” [4].
2. Selection and weighing of the recycled aggregates shall be according to thelawful inspection committee, and these shall be inspected before beingallowed for use.
3. The machinery should be able to continuously select and weigh materialsfor different mix proportions of recycled concrete. Actual data for volumesprocessed and stored should be kept properly.
(3) The concrete mixer truck of recycled concrete shall satisfy the following:
1. During transportation of recycled concrete, the truck should maintain aproper mixing speed, and segregation should be prevented at all times.
2. The recycled concrete transporting truck should be in accordance with thestandards “Concrete Mixing and Transporting Vehicles” [5]. Dump trucksare limited to the delivery of concrete with slump less than 80 mm, andthere must be no leakage; the inside should be smooth, and it should alsohave a lid cover.
(4) Measuring of all different types of raw materials for recycled concrete should bein accordance with the following:
1. All different original materials should be measured according to theirweight. Water and admixtures shall be measured according to the volume.
2. The deviation (error) allowed when measuring the raw materials should bein accordance with Table 15.4.
(5) The production of recycled concrete should be in accordance with thefollowing:
1: The mixing for recycled concrete mixing machinery should be in accor-dance with Sect. 15.3.2 (2) and should strictly used according to theequipment manual.
Table 15.4 Deviation (error) of concrete raw materials (%)
No. Type of rawmaterial
Cement Aggregates Water Admixtures Additives
1 Allowed deviationfor each batch
±2 ±3 ±2 ±2 ±2
2 Allowed totaldeviation
±1 ±2 ±1 ±1 ±1
Note Allowed total deviation, refers to the deviation of all raw materials in a concrete mixing truck.This index is only suitable for computer-controlled mixing machines
15.3 Mix-Proportion 617

2: The minimum duration for the mixing of recycled concrete should be inaccordance with the following regulations:
① While the recycled concrete is transported by a concrete mixing truck,the minimum duration for the mixing should be according to themixing equipment’s manual prescription. The mixing duration for eachbatch (from putting all the raw materials into the mixing) should not beless than 2 min.
② While transported by a dump truck, the mixing time may not be lessthan 3 min.
3: Testing the percentage of moisture, water absorption and bulk density ofrecycled concrete should be based on the following principles:
① Testing should be done before the production of the concrete.② Radom inspection during the quantity production of recycled concrete.③ When there is a clear change in the water content of recycled aggre-
gates or any abnormal slump flow.④ For pre-wetted recycled aggregates, the water absorption rate may not
be checked, but the wet bulk density should be tested.
4: Before mixing concrete, the amount of water in sand and coarse aggregatesshould be investigated, and the results could help to adjust the actualamount of raw materials to be used.
(6) The type of additives should be determined by laboratory experiment, and theyshould be firstly mixed with water and can also be put together in the mixturewith water. The mixing duration (from the time when all raw materials are puttogether) should not be less than 2 min.
(7) Transportation of recycled concrete should meet the following requirements:
1. Recycled concrete transporting should be in accordance with regulationSect. 15.3.2 (3) mentioned above;
2. The concrete truck should be free of water before starting to load therecycled concrete;
3. There should not be any addition of water to concrete in the concrete truck;4. Recycled concrete transporting duration refers to the time when recycled
concrete is poured into the concrete truck from the concrete mixing machineup to the time when the concrete truck begins to off-load the recycledconcrete. When the recycled concrete is transported by a concrete truck,maintain the time of off-loading within one hour; when using a dump truck,maintain the transportation time within 30 min.
5. During the mixing and transportation, measures should be taken to preventloss of the slump flow and segregation. In case that the loss of the slumpflow and segregation is very serious, do not add more water when secondarymixing is used before pour concrete.
618 15 Guidelines for Recycled Aggregate Concrete Materials and Structures

6. When the recycled concrete is mixed on a concrete truck, and the slumpflow is decreased obviously due to the long distance transportation or due toany traffic jam, suitable amount of additives can be added beforeoff-loading, in order to satisfy the construction and concrete workability.The additives to be added must be determined by a pre-test.
15.4 Materials
15.4.1 General Regulations
(1) The replacement percentage of recycled coarse aggregates in recycled concretecan be controlled to less than 50%.
(2) The recycled concrete strength should be evaluated according to the cubecompressive strength.
(3) The size effect factor of the recycled concrete cube compressive strength maybe referred to ordinary concrete.
(4) The recycled concrete strength grades are: RC15, RC20, RC25, RC30, RC35,RC40. The reasonable range of the recycled concrete strength grades is shownin Table 15.5.
Table 15.5 Recycled concrete strength grade
Type of classification Reasonable range of recycledconcrete strength grade
Usage
Recycled concreteused in bricks
RC15RC20RC25RC30RC35RC40
Mainly used in monsarystructures and infill walls
Recycled concreteused in pavement
RC30RC35RC40
Mainly used in roadconstruction
Recycled concreteused in structures
RC15RC20RC25RC30RC35RC40
Mainly used in load-bearingstructures
15.3 Mix-Proportion 619
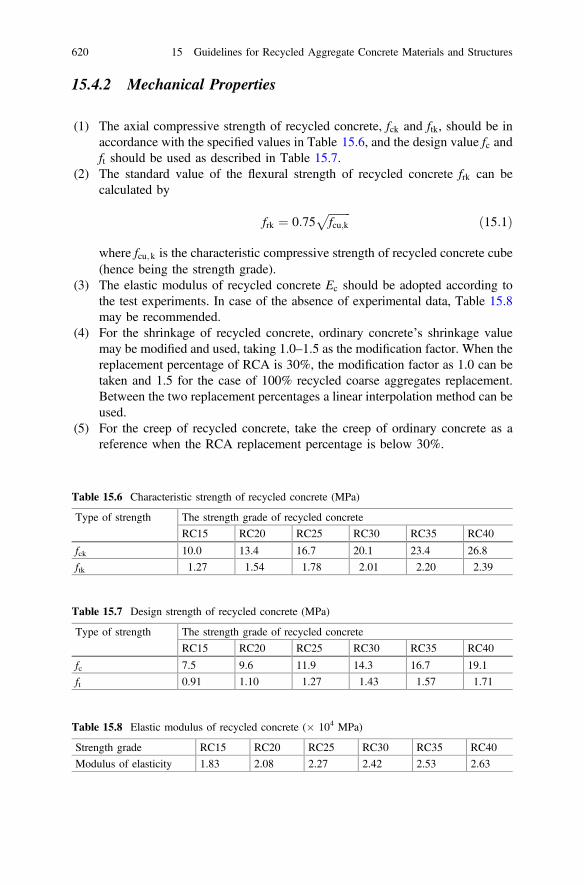
15.4.2 Mechanical Properties
(1) The axial compressive strength of recycled concrete, fck and ftk, should be inaccordance with the specified values in Table 15.6, and the design value fc andft should be used as described in Table 15.7.
(2) The standard value of the flexural strength of recycled concrete frk can becalculated by
frk ¼ 0:75ffiffiffiffiffiffiffiffifcu;k
p ð15:1Þ
where fcu;k is the characteristic compressive strength of recycled concrete cube(hence being the strength grade).
(3) The elastic modulus of recycled concrete Ec should be adopted according tothe test experiments. In case of the absence of experimental data, Table 15.8may be recommended.
(4) For the shrinkage of recycled concrete, ordinary concrete’s shrinkage valuemay be modified and used, taking 1.0–1.5 as the modification factor. When thereplacement percentage of RCA is 30%, the modification factor as 1.0 can betaken and 1.5 for the case of 100% recycled coarse aggregates replacement.Between the two replacement percentages a linear interpolation method can beused.
(5) For the creep of recycled concrete, take the creep of ordinary concrete as areference when the RCA replacement percentage is below 30%.
Table 15.6 Characteristic strength of recycled concrete (MPa)
Type of strength The strength grade of recycled concrete
RC15 RC20 RC25 RC30 RC35 RC40
fck 10.0 13.4 16.7 20.1 23.4 26.8
ftk 1.27 1.54 1.78 2.01 2.20 2.39
Table 15.7 Design strength of recycled concrete (MPa)
Type of strength The strength grade of recycled concrete
RC15 RC20 RC25 RC30 RC35 RC40
fc 7.5 9.6 11.9 14.3 16.7 19.1
ft 0.91 1.10 1.27 1.43 1.57 1.71
Table 15.8 Elastic modulus of recycled concrete (� 104 MPa)
Strength grade RC15 RC20 RC25 RC30 RC35 RC40
Modulus of elasticity 1.83 2.08 2.27 2.42 2.53 2.63
620 15 Guidelines for Recycled Aggregate Concrete Materials and Structures
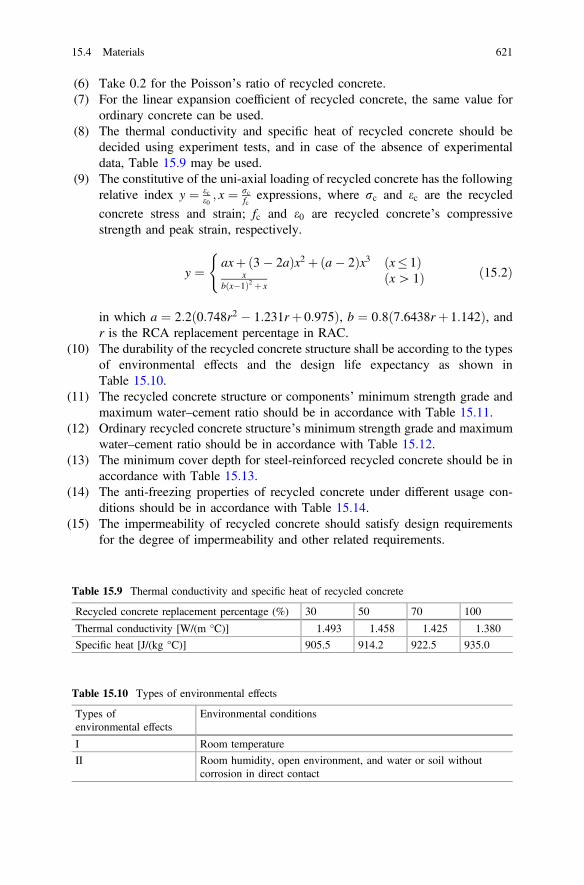
(6) Take 0.2 for the Poisson’s ratio of recycled concrete.(7) For the linear expansion coefficient of recycled concrete, the same value for
ordinary concrete can be used.(8) The thermal conductivity and specific heat of recycled concrete should be
decided using experiment tests, and in case of the absence of experimentaldata, Table 15.9 may be used.
(9) The constitutive of the uni-axial loading of recycled concrete has the followingrelative index y ¼ ec
e0; x ¼ rc
fcexpressions, where rc and ec are the recycled
concrete stress and strain; fc and e0 are recycled concrete’s compressivestrength and peak strain, respectively.
y ¼ axþð3� 2aÞx2 þða� 2Þx3 ðx� 1Þx
bðx�1Þ2 þ xðx[ 1Þ
(ð15:2Þ
in which a ¼ 2:2ð0:748r2 � 1:231rþ 0:975Þ, b ¼ 0:8ð7:6438rþ 1:142Þ, andr is the RCA replacement percentage in RAC.
(10) The durability of the recycled concrete structure shall be according to the typesof environmental effects and the design life expectancy as shown inTable 15.10.
(11) The recycled concrete structure or components’ minimum strength grade andmaximum water–cement ratio should be in accordance with Table 15.11.
(12) Ordinary recycled concrete structure’s minimum strength grade and maximumwater–cement ratio should be in accordance with Table 15.12.
(13) The minimum cover depth for steel-reinforced recycled concrete should be inaccordance with Table 15.13.
(14) The anti-freezing properties of recycled concrete under different usage con-ditions should be in accordance with Table 15.14.
(15) The impermeability of recycled concrete should satisfy design requirementsfor the degree of impermeability and other related requirements.
Table 15.9 Thermal conductivity and specific heat of recycled concrete
Recycled concrete replacement percentage (%) 30 50 70 100
Thermal conductivity [W/(m °C)] 1.493 1.458 1.425 1.380
Specific heat [J/(kg °C)] 905.5 914.2 922.5 935.0
Table 15.10 Types of environmental effects
Types ofenvironmental effects
Environmental conditions
I Room temperature
II Room humidity, open environment, and water or soil withoutcorrosion in direct contact
15.4 Materials 621

Table 15.11 Minimum strength grade and the maximum water–cement ratio of reinforcedrecycled concrete structure/components
Types ofenvironmentaleffects
Design life expectancy
50 years 30 years
Minimumstrengthgrade
Maximumwater–cementratio
Minimumstrengthgrade
Maximumwater–cementratio
1 RC25 0.60 RC25 0.60
2 RC30 0.55 RC25 0.55
Table 15.12 Minimum strength grade and maximum water–cement ratio of ordinary recycledconcrete structure/components
Design life expectancy 50 years 30 years
Minimum strength grade RC25 RC20
Maximum water–cement ratio 0.60 0.60
Table 15.13 Minimum cover depth of steel-reinforced recycled concrete
Design life expectancy
Types ofenvironmentaleffects
50 years 30 years
Strengthgrade
Maximumwater–cementratio
Minimumcoverdepth(mm)
Strengthgrade
Maximumwater–cementratio
Minimumcoverdepth(mm)
Plates, walls,etc. Plate-likecomponents
�RC25 0.60 15 �RC25 0.60 15
�RC30 0.55 25 �RC25 0.55 25
Beam, column,etc. Slendercomponents
RC25�RC30
0.600.55
3025
�RC25 0.60 25
RC30RC40
0.550.50
4035
RC30�RC35
0.600.50
3530
Table 15.14 Anti-freezing properties in different usage conditions
Usage condition Anti-freezing code
1. Areas with heating system2. Areas without heating systemRelative temperature � 50%Relative humidity >50%Alternating wet and dry parts, and change of water level part
F15
F25
F35
� F50
Note Area without heating system is defined as that the average temperature of the coldest month ishigher than -5 °C. For area with heating system, the average temperature of the coldest month islower than or equal to -5 °C
622 15 Guidelines for Recycled Aggregate Concrete Materials and Structures

15.4.3 Suggestions on the Design of Recycled ConcreteBlocks
15.4.3.1 Basic Requirements for Recycled Concrete Blocks
(1) The grades and classification of recycled concrete hollow bricks.
1. Classification
① According to the number of holes: There are three types includingsingle hole, double holes, and three holes.
② According to the dimensions: There are two types including 190 mmseries and 240 mm series.
2. Grade
① According to the strength, the recycled concrete hollow bricks aregrouped into five categories, MU5.0, MU7.5, MU10, MU15, andMU20.
② According to the dimensions by deviation and outer surface appearance,they are grouped into three groups, high-grade product, standard pro-duct and regular product.
(2) Dimensions and specifications
1. Dimension SizesThe recycled concrete hollow brick mainly has two sizes, which are390 � 190 � 190 mm and 390 � 240 � 190 mm.
2. Allowed dimension deviation and appearance qualityThe allowed dimension deviation and appearance quality should be inaccordance with the requirements shown in Table 15.15.
(3) The product investigation should be according to the following;
1. The investigation of the product be leaving the plant includes: size differ-ence, surface density, compressive strength, water absorption, and relativemoisture.
2. When the following conditions are encountered, the investigation must becarried out:
① If there is any change in the recycled aggregates’ quality.② Every after the 3 months during the regular production.③ If there is any change in the brick production technique.④ At the beginning of production when there had been no production
going on for three or more months.⑤ When required by the National Inspection and Investigation Body.
15.4 Materials 623
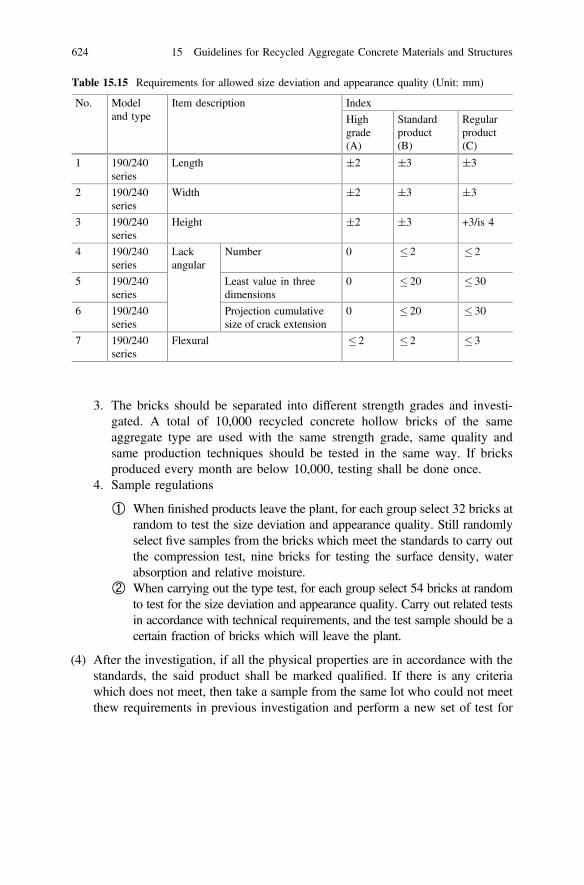
3. The bricks should be separated into different strength grades and investi-gated. A total of 10,000 recycled concrete hollow bricks of the sameaggregate type are used with the same strength grade, same quality andsame production techniques should be tested in the same way. If bricksproduced every month are below 10,000, testing shall be done once.
4. Sample regulations
① When finished products leave the plant, for each group select 32 bricks atrandom to test the size deviation and appearance quality. Still randomlyselect five samples from the bricks which meet the standards to carry outthe compression test, nine bricks for testing the surface density, waterabsorption and relative moisture.
② When carrying out the type test, for each group select 54 bricks at randomto test for the size deviation and appearance quality. Carry out related testsin accordance with technical requirements, and the test sample should be acertain fraction of bricks which will leave the plant.
(4) After the investigation, if all the physical properties are in accordance with thestandards, the said product shall be marked qualified. If there is any criteriawhich does not meet, then take a sample from the same lot who could not meetthew requirements in previous investigation and perform a new set of test for
Table 15.15 Requirements for allowed size deviation and appearance quality (Unit: mm)
No. Modeland type
Item description Index
Highgrade(A)
Standardproduct(B)
Regularproduct(C)
1 190/240series
Length ±2 ±3 ±3
2 190/240series
Width ±2 ±3 ±3
3 190/240series
Height ±2 ±3 +3/is 4
4 190/240series
Lackangular
Number 0 � 2 � 2
5 190/240series
Least value in threedimensions
0 � 20 � 30
6 190/240series
Projection cumulativesize of crack extension
0 � 20 � 30
7 190/240series
Flexural � 2 � 2 � 3
624 15 Guidelines for Recycled Aggregate Concrete Materials and Structures

the chosen sample. After the second test and if the criteria was satisfied, theproduct can be marked as qualified. In case the results still show that therequirement was not met, the said product should be marked as Unqualified.
(5) Qualified product, storage, and transportation.
1. When the bricks are leaving the plant, the plant should provide a qualityauthorization certificate.
2. The compressive strength of the products leaving the plant should not beless than 75% of the strength at 28d, and the 28-day strength should meetthe targeted value.
3. The bricks should be stored in groups according to their strength grades andmust not be mixed.
4. Transportation, loading and unloading should be done with care, thereshould not a sudden impact to the bricks causing damage.
15.4.3.2 Basic Assumptions for the Design of Recycled ConcreteBlocks
(1) The strength of the recycled concrete hollow bricks should be according torecycled concrete bricks and mortar strength grades and national code [6] maybe used for reference.
(2) When recycled concrete hollow bricks are used in load bearing, their strengthshould not be less than MU7.5, whereas for non-load bearing the strength ofrecycled concrete hollow bricks should not be less than MU5.0.
(3) When the used mortar in brick structure is not less than M5.0, the mortarstrength can be taken as 0 to determine the brick strength during constructionbefore the new bricks hardened.
(4) For the recycled concrete blocks in the basement walls and outdoor bulk watersurface, a moisture-proof layer should be laid down and a moisture-proof layerof waterproof mortar should be adopted.
(5) The recycled concrete block used in the underground or moisture-proof layermay use actual irrigation of the holes with strength grade not less than RC20.
(6) If necessary, calculations for the bearing capacity, stiffness and partial pressureshould be according to Chinese code [6].
(7) If there is earthquake-proof, column layout and construction of ring beamshould be in line with “Code for Seismic Design of Buildings” (GB50011) [7]and the seismic tests should be carried out according to the determined needs.
15.4 Materials 625

15.5 Infrastructure
15.5.1 Design Suggestions for Recycled Concrete Pavements
15.5.1.1 Basic Regulations for Pavement Design
(1) For the design safety level and corresponding design service life of recycledconcrete roads, the objective reliability index and goal reliability, as well as thestandard grade deviation of the safety level of road materials and structuraldimensions’ constants, should be in accordance with “Specifications for Designof Highway Cement Concrete Pavement” (JTG D40) [8] as reference.
(2) The recycled concrete can be used for second grade or below second gradenational highways, sub-trunk roads, city and settlement roads.
(3) The design of the recycled concrete road surface should be in accordance withJTG D40 [8], but it must be designed according to the actual situation,adjusting it according to the vehicles which will be using it and also consideringthe temperature gradient stress and other factors involved.
15.5.1.2 The Basic Construction Requirements for Pavement Surface
(1) The design of the recycled concrete road base layer, cushion and surface layermust satisfy the requirements of the existing design code JTG D40 [8].
(2) Plain recycled concrete can be used for the surface layer design of a recycledconcrete road, as well as reinforced recycled concrete panels. If possible,reinforced recycled concrete panels could be used as priority.
(3) The recycled concrete road panel dimensions (including length, width, depth)should be determined according to the actual situation, but should not exceeddimensions of the similar components made of ordinary concrete.
(4) In exception of asphalt which will be laid on the top layer, recycled concretepanels should not be used in multilayer road designs.
(5) For reinforcement, expansion joints and related structural design of the recycledconcrete road, the ordinary concrete road design methods could be used asreference.
15.5.1.3 Pavement Construction and Quality Inspection
(1) The national design code “Technical Guidelines for Construction of HighwayCement Concrete Pavements” (JTG/T F30-2014) [9] may be used as referencefor the construction of a recycled concrete road.
626 15 Guidelines for Recycled Aggregate Concrete Materials and Structures
(2) The investigation of recycled concrete road quality should be carried out inaccordance with the national code “Field Test Methods of Subgrade andPavement for Highway Engineering” (JTG E60-2008) [10].
15.5.1.4 Pot-Hole Filling Layer and Basic Layer
(1) Both recycled coarse aggregates and fine aggregates can be used for recycledconcrete road cushion in construction.
(2) Gravels with cement and lime fly ash can be used in the base layer of a recycledconcrete road. Cement stabilized crushed stone and lime fly ash stabilized gravecan be used together with recycled coarse aggregates.
15.5.2 Suggestions on the Design of Recycled ConcreteStructural Components
15.5.2.1 Basic Requirements for Structural Components
(1) Recycled concrete components mainly include recycled slab, beam, columnand shear wall.
(2) Basic assumptions for the design of recycled concrete flexural elements are:
1. The strain on cross section maintains plane section.2. The steel stress should be calculated based on the steel strain and the elastic
modulus, but it should not exceed the design strength value. The tensionsteel’s ultimate tension strain can be taken as 0.01.
3. Do not consider the tension strength of recycled concrete.
(3) The calculations of a recycled concrete structure should be in accordance withnational standards and certain local regulation requirements.
(4) The minimum depth of recycled concrete cover for steel under tension (mea-suring from the outer part of steel) should be in accordance with related reg-ulations and should not be less than the diameter of tension reinforcement. Thecover for reinforcement in slabs should not be less than 10 mm. The stirrups inthe beam and column should have a recycled concrete cover not less than15 mm.
(5) The anchorage length of vertical reinforcement in tension for recycled concretecomponents should use ordinary concrete design as reference. The modifiedfactor is between 0.9 and 1.0, and a lower value should be adopted if therecycled coarse aggregates replacement is higher.
15.5 Infrastructure 627
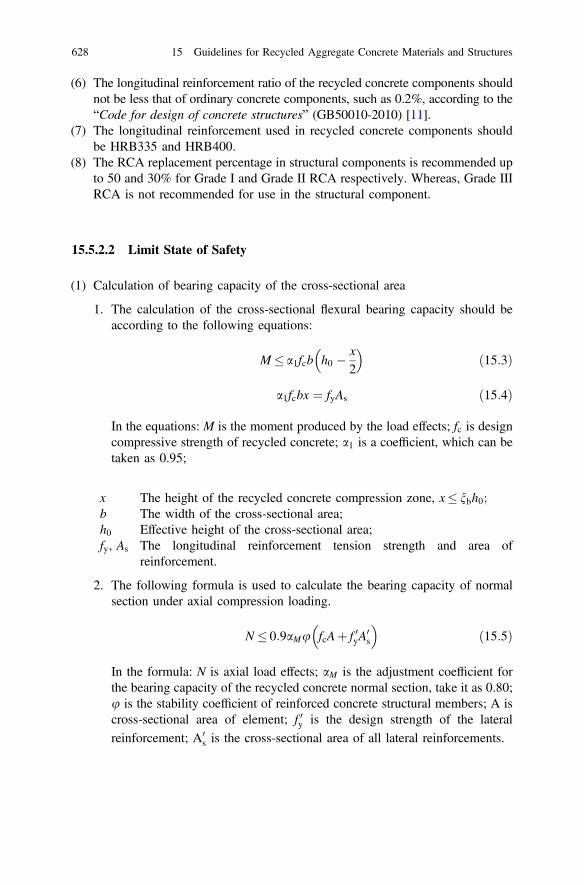
(6) The longitudinal reinforcement ratio of the recycled concrete components shouldnot be less that of ordinary concrete components, such as 0.2%, according to the“Code for design of concrete structures” (GB50010-2010) [11].
(7) The longitudinal reinforcement used in recycled concrete components shouldbe HRB335 and HRB400.
(8) The RCA replacement percentage in structural components is recommended upto 50 and 30% for Grade I and Grade II RCA respectively. Whereas, Grade IIIRCA is not recommended for use in the structural component.
15.5.2.2 Limit State of Safety
(1) Calculation of bearing capacity of the cross-sectional area
1. The calculation of the cross-sectional flexural bearing capacity should beaccording to the following equations:
M� a1fcb h0 � x2
� �ð15:3Þ
a1fcbx ¼ fyAs ð15:4Þ
In the equations: M is the moment produced by the load effects; fc is designcompressive strength of recycled concrete; a1 is a coefficient, which can betaken as 0.95;
x The height of the recycled concrete compression zone, x� nbh0;b The width of the cross-sectional area;h0 Effective height of the cross-sectional area;fy, As The longitudinal reinforcement tension strength and area of
reinforcement.
2. The following formula is used to calculate the bearing capacity of normalsection under axial compression loading.
N� 0:9aMu fcAþ f 0yA0s
� �ð15:5Þ
In the formula: N is axial load effects; aM is the adjustment coefficient forthe bearing capacity of the recycled concrete normal section, take it as 0.80;u is the stability coefficient of reinforced concrete structural members; A iscross-sectional area of element; f 0y is the design strength of the lateralreinforcement; A0
s is the cross-sectional area of all lateral reinforcements.
628 15 Guidelines for Recycled Aggregate Concrete Materials and Structures

(2) The calculation of the shear bearing capacity can be calculated using the fol-lowing formulae:
V � av 0:7ftbh0 þ fyvAsv
sh0
� �ð15:6Þ
V � av1:75kþ 1
ftbh0 þ fyvAsv
sh0
� �ð15:7Þ
In the formula: V is load effects caused by shear force; aV is the adjustmentcoefficient of the recycled concrete shear bearing capacity, take it as 0.85; k isshear span ratio; b is width of cross-sectional area; h0 is effective depth ofcross-sectional area; ft is the design tensile strength value of recycled concretetensile; A sv is configuration of reinforcement of each limb on the samecross-sectional area; A sv ¼ nA sv1; therefore, n is the number of segments withinthe stirrup, and A sv1 is the single limb stirrup cross-sectional area; s is thespacing of stirrups along the direction of the member length; fyv is the designstrength of stirrups.
(3) For calculations of eccentric compression, axial tension, eccentric tension,torsion, overall even compression, impact, etc., they should all be according torelated formulae in the “Code for design of concrete structures” (GB50010)[11].
15.5.2.3 Limit State of Serviceability
(1) Calculating for crack resistance in recycled concrete can be done according torelated formulae in the “Code for design of concrete structures” (GB50010)[11].
(2) Calculating for the crack width should be according to the “Code for design ofconcrete structures” (GB50010) [11], and the recycled concrete strengthspecifications should be in accordance with values in Sect. 15.4.2.
(3) For components under compression, the deflection should be calculated inaccordance with “Code for design of concrete structures” (GB50010) [11], andwhen the replacement percentage of recycled coarse aggregates is above 30%,the deflection amplifying coefficient of 1.2 should be considered.
15.5 Infrastructure 629

15.6 Construction
15.6.1 Casting and Molding
(1) Recycled concrete should not be used in construction during extreme winter.(2) Slope height for pouring concrete should not exceed 2 m. If the slope is greater
than 2 m, a string tube, chute, or a slide tube should be added for support.(3) Recycled aggregate concrete mixing should use molding machine vibrator. The
concrete flow which can satisfy plasticity in concrete strength and innon-load-bearing structures, should use needle vibrator machine.
(4) If dry hard pouring recycled concrete mixture is used to cast components,vibration table or compression molding surface should be used.
(5) When pouring concrete on components with large surface areas, with a depthless than 200 mm, surface vibrator should be used; when the depth is greaterthan 200 mm, firstly, use needle vibrator for compacting and then vibrate thesurface.
(6) When using the needle vibrator, the space for inserting the vibrator should notbe two times greater than the vibrator diameter. In case of continuously pouringconcrete to a number of floors, the vibrator should only be inserted to a depth ofabout 50 mm.
(7) According to the construction needs and material mixture properties, a suitablevibrator and decide on the vibration duration should be properly chosen.
15.6.2 Concrete Curing
(1) After finished pouring recycled concrete, follow standard experiment proce-dures to cure the recycled concrete.
(2) When using natural curing method, the curing duration should not be less than7d, for recycled concrete with retarder the curing time should be extended to14d. When the recycled concrete components are covered with plastics, thesurface should be all strictly covered, in order to maintain the membrane withcondensation water.
(3) When the recycled concrete components use steam for curing, after pouringconcrete into molds, the time before removing the molds should not be less thantwo hours.
630 15 Guidelines for Recycled Aggregate Concrete Materials and Structures

15.6.3 Quality Inspection
(1) First the quality evaluation should be based on use the concrete mix proportion,and its workability should meet the requirements. After production or pouringconcrete, leave out at least three specimens, and this will be used as a basis forinvestigating the mix proportion.
(2) Before mixing concrete, the amount of water content in natural aggregates(sand and stones) should be determined, as well as the water absorption ofrecycled aggregates, and adjust the amount of materials to be used according tothe results, and propose a mix proportion.
(3) Recycled concrete mixtures should be conducted in accordance with the fol-lowing provisions:
1. Investigate whether the mixture materials are inline with the mix proportion,and this test shall not be less than one time.
2. Investigate the slump flow, consistency, and surface density, and this shallnot be less than one time.
(4) The investigation of the recycled concrete strength should be done with thefollowing provisions, which is according to the national standards “Standardfor test and evaluation of concrete compression strength” (GB 50107-2010)[12].
1. For every 100 placements, more than one sample should be obtained fortesting the concrete when the amount in one same mix proportion exceeds100 m3.
2. When the concrete mixture does not exceed 100 placements, the samplingused for testing shall not be less than one time.
3. During a continuous pouring of concrete which exceeds 1000 m3, for thesame mix proportion, the sample should be taken every 200 m3.
4. For every floor with the same mix proportion of concrete, there should beat-least one sample taken for investigation.
5. For each time you obtain a sample, there should be a set of concretespecimens which shall be cured at the same conditions and should beaccording to the actual needs.
(5) When the recycled concrete is investigated according the provisions mentionedabove, the strength does not satisfy the requirements. The non-damaged orpartially damaged methods shall be used, this should be accordance withnational standard regulations for concrete strength in structures. When testingthe compressive strength of recycled concrete using the rebound method, therebound value should firstly be multiplied by a factor of 1.25, then comparewith the corresponding values for ordinary concrete rebound compressivestrength in order to obtain the recycled concrete compressive strength.
15.6 Construction 631

References
1. GB/T 50743-2012 Code for recycling construction and demolition waste. Beijing: ChinaPlanning Press; 2012.
2. GB/T 25177-2010 Recycled coarse aggregate for concrete. Beijing: Standards Press of China;2010.
3. GB/T 14685-2011 Pebble and crushed stone for construction. Beijing: Standards Press ofChina; 2011.
4. GB/T 9142. Concrete mixers. Beijing: Standards Press of China; 2000.5. Stepanian, S. Concrete mixing and transporting vehicle. U.S. Patent No. 1,935,922. 21 Nov
1933.6. GB 50003-2011. Code for design of masonry structures. Beijing: China Architecture &
Building Press; 2011.7. GB 50011-2010. Code for seismic design of buildings. Beijing: China Architecture &
Building Press; 2010.8. JTG D40-2011. Specifications for design of highway cement concrete pavement. Beijing:
China Communications Press; 2011.9. JTG/T F30-2014. Technical guidelines for construction of highway cement concrete
pavements. Beijing: China Communications Press; 2014.10. JTG E60-2008 Field test methods of subgrade and pavement for highway engineering [S].
Beijing: China Communications Press, 2008.11. GB 50010-2010. Code for design of concrete structures. Beijing: China Architecture &
Building Press; 2010.12. GB 50107-2010. Standard for test and evaluation of concrete compressive strength. Beijing:
China Architecture & Building Press; 2010.
632 15 Guidelines for Recycled Aggregate Concrete Materials and Structures
Related Documents