Carbon Footprint East Sussex Pension Fund March 2018 Page 1 Agenda Item 8

Welcome message from author
This document is posted to help you gain knowledge. Please leave a comment to let me know what you think about it! Share it to your friends and learn new things together.
Transcript

Carbon Footprint East Sussex Pension Fund
March 2018
Page 1
Agenda Item 8

East Sussex Carbon Footprint
March 2018
CREDITS
Yohan Hill Research Manager
ABOUT TRUCOST, PART OF S&P DOW JONES INDICES
Trucost is part of S&P Dow Jones Indices. A leader in carbon and environmental data and risk analysis, Trucost
assesses risks relating to climate change, natural resource constraints, and broader environmental, social, and
governance factors. Companies and financial institutions use Trucost intelligence to understand their ESG
exposure to these factors, inform resilience and identify transformative solutions for a more sustainable
global economy. S&P Global’s commitment to environmental analysis and product innovation allows us to
deliver essential ESG investment-related information to the global marketplace. For more information, visit
www.trucost.com.
ABOUT S&P DOW JONES INDICES
S&P Dow Jones Indices is the largest global resource for essential index-based concepts, data and research,
and home to iconic financial market indicators, such as the S&P 500® and the Dow Jones Industrial Average®.
More assets are invested in products based on our indices than products based on indices from any other
provider in the world. Since Charles Dow invented the first index in 1884, S&P DJI has become home to over
1,000,000 indices across the spectrum of asset classes that have helped define the way investors measure and
trade the markets.
S&P Dow Jones Indices is a division of S&P Global (NYSE: SPGI), which provides essential intelligence for
individuals, companies, and governments to make decisions with confidence. For more information, visit
www.spdji.com.
CONTACT
T: +44(0)20 7160 9800
T: +1 800 402 8774
www.trucost.com
Page 2
3
East Sussex Carbon Footprint
February 2018
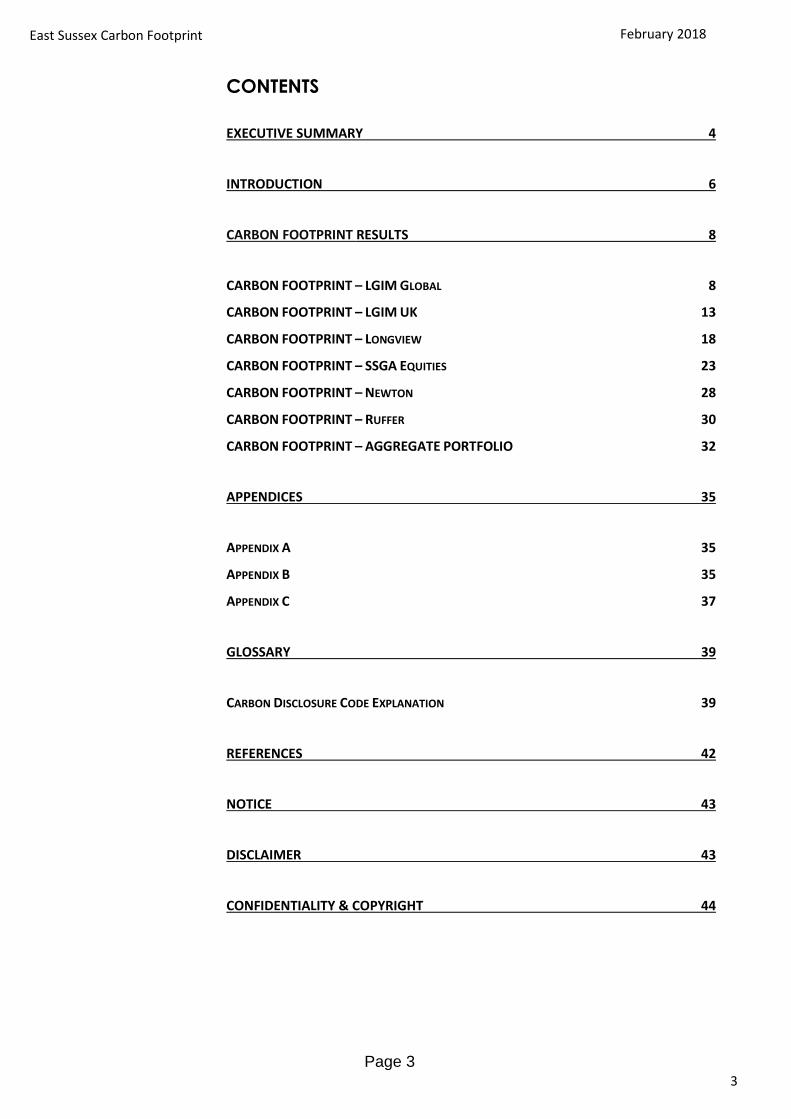
CONTENTS
EXECUTIVE SUMMARY 4
INTRODUCTION 6
CARBON FOOTPRINT RESULTS 8
CARBON FOOTPRINT – LGIM GLOBAL 8
CARBON FOOTPRINT – LGIM UK 13
CARBON FOOTPRINT – LONGVIEW 18
CARBON FOOTPRINT – SSGA EQUITIES 23
CARBON FOOTPRINT – NEWTON 28
CARBON FOOTPRINT – RUFFER 30
CARBON FOOTPRINT – AGGREGATE PORTFOLIO 32
APPENDICES 35
APPENDIX A 35
APPENDIX B 35
APPENDIX C 37
GLOSSARY 39
CARBON DISCLOSURE CODE EXPLANATION 39
REFERENCES 42
NOTICE 43
DISCLAIMER 43
CONFIDENTIALITY & COPYRIGHT 44
Page 3

4
East Sussex Carbon Footprint February 2018
EXECUTIVE SUMMARY
Trucost was commissioned by the East Sussex Pension Fund to conduct a
carbon footprint analysis of six listed equity portfolios, as noted below:
o LGIM Global
o LGIM UK
o Longview Partners Global Equity Strategy
o Newton
o Ruffer
o State Street Global Advisers (SSGA)
Two of these are absolute return portfolios (Newton and Ruffer). The
others are relative return and, as such, Trucost compared their carbon
footprint performance to their respective benchmarks as follows:
Portfolio Benchmark
LGIM Global FTSE World
LGIM UK FTSE All Share
Longview MSCI All Country World Index (ACWI)
SSGA FTSE RAFI All-World 3000
Based on the revenue method of analysis, we obtained the following
results from that comparison:
o LGIM Global is 7.47% more carbon intensive than its benchmark,
FTSE World.
o LGIM UK is 1.12% more carbon intensive than its benchmark,
FTSE All Share.
o Longview is 82.59% less carbon intensive than its benchmark,
MSCI ACWI.
o SSGA is 4.08% less carbon intensive than its benchmark, FTSE
RAFI-All World 3000.
Our assessment of the aggregate portfolio shows that the energy
generation mix for the aggregate holdings has a 16.6% share of energy
coming from renewable power generation, which is less than half of the
2025 IEA World 2-degree scenario amount of 37.1%.
Our analysis shows
that three out of
four of the relative-
return portfolios
analysed
outperform their
respective
benchmarks.
Page 4

5
East Sussex Carbon Footprint February 2018
Coal power generation stands at 29.4% of total power generation, which
is above the 24.7% required by 2025, under the IEA World 2-degree
scenario.
In order to meet the more challenging 2030 IEA World target, the
aggregate portfolio will need reduce the share of coal power generation
to 14.9% of total power generation, and increase the share of renewable
energy generation to 46.4%.
Page 5

6
East Sussex Carbon Footprint February 2018
INTRODUCTION
Trucost provides data and insight to help its clients understand the economic
consequences of natural capital dependency. Our clients include companies and
their advisors, the investment community, governments, academics and thought
leaders.
Trucost was commissioned by the East Sussex Pension Fund to conduct a carbon
footprint analysis of its listed equity portfolios.
Carbon footprints of investment portfolios can be used to identify carbon-related
strengths, weaknesses, opportunities and threats from the shift to a low-carbon
economy. The carbon footprint analysis helps to identify what the key climate
change impacts of an investment portfolio are, and the related risks and
opportunities. More information on carbon footprinting is provided in Appendix
A.
This analysis assesses the carbon risks inherent in the following equity mandates:
o LGIM Global
o LGIM UK
o Longview
o Newton
o Ruffer
o State Street Global Advisers (SSGA)
Carbon footprint analysis quantifies greenhouse gas emissions (GHG) embedded
within each investment portfolio presenting these as tonnes of carbon dioxide
equivalents (tCO2e). Comparing the total GHG emissions of each holding relative
to annual revenue, gives a measure of carbon intensity that enables comparison
between companies and countries, irrespective of size or geography.
Each holding’s contribution to the carbon footprint of the portfolio is calculated
on an ownership basis. The carbon footprint of the fund is the sum of these
contributions normalised by revenue owned (revenue method) or by per million
invested (AUM method). In addition, for comparison, we present the weighted
average carbon intensity (WACI) method of analysis of holdings, which aggregates
Carbon footprints of
investment
portfolios can be
used to identify
carbon-related
strengths,
weaknesses,
opportunities and
threats from the
shift to a low-carbon
economy.
Page 6

7
East Sussex Carbon Footprint February 2018
the individual issuers’ carbon footprint weighted by the proportion of portfolio
holdings.
Trucost’s assessment of the carbon footprint in East Sussex’s equity funds
includes:
Measurements of the carbon efficiency of portfolios relative to
benchmarks;
Analysis of sector allocation effects and stock selection effects;
Assessment of the transparency of carbon disclosure at portfolio and
constituent level;
Identification of key contributors to the carbon footprints of the funds;
Highlighting of key (active) investees for engagement on carbon risk;
Determination of the aggregate funds’ exposures to the fossil fuel; and,
Energy generation mix analysis of the aggregate portfolio.
A glossary of terms can be found in the Appendices. Values expressed in
percentage terms have been constructed such that a positive number is good
news for the fund’s carbon risk exposure.
Page 7

8
East Sussex Carbon Footprint February 2018
438.82
270.04
382.57408.33
251.78
362.60
-7.47% -7.25%
-5.51%
-8%
-7%
-6%
-5%
-4%
-3%
-2%
-1%
0%
0
50
100
150
200
250
300
350
400
450
500
CO2e Intensityper million revenue
(tCO2e/GBPm)
CO2e Intensityper million invested
(tCO2e/GBPm)
CO2e Intensityweighted average
(tCO2e/GBPm)
Rel
ativ
e Ef
fici
ency
Car
bo
n F
oo
tpri
nt
(tC
O2
e/G
BP
m)
LGIM - Global FTSE World Relative Efficiency
CARBON FOOTPRINT RESULTS
CARBON FOOTPRINT – LGIM GLOBAL
Summary
The carbon footprint analysis of the LGIM Global portfolio was carried out
for holdings data as at 30th September 2017.
The FTSE World Index was used as the benchmark for this analysis.
Our analysis covers companies of which holdings constitute 99.81% of the
value of the portfolio. The equivalent coverage figure for the benchmark
is 99.85%.
EXHIBIT 1: LGIM GLOBAL CARBON FOOTPRINT ANALYSIS
CO2e Intensity per million
revenue (tCO2e/GBPm)
CO2e Intensity per million
invested (tCO2e/GBPm)
CO2e Intensity weighted average
(tCO2e/GBPm)
Total Apportioned
CO2e (tonnes)
LGIM - Global 438.82 270.04 382.57 153,654.23
FTSE World 408.33 251.78 362.60 143,263.23
Relative Efficiency -7.47% -7.25% -5.51% -7.25%
The LGIM Global portfolio is 7.47% more carbon intensive than its
benchmark when compared using the revenue method; 7.25% more
carbon intensive when compared using the AUM method; and, 5.51% more
carbon intensive when compared using the weighted average method.
The following chart shows the comparison of the key metrics in graphical
representation.
EXHIBIT 2: LGIM GLOBAL CARBON FOOTPRINT CHART
The LGIM Global
portfolio is 7.47%
more carbon
intensive than its
benchmark, the
FTSE World Index,
when compared
using the revenue
method.
Page 8

9
East Sussex Carbon Footprint February 2018
Sector Analysis
The tables and charts below show how the sector and industry allocation as a proportion of the
portfolio differs from that in the benchmark, and the effect of this allocation on the carbon footprint
of the portfolio.
The sectors with the highest levels of carbon intensity within this portfolio are Utilities (3,082.48
tCO2e/GBPm) and Materials (1,695.29 tCO2e/GBPm).
EXHIBIT 3: SECTOR WEIGHTS IN THE PORTFOLIO AND THE BENCHMARK
Sector Weighting Carbon Intensity (tCO2e/GBPm)
Sector Portfolio Benchmark Portfolio Benchmark
Automobiles & Components 2.66% 2.54% 122.94 120.58
Banks 10.63% 10.07% 15.78 16.19
Capital Goods 7.95% 8.10% 198.25 188.52
Commercial & Professional Services 0.87% 0.91% 238.68 223.91
Consumer Durables & Apparel 1.91% 1.97% 129.77 129.19
Consumer Services 1.66% 1.73% 263.79 264.50
Diversified Financials 4.38% 4.45% 161.44 164.34
Energy 6.29% 6.05% 975.70 921.58
Food & Staples Retailing 1.72% 1.77% 75.70 75.89
Food, Beverage & Tobacco 5.15% 5.32% 525.29 522.01
Health Care Equipment & Services 3.31% 3.46% 37.91 37.58
Household & Personal Products 2.01% 2.03% 237.44 233.13
Insurance 4.05% 4.04% 8.50 8.69
Materials 5.48% 5.49% 1,695.29 1564.13
Media 2.42% 2.53% 32.51 32.78
Pharmaceuticals, Biotechnology & Life Sciences
7.63% 7.90% 72.28 70.88
Real Estate 3.06% 2.94% 141.83 153.34
Retailing 3.40% 3.51% 80.48 79.70
Semiconductors & Semiconductor Equipment
2.93% 3.08% 219.66 211.33
Software & Services 9.08% 8.65% 40.28 40.07
Technology Hardware & Equipment 4.85% 5.03% 109.20 109.38
Telecommunication Services 3.15% 3.03% 78.47 77.07
Transportation 2.29% 2.30% 671.27 658.28
Utilities 3.12% 3.09% 3,082.48 2826.47
100.00% 100.00% 438.82 408.33
Page 9

10
East Sussex Carbon Footprint February 2018
EXHIBIT 4: SECTOR WEIGHTS CHART
EXHIBIT 5: SECTOR CARBON INTENSITY CHART
0%
2%
4%
6%
8%
10%
12%
LGIM - Global FTSE World
0
500
1,000
1,500
2,000
2,500
3,000
3,500
tCO
2e/
GB
Pm
LGIM - Global FTSE World
Page 10

11
East Sussex Carbon Footprint February 2018
Performance Attribution
Sector allocation effects and stock selection effects are the principal reasons why the carbon intensity
of a portfolio may differ from its benchmark. A portfolio that is overweight in carbon intensive
sectors, or has holdings of the most carbon intensive stocks within any given sector, is likely to be
more carbon intensive than its benchmark, and vice versa.
The sectors that have the greatest effect on the LGIM Global’s carbon intensity are Utilities, Materials
and Energy, which together contribute negatively to the carbon intensity of the portfolio by -6.75%,
relative to the benchmark.
EXHIBIT 6: PERFORMANCE ATTRIBUTION TABLE (REVENUE METHOD)
Footprint Attribution
Sector Sector Allocation
Stock Selection
Total Effect
Automobiles & Components -0.05% -0.04% -0.09%
Banks 0.25% 0.01% 0.26%
Capital Goods -0.07% -0.24% -0.31%
Commercial & Professional Services -0.02% -0.03% -0.05%
Consumer Durables & Apparel -0.01% 0.00% -0.02%
Consumer Services -0.02% 0.00% -0.02%
Diversified Financials -0.05% 0.02% -0.02%
Energy -0.88% -1.14% -2.02%
Food & Staples Retailing -0.15% 0.00% -0.14%
Food, Beverage & Tobacco 0.03% -0.03% 0.00%
Health Care Equipment & Services -0.16% 0.00% -0.16%
Household & Personal Products -0.01% -0.01% -0.03%
Insurance 0.00% 0.00% 0.01%
Materials 0.03% -2.06% -2.03%
Media -0.08% 0.00% -0.08%
Pharmaceuticals, Biotechnology & Life Sciences
-0.08% -0.01% -0.09%
Real Estate 0.13% 0.04% 0.17%
Retailing -0.07% -0.01% -0.07%
Semiconductors & Semiconductor Equipment
-0.02% -0.02% -0.05%
Software & Services 0.02% 0.00% 0.02%
Technology Hardware & Equipment -0.07% 0.00% -0.07%
Telecommunication Services 0.12% -0.01% 0.11%
Transportation 0.01% -0.08% -0.06%
Utilities 0.05% -2.75% -2.70%
-1.09% -6.38% -7.47%
Page 11

East Sussex Carbon Footprint February 2018
Top Contributors
The 10 companies that contribute most to the LGIM Global portfolio’s carbon footprint are tabulated below. Note that a company may appear in this list
because of the proportion owned, rather than because it is among the 10 most carbon intensive stocks held.
These companies, belonging to the Utilities, Materials and Energy sectors, contribute negatively to the total carbon intensity of the portfolio by -11.70%, with
maximum negative contribution of -1.43% by Exxon Mobil Corp.
EXHIBIT 7: TOP 10 CONTRIBUTORS TO CARBON FOOTPRINT (REVENUE METHOD)
Company Name Sector Holding (GBPm)
Carbon Apportioned (tonnes)
Carbon Apportioned (%)
Company CO2e intensity (tonnes/GBPm)
Carbon Footprint Contribution (%)
CO2e Intensity Rank in Benchmark Sector
Data Source (Scope 1)
Exxon Mobil Corp Energy 4.56 3,549.13 2.31% 1,137.79 -1.43% 78/112 Full Disclosure
RWE AG Utilities 0.15 2,341.69 1.52% 3,883.66 -1.35% 74/116 Full Disclosure
ArcelorMittal Inc Materials 0.20 2,180.00 1.42% 4,587.14 -1.28% 222/241 Full Disclosure
American Electric Power Utilities 0.45 2,053.37 1.34% 8,785.54 -1.27% 110/116 Full Disclosure
LafargeHolcim Ltd Materials 0.29 1,997.22 1.30% 8,311.30 -1.23% 235/241 Full Disclosure
Southern Co Utilities 0.64 1,863.20 1.21% 6,593.13 -1.13% 104/116 Full Disclosure
Duke Energy Corp Utilities 0.77 1,841.54 1.20% 5,674.15 -1.11% 92/116 Full Disclosure
Korea Elec Power Corp Utilities 0.11 1,721.87 1.12% 5,921.09 -1.04% 97/116 Partial Disclosure
Tokyo Electric Power Co. Holding Inc. Utilities 0.08 1,736.72 1.13% 2,849.23 -0.96% 68/116 Full Disclosure
Nippon Steel & Sumitomo Metal Corp Materials 0.23 1,541.74 1.00% 3,753.35 -0.89% 214/241 Partial Disclosure
Page 12

13
East Sussex Carbon Footprint February 2018
362.52
285.46309.36
358.50
283.24304.89
-1.12%
-0.79%
-1.46%
-2%
-1%
-1%
-1%
-1%
-1%
0%
0%
0%
0
50
100
150
200
250
300
350
400
CO2e Intensityper million revenue
(tCO2e/GBPm)
CO2e Intensityper million invested
(tCO2e/GBPm)
CO2e Intensityweighted average
(tCO2e/GBPm)
Rel
ativ
e Ef
fici
ency
Car
bo
n F
oo
tpri
nt
(tC
O2
e/G
BP
m)
LGIM - UK FTSE All Share Relative Efficiency
CARBON FOOTPRINT – LGIM UK
Summary
The carbon footprint analysis of the LGIM - UK portfolio was carried out
for holdings data as at 30th September 2017.
The FTSE All Share Index was used as the benchmark for this analysis.
Our analysis covers companies of which holdings constitute 95.82% of the
value of the portfolio. The equivalent coverage figure for the benchmark
is 95.52%.
EXHIBIT 8: LGIM UK CARBON FOOTPRINT ANALYSIS
CO2e Intensity per million
revenue (tCO2e/GBPm)
CO2e Intensity per million
invested (tCO2e/GBPm)
CO2e Intensity weighted average
(tCO2e/GBPm)
Total Apportioned
CO2e (tonnes)
LGIM - UK 362.52 285.46 309.36 89,369.71
FTSE All Share 358.50 283.24 304.89 88,673.13
Relative Efficiency -1.12% -0.79% -1.46% -0.79%
The LGIM UK portfolio is 1.12% more carbon intensive than its benchmark
when compared using the revenue method; 0.79% more carbon intensive
when compared using the AUM method; and, 1.49% more carbon intensive
when compared using the weighted average method.
The following chart shows the comparison of the key metrics in graphical
representation.
EXHIBIT 9: LGIM UK CARBON FOOTPRINT CHART
The LGIM UK
portfolio is 1% more
carbon intensive
than its benchmark,
FTSE All Share, when
compared using the
revenue method.
Page 13

14
East Sussex Carbon Footprint February 2018
Sector Analysis
The tables and charts below show how the sector and industry allocation as a proportion of the portfolio
differs from that in the benchmark, and the effect of this allocation on the carbon footprint of the
portfolio.
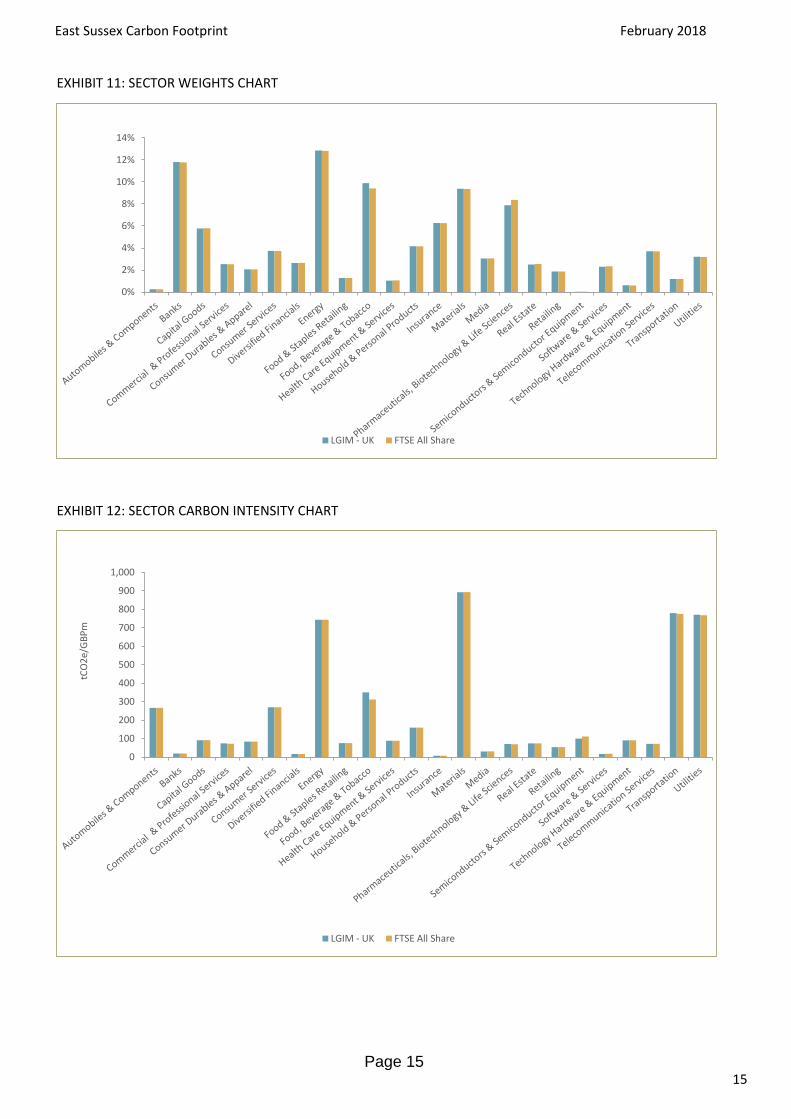
The sectors that have the highest levels of carbon intensity within this portfolio are Materials (892.10
tCO2e/GBPm), Transportation (779.28 tCO2e/GBPm), Utilities (770.01 tCO2e/GBPm) and Energy
(743.95 tCO2e/GBPm).
Sector Weighting Carbon Intensity (tCO2e/GBPm)
Sector Portfolio Benchmark Portfolio Benchmark
Automobiles & Components 0.26% 0.26% 266.98 266.98
Banks 11.81% 11.78% 19.75 19.74
Capital Goods 5.76% 5.80% 90.83 91.92
Commercial & Professional Services 2.53% 2.52% 73.46 72.17
Consumer Durables & Apparel 2.05% 2.06% 82.95 83.49
Consumer Services 3.74% 3.72% 269.92 270.29
Diversified Financials 2.63% 2.65% 16.74 16.70
Energy 12.86% 12.83% 743.95 743.30
Food & Staples Retailing 1.27% 1.27% 75.37 75.31
Food, Beverage & Tobacco 9.90% 9.42% 349.97 311.15
Health Care Equipment & Services 1.04% 1.05% 88.87 88.88
Household & Personal Products 4.16% 4.14% 159.04 159.02
Insurance 6.27% 6.26% 7.01 7.05
Materials 9.38% 9.36% 892.10 893.17
Media 3.04% 3.05% 29.43 30.90
Pharmaceuticals, Biotechnology & Life Sciences
7.89% 8.38% 70.25 69.77
Real Estate 2.51% 2.55% 74.13 74.04
Retailing 1.87% 1.87% 53.59 53.72
Semiconductors & Semiconductor Equipment
0.02% 0.02% 99.53 111.43
Software & Services 2.31% 2.34% 17.20 17.26
Technology Hardware & Equipment 0.62% 0.60% 90.61 90.98
Telecommunication Services 3.70% 3.69% 71.33 71.35
Transportation 1.18% 1.18% 779.28 775.64
Utilities 3.19% 3.18% 770.01 767.90
100.00% 100.00% 362.52 358.50
EXHIBIT 10: SECTOR WEIGHTS IN THE PORTFOLIO AND THE BENCHMARK
Page 14
15
East Sussex Carbon Footprint February 2018
EXHIBIT 11: SECTOR WEIGHTS CHART
EXHIBIT 12: SECTOR CARBON INTENSITY CHART
0%
2%
4%
6%
8%
10%
12%
14%
LGIM - UK FTSE All Share
0
100
200
300
400
500
600
700
800
900
1,000
tCO
2e/
GB
Pm
LGIM - UK FTSE All Share
Page 15

16
East Sussex Carbon Footprint February 2018
Performance Attribution
Sector allocation effects and stock selection effects are the principal reasons why the carbon intensity
of a portfolio may differ from its benchmark. A portfolio that is overweight in carbon intensive sectors,
or has holdings of the most carbon intensive stocks within any given sector, is likely to be more carbon
intensive than its benchmark, and vice versa.
The sectors that have the greatest effect on the LGIM UK’s carbon intensity are Food, Beverage and
Tobacco and Capital Goods, which together contribute negatively to the carbon intensity of the portfolio
by -0.67%, relative to the benchmark.
EXHIBIT 13: PERFORMANCE ATTRIBUTION TABLE (REVENUE METHOD)
Footprint Attribution
Sector Sector Allocation
Stock Selection
Total Effect
Automobiles & Components 0.00% 0.00% 0.00%
Banks 0.04% 0.00% 0.04%
Capital Goods -0.25% 0.02% -0.22%
Commercial & Professional Services -0.15% -0.01% -0.16%
Consumer Durables & Apparel 0.00% 0.00% 0.00%
Consumer Services 0.01% 0.00% 0.01%
Diversified Financials 0.00% 0.00% 0.00%
Energy -0.13% -0.04% -0.17%
Food & Staples Retailing 0.00% 0.00% 0.00%
Food, Beverage & Tobacco 0.05% -0.50% -0.45%
Health Care Equipment & Services 0.00% 0.00% 0.00%
Household & Personal Products 0.01% 0.00% 0.01%
Insurance 0.06% 0.00% 0.06%
Materials -0.01% 0.03% 0.02%
Media -0.04% 0.01% -0.03%
Pharmaceuticals, Biotechnology & Life Sciences
-0.06% 0.00% -0.06%
Real Estate -0.05% 0.00% -0.05%
Retailing -0.03% 0.00% -0.02%
Semiconductors & Semiconductor Equipment
0.00% 0.00% 0.00%
Software & Services -0.01% 0.00% -0.01%
Technology Hardware & Equipment 0.01% 0.00% 0.01%
Telecommunication Services 0.02% 0.00% 0.02%
Transportation -0.01% -0.03% -0.04%
Utilities -0.04% -0.03% -0.07%
-0.59% -0.53% -1.12%
Page 16

East Sussex Carbon Footprint February 2018
Top Contributors
The 10 companies that contribute most to the LGIM UK portfolio’s carbon footprint are tabulated below. Note that a company may appear in this list because
of the proportion owned, rather than because it is among the 10 most carbon intensive stocks held.
These companies, belonging to Energy, Materials, Utilities and Transportation sectors, contribute negatively by -39.19% to the total carbon intensity of the
portfolio, with maximum negative contribution of -8.50% by BP.
EXHIBIT 14: TOP 10 CONTRIBUTORS TO CARBON FOOTPRINT (REVENUE METHOD)
Company Name Sector Holding (GBPm)
Carbon Apportioned (tonnes)
Carbon Apportioned (%)
Company CO2e intensity (tonnes/GBPm)
Carbon Footprint Contribution (%)
CO2e Intensity Rank in Benchmark Sector
Data Source (Scope 1)
BP Energy 12.68 14,190.86 15.88% 714.23 -8.50% 10/18 Full Disclosure
Royal Dutch Shell PLC Energy 11.90 9,685.27 10.84% 809.57 -6.29% 13/18 Full Disclosure
Royal Dutch Shell PLC Energy 10.42 8,475.63 9.48% 809.57 -5.47% 13/18 Full Disclosure
CRH Plc Materials 3.30 4,900.73 5.48% 1,451.29 -4.17% 32/38 Full Disclosure
International Consolidated Airlines Group SA
Transportation 1.37 3,288.44 3.68% 1,455.29 -2.79% 12/12 Full Disclosure
Drax Group Utilities 0.18 2,575.01 2.88% 5,725.09 -2.70% 8/8 Full Disclosure
Rio Tinto Plc Materials 5.69 3,133.21 3.51% 1,280.80 -2.54% 29/38 Full Disclosure
Vedanta Resources Inc Materials 0.10 2,267.83 2.54% 7,195.34 -2.41% 38/38 Full Disclosure
Evraz Group GDR Materials 0.21 2,069.48 2.32% 7,021.33 -2.20% 37/38 Full Disclosure
Mondi Ltd Materials 1.02 2,106.90 2.36% 3,370.66 -2.11% 36/38 Full Disclosure
Page 17

18
East Sussex Carbon Footprint February 2018
73.02
45.4371.89
419.45
251.98
372.0882.59%
81.97%
80.68%
81%
81%
82%
82%
83%
83%
0
50
100
150
200
250
300
350
400
450
CO2e Intensityper million revenue
(tCO2e/GBPm)
CO2e Intensityper million invested
(tCO2e/GBPm)
CO2e Intensityweighted average
(tCO2e/GBPm)
Rel
ativ
e Ef
fici
ency
Car
bo
n F
oo
tpri
nt
(tC
O2
e/G
BP
)
Longview Partners Global Equity Strategy MSCI ACWI Relative Efficiency
CARBON FOOTPRINT – LONGVIEW
Summary
The carbon footprint analysis of the Longview portfolio was carried out
for holdings data as at 30th September 2017.
The MSCI ACWI was used as the benchmark for this analysis.
Our analysis covers companies of which holdings constitute 100% of the
value of the portfolio. The equivalent coverage figure for the benchmark
is 99.92%.
EXHIBIT 15: LONGVIEW CARBON FOOTPRINT ANALYSIS
CO2e Intensity per million
revenue (tCO2e/GBPm)
CO2e Intensity per million
invested (tCO2e/GBPm)
CO2e Intensity weighted average
(tCO2e/GBPm)
Total Apportioned
CO2e (tonnes)
Longview Partners Global Equity Strategy
73.02 45.43 71.89 8,028.73
MSCI ACWI 419.45 251.98 372.08 44,531.97
Relative Efficiency 82.59% 81.97% 80.68% 81.97%
The Longview portfolio is 82.59% less carbon intensive than its benchmark
when compared using the revenue method; 81.97% less carbon intensive
when compared using the AUM method; and, 80.68% less carbon intensive
when compared using the weighted average method.
The following chart shows the comparison of the key metrics in graphical
representation.
EXHIBIT 16: LONGVIEW CARBON FOOTPRINT CHART
The Longview
portfolio is 82.59%
less carbon intensive
than its benchmark,
MSCI ACWI, when
compared using the
revenue method.
Page 18

19
East Sussex Carbon Footprint February 2018
Sector Analysis
The tables and charts below show how the sector and industry allocation as a proportion of the portfolio
differs from that in the benchmark, and the effect of this allocation on the carbon footprint of the
portfolio.
The two sectors that have the highest levels of carbon intensity within this portfolio are Automobiles
and Components (189.37 tCO2e/GBPm) and Capital Goods (132.58 tCO2e/GBPm).
Sector Weighting Carbon Intensity (tCO2e/GBPm)
Sector Portfolio Benchmark Portfolio Benchmark
Automobiles & Components 7.99% 2.58% 189.37 117.50
Banks 7.31% 10.57% 11.99 15.86
Capital Goods 11.30% 7.94% 132.58 192.66
Commercial & Professional Services 1.31% 0.79% 28.07 259.60
Consumer Durables & Apparel 1.90% 131.31
Consumer Services 8.54% 1.68% 69.60 268.65
Diversified Financials 7.20% 4.09% 18.71 132.30
Energy 6.37% 976.16
Food & Staples Retailing 1.69% 76.83
Food, Beverage & Tobacco 5.10% 515.18
Health Care Equipment & Services 11.83% 3.34% 61.46 37.49
Household & Personal Products 2.02% 218.41
Insurance 9.27% 4.08% 23.14 8.01
Materials 5.31% 1640.41
Media 5.57% 2.39% 27.68 32.25
Pharmaceuticals, Biotechnology & Life Sciences
14.55% 7.61% 69.20 72.26
Real Estate 3.07% 135.09
Retailing 3.77% 3.47% 99.17 86.47
Semiconductors & Semiconductor Equipment
2.95% 219.57
Software & Services 10.42% 9.77% 32.41 39.89
Technology Hardware & Equipment 0.93% 4.81% 50.07 107.09
Telecommunication Services 3.21% 78.91
Transportation 2.18% 633.02
Utilities 3.08% 3001.62
100.00% 100.00% 73.02 419.45
EXHIBIT 17: SECTOR WEIGHTS IN THE PORTFOLIO AND THE BENCHMARK
Page 19

20
East Sussex Carbon Footprint February 2018
EXHIBIT 18: SECTOR WEIGHTS CHART
EXHIBIT 19: SECTOR CARBON INTENSITY CHART
0%
2%
4%
6%
8%
10%
12%
14%
16%
Longview Partners Global Equity Strategy MSCI ACWI
0
500
1,000
1,500
2,000
2,500
3,000
3,500
tCO
2e/
GB
Pm
Longview Partners Global Equity Strategy MSCI ACWI
Page 20

21
East Sussex Carbon Footprint February 2018
Performance Attribution
Sector allocation effects and stock selection effects are the principal reasons why the carbon intensity
of a portfolio may differ from its benchmark. A portfolio that is overweight in carbon intensive sectors,
or has holdings of the most carbon intensive stocks within any given sector, is likely to be more carbon
intensive than its benchmark, and vice versa.
The two sectors with the greatest total effect on the portfolio are Utilities and Materials, which together
reduce the carbon intensity of the portfolio relative to the benchmark by 43.98%.
EXHIBIT 20: PERFORMANCE ATTRIBUTION TABLE (REVENUE METHOD)
Footprint Attribution
Sector Sector Allocation
Stock Selection
Total Effect
Automobiles & Components 2.92% -1.87% 1.05%
Banks 2.08% 0.08% 2.16%
Capital Goods 0.48% 1.58% 2.06%
Commercial & Professional Services -0.12% 0.30% 0.18%
Consumer Durables & Apparel -1.48% -1.48%
Consumer Services 3.38% 4.97% 8.35%
Diversified Financials 0.25% 0.93% 1.18%
Energy 11.60% 11.60%
Food & Staples Retailing -4.72% -4.72%
Food, Beverage & Tobacco 0.95% 0.95%
Health Care Equipment & Services 11.25% -1.02% 10.23%
Household & Personal Products -0.53% -0.53%
Insurance -1.57% -0.23% -1.80%
Materials 18.19% 18.19%
Media 7.16% 0.11% 7.27%
Pharmaceuticals, Biotechnology & Life Sciences
2.89% 0.05% 2.93%
Real Estate -0.81% -0.81%
Retailing 1.17% -0.15% 1.02%
Semiconductors & Semiconductor Equipment
-0.54% -0.54%
Software & Services 0.87% 0.07% 0.94%
Technology Hardware & Equipment -0.19% 0.70% 0.52%
Telecommunication Services -3.08% -3.08%
Transportation 1.15% 1.15%
Utilities 25.79% 25.79%
77.07% 5.52% 82.59%
Page 21
East Sussex Carbon Footprint February 2018
Top Contributors
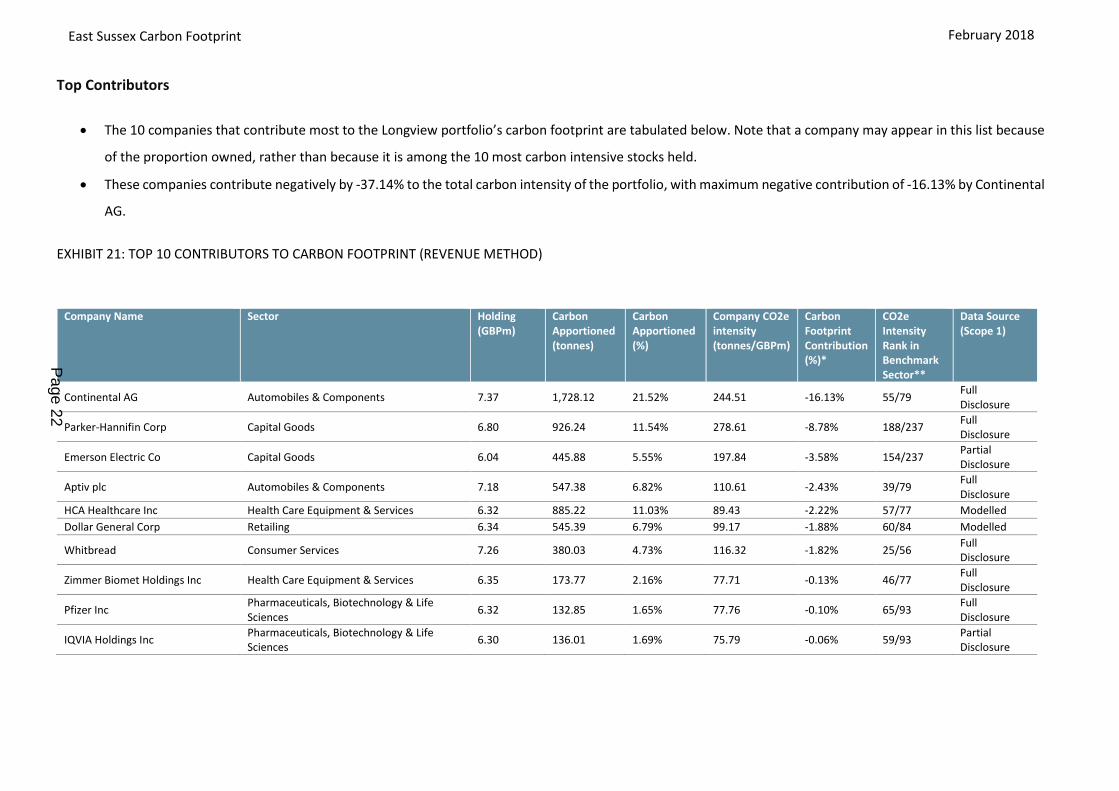
The 10 companies that contribute most to the Longview portfolio’s carbon footprint are tabulated below. Note that a company may appear in this list because
of the proportion owned, rather than because it is among the 10 most carbon intensive stocks held.
These companies contribute negatively by -37.14% to the total carbon intensity of the portfolio, with maximum negative contribution of -16.13% by Continental
AG.
EXHIBIT 21: TOP 10 CONTRIBUTORS TO CARBON FOOTPRINT (REVENUE METHOD)
Company Name Sector Holding (GBPm)
Carbon Apportioned (tonnes)
Carbon Apportioned (%)
Company CO2e intensity (tonnes/GBPm)
Carbon Footprint Contribution (%)*
CO2e Intensity Rank in Benchmark Sector**
Data Source (Scope 1)
Continental AG Automobiles & Components 7.37 1,728.12 21.52% 244.51 -16.13% 55/79 Full Disclosure
Parker-Hannifin Corp Capital Goods 6.80 926.24 11.54% 278.61 -8.78% 188/237 Full Disclosure
Emerson Electric Co Capital Goods 6.04 445.88 5.55% 197.84 -3.58% 154/237 Partial Disclosure
Aptiv plc Automobiles & Components 7.18 547.38 6.82% 110.61 -2.43% 39/79 Full Disclosure
HCA Healthcare Inc Health Care Equipment & Services 6.32 885.22 11.03% 89.43 -2.22% 57/77 Modelled
Dollar General Corp Retailing 6.34 545.39 6.79% 99.17 -1.88% 60/84 Modelled
Whitbread Consumer Services 7.26 380.03 4.73% 116.32 -1.82% 25/56 Full Disclosure
Zimmer Biomet Holdings Inc Health Care Equipment & Services 6.35 173.77 2.16% 77.71 -0.13% 46/77 Full Disclosure
Pfizer Inc Pharmaceuticals, Biotechnology & Life Sciences
6.32 132.85 1.65% 77.76 -0.10% 65/93 Full Disclosure
IQVIA Holdings Inc Pharmaceuticals, Biotechnology & Life Sciences
6.30 136.01 1.69% 75.79 -0.06% 59/93 Partial Disclosure
Page 22

23
East Sussex Carbon Footprint February 2018
CARBON FOOTPRINT – SSGA EQUITIES
Summary
The carbon footprint analysis of the SSGA portfolio was carried out for
holdings data as at 30th September 2017.
The FTSE RAFI-All World 3000 was the benchmark for this analysis.
Our analysis covers companies of which holdings constitute 99.74% of the
value of the portfolio. The equivalent coverage figure for the benchmark
is 99.81%.
EXHIBIT 22: SSGA CARBON FOOTPRINT ANALYSIS
CO2e Intensity per million
revenue (tCO2e/GBPm)
CO2e Intensity per million
invested (tCO2e/GBPm)
CO2e Intensity weighted average
(tCO2e/GBPm)
Total Apportioned
CO2e (tonnes)
SSGA Equities 523.72 537.69 491.64 352,207.12
FTSE RAFI All-World 3000
545.98 548.59 494.28 359,347.55
Relative Efficiency 4.08% 1.99% 0.54% 1.99%
The SSGA portfolio is 4.08% less carbon intensive than its benchmark when
compared using the revenue method; 1.99% less carbon intensive when
compared using the AUM method; and, 0.54% less carbon intensive when
compared using the weighted average method.
The following chart shows the comparison of the key metrics in graphical
representation.
EXHIBIT 23: SSGA EQUITIES CARBON FOOTPRINT CHART
523.72
537.69
491.64
545.98548.59
494.28
4.08%
1.99%
0.54%
0%
1%
1%
2%
2%
3%
3%
4%
4%
5%
460
470
480
490
500
510
520
530
540
550
560
CO2e Intensityper million revenue
(tCO2e/GBPm)
CO2e Intensityper million invested
(tCO2e/GBPm)
CO2e Intensityweighted average
(tCO2e/GBPm)
Rel
ativ
e Ef
fici
ency
Car
bo
n F
oo
tpri
nt
(tC
O2
e/G
BP
)
SSGA Equities FTSE RAFI All-World 3000 Relative Efficiency
The SSGA portfolio is
4.08% less carbon
intensive than its
benchmark, FTSE
RAFI-All World 3000,
when compared
using the revenue
method.
Page 23

24
East Sussex Carbon Footprint February 2018
Sector Analysis
The tables and charts below show how the sector and industry allocation as a proportion of the
portfolio differs from that in the benchmark, and the effect of this allocation on the carbon footprint
of the portfolio.
The two sectors that have the highest levels of carbon intensity within this portfolio are Utilities
(2,882.08 tCO2e/GBPm) and Materials (1,722.72 tCO2e/GBPm).
Sector Weighting Carbon Intensity (tCO2e/GBPm)
Sector Portfolio Benchmark Portfolio Benchmark
Automobiles & Components 4.10% 4.10% 110.93 112.86
Banks 14.43% 13.96% 15.49 15.13
Capital Goods 8.43% 8.38% 192.73 217.60
Commercial & Professional Services 0.73% 0.79% 235.97 191.75
Consumer Durables & Apparel 1.63% 1.72% 129.68 125.35
Consumer Services 1.15% 1.20% 284.65 271.14
Diversified Financials 4.02% 3.97% 134.54 137.82
Energy 11.09% 10.58% 961.55 1004.07
Food & Staples Retailing 2.39% 2.43% 82.67 82.80
Food, Beverage & Tobacco 3.83% 3.91% 650.02 657.21
Health Care Equipment & Services 2.38% 2.46% 44.57 43.22
Household & Personal Products 1.26% 1.31% 220.88 225.63
Insurance 6.03% 6.00% 7.35 7.34
Materials 6.99% 6.56% 1,722.72 1770.22
Media 1.73% 1.75% 34.73 35.52
Pharmaceuticals, Biotechnology & Life Sciences
4.62% 4.84% 73.76 75.99
Real Estate 2.73% 2.87% 130.56 133.28
Retailing 2.09% 2.12% 85.69 84.73
Semiconductors & Semiconductor Equipment
1.62% 1.64% 251.54 243.82
Software & Services 3.10% 3.27% 42.51 42.98
Technology Hardware & Equipment 4.15% 4.18% 113.53 119.39
Telecommunication Services 4.43% 4.46% 76.97 77.95
Transportation 2.28% 2.34% 804.88 813.74
Utilities 4.81% 5.16% 2,882.08 2825.81
100.00% 100.00% 523.72 545.98
EXHIBIT 24: SECTOR WEIGHTS IN THE PORTFOLIO AND THE BENCHMARK
Page 24

25
East Sussex Carbon Footprint February 2018
EXHIBIT 25: SECTOR WEIGHTS CHART
EXHIBIT 26: SECTOR CARBON INTENSITY CHART
0%
2%
4%
6%
8%
10%
12%
14%
16%
SSGA Equities FTSE RAFI All-World 3000
0
500
1,000
1,500
2,000
2,500
3,000
3,500
tCO
2e/
GB
Pm
SSGA Equities FTSE RAFI All-World 3000
Page 25

26
East Sussex Carbon Footprint February 2018
Performance Attribution
Sector allocation effects and stock selection effects are the principal reasons why the carbon intensity
of a portfolio may differ from its benchmark. A portfolio that is overweight in carbon intensive
sectors, or has holdings of the most carbon intensive stocks within any given sector, is likely to be
more carbon intensive than its benchmark, and vice versa.
The two sectors with the greatest total effect on the portfolio are Utilities and Capital Goods, which
together reduce the carbon intensity of the portfolio relative to the benchmark by 3.67%.
EXHIBIT 27: PERFORMANCE ATTRIBUTION TABLE (REVENUE METHOD)
Footprint Attribution
Sector Sector Allocation
Stock Selection
Total Effect
Automobiles & Components -0.05% 0.03% -0.02%
Banks 0.13% 0.00% 0.13%
Capital Goods 0.75% 0.53% 1.28%
Commercial & Professional Services -0.08% -0.07% -0.15%
Consumer Durables & Apparel -0.10% -0.01% -0.11%
Consumer Services -0.02% -0.02% -0.03%
Diversified Financials 0.02% 0.01% 0.03%
Energy -0.01% 0.91% 0.90%
Food & Staples Retailing 0.07% 0.00% 0.08%
Food, Beverage & Tobacco 0.01% 0.04% 0.05%
Health Care Equipment & Services -0.05% -0.01% -0.06%
Household & Personal Products 0.00% 0.00% 0.00%
Insurance -0.14% 0.00% -0.14%
Materials -0.80% 0.61% -0.19%
Media -0.02% 0.00% -0.02%
Pharmaceuticals, Biotechnology & Life Sciences
-0.07% 0.01% -0.07%
Real Estate -0.07% 0.00% -0.07%
Retailing -0.13% -0.01% -0.14%
Semiconductors & Semiconductor Equipment
-0.01% -0.01% -0.01%
Software & Services -0.06% 0.00% -0.06%
Technology Hardware & Equipment 0.08% 0.06% 0.13%
Telecommunication Services 0.00% 0.01% 0.00%
Transportation 0.10% 0.04% 0.14%
Utilities 3.05% -0.66% 2.39%
2.62% 1.46% 4.08%
Page 26

East Sussex Carbon Footprint February 2018
Top Contributors
The 10 companies that contribute most to the Longview portfolio’s carbon footprint are tabulated below. Note that a company may appear in this list because
of the proportion owned, rather than because it is among the 10 most carbon intensive stocks held.
These companies, made up of Utilities, Materials and Energy sector companies, contribute negatively by -17.42% to the total carbon intensity of the portfolio,
with maximum negative contribution of -3.77% by RWE AG.
EXHIBIT 28: TOP 10 CONTRIBUTORS TO CARBON FOOTPRINT (REVENUE METHOD)
Company Name Sector Holding (GBPm)
Carbon Apportioned (tonnes)
Carbon Apportioned (%)
Company CO2e intensity (tonnes/GBPm)
Carbon Footprint Contribution (%)*
CO2e Intensity Rank in Benchmark Sector**
Data Source (Scope 1)
RWE AG Utilities 0.98 15,271.55 4.34% 3,883.66 -3.77% 105/162 Full Disclosure
Tokyo Electric Power Co. Holding Inc. Utilities 0.55 11,368.42 3.23% 2,849.23 -2.65% 93/162 Full Disclosure
ArcelorMittal Inc Materials 0.74 7,959.19 2.26% 4,587.14 -2.01% 264/290 Full Disclosure
Gazprom PJSC Energy 1.19 8,185.62 2.32% 3,202.14 -1.95% 177/187 Full Disclosure
Korea Elec Power Corp Utilities 0.43 6,615.66 1.88% 5,921.09 -1.72% 131/162 Partial Disclosure
Engie Utilities 1.48 6,512.92 1.85% 2,268.98 -1.43% 88/162 Full Disclosure
Dynegy Inc Utilities 0.05 3,680.50 1.04% 19,008.27 -1.02% 156/162 Full Disclosure
Enel SpA Utilities 1.87 4,802.60 1.36% 1,913.54 -0.99% 82/162 Full Disclosure
Nippon Steel & Sumitomo Metal Corp Materials 0.59 3,890.95 1.10% 3,753.35 -0.95% 254/290 Partial Disclosure
China National Building Material Co. Ltd. - H Shares
Materials 0.12 3,569.52 1.01% 6,519.75 -0.93% 276/290 Modelled
Page 27

28
East Sussex Carbon Footprint February 2018
CARBON FOOTPRINT – NEWTON
Summary
The carbon footprint analysis of the Newton portfolio was carried out for
holdings data as at 30th September 2017.
No benchmark was used for this analysis (as the portfolio was one of the
two absolute return funds analysed).
Our analysis covers companies of which holdings constitute 90.60% of the
value of the portfolio.
EXHIBIT 29: NEWTON CARBON FOOTPRINT ANALYSIS
CO2e Intensity per million
revenue (tCO2e/GBPm)
CO2e Intensity per million
invested (tCO2e/GBPm)
CO2e Intensity weighted average
(tCO2e/GBPm)
Total Apportioned
CO2e (tonnes)
Newton Equities 377.68 191.88 402.20 31,418.77
The Newton portfolio has a carbon intensity of 377.68 tCO2e per million
GBP, when analysed using the revenue method.
The Newton
portfolio has a
carbon intensity of
377.68 tCO2e per
million GBP, when
analysed using the
revenue method.
Page 28

East Sussex Carbon Footprint February 2018
Top Contributors
The 10 companies that contribute most to the Newton portfolio’s carbon footprint are tabulated below. Note that a company may appear in this list because
of the proportion owned, rather than because it is among the 10 most carbon intensive stocks held.
These companies contribute negatively by -48.14% to the total carbon intensity of the portfolio, with maximum negative contribution of -17.76% by CMS Energy
Corp.
EXHIBIT 30: TOP 10 CONTRIBUTORS TO CARBON FOOTPRINT (REVENUE METHOD)
Company Name Sector Holding (GBPm)
Carbon Apportioned (tonnes)
Carbon Apportioned (%)
Company CO2e intensity (tonnes/GBPm)
Carbon Footprint Contribution (%)*
CO2e Intensity Rank in Benchmark Sector**
Data Source (Scope 1)
CMS Energy Corp Utilities 4.15 6,266.57 19.95% 2,837.75 -17.76% 5/5 Full Disclosure
Albemarle Corp Materials 3.65 3,431.06 10.92% 4,865.99 -10.16% 18/18 Full Disclosure
CRH Plc Materials 1.85 2,740.29 8.72% 1,451.29 -6.60% 17/18 Full Disclosure
Royal Dutch Shell PLC Energy 2.97 2,414.16 7.68% 809.57 -4.25% 3/3 Full Disclosure
Total S.A. Energy 3.00 2,030.26 6.46% 559.53 -2.20% 2/3 Full Disclosure
Associated British Foods Food, Beverage & Tobacco
2.41 1,171.94 3.73% 846.26 -2.10% 7/7 Full Disclosure
Orsted Utilities 3.15 1,095.98 3.49% 904.14 -2.06% 4/5 Full Disclosure
Eversource Energy Utilities 5.10 1,426.85 4.54% 646.24 -1.94% 3/5 Full Disclosure
Gold Fields Ltd Materials 0.47 352.45 1.12% 904.90 -0.66% 14/18 Full Disclosure
Newcrest Mining Ltd Materials 0.85 215.08 0.68% 962.66 -0.42% 15/18 Full Disclosure
Page 29

30
East Sussex Carbon Footprint February 2018
CARBON FOOTPRINT – RUFFER
Summary
The carbon footprint analysis of the Ruffer portfolio was carried out for
holdings data as at 30th September 2017.
No benchmark was used for this analysis (as the portfolio was one of the
two absolute return funds analysed).
Our analysis covers companies of which holdings constitute 72.29% of the
value of the portfolio.
EXHIBIT 31: RUFFER CARBON FOOTPRINT ANALYSIS
CO2e Intensity per million
revenue (tCO2e/GBPm)
CO2e Intensity per million
invested (tCO2e/GBPm)
CO2e Intensity weighted average
(tCO2e/GBPm)
Total Apportioned
CO2e (tonnes)
Ruffer Equities
196.91 247.76 255.34 24,156.15
The Ruffer portfolio has a carbon intensity of 196.91 tCO2e per million GBP,
when analysed using the revenue method.
The Ruffer portfolio
has a carbon
intensity of 196.91
tCO2e per million
GBP, when analysed
using the revenue
method.
Page 30

East Sussex Carbon Footprint February 2018
Top Contributors
The 10 companies that contribute most to the Ruffer portfolio’s carbon footprint are tabulated below. Note that a company may appear in this list because of
the proportion owned, rather than because it is among the 10 most carbon intensive stocks held.
These companies contribute negatively by -61.65% to the total carbon intensity of the portfolio, with maximum negative contribution of -32.64% by
HeidelbergCement AG.
EXHIBIT 32: TOP 10 CONTRIBUTORS TO CARBON FOOTPRINT (REVENUE METHOD)
Company Name Sector Holding (GBPm)
Carbon Apportioned (tonnes)
Carbon Apportioned (%)
Company CO2e intensity (tonnes/GBPm)
Carbon Footprint Contribution (%)*
CO2e Intensity Rank in Benchmark Sector**
Data Source (Scope 1)
HeidelbergCement AG Materials 1.58 8,070.76 33.41% 5,725.59 -32.64% 3/3 Full Disclosure
Leucadia National Corp (NY) Diversified Financials
2.78 2,532.00 10.48% 756.79 -7.97% 6/6 Modelled
Imperial Oil Ltd Energy 2.12 1,886.48 7.81% 1,167.40 -6.58% 4/4 Full Disclosure
Exxon Mobil Corp Energy 1.94 1,509.29 6.25% 1,137.79 -5.22% 3/4 Full Disclosure
BP Energy 0.95 1,068.60 4.42% 714.52 -3.24% 2/4 Full Disclosure
Phillips 66 Energy 0.94 1,111.36 4.60% 606.25 -3.15% 1/4 Partial Disclosure
Newcrest Mining Ltd Materials 2.43 612.62 2.54% 962.66 -2.03% 2/3 Full Disclosure
Groupe Bruxelles Lambert Diversified Financials
2.31 496.98 2.06% 297.36 -0.70% 5/6 Modelled
TP ICAP Plc Diversified Financials
0.46 2.32 0.01% 15.13 0.12% 2/6 Full Disclosure
Page 31

East Sussex Carbon Footprint February 2018
CARBON FOOTPRINT – AGGREGATE PORTFOLIO
Companies for Engagement
Trucost has identified 10 companies of the aggregated portfolio that do not fully disclose up-to-date data, while contributing negatively to the aggregated
portfolio’s carbon footprint.
These companies are ranked according to the size of their impact on the footprint as estimated, using Trucost’s proprietary environmental profiling model.
Transparency is key to monitor company’s performance and strategy and commitments regarding the environment. The companies in the aggregate portfolio
where engagement may be beneficial are listed in the table below.
EXHIBIT 33: TOP 10 CONTRIBUTORS FOR ENGAGEMENT
Company Name Bond Name Sector Holding (mGBP)
Carbon Apportioned (tonnes)
Carbon Apportioned (%)
Company CO2e intensity (tonnes/mGBP)
Carbon Footprint Contribution (%)
CO2e Intensity Rank in Benchmark Sector
Data Source (Scope 1)
Korea Elec Power Corp Utilities 0.43 6,615.66 1.00% 5,921.09 -0.93% 241/303 Partial Disclosure
Nippon Steel & Sumitomo Metal Corp Materials 0.59 3,890.95 0.59% 3,753.35 -0.53% 513/597 Partial Disclosure
China National Building Material Co. Ltd. - H Shares
Materials 0.12 3,569.52 0.54% 6,519.75 -0.51% 562/597 Modelled
AES Corp Utilities 0.26 3,473.21 0.53% 6,645.42 -0.49% 259/303 Partial Disclosure
Metalurgica Gerdau Materials 0.10 2,912.52 0.44% 4,184.18 -0.40% 527/597 Modelled
Huaneng Power International Inc Utilities 0.10 2,437.60 0.37% 19,066.81 -0.36% 288/303 Partial Disclosure
China Resources Power Holdings Co. Ltd. Utilities 0.11 2,429.83 0.37% 21,188.81 -0.36% 294/303 Partial Disclosure
Cemex SA Materials 0.41 2,369.32 0.36% 5,280.73 -0.33% 551/597 Partial Disclosure
Chubu Electric Power Co Utilities 0.25 2,399.17 0.36% 4,031.42 -0.33% 199/303 Partial Disclosure
Kobe Steel Materials 0.25 2,138.40 0.32% 2,532.79 -0.27% 470/597 Partial Disclosure
Page 32

East Sussex Carbon Footprint February 2018
33
Fossil Fuel Analysis
As of 30th September 2017, East Sussex has invested in 216 companies that derive at least some
revenue from fossil fuel extraction (accounting for 10.02% of total value of holdings).
The aggregate portfolio’s exposure to companies with fossil fuel reserves equates to 9.08% of
total value of holdings.
Total financed future emissions from fossil fuel reserves is approximately 13,613,122 tCO2e or
6,892 tCO2e per million GBP invested.
EXHIBIT 34: EXPOSURE TO EXTRACTIVE INDUSTRIES CHART
EXHIBIT 35: REVENUE BREAKDOWN OF EXTRACTIVES EXPOSURE BY ACTIVITY TYPE
10.02%
2.02%
0.00%
2.00%
4.00%
6.00%
8.00%
10.00%
12.00%
Extractives Exposure(% VOH)
Extractives Exposure(% Apportioned Revenues)
Aggregate Portfolio
7.56%
2.20%
56.62%
15.10%
5.54%
3.89%
9.09%
Bituminous Coal andLignite Surface Mining
Bituminous CoalUnderground Mining
Crude Petroleum andNatural Gas Extraction
Natural GasLiquid Extraction
Drilling Oil andGas Wells
Tar SandsExtraction
Support Activities forOil and Gas Operations
Page 33

34
East Sussex Carbon Footprint February 2018 February 2018
Energy Generation Mix Analysis
The table below shows the key energy generation mix analysis of the aggregated portfolio and
those of the aggregated benchmark.
The energy generation mix assessment is for holdings data as of 30th September 2017.
The proportion of the aggregated holdings covered in the analysis is 96.62%.
EXHIBIT 36: ENERGY GENERATION MIX CHART
AggregatePortfolio
IEA (World)2016
2 Degree Scenario
IEA (World)2025
2 Degree Scenario
IEA (World)2030
2 Degree Scenario
IEA (World)2050
2 Degree Scenario
Other sources (incl. landfill gas) 0.05% 0.05% 0.00% 0.00% 0.00%
Other renewables 5.55% 6.39% 14.60% 22.31% 42.52%
Biomass 1.29% 2.63% 4.65% 5.92% 7.91%
Hydroelectric 9.74% 16.67% 17.84% 18.16% 17.91%
Nuclear 17.70% 11.14% 12.97% 15.06% 16.29%
Fossil energy with CCS 0.00% 0.04% 0.19% 1.62% 8.98%
Natural Gas 33.31% 21.94% 23.07% 21.04% 6.04%
Petroleum 2.97% 3.84% 2.00% 0.96% 0.27%
Coal 29.39% 37.31% 24.68% 14.94% 0.08%
29.39%
37.31%
24.68%
14.94%
0.08%
2.97%
3.84%
2.00%
0.96%
0.27%
33.31%
21.94%
23.07%
21.04%
6.04%
0.00%0.04%
0.19%
1.62%
8.98%
17.70%
11.14%
12.97%
15.06%
16.29%
9.74%
16.67%
17.84%
18.16%
17.91%
1.29%2.63%
4.65%
5.92%
7.91%
5.55% 6.39%
14.60%
22.31%
42.52%
0%
10%
20%
30%
40%
50%
60%
70%
80%
90%
100%
Page 34

February 2018
35
East Sussex Carbon Footprint
APPENDICES
APPENDIX A
Trucost’s approach to calculating carbon footprints of portfolios
The carbon footprint is a measure of the greenhouse gas emissions (GHGs) associated with each portfolio.
This is calculated by allocating GHGs from each constituent company held in the portfolio in proportion to
the client’s equity ownership of that company. The GHGs measured are converted into their carbon dioxide
equivalents (CO2e). The carbon footprint is expressed as metric tons of GHGs emitted by the companies
within the portfolio, per million US Dollars (mUSD) of revenue from holdings. This normalized measure of
carbon performance enables comparison of portfolios and benchmarks, irrespective of the type and size of
the portfolios. The GHGs and revenue allocated to each holding are summed to calculate the overall carbon
footprint of the client’s listed equity holdings.
GHG emissions data for companies analysed are the latest available in Trucost’s database (the Trucost
Environmental Register) – the world’s largest and most comprehensive database of corporate natural
capital impact data covering 93% of global markets by market capitalization. Where companies do not
provide usable data on GHG emissions, Trucost uses its environmentally extended input-output (EEIO)
model to calculate likely emissions based on business activities in 464 sectors.
APPENDIX B
Company Analysis
Trucost maintains the world’s largest database of standardised corporate natural capital impact data.
Trucost’s comprehensive coverage of more than 5,000 companies since 2000 ensures that virtually all
companies in a portfolio or Index are included, not just those that disclose environmental information.
To calculate the carbon emissions of companies included in the study, Trucost reviewed company annual
reports and accounts, environmental/sustainability reports, public disclosures and corporate websites.
However, Trucost might standardise or normalise disclosed data where necessary. Where a company only
discloses data for part of its overall activities, analysts may standardise or normalise quantities in order to
calculate the carbon impacts of the business’s entire operations in line with the Greenhouse Gas Protocol.
Where companies only disclose resource use, such as fuel consumption, this information is used to derive
emissions data where possible.
Page 35

36
Report title here February 2018 East Sussex Carbon Footprint
Trucost uses its environmental profiling model to calculate the environmental impacts of companies that
do not disclose adequate data, as well as the upstream impacts from supply chains. These include GHG
emissions from the production of purchased goods and services, under Scope 3 of the Greenhouse Gas
Protocol. The input-output model examines interactions between 464 sectors to calculate each company’s
likely direct and supply chain environmental impacts. These calculations combine quantitative government
census and survey data on natural resource use through economic interactions between sectors with
information on pollutant releases from national emissions registries. Information on company revenues in
different industries is used to map environmental impacts from business activities.
Environmental profiling using an input-output model, overseen by an academic advisory panel, is a “best
efforts” attempt to understand environmental impacts in the current absence of sufficient and comparable
company disclosures on the environmental impacts of operations and supply chains.
Calculations incorporate disclosed quantitative data on industrial facilities’ actual pollutant releases where
available. Trucost engages with companies so that they have the opportunity to verify their environmental
profiles and provide more information. Analysts quality check any further disclosures made, which are
exclusive to Trucost and further augment the database.
GHG emissions for each company analysed are measured in tonnes of carbon dioxide equivalents (CO2e).
The analysis includes the six GHGs covered by the UN Kyoto Protocol. Each GHG has a different capacity to
cause global warming. Trucost’s conversion of GHGs to CO2e is based on the Global Warming Potential
(GWP) index published by the Intergovernmental Panel on Climate Change, which assesses the effect of the
emissions of different gases over a 100-year time period relative to the emission of an equal mass of CO2.
Where reported, data on GHG emissions from operations and purchased electricity, under Scopes 1 and 2
of the Greenhouse Gas Protocol corporate accounting standard, are included in Trucost’s database.
To limit any issues associated with double counting greenhouse gas emissions, Trucost analysed only the
direct and first-tier indirect emissions for each company. First-tier emissions are emissions purchased
upstream from the company’s direct suppliers. These included purchased electricity and business air travel.
Most companies are not major emitters of direct greenhouse gases and adopting this method ensures that
the study assesses the carbon impacts of business activities – such as extraction, production, transport and
logistics – outsourced to companies excluded from this analysis. In many sectors, indirect greenhouse gas
emissions are greater than their direct emissions. It is important to take into account indirect exposure to
carbon costs as suppliers may pass these on down the value chain.
Page 36

37
Report title here February 2018 East Sussex Carbon Footprint
Company carbon intensity is calculated throughout this report as total direct and first-tier indirect
greenhouse gas emissions per GBP million of revenue, unless stated otherwise. This quantitative approach
enables businesses of different sizes within different industries to be compared.
APPENDIX C
Interpretation of sector allocation & stock selection effects
Attribution analysis identifies drivers of carbon performance relative to a benchmark. Trucost conducts
attribution analysis to identify the effects of sector allocation (based on the GICS sector breakdown) and
stock selection decisions on portfolio carbon footprints relative to the relevant indices selected as their
benchmarks. The sum of these stock and sector allocation effects results in either a positive or negative
overall portfolio carbon efficiency relative to a benchmark.
Where the percentage difference in the carbon efficiency of the portfolio against its benchmark is positive
(indicated by a “+” sign), the portfolio is more carbon efficient than its benchmark. This indicates that the
portfolio has a smaller carbon footprint than this benchmark. Conversely, where the percentage difference
in the carbon efficiency of the portfolio against its benchmark is negative (indicated by a “-” symbol), the
portfolio is more carbon intensive than its benchmark. The portfolio therefore has a larger carbon footprint
than the benchmark index.
Sector allocation effects are based on a combination of the amount of the portfolio’s assets allocated to a
sector relative to the benchmark allocation to that sector in apportioned revenue terms, and the average
carbon intensity of the sector compared to the benchmark’s total footprint. For example, a portfolio
derives 1.92% of its total apportioned turnover from the Oil & Gas sector, whereas the benchmark derives
24.64% of its total apportioned revenue from the oil & gas sector. The benchmark’s total footprint is 664.66
metric tons of CO2e/mUSD, whereas the benchmark’s Oil & Gas sector carbon footprint is 1,382.5 metric
tons of CO2e/mUSD. The Oil & Gas sector allocation effect would therefore be +24.54%:
(1.92%- 24.64%) * (664.66 - 1,382.51)
664.66
The sector is less
carbon efficient than
the benchmark
Portfolio is
underweight the Oil &
Gas sector in revenue
terms
Page 37

38
Report title here February 2018 East Sussex Carbon Footprint
Stock selection effects are based on the average carbon intensity of the companies held in the portfolio,
combined with the holdings per company, compared with the companies present in their sector and their
allocation in the benchmark. Stock selection effects indicate the potential to reduce carbon risk in the
holdings without adjusting sector weightings. The carbon performance of companies directly contributes to
the carbon embedded within portfolio holdings. For example, a portfolio derives 1.92% of its total turnover
from the Oil & Gas sector. The portfolio’s sector carbon footprint is 4,443.62CO2e/ mUSD. The benchmark’s
total footprint is 664.66 metric tons of CO2e/ mUSD and the benchmark’s Oil & Gas sector carbon footprint
is 1,382.5 metric tons of CO2e/ mUSD. The Oil & Gas stock allocation effect would be -8.84%.
1.92% * (1,382.51 – 4,443.62)
664.66
The portfolio invests in less carbon
efficient Oil & Gas companies than
the benchmark
Portfolio derives
1.92% of total
turnover from the Oil
& Gas sector
Page 38
39
Report title here February 2018 East Sussex Carbon Footprint
GLOSSARY
CARBON DISCLOSURE CODE EXPLANATION
Year: All Trucost environmental data is concurrent with the company's financial information and covers the
same reporting period as the accounts. The accounting year given is the balance sheet date.
Benchmark: Standalone or composite index against which a portfolio is compared.
Carbon Disclosure: The source of direct carbon emissions is identified and divided into Trucost estimates
and company disclosures. The flag details the source of data disclosure and whether Trucost had to
perform an adjustment to convert the data into a standardized figure is captured and stated.
Carbon Scope 1 and Direct Emissions (tonnes CO2e): Greenhouse gas emissions generated from burning
fossil fuels and production processes which are owned or controlled by the company (reference: GHG
Protocol).
Carbon First Tier Indirect Emissions (tonnes CO2e): CO2 and other greenhouse gases emitted by the direct
suppliers to a company. The most significant sources are typically purchased electricity (Scope 2 of the GHG
Protocol) and employees' business air travel (reference: GHG Protocol).
Carbon Footprint (tonnes CO2e/GBPm): The direct and first tier indirect GHG emissions apportioned to the
portfolio per million GBP revenue generated by the portfolio. Each holding's contribution to the carbon
footprint of the portfolio is calculated on an equity ownership basis. The carbon footprint of the fund is the
sum of these contributions, normalised by revenue owned.
Carbon Intensity - Direct + First Tier indirect (tonnes CO2e/GBPm): Direct + first tier indirect CO2e
emissions/GBPm for selected company against peer companies and peer group (carbon footprint).
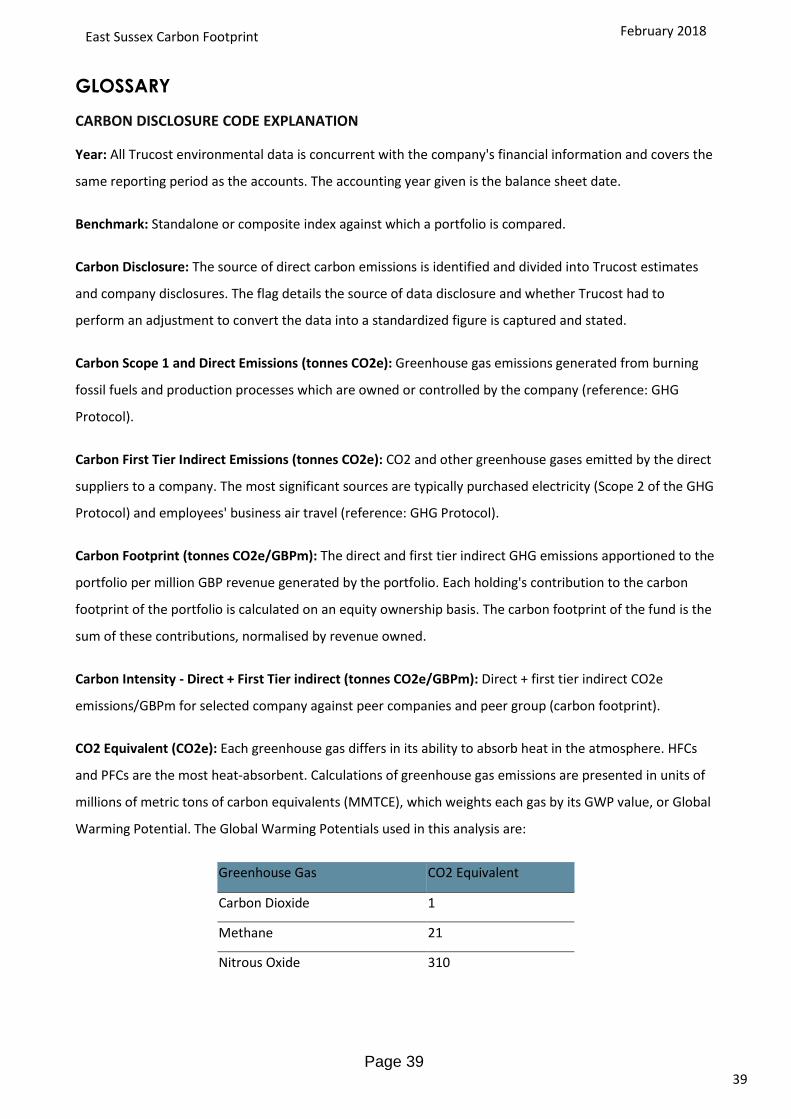
CO2 Equivalent (CO2e): Each greenhouse gas differs in its ability to absorb heat in the atmosphere. HFCs
and PFCs are the most heat-absorbent. Calculations of greenhouse gas emissions are presented in units of
millions of metric tons of carbon equivalents (MMTCE), which weights each gas by its GWP value, or Global
Warming Potential. The Global Warming Potentials used in this analysis are:
Greenhouse Gas CO2 Equivalent
Carbon Dioxide 1
Methane 21
Nitrous Oxide 310
Page 39

40
Report title here February 2018 East Sussex Carbon Footprint
Sulphur Hexaflouride 23,900
Per Fluoro Carbons 7,850
Hydro Flouro Carbons 5,920
See www.unfccc.org for more information about global warming.
Fossil Fuel Reserves: Quantity of fossil fuel not yet extracted.
Financial institutions' revenue: Trucost's approach for calculating the revenue for financial institution
companies is as follows: Revenue is based on the sum of 1) net interest income and 2) non-interest income
reported by the company in a given period. Net interest income is broadly calculated as interest receivable
on loans and advances less interest payable on customer deposits. Non-interest income includes, but is not
limited to, gross fees and commission income, income from trading activities and other operating income
such as share of profit and dividend received from associated companies, and profit or loss on the sale of
non-current assets held for sale. This revenue calculation is intended to reflect the inflow of economic
benefits from the operating activities of a financial institution which could result in environmental
damages.
Financed Emissions per GBPm Invested (tonnes CO2e/GBPm): The direct and first tier indirect GHG
emissions apportioned to the portfolio per million GBP invested in the portfolio. Each holding's
contribution to the apportioned carbon emissions of the portfolio is calculated on an equity ownership
basis. The value for Financed Emissions per GBP m Invested is the sum of these contributions, normalised
by the total AUM of the fund.
GHG: Abbreviation for Greenhouse Gases. Emissions to air that contribute to the greenhouse effect and
global warming. Each greenhouse gas differs in its ability to absorb heat in the atmosphere. HFCs and PFCs
are the most heat-absorbent. Methane traps over 21 times more heat per molecule than carbon dioxide,
and nitrous oxide absorbs 270 times more heat per molecule than carbon dioxide. Often, estimates of
greenhouse gas emissions are presented in units of millions of metric tons of carbon equivalents (MMTCE),
which weights each gas by its GWP value, or Global Warming Potential.
GICS Sector: The Global Industry Classification Standard (GICS®) was developed by MSCI and Standard &
Poor's (S&P) to enhance the investment research and asset management process for financial professionals
worldwide. The GICS structure consists of 10 sectors, 24 industry groups, 67 industries and 156 sub-
industries.
Page 40

41
Report title here February 2018 East Sussex Carbon Footprint
Input-Output Model: In economics, a model used to capture how each business sector inter-depends on its
own and other sectors for the flow of goods and services
ISIN: International Securities Identification Number (ISIN) is a 12 character alpha-numerical code that
uniquely identifies a security listed on a stock exchange.
Sector Carbon Footprint Attribution: Effects of sector allocation and stock allocation in the carbon
footprint attribution of the portfolio relative to its benchmark. The sector allocation effect expresses the
impact of sector weighting on the carbon footprint i.e. whether portfolio under/over performance from a
carbon perspective is due to a higher/lower weight in relative high/low carbon sector with respect to the
benchmark. Stock selection effect expresses the extent to which the portfolio's carbon performance is due
to picking more or less carbon intensive companies within a sector compared to the benchmark. Total
effect is the sum of the stock and sector allocation effects.
Sector Carbon intensity Chart/Table: Analysis of the weighted average carbon intensity (tCO2e/GBPm) in
each sector within the portfolio and the benchmark.
Sector Weighting Chart/Table: Analysis of the relative holdings in each sector within the portfolio and the
benchmark. The benchmark is market capitalisation weighted as per the market capitalisation as of the end
of the month.
Page 41

42
Report title here February 2018 East Sussex Carbon Footprint
REFERENCES
1. International Energy Agency Technology Perspectives 2015 report:
https://www.iea.org/etp/etp2015/.
Page 42
43
Report title here February 2018 East Sussex Carbon Footprint
NOTICE
Copyright © 2017 S&P Trucost Limited (“Trucost”), an affiliate of S&P Dow Jones Indices LLC. All rights
reserved. Redistribution or reproduction in whole or in part is prohibited without written permission. All
information provided by Trucost is impersonal and not tailored to the needs of any person, entity or group
of persons. This publication and related materials are not intended to provide and do not constitute
financial or investment advice.
DISCLAIMER
Copyright © 2017 S&P Trucost Limited (“Trucost”), an affiliate of S&P Dow Jones Indices LLC. All rights
reserved.
This publication and related materials are not intended to provide and do not constitute financial or
investment advice. The information in this publication should not be construed or relied upon in making, or
refraining from making, any investment decisions with respect to a specific company or security or be used
as legal advice. Trucost is not an investment advisor, and Trucost makes no representation regarding the
advisability of investing in any investment fund or other investment vehicle. A decision to invest in any
investment fund or other investment vehicle should not be made in reliance on any of the statements set
forth in this document.
This publication and related materials (“Information”) have been prepared solely for informational
purposes only based upon information generally available to the public from sources believed to be
reliable. The Information may not be reproduced or disseminated in whole or in part without the prior
written permission of Trucost. The information may not be used to verify or correct other data, create
indexes, risk models, or analytics or in connection with issuing, offering, sponsoring, managing, marketing
any securities, portfolios, financial products, or other investment vehicles.
Historical data and analysis should not be taken as an indication or guarantee of any future performance,
analysis, forecast or prediction.
Trucost, its affiliates, or its and their third-party data providers and licensors (collectively “Trucost Parties”)
do not guarantee the accuracy or completeness of the Information. Trucost Parties are not responsible for
any errors or omissions, regardless of the cause, for the results obtained from the use of the Information.
THE TRUCOST PARTIES MAKE NO WARRANTIES OR REPRESENTATIONS, AND, TO THE MAXIMUM EXTENT
PERMITTED BY LAW, EACH TRUCOST PARTY HEREBY EXPRESSLY DISCLAIMS ALL IMPLIED WARRANTIES,
INCLUDING WARRANTIES OR MERCHANTABILITY AND FITNESS FOR A PARTICULAR PURPOSE. WITHOUT
LIMITING ANY OF THE FOREGOING AND TO THE MAXIMUM EXTENT PERMITTED BY LAW, IN NO EVENT
Page 43

44
Report title here February 2018 East Sussex Carbon Footprint
SHALL ANY OF THE TRUCOST PARTIES HAVE ANY LIABILITY REGARDING ANY OF THE INFORMATION FOR
DIRECT, INDIRECT, SPECIAL, PUNITIVE, CONSEQUENTIAL (INCLUDING LOST PROFITS) OR AN OTHER
DAMAGES EVEN IF NOTIFIED OF THE POSSIBILITY OF SUCH DAMAGES. The foregoing shall not exclude or
limit any liability that may not by applicable law be excluded or limited.
‘Trucost’ is the trading name of S&P Trucost Limited a limited company registered in England company
number 3929223 whose registered office is at 20 Canada Square, London E14 5HL, UK.
CONFIDENTIALITY & COPYRIGHT
The information contained in this report is confidential and is submitted by Trucost on the understanding
that it will be used only by your staff and consultants. Where consultants are [self] employed, the use of
this information is restricted to use in relation to your business. In particular, the contents of this report
may not be disclosed in whole or in part to any other party without the prior written consent of Trucost.
Page 44

5133
••••••••••••••••••••••••••••••••••••••••••
Carbon footprint analysis quantifies greenhouse gas emissions (GHG) embeddedwithin the portfolio presenting these as tonnes of carbon dioxide equivalents(tCO2e). Comparing the total GHG emissions of each holding relative to annualrevenue, gives a measure of carbon intensity that enables comparison betweencompanies, irrespective of size or geography.
LGIM Global
The carbon footprint is an analysis of theGHG embedded within the portfolio. Thisis achieved by carrying out a carbonfootprint for each individual holdingencapsulating both direct and first tierindirect impacts.
Direct emissions result from a company’sown operations and include GHGemissions from boilers and company
owned vehicles, emissions from anymanufacturing operations and wasteproduced.
First tier indirect impacts, also termedsupply chain impacts, occur because ofthe goods or services a companyprocures. This includes purchasedelectricity, business travel and logistics.
Each holding’s contribution to the carbon footprint of the portfolio is calculated onan equity ownership basis. The carbon footprint of the fund is the sum of thesecontributions, normalised by revenue owned.
PORTFOLIO: LGIM Global
BENCHMARK: FTSE All World Index
DATE OF HOLDINGS: September 30, 2017
DATE OF ANALYSIS: April 19, 2018
CONTENTS
summary information 2
detailed findings 3
sector analysis 4
sector allocation & stockselection effect 5
largest carboncontributors to theportfolio's carbonfootprint 6
environmental skylinesfor largest twocontributors 7
company reportingassessment 8
detailed data forcompanies in yourportfolio 9
next steps 93
legal disclaimer 94
Page 45
Appendix 2

5133
The portfolio is 0.04% more carbonintensive than its benchmark, FTSE AllWorld Index.
To give context to thecarbon performance, theportfolio has beencompared to some keyindices.
Carbon has beenassessed based on anaverage annual price of£27
The price of carbon usedin the Trucost model isbased on academicresearch into the externaldamage costs of carbonemissions.
Carbon footprint analysis was carried out on 19 April 2018 for holdings data as at 30September 2017. The benchmark used for this analysis was the FTSE All World Index.
Value ofHoldings
(£ mn)Total Footprint(tCO2e/£mn)
Number ofCompanies
Total CarbonEmissions(tCO2e)
Portfolio 153,850 439.412,968 569.01
Benchmark 153,126 439.213,061 569.01
carbon exposure relative to benchmarks
Carbon Footprint
The carbon footprint of the portfolio is 439.41 compared to the benchmark which is 439.21.
CARBON FOOTPRINT
Carbon Footprintanalysis measures thecarbon risks andopportunities notcaptured by standardportfolio analysis andpresents a systematicassessment of carbonimpacts relative to yourbenchmark
The portfolio is 0.04% more carbon intensive than FTSE All World Index benchmark.
KEY FINDINGS
This efficiency is due to a combination of 0.97% negative sector allocation effects and 0.92%positive stock selection effects.
In aggregate the carbon exposure of the fund is equivalent to 1.02% of the aggregate turnoverof the fund.
LGIM GlobalC
arbo
n Fo
otpr
int
Summary Information1
Source: Trucost
www.trucost.com Copyright © 2018 S&P Trucost Limited, an affiliate of S&P Dow Jones Indices LLC-2-
Page 46

5133
The two principal reasons why the carbon exposure of the portfolio may differ from the benchmark are due to sector allocationdecisions and stock allocation decisions.
Carbon Footprint Attribution
Portfolio BenchmarkSector
AllocationStock
Selection Total Effect
Carbon Intensity(tCO2e/£mn revenue)
Sector Weighting
Portfolio
Benchmark
Summary of Stock and Sector Allocation Effects
PortfolioConsumer Discretionary 12.05 % 12.02 % 113.31 112.88 0.00 % -0.02 % -0.02 %-0.02 %
Consumer Staples 8.88 % 8.88 % 261.57 261.40 -0.01 % -0.00 % -0.01 %-0.01 %
Energy 6.29 % 6.02 % 976.25 1,000.99 -0.83 % 0.49 % -0.35 %-0.35 %
Financials 19.06 % 19.39 % 38.75 38.07 -0.39 % -0.03 % -0.42 %-0.42 %
Health Care 10.93 % 10.92 % 50.75 50.81 -0.01 % 0.00 % -0.01 %-0.01 %
Industrials 11.11 % 11.08 % 285.60 285.04 -0.02 % -0.02 % -0.03 %-0.03 %
Information Technology 16.86 % 16.83 % 102.19 102.04 -0.02 % -0.00 % -0.03 %-0.03 %
Materials 5.48 % 5.50 % 1,702.70 1,716.23 0.19 % 0.20 % 0.39 %
Real Estate 3.06 % 3.05 % 141.67 142.74 -0.00 % 0.00 % 0.00 %
Telecommunication Services 3.15 % 3.17 % 78.47 78.54 -0.02 % 0.00 % -0.02 %-0.02 %
Utilities 3.12 % 3.12 % 3,084.93 3,115.22 0.14 % 0.30 % 0.45 %
100.00 % 100.00 % 439.41 439.21 -0.97 % 0.92 % -0.04 %Total
The portfolio is 0.04% more carbon intensive than the benchmark.
The stock selection results in the portfolio being 0.92% more carbon efficient than the benchmark.
This is offset by the sector allocation however, which is 0.97% more carbon intensive than the benchmark.
In aggregate, the two sectors that have the greatest positive effect on carbon efficiency are Utilities and Materials, whichtogether contribute 0.84% of the increased carbon efficiency. The two worst performing sectors in the portfolio areFinancials and Energy, which contribute to 0.77% of reduced carbon efficiency.
Sector allocation decisions will cause the carbon intensity of the portfolio to diverge markedly from the benchmark where thesector/s are either carbon intensive or low carbon. If the portfolio is overweight in carbon intensive sectors the portfolio islikely to be more carbon intensive than the benchmark.
However, if the stocks within a carbon intensive sector are the most carbon efficient companies, it is possible that the portfoliomay still have a lower carbon footprint than the benchmark.
Trucost has developed a carbon optimisation product that can help minimise the carbon footprint associated with a portfolio.For more information, please go to http://www.trucost.com/investments
Detailed Findings2
www.trucost.com Copyright © 2018 S&P Trucost Limited, an affiliate of S&P Dow Jones Indices LLC-3-
Page 47

5133
Benchmark
Portfolio
The graphs below show how the sector allocation in the portfolio differs from that in the benchmark and the effect on theCarbon Footprint of the fund. The four sectors that contribute the highest levels of carbon intensity to the portfolio are Utilities(3,085 tCO2e/£mn), Materials (1,703 tCO2e/£mn), Energy (976 tCO2e/£mn), and Industrials (286 tCO2e/£mn). Sectors havebeen defined using the Global Industry Classification Standard (GICS) system.
Sector Analysissector weighting of portfolio and benchmark in % terms
sect
or w
eig
htin
g (
%)
Source: Trucost
Benchmark
PortfolioCarbon Footprint Of Portfolio and Benchmarkby sector (tCO2e/£mn revenue)
foot
prin
t (tC
O2e
/£m
n re
venu
e)
Source: Trucost
Sector Analysis3
www.trucost.com Copyright © 2018 S&P Trucost Limited, an affiliate of S&P Dow Jones Indices LLC-4-
Page 48
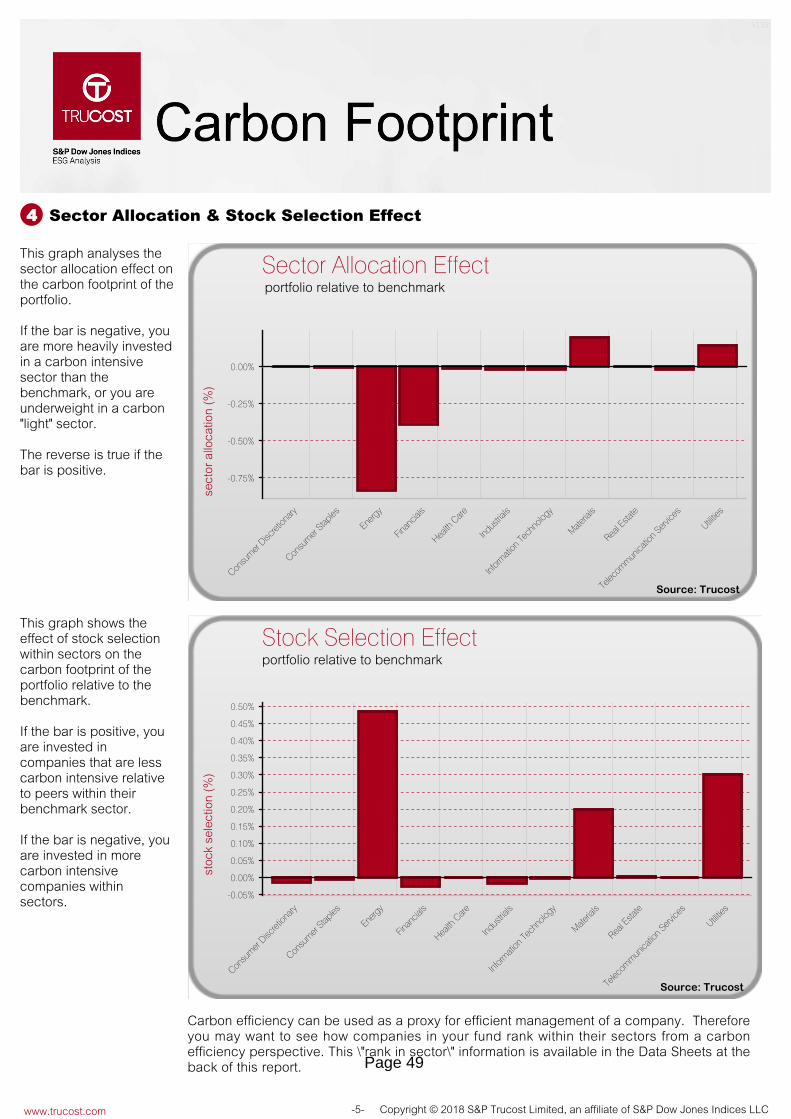
5133
Sector Allocation Effect
sect
or a
lloca
tion
(%)
portfolio relative to benchmark
This graph analyses thesector allocation effect onthe carbon footprint of theportfolio.
If the bar is negative, youare more heavily investedin a carbon intensivesector than thebenchmark, or you areunderweight in a carbon"light" sector.
The reverse is true if thebar is positive.
Source: Trucost
Carbon efficiency can be used as a proxy for efficient management of a company. Thereforeyou may want to see how companies in your fund rank within their sectors from a carbonefficiency perspective. This \"rank in sector\" information is available in the Data Sheets at theback of this report.
Stock Selection Effectportfolio relative to benchmark
stoc
k se
lect
ion
(%)
This graph shows theeffect of stock selectionwithin sectors on thecarbon footprint of theportfolio relative to thebenchmark.
If the bar is positive, youare invested incompanies that are lesscarbon intensive relativeto peers within theirbenchmark sector.
If the bar is negative, youare invested in morecarbon intensivecompanies withinsectors.
Source: Trucost
Sector Allocation & Stock Selection Effect4
www.trucost.com Copyright © 2018 S&P Trucost Limited, an affiliate of S&P Dow Jones Indices LLC-5-
Page 49

5133
Largest Contributors to Portfolio's Carbon Footprint
The ten companies that contribute the most to the portfolio’s carbon footprint are shown below. Note that a company mayappear due to the proportion owned, rather than because it is the most carbon intensive stock held. The rank in benchmarksector column is very useful in assessing the carbon intensity of your top ten contributors relative to their peers.
Company NameHolding(£ mn)
Carbon Apportioned
Tonnes (%)
CarbonIntensity
(tCO2e/£mn)
CarbonFootprint
Contribution(%)*
FootprintRank in
BenchmarkSector**
DataSource***
LafargeHolcim Ltd CDP277 / 292-1.56 %8,3111.64%2,5300.365
Exxon Mobil Corp CDP103 / 150-1.43 %1,1382.31%3,5494.565
RWE AG ENV*93 / 158-1.35 %3,8841.52%2,3420.151
ArcelorMittal Inc CDP254 / 292-1.28 %4,5871.42%2,1800.203
American Electric Power CDP137 / 158-1.27 %8,7861.33%2,0530.454
Southern Co ENV*128 / 158-1.13 %6,5931.21%1,8630.642
Gazprom PJSC ENV*142 / 150-1.11 %3,2021.28%1,9730.286
Duke Energy Corp CDP113 / 158-1.11 %5,6741.20%1,8420.772
Korea Elec Power Corp PRE120 / 158-1.04 %5,9211.12%1,7220.113
Tokyo Electric Power Co. Holding Inc. CDP84 / 158-0.96 %2,8491.13%1,7370.084
-12.23 %Total 7.634 21,791 14.16%
* The Carbon Footprint Contribution is the percentage decrease in performance between what the Carbon Footprint of the portfolio would be without theholding and what the Carbon Footprint is currently. This is a measurement of how much a specific holding reduces the carbon performance of the portfolio.
*** See table below for definitions of the Data Source.
** Footprint Rank in Benchmark Sector - A ranking of one indicates that the stock has the lowest carbon footprint among the stocks in the benchmark sector.An entry of N/A indicates that the stock is not a member of the benchmark.
Code Explanation
Carbon FootprintData Source Definitions
Exact Value from Annual Report/10K/Financial Accounts DisclosureARValue derived from data provided in Annual Report/Financial Accounts DisclosureAR*Exact Value from CDPCDPValue derived from data provided in CDPCDP*Exact Value from Environmental/CSRENVValue derived from data provided in Environmental/CSRENV*Exact Value from personal communicationOTHValue derived from personal communicationOTH*Estimate scaled according to company-specific dataPDDDerived from previous yearPREData Calculated by TrucostTCEstimate derived from production dataTC*
Largest Carbon Contributors to the Portfolio's Carbon Footprint5
www.trucost.com Copyright © 2018 S&P Trucost Limited, an affiliate of S&P Dow Jones Indices LLC-6-
Page 50

5133
The two charts below look at each company's environmental skyline across six broad environmental groups (GreenhouseGases, Water, Waste, Land & Water Pollutants, Air Pollutants, Natural Resource Use) relative to its benchmark sector.
The largest contributors to the carbon footprint of the portfolio are LafargeHolcim Ltd and Exxon Mobil Corp.
Environmental Skylines for Largest Two Contributors6
Direct environmental impactsare displayed (red bar) aswell as those containedwithin the first-tier of thesupply chain (grey bar).
The overall performanceacross the six environmentalgroups has been assessedrelative to the sectorbenchmark for bothcompanies. Businessactivities are analysedaccording to the NorthAmerican IndustryClassification (NAICS) 3-digitcode.
The red line denotes theaverage direct and supplychain impact for all theorganisations that share thisorganisation's primarybusiness activity.
A bar above the red lineindicates that thisorganisation is moreenvironmentally intensive perunit of revenue generatedthan the benchmark sectorfor that particularenvironmental impact.
Environmental SkylineLafargeHolcim LtdFY 2016
Based on a global benchmark for Nonmetallic Mineral Product Manufacturing sector of92 organisations.
Direct Impacts Supply Chain Impact
Env
ironm
enta
l Im
pac
t Rel
ativ
e to
Sec
tor
Ave
rag
e (%
)
Position in Benchmark
67 / 92
Source: Trucost
Environmental SkylineExxon Mobil CorpFY 2016
Based on a global benchmark for Petroleum and Coal Products Manufacturing sectorof 65 organisations.
Direct Impacts Supply Chain Impact
Env
ironm
enta
l Im
pac
t Rel
ativ
e to
Sec
tor
Ave
rag
e (%
)
Position in Benchmark
39 / 65
Source: Trucost
www.trucost.com Copyright © 2018 S&P Trucost Limited, an affiliate of S&P Dow Jones Indices LLC-7-
Page 51

5133
In order to rank stocks for engagement purposes we have identified five companies which do not disclose up-to-date data.These companies are ranked according to the size of their impact on your footprint as estimated by Trucost, using our uniqueenvironmental profiling model.
Not all companies report in a way considered best practice. The five companies in your portfolio we would draw your attentionto, where engagement may be beneficial, are listed in the table below.
Company Reporting AssessmentPortfolio
Company NameHolding(£ mn)
Carbon Apportioned
Tonnes (%)
CarbonIntensity
(tCO2e/£mn)
CarbonFootprint
Contribution(%)*
FootprintRank in
BenchmarkSector**
DataSource***
Company Reporting Assessment7
Korea Elec Power Corp PRE120 / 158-1.04 %5,9211.12%1,7220.113
China Resources Power Holdings Co. Ltd. PRE149 / 158-0.63 %21,1890.65%9940.044
China National Building Material Co. Ltd. - H Shares TC269 / 292-0.50 %6,5200.54%8270.029
PPL Corp PRE112 / 158-0.36 %5,6520.39%6020.339
Dominion Energy Inc PRE89 / 158-0.35 %3,6670.40%6120.647
Total 4,7571.171 3.09% -2.88 %
*** Definitions of the Data Sources may be found in section 5 of this report.
** Footprint rank in benchmark sector - A ranking of one indicates that the stock has the lowest carbon footprint among the stocks in the benchmark sector.An entry of N/A indicates that the stock is not a member of the benchmark.
* The Carbon Footprint Contribution is the percentage decrease in performance between what the Carbon Footprint of the portfolio would be without theholding and what the Carbon Footprint is currently. This is a measurement of how much a specific holding reduces the carbon performance of the portfolio.
www.trucost.com Copyright © 2018 S&P Trucost Limited, an affiliate of S&P Dow Jones Indices LLC-8-
Page 52

5133
The following table shows how each company contributes to the overall portfolio footprint. It allows you to see which stocks arethe greatest contributors to your portfolio’s CO2e emissions in absolute terms as well as helping you to understand how yourowned stocks compare on a sector by sector basis with other stocks in the benchmark. This will help in managing your overallfootprint without compromising your sector allocations. Further detail and regular updates are available from Trucost.
Detailed Data for Companies in your Portfolio8
Company BreakdownPortfolio
Company details
Weighting
Portfolio Benchmark
Carbon Apportioned
Tonnes CO2e
% ofPortfolio's
Total CarbonApportioned
CarbonIntensity
(tCO2e/£mn)
CarbonFootprint
Contribution(%)*
FootprintRank in
BenchmarkSector **
DataSource
***
13.72 %6,192 4.02 %12.02 %12.05 % 113Consumer Discretionary
0.00 % 0.00 % 1 TC145 / 4450.00 %680.00 %ABC-Mart Inc
0.02 % 0.02 % 19 AR*443 / 445-0.01 %1,3170.01 %Accor
0.00 % 0.00 % 1 TC258 / 4450.00 %1030.00 %Adastria Holdings Co Ltd
0.10 % 0.10 % 18 CDP132 / 4450.07 %640.01 %Adidas AG
0.02 % 0.02 % 55 TC379 / 4450.03 %2380.04 %Adient Inc.
0.02 % 0.02 % 13 TC294 / 4450.02 %1230.01 %Advance Auto Parts Inc
0.02 % 0.02 % 63 CDP413 / 4450.02 %3130.04 %Aisin Seiki Co
0.00 % 0.00 % 0 TC48 / 4450.00 %280.00 %Alibaba Pictures Group Ltd
0.00 % 0.00 % 4 AR352 / 4450.00 %2070.00 %Alsea SA
0.03 % 0.03 % 5 TC57 / 4450.04 %320.00 %Altice SA
0.88 % 0.88 % 133 TC184 / 4450.37 %830.09 %Amazon.com Inc
0.01 % 0.01 % 2 TC339 / 4450.00 %1660.00 %ANTA Sports Products Ltd.
0.00 % 0.00 % 2 TC270 / 4450.00 %1080.00 %Aoyama Trading Co
0.06 % 0.06 % 26 CDP277 / 4450.05 %1110.02 %Aptiv plc
0.02 % 0.02 % 28 TC327 / 4450.03 %1550.02 %Aramark
0.00 % 0.00 % 5 TC360 / 4450.00 %2200.00 %Arcelik Co
0.02 % 0.02 % 1 TC133 / 4450.01 %640.00 %Aristocrat Leisure Ltd
0.01 % 0.01 % 3 CDP152 / 4450.01 %700.00 %Asics Corp
0.00 % 0.00 % 1 TC253 / 4450.00 %1030.00 %Askul Corp
0.03 % 0.03 % 56 ENV*436 / 445-0.01 %5850.04 %Astra International Tbk PT
0.00 % 0.00 % 0 TC31 / 4450.00 %210.00 %Astro Malaysia Holdings Bhd
0.00 % 0.00 % 1 TC212 / 4450.00 %910.00 %Autobacs Seven Co
0.02 % 0.02 % 33 AR*376 / 4450.02 %2310.02 %Autoliv Inc
0.01 % 0.01 % 21 TC255 / 4450.05 %1030.01 %AutoNation Inc
0.04 % 0.04 % 16 TC276 / 4450.03 %1100.01 %AutoZone Inc
0.01 % 0.01 % 1 CDP119 / 4450.01 %590.00 %Axel Springer SE
0.00 % 0.00 % 3 TC103 / 4450.01 %550.00 %BAIC Motor Corporation Ltd - H share
0.01 % 0.01 % 4 TC417 / 4450.00 %3320.00 %Bajaj Auto Ltd
www.trucost.com Copyright © 2018 S&P Trucost Limited, an affiliate of S&P Dow Jones Indices LLC-9-
Page 53

5133
Company BreakdownPortfolio
Company details
Weighting
Portfolio Benchmark
Carbon Apportioned
Tonnes CO2e
% ofPortfolio's
Total CarbonApportioned
CarbonIntensity
(tCO2e/£mn)
CarbonFootprint
Contribution(%)*
FootprintRank in
BenchmarkSector **
DataSource
***
0.02 % 0.02 % 7 PRE306 / 4450.01 %1360.00 %Bandai Namco Holdings Inc
0.02 % 0.02 % 7 CDP197 / 4450.02 %870.00 %Barratt Developments
0.09 % 0.09 % 45 CDP94 / 4450.21 %540.03 %Bayer Motoren Werke AG (BMW)
0.00 % 0.00 % 0 TC15 / 4450.00 %190.00 %BEC World PCL
0.01 % 0.01 % 18 TC289 / 4450.03 %1180.01 %Bed Bath & Beyond Inc
0.01 % 0.01 % 4 ENV*207 / 4450.01 %890.00 %Bellway
0.01 % 0.01 % 1 CDP16 / 4450.01 %190.00 %Benesse Holdings Inc
0.00 % 0.00 % 1 TC128 / 4450.00 %610.00 %Berjaya Sports Toto Bhd
0.01 % 0.01 % 3 CDP226 / 4450.01 %950.00 %Berkeley Group Holdings Plc
0.03 % 0.03 % 19 CDP83 / 4450.11 %440.01 %Best Buy Co Inc
0.00 % 0.00 % 5 CDP442 / 445-0.00 %8860.00 %Bharat Forge Ltd
0.00 % 0.00 % 8 TC229 / 4450.02 %950.00 %BIC CAMERA
0.01 % 0.01 % 1 TC76 / 4450.01 %380.00 %Block H & R Inc
0.00 % 0.00 % 0 TC325 / 4450.00 %1550.00 %Bloomberry Resorts Corp.
0.21 % 0.21 % 4 TC45 / 4450.04 %270.00 %Booking Holdings Inc
0.02 % 0.02 % 29 CDP*372 / 4450.02 %2280.02 %Borgwarner Inc
0.01 % 0.01 % 1 TC394 / 4450.00 %2630.00 %Bosch Ltd
0.00 % 0.00 % 1 TC303 / 4450.00 %1350.00 %Bosideng International Holdings Ltd.
0.07 % 0.07 % 99 CDP404 / 4450.03 %2940.06 %Bridgestone Corp
0.02 % 0.02 % 0 TC101 / 4450.00 %550.00 %Brilliance China Automotive Holdings Ltd.
0.02 % 0.02 % 2 CDP80 / 4450.01 %420.00 %Burberry Group
0.01 % 0.01 % 5 TC272 / 4450.01 %1090.00 %BYD Co. Ltd. - H Shares
0.00 % 0.00 % 2 ENV*386 / 4450.00 %2470.00 %Cafe de Coral Holdings Ltd.
0.02 % 0.02 % 4 CDP52 / 4450.03 %300.00 %Canadian Tire Corporation Limited
0.00 % 0.00 % 0 PRE8 / 4450.01 %160.00 %Canon Marketing Japan Inc
0.03 % 0.03 % 22 TC286 / 4450.04 %1160.01 %Carmax Inc
0.09 % 0.09 % 150 CDP440 / 445-0.05 %8340.10 %Carnival Plc
0.01 % 0.01 % 3 CDP230 / 4450.01 %950.00 %Casio Computer Co
0.05 % 0.05 % 5 TC53 / 4450.04 %310.00 %CBS Corp
0.00 % 0.00 % 1 TC211 / 4450.00 %910.00 %CCC SA
0.16 % 0.16 % 6 TC20 / 4450.08 %190.00 %Charter Communications Inc A
0.00 % 0.00 % 0 PRE3 / 4450.01 %120.00 %Cheil Worldwide Inc
0.01 % 0.01 % 9 TC403 / 4450.00 %2920.01 %Cheng Shin Rubber Industry
0.00 % 0.00 % 0 TC147 / 4450.00 %680.00 %China Dongxiang (Group) Co Ltd
0.00 % 0.00 % 0 TC100 / 4450.00 %550.00 %China Motor Co
0.00 % 0.00 % 0 TC218 / 4450.00 %920.00 %China Travel International Investment Hong
www.trucost.com Copyright © 2018 S&P Trucost Limited, an affiliate of S&P Dow Jones Indices LLC-10-
Page 54

5133
Company BreakdownPortfolio
Company details
Weighting
Portfolio Benchmark
Carbon Apportioned
Tonnes CO2e
% ofPortfolio's
Total CarbonApportioned
CarbonIntensity
(tCO2e/£mn)
CarbonFootprint
Contribution(%)*
FootprintRank in
BenchmarkSector **
DataSource
***
0.02 % 0.02 % 8 TC319 / 4450.01 %1520.00 %Chipotle Mexican Grill Inc.
0.00 % 0.00 % 1 TC105 / 4450.01 %550.00 %Chongqing Changan Automobile Co Ltd
0.00 % 0.00 % 1 TC279 / 4450.00 %1120.00 %Chow Tai Fook Jewellery Group Ltd
0.01 % 0.01 % 3 AR169 / 4450.01 %780.00 %Christian Dior SE
0.42 % 0.42 % 43 CDP74 / 4450.30 %370.03 %Comcast Corp
0.08 % 0.08 % 19 CDP93 / 4450.09 %520.01 %Compass Group
0.06 % 0.06 % 84 CDP382 / 4450.04 %2450.05 %Continental AG
0.01 % 0.01 % 4 CDP350 / 4450.00 %2040.00 %Coway Co Ltd
0.01 % 0.01 % 2 CDP249 / 4450.00 %1010.00 %Crown Resorts Ltd
0.01 % 0.01 % 0 TC65 / 4450.00 %340.00 %Ctrip.com International ADR
0.01 % 0.01 % 1 TC62 / 4450.01 %330.00 %Cyber Agent Ltd
0.00 % 0.00 % 0 TC23 / 4450.00 %200.00 %Cyfrowy Polsat SA
0.00 % 0.00 % 1 TC282 / 4450.00 %1130.00 %DAIICHIKOSHO CO LTD
0.01 % 0.01 % 2 AR*114 / 4450.01 %570.00 %Daily Mail & General Trust
0.17 % 0.18 % 117 CDP98 / 4450.54 %540.08 %Daimler AG
0.02 % 0.02 % 24 PRE409 / 4450.01 %3050.02 %Darden Restaurants Inc
0.00 % 0.00 % 0 TC254 / 4450.00 %1030.00 %Delek Automotive Systems Ltd
0.06 % 0.06 % 65 PRE365 / 4450.04 %2260.04 %Denso Co
0.02 % 0.02 % 7 CDP5 / 4450.14 %140.00 %Dentsu Inc
0.02 % 0.02 % 2 TC27 / 4450.03 %210.00 %Discovery, Inc
0.03 % 0.03 % 2 TC21 / 4450.03 %190.00 %DISH Network Corp
0.01 % 0.01 % 5 CDP58 / 4450.04 %320.00 %Dixons Carphone Plc
0.05 % 0.05 % 25 TC242 / 4450.06 %990.02 %Dollar General Corp
0.05 % 0.05 % 19 TC247 / 4450.04 %1010.01 %Dollar Tree Inc
0.03 % 0.03 % 2 TC243 / 4450.01 %990.00 %Dollarama Inc
0.01 % 0.01 % 1 TC334 / 4450.00 %1630.00 %Domino's Pizza Enterprises Ltd
0.02 % 0.02 % 5 TC312 / 4450.01 %1450.00 %Domino's Pizza Inc
0.01 % 0.01 % 6 TC224 / 4450.01 %940.00 %Don Quijote Holdings Co Ltd
0.01 % 0.01 % 5 TC95 / 4450.02 %540.00 %Dongfeng Motor Group Co. Ltd. - H Shares
0.01 % 0.01 % 6 TC181 / 4450.02 %830.00 %Dufry AG
0.00 % 0.00 % 0 TC176 / 4450.00 %810.00 %DXB Entertainment PJSC
0.01 % 0.01 % 2 TC375 / 4450.00 %2310.00 %Eclat Textile Co Ltd
0.00 % 0.00 % 1 TC196 / 4450.00 %870.00 %El Puerto de Liverpool SAB de CV
0.02 % 0.02 % 32 CDP359 / 4450.02 %2170.02 %Electrolux AB
0.01 % 0.01 % 11 TC333 / 4450.01 %1590.01 %Elior Group
0.00 % 0.00 % 1 ENV*54 / 4450.01 %310.00 %Esprit Holdings Ltd.
www.trucost.com Copyright © 2018 S&P Trucost Limited, an affiliate of S&P Dow Jones Indices LLC-11-
Page 55

5133
Company BreakdownPortfolio
Company details
Weighting
Portfolio Benchmark
Carbon Apportioned
Tonnes CO2e
% ofPortfolio's
Total CarbonApportioned
CarbonIntensity
(tCO2e/£mn)
CarbonFootprint
Contribution(%)*
FootprintRank in
BenchmarkSector **
DataSource
***
0.01 % 0.01 % 2 TC356 / 4450.00 %2130.00 %Estacio Participacoes S.A.
0.01 % 0.01 % 1 TC68 / 4450.00 %340.00 %Eutelsat Communications Promesses
0.00 % 0.00 % 4 ENV*390 / 4450.00 %2550.00 %Exedy Corp
0.00 % 0.00 % 1 TC378 / 4450.00 %2330.00 %Exide Industries Ltd
0.04 % 0.04 % 3 TC66 / 4450.03 %340.00 %Expedia Group, Inc.
0.00 % 0.00 % 2 AR*268 / 4450.00 %1060.00 %Fairfax Media Ltd
0.00 % 0.00 % 1 AR*408 / 4450.00 %3010.00 %Famous Brands
0.04 % 0.03 % 7 ENV*148 / 4450.02 %690.00 %Fast Retailing Co
0.01 % 0.01 % 42 ENV*363 / 4450.03 %2220.03 %Faurecia
0.00 % 0.00 % 3 ENV*373 / 4450.00 %2290.00 %Feng Tay Enterprise
0.03 % 0.03 % 1 TC104 / 4450.01 %550.00 %Ferrari NV
0.00 % 0.00 % 1 TC223 / 4450.00 %940.00 %FF Group (Folli Follie)
0.04 % 0.04 % 83 CDP192 / 4450.22 %860.05 %Fiat Chrysler Automobiles NV
0.01 % 0.00 % 1 TC198 / 4450.00 %870.00 %Fielmann AG
0.00 % 0.00 % 1 TC73 / 4450.00 %370.00 %Flight Centre Travel Group Ltd
0.01 % 0.01 % 10 TC260 / 4450.02 %1040.01 %Foot Locker Inc
0.11 % 0.11 % 142 CDP142 / 4450.51 %670.09 %Ford Motor Co
0.00 % 0.00 % 1 CDP149 / 4450.00 %700.00 %Ford Otomotive Sanayii AS
0.00 % 0.00 % 6 CDP433 / 445-0.00 %5410.00 %Formosa Taffeta Co Ltd
0.00 % 0.00 % 0 PRE10 / 4450.01 %170.00 %Fuji Television Network Inc
0.00 % 0.00 % 3 TC362 / 4450.00 %2220.00 %Fujitsu General
0.00 % 0.00 % 4 TC437 / 445-0.00 %6090.00 %FuYao Glass Industry Group Co Ltd
0.03 % 0.03 % 8 TC341 / 4450.01 %1760.01 %Galaxy Entertainment Group Ltd.
0.02 % 0.02 % 9 CDP167 / 4450.03 %770.01 %Gap Inc
0.01 % 0.01 % 2 TC144 / 4450.01 %680.00 %Garmin Ltd
0.03 % 0.03 % 5 ENV*171 / 4450.01 %790.00 %Geely Automobile Holdings Ltd.
0.12 % 0.12 % 188 CDP202 / 4450.50 %880.12 %General Motors Company
0.01 % 0.01 % 6 PRE383 / 4450.00 %2450.00 %Gentex Corp
0.01 % 0.01 % 31 TC441 / 445-0.01 %8750.02 %Genting Bhd
0.01 % 0.01 % 1 ENV138 / 4450.00 %660.00 %Genting Malaysia Bhd
0.01 % 0.01 % 1 ENV*221 / 4450.00 %940.00 %Genting Singapore Plc
0.03 % 0.03 % 13 TC123 / 4450.05 %600.01 %Genuine Parts Co
0.00 % 0.00 % 6 TC405 / 4450.00 %2950.00 %Giant Mfg Co
0.02 % 0.02 % 44 CDP397 / 4450.02 %2670.03 %GKN
0.00 % 0.00 % 2 TC150 / 4450.01 %700.00 %Global Brands Group Holding
0.00 % 0.00 % 0 TC193 / 4450.00 %860.00 %Golden Eagle Retail Group Ltd.
www.trucost.com Copyright © 2018 S&P Trucost Limited, an affiliate of S&P Dow Jones Indices LLC-12-
Page 56

5133
Company BreakdownPortfolio
Company details
Weighting
Portfolio Benchmark
Carbon Apportioned
Tonnes CO2e
% ofPortfolio's
Total CarbonApportioned
CarbonIntensity
(tCO2e/£mn)
CarbonFootprint
Contribution(%)*
FootprintRank in
BenchmarkSector **
DataSource
***
0.00 % 0.00 % 15 PRE313 / 4450.02 %1460.01 %GOME Retail Holdings Ltd
0.02 % 0.02 % 77 CDP419 / 4450.01 %3570.05 %Goodyear Tire & Rubber Co
0.00 % 0.00 % 0 CDP77 / 4450.00 %390.00 %Grandvision B.V.
0.01 % 0.01 % 4 TC156 / 4450.01 %710.00 %Great Wall Motor Co. Ltd. - H Shares
0.03 % 0.03 % 2 CDP61 / 4450.02 %330.00 %Grupo Televisa SAB
0.01 % 0.01 % 2 TC126 / 4450.01 %610.00 %Guangzhou Automobile Group
0.00 % 0.00 % 7 TC248 / 4450.01 %1010.00 %H2O Retailing Corp
0.01 % 0.01 % 6 TC210 / 4450.01 %910.00 %Haier Electronics Group Co Ltd
0.01 % 0.01 % 3 TC79 / 4450.02 %420.00 %Hakuhodo DY Holdings
0.02 % 0.02 % 7 CDP191 / 4450.02 %860.00 %Hanesbrands Inc
0.01 % 0.01 % 20 CDP425 / 4450.00 %4090.01 %Hankook Tire Co Ltd/New
0.00 % 0.00 % 5 CDP380 / 4450.00 %2420.00 %Hanon Systems
0.00 % 0.00 % 1 TC291 / 4450.00 %1200.00 %Hanssem Co Ltd
0.02 % 0.02 % 21 ENV*381 / 4450.01 %2440.01 %Harley-Davidson Inc
0.00 % 0.00 % 2 PRE348 / 4450.00 %2030.00 %Harvey Norman Hldgs Ltd
0.03 % 0.03 % 6 CDP241 / 4450.01 %990.00 %Hasbro Inc
0.01 % 0.01 % 10 TC302 / 4450.02 %1340.01 %Haseko Corp
0.00 % 0.00 % 2 TC329 / 4450.00 %1560.00 %Heiwa Corp
0.01 % 0.01 % 6 TC342 / 4450.01 %1850.00 %HELLA GmbH & Co. KGaA
0.00 % 0.00 % 0 TC273 / 4450.00 %1090.00 %HengTen Networks Group Ltd
0.06 % 0.06 % 10 CDP106 / 4450.05 %550.01 %Hennes & Mauritz AB B
0.04 % 0.04 % 5 TC358 / 4450.00 %2170.00 %Hermes Intl
0.01 % 0.01 % 9 PRE415 / 4450.00 %3140.01 %Hero Motocorp Ltd
0.01 % 0.01 % 2 TC157 / 4450.01 %720.00 %Hikari Tsushin Inc
0.03 % 0.03 % 28 CDP399 / 4450.01 %2710.02 %Hilton Worldwide Holdings Inc
0.00 % 0.00 % 2 TC90 / 4450.01 %510.00 %HIS Co Ltd
0.45 % 0.45 % 73 CDP136 / 4450.27 %650.05 %Home Depot Inc
0.00 % 0.00 % 1 TC233 / 4450.00 %970.00 %Home Product Center PCL
0.12 % 0.12 % 186 CDP*297 / 4450.30 %1260.12 %Honda Motor Co
0.03 % 0.03 % 19 TC295 / 4450.03 %1230.01 %Horton D.R. Inc
0.01 % 0.01 % 6 TC239 / 4450.01 %980.00 %Hotai Motor Co Ltd
0.00 % 0.00 % 4 TC238 / 4450.01 %980.00 %Hotel Shilla
0.01 % 0.01 % 3 OTH205 / 4450.01 %880.00 %Hugo Boss AG
0.01 % 0.01 % 6 CDP332 / 4450.01 %1580.00 %Husqvarna AB
0.00 % 0.00 % 1 TC194 / 4450.00 %860.00 %Hyundai Dept Store
0.03 % 0.03 % 61 ENV*344 / 4450.05 %1940.04 %Hyundai Mobis
www.trucost.com Copyright © 2018 S&P Trucost Limited, an affiliate of S&P Dow Jones Indices LLC-13-
Page 57

5133
Company BreakdownPortfolio
Company details
Weighting
Portfolio Benchmark
Carbon Apportioned
Tonnes CO2e
% ofPortfolio's
Total CarbonApportioned
CarbonIntensity
(tCO2e/£mn)
CarbonFootprint
Contribution(%)*
FootprintRank in
BenchmarkSector **
DataSource
***
0.06 % 0.05 % 56 CDP154 / 4450.19 %710.04 %Hyundai Motor Co
0.00 % 0.00 % 12 TC361 / 4450.01 %2220.01 %Hyundai Wia Corp
0.01 % 0.01 % 8 TC309 / 4450.01 %1400.01 %Iida Group Holdings Co Ltd
0.01 % 0.01 % 18 CDP349 / 4450.01 %2040.01 %Imperial Hldgs Ltd
0.01 % 0.01 % 3 AR*17 / 4450.04 %190.00 %Inchcape
0.09 % 0.09 % 9 CDP231 / 4450.02 %960.01 %Inditex SA
0.02 % 0.02 % 1 AR*47 / 4450.01 %280.00 %Informa PLC
0.02 % 0.02 % 45 CDP445 / 445-0.02 %1,8770.03 %InterContinental Hotels Group Plc
0.02 % 0.02 % 4 TC70 / 4450.03 %360.00 %Interpublic Group Cos
0.01 % 0.01 % 11 TC240 / 4450.03 %980.01 %Isetan Mitsukoshi Holdings Ltd
0.02 % 0.02 % 7 CDP118 / 4450.03 %590.00 %Isuzu Motors
0.02 % 0.02 % 1 AR*35 / 4450.01 %240.00 %ITV Plc
0.00 % 0.00 % 4 TC236 / 4450.01 %970.00 %Izumi Co
0.01 % 0.01 % 11 TC245 / 4450.02 %1000.01 %J Front Retailing Co Ltd
0.01 % 0.01 % 23 TC424 / 4450.00 %3990.01 %Jardine Cycle & Carriage Ltd
0.01 % 0.01 % 1 CDP140 / 4450.00 %670.00 %JC Decaux Intl SA
0.02 % 0.02 % 6 TC178 / 4450.02 %820.00 %JD.com Inc ADR
0.00 % 0.00 % 2 TC314 / 4450.00 %1470.00 %Jollibee Foods Corp
0.00 % 0.00 % 1 TC228 / 4450.00 %950.00 %Jumbo SA
0.00 % 0.00 % 5 TC262 / 4450.01 %1050.00 %K's Holdings Corp
0.01 % 0.01 % 1 ENV*182 / 4450.00 %830.00 %Kangwon Land Inc
0.07 % 0.07 % 6 CDP87 / 4450.03 %500.00 %Kering
0.02 % 0.02 % 27 ENV*141 / 4450.10 %670.02 %Kia Motors Corp
0.02 % 0.02 % 13 CDP129 / 4450.05 %630.01 %Kingfisher
0.02 % 0.02 % 18 CDP166 / 4450.06 %760.01 %Kohl's Corp
0.02 % 0.02 % 12 TC351 / 4450.01 %2050.01 %Koito Manufacturing Co
0.00 % 0.00 % 1 TC200 / 4450.00 %870.00 %Komeri Co
0.02 % 0.02 % 1 TC89 / 4450.01 %510.00 %Kroton Educational S.A.
0.02 % 0.02 % 9 CDP155 / 4450.03 %710.01 %L Brands Inc
0.00 % 0.00 % 1 TC259 / 4450.00 %1040.00 %L'Occitane International SA
0.01 % 0.01 % 5 AR*91 / 4450.03 %510.00 %Lagardere S.C.A.
0.00 % 0.00 % 2 TC237 / 4450.00 %980.00 %Lao Feng Xiang Co Ltd
0.05 % 0.05 % 10 CDP307 / 4450.01 %1360.01 %Las Vegas Sands
0.03 % 0.03 % 55 PRE353 / 4450.04 %2070.04 %Lear Corp
0.01 % 0.01 % 12 TC371 / 4450.01 %2280.01 %Leggett & Platt
0.02 % 0.02 % 15 TC283 / 4450.03 %1150.01 %Lennar Corp
www.trucost.com Copyright © 2018 S&P Trucost Limited, an affiliate of S&P Dow Jones Indices LLC-14-
Page 58

5133
Company BreakdownPortfolio
Company details
Weighting
Portfolio Benchmark
Carbon Apportioned
Tonnes CO2e
% ofPortfolio's
Total CarbonApportioned
CarbonIntensity
(tCO2e/£mn)
CarbonFootprint
Contribution(%)*
FootprintRank in
BenchmarkSector **
DataSource
***
0.02 % 0.02 % 56 CDP284 / 4450.10 %1160.04 %LG Electronics Inc
0.01 % 0.01 % 3 ENV*25 / 4450.04 %200.00 %Li & Fung Ltd.
0.00 % 0.00 % 2 TC336 / 4450.00 %1630.00 %Li Ning Co. Ltd.
0.03 % 0.03 % 0 TC56 / 4450.00 %320.00 %Liberty Broadband Corp
0.06 % 0.06 % 10 CDP82 / 4450.06 %430.01 %Liberty Global plc
0.00 % 0.00 % 0 TC216 / 4450.00 %920.00 %Lifestyle International Holdings Ltd.
0.02 % 0.03 % 8 TC137 / 4450.03 %650.00 %LKQ Corp
0.01 % 0.01 % 1 CDP59 / 4450.01 %320.00 %Lojas Americanas
0.02 % 0.02 % 1 CDP55 / 4450.01 %320.00 %Lojas Renner SA
0.01 % 0.01 % 7 PRE111 / 4450.03 %570.00 %Lotte Shopping
0.16 % 0.15 % 68 CDP213 / 4450.17 %910.04 %Lowe's Cos Inc
0.01 % 0.01 % 2 TC215 / 4450.00 %920.00 %LPP SA
0.01 % 0.01 % 1 CDP75 / 4450.00 %380.00 %Lululemon Athletica inc
0.02 % 0.02 % 4 TC199 / 4450.01 %870.00 %Luxottica Group SpA
0.16 % 0.16 % 21 AR*158 / 4450.07 %730.01 %LVMH-Moet Vuitton
0.00 % 0.00 % 0 TC269 / 4450.00 %1070.00 %Macau Legend Development Limited
0.02 % 0.02 % 32 TC244 / 4450.07 %990.02 %Macy's Inc
0.04 % 0.04 % 128 CDP389 / 4450.06 %2520.08 %Magna International Inc
0.01 % 0.01 % 7 TC274 / 4450.01 %1100.00 %Mahindra & Mahindra Ltd
0.00 % 0.00 % 12 TC367 / 4450.01 %2260.01 %Mando Corp
0.02 % 0.02 % 13 CDP*139 / 4450.05 %660.01 %Marks & Spencer Group
0.08 % 0.08 % 108 CDP430 / 445-0.01 %5220.07 %Marriott Intl
0.01 % 0.01 % 2 ENV220 / 4450.01 %930.00 %Marui Group Co Ltd
0.03 % 0.03 % 4 ENV222 / 4450.01 %940.00 %Maruti Suzuki India Ltd
0.00 % 0.00 % 1 TC195 / 4450.00 %860.00 %Matahari Department Store Tbk
0.01 % 0.01 % 10 CDP305 / 4450.02 %1350.01 %Mattel Inc
0.02 % 0.02 % 25 CDP161 / 4450.08 %740.02 %Mazda Motor Corp
0.30 % 0.29 % 45 CDP300 / 4450.07 %1280.03 %McDonald's Corp
0.00 % 0.00 % 0 TC28 / 4450.00 %210.00 %Media Nusantara Citra Tbk PT
0.01 % 0.00 % 0 ENV*1 / 4450.00 %100.00 %Mediaset Espana
0.00 % 0.00 % 0 AR*34 / 4450.00 %230.00 %Mediaset SpA
0.00 % 0.00 % 0 TC36 / 4450.00 %240.00 %Megacable Holdings SAB de CV
0.01 % 0.01 % 4 TC326 / 4450.00 %1550.00 %Melco International Development Ltd.
0.01 % 0.01 % 2 AR*251 / 4450.00 %1020.00 %Merlin Entertainments Plc
0.00 % 0.00 % 0 AR*127 / 4450.00 %610.00 %MGM China Holdings Ltd
0.04 % 0.04 % 14 CDP292 / 4450.02 %1210.01 %MGM Resorts International
www.trucost.com Copyright © 2018 S&P Trucost Limited, an affiliate of S&P Dow Jones Indices LLC-15-
Page 59

5133
Company BreakdownPortfolio
Company details
Weighting
Portfolio Benchmark
Carbon Apportioned
Tonnes CO2e
% ofPortfolio's
Total CarbonApportioned
CarbonIntensity
(tCO2e/£mn)
CarbonFootprint
Contribution(%)*
FootprintRank in
BenchmarkSector **
DataSource
***
0.02 % 0.02 % 5 TC189 / 4450.01 %840.00 %Michael Kors Holdings Ltd
0.06 % 0.06 % 99 CDP414 / 4450.03 %3130.06 %Michelin CGDE A Beiges
0.01 % 0.01 % 2 TC301 / 4450.00 %1330.00 %Minor International PCL
0.01 % 0.01 % 3 TC369 / 4450.00 %2260.00 %Minth Group Ltd.
0.01 % 0.01 % 7 CDP146 / 4450.02 %680.00 %Mitsubishi Motors Corp
0.04 % 0.04 % 53 CDP429 / 445-0.00 %5030.03 %Mohawk Industries Inc
0.01 % 0.01 % 1 TC299 / 4450.00 %1270.00 %Moncler SpA
0.01 % 0.01 % 5 CDP*388 / 4450.00 %2520.00 %Motherson Sumi Systems Ltd
0.01 % 0.01 % 2 AR*317 / 4450.00 %1510.00 %Mr Price Group
0.00 % 0.00 % 2 TC418 / 4450.00 %3400.00 %MRF Ltd
0.00 % 0.00 % 0 TC50 / 4450.00 %290.00 %Multiplus SA
0.21 % 0.21 % 4 AR*120 / 4450.02 %600.00 %Naspers Ltd N
0.00 % 0.00 % 6 AR*432 / 445-0.00 %5380.00 %Nemak S.A.B. de C.V.
0.17 % 0.17 % 3 TC44 / 4450.03 %270.00 %NetFlix Inc
0.00 % 0.01 % 0 TC124 / 4450.00 %600.00 %New Oriental Education & Technology ADR
0.05 % 0.05 % 49 CDP396 / 4450.02 %2650.03 %Newell Brands Inc
0.01 % 0.02 % 6 CDP225 / 4450.02 %950.00 %News Corp
0.02 % 0.02 % 5 ENV*135 / 4450.02 %640.00 %Next
0.00 % 0.00 % 4 TC368 / 4450.00 %2260.00 %Nexteer Automotive
0.01 % 0.01 % 11 CDP416 / 4450.00 %3220.01 %NGK Spark Plug
0.00 % 0.00 % 17 ENV*423 / 4450.00 %3850.01 %NHK Spring Co
0.01 % 0.01 % 6 TC406 / 4450.00 %2970.00 %Nifco Inc
0.16 % 0.16 % 26 CDP187 / 4450.07 %830.02 %NIKE Inc
0.01 % 0.01 % 10 CDP304 / 4450.01 %1350.01 %Nikon Corp
0.00 % 0.00 % 0 TC71 / 4450.00 %360.00 %Nippon Television Holdings Inc
0.04 % 0.04 % 47 CDP179 / 4450.13 %820.03 %Nissan Motor Co
0.00 % 0.00 % 2 TC131 / 4450.01 %640.00 %Nissan Shatai Co
0.02 % 0.02 % 4 TC293 / 4450.01 %1220.00 %Nitori Holdings Co
0.01 % 0.01 % 13 TC391 / 4450.01 %2560.01 %NOK Corp
0.01 % 0.01 % 4 ENV*343 / 4450.00 %1900.00 %Nokian Renkaat Oyj
0.01 % 0.01 % 7 CDP108 / 4450.03 %560.00 %Nordstrom Inc
0.02 % 0.02 % 86 TC444 / 445-0.04 %1,6060.06 %Norwegian Cruise Line Holdings Ltd
0.02 % 0.02 % 9 TC288 / 4450.02 %1180.01 %NVR Inc
0.04 % 0.04 % 12 TC257 / 4450.03 %1030.01 %O'Reilly Automotive
0.04 % 0.04 % 8 CDP64 / 4450.06 %340.01 %Omnicom Group
0.01 % 0.01 % 3 PRE143 / 4450.01 %670.00 %OPAP S.A.
www.trucost.com Copyright © 2018 S&P Trucost Limited, an affiliate of S&P Dow Jones Indices LLC-16-
Page 60

5133
Company BreakdownPortfolio
Company details
Weighting
Portfolio Benchmark
Carbon Apportioned
Tonnes CO2e
% ofPortfolio's
Total CarbonApportioned
CarbonIntensity
(tCO2e/£mn)
CarbonFootprint
Contribution(%)*
FootprintRank in
BenchmarkSector **
DataSource
***
0.03 % 0.03 % 2 ENV*206 / 4450.01 %890.00 %Oriental Land Co
0.02 % 0.02 % 1 TC85 / 4450.01 %480.00 %Paddy Power Betfair Plc
0.00 % 0.00 % 3 TC153 / 4450.01 %710.00 %PALTAC Corporation
0.07 % 0.07 % 156 CDP374 / 4450.09 %2310.10 %Panasonic Corp
0.02 % 0.02 % 4 TC217 / 4450.01 %920.00 %Pandora A/S
0.00 % 0.00 % 1 TC328 / 4450.00 %1560.00 %Paradise Co Ltd
0.02 % 0.02 % 4 CDP86 / 4450.02 %500.00 %Pearson
0.02 % 0.02 % 5 CDP190 / 4450.01 %840.00 %Persimmon
0.02 % 0.02 % 32 CDP177 / 4450.09 %810.02 %Peugeot SA
0.00 % 22 CDPN / A0.00 %3900.01 %Pirelli & C. SpA
0.01 % 0.01 % 8 ENV357 / 4450.01 %2170.01 %Plastic Omnium
0.01 % 0.01 % 12 TC347 / 4450.01 %1980.01 %Polaris Inds Inc
0.01 % 0.01 % 18 PRE337 / 4450.02 %1640.01 %Pou Chen Corp
0.00 % 0.00 % 1 ENV234 / 4450.00 %970.00 %Prada SpA
0.02 % 0.02 % 1 CDP4 / 4450.02 %120.00 %ProSiebenSat.1 Media SE
0.03 % 0.03 % 3 AR30 / 4450.04 %210.00 %Publicis Groupe
0.02 % 0.02 % 11 TC287 / 4450.02 %1180.01 %Pulte Group Inc
0.02 % 0.02 % 5 CDP110 / 4450.02 %560.00 %PVH Corp
0.02 % 0.02 % 2 TC19 / 4450.03 %190.00 %Qurate Retail Group, Inc. QVC Group
0.00 % 0.00 % 16 TC280 / 4450.03 %1120.01 %Rajesh Exports Ltd
0.02 % 0.02 % 1 CDP*6 / 4450.02 %160.00 %Rakuten Inc
0.01 % 0.01 % 3 PRE84 / 4450.02 %450.00 %Ralph Lauren Corp
0.01 % 0.01 % 2 PRE439 / 445-0.00 %7280.00 %REA Group Ltd
0.10 % 0.10 % 3 CDP39 / 4450.03 %250.00 %RELX PLC
0.04 % 0.04 % 27 OTH*117 / 4450.11 %590.02 %Renault SA
0.00 % 0.00 % 1 TC330 / 4450.00 %1570.00 %Resorttrust
0.03 % 0.03 % 7 TC298 / 4450.01 %1270.00 %Restaurant Brands International Inc.
0.11 % 0.11 % 10 CDP172 / 4450.03 %800.01 %Richemont, Cie Financiere A Br
0.01 % 0.01 % 5 CDP377 / 4450.00 %2320.00 %Rinnai Corp
0.06 % 0.06 % 16 TC263 / 4450.03 %1050.01 %Ross Stores Inc
0.05 % 0.05 % 66 CDP438 / 445-0.02 %6800.04 %Royal Caribbean Cruises Ltd
0.01 % 0.01 % 0 PRE12 / 4450.01 %180.00 %RTL Group
0.02 % 0.02 % 3 TC235 / 4450.01 %970.00 %Ryohin Keikaku Co
0.00 % 0.00 % 0 AR*112 / 4450.00 %570.00 %Sa Sa International Holdings Ltd.
0.01 % 0.01 % 4 TC208 / 4450.01 %890.00 %SACI Falabella
0.00 % 0.00 % 1 CDP*250 / 4450.00 %1020.00 %Salvatore Ferragamo SpA
www.trucost.com Copyright © 2018 S&P Trucost Limited, an affiliate of S&P Dow Jones Indices LLC-17-
Page 61

5133
Company BreakdownPortfolio
Company details
Weighting
Portfolio Benchmark
Carbon Apportioned
Tonnes CO2e
% ofPortfolio's
Total CarbonApportioned
CarbonIntensity
(tCO2e/£mn)
CarbonFootprint
Contribution(%)*
FootprintRank in
BenchmarkSector **
DataSource
***
0.01 % 0.01 % 5 TC308 / 4450.01 %1390.00 %Samsonite International SA
0.03 % 0.03 % 6 PRE355 / 4450.00 %2110.00 %Sands China Ltd.
0.00 % 0.00 % 1 TC331 / 4450.00 %1580.00 %Sankyo Co Ltd
0.00 % 0.00 % 0 TC63 / 4450.00 %340.00 %Sanrio Co
0.01 % 0.01 % 1 CDP78 / 4450.01 %410.00 %Schibsted AS
0.02 % 0.02 % 0 CDP2 / 4450.01 %120.00 %Scripps Networks Interactive
0.01 % 0.01 % 10 CDP364 / 4450.01 %2260.01 %SEB SA
0.01 % 0.01 % 3 CDP296 / 4450.01 %1240.00 %Sega Sammy Holdings Inc
0.02 % 0.02 % 20 CDP385 / 4450.01 %2470.01 %Sekisui Chemical Co
0.02 % 0.02 % 9 CDP97 / 4450.04 %540.01 %Sekisui House
0.02 % 0.02 % 1 CDP43 / 4450.01 %260.00 %SES
0.00 % 0.00 % 0 TC69 / 4450.00 %360.00 %Seven West Media Ltd
0.00 % 0.00 % 5 CDP435 / 445-0.00 %5850.00 %Shangri-La Asia Ltd.
0.01 % 0.01 % 3 ENV311 / 4450.00 %1450.00 %Sharp Corp
0.02 % 0.02 % 1 TC60 / 4450.01 %330.00 %Shaw Communications Inc
0.01 % 0.01 % 7 TC434 / 445-0.00 %5440.00 %Shenzhou International Group Holdings Ltd.
0.00 % 0.00 % 1 TC214 / 4450.00 %920.00 %Shimachu Co
0.01 % 0.01 % 4 TC266 / 4450.01 %1060.00 %Shimamura Co
0.02 % 0.02 % 10 TC398 / 4450.00 %2700.01 %Shimano Inc
0.00 % 0.00 % 2 TC168 / 4450.01 %770.00 %Shinsegae Co Ltd
0.00 % 0.00 % 0 TC81 / 4450.00 %430.00 %Shochiku Co
0.01 % 0.01 % 10 TC264 / 4450.02 %1050.01 %Signet Jewelers Ltd
0.01 % 0.01 % 1 TC261 / 4450.00 %1050.00 %Singapore Press Hldgs
0.04 % 0.04 % 1 TC29 / 4450.02 %210.00 %Sirius XM Holdings Inc
0.00 % 0.00 % 4 TC323 / 4450.00 %1550.00 %SJM Holdings Ltd.
0.00 % 0.00 % 0 TC26 / 4450.00 %210.00 %Sky Network Television Limited
0.00 % 0.00 % 0 TC38 / 4450.00 %250.00 %SKY Perfect JSAT Holdings Inc.
0.03 % 0.03 % 3 CDP24 / 4450.04 %200.00 %Sky Plc
0.00 % 0.00 % 1 TC265 / 4450.00 %1050.00 %SkyCity Entertainment Group
0.00 % 0.00 % 5 TC318 / 4450.01 %1520.00 %Skylark Co Ltd
0.00 % 0.00 % 0 TC115 / 4450.00 %580.00 %Smiles S.A.
0.03 % 0.02 % 9 CDP88 / 4450.04 %510.01 %Sodexo
0.11 % 0.11 % 53 CDP134 / 4450.20 %640.03 %Sony Corp
0.01 % 0.01 % 13 ENV*421 / 4450.00 %3680.01 %Stanley Electric Co
0.17 % 0.17 % 21 CDP164 / 4450.07 %750.01 %Starbucks Corp
0.01 % 0.01 % 0 TC232 / 4450.00 %970.00 %Start Today Co Ltd
www.trucost.com Copyright © 2018 S&P Trucost Limited, an affiliate of S&P Dow Jones Indices LLC-18-
Page 62
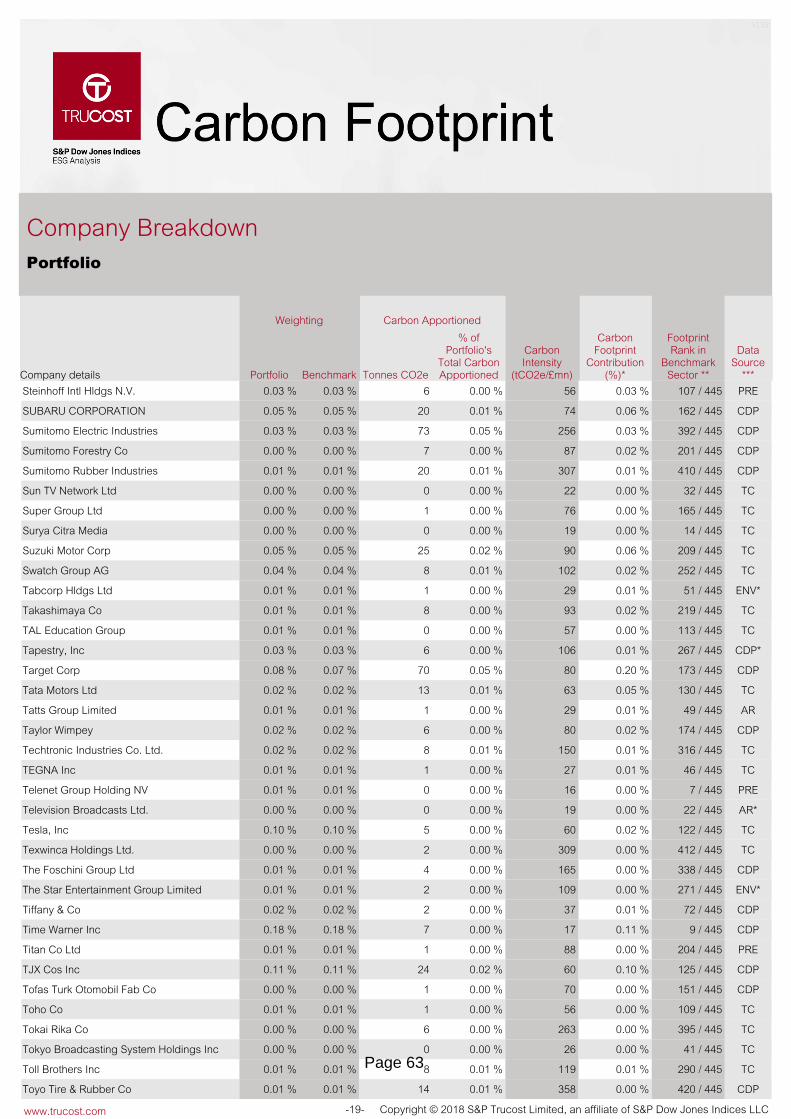
5133
Company BreakdownPortfolio
Company details
Weighting
Portfolio Benchmark
Carbon Apportioned
Tonnes CO2e
% ofPortfolio's
Total CarbonApportioned
CarbonIntensity
(tCO2e/£mn)
CarbonFootprint
Contribution(%)*
FootprintRank in
BenchmarkSector **
DataSource
***
0.03 % 0.03 % 6 PRE107 / 4450.03 %560.00 %Steinhoff Intl Hldgs N.V.
0.05 % 0.05 % 20 CDP162 / 4450.06 %740.01 %SUBARU CORPORATION
0.03 % 0.03 % 73 CDP392 / 4450.03 %2560.05 %Sumitomo Electric Industries
0.00 % 0.00 % 7 CDP201 / 4450.02 %870.00 %Sumitomo Forestry Co
0.01 % 0.01 % 20 CDP410 / 4450.01 %3070.01 %Sumitomo Rubber Industries
0.00 % 0.00 % 0 TC32 / 4450.00 %220.00 %Sun TV Network Ltd
0.00 % 0.00 % 1 TC165 / 4450.00 %760.00 %Super Group Ltd
0.00 % 0.00 % 0 TC14 / 4450.00 %190.00 %Surya Citra Media
0.05 % 0.05 % 25 TC209 / 4450.06 %900.02 %Suzuki Motor Corp
0.04 % 0.04 % 8 TC252 / 4450.02 %1020.01 %Swatch Group AG
0.01 % 0.01 % 1 ENV*51 / 4450.01 %290.00 %Tabcorp Hldgs Ltd
0.01 % 0.01 % 8 TC219 / 4450.02 %930.00 %Takashimaya Co
0.01 % 0.01 % 0 TC113 / 4450.00 %570.00 %TAL Education Group
0.03 % 0.03 % 6 CDP*267 / 4450.01 %1060.00 %Tapestry, Inc
0.08 % 0.07 % 70 CDP173 / 4450.20 %800.05 %Target Corp
0.02 % 0.02 % 13 TC130 / 4450.05 %630.01 %Tata Motors Ltd
0.01 % 0.01 % 1 AR49 / 4450.01 %290.00 %Tatts Group Limited
0.02 % 0.02 % 6 CDP174 / 4450.02 %800.00 %Taylor Wimpey
0.02 % 0.02 % 8 TC316 / 4450.01 %1500.01 %Techtronic Industries Co. Ltd.
0.01 % 0.01 % 1 TC46 / 4450.01 %270.00 %TEGNA Inc
0.01 % 0.01 % 0 PRE7 / 4450.00 %160.00 %Telenet Group Holding NV
0.00 % 0.00 % 0 AR*22 / 4450.00 %190.00 %Television Broadcasts Ltd.
0.10 % 0.10 % 5 TC122 / 4450.02 %600.00 %Tesla, Inc
0.00 % 0.00 % 2 TC412 / 4450.00 %3090.00 %Texwinca Holdings Ltd.
0.01 % 0.01 % 4 CDP338 / 4450.00 %1650.00 %The Foschini Group Ltd
0.01 % 0.01 % 2 ENV*271 / 4450.00 %1090.00 %The Star Entertainment Group Limited
0.02 % 0.02 % 2 CDP72 / 4450.01 %370.00 %Tiffany & Co
0.18 % 0.18 % 7 CDP9 / 4450.11 %170.00 %Time Warner Inc
0.01 % 0.01 % 1 PRE204 / 4450.00 %880.00 %Titan Co Ltd
0.11 % 0.11 % 24 CDP125 / 4450.10 %600.02 %TJX Cos Inc
0.00 % 0.00 % 1 CDP151 / 4450.00 %700.00 %Tofas Turk Otomobil Fab Co
0.01 % 0.01 % 1 TC109 / 4450.00 %560.00 %Toho Co
0.00 % 0.00 % 6 TC395 / 4450.00 %2630.00 %Tokai Rika Co
0.00 % 0.00 % 0 TC41 / 4450.00 %260.00 %Tokyo Broadcasting System Holdings Inc
0.01 % 0.01 % 8 TC290 / 4450.01 %1190.01 %Toll Brothers Inc
0.01 % 0.01 % 14 CDP420 / 4450.00 %3580.01 %Toyo Tire & Rubber Co
www.trucost.com Copyright © 2018 S&P Trucost Limited, an affiliate of S&P Dow Jones Indices LLC-19-
Page 63

5133
Company BreakdownPortfolio
Company details
Weighting
Portfolio Benchmark
Carbon Apportioned
Tonnes CO2e
% ofPortfolio's
Total CarbonApportioned
CarbonIntensity
(tCO2e/£mn)
CarbonFootprint
Contribution(%)*
FootprintRank in
BenchmarkSector **
DataSource
***
0.00 % 0.00 % 14 CDP407 / 4450.00 %3000.01 %Toyoda Gosei Co
0.00 % 0.00 % 12 ENV387 / 4450.01 %2480.01 %Toyota Boshoku Corp
0.02 % 0.02 % 25 CDP370 / 4450.02 %2270.02 %Toyota Industries Corp
0.36 % 0.36 % 184 CDP170 / 4450.55 %790.12 %Toyota Motor Corp
0.02 % 0.02 % 8 TC203 / 4450.02 %880.01 %Tractor Supply Co
0.01 % 0.01 % 1 TC67 / 4450.00 %340.00 %TripAdvisor Inc.
0.01 % 0.01 % 2 CDP278 / 4450.00 %1120.00 %Truworths International Ltd
0.00 % 0.00 % 10 TC393 / 4450.00 %2630.01 %Ts Tech Co Ltd
0.00 % 0.00 % 2 AR*422 / 4450.00 %3840.00 %Tsogo Sun Holdings Ltd
0.02 % 0.02 % 97 CDP428 / 445-0.01 %5000.06 %TUI AG
0.00 % 0.00 % 0 TC37 / 4450.00 %240.00 %TV Asahi Holdings Corp
0.09 % 0.09 % 6 CDP18 / 4450.08 %190.00 %Twenty-First Century Fox Inc
0.03 % 0.03 % 4 TC227 / 4450.01 %950.00 %Ulta Beauty, Inc
0.00 % 0.00 % 2 ENV*163 / 4450.01 %740.00 %UMW Holdings Bhd
0.01 % 0.01 % 4 TC121 / 4450.01 %600.00 %Under Armour Inc
0.01 % 0.01 % 0 TC160 / 4450.00 %740.00 %USS Co Ltd
0.04 % 0.04 % 63 AR384 / 4450.03 %2450.04 %Valeo
0.05 % 0.05 % 8 CDP*116 / 4450.04 %590.01 %VF Corp
0.02 % 0.02 % 3 CDP13 / 4450.04 %190.00 %Viacom Inc
0.06 % 0.06 % 4 AR*42 / 4450.04 %260.00 %Vivendi SA
0.08 % 0.08 % 116 CDP186 / 4450.33 %830.08 %Volkswagen AG
0.00 % 0.00 % 3 TC315 / 4450.00 %1490.00 %Wacoal Holdings Corp
0.36 % 0.35 % 41 CDP96 / 4450.19 %540.03 %Walt Disney Co
0.03 % 0.03 % 81 OTH400 / 4450.03 %2710.05 %Whirlpool Corp
0.02 % 0.02 % 6 CDP285 / 4450.01 %1160.00 %Whitbread
0.01 % 0.01 % 2 AR*92 / 4450.01 %520.00 %William Hill
0.03 % 0.03 % 1 CDP11 / 4450.02 %180.00 %Wolters Kluwer NV
0.01 % 0.01 % 10 CDP346 / 4450.01 %1960.01 %Woolworth Hldgs
0.05 % 0.05 % 7 CDP40 / 4450.07 %250.00 %WPP Plc
0.03 % 0.02 % 9 CDP275 / 4450.02 %1100.01 %Wyndham Worldwide Corp
0.01 % 0.01 % 2 TC321 / 4450.00 %1550.00 %Wynn Macau
0.03 % 0.03 % 8 TC322 / 4450.01 %1550.00 %Wynn Resorts Ltd
0.00 % 0.00 % 6 TC431 / 445-0.00 %5310.00 %Xinyi Glass Holdings Ltd.
0.01 % 0.01 % 13 TC246 / 4450.03 %1000.01 %Yamada Denki Co
0.01 % 0.01 % 4 CDP*281 / 4450.01 %1130.00 %Yamaha Corp
0.02 % 0.02 % 32 CDP354 / 4450.02 %2080.02 %Yamaha Motor Co
www.trucost.com Copyright © 2018 S&P Trucost Limited, an affiliate of S&P Dow Jones Indices LLC-20-
Page 64

5133
Company BreakdownPortfolio
Company details
Weighting
Portfolio Benchmark
Carbon Apportioned
Tonnes CO2e
% ofPortfolio's
Total CarbonApportioned
CarbonIntensity
(tCO2e/£mn)
CarbonFootprint
Contribution(%)*
FootprintRank in
BenchmarkSector **
DataSource
***
0.00 % 0.00 % 13 CDP401 / 4450.01 %2770.01 %Yokohama Rubber Co
0.01 % 0.01 % 8 TC310 / 4450.01 %1430.00 %Yue Yuen Industrial (Holdings) Ltd.
0.00 % 0.00 % 2 TC102 / 4450.01 %550.00 %Yulon Motor Co Ltd
0.04 % 0.03 % 45 PRE427 / 445-0.00 %4720.03 %Yum China Holdings Inc
0.06 % 0.06 % 41 CDP*426 / 445-0.00 %4520.03 %Yum! Brands Inc
0.01 % 0.01 % 2 TC183 / 4450.01 %830.00 %Zalando SE
0.01 % 0.01 % 0 TC33 / 4450.00 %220.00 %Zee Entertainment Enterprises Ltd
0.00 % 0.00 % 6 TC340 / 4450.01 %1670.00 %Zensho Holdings Co Ltd
0.00 % 0.00 % 4 TC256 / 4450.01 %1030.00 %Zhongsheng Group Holdings Ltd.
5.12 %10,277 6.68 %8.88 %8.88 % 262Consumer Staples
0.02 % 0.02 % 62 CDP60 / 2570.16 %900.04 %Aeon Co Ltd
0.05 % 0.05 % 89 CDP87 / 2570.13 %1360.06 %Ahold Delhaize Koninklijke NV
0.00 % 0.00 % 1 TC71 / 2570.00 %980.00 %Ain Holdings Inc
0.02 % 0.02 % 66 CDP206 / 257-0.01 %6090.04 %Ajinomoto Co
0.04 % 0.04 % 29 TC75 / 2570.07 %990.02 %Alimentation Couche Tard Inc
0.00 % 0.00 % 5 ENV9 / 2570.03 %420.00 %Almacenes Exito
0.28 % 0.28 % 65 CDP109 / 2570.06 %1760.04 %Altria Group Inc
0.07 % 0.07 % 12 PRE143 / 2570.01 %2370.01 %Ambev S.A.
0.02 % 0.02 % 3 CDP24 / 2570.01 %640.00 %Amorepacific Corp
0.01 % 0.01 % 2 ENV*17 / 2570.01 %600.00 %Amorepacific Group
0.00 % 0.00 % 3 PRE119 / 2570.00 %1990.00 %Anadolu Efes Biracilik Ve Malt
0.21 % 0.21 % 103 CDP173 / 2570.02 %3560.07 %Anheuser Busch Inbev NV
0.00 % 0.00 % 0 TC101 / 2570.00 %1570.00 %Anhui Gujing Distillery
0.01 % 0.01 % 4 ENV*153 / 2570.00 %2670.00 %Arca Continental, SAB de CV
0.05 % 0.05 % 1,023 CDP244 / 257-0.42 %1,1760.67 %Archer-Daniels-Midland Co
0.00 % 0.00 % 1 TC175 / 2570.00 %3600.00 %Ariake Japan Co
0.01 % 0.01 % 12 CDP136 / 2570.01 %2270.01 %ARYZTA
0.04 % 0.04 % 43 AR*148 / 2570.02 %2450.03 %Asahi Group Holdings Ltd
0.03 % 0.03 % 93 CDP223 / 257-0.03 %8460.06 %Associated British Foods
0.00 % 0.00 % 0 TC66 / 2570.00 %960.00 %Avenue Supermarts Ltd
0.01 % 0.01 % 5 ENV*196 / 257-0.00 %5430.00 %AVI Ltd
0.01 % 0.01 % 10 CDP169 / 2570.00 %3350.01 %Barry Callebaut AG
0.00 % 0.00 % 1 TC168 / 2570.00 %3330.00 %Becle, S.A. De C.V.
0.03 % 0.02 % 3 CDP41 / 2570.01 %780.00 %Beiersdorf AG
0.00 % 0.00 % 2 TC46 / 2570.01 %830.00 %BGF Co
www.trucost.com Copyright © 2018 S&P Trucost Limited, an affiliate of S&P Dow Jones Indices LLC-21-
Page 65

5133
Company BreakdownPortfolio
Company details
Weighting
Portfolio Benchmark
Carbon Apportioned
Tonnes CO2e
% ofPortfolio's
Total CarbonApportioned
CarbonIntensity
(tCO2e/£mn)
CarbonFootprint
Contribution(%)*
FootprintRank in
BenchmarkSector **
DataSource
***
0.02 % 0.02 % 19 ENV103 / 2570.02 %1600.01 %Bid Corporation Limited
0.01 % 0.01 % 6 TC47 / 2570.02 %830.00 %BIM Birlesik Magazalar AS
0.01 % 0.01 % 4 AR*13 / 2570.02 %440.00 %Booker Group Plc
0.02 % 0.02 % 56 CDP202 / 257-0.01 %5890.04 %BRF S.A.
0.00 % 0.00 % 1 PRE140 / 2570.00 %2320.00 %Britannia Industries Ltd.
0.00 % 0.00 % 1 AR113 / 2570.00 %1840.00 %British American Tobacco Malaysia Bhd
0.33 % 0.33 % 58 CDP125 / 2570.04 %2080.04 %British American Tobacco Plc
0.02 % 0.02 % 4 CDP122 / 2570.00 %2060.00 %Brown-Forman Corp
0.02 % 0.02 % 632 PRE235 / 257-0.23 %1,0190.41 %Bunge Ltd
0.01 % 0.01 % 8 AR*200 / 257-0.00 %5660.01 %Calbee Inc
0.02 % 0.02 % 29 CDP190 / 257-0.00 %4790.02 %Campbell Soup Co
0.03 % 0.03 % 33 CDP154 / 2570.01 %2690.02 %Carlsberg AS
0.02 % 0.03 % 49 CDP*16 / 2570.21 %600.03 %Carrefour SA
0.01 % 0.01 % 19 CDP22 / 2570.07 %620.01 %Casino Guichard-Perrachon
0.00 % 0.00 % 29 ENV*25 / 2570.11 %650.02 %CECONOMY AG
0.01 % 0.01 % 8 TC49 / 2570.02 %830.01 %Cencosud SA
0.01 % 0.01 % 105 TC242 / 257-0.04 %1,1640.07 %Charoen Pokphand Foods
0.00 % 0.00 % 11 TC207 / 257-0.00 %6140.01 %Charoen Pokphand Indonesia Tbk PT
0.00 % 0.00 % 89 ENV*252 / 257-0.04 %1,4600.06 %China Agri-Industries Holdings Ltd.
0.00 % 0.00 % 2 TC90 / 2570.00 %1370.00 %China Foods Ltd.
0.02 % 0.02 % 92 TC243 / 257-0.04 %1,1640.06 %China Mengniu Dairy Co. Ltd.
0.01 % 0.01 % 8 TC156 / 2570.00 %2710.01 %China Resources Beer (Holdings) Co Ltd
0.03 % 0.03 % 7 CDP96 / 2570.01 %1460.00 %Church & Dwight Co
0.01 % 0.01 % 7 CDP38 / 2570.02 %770.00 %Cia Brasileira de Distribuicao
0.01 % 0.01 % 25 CDP155 / 2570.01 %2700.02 %CJ CheilJedang Corp
0.01 % 0.01 % 2 CDP57 / 2570.00 %890.00 %Clicks Group Ltd
0.04 % 0.04 % 35 CDP187 / 257-0.00 %4490.02 %Clorox Co
0.01 % 0.01 % 8 CDP118 / 2570.01 %1950.00 %Coca-Cola Amatil Ltd
0.01 % 0.01 % 7 CDP124 / 2570.01 %2070.00 %Coca-Cola Bottlers Japan Co
0.40 % 0.40 % 122 CDP138 / 2570.07 %2280.08 %Coca-Cola Co
0.02 % 0.02 % 7 CDP100 / 2570.01 %1540.00 %Coca-Cola European Partners plc
0.01 % 0.01 % 4 ENV*92 / 2570.01 %1410.00 %Coca-Cola Femsa SAB de CV
0.01 % 0.02 % 10 CDP*121 / 2570.01 %2030.01 %Coca-Cola HBC AG
0.00 % 0.00 % 1 CDP99 / 2570.00 %1530.00 %Coca-Cola Icecek Uretim AS
0.14 % 0.14 % 36 CDP105 / 2570.04 %1690.02 %Colgate-Palmolive Co
0.00 % 0.00 % 0 TC85 / 2570.00 %1340.00 %Colgate-Palmolive India Ltd
www.trucost.com Copyright © 2018 S&P Trucost Limited, an affiliate of S&P Dow Jones Indices LLC-22-
Page 66

5133
Company BreakdownPortfolio
Company details
Weighting
Portfolio Benchmark
Carbon Apportioned
Tonnes CO2e
% ofPortfolio's
Total CarbonApportioned
CarbonIntensity
(tCO2e/£mn)
CarbonFootprint
Contribution(%)*
FootprintRank in
BenchmarkSector **
DataSource
***
0.01 % 0.01 % 2 PRE12 / 2570.01 %440.00 %Colruyt SA
0.00 % 0.00 % 4 PRE158 / 2570.00 %2810.00 %Compania Cervecerias Unidas S.A.
0.03 % 0.03 % 80 CDP205 / 257-0.01 %5980.05 %Conagra Brands, Inc
0.07 % 0.07 % 12 CDP104 / 2570.01 %1610.01 %Constellation Brands Inc
0.00 % 0.00 % 2 TC70 / 2570.00 %970.00 %Cosmos Pharmaceutical
0.17 % 0.16 % 68 CDP10 / 2570.41 %430.04 %Costco Wholesale Corp
0.02 % 0.02 % 4 TC67 / 2570.01 %960.00 %Coty Inc.
0.02 % 0.02 % 8 TC32 / 2570.03 %720.00 %CP ALL PCL
0.19 % 0.19 % 67 CDP*2 / 2570.69 %260.04 %CVS Health Corporation
0.01 % 0.01 % 1 PRE97 / 2570.00 %1500.00 %Dabur India Ltd
0.00 % 0.01 % 5 TC61 / 2570.01 %930.00 %Dairy Farm Intl Hldgs Ltd
0.00 % 0.00 % 2 TC183 / 2570.00 %4020.00 %Dali Foods Group Company Ltd
0.10 % 0.11 % 228 CDP220 / 257-0.06 %7640.15 %Danone
0.01 % 0.01 % 2 TC102 / 2570.00 %1570.00 %Davide Campari Group Milano SpA
0.19 % 0.19 % 71 CDP144 / 2570.04 %2380.05 %Diageo Plc
0.00 % 0.00 % 0 TC50 / 2570.00 %860.00 %Dis-Chem Pharmacies Limited
0.01 % 0.01 % 15 CDP78 / 2570.03 %1130.01 %Distribuidora Internacional De Alimentacion
0.00 % 0.00 % 0 TC21 / 2570.00 %610.00 %Dongsuh Companies Inc
0.04 % 0.04 % 19 CDP127 / 2570.01 %2100.01 %Dr Pepper Snapple Group
0.01 % 0.01 % 3 PRE1 / 2570.04 %250.00 %E-Mart Co. Ltd
0.01 % 0.01 % 13 TC182 / 2570.00 %4000.01 %Edgewell Personal Care Co.
0.00 % 0.00 % 0 PRE48 / 2570.00 %830.00 %Emami Ltd
0.00 % 0.00 % 2 TC117 / 2570.00 %1910.00 %Embotelladora Andina SA
0.04 % 0.04 % 54 ENV179 / 2570.01 %3800.03 %Essity AB
0.05 % 0.05 % 6 CDP28 / 2570.02 %670.00 %Estee Lauder Cos.
0.00 % 0.00 % 3 TC18 / 2570.01 %610.00 %Eurocash SA
0.01 % 0.01 % 18 TC213 / 257-0.00 %6810.01 %Ezaki Glico Co
0.01 % 0.01 % 12 AR*185 / 2570.00 %4160.01 %Familymart UNY Holdings Co
0.00 % 0.00 % 36 TC240 / 257-0.01 %1,1190.02 %Felda Global Ventures Holdings Bhd
0.05 % 0.05 % 34 ENV*80 / 2570.06 %1150.02 %Fomento Economico Mexicano S.A.B. de C.
0.00 % 0.00 % 11 CDP218 / 257-0.00 %7600.01 %Fuji Oil Co
0.07 % 0.07 % 120 CDP204 / 257-0.02 %5960.08 %General Mills Inc
0.01 % 0.01 % 5 CDP4 / 2570.05 %270.00 %George Weston Ltd
0.01 % 0.01 % 35 TC247 / 257-0.01 %1,2300.02 %Glanbia Plc
0.00 % 0.00 % 2 AR*239 / 257-0.00 %1,1130.00 %GlaxoSmithKline Consumer Healthcare Ltd
0.01 % 0.01 % 1 CDP93 / 2570.00 %1410.00 %Godrej Consumer Products Ltd
www.trucost.com Copyright © 2018 S&P Trucost Limited, an affiliate of S&P Dow Jones Indices LLC-23-
Page 67

5133
Company BreakdownPortfolio
Company details
Weighting
Portfolio Benchmark
Carbon Apportioned
Tonnes CO2e
% ofPortfolio's
Total CarbonApportioned
CarbonIntensity
(tCO2e/£mn)
CarbonFootprint
Contribution(%)*
FootprintRank in
BenchmarkSector **
DataSource
***
0.00 % 0.00 % 36 CDP214 / 257-0.01 %6970.02 %Golden Agri Resources Ltd
0.01 % 0.01 % 31 TC249 / 257-0.01 %1,3110.02 %Gruma SAB
0.01 % 0.01 % 22 AR*134 / 2570.01 %2260.01 %Grupo Bimbo S.A.B.
0.00 % 0.00 % 2 TC56 / 2570.00 %870.00 %Grupo Comercial Chedraui SA de CV
0.00 % 0.00 % 6 PRE211 / 257-0.00 %6530.00 %Grupo Lala S.A.B. de C.V.
0.00 % 0.00 % 3 TC59 / 2570.01 %900.00 %GS Retail Co Ltd
0.01 % 0.01 % 4 TC114 / 2570.00 %1860.00 %Gudang Garam Tbk PT
0.01 % 0.01 % 1 TC110 / 2570.00 %1760.00 %Hanjaya Mandala Sampoerna Tbk PT
0.00 % 0.00 % 2 TC191 / 257-0.00 %4960.00 %Health and Happiness International Holdings
0.03 % 0.02 % 45 CDP157 / 2570.02 %2800.03 %Heineken Holding NV
0.05 % 0.05 % 31 CDP*152 / 2570.01 %2660.02 %Heineken NV
0.02 % 0.02 % 24 TC230 / 257-0.01 %9680.02 %Hengan International Group Co. Ltd.
0.09 % 0.09 % 26 CDP84 / 2570.04 %1320.02 %Henkel AG & Co. KGaA
0.01 % 0.01 % 3 TC19 / 2570.01 %610.00 %Herbalife Ltd
0.03 % 0.03 % 12 CDP108 / 2570.01 %1760.01 %Hershey Foods Corp
0.03 % 0.03 % 5 PRE139 / 2570.00 %2310.00 %Hindustan Unilever Ltd
0.00 % 0.00 % 3 TC164 / 2570.00 %3230.00 %Hite Jinro
0.02 % 0.02 % 66 CDP*228 / 257-0.02 %9620.04 %Hormel Foods Corp
0.01 % 0.01 % 10 TC197 / 257-0.00 %5500.01 %House Foods Group Inc
0.01 % 0.01 % 1 TC26 / 2570.00 %650.00 %Hypera SA
0.01 % 0.01 % 2 AR7 / 2570.02 %330.00 %ICA Gruppen AB
0.09 % 0.09 % 74 ENV*91 / 2570.10 %1400.05 %Imperial Brands Plc
0.00 % 0.00 % 3 TC184 / 2570.00 %4020.00 %Indofood CBP Sukses Makmur TBK PT
0.01 % 0.01 % 35 TC234 / 257-0.01 %9790.02 %Indofood Sukses Makmur Tbk PT
0.00 % 0.00 % 19 TC253 / 257-0.01 %1,7700.01 %Industrias Bachoco SAB de CV
0.02 % 0.02 % 149 CDP256 / 257-0.08 %1,9810.10 %Ingredion Inc
0.01 % 0.01 % 20 PRE237 / 257-0.01 %1,0610.01 %IOI Corp Bhd
0.03 % 0.03 % 11 CDP189 / 257-0.00 %4710.01 %ITC Ltd
0.00 % 0.00 % 18 PRE216 / 257-0.00 %7400.01 %Ito En
0.09 % 0.09 % 36 CDP128 / 2570.02 %2160.02 %Japan Tobacco Inc
0.01 % 0.00 % 294 CDP248 / 257-0.12 %1,2660.19 %JBS SA
0.01 % 0.01 % 9 CDP68 / 2570.02 %970.01 %Jeronimo Martins & Filito SGPS
0.01 % 0.01 % 8 CDP181 / 2570.00 %3980.01 %Kagome Co
0.07 % 0.07 % 34 CDP111 / 2570.03 %1830.02 %Kao Corp
0.04 % 0.04 % 56 CDP193 / 257-0.00 %5040.04 %Kellogg Co
0.00 % 0.00 % 10 CDP*208 / 257-0.00 %6220.01 %Kernel Holding SA
www.trucost.com Copyright © 2018 S&P Trucost Limited, an affiliate of S&P Dow Jones Indices LLC-24-
Page 68

5133
Company BreakdownPortfolio
Company details
Weighting
Portfolio Benchmark
Carbon Apportioned
Tonnes CO2e
% ofPortfolio's
Total CarbonApportioned
CarbonIntensity
(tCO2e/£mn)
CarbonFootprint
Contribution(%)*
FootprintRank in
BenchmarkSector **
DataSource
***
0.03 % 0.03 % 19 TC145 / 2570.01 %2380.01 %Kerry Group A
0.01 % 0.01 % 4 CDP8 / 2570.03 %350.00 %Kesko Oyj
0.01 % 0.01 % 21 TC180 / 2570.00 %3980.01 %Kewpie Corporation
0.01 % 0.01 % 9 CDP147 / 2570.00 %2450.01 %Kikkoman Corp
0.00 % 0.00 % 5 ENV*212 / 257-0.00 %6770.00 %Kimberly Clark de Mexico S.A.B. de C.V.
0.10 % 0.10 % 122 CDP188 / 257-0.01 %4700.08 %Kimberly-Clark
0.05 % 0.05 % 58 CDP141 / 2570.03 %2340.04 %Kirin Holdings Co Ltd
0.01 % 0.01 % 1 TC39 / 2570.00 %770.00 %Kobayashi Pharmaceutical Co
0.01 % 0.01 % 1 TC77 / 2570.00 %1040.00 %Kose Corp
0.04 % 0.04 % 156 CDP*79 / 2570.29 %1140.10 %Kroger Co
0.02 % 0.02 % 9 PRE120 / 2570.01 %1990.01 %KT&G Corp.
0.01 % 0.01 % 32 TC250 / 257-0.01 %1,3310.02 %Kuala Lumpur Kepong Bhd
0.00 % 0.00 % 1 TC69 / 2570.00 %970.00 %Kusuri No Aoki Holdings
0.12 % 0.12 % 11 CDP23 / 2570.04 %640.01 %L'Oreal
0.02 % 0.02 % 24 TC210 / 257-0.00 %6250.02 %Lamb Weston Holdings Inc
0.01 % 0.01 % 1 CDP5 / 2570.01 %270.00 %Lawson Inc
0.02 % 0.02 % 3 CDP40 / 2570.01 %780.00 %LG Household & Health Care
0.03 % 0.03 % 7 CDP98 / 2570.01 %1520.00 %Lindt & Sprungli AG Br
0.01 % 0.01 % 6 CDP89 / 2570.01 %1370.00 %Lion Corp
0.03 % 0.03 % 12 CDP14 / 2570.07 %460.01 %Loblaw Companies Ltd
0.00 % 0.00 % 3 PRE115 / 2570.00 %1880.00 %Lotte Chilsung Beverage
0.00 % 0.00 % 7 TC217 / 257-0.00 %7480.00 %Lotte Corp
0.00 % 0.00 % 2 TC150 / 2570.00 %2610.00 %M Dias Branco SA
0.03 % 0.03 % 15 TC52 / 2570.04 %860.01 %Magnit PJSC
0.00 % 0.00 % 0 TC37 / 2570.00 %770.00 %Marico Ltd
0.02 % 0.02 % 11 CDP146 / 2570.01 %2440.01 %Marine Harvest ASA
0.00 % 0.00 % 5 CDP82 / 2570.01 %1240.00 %Massmart Holdings Ltd
0.01 % 0.01 % 4 TC63 / 2570.01 %950.00 %Matsumotokiyoshi Co
0.03 % 0.03 % 14 OTH149 / 2570.01 %2510.01 %McCormick & Co
0.00 % 0.00 % 39 CDP238 / 257-0.02 %1,1090.03 %MEGMILK Snow Brand Co
0.02 % 0.02 % 95 AR*224 / 257-0.03 %8540.06 %MEIJI Holdings Co Ltd
0.00 % 0.00 % 3 PRE3 / 2570.03 %270.00 %Metcash Ltd
0.01 % 0.01 % 38 TC76 / 2570.08 %1020.02 %METRO AG
0.02 % 0.02 % 7 CDP15 / 2570.03 %520.00 %Metro Inc.
0.00 % 0.00 % 4 TC31 / 2570.02 %710.00 %Mitsubishi Shokuhin Co Ltd
0.03 % 0.03 % 17 CDP*133 / 2570.01 %2230.01 %Molson Coors Brewing Co
www.trucost.com Copyright © 2018 S&P Trucost Limited, an affiliate of S&P Dow Jones Indices LLC-25-
Page 69

5133
Company BreakdownPortfolio
Company details
Weighting
Portfolio Benchmark
Carbon Apportioned
Tonnes CO2e
% ofPortfolio's
Total CarbonApportioned
CarbonIntensity
(tCO2e/£mn)
CarbonFootprint
Contribution(%)*
FootprintRank in
BenchmarkSector **
DataSource
***
0.14 % 0.14 % 118 CDP165 / 2570.03 %3270.08 %Mondelez International Inc
0.05 % 0.05 % 3 TC51 / 2570.01 %860.00 %Monster Beverage Corp
0.01 % 0.01 % 5 TC176 / 2570.00 %3670.00 %Morinaga & Co
0.02 % 0.02 % 21 PRE42 / 2570.06 %780.01 %Morrison (WM) Supermarkets
0.00 % 0.00 % 1 CDP29 / 2570.00 %680.00 %Natura Cosmeticos SA
0.01 % 0.01 % 5 PRE233 / 257-0.00 %9730.00 %Nestle India Ltd
0.60 % 0.60 % 720 CDP199 / 257-0.10 %5620.47 %Nestle SA
0.01 % 0.01 % 22 TC192 / 257-0.00 %5040.01 %Nichirei Corp
0.01 % 0.01 % 118 CDP229 / 257-0.04 %9650.08 %Nippon Meat Packers Inc
0.01 % 0.01 % 49 ENV*236 / 257-0.02 %1,0200.03 %Nisshin Seifun Group Inc
0.01 % 0.01 % 9 AR*171 / 2570.00 %3410.01 %Nissin Food Products Co
0.00 % 0.00 % 5 TC166 / 2570.00 %3310.00 %Nong Shim Co
0.00 % 0.00 % 2 TC54 / 2570.00 %860.00 %Organizacion Soriana
0.00 % 0.00 % 4 TC123 / 2570.00 %2070.00 %ORION Holdings Corp
0.02 % 0.02 % 14 CDP159 / 2570.00 %2880.01 %Orkla AS
0.00 % 0.00 % 3 PRE174 / 2570.00 %3580.00 %Ottogi Corp
0.37 % 0.37 % 333 CDP178 / 2570.04 %3720.22 %PepsiCo Inc
0.07 % 0.07 % 30 CDP161 / 2570.01 %2980.02 %Pernod-Ricard
0.40 % 0.40 % 180 CDP106 / 2570.19 %1690.12 %Philip Morris International
0.00 % 0.00 % 11 CDP*135 / 2570.01 %2260.01 %Pick' N Pay Stores
0.01 % 0.01 % 1 TC74 / 2570.00 %990.00 %Pigeon Corp
0.00 % 0.00 % 6 AR*195 / 257-0.00 %5360.00 %Pioneer Food Group Ltd
0.01 % 0.01 % 1 TC58 / 2570.00 %890.00 %Pola Orbis Holdings Inc
0.01 % 0.01 % 6 TC226 / 257-0.00 %9140.00 %PPB Group Bhd
0.01 % 0.01 % 4 TC34 / 2570.01 %740.00 %President Chain Store
0.54 % 0.53 % 189 CDP132 / 2570.12 %2190.12 %Procter & Gamble
0.01 % 0.01 % 3 TC55 / 2570.01 %860.00 %Raia Drogasil S.A.
0.13 % 0.13 % 16 CDP72 / 2570.04 %980.01 %Reckitt Benckiser Group PLC
0.01 % 0.01 % 2 CDP142 / 2570.00 %2350.00 %Remy Cointreau SA
0.01 % 0.01 % 25 CDP36 / 2570.08 %760.02 %Sainsbury (J)
0.00 % 0.00 % 3 AR*245 / 257-0.00 %1,2260.00 %Sao Martinho S.A.
0.00 % 0.00 % 13 CDP126 / 2570.01 %2090.01 %Sapporo Holdings Ltd.
0.02 % 0.02 % 80 CDP251 / 257-0.04 %1,3870.05 %Saputo Inc
0.01 % 0.01 % 120 CDP215 / 257-0.03 %7200.08 %SCA
0.07 % 0.07 % 72 CDP83 / 2570.11 %1310.05 %Seven & I Holdings Co Ltd
0.04 % 0.04 % 7 CDP27 / 2570.03 %660.00 %Shiseido Co
www.trucost.com Copyright © 2018 S&P Trucost Limited, an affiliate of S&P Dow Jones Indices LLC-26-
Page 70

5133
Company BreakdownPortfolio
Company details
Weighting
Portfolio Benchmark
Carbon Apportioned
Tonnes CO2e
% ofPortfolio's
Total CarbonApportioned
CarbonIntensity
(tCO2e/£mn)
CarbonFootprint
Contribution(%)*
FootprintRank in
BenchmarkSector **
DataSource
***
0.02 % 0.02 % 23 ENV*151 / 2570.01 %2610.01 %Shoprite Hldgs Ltd
0.00 % 0.00 % 1 TC44 / 2570.00 %820.00 %Shufersal Ltd.
0.03 % 0.03 % 52 CDP*198 / 257-0.01 %5570.03 %Smucker J.M. Co
0.01 % 0.01 % 2 CDP6 / 2570.02 %290.00 %Spar Group
0.00 % 0.00 % 4 PRE201 / 257-0.00 %5780.00 %Strauss Group
0.00 % 0.00 % 26 TC221 / 257-0.01 %7740.02 %Sudzucker AG
0.00 % 0.00 % 2 TC62 / 2570.01 %930.00 %Sugi Holdings Co Ltd
0.00 % 0.00 % 4 TC53 / 2570.01 %860.00 %Sun Art Retail Group Ltd
0.01 % 0.01 % 3 TC65 / 2570.01 %960.00 %Sundrug Co Ltd
0.01 % 0.01 % 10 CDP86 / 2570.02 %1340.01 %Suntory Beverage & Food Ltd
0.01 % 0.01 % 4 CDP88 / 2570.01 %1370.00 %Swedish Match AB
0.06 % 0.06 % 46 CDP33 / 2570.15 %730.03 %Sysco Corp
0.00 % 0.00 % 7 TC172 / 2570.00 %3490.00 %Takara Holdings Inc
0.01 % 0.01 % 110 CDP257 / 257-0.06 %2,5400.07 %Tate & Lyle
0.05 % 0.05 % 77 CDP*35 / 2570.24 %750.05 %Tesco
0.00 % 0.00 % 14 ENV*186 / 257-0.00 %4400.01 %Thai Union Group PCL
0.11 % 0.11 % 111 CDP203 / 257-0.02 %5940.07 %The Kraft Heinz Company
0.01 % 0.01 % 18 CDP219 / 257-0.00 %7610.01 %Tiger Brands Ltd
0.01 % 0.01 % 9 TC129 / 2570.01 %2160.01 %Tingyi (Cayman Islands) Holdings Corp.
0.00 % 0.00 % 24 CDP255 / 257-0.01 %1,9200.02 %Tongaat-Hulett
0.01 % 0.01 % 12 TC177 / 2570.00 %3680.01 %Toyo Suisan Kaisha
0.02 % 0.02 % 7 AR*162 / 2570.00 %3010.00 %Treasury Wine Estates
0.00 % 0.00 % 7 PRE194 / 257-0.00 %5130.00 %Tsingtao Brewery Co Ltd
0.01 % 0.01 % 4 TC64 / 2570.01 %960.00 %Tsuruha Holdings Inc
0.05 % 0.04 % 383 CDP231 / 257-0.14 %9680.25 %Tyson Foods Inc
0.00 % 0.00 % 2 CDP160 / 2570.00 %2970.00 %Ulker Gida Sanayi ve Ticaret
0.02 % 0.02 % 55 TC232 / 257-0.02 %9730.04 %Uni Charm Corp
0.00 % 0.00 % 3 TC130 / 2570.00 %2180.00 %Uni-President China Holdings Ltd.
0.02 % 0.02 % 33 AR*131 / 2570.02 %2190.02 %Uni-President Enterprises
0.36 % 0.36 % 143 CDP116 / 2570.12 %1890.09 %Unilever
0.01 % 0.01 % 1 PRE81 / 2570.00 %1160.00 %Unilever Indonesia Tbk PT
0.00 % 0.00 % 1 TC163 / 2570.00 %3150.00 %United Breweries Ltd
0.01 % 0.01 % 3 TC112 / 2570.00 %1830.00 %United Spirits Ltd
0.01 % 0.01 % 4 TC170 / 2570.00 %3390.00 %Universal Robina Corp
0.17 % 0.16 % 60 CDP11 / 2570.35 %440.04 %Walgreens Boots Alliance Inc
0.03 % 0.03 % 8 CDP30 / 2570.03 %690.01 %Walmart de Mexico SAB de CV
www.trucost.com Copyright © 2018 S&P Trucost Limited, an affiliate of S&P Dow Jones Indices LLC-27-
Page 71

5133
Company BreakdownPortfolio
Company details
Weighting
Portfolio Benchmark
Carbon Apportioned
Tonnes CO2e
% ofPortfolio's
Total CarbonApportioned
CarbonIntensity
(tCO2e/£mn)
CarbonFootprint
Contribution(%)*
FootprintRank in
BenchmarkSector **
DataSource
***
0.26 % 0.26 % 237 CDP43 / 2570.69 %810.15 %Walmart Inc.
0.01 % 0.01 % 11 TC209 / 257-0.00 %6230.01 %Want Want China Holdings Ltd.
0.00 % 0.00 % 3 TC73 / 2570.01 %980.00 %WELCIA HOLDINGS CO LTD
0.08 % 0.08 % 90 CDP94 / 2570.12 %1420.06 %Wesfarmers Ltd
0.02 % 0.02 % 216 ENV*246 / 257-0.09 %1,2270.14 %WH Group Ltd
0.01 % 0.01 % 141 CDP222 / 257-0.04 %7960.09 %Wilmar International
0.06 % 0.06 % 76 CDP95 / 2570.10 %1420.05 %Woolworths Group Ltd
0.02 % 0.02 % 22 TC227 / 257-0.01 %9530.01 %Yakult Honsha Co
0.01 % 0.01 % 18 TC137 / 2570.01 %2270.01 %Yamazaki Baking Co
0.00 % 0.00 % 1 TC167 / 2570.00 %3330.00 %Yantai Changyu Pioneer Wine Co Ltd
-11.51 %29,441 19.14 %6.02 %6.29 % 976Energy
0.00 % 0.00 % 54 TC145 / 150-0.03 %3,7090.04 %Adaro Energy Tbk PT
0.00 % 0.00 % 5 CDP77 / 150-0.00 %8640.00 %Aker BP ASA
0.06 % 0.06 % 209 CDP127 / 150-0.10 %1,7390.14 %Anadarko Petroleum Corp
0.04 % 0.03 % 342 ENV*90 / 150-0.12 %9980.22 %Andeavor
0.01 % 0.01 % 14 TC45 / 150-0.00 %6250.01 %Antero Resources Corp
0.04 % 0.04 % 198 PRE137 / 150-0.11 %2,5260.13 %Apache Corp
0.01 % 0.01 % 18 CDP123 / 150-0.01 %1,5550.01 %ARC Resources Ltd.
0.04 % 0.04 % 41 CDP23 / 1500.01 %2970.03 %Baker Hughes, a GE company
0.00 % 0.01 % 70 ENV*138 / 150-0.04 %3,0690.05 %Banpu Public Co Ltd
0.00 % 0.00 % 8 TC72 / 150-0.00 %8090.01 %Bashneft PJSC
0.02 % 0.02 % 139 TC85 / 150-0.05 %9410.09 %Bharat Petroleum Corp Ltd
0.28 % 1,776 CDPN / A-0.45 %7141.15 %BP
0.00 % 0.00 % 4 TC6 / 1500.00 %1420.00 %Brightoil Petroleum (Holdings) Ltd.
0.00 % 0.00 % 3 PRE38 / 150-0.00 %5410.00 %Bukit Asam (Persero) Tbk PT
0.00 % 0.00 % 1 PRE21 / 1500.00 %2720.00 %Bumi Armada Bhd
0.03 % 0.03 % 10 TC52 / 150-0.00 %6460.01 %Cabot Oil & Gas A
0.02 % 0.02 % 100 AR*37 / 150-0.01 %5190.06 %Caltex Australia Ltd
0.09 % 0.09 % 359 CDP139 / 150-0.20 %3,0800.23 %Canadian Natural Resources Limited
0.03 % 0.03 % 156 CDP115 / 150-0.07 %1,3340.10 %Cenovus Energy Inc
0.02 % 0.02 % 3 TC10 / 1500.00 %2040.00 %Cheniere Energy Inc
0.51 % 0.51 % 1,646 CDP98 / 150-0.62 %1,0501.07 %Chevron Corp
0.00 % 0.00 % 41 TC143 / 150-0.02 %3,3280.03 %China Coal Energy Co Ltd
0.00 % 0.00 % 5 AR*64 / 150-0.00 %7250.00 %China Oilfield Services Ltd
0.04 % 0.04 % 171 TC12 / 1500.11 %2230.11 %China Petroleum & Chemical Corp
www.trucost.com Copyright © 2018 S&P Trucost Limited, an affiliate of S&P Dow Jones Indices LLC-28-
Page 72

5133
Company BreakdownPortfolio
Company details
Weighting
Portfolio Benchmark
Carbon Apportioned
Tonnes CO2e
% ofPortfolio's
Total CarbonApportioned
CarbonIntensity
(tCO2e/£mn)
CarbonFootprint
Contribution(%)*
FootprintRank in
BenchmarkSector **
DataSource
***
0.02 % 0.02 % 694 AR*150 / 150-0.44 %13,0170.45 %China Shenhua Energy Co Ltd
0.02 % 0.02 % 22 PRE111 / 150-0.01 %1,2840.01 %Cimarex Energy Co
0.05 % 0.05 % 49 ENV31 / 1500.00 %4380.03 %CNOOC Ltd.
0.01 % 0.01 % 186 TC147 / 150-0.11 %4,3940.12 %Coal India Ltd
0.04 % 0.04 % 15 TC50 / 150-0.00 %6460.01 %Concho Resources Inc
0.14 % 0.14 % 487 CDP119 / 150-0.22 %1,4420.32 %ConocoPhillips
0.01 % 0.01 % 4 TC49 / 150-0.00 %6460.00 %Continental Resources Inc/OK
0.01 % 0.01 % 1 PRE5 / 1500.00 %1170.00 %Core Laboratories N.V.
0.00 % 0.00 % 2 PRE15 / 1500.00 %2400.00 %Cosan SA Industria e Comercio
0.00 % 0.00 % 149 CDP71 / 150-0.04 %7990.10 %Cosmo Energy Holding
0.01 % 0.01 % 61 CDP134 / 150-0.03 %2,2400.04 %Crescent Point Energy Corp
0.00 % 0.00 % 2 TC53 / 150-0.00 %6460.00 %Dana Gas PJSC
0.00 % 0.00 % 10 TC114 / 150-0.00 %1,3050.01 %Delek Group Ltd
0.04 % 0.04 % 125 CDP63 / 150-0.03 %7190.08 %Devon Energy Corp
0.00 % 0.01 % 21 ENV*79 / 150-0.01 %8640.01 %Ecopetrol SA
0.01 % 0.01 % 41 TC39 / 150-0.01 %5430.03 %Empresas COPEC SA
0.16 % 0.16 % 138 PRE28 / 1500.01 %3770.09 %Enbridge Inc
0.03 % 0.03 % 76 ENV*130 / 150-0.04 %1,8290.05 %EnCana Corp
0.00 % 0.00 % 0 TC24 / 1500.00 %3130.00 %Energy Absolute Public Company Limited
0.09 % 0.10 % 649 CDP99 / 150-0.25 %1,0800.42 %ENI SpA
0.13 % 0.13 % 97 CDP81 / 150-0.03 %9080.06 %EOG Resources
0.03 % 0.03 % 14 TC44 / 150-0.00 %6140.01 %EQT Corporation
0.00 % 0.00 % 12 CDP102 / 150-0.00 %1,1280.01 %Exxaro Resources
0.80 % 0.80 % 3,549 CDP103 / 150-1.43 %1,1382.31 %Exxon Mobil Corp
0.01 % 0.01 % 64 PRE129 / 150-0.03 %1,8060.04 %Formosa Petrochemical Corp
0.02 % 0.02 % 91 CDP65 / 150-0.02 %7290.06 %Galp Energia SGPS SA
0.05 % 0.05 % 1,973 ENV*142 / 150-1.11 %3,2021.28 %Gazprom PJSC
0.00 % 0.00 % 25 TC47 / 150-0.00 %6320.02 %Grupa Lotos SA
0.01 % 0.01 % 75 TC80 / 150-0.02 %8850.05 %GS Holdings Corp
0.09 % 0.09 % 72 CDP25 / 1500.02 %3180.05 %Halliburton Co
0.00 % 0.00 % 23 OTH96 / 150-0.01 %1,0450.01 %Hellenic Petroleum SA
0.01 % 0.01 % 10 TC34 / 150-0.00 %4870.01 %Helmerich & Payne Inc
0.03 % 0.03 % 75 CDP108 / 150-0.03 %1,2370.05 %Hess Corp
0.01 % 0.01 % 81 ENV*58 / 150-0.02 %6780.05 %Hindustan Petroleum Corp Ltd
0.01 % 0.01 % 117 TC69 / 150-0.03 %7900.08 %HollyFrontier Corporation
0.01 % 0.01 % 86 CDP132 / 150-0.04 %1,9800.06 %Husky Energy Inc
www.trucost.com Copyright © 2018 S&P Trucost Limited, an affiliate of S&P Dow Jones Indices LLC-29-
Page 73

5133
Company BreakdownPortfolio
Company details
Weighting
Portfolio Benchmark
Carbon Apportioned
Tonnes CO2e
% ofPortfolio's
Total CarbonApportioned
CarbonIntensity
(tCO2e/£mn)
CarbonFootprint
Contribution(%)*
FootprintRank in
BenchmarkSector **
DataSource
***
0.01 % 0.01 % 261 ENV*88 / 150-0.10 %9970.17 %Idemitsu Kosan Co Ltd
0.02 % 0.02 % 97 CDP106 / 150-0.04 %1,1670.06 %Imperial Oil Ltd
0.02 % 0.02 % 177 CDP84 / 150-0.06 %9370.11 %Indian Oil Corp Ltd
0.00 % 0.00 % 50 TC144 / 150-0.03 %3,4780.03 %Inner Mongolia Yitai Coal
0.02 % 0.02 % 12 CDP*8 / 1500.01 %1860.01 %INPEX Corp
0.02 % 0.02 % 11 CDP41 / 150-0.00 %5910.01 %Inter Pipeline Ltd.
0.00 % 0.00 % 47 ENV109 / 150-0.02 %1,2490.03 %IRPC PCL
0.00 % 0.00 % 9 TC55 / 150-0.00 %6630.01 %Japan Petroleum Exploration
0.04 % 0.04 % 400 CDP33 / 150-0.02 %4850.26 %JXTG Holdings Inc
0.09 % 0.08 % 72 TC32 / 150-0.00 %4500.05 %Kinder Morgan Inc
0.01 % 0.01 % 25 TC36 / 150-0.00 %5040.02 %Kunlun Energy Co. Ltd.
0.06 % 0.06 % 509 CDP76 / 150-0.16 %8470.33 %Lukoil PJSC
0.01 % 0.01 % 3 CDP26 / 1500.00 %3320.00 %Lundin Petroleum A
0.03 % 0.03 % 59 ENV*95 / 150-0.02 %1,0430.04 %Marathon Oil Corp
0.06 % 0.06 % 827 PRE82 / 150-0.28 %9240.54 %Marathon Petroleum Corp.
0.01 % 0.01 % 88 CDP93 / 150-0.03 %1,0350.06 %MOL HUNGARIAN OIL AND GAS NY
0.00 % 0.00 % 37 PRE66 / 150-0.01 %7540.02 %Motor Oil Hellas SA
0.01 % 0.01 % 38 ENV*124 / 150-0.02 %1,5800.02 %Murphy Oil Corp
0.03 % 0.03 % 24 PRE13 / 1500.01 %2260.02 %National Oilwell Varco Inc
0.01 % 0.01 % 56 CDP46 / 150-0.01 %6310.04 %Neste Oyj
0.01 % 0.01 % 20 PRE87 / 150-0.01 %9620.01 %Newfield Exploration Co
0.03 % 0.03 % 45 CDP86 / 150-0.02 %9430.03 %Noble Energy Inc
0.03 % 0.03 % 43 ENV101 / 150-0.02 %1,0910.03 %Novatek PJSC
0.11 % 0.11 % 288 CDP133 / 150-0.15 %2,0040.19 %Occidental Petroleum
0.00 % 0.00 % 2 TC61 / 150-0.00 %6990.00 %Oil & Gas Development Co Ltd
0.02 % 0.02 % 94 ENV*116 / 150-0.04 %1,3820.06 %Oil & Natural Gas Corp Ltd
0.00 % 0.00 % 3 ENV*57 / 150-0.00 %6760.00 %Oil India Ltd
0.00 % 0.00 % 21 TC70 / 150-0.01 %7940.01 %Oil Refineries Ltd
0.01 % 0.01 % 13 CDP89 / 150-0.00 %9970.01 %Oil Search Ltd
0.02 % 0.02 % 130 CDP91 / 150-0.05 %1,0040.08 %OMV AG
0.05 % 0.05 % 73 CDP43 / 150-0.01 %6120.05 %ONEOK Inc
0.02 % 0.02 % 366 CDP141 / 150-0.21 %3,1990.24 %Origin Energy Ltd
0.00 % 0.00 % 2 TC59 / 150-0.00 %6790.00 %Pakistan Petroleum Ltd
0.00 % 0.00 % 11 TC27 / 1500.00 %3540.01 %Paz Oil Company Ltd
0.03 % 0.03 % 13 TC22 / 1500.00 %2960.01 %Pembina Pipeline Corporation
0.08 % 0.08 % 697 CDP105 / 150-0.28 %1,1670.45 %Petrobras SA
www.trucost.com Copyright © 2018 S&P Trucost Limited, an affiliate of S&P Dow Jones Indices LLC-30-
Page 74

5133
Company BreakdownPortfolio
Company details
Weighting
Portfolio Benchmark
Carbon Apportioned
Tonnes CO2e
% ofPortfolio's
Total CarbonApportioned
CarbonIntensity
(tCO2e/£mn)
CarbonFootprint
Contribution(%)*
FootprintRank in
BenchmarkSector **
DataSource
***
0.03 % 0.03 % 94 ENV*30 / 1500.00 %4250.06 %PetroChina Co Ltd
0.00 % 3 CDP*N / A0.01 %1030.00 %Petrofac
0.00 % 0.00 % 18 PRE56 / 150-0.00 %6650.01 %Petron Corp
0.00 % 0.00 % 1 TC2 / 1500.01 %630.00 %Petronas Dagangan BHD
0.00 % 0.00 % 3 TC48 / 150-0.00 %6320.00 %Petronet LNG Ltd
0.09 % 0.09 % 621 PRE42 / 150-0.11 %6060.40 %Phillips 66
0.06 % 0.06 % 50 ENV*120 / 150-0.02 %1,4640.03 %Pioneer Natural Resources
0.02 % 0.02 % 264 PRE113 / 150-0.11 %1,2900.17 %Polski Koncern Naftowy SA
0.01 % 0.01 % 43 AR*107 / 150-0.02 %1,2030.03 %Polskie Gornictwo Naftowe
0.01 % 0.01 % 27 CDP*112 / 150-0.01 %1,2890.02 %PTT Exploration & Production PCL
0.04 % 0.04 % 316 ENV83 / 150-0.11 %9250.21 %PTT PCL
0.00 % 0.00 % 12 TC126 / 150-0.01 %1,6060.01 %Qatar Gas Transport
0.01 % 0.01 % 11 PRE60 / 150-0.00 %6830.01 %Range Resources Corp
0.09 % 0.09 % 353 ENV*110 / 150-0.15 %1,2770.23 %Reliance Industries Ltd
0.05 % 0.05 % 503 OTH104 / 150-0.20 %1,1630.33 %Repsol SA
0.01 % 0.01 % 180 ENV125 / 150-0.08 %1,6000.12 %Rosneft PJSC
0.57 % 0.58 % 2,630 CDP73 / 150-0.79 %8101.71 %Royal Dutch Shell PLC
0.01 % 0.01 % 74 ENV*97 / 150-0.03 %1,0490.05 %S-Oil Corp
0.01 % 0.01 % 37 AR*29 / 1500.00 %4000.02 %Saipem SpA Ord
0.01 % 0.01 % 77 ENV136 / 150-0.04 %2,4660.05 %Santos Ltd
0.00 % 0.00 % 5 TC14 / 1500.00 %2350.00 %Sapura Energy Berhad
0.03 % 0.03 % 985 CDP149 / 150-0.61 %7,9660.64 %Sasol Ltd
0.22 % 0.22 % 99 ENV*17 / 1500.05 %2490.06 %Schlumberger Ltd
0.00 % 0.00 % 17 AR*148 / 150-0.01 %5,3260.01 %Semirara Mining and Power Corp
0.01 % 0.01 % 100 OTH*78 / 150-0.03 %8640.06 %Showa Shell Sekiyu KK
0.02 % 0.02 % 266 ENV*75 / 150-0.08 %8430.17 %SK Innovation Co Ltd
0.03 % 0.03 % 19 CDP67 / 150-0.01 %7560.01 %Snam SpA
0.04 % 0.04 % 154 CDP74 / 150-0.05 %8180.10 %Statoil ASA
0.13 % 0.13 % 418 CDP118 / 150-0.19 %1,4380.27 %Suncor Energy Inc
0.02 % 0.02 % 24 PRE20 / 1500.01 %2680.02 %Surgutneftegas OJSC
0.02 % 0.02 % 15 TC7 / 1500.02 %1600.01 %Targa Resources Corp
0.03 % 0.03 % 62 TC62 / 150-0.02 %7120.04 %Tatneft PJSC
0.03 % 0.03 % 12 PRE9 / 1500.01 %1970.01 %TechnipFMC Ltd
0.02 % 0.02 % 36 PRE121 / 150-0.02 %1,4880.02 %Tenaris SA
0.01 % 0.01 % 55 ENV*92 / 150-0.02 %1,0190.04 %Thai Oil PCL
0.06 % 0.06 % 191 PRE128 / 150-0.09 %1,7870.12 %The Williams Companies Inc
www.trucost.com Copyright © 2018 S&P Trucost Limited, an affiliate of S&P Dow Jones Indices LLC-31-
Page 75

5133
Company BreakdownPortfolio
Company details
Weighting
Portfolio Benchmark
Carbon Apportioned
Tonnes CO2e
% ofPortfolio's
Total CarbonApportioned
CarbonIntensity
(tCO2e/£mn)
CarbonFootprint
Contribution(%)*
FootprintRank in
BenchmarkSector **
DataSource
***
0.27 % 0.27 % 1,025 CDP40 / 150-0.14 %5600.67 %Total S.A.
0.01 % 0.01 % 7 TC51 / 150-0.00 %6460.00 %Tourmaline Oil Corp
0.10 % 0.10 % 306 CDP135 / 150-0.16 %2,2610.20 %TransCanada Corp
0.01 % 0.01 % 10 TC16 / 1500.01 %2400.01 %Transneft Prf
0.01 % 0.01 % 86 AR*100 / 150-0.03 %1,0800.06 %Tupras-Turkiye Petrol Rafine
0.02 % 0.02 % 20 CDP3 / 1500.06 %800.01 %Ultrapar Participacoes S.A.
0.08 % 0.08 % 848 TC68 / 150-0.24 %7770.55 %Valero Energy Corp
0.01 % 0.01 % 2 AR*11 / 1500.00 %2070.00 %Vopak NV
0.01 % 0.01 % 19 CDP18 / 1500.01 %2560.01 %Weatherford Intl Ltd
0.00 % 0.00 % 10 ENV*117 / 150-0.00 %1,3910.01 %Whitehaven Coal Ltd
0.01 % 0.01 % 5 AR*4 / 1500.01 %930.00 %WOOD GROUP (JOHN) PLC
0.04 % 0.04 % 156 ENV*140 / 150-0.09 %3,1060.10 %Woodside Petroleum Ltd
0.00 % 0.00 % 2 CDP1 / 1500.01 %350.00 %WorleyParsons Ltd
0.00 % 0.00 % 75 AR*146 / 150-0.04 %4,0890.05 %Yanzhou Coal Mining Co Ltd
19.62 %2,402 1.56 %19.39 %19.06 % 39Financials
0.03 % 0.03 % 0 CDP219 / 5220.00 %90.00 %3I Group
0.00 % 0.00 % 0 TC191 / 5220.00 %80.00 %77 Bank Ltd
0.03 % 0.03 % 1 ENV*162 / 5220.02 %80.00 %ABN AMRO Group NV
0.01 % 0.01 % 0 PRE301 / 5220.00 %140.00 %Abu Dhabi Commercial Bank
0.01 % 0.01 % 4 TC504 / 5220.01 %1030.00 %Ackermans & Van Haaren NV
0.00 % 0.00 % 0 TC412 / 5220.00 %200.00 %Acom Co
0.01 % 0.01 % 0 ENV*77 / 5220.00 %60.00 %Admiral Group
0.02 % 0.02 % 2 CDP23 / 5220.12 %50.00 %Aegon NV
0.01 % 0.01 % 0 TC418 / 5220.00 %200.00 %AEON Financial Service Co Ltd
0.02 % 0.02 % 0 TC336 / 5220.01 %150.00 %Affiliated Managers Grp
0.07 % 0.07 % 2 CDP*41 / 5220.09 %50.00 %AFLAC Inc
0.02 % 0.02 % 2 PRE282 / 5220.06 %120.00 %AGEAS
0.02 % 0.02 % 1 TC503 / 5220.00 %1000.00 %AGNC Investment Corp
0.03 % 0.03 % 1 TC173 / 5220.02 %80.00 %Agricultural Bank of China Ltd
0.21 % 0.20 % 2 ENV32 / 5220.11 %50.00 %AIA Group Ltd
0.01 % 0.01 % 0 CDP285 / 5220.00 %120.00 %AIB Group Plc
0.00 % 0.00 % 0 TC416 / 5220.00 %200.00 %Aiful Corp
0.01 % 0.01 % 1 CDP362 / 5220.01 %170.00 %Akbank TAS
0.00 % 0.00 % 0 TC249 / 5220.00 %100.00 %Alior Bank
0.02 % 0.02 % 1 TC97 / 5220.02 %70.00 %Alleghany Corp (NY)
www.trucost.com Copyright © 2018 S&P Trucost Limited, an affiliate of S&P Dow Jones Indices LLC-32-
Page 76

5133
Company BreakdownPortfolio
Company details
Weighting
Portfolio Benchmark
Carbon Apportioned
Tonnes CO2e
% ofPortfolio's
Total CarbonApportioned
CarbonIntensity
(tCO2e/£mn)
CarbonFootprint
Contribution(%)*
FootprintRank in
BenchmarkSector **
DataSource
***
0.00 % 0.00 % 0 TC220 / 5220.00 %90.00 %Alliance Bank Malaysia Bhd
0.23 % 0.23 % 12 CDP113 / 5220.49 %70.01 %Allianz SE
0.08 % 0.08 % 7 CDP*288 / 5220.15 %120.00 %Allstate Corp
0.02 % 0.03 % 1 TC310 / 5220.03 %150.00 %Ally Financial Inc
0.01 % 0.01 % 1 CDP451 / 5220.01 %290.00 %Alpha Bank A.E.
0.15 % 0.15 % 5 CDP290 / 5220.10 %120.00 %American Express Co
0.13 % 0.13 % 4 TC59 / 5220.22 %50.00 %American Intl Group Inc
0.05 % 0.05 % 2 CDP269 / 5220.05 %110.00 %Ameriprise Financial Inc
0.00 % 0.00 % 0 TC214 / 5220.00 %90.00 %AMMB Holdings Bhd
0.03 % 0.03 % 1 CDP103 / 5220.04 %70.00 %AMP Ltd
0.01 % 0.01 % 0 TC324 / 5220.00 %150.00 %Amundi SA
0.03 % 0.03 % 0 TC44 / 5220.01 %50.00 %Annaly Capital Management Inc.
0.16 % 0.16 % 6 CDP444 / 5220.07 %250.00 %ANZ Banking Group
0.09 % 0.09 % 4 CDP435 / 5220.05 %210.00 %Aon plc
0.01 % 0.01 % 0 TC255 / 5220.00 %100.00 %Aozora Bank Ltd
0.03 % 0.03 % 0 TC63 / 5220.02 %50.00 %Arch Capital Group Ltd
0.00 % 0.00 % 0 AR*303 / 5220.00 %140.00 %Ashmore Group PLC
0.01 % 0.01 % 1 AR*73 / 5220.03 %60.00 %ASR Nederland
0.06 % 0.06 % 6 TC78 / 5220.31 %60.00 %Assicurazioni Generali SpA
0.01 % 0.01 % 1 CDP160 / 5220.03 %80.00 %Assurant Inc
0.02 % 0.02 % 0 AR*468 / 5220.00 %340.00 %ASX Limited
0.06 % 0.06 % 4 CDP7 / 5220.31 %30.00 %Aviva
0.00 % 0.00 % 0 TC252 / 5220.00 %100.00 %Awa Bank
0.13 % 0.13 % 6 OTH18 / 5220.40 %40.00 %AXA
0.03 % 0.03 % 2 CDP490 / 5220.01 %550.00 %Axis Bank Ltd
0.01 % 0.01 % 0 TC57 / 5220.02 %50.00 %Axis Capital Hldgs Ltd
0.01 % 0.01 % 5 PRE514 / 5220.00 %3260.00 %Ayala Corp
0.03 % 0.03 % 0 CDP277 / 5220.00 %120.00 %B3 S.A. - Brasil, Bolsa, Balcao
0.01 % 0.01 % 0 TC413 / 5220.00 %200.00 %Bajaj Finance Ltd
0.01 % 0.01 % 0 TC423 / 5220.00 %200.00 %Bajaj Finserv Ltd
0.00 % 0.00 % 0 TC485 / 5220.00 %480.00 %Bajaj Holdings and Investment Ltd
0.02 % 0.02 % 1 AR*19 / 5220.03 %40.00 %Baloise Holding AG
0.01 % 0.01 % 0 TC79 / 5220.01 %60.00 %Banca Mediolanum
0.14 % 0.14 % 9 CDP397 / 5220.13 %190.01 %Banco Bilbao Vizcaya Argentaria SA
0.01 % 0.30 % 0 PRE142 / 5220.01 %70.00 %Banco Bpm SpA
0.09 % 0.10 % 2 CDP91 / 5220.07 %60.00 %Banco Bradesco
www.trucost.com Copyright © 2018 S&P Trucost Limited, an affiliate of S&P Dow Jones Indices LLC-33-
Page 77
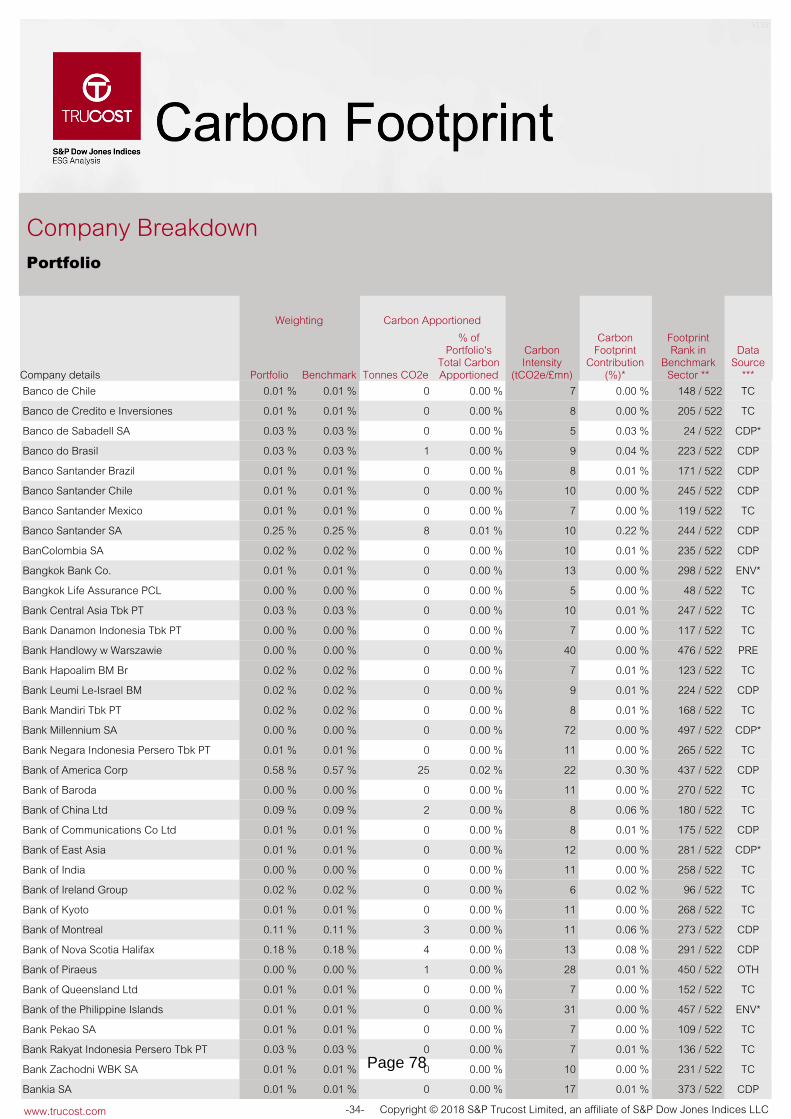
5133
Company BreakdownPortfolio
Company details
Weighting
Portfolio Benchmark
Carbon Apportioned
Tonnes CO2e
% ofPortfolio's
Total CarbonApportioned
CarbonIntensity
(tCO2e/£mn)
CarbonFootprint
Contribution(%)*
FootprintRank in
BenchmarkSector **
DataSource
***
0.01 % 0.01 % 0 TC148 / 5220.00 %70.00 %Banco de Chile
0.01 % 0.01 % 0 TC205 / 5220.00 %80.00 %Banco de Credito e Inversiones
0.03 % 0.03 % 0 CDP*24 / 5220.03 %50.00 %Banco de Sabadell SA
0.03 % 0.03 % 1 CDP223 / 5220.04 %90.00 %Banco do Brasil
0.01 % 0.01 % 0 CDP171 / 5220.01 %80.00 %Banco Santander Brazil
0.01 % 0.01 % 0 CDP245 / 5220.00 %100.00 %Banco Santander Chile
0.01 % 0.01 % 0 TC119 / 5220.00 %70.00 %Banco Santander Mexico
0.25 % 0.25 % 8 CDP244 / 5220.22 %100.01 %Banco Santander SA
0.02 % 0.02 % 0 CDP235 / 5220.01 %100.00 %BanColombia SA
0.01 % 0.01 % 0 ENV*298 / 5220.00 %130.00 %Bangkok Bank Co.
0.00 % 0.00 % 0 TC48 / 5220.00 %50.00 %Bangkok Life Assurance PCL
0.03 % 0.03 % 0 TC247 / 5220.01 %100.00 %Bank Central Asia Tbk PT
0.00 % 0.00 % 0 TC117 / 5220.00 %70.00 %Bank Danamon Indonesia Tbk PT
0.00 % 0.00 % 0 PRE476 / 5220.00 %400.00 %Bank Handlowy w Warszawie
0.02 % 0.02 % 0 TC123 / 5220.01 %70.00 %Bank Hapoalim BM Br
0.02 % 0.02 % 0 CDP224 / 5220.01 %90.00 %Bank Leumi Le-Israel BM
0.02 % 0.02 % 0 TC168 / 5220.01 %80.00 %Bank Mandiri Tbk PT
0.00 % 0.00 % 0 CDP*497 / 5220.00 %720.00 %Bank Millennium SA
0.01 % 0.01 % 0 TC265 / 5220.00 %110.00 %Bank Negara Indonesia Persero Tbk PT
0.58 % 0.57 % 25 CDP437 / 5220.30 %220.02 %Bank of America Corp
0.00 % 0.00 % 0 TC270 / 5220.00 %110.00 %Bank of Baroda
0.09 % 0.09 % 2 TC180 / 5220.06 %80.00 %Bank of China Ltd
0.01 % 0.01 % 0 CDP175 / 5220.01 %80.00 %Bank of Communications Co Ltd
0.01 % 0.01 % 0 CDP*281 / 5220.00 %120.00 %Bank of East Asia
0.00 % 0.00 % 0 TC258 / 5220.00 %110.00 %Bank of India
0.02 % 0.02 % 0 TC96 / 5220.02 %60.00 %Bank of Ireland Group
0.01 % 0.01 % 0 TC268 / 5220.00 %110.00 %Bank of Kyoto
0.11 % 0.11 % 3 CDP273 / 5220.06 %110.00 %Bank of Montreal
0.18 % 0.18 % 4 CDP291 / 5220.08 %130.00 %Bank of Nova Scotia Halifax
0.00 % 0.00 % 1 OTH450 / 5220.01 %280.00 %Bank of Piraeus
0.01 % 0.01 % 0 TC152 / 5220.00 %70.00 %Bank of Queensland Ltd
0.01 % 0.01 % 0 ENV*457 / 5220.00 %310.00 %Bank of the Philippine Islands
0.01 % 0.01 % 0 TC109 / 5220.00 %70.00 %Bank Pekao SA
0.03 % 0.03 % 0 TC136 / 5220.01 %70.00 %Bank Rakyat Indonesia Persero Tbk PT
0.01 % 0.01 % 0 TC231 / 5220.00 %100.00 %Bank Zachodni WBK SA
0.01 % 0.01 % 0 CDP373 / 5220.01 %170.00 %Bankia SA
www.trucost.com Copyright © 2018 S&P Trucost Limited, an affiliate of S&P Dow Jones Indices LLC-34-
Page 78

5133
Company BreakdownPortfolio
Company details
Weighting
Portfolio Benchmark
Carbon Apportioned
Tonnes CO2e
% ofPortfolio's
Total CarbonApportioned
CarbonIntensity
(tCO2e/£mn)
CarbonFootprint
Contribution(%)*
FootprintRank in
BenchmarkSector **
DataSource
***
0.02 % 0.01 % 0 CDP226 / 5220.01 %90.00 %Bankinter SA
0.01 % 0.00 % 0 CDP143 / 5220.00 %70.00 %Banque Cant Vaudoise Ptg
0.00 % 0.00 % 0 TC130 / 5220.00 %70.00 %Banregio Grupo Financiero SA de CV
0.10 % 0.10 % 19 CDP481 / 5220.11 %430.01 %Barclays
0.01 % 0.02 % 3 CDP462 / 5220.02 %330.00 %Barclays Africa Group Ltd
0.01 % 0.01 % 0 TC275 / 5220.00 %120.00 %BB Seguridade Participacoes S.A.
0.09 % 0.09 % 2 TC264 / 5220.04 %110.00 %BB&T Corp
0.01 % 0.01 % 0 TC177 / 5220.00 %80.00 %BDO Unibank Inc
0.01 % 0.01 % 1 CDP478 / 5220.00 %410.00 %Bendigo and Adelaide Bank Limited
0.80 % 0.80 % 1,331 TC518 / 522-0.17 %5440.86 %Berkshire Hathaway
0.13 % 0.13 % 2 CDP296 / 5220.03 %130.00 %BlackRock Inc
0.01 % 0.01 % 1 PRE440 / 5220.01 %220.00 %BNK Financial Group Inc
0.20 % 0.20 % 11 CDP259 / 5220.28 %110.01 %BNP Paribas
0.04 % 0.04 % 1 ENV*292 / 5220.01 %130.00 %BOC Hong Kong (Holdings) Ltd.
0.00 % 0.00 % 0 TC382 / 5220.00 %180.00 %Brait SA
0.01 % 0.01 % 0 TC53 / 5220.01 %50.00 %Brighthouse Financial Inc
0.08 % 0.08 % 18 AR*499 / 5220.05 %780.01 %Brookfield Asset Management Inc
0.01 % 0.01 % 0 TC370 / 5220.01 %170.00 %Brown & Brown Inc
0.04 % 0.04 % 1 CDP207 / 5220.02 %80.00 %CaixaBank
0.09 % 0.09 % 2 OTH274 / 5220.05 %110.00 %Canadian Imperial Bank of Commerce
0.00 % 0.00 % 0 TC188 / 5220.00 %80.00 %Canara Bank
0.09 % 0.09 % 5 CDP*311 / 5220.10 %150.00 %Capital One Financial
0.00 % 0.00 % 0 TC323 / 5220.00 %150.00 %Capital Securities Corp
0.01 % 0.01 % 0 AR*480 / 5220.00 %430.00 %Capitec Bank Hldgs
0.03 % 0.03 % 1 PRE36 / 5220.04 %50.00 %Cathay Financial Holding
0.03 % 0.03 % 0 TC326 / 5220.00 %150.00 %Cboe Global Markets, Inc
0.01 % 0.01 % 0 TC163 / 5220.01 %80.00 %Challenger Limited
0.01 % 0.01 % 0 TC118 / 5220.00 %70.00 %Chang Hwa Commercial Bank
0.01 % 0.01 % 0 TC194 / 5220.00 %80.00 %Chiba Bank
0.01 % 0.01 % 1 TC335 / 5220.01 %150.00 %China Cinda Asset Management Co Ltd
0.01 % 0.01 % 1 CDP308 / 5220.01 %140.00 %China CITIC Bank Corp Ltd
0.17 % 0.17 % 3 CDP*213 / 5220.11 %90.00 %China Construction Bank Corp
0.01 % 0.01 % 0 CDP471 / 5220.00 %350.00 %China Development Financial Co
0.00 % 0.00 % 0 TC222 / 5220.00 %90.00 %China Everbright Bank Company Limited
0.01 % 0.00 % 0 AR*90 / 5220.00 %60.00 %China Everbright Ltd.
0.01 % 0.01 % 0 TC337 / 5220.00 %150.00 %China Galaxy Securities Company Limited
www.trucost.com Copyright © 2018 S&P Trucost Limited, an affiliate of S&P Dow Jones Indices LLC-35-
Page 79

5133
Company BreakdownPortfolio
Company details
Weighting
Portfolio Benchmark
Carbon Apportioned
Tonnes CO2e
% ofPortfolio's
Total CarbonApportioned
CarbonIntensity
(tCO2e/£mn)
CarbonFootprint
Contribution(%)*
FootprintRank in
BenchmarkSector **
DataSource
***
0.01 % 0.01 % 0 TC331 / 5220.01 %150.00 %China Huarong Asset Management Co Ltd
0.00 % 0.00 % 0 TC342 / 5220.00 %150.00 %China International Capital Corp Ltd
0.01 % 0.01 % 1 ENV*112 / 5220.02 %70.00 %China Life Insurance
0.05 % 0.05 % 1 TC58 / 5220.07 %50.00 %China Life Insurance Co Ltd
0.03 % 0.03 % 0 TC132 / 5220.02 %70.00 %China Merchants Bank Co Ltd
0.00 % 0.00 % 0 TC340 / 5220.00 %150.00 %China Merchants Securities Co Ltd
0.01 % 0.01 % 0 TC129 / 5220.01 %70.00 %China Minsheng Banking Corp Ltd
0.03 % 0.03 % 1 TC56 / 5220.04 %50.00 %China Pacific Insurance (Group) Co Ltd
0.00 % 0.00 % 0 TC46 / 5220.01 %50.00 %China Reinsurance Group Corp
0.01 % 0.01 % 1 TC55 / 5220.03 %50.00 %China Taiping Insurance Holdings Co. Ltd.
0.00 % 0.00 % 0 TC253 / 5220.00 %100.00 %Chongqing Rural Commercial Bank
0.15 % 0.15 % 3 CDP110 / 5220.13 %70.00 %Chubb Limited
0.01 % 0.01 % 0 TC233 / 5220.00 %100.00 %Chugoku Bank
0.01 % 0.01 % 0 TC45 / 5220.01 %50.00 %CI Financial Corp
0.02 % 0.02 % 0 TC254 / 5220.01 %100.00 %CIMB Group Holdings Bhd
0.03 % 0.03 % 1 CDP242 / 5220.02 %100.00 %Cincinnati Financial Corp
0.02 % 0.02 % 0 TC151 / 5220.01 %70.00 %CIT Group Inc
0.01 % 0.01 % 0 TC300 / 5220.01 %140.00 %CITIC Securities Co Ltd
0.46 % 0.46 % 20 CDP*427 / 5220.27 %200.01 %Citigroup Inc
0.04 % 0.04 % 1 TC133 / 5220.02 %70.00 %Citizens Financial Group Inc
0.11 % 0.11 % 1 TC334 / 5220.01 %150.00 %CME Group Inc
0.01 % 0.01 % 0 CDP*3 / 5220.04 %30.00 %CNP Assurances
0.03 % 0.03 % 1 CDP460 / 5220.01 %320.00 %Comerica Inc (MI)
0.01 % 0.01 % 0 TC208 / 5220.00 %80.00 %Commerce Bancshares Inc (MO)
0.00 % 0.00 % 0 TC137 / 5220.00 %70.00 %Commercial Bank of Qatar
0.01 % 0.01 % 0 TC134 / 5220.00 %70.00 %Commercial International Bank (Egypt) S.A.
0.03 % 0.03 % 2 OTH*372 / 5220.04 %170.00 %Commerzbank AG
0.23 % 0.23 % 3 CDP280 / 5220.07 %120.00 %Commonwealth Bank Australia
0.01 % 0.01 % 1 CDP400 / 5220.01 %190.00 %Concordia Financial Group
0.00 % 0.00 % 0 TC76 / 5220.00 %60.00 %Coronation Fund Mangers Ltd
0.00 % 0.00 % 0 TC509 / 5220.00 %1330.00 %Corporacion Financiera Alba
0.03 % 0.03 % 0 CDP232 / 5220.01 %100.00 %Credicorp Limited
0.05 % 0.05 % 2 CDP89 / 5220.10 %60.00 %Credit Agricole SA
0.01 % 0.01 % 1 TC455 / 5220.01 %300.00 %Credit Saison Co
0.09 % 0.09 % 7 CDP375 / 5220.10 %180.00 %Credit Suisse Group AG
0.03 % 0.03 % 1 ENV*210 / 5220.04 %80.00 %CTBC Financial Holding Co Ltd
www.trucost.com Copyright © 2018 S&P Trucost Limited, an affiliate of S&P Dow Jones Indices LLC-36-
Page 80

5133
Company BreakdownPortfolio
Company details
Weighting
Portfolio Benchmark
Carbon Apportioned
Tonnes CO2e
% ofPortfolio's
Total CarbonApportioned
CarbonIntensity
(tCO2e/£mn)
CarbonFootprint
Contribution(%)*
FootprintRank in
BenchmarkSector **
DataSource
***
0.01 % 0.01 % 0 PRE453 / 5220.00 %300.00 %CYBG PLC
0.00 % 0.00 % 0 TC178 / 5220.00 %80.00 %Dah Sing Banking Group Ltd.
0.00 % 0.00 % 0 TC166 / 5220.00 %80.00 %Dah Sing Financial Holdings Ltd.
0.05 % 0.05 % 5 CDP104 / 5220.20 %70.00 %Dai-ichi Life Holdings Inc
0.00 % 0.00 % 0 TC358 / 5220.00 %160.00 %Daishi Bank
0.02 % 0.02 % 1 ENV355 / 5220.02 %160.00 %Daiwa Securities Group Inc
0.06 % 0.06 % 1 ENV*38 / 5220.04 %50.00 %Danske Bank A/S
0.01 % 0.01 % 1 PRE26 / 5220.04 %50.00 %DB INSURANCE
0.06 % 0.06 % 1 TC284 / 5220.02 %120.00 %DBS Group Holdings
0.07 % 0.07 % 9 ENV*406 / 5220.12 %200.01 %Deutsche Bank AG
0.05 % 0.05 % 1 CDP374 / 5220.01 %170.00 %Deutsche Boerse AG
0.00 % 0.00 % 0 CDP295 / 5220.01 %130.00 %DGB Financial Group Inc
0.02 % 0.02 % 0 CDP145 / 5220.02 %70.00 %Direct Line Insurance Group
0.06 % 0.05 % 2 TC366 / 5220.04 %170.00 %Discover Financial Services
0.01 % 0.01 % 0 CDP436 / 5220.01 %220.00 %Discovery Ltd
0.05 % 0.05 % 0 CDP85 / 5220.02 %60.00 %DNB ASA
0.00 % 0.00 % 0 TC116 / 5220.00 %70.00 %Doha Bank
0.00 % 0.00 % 0 TC322 / 5220.00 %150.00 %Dubai Financial Market
0.00 % 0.00 % 1 TC516 / 5220.00 %3300.00 %Dubai Investments (DI)
0.00 % 0.00 % 0 TC286 / 5220.00 %120.00 %Dubai Islamic Bank
0.01 % 0.01 % 0 PRE159 / 5220.00 %80.00 %E Sun Financial Hldgs Co Ltd
0.03 % 0.03 % 0 TC330 / 5220.01 %150.00 %E*TRADE Financial Corp
0.00 % 0.00 % 0 TC184 / 5220.01 %80.00 %EFG Eurobank Ergasias
0.00 % 0.00 % 0 TC332 / 5220.00 %150.00 %Egyptian Financial Group-Hermes Holding
0.03 % 0.03 % 1 AR*352 / 5220.02 %160.00 %Erste Group Bank AG
0.00 % 0.00 % 0 AR*33 / 5220.01 %50.00 %Euler Hermes Group
0.01 % 0.01 % 1 ENV*473 / 5220.01 %380.00 %Eurazeo
0.02 % 0.02 % 0 TC52 / 5220.02 %50.00 %Everest Re Group Ltd
0.02 % 0.02 % 55 TC491 / 5220.24 %570.04 %EXOR NV
0.03 % 0.03 % 1 TC61 / 5220.04 %50.00 %Fairfax Financial Holdings Limited
0.01 % 0.00 % 0 TC348 / 5220.00 %160.00 %Far East Horizon Ltd
0.00 % 0.00 % 0 TC141 / 5220.00 %70.00 %Far Eastern Intl Bank
0.03 % 0.03 % 4 TC461 / 5220.03 %320.00 %Fidelity National Financial Inc
0.05 % 0.05 % 3 CDP456 / 5220.02 %310.00 %Fifth Third Bancorp (OH)
0.01 % 0.01 % 0 TC127 / 5220.00 %70.00 %FinecoBank Spa
0.02 % 0.02 % 0 CDP369 / 5220.00 %170.00 %FIRST ABU DHABI BANK
www.trucost.com Copyright © 2018 S&P Trucost Limited, an affiliate of S&P Dow Jones Indices LLC-37-
Page 81

5133
Company BreakdownPortfolio
Company details
Weighting
Portfolio Benchmark
Carbon Apportioned
Tonnes CO2e
% ofPortfolio's
Total CarbonApportioned
CarbonIntensity
(tCO2e/£mn)
CarbonFootprint
Contribution(%)*
FootprintRank in
BenchmarkSector **
DataSource
***
0.01 % 0.01 % 0 CDP447 / 5220.00 %270.00 %First Financial Holding Co Ltd
0.00 % 0.00 % 0 TC120 / 5220.00 %70.00 %First Intl Bank of Israel
0.00 % 0.00 % 45 AR*521 / 522-0.01 %8580.03 %First Pacific Co. Ltd.
0.04 % 0.04 % 0 TC131 / 5220.01 %70.00 %First Republic Bank
0.03 % 0.03 % 3 CDP498 / 5220.01 %730.00 %FIRSTRAND LIMITED
0.04 % 0.03 % 1 CDP293 / 5220.02 %130.00 %Franklin Resources Inc
0.03 % 0.03 % 1 CDP105 / 5220.04 %70.00 %Fubon Financial Holding
0.01 % 0.01 % 0 TC404 / 5220.01 %190.00 %Fukuoka Financial Group
0.03 % 0.03 % 1 TC307 / 5220.02 %140.00 %Gallagher Arthur J. & Co
0.00 % 0.00 % 0 PRE442 / 5220.00 %230.00 %Gentera SAB de CV
0.01 % 0.01 % 0 TC329 / 5220.00 %150.00 %GF Securities Co Ltd
0.01 % 0.01 % 0 CDP5 / 5220.00 %30.00 %Gjensidige Forsikring ASA
0.20 % 0.20 % 6 CDP305 / 5220.11 %140.00 %Goldman Sachs Group Inc
0.02 % 0.02 % 1 CDP42 / 5220.04 %50.00 %Great-West Lifeco Inc
0.02 % 0.02 % 21 TC513 / 5220.01 %2970.01 %Groupe Bruxelles Lambert
0.00 % 0.00 % 0 TC125 / 5220.00 %70.00 %Grupo Aval Acciones y Valores
0.00 % 0.00 % 0 TC47 / 5220.00 %50.00 %GRUPO CATALANA OCCIDENTE SA
0.01 % 0.01 % 0 CDP*229 / 5220.01 %90.00 %Grupo de Inversiones Suramericana SA
0.01 % 0.01 % 0 ENV*454 / 5220.00 %300.00 %Grupo Elektra S.A.B. de C.V.
0.04 % 0.04 % 1 CDP441 / 5220.01 %230.00 %Grupo Financiero Banorte
0.01 % 0.01 % 0 TC126 / 5220.00 %70.00 %Grupo Financiero Inbursa
0.00 % 0.00 % 1 TC492 / 5220.01 %570.00 %GT Capital Holdings Inc
0.01 % 0.01 % 0 TC240 / 5220.00 %100.00 %Gunma Bank
0.00 % 0.00 % 0 ENV*187 / 5220.00 %80.00 %Guotai Junan International Holdings Ltd.
0.00 % 0.00 % 0 TC276 / 5220.00 %120.00 %Habib Bank Ltd
0.01 % 0.01 % 0 CDP403 / 5220.00 %190.00 %Hachijuni Bank
0.01 % 0.01 % 25 TC517 / 5220.00 %3980.02 %HACI OMER SABANCI HOLDING
0.00 % 0.00 % 0 TC327 / 5220.00 %150.00 %Haitong International Security Group
0.01 % 0.01 % 0 TC346 / 5220.00 %150.00 %Haitong Securities Co. Ltd.
0.03 % 0.03 % 2 CDP350 / 5220.03 %160.00 %Hana Financial Group Inc
0.04 % 0.04 % 0 CDP*234 / 5220.01 %100.00 %Hang Seng Bank Ltd.
0.02 % 0.02 % 1 TC60 / 5220.03 %50.00 %Hannover Ruck SE
0.00 % 0.00 % 0 TC49 / 5220.02 %50.00 %Hanwha Life Insurance Co Ltd
0.00 % 0.00 % 0 TC74 / 5220.01 %60.00 %Harel Insurance Inv Ltd 1
0.01 % 0.01 % 0 ENV*165 / 5220.00 %80.00 %Hargreaves Lansdown Plc
0.05 % 0.05 % 1 CDP39 / 5220.07 %50.00 %Hartford Finl Services Group
www.trucost.com Copyright © 2018 S&P Trucost Limited, an affiliate of S&P Dow Jones Indices LLC-38-
Page 82

5133
Company BreakdownPortfolio
Company details
Weighting
Portfolio Benchmark
Carbon Apportioned
Tonnes CO2e
% ofPortfolio's
Total CarbonApportioned
CarbonIntensity
(tCO2e/£mn)
CarbonFootprint
Contribution(%)*
FootprintRank in
BenchmarkSector **
DataSource
***
0.01 % 0.01 % 0 CDP13 / 5220.02 %40.00 %Helvetia Holding AG
0.01 % 0.01 % 0 TC199 / 5220.00 %80.00 %Hiroshima Bank
0.00 % 0.00 % 0 TC419 / 5220.00 %200.00 %Hitachi Capital Corp
0.00 % 0.00 % 0 TC193 / 5220.01 %80.00 %Hokuhoku Financial Group Inc
0.08 % 0.08 % 0 ENV402 / 5220.01 %190.00 %Hong Kong Exchanges and Clearing Ltd.
0.01 % 0.01 % 0 TC158 / 5220.00 %80.00 %Hong Leong Bank Bhd
0.00 % 0.00 % 0 TC169 / 5220.00 %80.00 %Hong Leong Financial Group Bhd
0.10 % 0.10 % 1 TC345 / 5220.02 %150.00 %Housing Development Finance Corp
0.45 % 0.46 % 15 CDP318 / 5220.27 %150.01 %HSBC Holdings Plc
0.01 % 0.01 % 0 TC144 / 5220.00 %70.00 %Hua Nan Financial Holdings
0.01 % 0.01 % 0 TC328 / 5220.00 %150.00 %Huatai Securities Co Ltd
0.03 % 0.03 % 2 CDP472 / 5220.01 %360.00 %Huntington Bancshares (OH)
0.01 % 0.01 % 1 CDP16 / 5220.04 %40.00 %Hyundai Fire & Marine Ins
0.00 % 0.00 % 0 TC506 / 5220.00 %1100.00 %Ichigo Inc
0.01 % 0.01 % 0 TC263 / 5220.01 %110.00 %ICICI Bank Ltd
0.00 % 0.00 % 0 TC94 / 5220.00 %60.00 %ICICI Prudential Life Insurance Company Ltd
0.00 % 0.00 % 0 TC399 / 5220.00 %190.00 %IDFC Bank Ltd
0.01 % 0.01 % 0 CDP12 / 5220.00 %40.00 %IGM Financial Inc
0.01 % 0.01 % 0 TC409 / 5220.00 %200.00 %Indiabulls Housing Finance Limited
0.01 % 0.01 % 0 CDP496 / 5220.00 %720.00 %Indusind Bank Ltd
0.13 % 0.13 % 2 TC228 / 5220.07 %90.00 %Industrial and Commercial Bank of China Ltd
0.01 % 0.01 % 1 PRE434 / 5220.01 %210.00 %Industrial Bank of Korea
0.02 % 0.02 % 1 CDP179 / 5220.03 %80.00 %Industrivarden AB
0.16 % 0.16 % 4 CDP278 / 5220.09 %120.00 %ING Groep NV
0.03 % 0.03 % 1 CDP351 / 5220.02 %160.00 %Insurance Australia Group Ltd
0.02 % 0.02 % 0 CDP35 / 5220.03 %50.00 %Intact Financial Corporation
0.09 % 0.09 % 1 TC333 / 5220.02 %150.00 %Intercontinental Exchange Inc
0.11 % 0.11 % 4 CDP272 / 5220.10 %110.00 %Intesa SanPaolo
0.03 % 0.03 % 1 CDP376 / 5220.02 %180.00 %Invesco Ltd
0.00 % 0.00 % 0 CDP474 / 5220.00 %380.00 %Investec Ltd
0.01 % 0.01 % 0 CDP470 / 5220.00 %350.00 %Investec PLC.
0.05 % 0.05 % 4 TC501 / 5220.01 %840.00 %Investor AB
0.01 % 0.01 % 0 PRE261 / 5220.00 %110.00 %Ioof Hldgs Ltd
0.01 % 0.01 % 1 PRE469 / 5220.01 %350.00 %Israel Discount Bank 0.1
0.00 % 0.00 % 0 TC69 / 5220.00 %50.00 %Israel Phoenix Assurance 1
0.00 % 0.00 % 0 TC135 / 5220.00 %70.00 %Itau Corpbanca S.A.
www.trucost.com Copyright © 2018 S&P Trucost Limited, an affiliate of S&P Dow Jones Indices LLC-39-
Page 83

5133
Company BreakdownPortfolio
Company details
Weighting
Portfolio Benchmark
Carbon Apportioned
Tonnes CO2e
% ofPortfolio's
Total CarbonApportioned
CarbonIntensity
(tCO2e/£mn)
CarbonFootprint
Contribution(%)*
FootprintRank in
BenchmarkSector **
DataSource
***
0.10 % 0.10 % 2 OTH185 / 5220.07 %80.00 %Itau Unibanco Holding SA
0.03 % 0.03 % 9 CDP515 / 5220.00 %3280.01 %Itausa Investimentos Itau S.A
0.01 % 0.01 % 0 TC230 / 5220.00 %100.00 %Iyo Bank
0.00 % 0.00 % 0 TC384 / 5220.00 %180.00 %Jafco Co
0.02 % 0.02 % 0 TC383 / 5220.00 %180.00 %Japan Exchange Group Inc
0.01 % 0.01 % 0 TC195 / 5220.00 %80.00 %Japan Post Bank co
0.03 % 0.04 % 25 TC493 / 5220.10 %590.02 %Japan Post Holdings co
0.00 % 0.00 % 0 TC93 / 5220.02 %60.00 %Japan Post Insurance co
0.78 % 0.78 % 25 CDP387 / 5220.38 %180.02 %JP Morgan Chase & Co
0.00 % 0.00 % 0 CDP500 / 5220.00 %800.00 %JSE Ltd
0.03 % 0.03 % 0 CDP102 / 5220.01 %70.00 %Julius Baer Group
0.00 % 0.00 % 0 TC357 / 5220.00 %160.00 %Juroku Bank
0.01 % 0.01 % 0 TC167 / 5220.00 %80.00 %Jyske Bank AS
0.03 % 0.03 % 2 ENV*438 / 5220.02 %220.00 %Kasikornbank
0.04 % 0.04 % 3 CDP*443 / 5220.03 %240.00 %KB Financial Group Inc.
0.05 % 0.05 % 2 CDP312 / 5220.03 %150.00 %KBC Group NV
0.00 % 0.00 % 0 TC189 / 5220.00 %80.00 %Keiyo Bank
0.05 % 0.05 % 2 CDP433 / 5220.02 %210.00 %KeyCorp
0.00 % 0.00 % 0 TC483 / 5220.00 %450.00 %Kingston Financial Froup Ltd
0.02 % 0.02 % 0 TC495 / 5220.00 %640.00 %Kinnevik Investment AB
0.01 % 0.01 % 0 TC146 / 5220.00 %70.00 %Komercni Banka
0.00 % 0.00 % 1 TC297 / 5220.01 %130.00 %Korea Investment Holdings Co Ltd
0.01 % 0.01 % 0 CDP344 / 5220.00 %150.00 %Kotak Mahindra Bank Ltd
0.00 % 0.00 % 0 TC363 / 5220.00 %170.00 %KRUK SA
0.01 % 0.01 % 0 TC183 / 5220.01 %80.00 %Krung Thai Bank Co
0.01 % 0.01 % 0 TC241 / 5220.00 %100.00 %Kyushu Financial Hds
0.00 % 0.00 % 0 TC398 / 5220.00 %190.00 %L&T Finance Holdings Ltd
0.00 % 0.00 % 0 TC512 / 5220.00 %2150.00 %Latour Investment AB
0.05 % 0.05 % 2 CDP101 / 5220.08 %70.00 %Legal & General Group
0.02 % 0.02 % 97 TC520 / 522-0.03 %7570.06 %Leucadia National Corp (NY)
0.00 % 0.00 % 0 CDP317 / 5220.01 %150.00 %Liberty Hldgs
0.01 % 0.01 % 0 TC415 / 5220.00 %200.00 %LIC Housing Finance Ltd
0.04 % 0.04 % 1 CDP8 / 5220.05 %40.00 %Lincoln National Corp
0.15 % 0.15 % 8 CDP237 / 5220.22 %100.00 %Lloyds Banking Group Plc
0.03 % 0.03 % 19 TC507 / 5220.03 %1230.01 %Loews Corp
0.04 % 0.04 % 1 CDP422 / 5220.01 %200.00 %London Stock Exchange Plc
www.trucost.com Copyright © 2018 S&P Trucost Limited, an affiliate of S&P Dow Jones Indices LLC-40-
Page 84

5133
Company BreakdownPortfolio
Company details
Weighting
Portfolio Benchmark
Carbon Apportioned
Tonnes CO2e
% ofPortfolio's
Total CarbonApportioned
CarbonIntensity
(tCO2e/£mn)
CarbonFootprint
Contribution(%)*
FootprintRank in
BenchmarkSector **
DataSource
***
0.00 % 0.01 % 1 TC511 / 5220.00 %1700.00 %Lundbergs AB-B Shs
0.05 % 0.05 % 1 TC238 / 5220.02 %100.00 %M&T Bank Corp
0.05 % 0.05 % 2 CDP388 / 5220.03 %180.00 %Macquarie Group Ltd
0.01 % 0.01 % 0 CDP*11 / 5220.00 %40.00 %Magellan Financial Group Limited
0.00 % 0.00 % 0 CDP221 / 5220.00 %90.00 %Mahindra & Mahindra Financial Services Ltd
0.03 % 0.03 % 1 CDP385 / 5220.02 %180.00 %Malayan Banking Bhd
0.09 % 0.09 % 13 CDP439 / 5220.16 %220.01 %Manulife Financial Corporation
0.01 % 0.01 % 1 CDP29 / 5220.04 %50.00 %Mapfre SA
0.03 % 0.03 % 0 TC50 / 5220.02 %50.00 %Markel Corp
0.10 % 0.10 % 3 CDP395 / 5220.05 %180.00 %Marsh & McLennan Companies
0.01 % 0.01 % 0 TC154 / 5220.00 %70.00 %Masraf Al Rayan Bank
0.00 % 0.00 % 0 TC380 / 5220.00 %180.00 %Matsui Securities Co Ltd
0.00 % 0.00 % 0 PRE349 / 5220.00 %160.00 %Mbank
0.01 % 0.01 % 0 TC246 / 5220.00 %100.00 %Mebuki Financial Group Inc
0.01 % 0.01 % 0 TC83 / 5220.02 %60.00 %Medibank Private Limited
0.01 % 0.01 % 0 CDP34 / 5220.01 %50.00 %Mediobanca SpA
0.02 % 0.02 % 0 TC150 / 5220.01 %70.00 %Mega Financial Holding Co Ltd
0.11 % 0.11 % 4 CDP28 / 5220.25 %50.00 %Metlife Inc
0.00 % 0.00 % 1 TC508 / 5220.00 %1310.00 %Metro Pacific Investments Corp
0.01 % 0.00 % 0 TC227 / 5220.00 %90.00 %Metropolitan Bank & Trust
0.00 % 0.00 % 0 TC71 / 5220.01 %60.00 %Migdal Insurance Hdlgs
0.01 % 0.01 % 0 CDP396 / 5220.00 %180.00 %Mirae Asset Daewoo
0.19 % 0.19 % 7 CDP316 / 5220.12 %150.00 %Mitsubishi UFJ Financial Group Inc
0.01 % 0.01 % 2 TC484 / 5220.01 %470.00 %Mitsubishi UFJ Lease & Finance Co Ltd
0.01 % 0.01 % 0 PRE448 / 5220.00 %270.00 %Mizrahi Tefahot Bank Ltd
0.10 % 0.10 % 6 CDP407 / 5220.08 %200.00 %Mizuho Financial Group Inc
0.00 % 0.00 % 1 CDP467 / 5220.01 %340.00 %MMI Holdings Ltd
0.00 % 0.00 % 0 CDP487 / 5220.00 %520.00 %Moneta Money Bank
0.05 % 0.05 % 1 CDP405 / 5220.01 %190.00 %Moody's Corp
0.15 % 0.15 % 7 CDP390 / 5220.11 %180.00 %Morgan Stanley
0.01 % 0.01 % 0 TC339 / 5220.00 %150.00 %Moscow Exchange MICEX-RTS PJSC
0.04 % 0.04 % 3 CDP111 / 5220.12 %70.00 %MS&AD Insurance Group Holdings Inc
0.07 % 0.07 % 4 PRE81 / 5220.21 %60.00 %Munich Re AG
0.02 % 0.02 % 1 TC464 / 5220.01 %330.00 %Nasdaq Inc
0.15 % 0.15 % 4 CDP392 / 5220.06 %180.00 %National Australia Bank Ltd
0.04 % 0.04 % 0 CDP88 / 5220.02 %60.00 %National Bank of Canada
www.trucost.com Copyright © 2018 S&P Trucost Limited, an affiliate of S&P Dow Jones Indices LLC-41-
Page 85

5133
Company BreakdownPortfolio
Company details
Weighting
Portfolio Benchmark
Carbon Apportioned
Tonnes CO2e
% ofPortfolio's
Total CarbonApportioned
CarbonIntensity
(tCO2e/£mn)
CarbonFootprint
Contribution(%)*
FootprintRank in
BenchmarkSector **
DataSource
***
0.00 % 0.00 % 1 CDP458 / 5220.01 %320.00 %National Bank of Greece SA
0.02 % 0.02 % 1 CDP75 / 5220.03 %60.00 %Natixis
0.01 % 0.01 % 1 TC368 / 5220.01 %170.00 %Navient Corp
0.01 % 0.01 % 1 CDP494 / 5220.00 %610.00 %Nedbank Group
0.01 % 0.01 % 0 TC68 / 5220.02 %50.00 %NEW CHINA LIFE INSURANCE CO
0.01 % 0.01 % 0 TC124 / 5220.01 %70.00 %New York Community Bancorp Inc
0.00 % 0.00 % 0 PRE203 / 5220.00 %80.00 %NH Investment & Securities Co/ New
0.01 % 0.01 % 0 TC463 / 5220.00 %330.00 %Nihon M&A Center Inc
0.00 % 0.00 % 0 TC196 / 5220.00 %80.00 %Nishi-Nippon Financial Holdings Inc
0.03 % 0.03 % 1 CDP6 / 5220.07 %30.00 %NN Group N.V.
0.04 % 0.04 % 3 CDP432 / 5220.04 %210.00 %Nomura Holdings Inc
0.10 % 0.10 % 1 CDP211 / 5220.03 %90.00 %Nordea AB
0.00 % 0.00 % 0 TC192 / 5220.00 %80.00 %North Pacific Bank Ltd
0.04 % 0.04 % 1 CDP*401 / 5220.02 %190.00 %Northern Trust Corp (IL)
0.03 % 0.03 % 9 CDP477 / 5220.06 %400.01 %Old Mutual
0.01 % 0.01 % 0 TC51 / 5220.02 %50.00 %Old Republic Intl Corp
0.00 % 0.00 % 0 TC417 / 5220.00 %200.00 %Orient Corp
0.00 % 0.00 % 0 TC341 / 5220.00 %150.00 %Orient Securities Company Limited
0.05 % 0.05 % 10 CDP482 / 5220.06 %430.01 %Orix Corp
0.02 % 0.02 % 1 PRE391 / 5220.01 %180.00 %OTP Bank
0.06 % 0.06 % 1 TC215 / 5220.05 %90.00 %Overseas-Chinese Banking
0.01 % 0.01 % 38 TC522 / 522-0.02 %1,5580.02 %Pargesa Hldgs SA Br
0.03 % 0.03 % 0 CDP428 / 5220.00 %200.00 %Partners Group Hldg
0.01 % 0.01 % 1 TC72 / 5220.06 %60.00 %People's Insurance Co. (Group) of China
0.01 % 0.01 % 0 TC121 / 5220.00 %70.00 %People's United Financial Inc
0.00 % 0.00 % 0 PRE315 / 5220.00 %150.00 %Perpetual Limited
0.02 % 0.02 % 1 TC54 / 5220.05 %50.00 %PICC Property and Casualty Co. Ltd. - H
0.09 % 0.09 % 3 TC84 / 5220.12 %60.00 %Ping An Insurance (Group) Co of China Ltd
0.02 % 0.02 % 0 TC217 / 5220.01 %90.00 %PKO Bank Polski SA
0.00 % 0.00 % 0 TC114 / 5220.00 %70.00 %Platinum Asset Management Limited
0.15 % 0.15 % 7 CDP459 / 5220.06 %320.00 %PNC Finl Services Group
0.00 % 0.00 % 0 CDP*99 / 5220.00 %70.00 %Porto Seguro SA
0.01 % 0.01 % 0 TC172 / 5220.01 %80.00 %Postal Savings Bank of China Co Ltd
0.01 % 0.01 % 3 TC304 / 5220.05 %140.00 %Poste Italiane Spa
0.02 % 0.02 % 2 CDP25 / 5220.12 %50.00 %Power Corporation of Canada
0.00 % 0.00 % 0 TC421 / 5220.00 %200.00 %Power Finance Corp Ltd
www.trucost.com Copyright © 2018 S&P Trucost Limited, an affiliate of S&P Dow Jones Indices LLC-42-
Page 86

5133
Company BreakdownPortfolio
Company details
Weighting
Portfolio Benchmark
Carbon Apportioned
Tonnes CO2e
% ofPortfolio's
Total CarbonApportioned
CarbonIntensity
(tCO2e/£mn)
CarbonFootprint
Contribution(%)*
FootprintRank in
BenchmarkSector **
DataSource
***
0.01 % 0.02 % 1 CDP21 / 5220.04 %40.00 %Power Financial Corp
0.02 % 0.02 % 0 TC65 / 5220.02 %50.00 %Powszechny Zaklad Ubezpieczen SA
0.04 % 0.04 % 1 CDP*115 / 5220.05 %70.00 %Principal Financial Group
0.06 % 0.06 % 6 PRE378 / 5220.09 %180.00 %Progressive Corp
0.00 % 0.00 % 0 CDP206 / 5220.01 %80.00 %Provident Financial
0.11 % 0.10 % 6 OTH*100 / 5220.24 %70.00 %Prudential Financial Inc
0.14 % 0.14 % 4 CDP20 / 5220.23 %40.00 %Prudential Plc
0.00 % 0.00 % 0 TC429 / 5220.00 %200.00 %PSG Group Ltd
0.03 % 0.03 % 0 TC218 / 5220.02 %90.00 %Public Bank Bhd
0.00 % 0.00 % 0 TC262 / 5220.00 %110.00 %Punjab National Bank
0.00 % 0.00 % 0 TC108 / 5220.01 %70.00 %Qatar Insurance Company
0.00 % 0.00 % 0 TC212 / 5220.00 %90.00 %Qatar International Islam
0.00 % 0.00 % 0 TC140 / 5220.00 %70.00 %Qatar Islamic Bank
0.02 % 0.02 % 0 CDP239 / 5220.01 %100.00 %Qatar National Bank
0.03 % 0.02 % 1 ENV*31 / 5220.06 %50.00 %QBE Insurance Group Ltd
0.01 % 0.01 % 0 CDP267 / 5220.01 %110.00 %Raiffeisen Bank International AG
0.00 % 0.00 % 0 TC82 / 5220.00 %60.00 %Rand Merchant Investment Holdings Limited
0.02 % 0.02 % 1 TC319 / 5220.02 %150.00 %Raymond James Financial Inc
0.04 % 0.04 % 1 TC182 / 5220.02 %80.00 %Regions Financial Corp
0.00 % 0.00 % 0 TC299 / 5220.00 %130.00 %Reliance Capital Ltd
0.02 % 0.02 % 16 CDP519 / 522-0.00 %7210.01 %Remgro Ltd
0.01 % 0.01 % 0 PRE30 / 5220.01 %50.00 %RenaissanceRe Hldgs
0.03 % 0.03 % 2 ENV*430 / 5220.02 %200.00 %Resona Holdings Inc
0.00 % 0.00 % 0 TC176 / 5220.00 %80.00 %RHB Bank Bhd
0.01 % 0.01 % 0 TC279 / 5220.00 %120.00 %RMB Holdings
0.26 % 0.26 % 4 CDP236 / 5220.12 %100.00 %Royal Bank of Canada
0.03 % 0.03 % 2 AR*446 / 5220.02 %260.00 %Royal Bank of Scotland Group
0.02 % 0.02 % 1 AR*40 / 5220.04 %50.00 %RSA Insurance Group Plc
0.00 % 0.00 % 0 TC420 / 5220.00 %200.00 %Rural Electrification Corp Ltd
0.09 % 0.09 % 1 CDP394 / 5220.02 %180.00 %S&P Global Inc
0.06 % 0.06 % 0 AR*10 / 5220.03 %40.00 %Sampo Oyj A
0.00 % 0.00 % 0 TC364 / 5220.00 %170.00 %Samsung Card
0.02 % 0.02 % 1 CDP14 / 5220.05 %40.00 %Samsung Fire & Marine
0.01 % 0.01 % 1 PRE216 / 5220.04 %90.00 %Samsung Life Insurance Co Ltd
0.00 % 0.00 % 0 CDP107 / 5220.01 %70.00 %Samsung Secs Co
0.00 % 0.00 % 0 TC314 / 5220.00 %150.00 %San-In Godo Bank
www.trucost.com Copyright © 2018 S&P Trucost Limited, an affiliate of S&P Dow Jones Indices LLC-43-
Page 87

5133
Company BreakdownPortfolio
Company details
Weighting
Portfolio Benchmark
Carbon Apportioned
Tonnes CO2e
% ofPortfolio's
Total CarbonApportioned
CarbonIntensity
(tCO2e/£mn)
CarbonFootprint
Contribution(%)*
FootprintRank in
BenchmarkSector **
DataSource
***
0.02 % 0.02 % 1 CDP257 / 5220.02 %100.00 %Sanlam Ltd
0.00 % 0.00 % 0 PRE174 / 5220.00 %80.00 %Santam Ltd
0.08 % 0.08 % 5 PRE408 / 5220.06 %200.00 %Sberbank of Russia PJSC
0.01 % 0.01 % 0 TC356 / 5220.01 %160.00 %SBI Holdings Inc
0.01 % 0.01 % 0 CDP80 / 5220.00 %60.00 %Schroders Plc
0.12 % 0.12 % 1 CDP289 / 5220.03 %120.00 %Schwab Charles Corp
0.06 % 0.06 % 2 CDP4 / 5220.16 %30.00 %Schweiz-Ruckversicherungs Br
0.01 % 0.01 % 1 OTH*17 / 5220.05 %40.00 %SCOR SE
0.04 % 0.04 % 0 CDP157 / 5220.02 %80.00 %SEB-Skand Enskilda Banken
0.02 % 0.02 % 0 TC338 / 5220.00 %150.00 %SEI Investments Corp
0.00 % 0.00 % 0 TC197 / 5220.00 %80.00 %Senshu Ikeda Holdings
0.01 % 0.01 % 0 CDP87 / 5220.00 %60.00 %Seven Bank Ltd
0.00 % 0.00 % 0 TC198 / 5220.00 %80.00 %Shiga Bank
0.01 % 0.01 % 1 TC106 / 5220.03 %70.00 %Shin Kong Financial Hdlgs
0.05 % 0.05 % 3 CDP294 / 5220.06 %130.00 %Shinhan Financial Group Ltd
0.01 % 0.01 % 0 TC379 / 5220.00 %180.00 %Shinsei Bank Ltd
0.01 % 0.01 % 0 TC225 / 5220.01 %90.00 %Shizuoka Bank
0.01 % 0.01 % 0 TC414 / 5220.00 %200.00 %Shriram Transport Finance Co Ltd
0.03 % 0.03 % 0 TC170 / 5220.01 %80.00 %Siam Commercial Bank PCL
0.01 % 0.01 % 0 TC361 / 5220.00 %170.00 %Singapore Exchange Ltd
0.01 % 0.01 % 0 ENV*354 / 5220.00 %160.00 %SinoPac Financial Holdings Co
0.10 % 0.10 % 6 CDP251 / 5220.16 %100.00 %Societe Generale
0.01 % 0.01 % 0 TC479 / 5220.00 %430.00 %Sofina
0.03 % 0.03 % 2 CDP*147 / 5220.08 %70.00 %Sompo Holdings Inc
0.01 % 0.01 % 0 TC95 / 5220.01 %60.00 %SONY FINANCIAL HOLDINGS INC
0.02 % 0.02 % 1 CDP1 / 5220.06 %20.00 %St James's Place
0.03 % 0.03 % 4 CDP466 / 5220.03 %340.00 %Standard Bank Group Ltd
0.06 % 0.06 % 4 ENV445 / 5220.04 %250.00 %Standard Chartered
0.04 % 0.04 % 1 CDP70 / 5220.03 %60.00 %Standard Life Aberdeen
0.01 % 0.02 % 1 TC271 / 5220.01 %110.00 %State Bank of India
0.08 % 0.08 % 3 CDP393 / 5220.04 %180.00 %State Street Corp
0.00 % 0.00 % 0 CDP2 / 5220.01 %30.00 %Sul America SA
0.12 % 0.12 % 5 TC283 / 5220.10 %120.00 %Sumitomo Mitsui Financial Group
0.03 % 0.03 % 1 CDP287 / 5220.03 %120.00 %Sumitomo Mitsui Trust Holdings Inc
0.06 % 0.06 % 3 CDP256 / 5220.07 %100.00 %Sun Life Financial Serv Canada
0.03 % 0.03 % 1 CDP250 / 5220.04 %100.00 %Suncorp Group Ltd
www.trucost.com Copyright © 2018 S&P Trucost Limited, an affiliate of S&P Dow Jones Indices LLC-44-
Page 88

5133
Company BreakdownPortfolio
Company details
Weighting
Portfolio Benchmark
Carbon Apportioned
Tonnes CO2e
% ofPortfolio's
Total CarbonApportioned
CarbonIntensity
(tCO2e/£mn)
CarbonFootprint
Contribution(%)*
FootprintRank in
BenchmarkSector **
DataSource
***
0.07 % 0.07 % 1 TC209 / 5220.03 %80.00 %SunTrust Banks Inc (GA)
0.01 % 0.01 % 0 TC202 / 5220.00 %80.00 %Suruga Bank
0.05 % 0.05 % 1 CDP266 / 5220.01 %110.00 %Svenska Handelsbanken
0.07 % 0.07 % 1 CDP243 / 5220.02 %100.00 %Swedbank AB
0.03 % 0.03 % 1 CDP9 / 5220.08 %40.00 %Swiss Life Reg
0.06 % 0.06 % 3 TC367 / 5220.06 %170.00 %Synchrony Financial
0.05 % 0.05 % 1 OTH360 / 5220.02 %170.00 %T Rowe Price Group Inc
0.02 % 0.02 % 1 CDP164 / 5220.05 %80.00 %T&D Holdings Inc
0.01 % 0.01 % 0 ENV*161 / 5220.00 %80.00 %Taishin Financial Hdlgs
0.00 % 0.00 % 0 TC153 / 5220.00 %70.00 %Taiwan Business Bank
0.01 % 0.01 % 0 TC138 / 5220.00 %70.00 %Taiwan Cooperative Financial Holding
0.00 % 0.00 % 0 TC67 / 5220.02 %50.00 %Talanx AG
0.03 % 0.03 % 0 TC353 / 5220.01 %160.00 %TD Ameritrade Holding Corporation
0.12 % 0.12 % 4 CDP425 / 5220.06 %200.00 %The Bank of New York Mellon Corp
0.03 % 0.03 % 3 CDP489 / 5220.02 %540.00 %Thomson Reuters Corporation
0.00 % 0.00 % 0 TC139 / 5220.00 %70.00 %TMB Bank Pcl
0.00 % 0.00 % 0 TC381 / 5220.00 %180.00 %Tokai Tokyo Financial Holdings Inc
0.06 % 0.06 % 3 CDP92 / 5220.12 %60.00 %Tokio Marine Holdings Inc
0.00 % 0.00 % 2 TC488 / 5220.01 %530.00 %Tokyo Century Corp
0.02 % 0.02 % 0 TC155 / 5220.02 %70.00 %Torchmark Corp
0.24 % 0.24 % 5 CDP309 / 5220.10 %150.00 %Toronto-Dominion Bank
0.08 % 0.08 % 2 CDP37 / 5220.11 %50.00 %Travelers Cos Inc
0.01 % 0.01 % 0 PRE27 / 5220.00 %50.00 %Tryg A/S
0.01 % 0.01 % 1 CDP371 / 5220.01 %170.00 %Turkiye Garanti Bankasi
0.00 % 0.00 % 0 CDP424 / 5220.01 %200.00 %Turkiye Halk Bankasi
0.01 % 0.01 % 0 ENV*181 / 5220.01 %80.00 %Turkiye Is Bankasi A
0.00 % 0.00 % 0 CDP98 / 5220.01 %70.00 %Turkiye Vakiflar Bankasi TAO
0.01 % 0.01 % 1 ENV*359 / 5220.01 %160.00 %UBI Banca
0.14 % 0.14 % 6 CDP313 / 5220.11 %150.00 %UBS Group AG
0.11 % 0.11 % 7 CDP431 / 5220.09 %200.00 %Unicredit SpA Ord
0.01 % 0.01 % 1 ENV386 / 5220.02 %180.00 %UnipolSai Assicurazioni SpA
0.05 % 0.05 % 0 TC156 / 5220.02 %80.00 %United Overseas Bank
0.03 % 0.03 % 1 CDP43 / 5220.04 %50.00 %Unum Group
0.20 % 0.19 % 8 CDP*449 / 5220.08 %270.01 %US Bancorp
0.00 % 0.00 % 0 TC66 / 5220.01 %50.00 %Vienna Insurance Group
0.02 % 0.02 % 1 TC86 / 5220.06 %60.00 %Voya Financial, Inc
www.trucost.com Copyright © 2018 S&P Trucost Limited, an affiliate of S&P Dow Jones Indices LLC-45-
Page 89

5133
Company BreakdownPortfolio
Company details
Weighting
Portfolio Benchmark
Carbon Apportioned
Tonnes CO2e
% ofPortfolio's
Total CarbonApportioned
CarbonIntensity
(tCO2e/£mn)
CarbonFootprint
Contribution(%)*
FootprintRank in
BenchmarkSector **
DataSource
***
0.01 % 0.01 % 0 TC186 / 5220.01 %80.00 %VTB Bank PJSC
0.57 % 0.57 % 23 CDP426 / 5220.31 %200.01 %Wells Fargo & Co
0.01 % 0.01 % 11 AR*510 / 5220.01 %1480.01 %Wendel
0.20 % 0.20 % 4 CDP377 / 5220.06 %180.00 %Westpac Banking Corp
0.04 % 0.04 % 3 TC452 / 5220.03 %290.00 %Willis Towers Watson PLC
0.02 % 0.02 % 2 PRE465 / 5220.02 %340.00 %Woori Bank
0.01 % 0.01 % 0 TC62 / 5220.03 %50.00 %WR Berkley Corp
0.02 % 0.02 % 1 ENV*15 / 5220.04 %40.00 %XL Group Ltd
0.01 % 0.01 % 0 TC201 / 5220.00 %80.00 %Yamaguchi Financial Group
0.00 % 0.00 % 0 CDP302 / 5220.00 %140.00 %Yapi Ve Kredi Bankasi
0.02 % 0.02 % 0 CDP*486 / 5220.00 %480.00 %Yes Bank Ltd
0.01 % 0.01 % 0 ENV*204 / 5220.01 %80.00 %Yuanta Financial Holding Co Ltd
0.00 % 0.00 % 0 TC411 / 5220.00 %200.00 %Zenkoku Hosho Co Ltd
0.02 % 0.02 % 0 TC122 / 5220.01 %70.00 %Zions Bancorp (UT)
0.11 % 0.11 % 4 CDP22 / 5220.26 %40.00 %Zurich Insurance Group AG
8.20 %1,507 0.98 %10.92 %10.93 % 51Health Care
0.00 % 0.00 % 0 TC64 / 1890.00 %650.00 %3SBio Inc
0.21 % 0.21 % 104 CDP186 / 1890.02 %3590.07 %Abbott Laboratories
0.33 % 0.32 % 21 CDP38 / 1890.09 %570.01 %AbbVie Inc.
0.12 % 0.12 % 9 PRE5 / 1890.25 %110.01 %Aetna Inc
0.05 % 0.05 % 4 CDP*84 / 1890.01 %670.00 %Agilent Technologies Inc
0.07 % 0.07 % 3 TC112 / 1890.01 %760.00 %Alexion Pharmaceuticals Inc
0.01 % 0.01 % 5 AR*11 / 1890.05 %250.00 %Alfresa Holdings Corp
0.03 % 0.03 % 2 TC162 / 1890.00 %1110.00 %Align Technology Inc
0.02 % 0.02 % 1 TC66 / 1890.00 %650.00 %Alkermes plc
0.16 % 0.16 % 10 CDP29 / 1890.05 %470.01 %Allergan plc
0.03 % 0.03 % 25 OTH8 / 1890.40 %180.02 %AmerisourceBergen Corp
0.32 % 0.31 % 12 CDP19 / 1890.09 %360.01 %Amgen Inc
0.01 % 0.01 % 6 PRE184 / 1890.00 %2720.00 %Ansell Ltd
0.12 % 0.12 % 5 CDP1 / 1890.34 %40.00 %Anthem Inc
0.01 % 0.01 % 0 TC159 / 1890.00 %1080.00 %Asahi Intecc Co Ltd
0.02 % 0.02 % 3 CDP173 / 1890.00 %1370.00 %Aspen Pharmacare Holdings Ltd
0.06 % 0.06 % 9 CDP48 / 1890.03 %610.01 %Astellas Pharma Inc
0.19 % 0.19 % 19 CDP53 / 1890.07 %630.01 %AstraZeneca Plc
0.01 % 0.01 % 7 PRE188 / 189-0.00 %6510.00 %Aurobindo Pharma Ltd
www.trucost.com Copyright © 2018 S&P Trucost Limited, an affiliate of S&P Dow Jones Indices LLC-46-
Page 90

5133
Company BreakdownPortfolio
Company details
Weighting
Portfolio Benchmark
Carbon Apportioned
Tonnes CO2e
% ofPortfolio's
Total CarbonApportioned
CarbonIntensity
(tCO2e/£mn)
CarbonFootprint
Contribution(%)*
FootprintRank in
BenchmarkSector **
DataSource
***
0.01 % 0.01 % 1 TC145 / 1890.00 %890.00 %Bangkok Dusit Medical Services PCL
0.05 % 0.05 % 5 PRE148 / 1890.01 %920.00 %Bard C.R. Inc
0.07 % 0.07 % 18 CDP171 / 1890.03 %1340.01 %Baxter Intl Inc
0.26 % 0.26 % 85 CDP165 / 1890.15 %1170.06 %Bayer AG
0.10 % 0.10 % 16 CDP151 / 1890.04 %930.01 %Becton Dickinson & Co
0.15 % 0.15 % 6 CDP17 / 1890.04 %340.00 %Biogen Inc
0.04 % 0.04 % 1 TC63 / 1890.00 %650.00 %Biomarin Pharmaceutical Inc
0.01 % 0.01 % 1 PRE62 / 1890.00 %650.00 %BioMerieux
0.02 % 0.01 % 1 TC76 / 1890.00 %650.00 %Bioverativ
0.09 % 0.09 % 7 CDP35 / 1890.03 %550.00 %Boston Scientific Corp
0.24 % 0.24 % 16 CDP*39 / 1890.07 %570.01 %Bristol-Myers Squibb
0.00 % 0.00 % 0 TC146 / 1890.00 %890.00 %Bumrungrad Hospital PCL
0.00 % 0.00 % 1 PRE169 / 1890.00 %1270.00 %Cadila Healthcare Ltd
0.05 % 0.05 % 43 CDP12 / 1890.43 %270.03 %Cardinal Health Inc
0.26 % 0.26 % 5 CDP16 / 1890.04 %330.00 %Celgene Corp
0.02 % 0.02 % 0 TC120 / 1890.00 %770.00 %Celltrion Inc
0.04 % 0.04 % 3 TC4 / 1890.16 %50.00 %Centene Corp
0.05 % 0.05 % 2 TC13 / 1890.02 %270.00 %Cerner Corp
0.01 % 0.00 % 0 TC65 / 1890.00 %650.00 %China Medical System Holdings Ltd.
0.01 % 0.00 % 5 ENV*44 / 1890.02 %600.00 %China Resources Pharmaceutical Group Ltd
0.00 % 0.00 % 0 TC69 / 1890.00 %650.00 %China Traditional Chinese Medicine
0.02 % 0.02 % 1 CDP36 / 1890.01 %550.00 %Chugai Pharmaceutical Co
0.11 % 0.11 % 3 CDP3 / 1890.16 %50.00 %Cigna Corporation
0.01 % 0.01 % 1 PRE138 / 1890.00 %860.00 %Cipla Ltd/India
0.02 % 0.02 % 1 TC160 / 1890.00 %1080.00 %Cochlear Ltd
0.02 % 0.02 % 2 CDP150 / 1890.00 %930.00 %Coloplast AS B
0.01 % 0.01 % 1 AR*61 / 1890.00 %650.00 %ConvaTec Group Plc
0.03 % 0.03 % 2 TC137 / 1890.01 %860.00 %Cooper Companies Inc
0.11 % 0.11 % 7 CDP152 / 1890.02 %950.00 %CSL Ltd
0.02 % 0.02 % 1 TC72 / 1890.00 %650.00 %CSPC Pharmaceutical Group Ltd.
0.03 % 0.03 % 7 CDP91 / 1890.02 %700.00 %Daiichi Sankyo Co Ltd
0.02 % 0.02 % 7 CDP23 / 1890.04 %440.00 %DaVita Inc
0.03 % 0.03 % 6 PRE163 / 1890.01 %1130.00 %Dentsply Sirona Inc.
0.00 % 0.00 % 2 PRE189 / 189-0.00 %8990.00 %Divi's Laboratories Ltd
0.01 % 0.01 % 5 CDP185 / 1890.00 %3390.00 %Dr Reddy's Laboratories Ltd
0.05 % 0.05 % 3 CDP60 / 1890.01 %650.00 %Edwards Lifesciences Corp
www.trucost.com Copyright © 2018 S&P Trucost Limited, an affiliate of S&P Dow Jones Indices LLC-47-
Page 91

5133
Company BreakdownPortfolio
Company details
Weighting
Portfolio Benchmark
Carbon Apportioned
Tonnes CO2e
% ofPortfolio's
Total CarbonApportioned
CarbonIntensity
(tCO2e/£mn)
CarbonFootprint
Contribution(%)*
FootprintRank in
BenchmarkSector **
DataSource
***
0.03 % 0.03 % 4 CDP102 / 1890.01 %720.00 %Eisai Co
0.06 % 0.06 % 10 CDP149 / 1890.02 %920.01 %Essilor Intl
0.01 % 0.01 % 2 TC140 / 1890.00 %880.00 %Eurofins Scientific
0.08 % 0.08 % 42 TC14 / 1890.38 %300.03 %Express Scripts Holding Co.
0.01 % 0.01 % 1 CDP96 / 1890.00 %710.00 %Fisher & Paykel Healthcare Corporation
0.00 % 0.00 % 0 CDP18 / 1890.00 %360.00 %Fleury SA
0.05 % 0.05 % 13 TC94 / 1890.04 %710.01 %Fresenius Medical Care AG
0.07 % 0.07 % 23 TC89 / 1890.08 %690.01 %Fresenius SE & Co KGaA
0.03 % 0.03 % 0 TC139 / 1890.00 %880.00 %Genmab AS
0.01 % 0.01 % 3 CDP110 / 1890.01 %760.00 %Getinge AB
0.24 % 0.24 % 16 PRE20 / 1890.11 %370.01 %Gilead Sciences Inc
0.22 % 0.22 % 41 AR*125 / 1890.12 %800.03 %GlaxoSmithKline
0.00 % 0.00 % 0 PRE34 / 1890.00 %520.00 %Glenmark Pharmaceuticals Ltd
0.03 % 0.04 % 4 CDP128 / 1890.01 %810.00 %Grifols SA
0.00 % 0.00 % 0 TC57 / 1890.00 %640.00 %Guangzhou Baiyunshan Pharmaceutical
0.01 % 0.01 % 0 CDP22 / 1890.00 %420.00 %H Lundbeck A/S
0.01 % 0.01 % 0 TC77 / 1890.00 %650.00 %Hanmi Pharm Co Ltd
0.00 % 0.00 % 0 TC51 / 1890.00 %610.00 %Hanmi Science Co Ltd
0.05 % 0.05 % 43 TC144 / 1890.11 %890.03 %HCA Healthcare Inc
0.01 % 0.01 % 2 ENV*155 / 1890.00 %1020.00 %Healthscope Ltd
0.01 % 0.01 % 1 ENV*147 / 1890.00 %920.00 %Hikma Pharmaceuticals
0.01 % 0.01 % 1 TC103 / 1890.00 %730.00 %Hisamitsu Pharmaceutical Co
0.02 % 0.02 % 2 CDP83 / 1890.01 %660.00 %Hologic Inc
0.05 % 0.05 % 8 PRE177 / 1890.01 %1610.01 %Hoya Corp
0.08 % 0.08 % 4 CDP2 / 1890.22 %50.00 %Humana Inc
0.03 % 0.03 % 2 TC101 / 1890.01 %720.00 %IDEXX Laboratories Inc
0.01 % 0.01 % 1 TC142 / 1890.00 %890.00 %IHH Healthcare Bhd
0.07 % 0.07 % 2 CDP*86 / 1890.01 %680.00 %Illumina Inc
0.05 % 0.05 % 1 TC68 / 1890.00 %650.00 %Incyte Corp
0.09 % 0.09 % 3 TC134 / 1890.01 %840.00 %Intuitive Surgical Inc
0.01 % 0.01 % 0 CDP26 / 1890.00 %450.00 %Ipsen
0.03 % 0.03 % 3 PRE113 / 1890.01 %760.00 %IQVIA Holdings Inc
0.02 % 0.02 % 1 TC70 / 1890.00 %650.00 %Jazz Pharmaceuticals plc
0.81 % 0.80 % 68 CDP*81 / 1890.25 %660.04 %Johnson & Johnson
0.00 % 0.00 % 1 TC118 / 1890.00 %770.00 %Kaken Pharmaceutical
0.01 % 0.01 % 4 TC187 / 1890.00 %4070.00 %Kalbe Farma Tbk PT
www.trucost.com Copyright © 2018 S&P Trucost Limited, an affiliate of S&P Dow Jones Indices LLC-48-
Page 92

5133
Company BreakdownPortfolio
Company details
Weighting
Portfolio Benchmark
Carbon Apportioned
Tonnes CO2e
% ofPortfolio's
Total CarbonApportioned
CarbonIntensity
(tCO2e/£mn)
CarbonFootprint
Contribution(%)*
FootprintRank in
BenchmarkSector **
DataSource
***
0.00 % 0.00 % 0 AR129 / 1890.00 %820.00 %Kissei Pharmaceutical Co
0.00 % 0.00 % 0 AR*46 / 1890.00 %610.00 %Kyorin Holdings Inc
0.01 % 0.01 % 4 ENV181 / 1890.00 %2140.00 %Kyowa Hakko Kogyo Co
0.04 % 0.04 % 10 TC107 / 1890.03 %740.01 %Lab Corp of America Hldgs
0.01 % 0.01 % 3 CDP179 / 1890.00 %2020.00 %Life Healthcare Group Holdings Ltd.
0.19 % 0.19 % 32 CDP166 / 1890.06 %1170.02 %Lilly Eli & Co
0.00 % 0.00 % 0 TC79 / 1890.00 %650.00 %Livzon Pharmaceutical Group Inc
0.04 % 0.04 % 15 CDP182 / 1890.01 %2520.01 %Lonza AG
0.01 % 0.01 % 1 PRE158 / 1890.00 %1060.00 %Lupin Ltd
0.00 % 0.00 % 0 TC78 / 1890.00 %650.00 %Luye Pharma Group Ltd
0.01 % 0.01 % 0 TC15 / 1890.00 %320.00 %M3 Inc
0.01 % 0.01 % 3 TC88 / 1890.01 %690.00 %Mallinckrodt plc
0.08 % 0.07 % 50 ENV9 / 1890.65 %210.03 %McKesson Corp
0.01 % 0.01 % 2 CDP157 / 1890.00 %1060.00 %Mediclinic International PLC
0.01 % 0.01 % 14 TC92 / 1890.05 %710.01 %Medipal Holdings Co
0.25 % 0.24 % 26 CDP106 / 1890.08 %730.02 %Medtronic plc
0.40 % 0.40 % 39 CDP87 / 1890.14 %680.03 %Merck & Co Inc
0.03 % 0.03 % 9 CDP170 / 1890.01 %1340.01 %MERCK KGaA
0.04 % 0.04 % 3 CDP104 / 1890.01 %730.00 %Mettler-Toledo Intl
0.01 % 0.01 % 2 TC133 / 1890.00 %840.00 %Miraca Holdings Inc
0.01 % 0.01 % 1 ENV*109 / 1890.00 %750.00 %Mitsubishi Tanabe Pharma Corp
0.00 % 0.00 % 0 TC119 / 1890.00 %770.00 %Mochida Pharmaceutical Co
0.04 % 0.04 % 11 TC73 / 1890.04 %650.01 %Mylan NV
0.01 % 0.01 % 6 CDP178 / 1890.01 %1850.00 %Netcare Ltd
0.00 % 0.00 % 1 CDP126 / 1890.00 %800.00 %Nihon Kohden Corp
0.01 % 0.01 % 1 TC167 / 1890.00 %1220.00 %Nippon Shinyaku Co
0.00 % 0.00 % 4 TC176 / 1890.00 %1540.00 %Nipro Corp
0.00 % 0.01 % 0 AR*130 / 1890.00 %820.00 %NMC Health PLC
0.46 % 0.46 % 40 OTH55 / 1890.15 %640.03 %Novartis AG ADR
0.19 % 0.19 % 8 CDP28 / 1890.04 %470.01 %Novo Nordisk AS
0.00 % 0.00 % 0 TC80 / 1890.00 %650.00 %OBI Pharma Inc
0.00 % 0.00 % 0 TC21 / 1890.00 %390.00 %Odontoprev S.A.
0.02 % 0.02 % 5 CDP99 / 1890.02 %720.00 %Olympus Corporation
0.02 % 0.02 % 1 OTH45 / 1890.00 %600.00 %Ono Pharmaceutical Co
0.01 % 0.01 % 1 ENV108 / 1890.00 %750.00 %Orion OYJ
0.01 % 0.01 % 2 AR98 / 1890.01 %720.00 %Orpea
www.trucost.com Copyright © 2018 S&P Trucost Limited, an affiliate of S&P Dow Jones Indices LLC-49-
Page 93

5133
Company BreakdownPortfolio
Company details
Weighting
Portfolio Benchmark
Carbon Apportioned
Tonnes CO2e
% ofPortfolio's
Total CarbonApportioned
CarbonIntensity
(tCO2e/£mn)
CarbonFootprint
Contribution(%)*
FootprintRank in
BenchmarkSector **
DataSource
***
0.04 % 0.04 % 16 PRE172 / 1890.02 %1360.01 %Otsuka Holdings Co Ltd
0.01 % 0.01 % 4 TC121 / 1890.01 %780.00 %Patterson Cos Inc
0.01 % 0.01 % 0 TC153 / 1890.00 %950.00 %Peptidream Inc
0.03 % 0.03 % 6 ENV*127 / 1890.02 %810.00 %Perrigo Company plc
0.49 % 0.48 % 58 CDP124 / 1890.18 %780.04 %Pfizer Inc
0.01 % 0.01 % 1 CDP180 / 1890.00 %2060.00 %Piramal Enterprises Ltd
0.01 % 0.02 % 1 TC131 / 1890.00 %840.00 %QIAGEN AG
0.00 % 0.01 % 0 TC7 / 1890.00 %170.00 %Qualicorp S.A.
0.03 % 0.03 % 6 CDP40 / 1890.03 %570.00 %Quest Diagnostics
0.01 % 0.01 % 3 PRE54 / 1890.01 %630.00 %Ramsay Health Care Ltd
0.01 % 0.01 % 1 TC75 / 1890.00 %650.00 %Recordati SpA Ord
0.08 % 0.08 % 2 CDP25 / 1890.01 %440.00 %Regeneron Pharmaceuticals Inc
0.02 % 0.02 % 1 PRE41 / 1890.01 %580.00 %ResMed Inc
0.01 % 0.01 % 1 TC59 / 1890.00 %640.00 %Richter Gedeon
0.42 % 0.42 % 29 CDP30 / 1890.15 %480.02 %Roche Hldgs AG Br
0.01 % 0.01 % 1 TC154 / 1890.00 %1000.00 %Rohto Pharmaceutical Co
0.01 % 0.01 % 0 TC164 / 1890.00 %1160.00 %Ryman Healthcare Group Ltd
0.01 % 0.01 % 0 TC111 / 1890.00 %760.00 %Samsung BioLogics Co Ltd
0.25 % 0.25 % 26 CDP37 / 1890.11 %560.02 %Sanofi
0.01 % 0.01 % 1 TC117 / 1890.00 %760.00 %Santen Pharmaceutical Co
0.01 % 0.01 % 1 AR*97 / 1890.00 %710.00 %Sartorius AG
0.00 % 0.00 % 0 AR105 / 1890.00 %730.00 %Sartorius Stedim Biotech
0.00 % 0.00 % 1 CDP161 / 1890.00 %1100.00 %Sawai Pharmaceutical Co
0.03 % 0.03 % 11 TC58 / 1890.04 %640.01 %Schein Henry Inc
0.00 % 0.00 % 0 TC135 / 1890.00 %840.00 %Shandong Weigao Group Medical Polymer
0.00 % 0.00 % 1 PRE183 / 1890.00 %2680.00 %Shanghai Fosun Pharmaceutical Group Co.
0.00 % 0.00 % 3 TC52 / 1890.01 %620.00 %Shanghai Pharmaceuticals Holding Co Ltd
0.04 % 0.04 % 2 CDP132 / 1890.01 %840.00 %Shionogi & Co
0.10 % 0.10 % 8 CDP33 / 1890.04 %500.01 %Shire Plc
0.00 % 0.00 % 0 TC67 / 1890.00 %650.00 %Sihuan Pharmaceutical Holdings Group Ltd
0.01 % 0.01 % 1 TC71 / 1890.00 %650.00 %Sino Biopharmaceutical Ltd.
0.01 % 0.01 % 12 TC47 / 1890.05 %610.01 %Sinopharm Group Co. Ltd. - H Shares
0.04 % 0.04 % 6 AR141 / 1890.02 %880.00 %Smith & Nephew
0.02 % 0.02 % 2 ENV27 / 1890.01 %460.00 %Sonic Healthcare Ltd
0.02 % 0.02 % 1 CDP50 / 1890.00 %610.00 %Sonova Holding AG
0.01 % 0.01 % 1 CDP156 / 1890.00 %1020.00 %Straumann AG Reg
www.trucost.com Copyright © 2018 S&P Trucost Limited, an affiliate of S&P Dow Jones Indices LLC-50-
Page 94

5133
Company BreakdownPortfolio
Company details
Weighting
Portfolio Benchmark
Carbon Apportioned
Tonnes CO2e
% ofPortfolio's
Total CarbonApportioned
CarbonIntensity
(tCO2e/£mn)
CarbonFootprint
Contribution(%)*
FootprintRank in
BenchmarkSector **
DataSource
***
0.11 % 0.11 % 9 CDP42 / 1890.04 %580.01 %Stryker Corp
0.00 % 0.00 % 1 CDP56 / 1890.00 %640.00 %Sumitomo Dainippon Pharma Co Ltd
0.02 % 0.02 % 2 PRE82 / 1890.01 %660.00 %Sun Pharmaceutical Industries Ltd
0.01 % 0.01 % 13 TC95 / 1890.04 %710.01 %Suzuken Co Ltd
0.02 % 0.02 % 1 CDP31 / 1890.00 %490.00 %Sysmex Corp
0.01 % 0.01 % 1 TC114 / 1890.00 %760.00 %Taisho Pharmaceutical Holdings Co Ltd
0.10 % 0.10 % 13 CDP93 / 1890.04 %710.01 %Takeda Pharmaceutical Co Ltd
0.03 % 0.03 % 5 CDP168 / 1890.01 %1260.00 %Terumo Corp
0.03 % 0.04 % 21 CDP123 / 1890.06 %780.01 %Teva Pharmaceutical Industries
0.17 % 0.17 % 19 CDP100 / 1890.06 %720.01 %Thermo Fisher Scientific
0.00 % 0.00 % 0 TC115 / 1890.00 %760.00 %Torrent Pharmaceuticals Ltd
0.01 % 0.01 % 2 CDP175 / 1890.00 %1530.00 %Tsumura & Co
0.02 % 0.02 % 2 CDP24 / 1890.01 %440.00 %UCB SA
0.43 % 0.43 % 44 CDP*6 / 1890.72 %170.03 %Unitedhealth Group Inc
0.02 % 0.02 % 11 TC143 / 1890.03 %890.01 %Universal Health Services
0.01 % 0.01 % 20 CDP174 / 1890.03 %1460.01 %Valeant Pharmaceuticals International Inc.
0.02 % 0.02 % 3 CDP43 / 1890.01 %600.00 %Varian Medical Systems Inc
0.09 % 0.09 % 2 TC136 / 1890.01 %850.00 %Vertex Pharmaceuticals Inc
0.01 % 0.01 % 1 CDP10 / 1890.01 %250.00 %Vifor Pharma Group
0.03 % 0.03 % 2 CDP90 / 1890.01 %700.00 %Waters Corp
0.01 % 0.01 % 1 CDP32 / 1890.00 %490.00 %William Demant Hldg
0.00 % 0.00 % 1 TC85 / 1890.00 %670.00 %Yuhan Corp
0.05 % 0.05 % 8 OTH122 / 1890.03 %780.01 %Zimmer Biomet Holdings Inc
0.07 % 0.07 % 5 TC74 / 1890.02 %650.00 %Zoetis Inc
5.45 %13,474 8.76 %11.08 %11.11 % 286Industrials
0.28 % 0.28 % 153 CDP392 / 4940.02 %3660.10 %3M Co
0.00 % 0.00 % 1 PRE370 / 4940.00 %3060.00 %ABB India Ltd
0.11 % 0.11 % 83 CDP287 / 4940.07 %1930.05 %ABB Ltd
0.03 % 0.03 % 3 CDP62 / 4940.01 %600.00 %Abertis Infraestructuras SA
0.01 % 0.01 % 75 AR*492 / 494-0.04 %5,2990.05 %Aboitiz Equity Ventures Inc
0.02 % 0.02 % 55 ENV*222 / 4940.07 %1420.04 %ACS Actividades de Construccion y
0.02 % 0.02 % 8 TC288 / 4940.01 %1940.01 %Acuity Brands Inc
0.00 % 0.00 % 38 PRE478 / 494-0.02 %1,8740.02 %Adani Enterprises Ltd
0.01 % 0.01 % 1 TC171 / 4940.00 %1100.00 %Adani Ports and Special Economic Zone
0.03 % 0.03 % 3 CDP2 / 4940.09 %90.00 %Adecco Group AG
www.trucost.com Copyright © 2018 S&P Trucost Limited, an affiliate of S&P Dow Jones Indices LLC-51-
Page 95

5133
Company BreakdownPortfolio
Company details
Weighting
Portfolio Benchmark
Carbon Apportioned
Tonnes CO2e
% ofPortfolio's
Total CarbonApportioned
CarbonIntensity
(tCO2e/£mn)
CarbonFootprint
Contribution(%)*
FootprintRank in
BenchmarkSector **
DataSource
***
0.01 % 0.01 % 1 CDP68 / 4940.00 %630.00 %ADP Promesses
0.03 % 0.03 % 3 PRE215 / 4940.00 %1380.00 %Aena SA
0.02 % 0.02 % 3 TC43 / 4940.02 %460.00 %AerCap Holdings NV
0.00 % 0.00 % 52 CDP452 / 494-0.02 %1,2970.03 %Aeroflot PJSC
0.01 % 0.01 % 1 TC38 / 4940.01 %420.00 %Aggreko
0.00 % 0.00 % 3 TC354 / 4940.00 %2820.00 %Aica Kogyo Co
0.00 % 0.00 % 11 TC461 / 494-0.00 %1,4520.01 %Air Arabia
0.00 % 0.00 % 32 TC458 / 494-0.01 %1,3980.02 %Air China Ltd
0.00 % 0.00 % 28 ENV*455 / 494-0.01 %1,3240.02 %Air New Zealand Ltd
0.00 % 0.00 % 17 PRE473 / 494-0.01 %1,7050.01 %AirAsia Group
0.12 % 0.12 % 54 CDP85 / 4940.17 %740.04 %Airbus SE
0.02 % 0.02 % 1 TC157 / 4940.00 %1000.00 %Airports of Thailand PCL
0.01 % 0.01 % 24 PRE443 / 494-0.01 %1,1570.02 %Alaska Air Group Inc
0.02 % 0.02 % 8 CDP284 / 4940.01 %1900.01 %Alfa Laval AB
0.01 % 0.01 % 106 ENV*435 / 494-0.03 %8320.07 %Alfa SA
0.02 % 0.02 % 2 TC87 / 4940.01 %760.00 %Allegion plc
0.00 % 0.00 % 3 TC283 / 4940.00 %1890.00 %Alliance Global Group Inc
0.01 % 0.01 % 0 TC35 / 4940.00 %400.00 %ALS Ltd
0.02 % 0.01 % 12 AR*272 / 4940.01 %1830.01 %Alstom
0.01 % 0.01 % 7 TC340 / 4940.00 %2540.00 %Amada Co
0.01 % 0.01 % 200 CDP459 / 494-0.09 %1,3990.13 %American Airlines Group Inc.
0.03 % 0.03 % 10 TC282 / 4940.01 %1890.01 %AMETEK Inc
0.01 % 0.01 % 81 CDP*457 / 494-0.04 %1,3560.05 %ANA HOLDINGS INC
0.01 % 0.01 % 12 AR*280 / 4940.01 %1890.01 %Andritz AG
0.05 % 0.05 % 343 CDP453 / 494-0.15 %1,3020.22 %AP Moller - Maersk AS
0.00 % 0.00 % 2 TC178 / 4940.00 %1110.00 %Arabtec Holding
0.02 % 0.02 % 80 CDP414 / 494-0.01 %5110.05 %Arconic Inc
0.02 % 0.02 % 162 CDP445 / 494-0.07 %1,1690.11 %Asahi Glass Co
0.00 % 0.00 % 0 CDP96 / 4940.00 %810.00 %Aselsan SA
0.01 % 0.01 % 3 TC266 / 4940.00 %1740.00 %Ashok Leyland Ltd
0.03 % 0.03 % 5 AR*186 / 4940.01 %1160.00 %Ashtead Group
0.05 % 0.05 % 24 CDP333 / 4940.01 %2440.02 %Assa Abloy B
0.04 % 0.04 % 5 CDP91 / 4940.01 %780.00 %Atlantia SpA
0.09 % 0.09 % 22 CDP245 / 4940.02 %1600.01 %Atlas Copco AB
0.01 % 0.01 % 0 CDP64 / 4940.00 %610.00 %Auckland Intl Airport Ltd
0.02 % 0.02 % 20 CDP424 / 494-0.00 %6300.01 %Aurizon Holdings Limited
www.trucost.com Copyright © 2018 S&P Trucost Limited, an affiliate of S&P Dow Jones Indices LLC-52-
Page 96

5133
Company BreakdownPortfolio
Company details
Weighting
Portfolio Benchmark
Carbon Apportioned
Tonnes CO2e
% ofPortfolio's
Total CarbonApportioned
CarbonIntensity
(tCO2e/£mn)
CarbonFootprint
Contribution(%)*
FootprintRank in
BenchmarkSector **
DataSource
***
0.00 % 0.00 % 3 TC145 / 4940.01 %970.00 %AviChina Industry & Technology Co. Ltd. - H
0.01 % 0.01 % 2 AR*59 / 4940.01 %580.00 %Babcock Intl Group
0.06 % 0.06 % 40 CDP168 / 4940.08 %1070.03 %BAE Systems Plc
0.00 % 0.00 % 0 TC200 / 4940.00 %1250.00 %Bangkok Expressway & Metro PCL
0.00 % 0.00 % 6 OTH*146 / 4940.01 %970.00 %Barloworld Ltd
0.00 % 0.01 % 1 TC134 / 4940.00 %940.00 %Beijing Capital International Airport Co. Ltd. -
0.01 % 0.01 % 26 ENV*422 / 494-0.00 %6160.02 %Beijing Enterprises Holdings Ltd.
0.00 % 0.00 % 2 TC262 / 4940.00 %1730.00 %Berli Jucker PCL
0.00 % 0.00 % 0 PRE75 / 4940.00 %660.00 %Bharat Electronics Ltd
0.00 % 0.00 % 4 PRE386 / 4940.00 %3480.00 %Bharat Heavy Electricals Ltd
0.01 % 0.01 % 4 CDP326 / 4940.00 %2280.00 %BIC
0.01 % 0.01 % 16 AR*349 / 4940.01 %2740.01 %Bidvest Group
0.00 % 0.00 % 0 TC41 / 4940.00 %460.00 %BOC Aviation Ltd
0.33 % 0.32 % 92 OTH83 / 4940.30 %720.06 %Boeing Co
0.01 % 0.01 % 7 AR197 / 4940.01 %1230.00 %Bollore Investissement
0.01 % 0.01 % 15 ENV*421 / 494-0.00 %6150.01 %Boskalis Westminster Group
0.02 % 0.02 % 45 CDP252 / 4940.05 %1650.03 %Bouygues
0.01 % 0.01 % 1 CDP63 / 4940.00 %610.00 %Bpost NV-SA
0.03 % 0.03 % 3 CDP45 / 4940.02 %470.00 %Brambles Industries Ltd
0.02 % 0.02 % 10 TC66 / 4940.04 %630.01 %Brenntag AG
0.00 % 0.00 % 0 TC110 / 4940.00 %870.00 %BTS Group Holdings PCL
0.00 % 0.00 % 1 PRE191 / 4940.00 %1190.00 %Budimex SA B
0.02 % 0.02 % 5 CDP21 / 4940.04 %300.00 %Bunzl
0.02 % 0.02 % 2 CDP32 / 4940.01 %390.00 %Bureau Veritas SA
0.14 % 0.14 % 100 CDP431 / 494-0.03 %7700.06 %Canadian National Railways
0.06 % 0.06 % 54 CDP432 / 494-0.02 %7970.03 %Canadian Pacific Railway Ltd
0.01 % 0.01 % 3 ENV*20 / 4940.03 %300.00 %Capita Group
0.00 % 0.00 % 0 TC52 / 4940.00 %510.00 %CAR Inc
0.16 % 0.16 % 104 ENV*294 / 4940.08 %1960.07 %Caterpillar Inc
0.00 % 0.00 % 68 CDP480 / 494-0.03 %1,9130.04 %Cathay Pacific Airways Ltd.
0.01 % 0.01 % 1 CDP72 / 4940.01 %650.00 %CCR S.A.
0.07 % 0.07 % 31 AR*299 / 4940.02 %1990.02 %Central Japan Railway Co
0.00 % 0.00 % 1 PRE237 / 4940.00 %1530.00 %CG Power and Industrial Solutions Ltd
0.02 % 0.02 % 17 TC113 / 4940.04 %880.01 %CH Robinson Worldwide Inc
0.00 % 0.00 % 58 ENV*483 / 494-0.03 %2,0480.04 %China Airlines Co
0.01 % 0.01 % 28 AR*261 / 4940.03 %1730.02 %China Communications Construction Co.
www.trucost.com Copyright © 2018 S&P Trucost Limited, an affiliate of S&P Dow Jones Indices LLC-53-
Page 97

5133
Company BreakdownPortfolio
Company details
Weighting
Portfolio Benchmark
Carbon Apportioned
Tonnes CO2e
% ofPortfolio's
Total CarbonApportioned
CarbonIntensity
(tCO2e/£mn)
CarbonFootprint
Contribution(%)*
FootprintRank in
BenchmarkSector **
DataSource
***
0.01 % 0.01 % 1 TC363 / 4940.00 %2930.00 %China Conch Venture Holdings Ltd
0.00 % 0.00 % 21 PRE469 / 494-0.01 %1,5790.01 %China Eastern Airlines Corp Ltd
0.01 % 0.01 % 52 ENV*490 / 494-0.03 %3,7030.03 %China Everbright International Ltd.
0.00 % 0.00 % 3 TC314 / 4940.00 %2160.00 %China International Marine Containers
0.01 % 0.01 % 1 TC140 / 4940.00 %940.00 %China Merchants Port Holdings Co Ltd
0.00 % 0.00 % 0 TC6 / 4940.00 %150.00 %China Minsheng Financial Holding
0.01 % 0.01 % 16 TC176 / 4940.03 %1100.01 %China Railway Construction Corp Ltd
0.01 % 0.01 % 18 TC175 / 4940.03 %1100.01 %China Railway Group Ltd
0.00 % 0.00 % 40 ENV*477 / 494-0.02 %1,7850.03 %China Southern Airlines Co Ltd
0.01 % 0.01 % 15 CDP406 / 494-0.00 %4660.01 %China State Construction International
0.00 % 0.00 % 3 TC80 / 4940.01 %700.00 %Chiyoda Corp
0.01 % 0.01 % 14 ENV*399 / 4940.00 %4200.01 %CIMIC Group Ltd
0.03 % 0.03 % 6 TC194 / 4940.01 %1220.00 %Cintas Corp
0.02 % 0.02 % 123 TC447 / 494-0.05 %1,2170.08 %CITIC Limited
0.00 % 0.00 % 61 TC411 / 494-0.01 %5040.04 %CJ Corp
0.00 % 0.00 % 17 TC428 / 494-0.00 %7320.01 %CJ Korea Express Corp
0.08 % 0.08 % 22 TC71 / 4940.08 %650.01 %CK Hutchison Holding Ltd
0.03 % 0.03 % 34 CDP214 / 4940.05 %1380.02 %CNH Industrial NV
0.01 % 0.01 % 4 CDP144 / 4940.01 %970.00 %Cobham
0.01 % 0.01 % 24 ENV*419 / 494-0.00 %6070.02 %ComfortDelGro Corp Ltd
0.01 % 0.01 % 3 TC181 / 4940.01 %1140.00 %Comsys Holdings Corp
0.00 % 0.00 % 0 TC170 / 4940.00 %1100.00 %Container Corp Of India
0.00 % 0.00 % 0 ENV128 / 4940.00 %940.00 %COSCO SHIPPING Development Co. Ltd.
0.00 % 0.00 % 8 PRE468 / 494-0.00 %1,5760.00 %COSCO SHIPPING Energy Transportation
0.00 % 0.00 % 29 PRE450 / 494-0.01 %1,2510.02 %COSCO SHIPPING Holdings Co Ltd
0.00 % 0.00 % 2 PRE394 / 4940.00 %3810.00 %COSCO SHIPPING Ports Ltd
0.01 % 0.01 % 6 TC227 / 4940.01 %1450.00 %CRRC Corporation Limited
0.00 % 0.00 % 1 TC260 / 4940.00 %1730.00 %CSSC Offshore and Marine Engineering
0.11 % 0.11 % 91 CDP418 / 494-0.02 %6060.06 %CSX Corporation
0.06 % 0.06 % 37 CDP241 / 4940.04 %1580.02 %Cummins Inc
0.00 % 0.00 % 1 TC378 / 4940.00 %3210.00 %Cummins India Ltd
0.00 % 0.00 % 8 PRE106 / 4940.02 %850.01 %Daelim Industrial Co
0.00 % 0.00 % 4 CDP81 / 4940.01 %700.00 %Daewoo Engineering & Construction
0.02 % 0.02 % 31 CDP330 / 4940.02 %2360.02 %Dai Nippon Printing Co
0.01 % 0.01 % 8 OTH380 / 4940.00 %3240.01 %Daifuku Co
0.06 % 0.06 % 55 CDP359 / 4940.02 %2880.04 %Daikin Industries
www.trucost.com Copyright © 2018 S&P Trucost Limited, an affiliate of S&P Dow Jones Indices LLC-54-
Page 98

5133
Company BreakdownPortfolio
Company details
Weighting
Portfolio Benchmark
Carbon Apportioned
Tonnes CO2e
% ofPortfolio's
Total CarbonApportioned
CarbonIntensity
(tCO2e/£mn)
CarbonFootprint
Contribution(%)*
FootprintRank in
BenchmarkSector **
DataSource
***
0.12 % 0.12 % 18 TC107 / 4940.05 %850.01 %Danaher Corp
0.01 % 0.01 % 1 AR125 / 4940.00 %930.00 %Dassault Aviation
0.00 % 0.00 % 0 TC163 / 4940.00 %1020.00 %Dazhong Transportation (Group) Co Ltd
0.02 % 0.02 % 6 CDP22 / 4940.05 %300.00 %DCC
0.09 % 0.09 % 75 CDP291 / 4940.06 %1950.05 %Deere & Co
0.02 % 0.02 % 176 CDP446 / 494-0.07 %1,1990.11 %Delta Air Lines
0.01 % 0.01 % 274 CDP441 / 494-0.11 %1,1140.18 %Deutsche Lufthansa Reg
0.10 % 0.10 % 113 CDP248 / 4940.13 %1610.07 %Deutsche Post AG
0.01 % 0.01 % 2 TC17 / 4940.02 %290.00 %DKSH Holding AG
0.00 % 0.00 % 36 AR*493 / 494-0.02 %5,6230.02 %DMCI Holdings Inc
0.00 % 0.00 % 8 TC298 / 4940.01 %1980.01 %DMG MORI SEIKI CO LTD
0.00 % 0.00 % 15 ENV*247 / 4940.02 %1610.01 %Doosan Corp
0.00 % 0.00 % 16 CDP236 / 4940.02 %1530.01 %Doosan Heavy Indust &Construct
0.00 % 0.00 % 9 PRE277 / 4940.01 %1860.01 %Doosan Infracore Co Ltd
0.03 % 0.03 % 19 CDP*292 / 4940.02 %1950.01 %Dover Corp
0.01 % 0.01 % 11 CDP253 / 4940.01 %1660.01 %Downer EDI Ltd
0.01 % 0.01 % 1 TC132 / 4940.00 %940.00 %DP World Ltd.
0.03 % 0.03 % 116 CDP434 / 494-0.04 %8300.08 %Dsv A/S
0.01 % 0.01 % 1 TC13 / 4940.01 %270.00 %Dun & Bradstreet Corp
0.08 % 0.08 % 54 CDP281 / 4940.05 %1890.03 %East Japan Railway Co
0.01 % 0.01 % 68 AR451 / 494-0.03 %1,2730.04 %Easyjet
0.08 % 0.08 % 103 CDP391 / 4940.01 %3650.07 %Eaton Corp plc
0.01 % 0.01 % 7 ENV*225 / 4940.01 %1430.00 %Ebara Corp
0.01 % 0.01 % 0 CDP5 / 4940.00 %150.00 %Edenred
0.01 % 0.01 % 1 TC70 / 4940.00 %640.00 %Eicher Motors Ltd
0.02 % 0.02 % 14 ENV*98 / 4940.04 %820.01 %Eiffage
0.00 % 0.00 % 2 TC204 / 4940.00 %1260.00 %El sewedy Electric company
0.01 % 0.01 % 2 PRE94 / 4940.01 %800.00 %Elbit Systems Ltd
0.01 % 0.01 % 8 AR*118 / 4940.02 %920.01 %Embraer S.A.
0.09 % 0.09 % 39 CDP*297 / 4940.03 %1980.03 %Emerson Electric Co
0.00 % 0.00 % 27 TC491 / 494-0.02 %4,0020.02 %Enka Insaat ve Sanayi AS
0.03 % 0.03 % 2 TC31 / 4940.01 %390.00 %Equifax Inc
0.00 % 0.00 % 42 TC448 / 494-0.02 %1,2180.03 %EVA Airways Corp
0.00 % 0.00 % 43 TC470 / 494-0.02 %1,6060.03 %Evergreen Marine Corp
0.02 % 0.02 % 4 CDP40 / 4940.02 %440.00 %Expeditors Intl of WA Inc
0.04 % 0.04 % 2 CDP24 / 4940.01 %310.00 %Experian Plc
www.trucost.com Copyright © 2018 S&P Trucost Limited, an affiliate of S&P Dow Jones Indices LLC-55-
Page 99

5133
Company BreakdownPortfolio
Company details
Weighting
Portfolio Benchmark
Carbon Apportioned
Tonnes CO2e
% ofPortfolio's
Total CarbonApportioned
CarbonIntensity
(tCO2e/£mn)
CarbonFootprint
Contribution(%)*
FootprintRank in
BenchmarkSector **
DataSource
***
0.09 % 0.09 % 11 TC271 / 4940.01 %1770.01 %Fanuc Co
0.01 % 0.01 % 33 ENV*407 / 494-0.00 %4820.02 %Far Eastern New Century Corporation
0.03 % 0.03 % 4 TC73 / 4940.01 %650.00 %Fastenal Co
0.13 % 0.13 % 285 CDP413 / 494-0.02 %5070.19 %FedEx Corp
0.04 % 0.04 % 13 CDP49 / 4940.07 %480.01 %Ferguson PLC
0.02 % 0.02 % 14 CDP198 / 4940.02 %1240.01 %Ferrovial SA
0.01 % 0.01 % 9 PRE238 / 4940.01 %1540.01 %Flowserve Corp
0.01 % 0.01 % 1 AR84 / 4940.00 %730.00 %Flughafen Zurich AG
0.01 % 0.01 % 5 CDP7 / 4940.07 %200.00 %Fluor Corp
0.05 % 0.05 % 8 TC154 / 4940.02 %1000.01 %Fortive Corp
0.02 % 0.02 % 16 TC319 / 4940.01 %2210.01 %Fortune Brands Home & Security Inc
0.01 % 0.01 % 2 TC53 / 4940.01 %520.00 %Fosun International Ltd.
0.01 % 0.01 % 2 CDP231 / 4940.00 %1470.00 %Fraport AG
0.01 % 0.01 % 19 CDP366 / 4940.01 %2970.01 %Fuji Electric Co Ltd
0.01 % 0.01 % 14 CDP*305 / 4940.01 %2070.01 %Fujikura
0.00 % 0.00 % 4 TC361 / 4940.00 %2910.00 %Fukuyama Transporting Co
0.01 % 0.01 % 24 CDP374 / 4940.01 %3140.02 %Furukawa Electric Co
0.01 % 0.01 % 9 OTH67 / 4940.04 %630.01 %G4S Plc
0.01 % 0.01 % 1 TC152 / 4940.00 %990.00 %Gamuda Bhd
0.02 % 0.02 % 6 CDP165 / 4940.01 %1030.00 %GEA AG
0.04 % 0.04 % 13 CDP381 / 4940.00 %3250.01 %Geberit AG Reg
0.12 % 0.12 % 39 PRE159 / 4940.09 %1010.03 %General Dynamics
0.49 % 0.48 % 276 CDP*240 / 4940.33 %1560.18 %General Electric Co
0.00 % 0.00 % 3 CDP249 / 4940.00 %1610.00 %Glory
0.00 % 0.00 % 67 ENV494 / 494-0.04 %6,9460.04 %GMR Infrastructure Ltd
0.02 % 0.02 % 5 CDP28 / 4940.03 %360.00 %Grainger W.W. Inc
0.00 % 0.00 % 5 CDP437 / 494-0.00 %9270.00 %Grindrod Ltd
0.01 % 0.01 % 1 CDP82 / 4940.00 %710.00 %Groupe Eurotunnel SE
0.00 % 0.00 % 30 TC463 / 494-0.01 %1,4770.02 %Grupo Aeromexico SAB de CV
0.00 % 0.00 % 1 ENV*239 / 4940.00 %1550.00 %Grupo Aeroportuario del Centro Norte, S.A.
0.01 % 0.01 % 1 TC136 / 4940.00 %940.00 %Grupo Aeroportuario del Pacifico, S.A.B. de
0.01 % 0.01 % 1 TC133 / 4940.00 %940.00 %Grupo Aeroportuario del Sureste SAB de CV
0.00 % 0.00 % 2 TC196 / 4940.00 %1220.00 %Grupo Carso SAB de CV
0.00 % 0.00 % 7 PRE102 / 4940.02 %840.00 %GS Engineering & Construction Corp
0.00 % 0.00 % 11 CDP*362 / 4940.00 %2920.01 %GS Yuasa Corp
0.00 % 0.00 % 1 ENV*286 / 4940.00 %1920.00 %Guangshen Railway Co Ltd
www.trucost.com Copyright © 2018 S&P Trucost Limited, an affiliate of S&P Dow Jones Indices LLC-56-
Page 100

5133
Company BreakdownPortfolio
Company details
Weighting
Portfolio Benchmark
Carbon Apportioned
Tonnes CO2e
% ofPortfolio's
Total CarbonApportioned
CarbonIntensity
(tCO2e/£mn)
CarbonFootprint
Contribution(%)*
FootprintRank in
BenchmarkSector **
DataSource
***
0.00 % 0.00 % 1 TC320 / 4940.00 %2220.00 %Haitian International Holdings Ltd.
0.00 % 0.01 % 15 PRE37 / 4940.10 %410.01 %Han Wha Co
0.02 % 0.02 % 15 AR*327 / 4940.01 %2280.01 %Hankyu Hanshin Holdings
0.00 % 0.00 % 2 PRE90 / 4940.01 %780.00 %Hanwha Techwin Co Ltd
0.00 % 0.00 % 2 TC390 / 4940.00 %3610.00 %HAP Seng Consolidated Bhd
0.00 % 0.00 % 1 ENV*307 / 4940.00 %2080.00 %Havells India Ltd
0.01 % 0.01 % 7 CDP104 / 4940.02 %850.00 %Hino Motors
0.01 % 0.01 % 7 CDP295 / 4940.01 %1960.00 %Hitachi Construction Machinery
0.00 % 0.00 % 8 TC372 / 4940.00 %3090.01 %Hitachi Transport System
0.01 % 0.01 % 14 CDP224 / 4940.02 %1430.01 %HOCHTIEF AG
0.25 % 0.25 % 119 CDP312 / 4940.08 %2120.08 %Honeywell Intl Inc
0.00 % 0.00 % 0 ENV*306 / 4940.00 %2080.00 %Hopewell Highway Infrastructure Ltd.
0.01 % 0.01 % 0 ENV*328 / 4940.00 %2310.00 %Hopewell Holdings Ltd.
0.01 % 0.01 % 5 TC285 / 4940.00 %1910.00 %HOSHIZAKI ELECTRIC CO LTD
0.01 % 0.01 % 2 AR150 / 4940.01 %980.00 %Howden Joinery Group PLC
0.02 % 0.02 % 34 PRE405 / 494-0.00 %4620.02 %Hunt J.B. Transport Services
0.01 % 0.00 % 1 TC135 / 4940.00 %940.00 %Hutchison Port Holdings Trust
0.00 % 0.00 % 7 TC246 / 4940.01 %1610.00 %Hyundai Dev Co
0.01 % 0.01 % 18 CDP184 / 4940.03 %1150.01 %Hyundai Eng & Const Co
0.01 % 0.01 % 38 CDP398 / 4940.00 %4090.02 %Hyundai Glovis Co Ltd
0.01 % 0.01 % 68 PRE329 / 4940.04 %2350.04 %Hyundai Heavy Industries Co
0.00 % 0.00 % 3 TC193 / 4940.01 %1210.00 %Hyundai Mipo Dockyard
0.01 % 0.01 % 25 CDP296 / 4940.02 %1970.02 %IHI Corp
0.04 % 0.04 % 1 CDP16 / 4940.01 %290.00 %IHS Markit Ltd
0.01 % 0.01 % 4 TC379 / 4940.00 %3230.00 %IJM Corp Bhd
0.10 % 0.10 % 30 ENV*270 / 4940.03 %1770.02 %Illinois Tool Works Inc
0.01 % 0.01 % 5 CDP234 / 4940.01 %1520.00 %IMI
0.01 % 0.01 % 30 TC485 / 494-0.02 %2,3800.02 %Industries Qatar
0.05 % 0.05 % 38 CDP290 / 4940.03 %1940.02 %Ingersoll-Rand Plc
0.00 % 0.00 % 5 TC475 / 494-0.00 %1,7180.00 %InterGlobe Aviation Ltd
0.02 % 0.02 % 260 CDP462 / 494-0.12 %1,4550.17 %International Consolidated Airlines Group SA
0.01 % 0.01 % 2 TC331 / 4940.00 %2380.00 %International Container Terminal Services Inc
0.02 % 0.02 % 4 CDP89 / 4940.01 %780.00 %Intertek Group PLC
0.02 % 0.02 % 5 CDP14 / 4940.04 %280.00 %ISS A/S
0.05 % 0.05 % 178 TC396 / 4940.01 %4020.12 %Itochu Corp
0.02 % 0.02 % 6 TC30 / 4940.04 %370.00 %Jacobs Engineering Group Inc
www.trucost.com Copyright © 2018 S&P Trucost Limited, an affiliate of S&P Dow Jones Indices LLC-57-
Page 101

5133
Company BreakdownPortfolio
Company details
Weighting
Portfolio Benchmark
Carbon Apportioned
Tonnes CO2e
% ofPortfolio's
Total CarbonApportioned
CarbonIntensity
(tCO2e/£mn)
CarbonFootprint
Contribution(%)*
FootprintRank in
BenchmarkSector **
DataSource
***
0.01 % 0.01 % 54 AR*444 / 494-0.02 %1,1690.04 %Japan Airlines Co Ltd
0.00 % 0.00 % 1 TC177 / 4940.00 %1100.00 %Japan Airport Terminal Co
0.00 % 0.00 % 13 AR*425 / 494-0.00 %6580.01 %Japan Steel Works
0.03 % 0.03 % 13 TC103 / 4940.04 %840.01 %Jardine Matheson Hldgs Ltd
0.02 % 0.02 % 6 TC115 / 4940.02 %890.00 %Jardine Strategic Hldgs
0.00 % 0.00 % 1 TC162 / 4940.00 %1020.00 %Jasa Marga PT
0.01 % 0.01 % 22 TC430 / 494-0.01 %7650.01 %JG Summit Holdings Inc
0.01 % 0.01 % 9 PRE192 / 4940.02 %1210.01 %JGC Corp
0.00 % 0.00 % 0 TC121 / 4940.00 %930.00 %Jiangsu Expressway Co Ltd
0.09 % 0.09 % 148 CDP360 / 4940.05 %2890.10 %Johnson Controls International plc
0.00 % 0.00 % 2 TC321 / 4940.00 %2240.00 %Johnson Electric Holdings Ltd.
0.01 % 0.01 % 28 CDP371 / 4940.01 %3080.02 %JTEKT Corp
0.02 % 0.02 % 13 CDP*95 / 4940.04 %810.01 %Kajima Corp
0.01 % 0.01 % 5 TC351 / 4940.00 %2770.00 %Kamigumi Co
0.00 % 0.00 % 1 TC36 / 4940.01 %400.00 %Kandenko Co
0.03 % 0.03 % 25 PRE429 / 494-0.01 %7500.02 %Kansas City Southern Inc
0.00 % 0.00 % 6 PRE433 / 494-0.00 %7970.00 %KAP Industrial Holdings
0.01 % 0.01 % 25 CDP268 / 4940.02 %1770.02 %Kawasaki Heavy Industries
0.00 % 0.00 % 205 CDP479 / 494-0.10 %1,8830.13 %Kawasaki Kisen Kaisha
0.00 % 0.00 % 19 PRE436 / 494-0.01 %8330.01 %KCC CORP
0.01 % 0.01 % 5 TC250 / 4940.00 %1640.00 %Keihan Electric Railway Co
0.01 % 0.01 % 5 TC278 / 4940.00 %1860.00 %Keikyu Corp
0.01 % 0.01 % 6 TC258 / 4940.01 %1710.00 %Keio Corp
0.01 % 0.01 % 4 TC301 / 4940.00 %2000.00 %Keisei Electric Railway Co
0.00 % 0.00 % 0 TC19 / 4940.00 %290.00 %KEPCO Plant Service & Engineering Co Ltd
0.02 % 0.02 % 23 ENV*400 / 4940.00 %4240.02 %Keppel Corp Ltd
0.00 % 0.00 % 1 TC148 / 4940.00 %980.00 %Kerry Logistics Network Ltd
0.00 % 0.00 % 4 TC205 / 4940.01 %1290.00 %Kinden Corp
0.01 % 0.01 % 6 CDP218 / 4940.01 %1390.00 %Kingspan Group Plc
0.02 % 0.02 % 14 CDP199 / 4940.02 %1240.01 %Kintetsu Group Holdings Co Ltd
0.02 % 0.02 % 4 TC86 / 4940.01 %750.00 %KION Group AG
0.01 % 0.01 % 16 AR*336 / 4940.01 %2510.01 %Koc Holding
0.06 % 0.06 % 35 CDP293 / 4940.03 %1960.02 %Komatsu
0.05 % 0.05 % 28 CDP353 / 4940.01 %2810.02 %Kone Corp B
0.09 % 0.09 % 40 CDP166 / 4940.08 %1050.03 %Koninklijke Philips Electronics NV (Royal
0.01 % 0.01 % 2 TC117 / 4940.01 %910.00 %Korea Aerospace Industries Ltd
www.trucost.com Copyright © 2018 S&P Trucost Limited, an affiliate of S&P Dow Jones Indices LLC-58-
Page 102

5133
Company BreakdownPortfolio
Company details
Weighting
Portfolio Benchmark
Carbon Apportioned
Tonnes CO2e
% ofPortfolio's
Total CarbonApportioned
CarbonIntensity
(tCO2e/£mn)
CarbonFootprint
Contribution(%)*
FootprintRank in
BenchmarkSector **
DataSource
***
0.00 % 0.00 % 120 PRE474 / 494-0.06 %1,7150.08 %Korean Air Lines Co
0.05 % 0.05 % 50 CDP344 / 4940.02 %2650.03 %Kubota Corp
0.02 % 0.02 % 6 CDP58 / 4940.02 %570.00 %KUEHNE & NAGEL INTL AG-REG
0.01 % 0.01 % 7 CDP388 / 4940.00 %3550.00 %Kurita Water Industries
0.00 % 0.00 % 2 TC206 / 4940.00 %1290.00 %Kyudenko Corp
0.01 % 0.01 % 4 TC180 / 4940.01 %1110.00 %Kyushu Railway Company
0.03 % 0.03 % 12 TC93 / 4940.03 %800.01 %L3 Technologies, Inc
0.01 % 0.01 % 4 CDP*127 / 4940.01 %940.00 %Larsen & Toubro Ltd
0.01 % 0.01 % 116 ENV*467 / 494-0.05 %1,5240.08 %LATAM Airlines Group S.A.
0.04 % 0.04 % 10 CDP202 / 4940.02 %1260.01 %Legrand Promesses
0.02 % 0.02 % 15 CDP190 / 4940.03 %1180.01 %Leonardo S.p.a.
0.01 % 0.01 % 39 CDP417 / 494-0.01 %5850.03 %LG Corp
0.00 % 0.00 % 5 CDP310 / 4940.00 %2090.00 %LG Hausys Ltd
0.02 % 0.02 % 41 CDP338 / 4940.02 %2530.03 %LIXIL Group Corporation
0.01 % 0.01 % 0 TC29 / 4940.00 %360.00 %Localiza Rent A Car
0.18 % 0.18 % 40 OTH77 / 4940.14 %690.03 %Lockheed Martin
0.00 % 0.00 % 13 TC289 / 4940.01 %1940.01 %LS Corp
0.00 % 0.00 % 0 TC155 / 4940.00 %1000.00 %LT Group Inc.
0.01 % 0.01 % 5 PRE376 / 4940.00 %3160.00 %Mabuchi Motor Co
0.01 % 0.01 % 0 TC141 / 4940.00 %940.00 %Macquarie Altas Roads Limited
0.00 % 0.00 % 4 TC207 / 4940.01 %1310.00 %Maeda Corp
0.00 % 0.00 % 5 TC375 / 4940.00 %3150.00 %Maeda Road Construction Co
0.02 % 0.02 % 5 ENV*221 / 4940.01 %1420.00 %Makita Corp
0.00 % 0.00 % 4 ENV*410 / 494-0.00 %4950.00 %Malaysia Airports Holdings Bhd
0.01 % 0.01 % 5 ENV122 / 4940.01 %930.00 %MAN SE
0.02 % 0.02 % 2 CDP1 / 4940.08 %60.00 %ManpowerGroup
0.02 % 0.02 % 290 PRE404 / 494-0.00 %4490.19 %Marubeni Corp
0.03 % 0.03 % 16 CDP242 / 4940.02 %1580.01 %Masco Corp
0.01 % 4 CDPN / A0.01 %1040.00 %Meggitt
0.01 % 0.01 % 3 AR*274 / 4940.00 %1840.00 %Melrose Industries PLC
0.00 % 0.00 % 5 TC216 / 4940.01 %1380.00 %Metallurgical Corporation of China Ltd
0.01 % 0.01 % 6 CDP273 / 4940.01 %1840.00 %Metso Oyj
0.02 % 0.02 % 19 ENV*369 / 4940.01 %3060.01 %Minebea Mitsumi Co
0.01 % 0.01 % 28 PRE486 / 494-0.02 %2,6830.02 %MISC Bhd
0.02 % 0.02 % 5 TC308 / 4940.00 %2090.00 %Misumi Group Inc
0.07 % 0.07 % 151 PRE341 / 4940.07 %2630.10 %Mitsubishi Corp
www.trucost.com Copyright © 2018 S&P Trucost Limited, an affiliate of S&P Dow Jones Indices LLC-59-
Page 103

5133
Company BreakdownPortfolio
Company details
Weighting
Portfolio Benchmark
Carbon Apportioned
Tonnes CO2e
% ofPortfolio's
Total CarbonApportioned
CarbonIntensity
(tCO2e/£mn)
CarbonFootprint
Contribution(%)*
FootprintRank in
BenchmarkSector **
DataSource
***
0.07 % 0.07 % 66 CDP244 / 4940.08 %1590.04 %Mitsubishi Electric Corp
0.03 % 0.03 % 61 CDP264 / 4940.06 %1740.04 %Mitsubishi Heavy Industries
0.00 % 0.00 % 2 ENV*161 / 4940.00 %1020.00 %Mitsubishi Logistics Corp
0.06 % 0.06 % 282 TC423 / 494-0.05 %6190.18 %Mitsui & Co
0.00 % 0.00 % 13 AR*265 / 4940.01 %1740.01 %Mitsui E&S Holding
0.01 % 0.01 % 308 CDP481 / 494-0.15 %1,9250.20 %Mitsui OSK Lines Ltd
0.00 % 0.00 % 2 TC346 / 4940.00 %2680.00 %Miura Co
0.00 % 0.00 % 0 TC160 / 4940.00 %1010.00 %MMC Corp Bhd
0.00 % 0.00 % 0 TC101 / 4940.00 %830.00 %Monotaro Co Ltd
0.02 % 0.02 % 7 CDP384 / 4940.00 %3440.00 %MTR Corporation Ltd.
0.02 % 0.02 % 4 CDP51 / 4940.02 %500.00 %MTU Aero Engines AG
0.01 % 0.01 % 5 CDP275 / 4940.00 %1840.00 %Nabtesco Corp
0.00 % 0.00 % 28 TC402 / 494-0.00 %4400.02 %Nagase & Co
0.01 % 0.01 % 12 TC300 / 4940.01 %1990.01 %Nagoya Railroad Co
0.01 % 0.01 % 4 ENV*304 / 4940.00 %2050.00 %Nankai Electric Railway
0.01 % 0.01 % 14 ENV*395 / 4940.00 %3850.01 %NGK Insulators
0.07 % 0.07 % 32 CDP382 / 4940.01 %3360.02 %Nidec Corp
0.03 % 0.03 % 1 ENV*4 / 4940.02 %140.00 %Nielsen Holdings plc
0.00 % 0.00 % 4 TC313 / 4940.00 %2150.00 %Nippo Corporation
0.01 % 0.01 % 20 ENV*228 / 4940.03 %1450.01 %Nippon Express Co
0.01 % 0.01 % 353 CDP472 / 494-0.17 %1,6560.23 %Nippon Yusen KK
0.00 % 0.00 % 5 TC235 / 4940.01 %1520.00 %Nishi-Nippon Railroad Co
0.00 % 0.00 % 16 CDP383 / 4940.00 %3420.01 %Nisshinbo Holdings Inc
0.09 % 0.09 % 98 CDP426 / 494-0.02 %6930.06 %Norfolk Southern Corp
0.11 % 0.11 % 21 CDP74 / 4940.08 %660.01 %Northrop Grumman Corp
0.01 % 0.01 % 33 CDP397 / 4940.00 %4030.02 %NSK
0.00 % 0.00 % 17 CDP373 / 4940.00 %3090.01 %NTN Corp
0.01 % 0.01 % 4 ENV*325 / 4940.00 %2260.00 %NWS Holdings Ltd.
0.02 % 0.02 % 16 CDP124 / 4940.04 %930.01 %Obayashi Corp
0.01 % 0.01 % 7 TC254 / 4940.01 %1660.00 %Odakyu Electric Railway Co
0.00 % 0.00 % 4 PRE324 / 4940.00 %2250.00 %Okuma Corp
0.00 % 0.00 % 32 ENV454 / 494-0.01 %1,3030.02 %Orient Overseas (International) Ltd.
0.00 % 0.00 % 2 PRE322 / 4940.00 %2240.00 %OSG Corp
0.01 % 0.01 % 10 AR335 / 4940.01 %2500.01 %OSRAM Licht AG
0.06 % 0.06 % 20 PRE99 / 4940.05 %830.01 %PACCAR Inc
0.01 % 0.01 % 1 TC56 / 4940.00 %550.00 %Park 24 Co
www.trucost.com Copyright © 2018 S&P Trucost Limited, an affiliate of S&P Dow Jones Indices LLC-60-
Page 104

5133
Company BreakdownPortfolio
Company details
Weighting
Portfolio Benchmark
Carbon Apportioned
Tonnes CO2e
% ofPortfolio's
Total CarbonApportioned
CarbonIntensity
(tCO2e/£mn)
CarbonFootprint
Contribution(%)*
FootprintRank in
BenchmarkSector **
DataSource
***
0.05 % 0.05 % 41 OTH352 / 4940.02 %2790.03 %Parker-Hannifin Corp
0.03 % 0.03 % 14 TC316 / 4940.01 %2190.01 %Pentair PLC
0.01 % 0.01 % 1 TC25 / 4940.01 %310.00 %PERSOL HOLDINGS CO LTD
0.01 % 0.01 % 8 CDP229 / 4940.01 %1460.01 %Philips lighting
0.00 % 0.00 % 1 TC189 / 4940.00 %1170.00 %Pilot Group Holding Corp
0.00 % 0.00 % 7 TC123 / 4940.02 %930.00 %POSCO DAEWOO Co
0.01 % 0.01 % 0 TC183 / 4940.00 %1150.00 %Promotora y Operadora de Infraestructura
0.02 % 0.02 % 50 ENV401 / 4940.00 %4350.03 %Prysmian SpA
0.01 % 0.01 % 110 ENV*460 / 494-0.05 %1,4370.07 %Qantas Airways Ltd
0.02 % 0.02 % 2 AR*3 / 4940.05 %110.00 %Randstad NV
0.01 % 0.01 % 0 TC212 / 4940.00 %1360.00 %RATIONAL AG
0.13 % 0.12 % 16 CDP44 / 4940.09 %470.01 %Raytheon Co
0.06 % 0.06 % 6 PRE48 / 4940.03 %480.00 %Recruit Holdings Co Ltd
0.02 % 0.02 % 6 CDP230 / 4940.01 %1470.00 %Rentokil Initial
0.03 % 0.03 % 254 CDP487 / 494-0.14 %2,7920.17 %Republic Services Inc
0.00 % 0.00 % 1 CDP267 / 4940.00 %1760.00 %Reunert Ltd
0.01 % 0.01 % 5 AR*9 / 4940.05 %250.00 %Rexel SA
0.01 % 0.01 % 2 TC11 / 4940.02 %260.00 %Robert Half Intl Inc
0.05 % 0.05 % 7 CDP109 / 4940.02 %870.00 %Rockwell Automation Inc
0.05 % 0.05 % 4 CDP55 / 4940.02 %540.00 %Rockwell Collins
0.04 % 0.04 % 21 CDP100 / 4940.06 %830.01 %Rolls-Royce Holdings Plc
0.06 % 0.06 % 5 TC151 / 4940.01 %990.00 %Roper Technologies, Inc
0.01 % 0.01 % 14 CDP112 / 4940.04 %880.01 %Royal Mail plc
0.01 % 0.01 % 14 ENV*439 / 494-0.01 %1,0410.01 %Rumo Logistica S.A.
0.01 % 0.00 % 16 AR*476 / 494-0.01 %1,7800.01 %Ryanair Holdings Plc
0.00 % 0.00 % 1 TC50 / 4940.00 %490.00 %S-1 Corporation
0.00 % 0.00 % 1 CDP33 / 4940.00 %400.00 %SAAB AB B
0.07 % 0.07 % 12 CDP79 / 4940.04 %690.01 %SAGEM SA Prf
0.07 % 0.07 % 260 CDP408 / 494-0.02 %4860.17 %Saint-Gobain, Cie de
0.02 % 0.02 % 6 CDP47 / 4940.03 %480.00 %Samsung C&T Corp.
0.00 % 0.00 % 6 CDP111 / 4940.02 %880.00 %Samsung Engineering Co Ltd
0.01 % 0.01 % 12 CDP219 / 4940.02 %1400.01 %Samsung Heavy Industries
0.04 % 0.04 % 31 CDP348 / 4940.01 %2710.02 %Sandvik AB
0.01 % 0.00 % 49 TC440 / 494-0.02 %1,1070.03 %Sankyu Inc
0.01 % 0.01 % 14 TC403 / 494-0.00 %4420.01 %Sanwa Holdings Corp
0.00 % 0.00 % 1 TC173 / 4940.00 %1100.00 %SATS Ltd
www.trucost.com Copyright © 2018 S&P Trucost Limited, an affiliate of S&P Dow Jones Indices LLC-61-
Page 105

5133
Company BreakdownPortfolio
Company details
Weighting
Portfolio Benchmark
Carbon Apportioned
Tonnes CO2e
% ofPortfolio's
Total CarbonApportioned
CarbonIntensity
(tCO2e/£mn)
CarbonFootprint
Contribution(%)*
FootprintRank in
BenchmarkSector **
DataSource
***
0.03 % 0.03 % 22 CDP356 / 4940.01 %2860.01 %Schindler-Hldg AG Br
0.11 % 0.11 % 35 CDP164 / 4940.08 %1020.02 %Schneider Electric SE
0.03 % 0.03 % 2 CDP8 / 4940.02 %240.00 %Secom Co
0.01 % 0.01 % 3 CDP10 / 4940.03 %260.00 %Securitas AB B
0.01 % 0.01 % 0 PRE12 / 4940.00 %270.00 %Seek Ltd
0.01 % 0.01 % 6 TC263 / 4940.01 %1730.00 %Seibu holding Inc
0.00 % 0.00 % 10 TC339 / 4940.00 %2530.01 %Seino Holdings Co Ltd
0.00 % 0.00 % 153 CDP489 / 494-0.09 %3,6500.10 %Sembcorp Industries
0.00 % 0.00 % 2 AR*223 / 4940.00 %1420.00 %Sembcorp Marine Ltd
0.02 % 0.02 % 5 CDP188 / 4940.01 %1170.00 %Sensata Technologies Holding plc
0.03 % 0.03 % 5 CDP108 / 4940.01 %860.00 %SGS AG
0.00 % 0.00 % 2 TC232 / 4940.00 %1480.00 %Shanghai Electric Group Co Ltd
0.00 % 0.00 % 2 TC187 / 4940.00 %1170.00 %Shanghai Industrial Holdings Ltd.
0.00 % 0.00 % 2 TC364 / 4940.00 %2950.00 %Shanghai Mechanical & Electrical Industry
0.00 % 0.00 % 3 TC367 / 4940.00 %2980.00 %Shanghai Zhenhua Heavy Industry Co Ltd
0.00 % 0.00 % 0 TC97 / 4940.00 %820.00 %Shenzhen Expressway Co Ltd
0.00 % 0.00 % 1 TC203 / 4940.00 %1260.00 %Shenzhen International Holdings Ltd
0.00 % 0.00 % 2 ENV*345 / 4940.00 %2650.00 %Shikun & Binui Ltd.
0.01 % 0.01 % 11 CDP116 / 4940.03 %890.01 %Shimizu Corp
0.00 % 0.00 % 6 PRE456 / 494-0.00 %1,3350.00 %Shun Tak Holdings Ltd.
0.00 % 0.00 % 0 TC172 / 4940.00 %1100.00 %SIA Engineering Co
0.24 % 0.25 % 98 CDP120 / 4940.24 %930.06 %Siemens AG
0.01 % 0.01 % 2 CDP105 / 4940.01 %850.00 %Siemens Gamesa Renewable Energy SA
0.00 % 0.00 % 1 TC130 / 4940.00 %940.00 %Siemens India Ltd
0.02 % 0.02 % 35 ENV*409 / 494-0.00 %4930.02 %Sime Darby Bhd
0.01 % 0.01 % 108 ENV*482 / 494-0.05 %1,9280.07 %Singapore Airlines
0.00 % 0.00 % 1 TC158 / 4940.00 %1000.00 %Singapore Post Ltd
0.01 % 0.01 % 2 CDP76 / 4940.01 %670.00 %Singapore Technologies Engineering Ltd
0.00 % 0.00 % 1 TC54 / 4940.01 %520.00 %Sinopec Engineering Group Ltd
0.00 % 0.00 % 2 AR*69 / 4940.01 %640.00 %Sinotrans Ltd. - H Shares
0.00 % 0.00 % 1 TC78 / 4940.00 %690.00 %Sinotruk (Hong Kong) Ltd.
0.02 % 0.02 % 1 CDP15 / 4940.00 %280.00 %SK Holdings Co Ltd
0.00 % 0.00 % 8 TC61 / 4940.03 %590.01 %SK Networks Co Ltd
0.02 % 0.02 % 18 CDP114 / 4940.05 %890.01 %Skanska AB
0.02 % 0.02 % 28 AR355 / 4940.01 %2830.02 %SKF AB
0.02 % 0.02 % 6 ENV*233 / 4940.01 %1480.00 %SM Investments Corp
www.trucost.com Copyright © 2018 S&P Trucost Limited, an affiliate of S&P Dow Jones Indices LLC-62-
Page 106

5133
Company BreakdownPortfolio
Company details
Weighting
Portfolio Benchmark
Carbon Apportioned
Tonnes CO2e
% ofPortfolio's
Total CarbonApportioned
CarbonIntensity
(tCO2e/£mn)
CarbonFootprint
Contribution(%)*
FootprintRank in
BenchmarkSector **
DataSource
***
0.05 % 0.05 % 12 TC365 / 4940.00 %2960.01 %SMC Corp
0.02 % 0.02 % 5 CDP147 / 4940.01 %980.00 %Smiths Group
0.02 % 0.02 % 15 TC389 / 4940.00 %3560.01 %Snap On Inc
0.02 % 0.02 % 4 PRE46 / 4940.02 %480.00 %SNC - Lavalin Group Inc
0.01 % 0.01 % 1 CDP26 / 4940.01 %330.00 %Sohgo Security Services Co
0.01 % 0.01 % 45 ENV334 / 4940.02 %2490.03 %Sojitz Corp
0.00 % 0.00 % 3 TC226 / 4940.00 %1440.00 %Sotetsu Holdings Inc
0.02 % 0.02 % 89 CDP449 / 494-0.04 %1,2440.06 %Southwest Airlines Co
0.01 % 0.01 % 2 CDP256 / 4940.00 %1660.00 %Spirax-Sarco Engineering
0.05 % 0.05 % 45 CDP350 / 4940.02 %2760.03 %Stanley Black & Decker
0.01 % 0.01 % 14 TC358 / 4940.00 %2860.01 %Stericycle Inc
0.00 % 0.00 % 2 ENV*211 / 4940.00 %1350.00 %Sulzer AG Ptg
0.04 % 0.04 % 11 ENV*23 / 4940.10 %300.01 %Sumitomo Corp
0.01 % 0.01 % 18 CDP347 / 4940.01 %2700.01 %Sumitomo Heavy Industries
0.01 % 0.01 % 1 ENV*217 / 4940.00 %1390.00 %Sydney Airport
0.00 % 0.00 % 7 TC385 / 4940.00 %3470.00 %Tadano Corp
0.03 % 0.03 % 14 CDP129 / 4940.03 %940.01 %Taisei Corp
0.00 % 0.00 % 6 TC420 / 494-0.00 %6100.00 %Taiwan Glass Ind Corp
0.00 % 0.00 % 0 TC27 / 4940.00 %340.00 %Taiwan Secom Co
0.00 % 0.00 % 1 CDP174 / 4940.00 %1100.00 %TAV Havalimanlari Holdings AS
0.00 % 0.00 % 4 PRE317 / 4940.00 %2200.00 %Teco Electric & Machinery Co Ltd
0.02 % 0.02 % 3 ENV*57 / 4940.01 %560.00 %Teleperformance
0.03 % 0.03 % 31 CDP276 / 4940.03 %1860.02 %Textron Inc
0.00 % 0.00 % 51 ENV466 / 494-0.02 %1,5160.03 %Thai Airways International PCL
0.03 % 0.03 % 7 CDP65 / 4940.03 %610.00 %Thales
0.01 % 0.01 % 8 CDP*393 / 4940.00 %3720.00 %THK Co
0.01 % 0.01 % 9 TC251 / 4940.01 %1650.01 %Tobu Railway Co
0.00 % 0.00 % 5 TC195 / 4940.01 %1220.00 %Toda Corp
0.02 % 0.02 % 12 TC220 / 4940.02 %1410.01 %Tokyu Corp
0.00 % 0.00 % 2 AR*243 / 4940.00 %1590.00 %Toppan Forms Co
0.01 % 0.01 % 30 CDP343 / 4940.01 %2650.02 %Toppan Printing Co
0.02 % 0.02 % 99 CDP279 / 4940.09 %1870.06 %Toshiba Corp
0.01 % 0.01 % 9 CDP303 / 4940.01 %2010.01 %Toto
0.02 % 0.02 % 131 TC337 / 4940.06 %2520.09 %Toyota Tsusho Corp
0.03 % 0.03 % 4 TC142 / 4940.01 %970.00 %TransDigm Group
0.04 % 0.04 % 2 ENV*185 / 4940.00 %1160.00 %Transurban Group NPV
www.trucost.com Copyright © 2018 S&P Trucost Limited, an affiliate of S&P Dow Jones Indices LLC-63-
Page 107

5133
Company BreakdownPortfolio
Company details
Weighting
Portfolio Benchmark
Carbon Apportioned
Tonnes CO2e
% ofPortfolio's
Total CarbonApportioned
CarbonIntensity
(tCO2e/£mn)
CarbonFootprint
Contribution(%)*
FootprintRank in
BenchmarkSector **
DataSource
***
0.01 % 0.01 % 7 AR60 / 4940.03 %580.00 %Travis Perkins
0.01 % 0.01 % 11 CDP342 / 4940.00 %2640.01 %Trelleborg AB B
0.00 % 0.00 % 83 TC464 / 494-0.04 %1,4770.05 %Turkiye Hava Yollari A O
0.00 % 0.00 % 25 CDP484 / 494-0.01 %2,1080.02 %Turkiye Sise Cam Fabrik
0.00 % 0.00 % 4 PRE488 / 494-0.00 %3,0280.00 %U-Ming Marine Transport
0.22 % 0.22 % 204 CDP427 / 494-0.05 %7120.13 %Union Pacific Corp
0.01 % 0.01 % 145 CDP442 / 494-0.06 %1,1250.09 %United Continental Holding Inc
0.19 % 0.19 % 220 CDP377 / 4940.05 %3180.14 %United Parcel Service Inc
0.03 % 0.03 % 4 TC42 / 4940.02 %460.00 %United Rentals Inc
0.20 % 0.20 % 96 CDP*201 / 4940.16 %1250.06 %United Technologies Corp
0.01 % 0.01 % 5 PRE323 / 4940.00 %2240.00 %United Tractors Tbk PT
0.00 % 0.00 % 2 CDP213 / 4940.00 %1370.00 %Ushio Inc
0.03 % 0.03 % 1 TC18 / 4940.01 %290.00 %Verisk Analytics Inc
0.04 % 0.04 % 15 CDP143 / 4940.03 %970.01 %Vestas Wind Systems AS
0.10 % 0.10 % 53 CDP182 / 4940.10 %1140.03 %Vinci
0.07 % 0.07 % 28 ENV88 / 4940.09 %770.02 %Volvo AB
0.01 % 0.01 % 8 TC311 / 4940.01 %2100.01 %Wabtec
0.00 % 0.00 % 32 PRE416 / 494-0.00 %5420.02 %Walsin Lihwa Corp
0.00 % 0.00 % 15 TC471 / 494-0.01 %1,6060.01 %Wan Hai Lines Ltd
0.02 % 0.03 % 5 CDP119 / 4940.01 %930.00 %Wartsila Oyj
0.04 % 0.04 % 14 TC357 / 4940.00 %2860.01 %Waste Connections, Inc.
0.08 % 0.08 % 289 CDP465 / 494-0.13 %1,4820.19 %Waste Management Inc
0.01 % 0.01 % 3 CDP315 / 4940.00 %2170.00 %WEG SA
0.01 % 0.00 % 10 TC332 / 4940.01 %2400.01 %Weichai Power Co Ltd
0.01 % 0.01 % 6 CDP302 / 4940.00 %2000.00 %Weir Group
0.03 % 0.03 % 49 CDP387 / 4940.01 %3490.03 %West Japan Railway
0.00 % 0.00 % 1 ENV*415 / 494-0.00 %5170.00 %Westports Holdings Berhad
0.00 % 0.00 % 1 TC169 / 4940.00 %1080.00 %Xinjiang Goldwind Science & Technology Co
0.03 % 0.03 % 7 CDP208 / 4940.01 %1320.00 %Xylem Inc
0.02 % 0.02 % 17 PRE210 / 4940.03 %1340.01 %Yamato Holdings Co Ltd
0.00 % 0.00 % 2 TC209 / 4940.00 %1330.00 %Yangzijiang Shipbuilding Hldgs Ltd
0.00 % 0.00 % 1 TC368 / 4940.00 %3010.00 %Zardoya-Otis SA
0.00 % 0.00 % 0 ENV*34 / 4940.00 %400.00 %Zhejiang Expressway Co. Ltd. - H Shares
0.01 % 0.01 % 1 TC179 / 4940.00 %1110.00 %Zhuzhou CRRC Times Electric Co Ltd - H
0.01 % 0.01 % 5 AR*126 / 4940.01 %940.00 %Zodiac Aerospace
0.00 % 0.00 % 1 TC255 / 4940.00 %1660.00 %Zoomlion Heavy Industry Science and
www.trucost.com Copyright © 2018 S&P Trucost Limited, an affiliate of S&P Dow Jones Indices LLC-64-
Page 108

5133
Company BreakdownPortfolio
Company details
Weighting
Portfolio Benchmark
Carbon Apportioned
Tonnes CO2e
% ofPortfolio's
Total CarbonApportioned
CarbonIntensity
(tCO2e/£mn)
CarbonFootprint
Contribution(%)*
FootprintRank in
BenchmarkSector **
DataSource
***
7.78 %3,293 2.14 %16.83 %16.86 % 102Information Technology
0.00 % 0.00 % 0 TC67 / 2800.00 %270.00 %58.Com Inc
0.03 % 0.03 % 4 PRE246 / 2800.00 %2190.00 %AAC Technologies Holdings Inc
0.19 % 0.19 % 18 OTH114 / 2800.12 %370.01 %Accenture plc
0.00 % 0.00 % 1 ENV*3 / 2800.03 %150.00 %Acer Inc
0.11 % 0.11 % 2 TC24 / 2800.03 %200.00 %Activision Blizzard Inc
0.17 % 0.17 % 2 CDP*49 / 2800.02 %240.00 %Adobe Systems Inc
0.02 % 0.02 % 2 CDP103 / 2800.01 %350.00 %Advanced Micro Devices
0.02 % 0.02 % 25 CDP248 / 2800.01 %2630.02 %Advanced Semiconductor Engineering
0.01 % 0.01 % 1 TC180 / 2800.00 %870.00 %Advantech Co Ltd
0.01 % 0.01 % 2 CDP196 / 2800.00 %1080.00 %Advantest Corp
0.02 % 0.02 % 2 CDP*168 / 2800.01 %720.00 %Akamai Technologies Inc
0.11 % 0.11 % 1 TC91 / 2800.01 %320.00 %Alibaba Group Holding Ltd
0.02 % 0.02 % 2 CDP39 / 2800.02 %230.00 %Alliance Data Systems Corp
1.34 % 1.33 % 60 CDP138 / 2800.28 %540.04 %Alphabet Inc
0.01 % 0.01 % 8 AR*201 / 2800.02 %1140.01 %Alps Electric Co
0.06 % 0.06 % 2 TC77 / 2800.02 %290.00 %Amadeus IT Group SA
0.02 % 0.02 % 3 CDP136 / 2800.01 %510.00 %Amdocs Ltd
0.06 % 0.06 % 26 CDP256 / 2800.01 %2990.02 %Amphenol Corp A
0.01 % 0.01 % 1 CDP206 / 2800.00 %1220.00 %ams AG
0.07 % 0.07 % 5 OTH190 / 2800.01 %1000.00 %Analog Devices Inc
0.02 % 0.02 % 0 TC20 / 2800.00 %200.00 %ANSYS Inc
1.86 % 1.85 % 91 CDP86 / 2800.79 %310.06 %Apple Inc.
0.13 % 0.13 % 11 CDP166 / 2800.04 %710.01 %Applied Materials Inc
0.02 % 0.02 % 0 TC80 / 2800.00 %290.00 %Arista Networks Inc
0.02 % 0.02 % 17 TC135 / 2800.09 %500.01 %Arrow Electronics Inc
0.01 % 0.01 % 2 TC197 / 2800.00 %1090.00 %ASM Pacific Technology Ltd.
0.12 % 0.12 % 5 CDP167 / 2800.02 %720.00 %ASML Holding NV
0.00 % 0.00 % 1 TC42 / 2800.01 %230.00 %Asseco Poland SA
0.01 % 0.01 % 11 CDP144 / 2800.05 %580.01 %Asustek Computer Inc
0.03 % 0.03 % 4 CDP44 / 2800.04 %230.00 %AtoS SE
0.01 % 0.01 % 55 CDP265 / 2800.00 %4210.04 %AU Optronics Corp
0.01 % 0.01 % 0 AR*7 / 2800.00 %160.00 %Auto Trader Group Plc
0.05 % 0.05 % 0 CDP2 / 2800.01 %150.00 %Autodesk Inc
0.00 % 0.00 % 0 TC55 / 2800.00 %270.00 %Autohome Inc
www.trucost.com Copyright © 2018 S&P Trucost Limited, an affiliate of S&P Dow Jones Indices LLC-65-
Page 109

5133
Company BreakdownPortfolio
Company details
Weighting
Portfolio Benchmark
Carbon Apportioned
Tonnes CO2e
% ofPortfolio's
Total CarbonApportioned
CarbonIntensity
(tCO2e/£mn)
CarbonFootprint
Contribution(%)*
FootprintRank in
BenchmarkSector **
DataSource
***
0.11 % 0.11 % 4 CDP*75 / 2800.04 %290.00 %Automatic Data Processing
0.01 % 0.01 % 11 PRE93 / 2800.09 %330.01 %Avnet Inc
0.01 % 0.01 % 3 CDP212 / 2800.00 %1340.00 %Azbil Corp
0.04 % 0.04 % 1 TC60 / 2800.01 %270.00 %Baidu.com ADR
0.01 % 0.01 % 1 CDP141 / 2800.01 %560.00 %BlackBerry Limited
0.00 % 0.00 % 0 PRE156 / 2800.00 %640.00 %BOE Technology Group Co Ltd
0.23 % 0.22 % 35 TC234 / 2800.03 %1840.02 %Broadcom Inc
0.02 % 0.02 % 1 CDP89 / 2800.01 %310.00 %Broadridge Financial Solutions Inc.
0.01 % 0.01 % 12 CDP233 / 2800.01 %1770.01 %Brother Industries
0.00 % 0.01 % 1 TC143 / 2800.00 %570.00 %BYD Electronic (International) Co. Ltd.
0.02 % 0.02 % 1 CDP*106 / 2800.01 %360.00 %CA Inc
0.08 % 0.08 % 42 CDP211 / 2800.06 %1310.03 %Canon Inc
0.04 % 0.04 % 5 OTH69 / 2800.05 %270.00 %Cap Gemini SE
0.00 % 0.00 % 0 TC145 / 2800.00 %580.00 %Capcom
0.02 % 0.02 % 23 TC275 / 280-0.01 %6840.01 %Catcher Technology Co Ltd
0.02 % 0.02 % 1 TC97 / 2800.01 %330.00 %CDK Global Inc
0.02 % 0.02 % 5 TC72 / 2800.05 %290.00 %CDW Corp/DE
0.03 % 0.03 % 2 PRE52 / 2800.03 %260.00 %CGI Group Inc.
0.03 % 0.03 % 1 TC78 / 2800.01 %290.00 %Check Point Software (US)
0.00 % 0.00 % 4 ENV*195 / 2800.01 %1080.00 %Cheng Uei Precision Industry
0.00 % 0.00 % 2 CDP152 / 2800.01 %610.00 %Chicony Electronics Co
0.00 % 0.00 % 1 TC163 / 2800.00 %680.00 %CHINA RAILWAY SIGNAL & COM
0.02 % 0.02 % 0 CDP6 / 2800.01 %160.00 %Cielo SA
0.39 % 0.39 % 35 CDP137 / 2800.17 %530.02 %Cisco Systems Inc
0.00 % 0.00 % 5 TC221 / 2800.01 %1560.00 %Citizen Watch Co Ltd
0.03 % 0.03 % 1 TC21 / 2800.01 %200.00 %Citrix Systems Inc
0.10 % 0.10 % 7 CDP*115 / 2800.05 %380.00 %Cognizant Tech Solutions Corp
0.00 % 0.00 % 0 TC31 / 2800.00 %210.00 %Colopl Inc
0.01 % 0.01 % 11 CDP108 / 2800.08 %360.01 %Compal Electronics Inc
0.01 % 0.01 % 0 TC17 / 2800.01 %180.00 %Computershare Ltd
0.02 % 0.02 % 1 TC121 / 2800.01 %400.00 %Constellation Software
0.06 % 0.06 % 39 PRE255 / 2800.01 %2950.03 %Corning Inc
0.01 % 0.01 % 2 TC98 / 2800.01 %330.00 %CSRA Inc
0.03 % 0.03 % 1 AR*70 / 2800.01 %270.00 %Dassault Systemes SA
0.03 % 0.03 % 10 CDP208 / 2800.02 %1270.01 %Delta Electronic Ind
0.00 % 0.00 % 1 TC199 / 2800.00 %1120.00 %Delta Electronics Thai PCL
www.trucost.com Copyright © 2018 S&P Trucost Limited, an affiliate of S&P Dow Jones Indices LLC-66-
Page 110

5133
Company BreakdownPortfolio
Company details
Weighting
Portfolio Benchmark
Carbon Apportioned
Tonnes CO2e
% ofPortfolio's
Total CarbonApportioned
CarbonIntensity
(tCO2e/£mn)
CarbonFootprint
Contribution(%)*
FootprintRank in
BenchmarkSector **
DataSource
***
0.01 % 0.01 % 0 TC105 / 2800.00 %360.00 %Dena Co
0.01 % 0.01 % 1 CDP207 / 2800.00 %1250.00 %Disco Corp
0.01 % 0.01 % 0 TC41 / 2800.01 %230.00 %DST Systems Inc
0.06 % 0.06 % 5 ENV142 / 2800.02 %560.00 %DXC Technology Company
0.09 % 0.09 % 5 CDP120 / 2800.03 %390.00 %eBay Inc.
0.08 % 0.08 % 2 TC94 / 2800.01 %330.00 %Electronic Arts
0.00 % 0.00 % 0 AR112 / 2800.00 %370.00 %EOH Holdings Ltd
0.00 % 0.00 % 2 TC240 / 2800.00 %1870.00 %Epistar Corp
0.04 % 0.04 % 12 CDP109 / 2800.09 %370.01 %Ericsson L.M. Telefonaktie
0.02 % 0.02 % 1 TC33 / 2800.01 %210.00 %F5 Networks Inc
0.92 % 0.92 % 12 ENV*111 / 2800.08 %370.01 %Facebook Inc
0.07 % 0.07 % 3 TC50 / 2800.04 %240.00 %Fidelity National Information
0.00 % 0.00 % 3 TC171 / 2800.01 %760.00 %FIH Mobile Ltd
0.06 % 0.06 % 2 TC47 / 2800.02 %230.00 %Fiserv Inc
0.03 % 0.03 % 0 TC9 / 2800.01 %170.00 %FleetCor Technologies Inc
0.02 % 0.02 % 31 CDP192 / 2800.07 %1010.02 %Flex Ltd
0.01 % 0.01 % 4 TC224 / 2800.01 %1590.00 %Foxconn Technology Co Ltd
0.03 % 0.03 % 32 CDP*228 / 2800.03 %1640.02 %Fujifilm Holdings Corp
0.03 % 0.03 % 29 CDP153 / 2800.11 %630.02 %Fujitsu
0.02 % 0.02 % 2 TC172 / 2800.01 %760.00 %Gartner Inc
0.00 % 0.00 % 41 PRE279 / 280-0.02 %1,1480.03 %GCL-Poly Energy Holdings Ltd.
0.01 % 0.01 % 4 CDP182 / 2800.01 %880.00 %Gemalto NV
0.03 % 0.03 % 1 TC28 / 2800.01 %200.00 %Global Payments Inc
0.00 % 0.00 % 0 TC15 / 2800.00 %180.00 %Gmo Payment Gateway Inc
0.00 % 0.00 % 0 TC82 / 2800.00 %290.00 %Gree Inc
0.00 % 0.00 % 0 TC25 / 2800.00 %200.00 %GungHo Online Entertainment
0.01 % 0.01 % 1 CDP176 / 2800.00 %830.00 %Halma
0.01 % 0.01 % 2 TC241 / 2800.00 %1930.00 %Hamamatsu Photonic
0.04 % 0.04 % 7 TC154 / 2800.03 %630.00 %Harris Corp
0.02 % 0.02 % 1 ENV*140 / 2800.01 %550.00 %HCL Technologies Ltd
0.06 % 0.06 % 33 CDP126 / 2800.19 %440.02 %Hewlett Packard Enterprise Co
0.03 % 0.03 % 4 TC210 / 2800.01 %1280.00 %Hexagon AB
0.01 % 0.01 % 2 CDP226 / 2800.00 %1600.00 %Hirose Electric Co
0.08 % 0.07 % 173 CDP231 / 2800.17 %1760.11 %Hitachi
0.01 % 0.01 % 1 CDP133 / 2800.01 %490.00 %Hitachi High-Technologies
0.00 % 0.00 % 1 TC184 / 2800.00 %920.00 %Hitachi Kokusai Electric Inc
www.trucost.com Copyright © 2018 S&P Trucost Limited, an affiliate of S&P Dow Jones Indices LLC-67-
Page 111

5133
Company BreakdownPortfolio
Company details
Weighting
Portfolio Benchmark
Carbon Apportioned
Tonnes CO2e
% ofPortfolio's
Total CarbonApportioned
CarbonIntensity
(tCO2e/£mn)
CarbonFootprint
Contribution(%)*
FootprintRank in
BenchmarkSector **
DataSource
***
0.12 % 0.12 % 256 AR*222 / 2800.30 %1570.17 %Hon Hai Precision Industry Co Ltd
0.01 % 0.00 % 2 PRE170 / 2800.00 %750.00 %Horiba
0.08 % 0.08 % 33 CDP129 / 2800.18 %470.02 %HP Inc
0.00 % 0.00 % 2 PRE164 / 2800.01 %700.00 %HTC Corporation
0.02 % 0.02 % 2 TC146 / 2800.01 %580.00 %IAC InterActiveCorp
0.00 % 0.00 % 12 CDP268 / 280-0.00 %4990.01 %Ibiden Co
0.07 % 0.07 % 22 ENV*247 / 2800.01 %2290.01 %Infineon Technologies AG
0.06 % 0.06 % 6 CDP*162 / 2800.02 %670.00 %Infosys Ltd
0.01 % 0.01 % 0 CDP1 / 2800.01 %140.00 %Ingenico Group
0.01 % 0.01 % 55 CDP271 / 280-0.00 %5090.04 %Innolux Corp
0.41 % 0.41 % 108 CDP209 / 2800.17 %1270.07 %Intel Corp
0.29 % 0.29 % 41 CDP118 / 2800.27 %390.03 %Intl Business Machines Corp
0.08 % 0.08 % 1 CDP16 / 2800.02 %180.00 %Intuit Inc
0.01 % 0.01 % 7 CDP123 / 2800.04 %420.00 %Inventec Corp
0.00 % 0.00 % 2 TC189 / 2800.00 %1000.00 %Itochu Techno-Solutions Corp
0.01 % 0.01 % 35 CDP217 / 2800.05 %1460.02 %Jabil Inc
0.00 % 0.00 % 2 ENV*236 / 2800.00 %1860.00 %Japan Aviation Electronics
0.00 % 0.00 % 12 CDP244 / 2800.01 %2020.01 %Japan Display Inc
0.02 % 0.02 % 4 CDP*139 / 2800.02 %550.00 %Juniper Networks Inc
0.01 % 0.01 % 0 CDP13 / 2800.00 %170.00 %Just Eat Plc
0.00 % 0.00 % 0 TC88 / 2800.00 %310.00 %Kakaku.com Inc
0.01 % 0.01 % 0 TC57 / 2800.00 %270.00 %Kakao Corp
0.11 % 0.11 % 4 TC219 / 2800.01 %1500.00 %Keyence Corp
0.02 % 0.02 % 2 ENV150 / 2800.01 %610.00 %Keysight Technologies Inc
0.01 % 0.01 % 12 TC254 / 2800.00 %2880.01 %Kingboard Chemical Holdings Ltd.
0.00 % 0.00 % 9 TC278 / 280-0.00 %8970.01 %Kingboard Laminates Holdings Ltd.
0.00 % 0.00 % 0 TC27 / 2800.00 %200.00 %Kingsoft Corporation Ltd.
0.04 % 0.04 % 3 CDP*175 / 2800.01 %800.00 %KLA-Tencor Corporation
0.00 % 0.00 % 0 TC87 / 2800.00 %310.00 %Koei Tecmo Holdings Co Ltd
0.01 % 0.01 % 1 TC179 / 2800.00 %870.00 %Konami Holdings Cor
0.01 % 0.01 % 15 CDP227 / 2800.02 %1610.01 %KONICA MINOLTA INC
0.04 % 0.04 % 51 OTH264 / 2800.00 %4050.03 %Kyocera Corp
0.07 % 0.07 % 17 CDP*245 / 2800.01 %2190.01 %Lam Research Corp
0.04 % 0.04 % 2 TC200 / 2800.00 %1130.00 %Largan Precision Co Ltd
0.00 % 0.00 % 17 TC232 / 2800.02 %1770.01 %Legend Holdings Corp.
0.01 % 0.01 % 14 CDP116 / 2800.09 %380.01 %Lenovo Group Ltd.
www.trucost.com Copyright © 2018 S&P Trucost Limited, an affiliate of S&P Dow Jones Indices LLC-68-
Page 112

5133
Company BreakdownPortfolio
Company details
Weighting
Portfolio Benchmark
Carbon Apportioned
Tonnes CO2e
% ofPortfolio's
Total CarbonApportioned
CarbonIntensity
(tCO2e/£mn)
CarbonFootprint
Contribution(%)*
FootprintRank in
BenchmarkSector **
DataSource
***
0.01 % 0.01 % 86 CDP266 / 2800.00 %4240.06 %LG Display Co Ltd
0.00 % 0.00 % 0 TC56 / 2800.00 %270.00 %LINE Corp
0.01 % 0.01 % 11 CDP204 / 2800.02 %1200.01 %Lite-On Technology Corp
0.01 % 0.01 % 2 TC191 / 2800.00 %1010.00 %Logitech International SA
0.02 % 0.02 % 3 CDP186 / 2800.01 %970.00 %Marvell Technology Group Ltd
0.31 % 0.31 % 2 CDP14 / 2800.04 %180.00 %Mastercard Inc
0.03 % 0.03 % 9 PRE257 / 2800.00 %3260.01 %MAXIM INTEGRATED
0.03 % 0.03 % 7 CDP160 / 2800.03 %670.00 %Mediatek Inc
0.02 % 0.02 % 0 TC61 / 2800.00 %270.00 %Mercadolibre inc
0.03 % 0.03 % 0 CDP30 / 2800.00 %210.00 %Micro Focus International
0.05 % 0.05 % 14 CDP273 / 280-0.00 %5330.01 %Microchip Technology Inc
0.10 % 0.10 % 75 CDP267 / 280-0.00 %4640.05 %Micron Technology Inc
1.29 % 1.28 % 54 OTH134 / 2800.28 %500.04 %Microsoft Corp
0.00 % 0.00 % 0 TC68 / 2800.00 %270.00 %Momo Inc ADR
0.03 % 0.03 % 6 CDP158 / 2800.02 %650.00 %Motorola Solutions Inc
0.00 % 0.00 % 0 TC51 / 2800.00 %240.00 %Mphasis Ltd
0.06 % 0.06 % 28 CDP251 / 2800.01 %2720.02 %Murata Manufacturing Co Ltd
0.00 % 0.00 % 2 CDP258 / 2800.00 %3400.00 %Nanya Technology Corp
0.04 % 0.04 % 1 TC62 / 2800.01 %270.00 %NAVER Corp
0.01 % 0.01 % 4 TC119 / 2800.02 %390.00 %NCR Corp
0.02 % 0.02 % 0 TC65 / 2800.00 %270.00 %NCsoft Corp
0.02 % 0.02 % 12 CDP122 / 2800.07 %420.01 %NEC Corp
0.03 % 0.03 % 6 CDP178 / 2800.02 %850.00 %NetApp Inc
0.01 % 0.01 % 0 TC104 / 2800.00 %350.00 %NetEase Inc ADR
0.01 % 0.01 % 0 TC26 / 2800.00 %200.00 %Netmarble Corp
0.01 % 0.01 % 0 TC22 / 2800.00 %200.00 %Nexon Co Ltd
0.00 % 0.00 % 0 TC23 / 2800.00 %200.00 %NHN Entertainment Corp
0.01 % 0.01 % 0 TC74 / 2800.00 %290.00 %Nice Ltd
0.09 % 0.09 % 6 TC216 / 2800.01 %1420.00 %Nintendo Co Ltd
0.01 % 0.01 % 19 PRE276 / 280-0.00 %7300.01 %Nippon Electric Glass
0.08 % 0.08 % 15 CDP124 / 2800.09 %430.01 %Nokia OYJ
0.01 % 0.01 % 1 CDP131 / 2800.00 %480.00 %Nomura Research Institute Ltd
0.00 % 0.00 % 1 PRE173 / 2800.00 %780.00 %Novatek Microelectronics Corp
0.00 % 0.00 % 0 TC99 / 2800.00 %340.00 %NS Solutions Corp
0.02 % 0.02 % 2 TC96 / 2800.02 %330.00 %NTT Data Communications Systems
0.01 % 0.01 % 1 TC32 / 2800.01 %210.00 %Nuance Communications Inc
www.trucost.com Copyright © 2018 S&P Trucost Limited, an affiliate of S&P Dow Jones Indices LLC-69-
Page 113

5133
Company BreakdownPortfolio
Company details
Weighting
Portfolio Benchmark
Carbon Apportioned
Tonnes CO2e
% ofPortfolio's
Total CarbonApportioned
CarbonIntensity
(tCO2e/£mn)
CarbonFootprint
Contribution(%)*
FootprintRank in
BenchmarkSector **
DataSource
***
0.23 % 0.23 % 2 CDP*79 / 2800.02 %290.00 %Nvidia Corp
0.09 % 0.09 % 25 TC238 / 2800.02 %1870.02 %NXP Semiconductor NV
0.00 % 0.00 % 0 TC46 / 2800.00 %230.00 %Obic Business Consultants Ltd
0.01 % 0.01 % 0 TC128 / 2800.00 %460.00 %Obic Co Ltd
0.02 % 0.02 % 11 CDP214 / 2800.02 %1390.01 %Omron Corp
0.32 % 0.32 % 18 CDP148 / 2800.08 %590.01 %Oracle Corp
0.01 % 0.01 % 0 TC102 / 2800.00 %350.00 %Oracle Corp Japan
0.00 % 0.00 % 0 TC101 / 2800.00 %340.00 %Oracle Financial Services Software Ltd
0.01 % 0.01 % 1 TC71 / 2800.01 %290.00 %Otsuka Corp
0.03 % 0.03 % 0 TC35 / 2800.00 %210.00 %Palo Alto Networks Inc.
0.04 % 0.04 % 1 TC107 / 2800.01 %360.00 %Paychex Inc
0.17 % 0.17 % 2 TC10 / 2800.04 %170.00 %PayPal Holdings Inc.
0.01 % 0.01 % 25 PRE159 / 2800.09 %660.02 %Pegatron Corporation
0.02 % 0.02 % 2 TC165 / 2800.01 %700.00 %Qorvo, Inc
0.18 % 0.18 % 14 ENV*125 / 2800.08 %440.01 %QUALCOMM Inc
0.01 % 0.01 % 13 ENV*132 / 2800.07 %490.01 %Quanta Computer
0.00 % 0.00 % 3 TC239 / 2800.00 %1870.00 %Realtek Semiconductor Corp
0.05 % 0.05 % 1 TC38 / 2800.01 %220.00 %Red Hat Inc
0.01 % 0.01 % 8 CDP263 / 2800.00 %3930.01 %Renesas Electronics Corp
0.02 % 0.02 % 28 CDP213 / 2800.04 %1350.02 %Ricoh Co
0.01 % 0.01 % 0 CDP5 / 2800.00 %160.00 %Rightmove Plc
0.02 % 0.02 % 11 CDP262 / 2800.00 %3840.01 %Rohm Co Ltd
0.02 % 0.02 % 1 CDP18 / 2800.01 %180.00 %Sage Group
0.15 % 0.14 % 3 CDP92 / 2800.02 %320.00 %Salesforce.com
0.01 % 0.01 % 19 CDP*259 / 2800.00 %3410.01 %Samsung Electro-Mech Co
0.57 % 0.56 % 280 CDP218 / 2800.36 %1490.18 %Samsung Electronics Co
0.02 % 0.02 % 13 CDP249 / 2800.01 %2640.01 %Samsung SDI Co
0.01 % 0.01 % 1 CDP*85 / 2800.01 %300.00 %Samsung SDS Co Ltd
0.23 % 0.23 % 10 CDP117 / 2800.07 %380.01 %SAP SE
0.01 % 0.01 % 2 CDP202 / 2800.00 %1160.00 %SCREEN Holdings Co Ltd
0.00 % 0.00 % 0 CDP113 / 2800.00 %370.00 %SCSK Corp
0.02 % 0.02 % 29 CDP242 / 2800.02 %1940.02 %Seagate Technology
0.02 % 0.02 % 11 CDP220 / 2800.01 %1500.01 %Seiko Epson Corp
0.01 % 0.01 % 19 PRE277 / 280-0.01 %7610.01 %Semiconductor Manufacturing International
0.05 % 0.05 % 1 TC81 / 2800.01 %290.00 %ServiceNow Inc.
0.01 % 0.01 % 3 ENV*185 / 2800.01 %960.00 %Shimadzu Corp
www.trucost.com Copyright © 2018 S&P Trucost Limited, an affiliate of S&P Dow Jones Indices LLC-70-
Page 114

5133
Company BreakdownPortfolio
Company details
Weighting
Portfolio Benchmark
Carbon Apportioned
Tonnes CO2e
% ofPortfolio's
Total CarbonApportioned
CarbonIntensity
(tCO2e/£mn)
CarbonFootprint
Contribution(%)*
FootprintRank in
BenchmarkSector **
DataSource
***
0.01 % 0.01 % 7 CDP252 / 2800.00 %2850.00 %Siliconware Precision Industries Co
0.02 % 0.02 % 0 TC58 / 2800.00 %270.00 %Sina Corp (Caymans)
0.09 % 0.09 % 77 CDP269 / 280-0.01 %5000.05 %SK Hynix Inc
0.04 % 0.04 % 9 TC243 / 2800.01 %1970.01 %Skyworks Solutions Inc
0.00 % 0.00 % 0 TC53 / 2800.00 %260.00 %Sonda
0.02 % 0.02 % 0 TC40 / 2800.00 %230.00 %Splunk Inc.
0.01 % 0.01 % 1 TC110 / 2800.00 %370.00 %Square Enix Co Ltd
0.03 % 0.03 % 20 CDP250 / 2800.01 %2690.01 %STMicroelectronics NV
0.01 % 0.01 % 11 ENV272 / 280-0.00 %5280.01 %Sumco Corp
0.02 % 0.02 % 3 TC230 / 2800.00 %1710.00 %Sunny Optical Technology (Group) Co. Ltd.
0.05 % 0.05 % 3 CDP155 / 2800.01 %640.00 %Symantec Corp
0.00 % 0.00 % 8 TC151 / 2800.03 %610.01 %Synnex Tech Intl Corp
0.03 % 0.03 % 1 TC48 / 2800.01 %230.00 %Synopsys Inc
0.39 % 0.39 % 142 CDP261 / 2800.02 %3730.09 %Taiwan Semiconductor Manufacturing Co
0.00 % 0.00 % 4 TC235 / 2800.00 %1850.00 %Taiyo Yuden Co
0.04 % 0.04 % 3 CDP*157 / 2800.01 %640.00 %Tata Consultancy Services Ltd
0.02 % 0.02 % 39 CDP260 / 2800.01 %3560.03 %TDK Corp
0.07 % 0.07 % 20 CDP205 / 2800.03 %1210.01 %TE Connectivity Ltd.
0.01 % 0.01 % 1 CDP149 / 2800.01 %610.00 %Tech Mahindra Ltd
0.01 % 0.01 % 0 TC43 / 2800.00 %230.00 %Temenos Group AG
0.52 % 0.53 % 5 TC59 / 2800.05 %270.00 %Tencent Holdings Ltd.
0.20 % 0.20 % 55 CDP253 / 2800.02 %2870.04 %Texas Instruments Inc
0.01 % 0.01 % 1 TC100 / 2800.01 %340.00 %TIS Inc
0.06 % 0.05 % 6 CDP181 / 2800.01 %870.00 %Tokyo Electron
0.00 % 0.00 % 1 PRE193 / 2800.00 %1060.00 %Topcon Corp
0.03 % 0.03 % 2 TC84 / 2800.02 %300.00 %Total System Services Inc
0.01 % 0.01 % 3 TC237 / 2800.00 %1870.00 %Tower Semiconductor Ltd
0.00 % 0.00 % 4 CDP223 / 2800.00 %1580.00 %TPK Holding Co Ltd
0.00 % 0.00 % 1 TC183 / 2800.00 %910.00 %Transcend information
0.01 % 0.01 % 0 TC76 / 2800.00 %290.00 %TravelSky Technology Ltd. - H Shares
0.01 % 0.01 % 0 TC19 / 2800.00 %200.00 %Trend Micro Inc
0.02 % 0.02 % 3 TC177 / 2800.01 %830.00 %Trimble Inc
0.03 % 0.03 % 1 TC63 / 2800.01 %270.00 %Twitter Inc
0.01 % 0.01 % 1 AR*169 / 2800.00 %730.00 %Ubisoft Entertainment SA
0.01 % 0.01 % 3 AR*229 / 2800.00 %1660.00 %Ulvac Inc
0.00 % 0.00 % 11 PRE270 / 280-0.00 %5030.01 %Unimicron Technology Corp
www.trucost.com Copyright © 2018 S&P Trucost Limited, an affiliate of S&P Dow Jones Indices LLC-71-
Page 115

5133
Company BreakdownPortfolio
Company details
Weighting
Portfolio Benchmark
Carbon Apportioned
Tonnes CO2e
% ofPortfolio's
Total CarbonApportioned
CarbonIntensity
(tCO2e/£mn)
CarbonFootprint
Contribution(%)*
FootprintRank in
BenchmarkSector **
DataSource
***
0.02 % 0.02 % 1 TC83 / 2800.01 %300.00 %United Internet AG Reg
0.01 % 0.01 % 33 CDP274 / 280-0.00 %5490.02 %United Microelectronics Corp
0.00 % 0.00 % 7 CDP280 / 280-0.00 %1,1750.00 %Vanguard International Semiconductor Co
0.01 % 0.01 % 3 TC187 / 2800.01 %990.00 %Venture Corp Ltd
0.02 % 0.02 % 0 TC73 / 2800.00 %290.00 %VeriSign Inc
0.45 % 0.45 % 3 CDP8 / 2800.05 %160.00 %Visa Inc
0.02 % 0.02 % 0 CDP29 / 2800.00 %200.00 %Vmware Inc
0.01 % 0.01 % 2 ENV*203 / 2800.00 %1170.00 %VTech Holdings Ltd.
0.00 % 0.00 % 0 TC54 / 2800.00 %270.00 %WEIBO CORP ADR
0.06 % 0.06 % 27 CDP225 / 2800.03 %1590.02 %Western Digital Corp
0.02 % 0.02 % 2 PRE34 / 2800.02 %210.00 %Western Union Co
0.01 % 0.01 % 2 CDP174 / 2800.01 %790.00 %Wipro Ltd
0.02 % 0.02 % 0 TC12 / 2800.00 %170.00 %Wirecard AG
0.00 % 0.00 % 13 CDP130 / 2800.07 %470.01 %Wistron Corp
0.03 % 0.03 % 0 PRE95 / 2800.00 %330.00 %Workday Inc.
0.02 % 0.02 % 1 CDP4 / 2800.02 %150.00 %Worldpay Group Plc
0.03 % 0.03 % 1 TC11 / 2800.01 %170.00 %Worldpay Inc
0.00 % 0.00 % 0 TC45 / 2800.00 %230.00 %Xero Ltd.
0.02 % 0.02 % 9 CDP*161 / 2800.03 %670.01 %Xerox Corp
0.04 % 0.04 % 3 CDP188 / 2800.01 %1000.00 %Xilinx Inc
0.00 % 0.00 % 1 TC215 / 2800.00 %1420.00 %Xinyi Solar Holdings Ltd
0.01 % 0.01 % 0 TC90 / 2800.00 %320.00 %Yahoo Japan Corp
0.02 % 0.02 % 0 TC64 / 2800.00 %270.00 %Yandex NV
0.02 % 0.02 % 4 TC198 / 2800.01 %1120.00 %Yaskawa Electric Corp
0.01 % 0.01 % 4 CDP194 / 2800.01 %1080.00 %Yokogawa Electric Corp
0.01 % 0.01 % 2 ENV*127 / 2800.01 %450.00 %ZTE Corp
-19.71 %38,252 24.86 %5.50 %5.48 % 1,703Materials
0.00 % 0.00 % 122 CDP286 / 292-0.08 %10,7120.08 %ACC Ltd
0.00 % 0.00 % 34 CDP154 / 292-0.01 %1,0400.02 %Acerinox SA
0.00 % 0.00 % 40 AR*243 / 292-0.02 %3,8090.03 %Adelaide Brighton Ltd
0.00 % 0.00 % 10 CDP92 / 292-0.00 %6340.01 %AECI Ltd
0.00 % 0.00 % 8 CDP220 / 292-0.00 %2,5340.01 %African Rainbow Minerals
0.02 % 0.02 % 12 CDP48 / 2920.00 %4080.01 %Agnico Eagle Mines Limited
0.03 % 0.03 % 78 PRE45 / 2920.00 %4010.05 %Agrium Inc
0.12 % 0.12 % 463 CDP192 / 292-0.22 %1,6650.30 %Air Liquide
www.trucost.com Copyright © 2018 S&P Trucost Limited, an affiliate of S&P Dow Jones Indices LLC-72-
Page 116

5133
Company BreakdownPortfolio
Company details
Weighting
Portfolio Benchmark
Carbon Apportioned
Tonnes CO2e
% ofPortfolio's
Total CarbonApportioned
CarbonIntensity
(tCO2e/£mn)
CarbonFootprint
Contribution(%)*
FootprintRank in
BenchmarkSector **
DataSource
***
0.08 % 0.07 % 542 CDP*251 / 292-0.32 %4,2510.35 %Air Products & Chemicals Inc
0.01 % 0.01 % 32 ENV*93 / 292-0.01 %6370.02 %Air Water Inc
0.05 % 0.05 % 106 CDP62 / 292-0.01 %5030.07 %Akzo Nobel NV
0.04 % 0.03 % 191 ENV*258 / 292-0.11 %4,8660.12 %Albemarle Corp
0.02 % 0.02 % 499 CDP238 / 292-0.29 %3,7480.32 %Alcoa Corp
0.01 % 0.01 % 9 PRE39 / 2920.00 %3730.01 %Alrosa PJSC
0.01 % 0.01 % 88 ENV*252 / 292-0.05 %4,3770.06 %Alumina Ltd
0.01 % 0.01 % 94 AR*187 / 292-0.04 %1,4950.06 %Aluminum Corporation of China Ltd
0.01 % 0.01 % 105 CDP288 / 292-0.07 %12,0950.07 %Ambuja Cements Ltd
0.03 % 0.03 % 59 CDP57 / 292-0.00 %4790.04 %Amcor Ltd
0.00 % 0.00 % 73 TC250 / 292-0.04 %4,2360.05 %Angang Steel Co Ltd
0.00 % 0.00 % 24 CDP197 / 292-0.01 %1,7940.02 %Anglo American Platinum Ltd
0.05 % 0.05 % 276 CDP164 / 292-0.11 %1,1430.18 %Anglo American Plc
0.01 % 0.01 % 74 CDP178 / 292-0.03 %1,2740.05 %AngloGold Ashanti Ltd
0.01 % 0.01 % 300 TC285 / 292-0.19 %10,4110.19 %Anhui Conch Cement Co Ltd
0.01 % 0.01 % 19 CDP155 / 292-0.01 %1,0410.01 %Antofagasta Hldgs
0.04 % 0.04 % 2,180 CDP254 / 292-1.28 %4,5871.42 %ArcelorMittal Inc
0.02 % 0.02 % 83 CDP122 / 292-0.03 %8240.05 %Arkema
0.04 % 0.04 % 92 CDP*65 / 292-0.01 %5160.06 %Asahi Kasei Corporation
0.01 % 0.01 % 33 CDP63 / 292-0.00 %5040.02 %Ashland Global Holdings Inc
0.00 % 0.00 % 169 OTH*280 / 292-0.10 %9,0490.11 %Asia Cement Corp
0.01 % 0.01 % 2 CDP*12 / 2920.00 %1820.00 %Asian Paints Ltd
0.00 % 0.00 % 6 ENV*278 / 292-0.00 %8,3770.00 %Assore Limited
0.02 % 0.02 % 26 CDP32 / 2920.01 %3020.02 %Avery Dennison Corp
0.03 % 0.03 % 75 CDP84 / 292-0.01 %6040.05 %Ball Corp
0.04 % 0.04 % 72 CDP81 / 292-0.01 %5940.05 %Barrick Gold Corp
0.22 % 0.22 % 551 CDP87 / 292-0.10 %6190.36 %BASF SE
0.00 % 0.00 % 38 TC232 / 292-0.02 %3,3230.02 %BBMG Corporation
0.01 % 0.01 % 24 OTH49 / 2920.00 %4220.02 %Bemis Co Inc
0.23 % 0.23 % 377 CDP135 / 292-0.13 %9320.24 %BHP Billiton Ltd
0.01 % 0.01 % 210 ENV*215 / 292-0.11 %2,3880.14 %Bluescope Steel Ltd
0.02 % 0.02 % 30 CDP51 / 292-0.00 %4450.02 %Boliden AB
0.01 % 0.01 % 82 CDP202 / 292-0.04 %1,9430.05 %Boral Ltd
0.00 % 0.00 % 0 TC3 / 2920.00 %520.00 %Bradespar SA
0.01 % 0.01 % 48 CDP167 / 292-0.02 %1,1710.03 %Braskem SA
0.01 % 0.01 % 145 TC275 / 292-0.09 %7,6660.09 %Buzzi Unicem SpA
www.trucost.com Copyright © 2018 S&P Trucost Limited, an affiliate of S&P Dow Jones Indices LLC-73-
Page 117

5133
Company BreakdownPortfolio
Company details
Weighting
Portfolio Benchmark
Carbon Apportioned
Tonnes CO2e
% ofPortfolio's
Total CarbonApportioned
CarbonIntensity
(tCO2e/£mn)
CarbonFootprint
Contribution(%)*
FootprintRank in
BenchmarkSector **
DataSource
***
0.00 % 0.00 % 1 TC69 / 292-0.00 %5260.00 %Castrol India Ltd
0.03 % 0.03 % 66 CDP131 / 292-0.02 %8620.04 %Celanese Corp A
0.01 % 0.01 % 86 CDP255 / 292-0.05 %4,5900.06 %Cementos Argos SA
0.00 % 0.00 % 25 ENV253 / 292-0.01 %4,4170.02 %Cemex Latam Holdings S.A.
0.03 % 0.03 % 1,054 CDP*263 / 292-0.63 %5,2810.69 %Cemex SA
0.02 % 0.02 % 305 ENV*266 / 292-0.18 %5,8350.20 %CF Industries Holdings
0.00 % 0.00 % 9 TC168 / 292-0.00 %1,1830.01 %China BlueChemical Ltd. - H Shares
0.01 % 0.01 % 6 PRE245 / 292-0.00 %3,9650.00 %China Molybdenum Co. Ltd.
0.01 % 0.00 % 827 TC269 / 292-0.50 %6,5200.54 %China National Building Material Co. Ltd. - H
0.00 % 0.00 % 158 TC249 / 292-0.09 %4,1890.10 %China National Materials Co. Ltd. - H Shares
0.00 % 0.00 % 114 TC279 / 292-0.07 %8,8930.07 %China Resources Cement Holdings Ltd.
0.02 % 0.02 % 351 CDP234 / 292-0.20 %3,5030.23 %China Steel Corp
0.00 % 0.00 % 5 AR*88 / 292-0.00 %6260.00 %China Zhongwang Holdings Ltd.
0.02 % 0.02 % 3 ENV*31 / 2920.00 %2960.00 %Christian Hansen Holding A/S
0.00 % 0.00 % 14 PRE210 / 292-0.01 %2,2580.01 %Ciech SA
0.02 % 0.02 % 24 CDP35 / 2920.00 %3390.02 %Clariant AG Reg
0.00 % 0.00 % 100 OTH229 / 292-0.06 %3,0150.06 %Companhia Siderurgica Nacional
0.01 % 0.01 % 5 TC54 / 292-0.00 %4580.00 %Compania de Minas Buenaventura S.A.A.
0.03 % 0.03 % 86 ENV*103 / 292-0.02 %7130.06 %Covestro AG
0.07 % 0.07 % 603 CDP185 / 292-0.27 %1,4510.39 %CRH Plc
0.01 % 0.01 % 9 CDP40 / 2920.00 %3760.01 %Croda Intl
0.00 % 0.00 % 3 TC76 / 292-0.00 %5720.00 %CSG Holding Co Ltd
0.00 % 0.00 % 15 ENV*105 / 292-0.00 %7250.01 %CSR Ltd
0.01 % 0.01 % 28 ENV*106 / 292-0.01 %7290.02 %Daicel Chemical Industries Co
0.00 % 0.00 % 37 PRE142 / 292-0.01 %9800.02 %Daido Steel Co
0.01 % 0.01 % 47 CDP175 / 292-0.02 %1,2330.03 %Denka Co Ltd
0.01 % 0.01 % 20 CDP23 / 2920.01 %2400.01 %DIC Corp
0.37 % 0.37 % 731 CDP156 / 292-0.28 %1,0680.48 %Dow Chemical
0.00 % 0.00 % 21 ENV99 / 292-0.00 %6810.01 %DOWA Holdings Co Ltd
0.02 % 0.01 % 57 CDP124 / 292-0.02 %8350.04 %DS Smith
0.00 % 0.00 % 7 TC44 / 2920.00 %3860.00 %DuluxGroup Ltd
0.03 % 0.03 % 157 CDP176 / 292-0.07 %1,2350.10 %Eastman Chemical Co
0.08 % 0.08 % 26 CDP10 / 2920.03 %1580.02 %Ecolab Inc
0.01 % 0.01 % 151 ENV*260 / 292-0.09 %4,8720.10 %Empresas CMPC SA
0.01 % 0.01 % 3 TC41 / 2920.00 %3770.00 %EMS-Chemie Hldg AG
0.01 % 0.01 % 88 TC248 / 292-0.05 %4,1840.06 %Eregli Demir Celik
www.trucost.com Copyright © 2018 S&P Trucost Limited, an affiliate of S&P Dow Jones Indices LLC-74-
Page 118

5133
Company BreakdownPortfolio
Company details
Weighting
Portfolio Benchmark
Carbon Apportioned
Tonnes CO2e
% ofPortfolio's
Total CarbonApportioned
CarbonIntensity
(tCO2e/£mn)
CarbonFootprint
Contribution(%)*
FootprintRank in
BenchmarkSector **
DataSource
***
0.00 % 0.00 % 5 TC47 / 2920.00 %4070.00 %Eternal Chemical Co
0.01 % 0.01 % 58 CDP130 / 292-0.02 %8620.04 %Evonik Industries
0.00 % 0.00 % 21 ENV240 / 292-0.01 %3,7720.01 %Fauji Fertilizer Co Ltd
0.00 % 0.00 % 7 TC152 / 292-0.00 %1,0380.00 %Feng Hsin Iron & Steel Co
0.01 % 0.01 % 89 CDP262 / 292-0.05 %5,2500.06 %Fibria Celulose S.A.
0.01 % 0.01 % 43 CDP60 / 292-0.00 %4930.03 %Fletcher Building Ltd
0.03 % 0.03 % 11 CDP22 / 2920.01 %2350.01 %FMC Corp
0.02 % 0.02 % 260 TC231 / 292-0.15 %3,2030.17 %Formosa Chem & Fibre Co
0.03 % 0.03 % 129 ENV*206 / 292-0.07 %2,1610.08 %Formosa Plastics Corp
0.01 % 0.01 % 26 CDP71 / 292-0.00 %5390.02 %Fortescue Metals Group
0.00 % 0.00 % 3 CDP34 / 2920.00 %3360.00 %FP Corp
0.03 % 0.03 % 0 TC1 / 2920.00 %150.00 %Franco-Nevada Corp
0.04 % 0.04 % 194 CDP*141 / 292-0.07 %9780.13 %Freeport-McMoRan Inc
0.01 % 0.01 % 4 CDP104 / 292-0.00 %7200.00 %Fresnillo PLC
0.01 % 0.01 % 1 TC7 / 2920.00 %1440.00 %Frutarom
0.01 % 0.01 % 14 TC68 / 292-0.00 %5260.01 %Fuchs Petrolub SE
0.01 % 0.01 % 105 PRE174 / 292-0.04 %1,2160.07 %Gerdau SA
0.05 % 0.05 % 8 CDP6 / 2920.01 %1230.01 %Givaudan AG
0.12 % 0.12 % 550 CDP33 / 2920.14 %3190.36 %Glencore Plc
0.00 % 0.00 % 2 CDP59 / 292-0.00 %4880.00 %Godrej Industries Ltd
0.01 % 0.01 % 33 CDP133 / 292-0.01 %9050.02 %Gold Fields Ltd
0.03 % 0.03 % 20 CDP43 / 2920.00 %3840.01 %Goldcorp Inc
0.01 % 0.01 % 53 PRE188 / 292-0.02 %1,5150.03 %Grasim Industries Ltd
0.00 % 0.00 % 26 TC193 / 292-0.01 %1,6820.02 %Grupa Azoty S.A.
0.02 % 0.02 % 63 ENV*180 / 292-0.03 %1,2910.04 %Grupo Mexico SAB de CV
0.01 % 0.01 % 61 PRE159 / 292-0.02 %1,0840.04 %Hanwha Chemical Corp
0.00 % 0.00 % 40 CDP228 / 292-0.02 %2,9310.03 %Harmony Gold Mining Co
0.04 % 0.04 % 1,024 CDP265 / 292-0.61 %5,7260.67 %HeidelbergCement AG
0.01 % 0.01 % 158 PRE213 / 292-0.08 %2,3500.10 %Hindalco Industries Ltd
0.00 % 0.00 % 5 CDP230 / 292-0.00 %3,0310.00 %Hindustan Zinc Ltd
0.01 % 0.01 % 9 CDP38 / 2920.00 %3620.01 %Hitachi Chemical Co
0.01 % 0.01 % 44 ENV*123 / 292-0.01 %8290.03 %Hitachi Metals
0.00 % 0.00 % 0 TC20 / 2920.00 %2140.00 %Huabao International Holdings Ltd.
0.01 % 0.01 % 22 CDP61 / 292-0.00 %4940.01 %Huhtamaki Oyj
0.01 % 0.01 % 39 PRE46 / 2920.00 %4060.03 %Hyosung Corp
0.01 % 0.01 % 291 ENV*221 / 292-0.16 %2,5470.19 %Hyundai Steel Co
www.trucost.com Copyright © 2018 S&P Trucost Limited, an affiliate of S&P Dow Jones Indices LLC-75-
Page 119

5133
Company BreakdownPortfolio
Company details
Weighting
Portfolio Benchmark
Carbon Apportioned
Tonnes CO2e
% ofPortfolio's
Total CarbonApportioned
CarbonIntensity
(tCO2e/£mn)
CarbonFootprint
Contribution(%)*
FootprintRank in
BenchmarkSector **
DataSource
***
0.01 % 0.01 % 10 AR*181 / 292-0.00 %1,2910.01 %Iluka Resources Ltd
0.01 % 0.01 % 56 CDP198 / 292-0.03 %1,8040.04 %Imerys
0.00 % 0.00 % 60 CDP204 / 292-0.03 %2,0700.04 %Impala Platinum
0.01 % 0.01 % 55 CDP191 / 292-0.03 %1,6460.04 %Incitec Pivot
0.00 % 0.00 % 84 ENV*290 / 292-0.05 %13,5340.05 %Indocement Tunggal Prakarsa Tbk PT
0.00 % 0.00 % 35 CDP166 / 292-0.01 %1,1690.02 %Indorama Ventures PCL
0.00 % 0.00 % 7 TC153 / 292-0.00 %1,0380.00 %Industrias CH
0.01 % 0.01 % 16 ENV*118 / 292-0.00 %8170.01 %Industrias Penoles
0.03 % 0.03 % 8 CDP11 / 2920.01 %1780.01 %Intl Flavors & Fragrances
0.05 % 0.05 % 747 CDP218 / 292-0.40 %2,4960.49 %Intl Paper Co
0.00 % 0.01 % 28 CDP144 / 292-0.01 %9860.02 %Israel Chemical Corp
0.00 % 0.00 % 48 TC183 / 292-0.02 %1,3930.03 %Israel Corp
0.01 % 0.01 % 10 TC53 / 292-0.00 %4570.01 %James Hardie Industries plc
0.00 % 0.00 % 26 TC222 / 292-0.01 %2,5820.02 %Jastrzebska Spolka Weglowa SA
0.02 % 0.02 % 1,075 ENV236 / 292-0.62 %3,6630.70 %JFE Holdings Inc
0.00 % 0.00 % 38 TC50 / 2920.00 %4360.02 %Jiangxi Copper Co Ltd
0.00 % 0.00 % 189 ENV289 / 292-0.12 %13,3030.12 %Jindal Steel & Power Ltd
0.02 % 0.02 % 48 CDP26 / 2920.02 %2470.03 %Johnson, Matthey
0.01 % 0.01 % 24 CDP112 / 292-0.01 %7660.02 %JSR Corp
0.01 % 0.01 % 302 ENV*273 / 292-0.18 %7,2490.20 %JSW Steel Ltd
0.01 % 0.01 % 36 AR*95 / 292-0.01 %6510.02 %K+S AG
0.00 % 0.01 % 28 ENV*91 / 292-0.01 %6310.02 %Kaneka Corp
0.00 % 0.00 % 0 ENV21 / 2920.00 %2310.00 %Kansai Nerolac Paints Ltd.
0.01 % 0.01 % 5 TC16 / 2920.00 %1950.00 %Kansai Paint Co
0.01 % 0.01 % 54 PRE161 / 292-0.02 %1,1140.04 %KGHM Polska Miedz SA Br
0.01 % 0.01 % 11 CDP94 / 292-0.00 %6420.01 %Klabin SA
0.01 % 0.01 % 386 PRE219 / 292-0.21 %2,5330.25 %Kobe Steel
0.03 % 0.03 % 72 CDP83 / 292-0.01 %6020.05 %Koninklijke DSM NV
0.01 % 0.01 % 22 TC82 / 292-0.00 %5960.01 %Korea Zinc Co
0.00 % 0.00 % 4 CDP98 / 292-0.00 %6620.00 %Kumba Iron Ore
0.00 % 0.00 % 71 CDP217 / 292-0.04 %2,4430.05 %Kumho Petro Chemical Co Ltd
0.02 % 0.02 % 52 CDP119 / 292-0.02 %8190.03 %Kuraray Co
0.06 % 0.06 % 2,530 CDP277 / 292-1.56 %8,3111.64 %LafargeHolcim Ltd
0.02 % 0.02 % 124 CDP*149 / 292-0.05 %1,0320.08 %Lanxess AG
0.00 % 0.00 % 11 TC147 / 292-0.00 %1,0310.01 %Lee & Man Paper Manufacturing Ltd.
0.04 % 0.04 % 134 CDP115 / 292-0.04 %7920.09 %LG Chem Ltd
www.trucost.com Copyright © 2018 S&P Trucost Limited, an affiliate of S&P Dow Jones Indices LLC-76-
Page 120
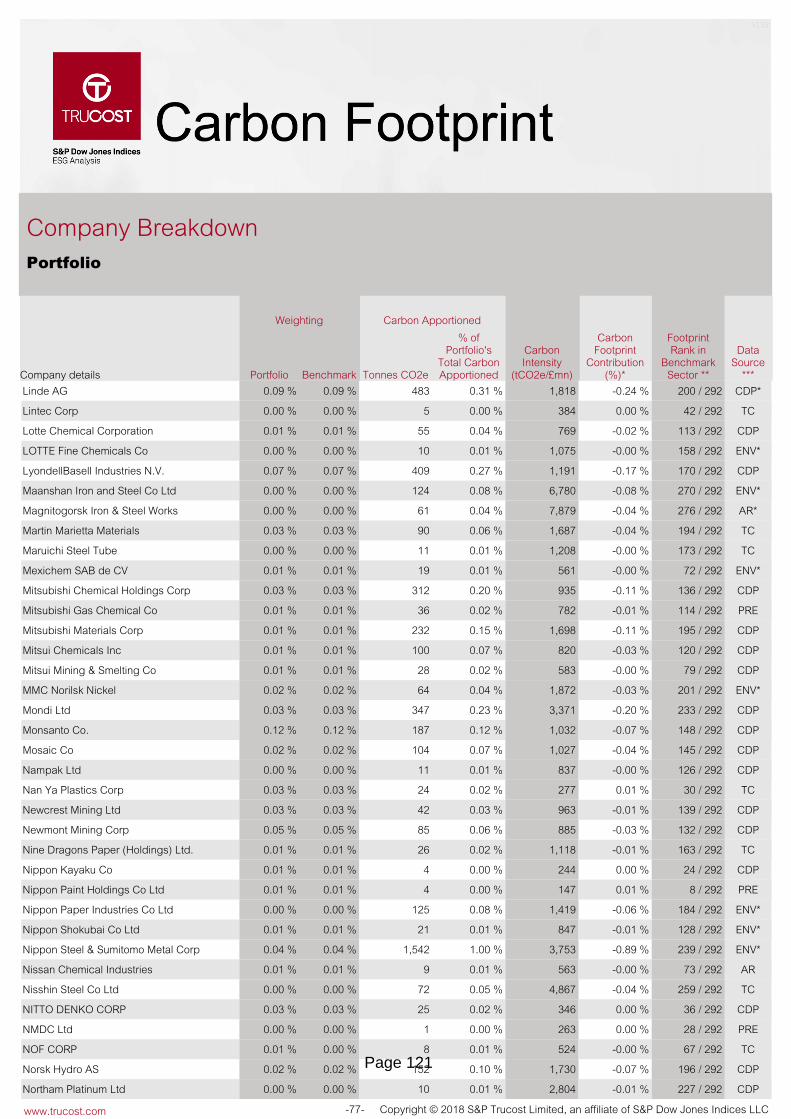
5133
Company BreakdownPortfolio
Company details
Weighting
Portfolio Benchmark
Carbon Apportioned
Tonnes CO2e
% ofPortfolio's
Total CarbonApportioned
CarbonIntensity
(tCO2e/£mn)
CarbonFootprint
Contribution(%)*
FootprintRank in
BenchmarkSector **
DataSource
***
0.09 % 0.09 % 483 CDP*200 / 292-0.24 %1,8180.31 %Linde AG
0.00 % 0.00 % 5 TC42 / 2920.00 %3840.00 %Lintec Corp
0.01 % 0.01 % 55 CDP113 / 292-0.02 %7690.04 %Lotte Chemical Corporation
0.00 % 0.00 % 10 ENV*158 / 292-0.00 %1,0750.01 %LOTTE Fine Chemicals Co
0.07 % 0.07 % 409 CDP170 / 292-0.17 %1,1910.27 %LyondellBasell Industries N.V.
0.00 % 0.00 % 124 ENV*270 / 292-0.08 %6,7800.08 %Maanshan Iron and Steel Co Ltd
0.00 % 0.00 % 61 AR*276 / 292-0.04 %7,8790.04 %Magnitogorsk Iron & Steel Works
0.03 % 0.03 % 90 TC194 / 292-0.04 %1,6870.06 %Martin Marietta Materials
0.00 % 0.00 % 11 TC173 / 292-0.00 %1,2080.01 %Maruichi Steel Tube
0.01 % 0.01 % 19 ENV*72 / 292-0.00 %5610.01 %Mexichem SAB de CV
0.03 % 0.03 % 312 CDP136 / 292-0.11 %9350.20 %Mitsubishi Chemical Holdings Corp
0.01 % 0.01 % 36 PRE114 / 292-0.01 %7820.02 %Mitsubishi Gas Chemical Co
0.01 % 0.01 % 232 CDP195 / 292-0.11 %1,6980.15 %Mitsubishi Materials Corp
0.01 % 0.01 % 100 CDP120 / 292-0.03 %8200.07 %Mitsui Chemicals Inc
0.01 % 0.01 % 28 CDP79 / 292-0.00 %5830.02 %Mitsui Mining & Smelting Co
0.02 % 0.02 % 64 ENV*201 / 292-0.03 %1,8720.04 %MMC Norilsk Nickel
0.03 % 0.03 % 347 CDP233 / 292-0.20 %3,3710.23 %Mondi Ltd
0.12 % 0.12 % 187 CDP148 / 292-0.07 %1,0320.12 %Monsanto Co.
0.02 % 0.02 % 104 CDP145 / 292-0.04 %1,0270.07 %Mosaic Co
0.00 % 0.00 % 11 CDP126 / 292-0.00 %8370.01 %Nampak Ltd
0.03 % 0.03 % 24 TC30 / 2920.01 %2770.02 %Nan Ya Plastics Corp
0.03 % 0.03 % 42 CDP139 / 292-0.01 %9630.03 %Newcrest Mining Ltd
0.05 % 0.05 % 85 CDP132 / 292-0.03 %8850.06 %Newmont Mining Corp
0.01 % 0.01 % 26 TC163 / 292-0.01 %1,1180.02 %Nine Dragons Paper (Holdings) Ltd.
0.01 % 0.01 % 4 CDP24 / 2920.00 %2440.00 %Nippon Kayaku Co
0.01 % 0.01 % 4 PRE8 / 2920.01 %1470.00 %Nippon Paint Holdings Co Ltd
0.00 % 0.00 % 125 ENV*184 / 292-0.06 %1,4190.08 %Nippon Paper Industries Co Ltd
0.01 % 0.01 % 21 ENV*128 / 292-0.01 %8470.01 %Nippon Shokubai Co Ltd
0.04 % 0.04 % 1,542 ENV*239 / 292-0.89 %3,7531.00 %Nippon Steel & Sumitomo Metal Corp
0.01 % 0.01 % 9 AR73 / 292-0.00 %5630.01 %Nissan Chemical Industries
0.00 % 0.00 % 72 TC259 / 292-0.04 %4,8670.05 %Nisshin Steel Co Ltd
0.03 % 0.03 % 25 CDP36 / 2920.00 %3460.02 %NITTO DENKO CORP
0.00 % 0.00 % 1 PRE28 / 2920.00 %2630.00 %NMDC Ltd
0.01 % 0.00 % 8 TC67 / 292-0.00 %5240.01 %NOF CORP
0.02 % 0.02 % 152 CDP196 / 292-0.07 %1,7300.10 %Norsk Hydro AS
0.00 % 0.00 % 10 CDP227 / 292-0.01 %2,8040.01 %Northam Platinum Ltd
www.trucost.com Copyright © 2018 S&P Trucost Limited, an affiliate of S&P Dow Jones Indices LLC-77-
Page 121

5133
Company BreakdownPortfolio
Company details
Weighting
Portfolio Benchmark
Carbon Apportioned
Tonnes CO2e
% ofPortfolio's
Total CarbonApportioned
CarbonIntensity
(tCO2e/£mn)
CarbonFootprint
Contribution(%)*
FootprintRank in
BenchmarkSector **
DataSource
***
0.00 % 0.00 % 54 TC237 / 292-0.03 %3,6640.04 %Novolipetsk Steel (GDR)
0.03 % 0.03 % 12 AR75 / 292-0.00 %5710.01 %Novozymes AS B
0.04 % 0.04 % 239 TC151 / 292-0.09 %1,0380.16 %Nucor Corp
0.00 % 0.00 % 3 ENV*9 / 2920.00 %1580.00 %Nufarm Limited
0.04 % 0.04 % 171 CDP225 / 292-0.09 %2,6840.11 %Nutrien Ltd.
0.00 % 0.00 % 39 TC186 / 292-0.02 %1,4940.03 %OCI Company Ltd
0.01 % 0.01 % 35 PRE224 / 292-0.02 %2,6650.02 %OCI NV
0.01 % 0.01 % 145 ENV*165 / 292-0.06 %1,1590.09 %Oji Holdings Corp
0.00 % 0.00 % 6 CDP52 / 292-0.00 %4570.00 %Omnia Hldgs Ltd
0.01 % 0.01 % 43 ENV*129 / 292-0.01 %8510.03 %Orica Ltd
0.00 % 0.00 % 5 TC97 / 292-0.00 %6540.00 %Oriental Union Chem Corp
0.01 % 0.01 % 26 AR*101 / 292-0.01 %7010.02 %Orora Limited
0.00 % 0.00 % 6 AR*108 / 292-0.00 %7340.00 %OZ Minerals Limited
0.02 % 0.02 % 78 TC140 / 292-0.03 %9680.05 %Packaging Corp of America
0.00 % 0.00 % 7 TC109 / 292-0.00 %7500.00 %Petkim AS
0.01 % 0.01 % 40 AR*216 / 292-0.02 %2,4140.03 %Petronas Chemicals Group Bhd
0.00 % 0.00 % 24 AR*212 / 292-0.01 %2,3050.02 %PhosAgro PJSC
0.00 % 0.00 % 1 PRE18 / 2920.00 %2120.00 %Pidilite Industries Ltd
0.01 % 0.01 % 9 CDP96 / 292-0.00 %6530.01 %Polymetal International PLC
0.04 % 0.04 % 1,100 CDP207 / 292-0.57 %2,1620.71 %POSCO
0.06 % 0.06 % 57 CDP29 / 2920.02 %2710.04 %PPG Industries Inc
0.09 % 0.09 % 390 OTH223 / 292-0.21 %2,5890.25 %Praxair Inc
0.01 % 0.01 % 61 CDP143 / 292-0.02 %9840.04 %PTT Global Chemical PCL
0.02 % 0.02 % 15 CDP177 / 292-0.01 %1,2480.01 %Randgold Resources Ltd
0.00 % 0.00 % 31 CDP107 / 292-0.01 %7290.02 %Rengo Co
0.18 % 0.18 % 553 CDP179 / 292-0.24 %1,2810.36 %Rio Tinto Ltd
0.01 % 0.01 % 11 AR*37 / 2920.00 %3580.01 %RPC Group
0.01 % 0.01 % 265 CDP244 / 292-0.15 %3,9640.17 %Sappi Ltd
0.02 % 0.02 % 21 CDP19 / 2920.01 %2140.01 %Sealed Air Corp
0.00 % 0.01 % 97 PRE272 / 292-0.06 %7,1670.06 %Semen Indonesia Persero Tbk PT
0.01 % 0.01 % 67 TC242 / 292-0.04 %3,8030.04 %Severstal PJSC
0.00 % 0.00 % 16 TC160 / 292-0.01 %1,1070.01 %Shandong Chenming Paper Holdings Ltd
0.07 % 0.07 % 15 CDP5 / 2920.03 %1020.01 %Sherwin-Williams Co
0.08 % 0.08 % 139 CDP162 / 292-0.05 %1,1180.09 %Shin-Etsu Chemical Co
0.00 % 0.00 % 8 TC241 / 292-0.00 %3,7770.01 %Shougang Fushan Resources Group Ltd
0.01 % 0.01 % 62 PRE121 / 292-0.02 %8210.04 %Showa Denko KK
www.trucost.com Copyright © 2018 S&P Trucost Limited, an affiliate of S&P Dow Jones Indices LLC-78-
Page 122

5133
Company BreakdownPortfolio
Company details
Weighting
Portfolio Benchmark
Carbon Apportioned
Tonnes CO2e
% ofPortfolio's
Total CarbonApportioned
CarbonIntensity
(tCO2e/£mn)
CarbonFootprint
Contribution(%)*
FootprintRank in
BenchmarkSector **
DataSource
***
0.01 % 0.01 % 42 CDP291 / 292-0.03 %14,6710.03 %Shree Cement Ltd
0.03 % 0.03 % 329 ENV*226 / 292-0.18 %2,7880.21 %Siam Cement Public Co.
0.00 % 0.00 % 78 ENV*292 / 292-0.05 %18,6670.05 %Siam City Cement PCL
0.00 % 0.00 % 91 CDP246 / 292-0.05 %3,9760.06 %Sibanye Gold Limited
0.04 % 0.04 % 37 CDP70 / 292-0.00 %5370.02 %Sika AG
0.00 % 0.00 % 3 ENV4 / 2920.01 %930.00 %Sims Metal Management Ltd
0.00 % 0.00 % 90 AR*209 / 292-0.05 %2,2490.06 %Sinopec Shanghai Petrochemical Co Ltd
0.00 % 0.00 % 2 TC13 / 2920.00 %1870.00 %SKC
0.02 % 0.02 % 162 CDP182 / 292-0.07 %1,3080.11 %Smurfit Kappa Group PLC
0.02 % 0.02 % 186 CDP189 / 292-0.09 %1,5920.12 %Solvay
0.01 % 0.01 % 6 ENV78 / 292-0.00 %5800.00 %SOQUIMICH - Sociedad Quimica y Minera
0.03 % 0.03 % 575 CDP274 / 292-0.35 %7,5050.37 %South32 Limited
0.01 % 0.01 % 6 PRE102 / 292-0.00 %7050.00 %Southern Copper Corp
0.00 % 0.00 % 209 ENV*283 / 292-0.13 %10,1480.14 %Steel Authority of India Ltd
0.02 % 0.02 % 232 CDP205 / 292-0.12 %2,1070.15 %Stora Enso OYJ
0.02 % 0.02 % 138 CDP100 / 292-0.03 %6970.09 %Sumitomo Chemical Co
0.02 % 0.02 % 56 CDP117 / 292-0.02 %7970.04 %Sumitomo Metal Mining Co
0.00 % 0.00 % 182 TC281 / 292-0.11 %9,4390.12 %Sumitomo Osaka Cement Co
0.00 % 0.01 % 7 PRE58 / 292-0.00 %4800.00 %Suzano Papel e Celulose S.A.
0.02 % 0.02 % 8 CDP14 / 2920.01 %1880.01 %Symrise AG
0.00 % 0.00 % 6 CDP172 / 292-0.00 %1,2070.00 %Synthos SA
0.01 % 0.02 % 566 ENV*271 / 292-0.34 %7,0410.37 %Taiheiyo Cement Corp
0.01 % 0.01 % 352 TC282 / 292-0.22 %9,9000.23 %Taiwan Cement Corp
0.00 % 0.00 % 7 TC190 / 292-0.00 %1,6110.00 %Taiwan Fertilizer Co
0.00 % 0.00 % 24 ENV*157 / 292-0.01 %1,0710.02 %Taiyo Nippon Sanso Corp
0.01 % 0.01 % 257 CDP*261 / 292-0.15 %4,8840.17 %Tata Steel Ltd
0.02 % 0.02 % 53 CDP90 / 292-0.01 %6280.03 %Teck Resources Limited
0.01 % 0.01 % 36 CDP56 / 292-0.00 %4770.02 %Teijin
0.03 % 0.03 % 530 CDP171 / 292-0.22 %1,2070.34 %ThyssenKrupp AG
0.00 % 0.00 % 119 AR284 / 292-0.07 %10,2950.08 %Titan Cement Co
0.03 % 0.03 % 122 CDP*85 / 292-0.02 %6050.08 %Toray Industries Inc
0.01 % 0.01 % 63 TC137 / 292-0.02 %9350.04 %Tosoh Corp
0.01 % 0.01 % 45 CDP*110 / 292-0.01 %7560.03 %Toyo Seikan Group Holdings Ltd
0.00 % 0.00 % 80 CDP203 / 292-0.04 %2,0270.05 %Toyobo Co
0.01 % 0.01 % 4 TC77 / 292-0.00 %5730.00 %Turquoise Hill Resources Ltd
0.01 % 0.01 % 300 TC256 / 292-0.18 %4,5920.19 %Ube Industries
www.trucost.com Copyright © 2018 S&P Trucost Limited, an affiliate of S&P Dow Jones Indices LLC-79-
Page 123

5133
Company BreakdownPortfolio
Company details
Weighting
Portfolio Benchmark
Carbon Apportioned
Tonnes CO2e
% ofPortfolio's
Total CarbonApportioned
CarbonIntensity
(tCO2e/£mn)
CarbonFootprint
Contribution(%)*
FootprintRank in
BenchmarkSector **
DataSource
***
0.01 % 0.01 % 177 CDP287 / 292-0.11 %11,6980.12 %Ultratech Cement Ltd
0.02 % 0.02 % 29 AR*17 / 2920.02 %2100.02 %Umicore
0.00 % 0.00 % 73 CDP264 / 292-0.04 %5,4160.05 %United Company RUSAL Plc
0.01 % 0.01 % 4 PRE27 / 2920.00 %2580.00 %UPL Ltd
0.03 % 0.03 % 356 CDP211 / 292-0.19 %2,2930.23 %UPM-Kymmene Oyj
0.00 % 0.00 % 3 ENV146 / 292-0.00 %1,0290.00 %Uralkaliy PJSC
0.00 % 0.00 % 69 PRE268 / 292-0.04 %6,3610.04 %Usiminas SA
0.00 % 0.00 % 1 TC89 / 292-0.00 %6270.00 %Vale Indonesia Tbk
0.07 % 0.07 % 193 CDP127 / 292-0.06 %8380.13 %Vale S.A.
0.02 % 0.02 % 355 CDP267 / 292-0.21 %6,2130.23 %Vedanta Ltd
0.01 % 0.01 % 225 ENV*214 / 292-0.12 %2,3740.15 %VOESTALPINE AG
0.04 % 0.04 % 27 TC64 / 292-0.00 %5100.02 %Vulcan Materials Co
0.01 % 0.00 % 22 CDP125 / 292-0.01 %8350.01 %Wacker Chemie AG
0.01 % 0.01 % 10 TC66 / 292-0.00 %5210.01 %Westlake Chemical Corp
0.03 % 0.03 % 177 CDP134 / 292-0.06 %9080.11 %WestRock Co
0.02 % 0.02 % 0 PRE2 / 2920.00 %160.00 %Wheaton Precious Metals Corp.
0.00 % 0.00 % 9 TC169 / 292-0.00 %1,1850.01 %Yamato Kogyo Co
0.02 % 0.02 % 231 CDP208 / 292-0.12 %2,2240.15 %Yara International ASA
0.00 % 0.00 % 12 ENV*86 / 292-0.00 %6130.01 %Zeon Corp
0.00 % 0.00 % 2 TC55 / 292-0.00 %4740.00 %Zhaojin Mining Industry Co. Ltd. - H Shares
0.00 % 0.00 % 16 TC74 / 292-0.00 %5640.01 %Zijin Mining Group Co Ltd
0.85 %617 0.40 %3.05 %3.06 % 142Real Estate
0.00 % 0.00 % 9 ENV*178 / 180-0.00 %7380.01 %Aeon Mall Co Ltd
0.00 % 0.00 % 4 TC132 / 1800.01 %1200.00 %Agile Group Holdings Ltd
0.00 % 0.00 % 0 TC76 / 1800.00 %1000.00 %Airport City Ltd
0.00 % 0.00 % 1 TC110 / 1800.00 %1090.00 %ALDAR Properties
0.02 % 0.03 % 1 TC56 / 1800.00 %1000.00 %Alexandria Real Estate Eqty
0.00 % 0.00 % 0 TC30 / 1800.00 %890.00 %Aloni Hetz Properties
0.13 % 0.13 % 9 PRE98 / 1800.02 %1070.01 %American Tower Corp A
0.00 % 0.00 % 0 TC80 / 1800.00 %1000.00 %AMOT Investment Ltd
0.01 % 0.01 % 1 ENV*150 / 1800.00 %1480.00 %Ascendas REIT
0.00 % 0.00 % 2 CDP179 / 180-0.00 %1,9690.00 %Attacq Ltd
0.06 % 0.06 % 2 CDP15 / 1800.01 %600.00 %AvalonBay Communities Inc
0.01 % 0.01 % 2 CDP143 / 1800.00 %1350.00 %Ayala Land Inc
0.00 % 0.00 % 0 TC45 / 1800.00 %1000.00 %Azrieli Group
www.trucost.com Copyright © 2018 S&P Trucost Limited, an affiliate of S&P Dow Jones Indices LLC-80-
Page 124

5133
Company BreakdownPortfolio
Company details
Weighting
Portfolio Benchmark
Carbon Apportioned
Tonnes CO2e
% ofPortfolio's
Total CarbonApportioned
CarbonIntensity
(tCO2e/£mn)
CarbonFootprint
Contribution(%)*
FootprintRank in
BenchmarkSector **
DataSource
***
0.00 % 0.00 % 0 TC78 / 1800.00 %1000.00 %Barwa Real Estate
0.04 % 0.04 % 5 ENV*141 / 1800.01 %1290.00 %Boston Properties Inc
0.01 % 0.01 % 1 PRE166 / 1800.00 %2500.00 %BR Malls Participacoes S.A.
0.02 % 0.02 % 1 CDP29 / 1800.00 %870.00 %British Land Co
0.00 % 0.00 % 0 TC47 / 1800.00 %1000.00 %Bumi Serpong Damai PT
0.01 % 0.01 % 0 CDP13 / 1800.00 %530.00 %Capital & Counties Properties PLC
0.01 % 0.01 % 0 PRE148 / 1800.00 %1470.00 %CapitaLand Commercial Trust
0.02 % 0.02 % 6 ENV*157 / 1800.01 %1900.00 %Capitaland Ltd
0.01 % 0.01 % 1 AR*153 / 1800.00 %1670.00 %CapitaLand Mall Trust REIT
0.03 % 0.03 % 3 CDP2 / 1800.04 %190.00 %CBRE Group Inc.
0.01 % 0.01 % 2 AR*173 / 1800.00 %3500.00 %Central Pattana PCL
0.00 % 0.00 % 0 AR*142 / 1800.00 %1320.00 %Champion REIT
0.02 % 0.02 % 10 TC62 / 1800.02 %1000.01 %China Evergrande Group
0.01 % 0.01 % 2 TC92 / 1800.01 %1040.00 %China Jinmao Holdings Group Ltd.
0.00 % 0.00 % 0 TC41 / 1800.00 %1000.00 %China Oceanwide Holdings Ltd
0.03 % 0.03 % 9 ENV24 / 1800.02 %810.01 %China Overseas Land & Investment Ltd.
0.02 % 0.02 % 8 TC87 / 1800.02 %1010.01 %China Resources Land Ltd.
0.00 % 0.00 % 0 TC138 / 1800.00 %1240.00 %China South City Holdings Ltd.
0.01 % 0.01 % 3 CDP18 / 1800.01 %670.00 %China Vanke Co Ltd
0.01 % 0.01 % 4 ENV*160 / 1800.00 %2110.00 %City Developments Ltd
0.05 % 0.05 % 10 TC91 / 1800.02 %1040.01 %CK Asset Holdings Ltd
0.02 % 0.02 % 8 TC86 / 1800.02 %1010.01 %Country Garden Holdings Co. Ltd.
0.09 % 0.09 % 2 TC5 / 1800.01 %320.00 %Crown Castle Intl Corp
0.00 % 0.00 % 1 TC125 / 1800.00 %1170.00 %Daikyo Inc
0.03 % 0.03 % 7 CDP12 / 1800.03 %520.00 %Daito Trust Construction Co
0.05 % 0.05 % 26 CDP25 / 1800.07 %820.02 %Daiwa House Industry Co
0.00 % 0.00 % 1 TC49 / 1800.00 %1000.00 %DAMAC Properties Dubai Co PJSC
0.01 % 0 CDPN / A0.00 %470.00 %Derwent London Plc
0.03 % 0.03 % 2 TC96 / 1800.00 %1060.00 %Deutsche Wohnen AG BR
0.02 % 0.02 % 3 CDP172 / 1800.00 %3350.00 %Dexus
0.06 % 0.06 % 1 TC4 / 1800.01 %290.00 %Digital Realty Trust
0.00 % 0.00 % 0 PRE36 / 1800.00 %970.00 %DLF Ltd
0.02 % 0.02 % 1 TC50 / 1800.00 %1000.00 %Duke Realty Corp
0.00 % 0.00 % 0 TC77 / 1800.00 %1000.00 %Emaar Malls Group
0.02 % 0.02 % 3 TC65 / 1800.01 %1000.00 %Emaar Properties
0.00 % 0.00 % 1 TC61 / 1800.00 %1000.00 %Emlak Konut Gayrimenkul Yatirim Ortakligi
www.trucost.com Copyright © 2018 S&P Trucost Limited, an affiliate of S&P Dow Jones Indices LLC-81-
Page 125

5133
Company BreakdownPortfolio
Company details
Weighting
Portfolio Benchmark
Carbon Apportioned
Tonnes CO2e
% ofPortfolio's
Total CarbonApportioned
CarbonIntensity
(tCO2e/£mn)
CarbonFootprint
Contribution(%)*
FootprintRank in
BenchmarkSector **
DataSource
***
0.08 % 0.08 % 28 CDP176 / 180-0.00 %5410.02 %Equinix Inc
0.05 % 0.05 % 3 TC64 / 1800.01 %1000.00 %Equity Residential
0.04 % 0.04 % 2 TC70 / 1800.00 %1000.00 %Essex Property Trust
0.02 % 0.02 % 1 TC73 / 1800.00 %1000.00 %Extra Space Storage Inc
0.01 % 0.01 % 1 TC74 / 1800.00 %1000.00 %Fastighets AB Bald
0.02 % 0.02 % 1 TC51 / 1800.00 %1000.00 %Federal Realty Invt Trust
0.01 % 0.01 % 1 TC69 / 1800.00 %1000.00 %Fibra Uno Administracion S.A. de C.V.
0.01 % 0.01 % 1 TC123 / 1800.00 %1170.00 %Fonciere des Regions
0.01 % 0.01 % 0 TC106 / 1800.00 %1080.00 %Fortress REIT Ltd.-B
0.00 % 0.00 % 0 ENV*115 / 1800.00 %1110.00 %Frasers Property Limited
0.01 % 0.01 % 0 TC128 / 1800.00 %1170.00 %Fullshare Holdings Ltd
0.00 % 0.00 % 1 TC52 / 1800.00 %1000.00 %Gazit Globe 1982 Ltd
0.02 % 0.02 % 0 CDP14 / 1800.00 %540.00 %Gecina
0.03 % 0.03 % 6 CDP167 / 1800.00 %2670.00 %GGP Inc
0.02 % 0.02 % 1 TC38 / 1800.00 %990.00 %Global Logistic Properties Ltd
0.03 % 0.03 % 1 TC33 / 1800.00 %920.00 %Goodman Group
0.02 % 0.02 % 3 CDP165 / 1800.00 %2460.00 %GPT Group
0.00 % 0.00 % 1 CDP147 / 1800.00 %1450.00 %Great Eagle Holdings Ltd.
0.00 % 0.00 % 2 TC39 / 1800.00 %990.00 %Greentown China Holdings Ltd.
0.01 % 0.01 % 0 CDP*6 / 1800.00 %400.00 %Growthpoint Properties
0.01 % 0.01 % 4 TC89 / 1800.01 %1020.00 %Guangzhou R&F Properties Co Ltd - H
0.01 % 0.01 % 1 CDP144 / 1800.00 %1380.00 %Hammerson
0.01 % 0.01 % 9 ENV*177 / 180-0.00 %5460.01 %Hang Lung Group Ltd.
0.01 % 0.01 % 3 PRE171 / 1800.00 %3190.00 %Hang Lung Properties Ltd.
0.03 % 0.03 % 7 CDP161 / 1800.00 %2190.00 %HCP Inc
0.02 % 0.02 % 1 TC84 / 1800.00 %1000.00 %Henderson Land Development Co. Ltd.
0.02 % 0.02 % 1 TC67 / 1800.00 %1000.00 %Hong Kong Land Hldgs Ltd
0.00 % 0.00 % 1 TC88 / 1800.00 %1010.00 %Hopson Development Holdings Ltd.
0.01 % 0.01 % 3 TC58 / 1800.01 %1000.00 %Hospitality Properties Trust
0.03 % 0.03 % 9 CDP122 / 1800.02 %1160.01 %Host Hotels & Resorts Inc
0.01 % 0.01 % 1 TC35 / 1800.00 %920.00 %Hulic Co Ltd (New)
0.00 % 0.00 % 1 CDP168 / 1800.00 %2920.00 %Hyprop Investments Ltd
0.01 % 0.01 % 0 AR*117 / 1800.00 %1110.00 %Hysan Development Co. Ltd.
0.01 % 0.01 % 1 CDP10 / 1800.00 %520.00 %Icade
0.01 % 0.01 % 0 CDP20 / 1800.00 %700.00 %Intu Properties PLC
0.00 % 0.00 % 0 TC108 / 1800.00 %1080.00 %IOI Properties Group Bhd
www.trucost.com Copyright © 2018 S&P Trucost Limited, an affiliate of S&P Dow Jones Indices LLC-82-
Page 126

5133
Company BreakdownPortfolio
Company details
Weighting
Portfolio Benchmark
Carbon Apportioned
Tonnes CO2e
% ofPortfolio's
Total CarbonApportioned
CarbonIntensity
(tCO2e/£mn)
CarbonFootprint
Contribution(%)*
FootprintRank in
BenchmarkSector **
DataSource
***
0.02 % 0.02 % 6 CDP140 / 1800.01 %1260.00 %Iron Mountain Inc
0.01 % 0.01 % 1 TC126 / 1800.00 %1170.00 %JBG Smith Properties
0.01 % 0.01 % 1 ENV*93 / 1800.00 %1040.00 %Kerry Properties Ltd.
0.02 % 0.02 % 1 CDP19 / 1800.00 %670.00 %Kimco Realty Corp
0.00 % 0.00 % 0 PRE7 / 1800.00 %440.00 %Kiwi Property Group Limited
0.00 % 0.00 % 0 TC40 / 1800.00 %1000.00 %KLCC Property Holdings Bhd
0.02 % 0.02 % 1 CDP129 / 1800.00 %1190.00 %Klepierre
0.00 % 0.00 % 1 TC101 / 1800.00 %1080.00 %KWG Property Holding Ltd.
0.00 % 0.00 % 1 TC134 / 1800.00 %1200.00 %Land and Houses PCL
0.02 % 0.02 % 1 CDP26 / 1800.00 %830.00 %Land Securities Group PLC
0.01 % 0.01 % 1 TC75 / 1800.00 %1000.00 %LEG Immobilien AG
0.02 % 0.02 % 13 ENV32 / 1800.03 %920.01 %Lend Lease Group
0.00 % 0.00 % 6 TC136 / 1800.01 %1210.00 %Leopalace 21 Corp
0.01 % 0.01 % 3 PRE170 / 1800.00 %3080.00 %Liberty Property Trust
0.04 % 0.04 % 2 PRE154 / 1800.00 %1800.00 %Link REIT
0.01 % 0.01 % 3 TC63 / 1800.01 %1000.00 %Longfor Properties Co. Ltd.
0.00 % 0.00 % 1 TC145 / 1800.00 %1400.00 %LSR Group OJSC
0.02 % 0.02 % 1 CDP83 / 1800.00 %1000.00 %Macerich Co
0.00 % 0.00 % 0 TC37 / 1800.00 %990.00 %Megaworld Corp
0.00 % 0.00 % 0 TC81 / 1800.00 %1000.00 %MELISRON Ltd.
0.01 % 0.01 % 0 TC79 / 1800.00 %1000.00 %Merlin Properties Socimi SA
0.03 % 0.03 % 2 TC68 / 1800.00 %1000.00 %Mid-America Apt Communties
0.02 % 0.02 % 3 ENV*119 / 1800.00 %1130.00 %Mirvac Group
0.05 % 0.05 % 11 ENV*135 / 1800.02 %1210.01 %Mitsubishi Estate Co
0.05 % 0.05 % 12 ENV*23 / 1800.04 %800.01 %Mitsui Fudosan Co
0.00 % 0.00 % 0 TC48 / 1800.00 %1000.00 %Multiplan Empreendimentos Imobiliarios S.A.
0.01 % 0.01 % 0 TC46 / 1800.00 %1000.00 %NEPI Rockcastle
0.02 % 0.02 % 11 PRE156 / 1800.01 %1880.01 %New World Development Co. Ltd.
0.01 % 0.01 % 4 TC124 / 1800.01 %1170.00 %Nomura Real Estate Holdings
0.00 % 0.00 % 1 CDP109 / 1800.00 %1090.00 %NTT Urban Development
0.01 % 0.01 % 4 TC151 / 1800.00 %1550.00 %Park Hotels & Resorts Inc
0.00 % 0.00 % 0 ENV*116 / 1800.00 %1110.00 %Parque Arauco SA
0.00 % 0.00 % 4 TC130 / 1800.01 %1190.00 %Poly Property Group Co. Ltd.
0.08 % 0.08 % 1 CDP1 / 1800.01 %150.00 %ProLogis Inc
0.01 % 0.01 % 0 CDP8 / 1800.00 %460.00 %PSP Swiss Property AG
0.07 % 0.07 % 7 TC164 / 1800.00 %2380.00 %Public Storage
www.trucost.com Copyright © 2018 S&P Trucost Limited, an affiliate of S&P Dow Jones Indices LLC-83-
Page 127

5133
Company BreakdownPortfolio
Company details
Weighting
Portfolio Benchmark
Carbon Apportioned
Tonnes CO2e
% ofPortfolio's
Total CarbonApportioned
CarbonIntensity
(tCO2e/£mn)
CarbonFootprint
Contribution(%)*
FootprintRank in
BenchmarkSector **
DataSource
***
0.04 % 0.04 % 2 TC71 / 1800.00 %1000.00 %Realty Income Corp
0.00 % 0.00 % 0 TC21 / 1800.00 %750.00 %RED STAR MACALLINE GROUP
0.01 % 0.01 % 1 CDP152 / 1800.00 %1600.00 %Redefine Properties Ltd
0.02 % 0.02 % 1 PRE27 / 1800.00 %850.00 %Regency Centers Corp
0.01 % 0.01 % 3 TC163 / 1800.00 %2240.00 %Relo Holdings Inc
0.00 % 0.00 % 0 TC17 / 1800.00 %610.00 %Renhe Commercial Holdings Co. Ltd.
0.01 % 0.01 % 0 TC107 / 1800.00 %1080.00 %Resilient REIT Limited
0.01 % 0.01 % 1 TC72 / 1800.00 %1000.00 %RioCan REIT
0.04 % 0.04 % 6 CDP162 / 1800.00 %2210.00 %Scentre Group
0.02 % 0.02 % 0 CDP22 / 1800.00 %790.00 %SEGRO Plc
0.00 % 0.00 % 0 TC82 / 1800.00 %1000.00 %Shanghai Jinqiao Export Processing Zone
0.00 % 0.00 % 0 TC28 / 1800.00 %870.00 %Shanghai Lujiazui Finance & Trade Zone
0.00 % 0.00 % 2 TC139 / 1800.00 %1260.00 %Shenzhen Investment Ltd.
0.01 % 0.01 % 5 TC99 / 1800.01 %1070.00 %Shimao Property Holdings Ltd.
0.00 % 0.00 % 0 TC105 / 1800.00 %1080.00 %Shopping Centres Australasia Property
0.00 % 0.00 % 2 AR*121 / 1800.00 %1140.00 %Shui On Land Ltd.
0.12 % 0.11 % 6 CDP31 / 1800.02 %910.00 %Simon Property Group
0.01 % 0.01 % 2 TC159 / 1800.00 %2060.00 %Sino Land Co. Ltd.
0.00 % 0.00 % 3 TC57 / 1800.01 %1000.00 %Sino-Ocean Group Holdings Ltd.
0.02 % 0.02 % 4 PRE149 / 1800.01 %1470.00 %SL Green Realty Corp
0.01 % 0.01 % 3 CDP175 / 1800.00 %3950.00 %SM Prime Holdings Inc
0.00 % 0.00 % 0 TC114 / 1800.00 %1110.00 %SOHO China Ltd.
0.02 % 0.02 % 3 CDP120 / 1800.00 %1130.00 %Stockland
0.03 % 0.03 % 10 TC137 / 1800.02 %1230.01 %Sumitomo Realty & Dev Co
0.05 % 0.05 % 8 TC85 / 1800.02 %1010.00 %Sun Hung Kai Properties Ltd.
0.02 % 0.02 % 3 TC59 / 1800.01 %1000.00 %Sunac China Holdings Ltd
0.01 % 0.01 % 0 TC60 / 1800.00 %1000.00 %Suntec Real Estate Investment Trust
0.01 % 0.01 % 106 CDP180 / 180-0.05 %2,0660.07 %Swire Pacific Ltd.
0.01 % 0.01 % 1 ENV*146 / 1800.00 %1420.00 %Swire Properties Ltd
0.01 % 0.01 % 1 ENV11 / 1800.00 %520.00 %Swiss Prime Site AG
0.00 % 0.00 % 0 TC95 / 1800.00 %1060.00 %Talaat Moustafa Group Holding
0.01 % 0.01 % 3 TC66 / 1800.01 %1000.00 %Tokyo Tatemono Co
0.01 % 0.01 % 8 TC127 / 1800.01 %1170.01 %Tokyu Fudosan Holdings Corp
0.02 % 0.02 % 1 TC53 / 1800.00 %1000.00 %UDR Inc
0.00 % 0.00 % 0 TC112 / 1800.00 %1100.00 %UEM Sunrise Bhd
0.05 % 0.06 % 1 AR*9 / 1800.01 %520.00 %Unibail - Rodamco
www.trucost.com Copyright © 2018 S&P Trucost Limited, an affiliate of S&P Dow Jones Indices LLC-84-
Page 128

5133
Company BreakdownPortfolio
Company details
Weighting
Portfolio Benchmark
Carbon Apportioned
Tonnes CO2e
% ofPortfolio's
Total CarbonApportioned
CarbonIntensity
(tCO2e/£mn)
CarbonFootprint
Contribution(%)*
FootprintRank in
BenchmarkSector **
DataSource
***
0.00 % 0.00 % 0 TC90 / 1800.00 %1030.00 %United Development
0.01 % 0.01 % 1 ENV*100 / 1800.00 %1080.00 %UOL Group Limited
0.05 % 0.05 % 10 CDP158 / 1800.01 %1990.01 %Ventas Inc
0.02 % 0.02 % 2 TC34 / 1800.00 %920.00 %VEREIT Inc
0.02 % 0.02 % 3 CDP169 / 1800.00 %2980.00 %Vicinity Centres
0.05 % 0.05 % 1 CDP3 / 1800.01 %230.00 %Vonovia SE
0.03 % 0.03 % 6 ENV*155 / 1800.01 %1840.00 %Vornado Realty Trust
0.01 % 0.01 % 1 TC55 / 1800.00 %1000.00 %Weingarten Realty Investors
0.06 % 0.06 % 4 CDP16 / 1800.01 %610.00 %Welltower Inc
0.03 % 0.03 % 1 CDP113 / 1800.00 %1100.00 %Westfield Corporation
0.06 % 0.06 % 32 CDP174 / 1800.00 %3590.02 %Weyerhaeuser Co
0.03 % 0.02 % 4 PRE104 / 1800.01 %1080.00 %Wharf (Holdings) Ltd.
0.01 % 0.01 % 5 TC111 / 1800.01 %1100.00 %Wheelock and Co. Ltd.
0.00 % 0.00 % 0 TC97 / 1800.00 %1070.00 %Wing Tai Hldgs Ltd
0.00 % 0.00 % 2 TC54 / 1800.00 %1000.00 %Yanlord Land Group
0.00 % 0.00 % 3 TC102 / 1800.01 %1080.00 %Yuexiu Property Co. Ltd.
3.10 %1,000 0.65 %3.17 %3.15 % 78Telecommunication Services
0.00 % 0.00 % 0 TC12 / 940.00 %320.00 %Alibaba Health Information Technology Ltd
0.06 % 0.06 % 68 PRE90 / 940.05 %2080.04 %America Movil SAB de CV
0.56 % 0.55 % 182 CDP61 / 940.55 %780.12 %AT&T Inc
0.01 % 0.01 % 9 CDP92 / 940.00 %2460.01 %Axiata Group Bhd
0.03 % 0.03 % 3 CDP32 / 940.02 %330.00 %BCE Inc
0.01 % 0.01 % 3 PRE72 / 940.01 %1110.00 %BEZEQ ISRAELI TELECOM CORP
0.02 % 0.02 % 2 TC38 / 940.02 %370.00 %Bharti Airtel Ltd
0.01 % 0.01 % 0 TC40 / 940.00 %370.00 %Bharti Infratel Ltd.
0.07 % 0.07 % 21 CDP57 / 940.07 %720.01 %BT Group
0.01 % 0.01 % 1 CDP75 / 940.00 %1300.00 %Cellnex Telecom S.A.
0.02 % 0.02 % 39 CDP86 / 940.04 %1630.03 %CenturyLink Inc
0.00 % 0.00 % 2 TC24 / 940.02 %320.00 %China Communications Services Corporation
0.12 % 0.12 % 70 CDP89 / 940.06 %1850.05 %China Mobile Ltd.
0.02 % 0.02 % 4 TC22 / 940.03 %320.00 %China Telecom Corporation Ltd. - H Shares
0.02 % 0.02 % 4 TC21 / 940.03 %320.00 %China Unicom (Hong Kong) Ltd.
0.03 % 0.03 % 8 PRE85 / 940.01 %1580.01 %Chunghwa Telecom Co Ltd
0.14 % 0.14 % 54 CDP56 / 940.18 %710.04 %Deutsche Telekom
0.01 % 0.01 % 1 ENV74 / 940.00 %1220.00 %Digi.com Bhd
www.trucost.com Copyright © 2018 S&P Trucost Limited, an affiliate of S&P Dow Jones Indices LLC-85-
Page 129

5133
Company BreakdownPortfolio
Company details
Weighting
Portfolio Benchmark
Carbon Apportioned
Tonnes CO2e
% ofPortfolio's
Total CarbonApportioned
CarbonIntensity
(tCO2e/£mn)
CarbonFootprint
Contribution(%)*
FootprintRank in
BenchmarkSector **
DataSource
***
0.01 % 0.01 % 1 CDP55 / 940.01 %670.00 %Elisa Corporation
0.02 % 0.02 % 1 TC19 / 940.01 %320.00 %Emirates Telecommunications Group
0.00 % 0.00 % 1 TC29 / 940.00 %320.00 %Empresa Nacional de Telecomunicaciones
0.01 % 0.01 % 3 PRE78 / 940.00 %1330.00 %Far Eastone Telecommunications Co
0.00 % 0.00 % 1 TC13 / 940.01 %320.00 %Global Telecom Holding
0.00 % 0.00 % 1 PRE77 / 940.00 %1320.00 %Globe Telecom Inc
0.01 % 0.01 % 3 CDP69 / 940.01 %1030.00 %Hellenic Telecommunications Organization
0.00 % 0.00 % 0 TC16 / 940.00 %320.00 %Hutchison Telecommunications Hong Kong
0.00 % 0.00 % 1 TC42 / 940.01 %370.00 %Idea Cellular Ltd
0.01 % 0.01 % 1 PRE3 / 940.01 %160.00 %ILIAD SA
0.01 % 0.01 % 0 CDP*5 / 940.01 %240.00 %Inmarsat
0.01 % 0.01 % 0 TC31 / 940.00 %320.00 %Intouch Holdings PCL
0.11 % 0.11 % 31 CDP65 / 940.07 %960.02 %KDDI Corp
0.02 % 0.02 % 1 CDP2 / 940.02 %160.00 %Koninklijke KPN NV
0.04 % 0.04 % 11 CDP71 / 940.02 %1100.01 %Level 3 Communications
0.01 % 0.01 % 9 CDP81 / 940.01 %1400.01 %LG Uplus Ltd
0.00 % 0.00 % 0 AR*8 / 940.00 %270.00 %M1 Ltd
0.00 % 0.00 % 0 ENV37 / 940.00 %350.00 %Magyar Telekom
0.01 % 0.01 % 0 TC27 / 940.00 %320.00 %Maxis Bhd
0.00 % 0.00 % 0 PRE7 / 940.00 %270.00 %MegaFon PJSC
0.01 % 0.01 % 1 PRE10 / 940.01 %310.00 %Mobile TeleSystems PJSC
0.04 % 0.04 % 19 CDP83 / 940.03 %1430.01 %MTN Group Ltd
0.07 % 0.07 % 36 CDP64 / 940.08 %950.02 %Nippon Tel & Tel Corp
0.07 % 0.07 % 5 CDP33 / 940.04 %340.00 %NTT DOCOMO
0.00 % 0.00 % 0 TC15 / 940.00 %320.00 %O2 Czech Republic
0.00 % 0.00 % 1 TC18 / 940.01 %320.00 %Ooredoo
0.07 % 0.07 % 23 CDP47 / 940.12 %500.01 %Orange
0.00 % 0.00 % 4 AR*91 / 940.00 %2130.00 %Orange Polska S.A.
0.01 % 0.01 % 1 TC11 / 940.01 %310.00 %PCCW Ltd.
0.01 % 0.01 % 3 AR*82 / 940.00 %1410.00 %PLDT Inc
0.01 % 0.01 % 1 CDP36 / 940.01 %350.00 %Proximus
0.04 % 0.04 % 3 CDP9 / 940.03 %290.00 %Rogers Communications Inc
0.00 % 0.00 % 7 CDP93 / 940.00 %3480.00 %Rostelecom PJSC
0.04 % 0.04 % 1 TC25 / 940.01 %320.00 %SBA Communications Corp
0.05 % 0.05 % 5 CDP62 / 940.02 %790.00 %Singapore Telecommunications Ltd
0.00 % 0.00 % 5 TC68 / 940.01 %1000.00 %Sistema FC PJSC
www.trucost.com Copyright © 2018 S&P Trucost Limited, an affiliate of S&P Dow Jones Indices LLC-86-
Page 130

5133
Company BreakdownPortfolio
Company details
Weighting
Portfolio Benchmark
Carbon Apportioned
Tonnes CO2e
% ofPortfolio's
Total CarbonApportioned
CarbonIntensity
(tCO2e/£mn)
CarbonFootprint
Contribution(%)*
FootprintRank in
BenchmarkSector **
DataSource
***
0.01 % 0.01 % 5 CDP63 / 940.01 %810.00 %SK Telecom Co Ltd
0.16 % 0.16 % 30 TC44 / 940.19 %420.02 %SoftBank Group Corp
0.01 % 0.01 % 1 CDP6 / 940.01 %240.00 %Spark New Zealand Ltd
0.01 % 0.01 % 4 CDP51 / 940.02 %620.00 %Sprint Nextel Corp
0.00 % 0.00 % 0 AR*46 / 940.00 %500.00 %Starhub
0.03 % 0.03 % 1 CDP1 / 940.02 %140.00 %Swisscom AG ADR
0.04 % 0.04 % 6 TC23 / 940.05 %320.00 %T-Mobile US Inc
0.01 % 0.01 % 2 CDP67 / 940.01 %990.00 %Taiwan Mobile Co Ltd
0.00 % 0.00 % 1 PRE79 / 940.00 %1370.00 %Tata Communications Ltd
0.01 % 0.01 % 2 CDP43 / 940.01 %380.00 %TDC A/S
0.01 % 0.01 % 2 PRE58 / 940.01 %730.00 %Tele2 AB
0.03 % 0.03 % 16 ENV*52 / 940.06 %650.01 %Telecom Italia SpA
0.01 % 0.02 % 8 PRE84 / 940.01 %1520.01 %Telefonica Brasil S.A.
0.01 % 0.01 % 2 ENV*60 / 940.01 %760.00 %Telefonica Deutschland Holding AG
0.11 % 0.11 % 39 CDP49 / 940.17 %570.03 %Telefonica SA
0.00 % 0.00 % 1 CDP53 / 940.00 %650.00 %Telekom Austria AG
0.00 % 0.00 % 1 ENV*45 / 940.00 %420.00 %Telekom Malaysia Bhd
0.04 % 0.04 % 2 TC20 / 940.02 %320.00 %Telekomunikasi Indonesia Tbk PT
0.03 % 0.03 % 12 CDP73 / 940.02 %1180.01 %Telenor ASA
0.00 % 0.00 % 0 TC30 / 940.00 %320.00 %Telesites S.A.B. de C.V.
0.03 % 0.03 % 5 CDP50 / 940.02 %590.00 %Telia Company AB
0.00 % 0.00 % 8 CDP94 / 940.00 %4220.01 %Telkom South Africa Ltd
0.03 % 0.03 % 9 CDP70 / 940.02 %1090.01 %Telstra Corp Ltd
0.02 % 0.02 % 3 CDP48 / 940.01 %550.00 %TELUS Corp
0.01 % 0.01 % 1 CDP4 / 940.01 %220.00 %Tim Participacoes
0.00 % 0.00 % 0 TC17 / 940.00 %320.00 %Total Access Communication PCL
0.00 % 0.00 % 0 TC14 / 940.00 %320.00 %Tower Bersama Infrastructure Tbk PT
0.00 % 0.00 % 0 TC34 / 940.00 %340.00 %TPG Telecom Ltd
0.00 % 0.00 % 3 CDP87 / 940.00 %1710.00 %True Corp PCL
0.00 % 0.00 % 2 CDP88 / 940.00 %1760.00 %Turk Telekomunikasyon AS
0.01 % 0.01 % 3 CDP66 / 940.01 %980.00 %Turkcell Iletisim Hizmet AS
0.47 % 0.46 % 119 CDP54 / 940.44 %660.08 %Verizon Communications Inc
0.00 % 0.00 % 0 TC35 / 940.00 %340.00 %Vocus Group Limited
0.02 % 0.02 % 3 CDP80 / 940.00 %1400.00 %Vodacom Group Ltd
0.17 % 0.17 % 53 CDP59 / 940.17 %740.03 %Vodafone Group
0.00 % 0.00 % 0 TC39 / 940.00 %370.00 %Vodafone Qatar
www.trucost.com Copyright © 2018 S&P Trucost Limited, an affiliate of S&P Dow Jones Indices LLC-87-
Page 131

5133
Company BreakdownPortfolio
Company details
Weighting
Portfolio Benchmark
Carbon Apportioned
Tonnes CO2e
% ofPortfolio's
Total CarbonApportioned
CarbonIntensity
(tCO2e/£mn)
CarbonFootprint
Contribution(%)*
FootprintRank in
BenchmarkSector **
DataSource
***
0.00 % 0.00 % 0 TC26 / 940.00 %320.00 %XL Axiata Tbk PT
-27.63 %47,393 30.80 %3.12 %3.12 % 3,085Utilities
0.01 % 0.01 % 74 CDP72 / 158-0.04 %1,8970.05 %A2A SpA
0.00 % 0.00 % 37 AR*127 / 158-0.02 %6,5050.02 %Aboitiz Power Corp
0.01 % 0.00 % 14 CDP26 / 1580.00 %3050.01 %Acciona SA
0.02 % 0.02 % 1,312 CDP*129 / 158-0.80 %6,6450.85 %AES Corp
0.00 % 0.00 % 121 AR*141 / 158-0.08 %11,6690.08 %AES Gener S.A.
0.00 % 0.00 % 0 CDP2 / 1580.00 %230.00 %AES Tiete Energia S.A.
0.03 % 0.03 % 803 CDP132 / 158-0.49 %7,5170.52 %AGL Energy Ltd
0.00 % 0.00 % 1 ENV*12 / 1580.00 %1990.00 %Aguas Andinas S.A.
0.02 % 0.02 % 400 ENV*136 / 158-0.25 %8,6110.26 %Alliant Energy Corp
0.03 % 0.03 % 521 CDP119 / 158-0.31 %5,9080.34 %Ameren Corp
0.08 % 0.08 % 2,053 CDP137 / 158-1.27 %8,7861.33 %American Electric Power
0.03 % 0.03 % 12 CDP19 / 1580.01 %2490.01 %American Water Works Co Inc
0.02 % 0.02 % 13 CDP45 / 158-0.00 %6220.01 %APA Group
0.01 % 0.01 % 17 PRE76 / 158-0.01 %1,9880.01 %AusNet Services Ltd
0.01 % 0.01 % 5 CDP28 / 1580.00 %3150.00 %Avangrid Inc
0.01 % 0.01 % 2 TC9 / 1580.00 %1300.00 %Beijing Enterprises Water Group Ltd.
0.00 % 0.00 % 53 AR*114 / 158-0.03 %5,6800.03 %Beijing Jingneng Clean Energy Co Ltd
0.01 % 0.01 % 740 AR*133 / 158-0.45 %7,6080.48 %Calpine Corporation
0.01 % 0.01 % 89 ENV*110 / 158-0.05 %5,2400.06 %Canadian Utilities Ltd A Nvtg
0.03 % 0.03 % 70 PRE49 / 158-0.02 %6580.05 %Centerpoint Energy Inc
0.03 % 0.03 % 172 CDP30 / 1580.03 %3400.11 %Centrica
0.01 % 0.01 % 167 AR107 / 158-0.10 %4,8970.11 %CEZ-Ceske Energeticke Zavody
0.01 % 0.01 % 1 TC6 / 1580.00 %670.00 %CGN Power Ltd- H share
0.01 % 0.01 % 9 TC46 / 158-0.00 %6320.01 %China Gas Holdings Ltd.
0.01 % 0.01 % 81 AR*95 / 158-0.05 %3,9190.05 %China Longyuan Power Group Corporation
0.00 % 0.00 % 347 PRE147 / 158-0.22 %20,2320.23 %China Power International Development Ltd.
0.01 % 0.01 % 9 TC35 / 1580.00 %4190.01 %China Resources Gas Group Ltd.
0.01 % 0.01 % 994 PRE149 / 158-0.63 %21,1890.65 %China Resources Power Holdings Co. Ltd.
0.02 % 0.02 % 1,075 AR*97 / 158-0.62 %4,0310.70 %Chubu Electric Power Co
0.01 % 0.01 % 495 AR*108 / 158-0.29 %5,0760.32 %Chugoku Electric Power Co Inc
0.00 % 0.01 % 8 CDP10 / 1580.01 %1650.00 %Cia Energetica de Minas Gerais
0.00 % 0.00 % 3 TC40 / 158-0.00 %5430.00 %Cia Gas de Sao Paulo - COMGAS
0.01 % 0.01 % 10 PRE38 / 158-0.00 %4900.01 %Cia Saneamento Basico De Sp
www.trucost.com Copyright © 2018 S&P Trucost Limited, an affiliate of S&P Dow Jones Indices LLC-88-
Page 132

5133
Company BreakdownPortfolio
Company details
Weighting
Portfolio Benchmark
Carbon Apportioned
Tonnes CO2e
% ofPortfolio's
Total CarbonApportioned
CarbonIntensity
(tCO2e/£mn)
CarbonFootprint
Contribution(%)*
FootprintRank in
BenchmarkSector **
DataSource
***
0.00 % 0.00 % 0 PRE3 / 1580.00 %270.00 %Cia Transmissao Energia Electrica Paulista
0.01 % 0.01 % 18 TC69 / 158-0.01 %1,5370.01 %CK Infrastructure Holdings Ltd
0.04 % 0.04 % 573 CDP121 / 158-0.35 %6,0550.37 %CLP Holdings Ltd.
0.03 % 0.03 % 254 CDP83 / 158-0.14 %2,8380.17 %CMS Energy Corp
0.00 % 0.00 % 37 CDP102 / 158-0.02 %4,4760.02 %COLBUN SA
0.00 % 0.00 % 5 CDP17 / 1580.00 %2290.00 %Companhia Paranaense de Energia
0.06 % 0.06 % 116 ENV50 / 158-0.03 %6860.08 %Consolidated Edison Inc
0.01 % 0.01 % 22 AR*65 / 158-0.01 %1,1570.01 %Contact Energy Ltd
0.01 % 0.01 % 5 CDP11 / 1580.00 %1950.00 %CPFL Energia SA
0.00 % 0.00 % 312 AR*148 / 158-0.20 %21,0760.20 %Datang International Power Generation Co
0.11 % 0.11 % 612 PRE89 / 158-0.35 %3,6670.40 %Dominion Energy Inc
0.04 % 0.04 % 661 CDP101 / 158-0.39 %4,3800.43 %DTE Energy Co
0.14 % 0.13 % 1,842 CDP113 / 158-1.11 %5,6741.20 %Duke Energy Corp
0.00 % 0.00 % 148 ENV*155 / 158-0.10 %38,5210.10 %E.ON Russia OJSC
0.05 % 0.05 % 214 CDP32 / 1580.02 %3830.14 %E.ON SE
0.06 % 0.06 % 47 PRE25 / 1580.02 %2870.03 %Edison Intl
0.00 % 0.00 % 54 CDP82 / 158-0.03 %2,6560.03 %EDP - Energias do Brasil SA
0.01 % 0.01 % 993 ENV143 / 158-0.63 %14,0600.65 %Electric Power Development Co
0.01 % 0.01 % 161 CDP60 / 158-0.06 %9760.10 %Electricite de France
0.00 % 0.00 % 216 AR*157 / 158-0.14 %44,4330.14 %Electricity Generating PCL
0.01 % 0.01 % 89 CDP*57 / 158-0.03 %8800.06 %Eletrobras SA
0.01 % 0.01 % 11 OTH42 / 158-0.00 %5900.01 %Enagas SA
0.02 % 0.02 % 184 CDP77 / 158-0.10 %2,1820.12 %Endesa SA
0.00 % 0.00 % 126 AR*115 / 158-0.08 %5,7030.08 %Enea S.A.
0.01 % 0.01 % 88 AR*71 / 158-0.04 %1,8350.06 %Enel Americas S.A.
0.00 % 0.01 % 36 AR*74 / 158-0.02 %1,9710.02 %Enel Chile S.A.
0.01 % 0.01 % 38 ENV*85 / 158-0.02 %2,9670.02 %Enel Generacion Chile S.A.
0.11 % 0.11 % 1,569 CDP73 / 158-0.79 %1,9141.02 %Enel SpA
0.02 % 0.02 % 255 CDP70 / 158-0.12 %1,6050.17 %Energias de Portugal SA
0.06 % 0.06 % 1,611 CDP79 / 158-0.85 %2,2691.05 %Engie
0.01 % 0.00 % 33 ENV*96 / 158-0.02 %4,0310.02 %ENGIE Brasil Energia S.A.
0.01 % 0.01 % 21 TC34 / 1580.00 %4100.01 %ENN Energy Holdings Ltd
0.03 % 0.03 % 647 ENV*99 / 158-0.38 %4,2300.42 %Entergy Corp
0.01 % 0.01 % 20 TC52 / 158-0.01 %7080.01 %Equatorial Energia S.A.
0.04 % 0.04 % 70 CDP48 / 158-0.01 %6460.05 %Eversource Energy
0.08 % 0.08 % 320 CDP53 / 158-0.08 %7170.21 %Exelon Corp
www.trucost.com Copyright © 2018 S&P Trucost Limited, an affiliate of S&P Dow Jones Indices LLC-89-
Page 133

5133
Company BreakdownPortfolio
Company details
Weighting
Portfolio Benchmark
Carbon Apportioned
Tonnes CO2e
% ofPortfolio's
Total CarbonApportioned
CarbonIntensity
(tCO2e/£mn)
CarbonFootprint
Contribution(%)*
FootprintRank in
BenchmarkSector **
DataSource
***
0.00 % 0.00 % 3 TC13 / 1580.00 %2180.00 %Federal Grid Co Unified Energy System
0.00 % 0.00 % 137 CDP134 / 158-0.08 %7,7310.09 %Federal Hydrogenerating Co (RusHydro)
0.03 % 0.03 % 1,285 CDP122 / 158-0.78 %6,2500.84 %FirstEnergy Corp
0.03 % 0.03 % 342 TC104 / 158-0.20 %4,6500.22 %Fortis Inc
0.02 % 0.02 % 176 CDP125 / 158-0.11 %6,3880.11 %Fortum Oyj
0.01 % 0.01 % 15 CDP44 / 158-0.00 %6020.01 %Gail India Ltd
0.02 % 0.02 % 134 CDP66 / 158-0.06 %1,2140.09 %Gas Natural SDG SA
0.00 % 0.00 % 57 AR*138 / 158-0.04 %9,8470.04 %Glow Energy
0.01 % 0.01 % 33 AR*98 / 158-0.02 %4,0380.02 %Guangdong Investment Ltd.
0.00 % 0.00 % 342 AR*111 / 158-0.20 %5,3740.22 %Hokkaido Electric Power Co
0.00 % 0.00 % 292 AR126 / 158-0.18 %6,4090.19 %Hokuriku Electric Power Co
0.04 % 0.04 % 20 ENV*47 / 158-0.00 %6400.01 %Hong Kong and China Gas Co Ltd
0.00 % 0.00 % 78 AR*131 / 158-0.05 %7,4070.05 %Huadian Fuxin Energy Corp Ltd.
0.00 % 0.00 % 330 ENV*151 / 158-0.21 %23,8240.21 %Huadian Power International Corp Ltd
0.01 % 0.01 % 910 ENV*145 / 158-0.58 %19,0670.59 %Huaneng Power International Inc
0.00 % 0.00 % 0 TC4 / 1580.00 %280.00 %Huaneng Renewables Corp Ltd.
0.01 % 0.01 % 9 TC23 / 1580.00 %2760.01 %Hydro One Limited
0.10 % 0.10 % 456 CDP64 / 158-0.18 %1,1330.30 %Iberdrola SA
0.01 % 0.01 % 11 ENV*81 / 158-0.01 %2,6550.01 %Infraestructura Energetica Nova S.A.B. de C.
0.01 % 0.01 % 49 AR*29 / 1580.01 %3160.03 %Innogy SE
0.00 % 0.00 % 455 AR*135 / 158-0.28 %8,4870.30 %Inter RAO OJSC
0.00 % 0.00 % 4 TC15 / 1580.00 %2220.00 %Interconexion Electrica SA ESP
0.00 % 0.00 % 93 AR*146 / 158-0.06 %19,5520.06 %JSW Energy Ltd
0.02 % 0.02 % 636 CDP80 / 158-0.34 %2,4510.41 %Kansai Electric Power Co Inc
0.02 % 0.02 % 1,722 PRE120 / 158-1.04 %5,9211.12 %Korea Elec Power Corp
0.00 % 0.00 % 23 PRE27 / 1580.01 %3100.02 %Korea Gas Corp
0.01 % 0.01 % 812 AR100 / 158-0.47 %4,3520.53 %Kyushu Electric Power Co Inc
0.00 % 0.00 % 4 TC14 / 1580.00 %2220.00 %Manila Electric Co
0.01 % 0.01 % 55 AR*59 / 158-0.02 %9480.04 %MDU Resources Group Inc
0.00 % 0.00 % 4 AR*41 / 158-0.00 %5840.00 %Mercury NZ Limited
0.01 % 0.01 % 1 TC8 / 1580.00 %950.00 %Meridian Energy Ltd
0.10 % 0.10 % 224 CDP56 / 158-0.07 %8070.15 %National Grid PLC
0.16 % 0.16 % 769 ENV*87 / 158-0.43 %3,3420.50 %NextEra Energy Inc
0.00 % 0.00 % 0 TC5 / 1580.00 %320.00 %NHPC Ltd
0.02 % 0.02 % 241 OTH90 / 158-0.14 %3,7770.16 %Nisource Inc
0.02 % 0.02 % 1,220 CDP130 / 158-0.75 %7,2150.79 %NRG Energy
www.trucost.com Copyright © 2018 S&P Trucost Limited, an affiliate of S&P Dow Jones Indices LLC-90-
Page 134

5133
Company BreakdownPortfolio
Company details
Weighting
Portfolio Benchmark
Carbon Apportioned
Tonnes CO2e
% ofPortfolio's
Total CarbonApportioned
CarbonIntensity
(tCO2e/£mn)
CarbonFootprint
Contribution(%)*
FootprintRank in
BenchmarkSector **
DataSource
***
0.01 % 0.01 % 1,064 ENV*154 / 158-0.68 %29,6260.69 %NTPC Ltd
0.02 % 0.02 % 39 CDP58 / 158-0.01 %9040.03 %Orsted
0.02 % 0.02 % 102 CDP54 / 158-0.03 %8040.07 %Osaka Gas Co
0.01 % 0.01 % 27 CDP63 / 158-0.01 %1,0980.02 %Pennon Group
0.00 % 0.00 % 5 ENV*22 / 1580.00 %2630.00 %Perusahaan Gas Negara PT
0.01 % 0.01 % 30 AR*105 / 158-0.02 %4,8380.02 %Petronas Gas BHD
0.08 % 0.08 % 112 CDP36 / 158-0.00 %4450.07 %PG&E Corporation
0.02 % 0.02 % 193 OTH91 / 158-0.11 %3,8590.13 %Pinnacle West Capital (AZ)
0.01 % 0.01 % 413 AR139 / 158-0.26 %9,8910.27 %Polska Grupa Energetyczna SA
0.03 % 0.03 % 93 AR*158 / 158-0.06 %63,7580.06 %Power Assets Holdings Ltd
0.01 % 0.01 % 2 TC20 / 1580.00 %2550.00 %Power Grid Corp of India Ltd
0.06 % 0.06 % 602 PRE112 / 158-0.36 %5,6520.39 %PPL Corp
0.05 % 0.05 % 284 CDP78 / 158-0.15 %2,1990.18 %Public Service Enterprise Grp
0.00 % 0.00 % 11 TC88 / 158-0.01 %3,5870.01 %Qatar Electricity & Water
0.00 % 0.00 % 114 ENV*142 / 158-0.07 %13,0710.07 %Ratchaburi Electricity Generating Holding
0.02 % 0.02 % 11 CDP37 / 158-0.00 %4690.01 %Red Electrica Corporacion SA
0.00 % 0.00 % 52 AR*86 / 158-0.03 %3,2050.03 %Reliance Infrastructure Ltd
0.00 % 0.00 % 2 PRE7 / 1580.01 %760.00 %Rosseti PJSC
0.01 % 0.01 % 13 AR*33 / 1580.00 %3980.01 %Rubis
0.03 % 0.03 % 2,342 ENV*93 / 158-1.35 %3,8841.52 %RWE AG
0.01 % 0.01 % 284 PRE109 / 158-0.17 %5,2140.18 %SCANA Corp
0.04 % 0.04 % 363 CDP51 / 158-0.09 %6950.24 %Scottish & Southern Energy
0.07 % 0.07 % 105 CDP55 / 158-0.03 %8050.07 %Sempra Energy
0.02 % 0.02 % 9 CDP*24 / 1580.00 %2770.01 %Severn Trent
0.00 % 0.00 % 217 AR106 / 158-0.13 %4,8790.14 %Shikoku Electric Power Co Inc
0.11 % 0.11 % 1,863 ENV*128 / 158-1.13 %6,5931.21 %Southern Co
0.02 % 0.02 % 156 CDP62 / 158-0.06 %1,0900.10 %Suez SA
0.00 % 0.00 % 282 CDP140 / 158-0.18 %10,6450.18 %Tata Power Co Ltd
0.00 % 0.00 % 147 ENV103 / 158-0.09 %4,5740.10 %Tauron Polska Energia SA
0.03 % 0.03 % 400 ENV*94 / 158-0.23 %3,9110.26 %Tenaga Nasional Bhd
0.02 % 0.02 % 23 CDP61 / 158-0.01 %1,0480.01 %Terna SpA
0.01 % 0.01 % 15 PRE31 / 1580.00 %3470.01 %Toho Gas Co
0.01 % 0.01 % 768 OTH92 / 158-0.44 %3,8740.50 %Tohoku Electric Power Co
0.01 % 0.01 % 1,737 CDP84 / 158-0.96 %2,8491.13 %Tokyo Electric Power Co. Holding Inc.
0.02 % 0.02 % 105 ENV*43 / 158-0.02 %5940.07 %Tokyo Gas Co
0.00 % 0.00 % 1 ENV*21 / 1580.00 %2590.00 %Towngas China Co. Ltd.
www.trucost.com Copyright © 2018 S&P Trucost Limited, an affiliate of S&P Dow Jones Indices LLC-91-
Page 135

5133
Company BreakdownPortfolio
Company details
Weighting
Portfolio Benchmark
Carbon Apportioned
Tonnes CO2e
% ofPortfolio's
Total CarbonApportioned
CarbonIntensity
(tCO2e/£mn)
CarbonFootprint
Contribution(%)*
FootprintRank in
BenchmarkSector **
DataSource
***
0.00 % 0.00 % 0 TC16 / 1580.00 %2280.00 %Transmissora Alianca de Energia Eletrica
0.01 % 0.01 % 812 ENV68 / 158-0.37 %1,4290.53 %Uniper SE
0.02 % 0.02 % 8 CDP*18 / 1580.00 %2430.00 %United Utilities Group Plc
0.03 % 0.03 % 661 CDP75 / 158-0.33 %1,9840.43 %Veolia Environnement
0.05 % 0.05 % 667 CDP123 / 158-0.40 %6,2620.43 %WEC Energy Group Inc
0.06 % 0.06 % 1,008 ENV*124 / 158-0.61 %6,3680.65 %Xcel Energy Inc
0.00 % 0.00 % 131 TC118 / 158-0.08 %5,9000.08 %YTL Corp Bhd
0.00 % 0.00 % 66 TC117 / 158-0.04 %5,8920.04 %YTL Power International Bhd
153,85099.86 % 100.00 % 439Porfolio Total 100.00 %
** Footprint rank in benchmark sector - A ranking of one indicates that the stock has the lowest carbon footprint among the stocks in the benchmark sector.An entry of N/A indicates that the stock is not a member of the benchmark.
* The Carbon Footprint Contribution is the percentage decrease in performance between what the Carbon Footprint of the portfolio would be without theholding and what the Carbon Footprint is currently. This is a measurement of how much a specific holding reduces the carbon performance of the portfolio.
*** Definitions of the Data Sources may be found in section 5 of this report.
Note that the weighting for the benchmark will not always total 100% as the stocks shown are only for those held by theportfolio.
www.trucost.com Copyright © 2018 S&P Trucost Limited, an affiliate of S&P Dow Jones Indices LLC-92-
Page 136

5133
Make portfolio adjustments
Reduce risk by rebalancing holdings to favour companies withgreater carbon or environmental efficiency relative to sectorpeers.
Trucost provides standardised data on all companies across theinvestment universe to help identify carbon and environmentalopportunities. We also have time series data and can customiseresearch to meet your requirements.
The chart on page 8 shows companies with which you maychoose to engage with to encourage them to disclose betterenvironmental data, providing greater transparency for investorsand setting them on the course to appropriate measurement andmanagement of GHG emissions.
You may choose to communicate your footprint tostakeholders to demonstrate that you actively considercarbon exposure in your investments and providetransparency about the risk exposure or benefits of thefund.
Trucost's carbon and natural capital investmentmetrics drive investment indices and products fromleading institutions that deliver financial performancealongside reduced environmental risk. Find out moreat www.trucost.com/capital-markets/investment-products
Embed environmental analysis into your investmentstrategy
Engage with companies
Communicate your footprint to stakeholders
Invest in carbon optimised funds
"Trucost’s global environmental impact data has enabled us to truly integrate climate change analysis into ourinvestment process. The quantitative data is fed into our mainstream investment decision making processenabling risk management, portfolio footprinting, sector and stock level analysis and the simulation of climatechange strategies across asset classes."
AXA Investment Managers
WHY CHOOSE TRUCOST DATA?
Standardised: company disclosed data isstandardised to enable comparison betweencompanies, funds, sectors and geographies.
Validated: company disclosed data is validatedto resolve reporting errors.
Comprehensive: where companies do notmeasure or disclose data, Trucost 'fills the gaps'using its advanced environmental profilingmodel to provide complete data across theinvestment universe.
Proven: Trucost data has been used to analyseover $2.7trillion AUM and drives $583million ininvestment products that deliver financialperformance with up to 50% reduced carbonintensity e.g. S&P US Carbon Efficient Index andthe Legal and General Investment ManagementUK Carbon Optimised Index Fund.
Next Steps9
CONTACT
UK (HEAD OFFICE)T: +44 (0) 20 7160 9800E: [email protected]
AsiaE: [email protected]
EuropeE: [email protected]
North AmericaT: +1 800 402 8774E: [email protected]
South AmericaE: [email protected]
www.trucost.com
www.trucost.com Copyright © 2018 S&P Trucost Limited, an affiliate of S&P Dow Jones Indices LLC-93-
Page 137

Legal Disclaimer10
NOTICE
Copyright © 2018 S&P Trucost Limited (“Trucost”), an affiliate of S&P Dow Jones Indices LLC. All rights reserved. Trucostand EBoard are trademarks of Trucost. Redistribution or reproduction in whole or in part is prohibited without writtenpermission. This document does not constitute an offer of services in jurisdictions where Trucost and its affiliates do not havethe necessary licenses. All information provided by Trucost is impersonal and not tailored to the needs of any person, entityor group of persons.
DISCLAIMER
Copyright © 2018 S&P Trucost Limited (“Trucost”), an affiliate of S&P Dow Jones Indices LLC. All rights reserved. Trucostand EBoard are trademarks of Trucost.
This document does not constitute an offer of services in jurisdictions where Trucost and its affiliates do not have thenecessary licenses. Trucost is not an investment advisor, and Trucost makes no representation regarding the advisability ofinvesting in any investment fund or other investment vehicle. A decision to invest in any investment fund or other investmentvehicle should not be made in reliance on any of the statements set forth in this document. Prospective investors are advisedto make an investment in any fund or other vehicle only after carefully considering the risks associated with investing in suchfunds, as detailed in an offering memorandum or similar document that is prepared by or on behalf of the issuer of theinvestment fund or other investment product or vehicle.
The materials have been prepared solely for informational purposes only based upon information generally available to thepublic from sources believed to be reliable. No content contained in these materials (including credit-related analyses anddata, research, valuation, models, software or other application or output therefrom) or any part thereof (“Content”) may bemodified reverse-engineered, reproduced or distributed in any form or by any means, or stored in a database or retrievalsystem, without the prior written permission of Trucost. The Content shall not be used for any unlawful or unauthorizedpurposes. Trucost and its third-party data providers and licensors (collectively “Trucost Parties”) do not guarantee theaccuracy, completeness, timeliness or availability of the Content. Trucost Parties are not responsible for any errors oromissions, regardless of the cause, for the results obtained from the use of the Content. THE CONTENT IS PROVIDED ONAN “AS IS” BASIS. TRUCOST PARTIES DISCLAIM ANY AND ALL EXPRESS OR IMPLIED WARRANTIES, INCLUDING, BUTNOT LIMITED TO, ANY WARRANTIES OF MERCHANTABILITY OR FITNESS FOR A PARTICULAR PURPOSE OR USE,FREEDOM FROM BUGS, SOFTWARE ERRORS OR DEFECTS, THAT THE CONTENT’S FUNCTIONING WILL BEUNINTERRUPTED OR THAT THE CONTENT WILL OPERATE WITH ANY SOFTWARE OR HARDWARE CONFIGURATION. Inno event shall Trucost Parties be liable to any party for any direct, indirect, incidental, exemplary, compensatory, punitive,special or consequential damages, costs, expenses, legal fees, or losses (including, without limitation, lost income or lostprofits and opportunity costs) in connection with any use of the Content even if advised of the possibility of such damages.
The Content does not constitute or form part of any offer, invitation to sell, offer to subscribe for or to purchase any shares orother securities and must not be relied upon in connection with any contract relating to any such matter. ‘Trucost’ is thetrading name of S&P Trucost Limited a limited company registered in England company number 3929223 whose registeredoffice is at 20 Canada Square, London E14 5HL, UK.
CONFIDENTIALITY & COPYRIGHT
The information contained in this report is confidential and is submitted by Trucost on the understanding that it will be usedonly by your staff and consultants. Where consultants are [self] employed, the use of this information is restricted to use inrelation to your business. In particular, the contents of this report may not be disclosed in whole or in part to any other partywithout the prior written consent of Trucost.
www.trucost.com Copyright © 2018 S&P Trucost Limited, an affiliate of S&P Dow Jones Indices LLC
Page 138
Related Documents