This article appeared in a journal published by Elsevier. The attached copy is furnished to the author for internal non-commercial research and education use, including for instruction at the authors institution and sharing with colleagues. Other uses, including reproduction and distribution, or selling or licensing copies, or posting to personal, institutional or third party websites are prohibited. In most cases authors are permitted to post their version of the article (e.g. in Word or Tex form) to their personal website or institutional repository. Authors requiring further information regarding Elsevier’s archiving and manuscript policies are encouraged to visit: http://www.elsevier.com/copyright

Welcome message from author
This document is posted to help you gain knowledge. Please leave a comment to let me know what you think about it! Share it to your friends and learn new things together.
Transcript
This article appeared in a journal published by Elsevier. The attachedcopy is furnished to the author for internal non-commercial researchand education use, including for instruction at the authors institution
and sharing with colleagues.
Other uses, including reproduction and distribution, or selling orlicensing copies, or posting to personal, institutional or third party
websites are prohibited.
In most cases authors are permitted to post their version of thearticle (e.g. in Word or Tex form) to their personal website orinstitutional repository. Authors requiring further information
regarding Elsevier’s archiving and manuscript policies areencouraged to visit:
http://www.elsevier.com/copyright

Author's personal copy
Forest Ecology and Management 260 (2010) 229–237
Contents lists available at ScienceDirect
Forest Ecology and Management
journa l homepage: www.e lsev ier .com/ locate / foreco
Carbon accumulation along a stand development sequence of Nothofagusantarctica forests across a gradient in site quality in Southern Patagonia
Pablo L. Peri a,c,∗, Verónica Gargaglionea, Guillermo Martínez Pasturb,c, María Vanesa Lencinasb,c
a INTA EEA-Santa Cruz, UNPA, cc 332, 9400 Río Gallegos, Santa Cruz, Argentinab Centro Austral de Investigaciones Científicas (CADIC), cc 92, 9410 Ushuaia, Tierra del Fuego, Argentinac Consejo Nacional de Investigaciones Científicas y Técnicas (CONICET), Argentina
a r t i c l e i n f o
Article history:Received 16 December 2009Received in revised form 8 April 2010Accepted 24 April 2010
Keywords:Carbon storageModelsC root/shoot ratioCrown classesSite quality classes
a b s t r a c t
Above- and below-ground C pools were measured in pure even-aged stands of Nothofagus antarctica(Forster f.) Oersted at different ages (5–220 years), crown and site classes in the Patagonian region. Meantissue C concentration varied from 46.3% in medium sized roots of dominant trees to 56.1% in rottenwood for trees grown in low quality sites. Total C concentration was in the order of: heartwood > rottenwood > sapwood > bark > small branches > coarse roots > leaves > medium roots > fine roots. Sigmoid func-tions were fitted for total C accumulation and C root/shoot ratio of individual trees against age. Total Caccumulated by mature dominant trees was six times greater than suppressed trees in the same stands,and total C accumulated by mature dominant trees grown on the best site quality was doubled that ofthose on the lowest site quality. Crown classes and site quality also affected the moment of maximum Caccumulation, e.g. dominant trees growing on the worse site quality sequestered 0.73 kg C tree−1 year−1
at 139 years compared to the best site where 1.44 kg C tree−1 year−1 at 116 years was sequestered. Croot/shoot ratio decreased over time from a maximum value of 1.3–2.2 at 5 years to a steady-stateasymptote of 0.3–0.7 beyond 60 years of age depending on site quality. Thus, root C accumulation wasgreater during the regeneration phase and for trees growing on the poorest sites. The equations devel-oped for individual trees have been used to estimate stand C accumulation from forest inventory data.Total stand C content ranged from 128.0 to 350.9 Mg C ha−1, where the soil C pool represented 52–73%of total ecosystem C depending on age and site quality. Proposed equations can be used for practicalpurposes such as estimating the impact of silvicultural practices (e.g. thinning or silvopastoral systems)on forest C storage or evaluating the development of both above- and below-ground C over the forest lifecycle for different site qualities for accurate quantification of C pools at regional scale.
© 2010 Elsevier B.V. All rights reserved.
1. Introduction
Data on carbon (C) storage in forests and different tree com-ponents are essential for understanding the importance of rapidlyincreasing level of CO2 in the atmosphere and its potential effecton global climate change. In South America, mean annual tem-perature is predicted to increase by 3–4 ◦C in both summer andwinter between 30◦ and 55◦ SL (Manabe and Wetherald, 1987).Such an increase would have significant effects on Nothofagusforests. In this context, secondary indigenous forests are consid-ered efficient C sink ecosystems. Nothofagus antarctica (Forster f.)Oersted (nire), one of the main deciduous native species in thePatagonian region (Argentina), covers 7500 km2 over a wide lat-itudinal (from 36◦25′ to 54◦53′SL) and altitudinal (near sea level
∗ Corresponding author at: INTA EEA-Santa Cruz, UNPA, cc 332, 9400 Río Gallegos,Santa Cruz, Argentina. Tel.: +54 2966 442305; fax: +54 2966 442305.
E-mail address: [email protected] (P.L. Peri).
to 2000 m.a.s.l.) distribution. These forests occur naturally in dif-ferent habitats such as poorly drained sites at low elevations,exposed windy areas with shallow soils, depressions under coldair influence, or in drier eastern sites near the Patagonian steppe(Veblen et al., 1996). These forests provide a range of wood prod-ucts including poles, firewood and timber for rural constructionpurposes.
Several studies have shown the importance of factors such asforest type, climate, soil properties, site quality, or stand produc-tivity on C storage of forest ecosystems (Dixon et al., 1994; Bert andDanjon, 2006). Site quality for N. antarctica ranges from tall treesup to 15 m in dominant height on the best sites to shrubby trees of2 m tall on rocky, xeric and exposed sites, and also in poorly drainedsites (peat bog) (Veblen et al., 1996). Previous research has high-lighted the importance of stand age on the magnitude of C poolsin both forest biomass and forest floor pools (Grigal and Ohmann,1992; Silvester and Orchard, 1999; Davis et al., 2003). Large-scalecanopy disturbance in N. antarctica forests may occur as a result oftectonic activity, blowdown, snow avalanches or fire. This results in
0378-1127/$ – see front matter © 2010 Elsevier B.V. All rights reserved.doi:10.1016/j.foreco.2010.04.027

Author's personal copy
230 P.L. Peri et al. / Forest Ecology and Management 260 (2010) 229–237
Table 1Mean dasometric (±standard deviation) characteristics of sampled Nothofagus antarctica stands grown at three sites qualities in Southern Patagonia.
Growth phase Age class (years) Density (trees ha-1) Height (m) DBH (m) Basal area (m2 ha-1) % Crown classes
D C I S
Site Class IIIRegeneration 5–20 35,050 ± 2459 1.5 ± 0.5 0.028 ± 0.004 38.3 ± 2.3 24 26 30 20Optimal growth 21–110 5820 ± 1088 5.8 ± 0.8 0.095 ± 0.03 44.6 ± 3.1 28 30 28 14Mature 111–235 420 ± 89 10.2 ± 1.5 0.285 ± 0.07 32.2 ± 2.4 40 28 25 7
Site Class IVRegeneration 5–20 23,500 ± 1504 1.2 ± 0.4 0.030 ± 0.002 40.5 ± 2.6 21 17 28 34Optimal growth 21–110 4950 ± 980 4.3 ± 0.7 0.115 ± 0.01 51.2 ± 3.4 30 26 23 21Mature 111–220 460 ± 55 7.5 ± 1.6 0.256 ± 0.06 30.8 ± 1.8 35 30 22 13
Site Class VRegeneration 5–20 26,120 ± 8100 1.1 ± 0.6 0.020 ± 0.003 32.3 ± 3.1 20 24 25 31Optimal growth 21–110 3330 ± 1200 3.4 ± 0.8 0.108 ± 0.02 29.3 ± 2.9 25 28 24 23Mature 111–200 440 ± 35 5.3 ± 0.7 0.202 ± 0.05 25.4 ± 2.7 36 27 23 14
Crown classes = D: dominant trees, C: codominant trees, I: intermediate trees, S: suppressed trees.Site Class III: stands where the mean total height of dominant mature tree (H) reach 10.2 m, Site Class IV: H = 7.8 m, Site Class V: H = 5.3 m.
abundant regeneration (∼100,000 seedlings ha−1 less than 1 m tall,up to 20 years of age) followed by self-thinning due mainly to lightcompetition (Veblen et al., 1996) resulting in a final stand densityof ∼200–350 trees ha−1 at mature stages (more than 180 years ofage).
It is important to emphasize that many researchers have onlyfocused on above-ground carbon sequestration (Davis et al., 2003).However, roots in forest ecosystems can contribute up to two timesmore biomass than above-ground components in young growthphases (Peri et al., 2006).
There are few studies of above- and below-ground pools of Cstorage in Patagonian Nothofagus forests that provide an under-standing about ecosystem functionality (Peri et al., 2006, 2008)and the consequences of different disturbance and managementregimes, and there are no reports of above- and below-groundcarbon accumulation related to stand age and degree of canopysuppression. In this context, forest ecosystem pools and fluxes ofC are strongly affected by forest management (Finér et al., 2003).We hypothesize that C storage in tree components (leaves, stems,branches, and roots) and forest floor will change as a result of dif-ferent forest structures determined by the proportion of crownclasses, development stages (age) and the site quality where treesgrow. Therefore, the aim of this study was to quantify the amountand dynamics of C in both above- and below-ground componentsfor an age sequence and among crown classes for individual treesgrown at different site qualities of deciduous N. antarctica forestsin Southern Patagonia.
2. Materials and methods
2.1. Study sites and stand characteristics
This study was conducted in natural stands of N. antarctica forestgrowing in the southern west of Santa Cruz province (Argentina)at three site qualities (Lencinas et al., 2002): Site Class III (SCIII) where the mean total height of dominant mature tree (H)reached 10.2 m (51◦13′21′′SL, 72◦15′34′′WL), Site Class IV (SC IV)where H reached 7.8 m (51◦34′10′′SL, 72◦14′21′′WL), and Site ClassV (SC V) which represented a marginal site where H reached5.3 m (51◦40′59′′SL, 72◦15′56′′WL). These stands are part of a largerexperiment described by Peri et al. (2006, 2008) where the biomassand nutrients in both above- and below-ground components of N.antarctica forests have been studied. Regional climate is cold tem-perate and sub-humid with a mean annual temperature of 6.5 ◦Cand a long-term annual rainfall of 300 mm. Soils were classified asMollisols.
In each of the three study areas of 400 km2, three purestands corresponding to different development phases (regener-ation phase 5–20 years of age, optimal growth phase 21–110 yearsof age and mature phase 111–220 years of age) were selected. Ineach stand, three circular plots of 500 m2 were randomly located ineach stand to characterize the forest structure (Table 1). Mean standdensity ranged from 35,050 trees ha−1 in the regeneration phase to420 trees ha−1 in the mature phase. In the study stands, mean dom-inant height (H) ranged from 1.1 to 10.2 m, mean diameter at 1.3 mheight (DBH) from 0.02 to 0.28 m and mean basal area from 25.4to 51.2 m2 ha−1. The proportion of dominant trees increased andsuppressed trees decreased with age (Table 1).
2.2. Soil C sampling
Thirty bulked soil sample cores from each stand at four differentdepths corresponding to observe root distribution (forest floor lit-ter from 0 to 1 cm, organic horizon from 1 to 6 cm, mineral horizonI from 5 to 30 cm, mineral horizon II from 30 to 60 cm) were takenat random (Table 2). Soil samples were kept at 2 ◦C until furtherprocessed. The litter layer and organic samples were oven-dried at70 ◦C and ground with a Wiley mill to pass a 1 mm mesh. The min-eral soil samples were air dried and passed through a 2 mm sieve.Soil bulk density was measured from the weight of the soil per unitvolume (g cm−3) given on an oven-dry basis. C concentration wasdetermined by dry combustion using a LECO analyser. The contentof soil C for each sampling depth was calculated by applying the Cconcentration to the soil bulk density of a particular depth.
2.3. Tree C determination
For each stand, ninety-six trees of different age classes corre-sponding to different stand development phases (regeneration:5–20 years, optimal growth: 21–110 years and mature: 111–220years) were randomly selected. Within each age class, eight treesof each crown class (dominant, codominant, intermediate andsuppressed) were sampled. Thus, a total of 288 trees were sam-pled (3 site quality class × 3 development stand stages × 4 crownclasses × 8 replicates). For each tree, total height and DBH weremeasured, and the stem was cut at 0.1 m (stump), 1.3 m and every1 m up to an end diameter of 10 mm after the harvesting to calculatevolume of heartwood, sapwood, bark and rotten wood componentsusing the Smalian formula. Each tree was separated into the follow-ing components: leaves; small branches (diameter < 10 mm) andcoarse branches (>10 mm) with bark; stem components includingsapwood, heartwood and bark; and roots with bark classified asfine (diameter < 2 mm), medium (<30 mm) or coarse (>30 mm).
Author's personal copy
P.L. Peri et al. / Forest Ecology and Management 260 (2010) 229–237 231
Tab
le2
Mea
nso
ilp
rop
erti
esin
sam
ple
dN
otho
fagu
san
tarc
tica
fore
sts
grow
nat
dif
fere
nt
site
clas
ses
inSo
uth
ern
Pata
gon
ia,A
rgen
tin
a(s
tan
dar
dd
evia
tion
inp
aren
thes
is,n
=3)
.
Soil
hor
izon
sSi
teC
lass
III
Site
Cla
ssIV
Site
Cla
ssV
Litt
erO
rgan
ich
oriz
onM
iner
alh
oriz
onI
Min
eral
hor
izon
IILi
tter
Org
anic
hor
izon
Min
eral
hor
izon
IM
iner
alh
oriz
onII
Litt
erO
rgan
ich
oriz
onM
iner
alh
oriz
onI
Min
eral
hor
izon
II
Dep
th(c
m)
0–2
2–6
6–20
20–6
00–
11–
55–
3030
–60
0–1
1–4
4–20
20–5
0C
lay
(%)
––
1015
––
2020
––
2625
Silt
(%)
––
3724
––
3060
––
2320
San
d(%
)–
–53
61–
–50
20–
–51
55B
ulk
den
sity
(gcm
−3)
0.07
(0.0
2)0.
47(0
.06)
0.79
(0.1
2)1.
04(0
.16)
0.10
(0.0
1)0.
39(0
.05)
1.14
(0.1
9)1.
29(0
.14)
0.09
(0.0
1)0.
63(0
.07)
0.97
(0.1
6)1.
05(0
.09)
Car
bon
con
-ce
ntr
atio
n(%
)
47.2
(6.1
1)16
.0(2
.04)
6.0
(0.7
1)2.
3(0
.22)
50.8
(0.7
8)14
.2(0
.24)
2.1
(0.1
5)0.
4(0
.07)
49.1
(5.5
3)9.
4(1
.12)
3.2
(0.6
4)0.
5(0
.06)
Car
bon
con
ten
t(M
gh
a−1)
6.6
(0.8
)30
.1(2
.8)
66.4
(7.8
)95
.7(8
.4)
5.8
(0.8
)22
.1(0
.3)
59.8
(6.1
)15
.5(1
.1)
4.4
(0.5
)17
.8(2
.1)
49.7
(6.3
)15
.8(2
.2)
Site
Cla
ssII
I:st
and
sw
her
eth
em
ean
tota
lhei
ght
ofd
omin
ant
mat
ure
tree
(H)
reac
h10
.2m
,Sit
eC
lass
IV:
H=
7.8
m,S
ite
Cla
ssV
:H
=5.
3m
.
Three samples of each component in every tree were taken fordry weight and C analysis. For coarse branches and stem, threecross-sectional discs of 30 mm at different lengths were taken andseparated into their component pool (heartwood, sapwood, barkand rotten wood) to determine density for biomass calculations.All small branches, leaves and dead branches from each sampledtree were separated and weighed fresh. Roots from individual treeswere excavated to a depth of 0.5 m for SC V and 0.6 m for SC IIIand SC IV (maximum rooting depth for all crown classes) in circu-lar plots (radius ranged from 1.5 m for regeneration to 10.2 m formature trees growing in SC III) centred on the stump of the sampledtrees. These roots were sorted into diameter classes (fine < 2 mm,medium < 30 mm, coarse > 30 mm) and weighed in fresh. Subsam-ples were taken for oven drying to estimate biomass and C analysis.Although the fine root biomass was underestimated because itis difficult to assess the entire root system using the excavationmethod, we agree with Le Goff and Ottorini (2001) who reportedthat coarse roots contribute most to the total root biomass and thatthe fine fraction represents a very small part of the total root sys-tem. Therefore, the missing fine root biomass would not stronglyinfluence the total estimated root biomass.
Samples from the three age classes in each site class were driedin a forced draft oven at 65 ◦C to constant weight and ground in amill containing 1 mm stainless steel screen for C analysis. C concen-trations were determined by dry combustion using a LECO analyser.
C accumulation of trees was estimated by multiplying C con-centrations from chemical analysis and the mass of each biomasscomponent (dry weight measurements). Age of each sampletree was obtained by counting rings at the stump (0.3 m fromsoil level). C accumulation was divided by tree age to estab-lish the average annual rate at which C was accumulated bytrees.
2.4. Statistical analysis
Total C accumulation and C root/shoot ratio functions werefitted using non-linear regression analysis. Different sigmoid func-tions (Chapman-Richard, Logistic, Weibull, Gompertz, Hill andSchumacher) were compared to fit total C accumulation against ageand crown suppression classes. For C root/shoot ratio data, inversefunctions were fitted against age. The selected functions were firstestimated for each crown class based on individual trees in eachstand. The parameters of these functions for each crown suppres-sion classes were subjected to an analysis of variance (ANOVA) asa segregation indicator.
Comparisons of main factors (site, age and crown classes) werecarried out by analyses of variance with the F test for C concentra-tion and allocation. Significantly different averages were separatedwith standard error of means to evaluate least significant differ-ences (LSD). All tests were evaluated at P < 0.05. Statistical analyseswere carried out using the Genstat statistical package (Genstat5—v.1997).
3. Results
3.1. Soil C
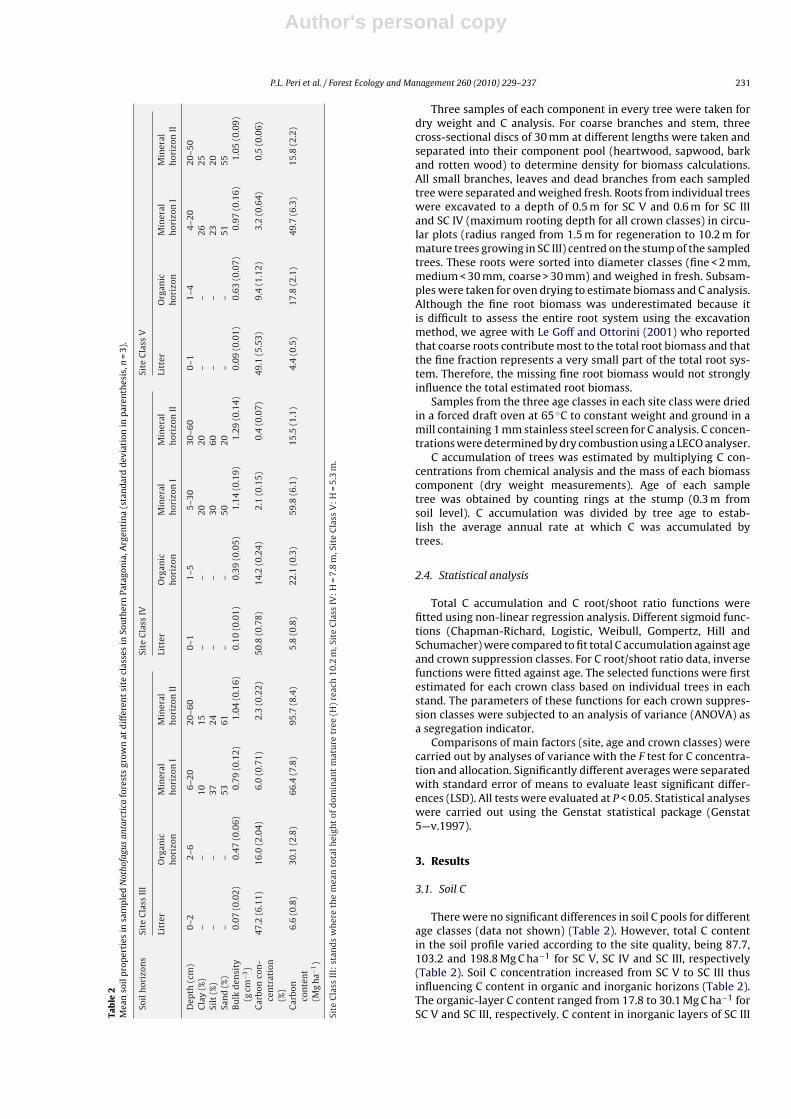
There were no significant differences in soil C pools for differentage classes (data not shown) (Table 2). However, total C contentin the soil profile varied according to the site quality, being 87.7,103.2 and 198.8 Mg C ha−1 for SC V, SC IV and SC III, respectively(Table 2). Soil C concentration increased from SC V to SC III thusinfluencing C content in organic and inorganic horizons (Table 2).The organic-layer C content ranged from 17.8 to 30.1 Mg C ha−1 forSC V and SC III, respectively. C content in inorganic layers of SC III

Author's personal copy
232 P.L. Peri et al. / Forest Ecology and Management 260 (2010) 229–237
Table 3Mean carbon concentration in components of Nothofagus antarctica trees (data expressed as a percentage of dry matter) for different crown, age and site classes.
Leaves Small branches Sapwood Heartwood Bark Rotten wood Roots
<2 mm <30 mm >30 mm
Age class5-20 years 48.9 50.1 50.3 51.6 49.9 51.5 46.8 47.0 49.121-110 years 49.8 50.5 51.7 53.2 51.8 52.5 48.2 47.7 50.2111-235 years 50.2 51.6 52.4 54.2 52.0 53.2 48.8 48.7 51.0
Crown classDominant 48.3 49.6 50.4 51.3 49.8 51.1 46.4 46.3 48.8Codominant 49.3 50.1 51.2 52.5 50.5 51.7 47.3 47.2 49.4Intermediate 50.0 51.1 51.5 53.5 51.7 52.6 48.5 48.3 50.5Suppressed 50.8 52.0 53.0 54.7 52.9 54.1 49.4 49.3 51.5
Site classSite Class III 48.5 49.1 49.8 51.1 49.4 50.5 46.5 47.1 47.9Site Class IV 49.1 49.6 50.2 52.8 50.7 51.6 47.3 47.7 48.2Site Class V 51.3 53.4 54.4 55.1 53.6 56.1 49.9 48.5 54.2
Age class effect ns (1.35) ns (1.54) (0.64)* (0.88)* (1.01)* ns (1.82) (0.45)* ns (1.47) (0.75)*
Crown class effect (0.68)* (0.58)* (0.44)** (0.73)*** (0.97)* (1.07)** (0.38)** (0.81)** (0.67)*
Site class effect (0.54)* (0.42)** (0.37)*** (0.64)** (0.55)** (0.41)*** (0.57)* ns (1.45) (0.49)**
Interaction ns (1.75) ns (1.67) (0.71)* (0.92)* (1.07)* ns (1.91) (0.52)* ns (1.55) (0.77)*
Site Class III: stands where the mean total height of dominant mature tree (H) reach 10.2 m, Site Class IV: H = 7.8 m, Site Class V: H = 5.3 m.ns = non significative (standard error of differences of means in parentheses).
* P < 0.05.** P < 0.01.
*** P < 0.001.
was more than twofold greater than the other site quality class.Similarly, litter C content was greater for the best site quality.
3.2. C concentration in the tree components
C concentration in each biomass pool component, except formedium roots, showed significant differences according to crownand site classes (Table 3). C concentration in components increasedfrom dominant to suppressed trees and from trees grown in SC IIIto SC V. For example, mean C concentration in leaves was 48.3% indominant trees and 50.8% in suppressed trees, and 48.5% in SC IIIand 51.3% in SC V.
C concentrations in leaves, small branches, rotten wood andmedium root did not differ (P > 0.05) between trees of different ages(Table 3). C concentration of other biomass components (sapwood,heartwood, bark, fine and coarse roots) increased with increasingstand development.
C concentrations significantly varied between biomass poolcomponents. Total C concentration generally graded in the follow-ing order: heartwood > rotten wood > sapwood > bark > smallbranches > coarse roots > leaves > medium roots > fine roots(Table 3).
3.3. Total C accumulation
A logistic function (Eq. (1)) with three parameters was used toestimate total C accumulation of individual trees.
Y = a
1 + (x/b)c (1)
where Y = C of individual trees (kg); x = age (years); a, b and c arethe estimated parameters and are provided in Appendix A.
Relationships between the total C content of N. antarctica andage for different crown and site classes are presented in Fig. 1. TheANOVA of parameters showed significant differences (P < 0.05) foreach crown class. Total C accumulation over time followed theorder: dominant > codominant > intermediate > suppressed trees.For example, dominant trees growing on SC IV had accumu-lated 164.6 kg C tree−1 after 160 years and suppressed trees only
23.1 kg C tree−1. At 40 years of age these differences were 8.6, 6.1,3.3 and 0.9 kg C tree−1 for dominant, codominant, intermediate andsuppressed trees, respectively (Fig. 1b). Also, there was an effect ofsite quality of the stands on total C accumulation over time. Forexample, while the mean total C accumulated for dominant treesgrown in SC V at 150 years was 108.9 kg C tree−1 (Fig. 1c), dominanttrees growing on SC III had 206.8 kg C tree−1 (Fig. 1a).
The rate of C accumulation showed a parabolic relationship withtree age and increased to reach a maximum and then declinedas tree age increased further (Fig. 2). Position in the canopy alsoaffected the maximum value and shape of this response. For exam-ple, maximum accumulation rate for dominant trees growing onSC IV was 1.08 kg C tree−1 year−1 at 126 years and then declinedto 0.84 kg C tree−1 year−1 at 220 years. In contrast, maximum accu-mulation rate for suppressed trees was 0.14 kg C tree−1 year−1 at133 years (Fig. 2b). Also, the site quality modified the maximumvalues and the shape of the rate of C accumulation. While the max-imum C accumulation rate of dominant trees growing on SC Vwas 0.73 kg C tree−1 year−1 at 139 years (Fig. 2c), for SC III it was1.44 kg C tree−1 year−1 at 116 years (Fig. 2a).
3.4. Above- and below-ground C ratio
An inverse function (Eq. (2)) with two parameters describedthe C root/shoot ratio data better than others functions (data notshown).
y = a +(
b
x
)(2)
where y = C root/shoot ratio of individual trees (dimensionless);x = age (years); a and b are the estimated parameters.
There were no significant difference in the slope of the relation-ship between the C root/shoot ratio and age for different crownclasses. Therefore, a single function was used for each site qualityclass. The parameters for each site class are given in Appendix B.
C root/shoot ratio decreased from maximum values of 2.2, 1.9and 1.3 at 5 years to a steady-state asymptote of 0.7, 0.5 and 0.3beyond 60 years of age, for trees grown in SC V, SC IV and SC III,

Author's personal copy
P.L. Peri et al. / Forest Ecology and Management 260 (2010) 229–237 233
Fig. 1. Total carbon accumulation (kg C tree−1) against age for different crown classes of Nothofagus antarctica growing at Site Class III (a), Site Class IV (b) and Site Class V(c), Patagonia. (�) dominant trees, (©) codominant trees, (�) intermediate trees, (�) suppressed trees. Site Class III: stands where the mean total height of dominant maturetree (H) reach 10.2 m, Site Class IV: H = 7.8 m, Site Class V: H = 5.3 m.
respectively (Fig. 3). Thus, root C accumulation was greater duringthe regeneration phase, and then the above-ground C accumulationof young and mature trees increased over time. At any time, the rootC accumulation was greater for trees growing on the poorer sites(SC V) than for better site conditions (Fig. 3).
3.5. C allocation in tree components
Significant differences were found in C distribution betweencomponents (Table 4), e.g. mature trees allocated more C mainly tosapwood and heartwood and less to fine roots. C allocation variedsignificantly according to tree age, e.g. mean C allocation for domi-nant trees in the regeneration phase growing on SC IV was mainlyto medium roots (41.1%) and 30.1% of C was allocated to sapwoodin mature dominant trees for the same site quality (Table 4). C allo-cation also varied according to the site quality, e.g. there was adecrease in C storage in leaves, small branches, sapwood, bark andfine roots of trees grown on the better sites (SC III) compared topoorer sites (SC V) (Table 4). In general, there was a significant dif-ference in C allocation between crown classes in leaves and smallbranches components (except sapwood in SC IV) (Table 4).
3.6. Estimation of C storage at stand level
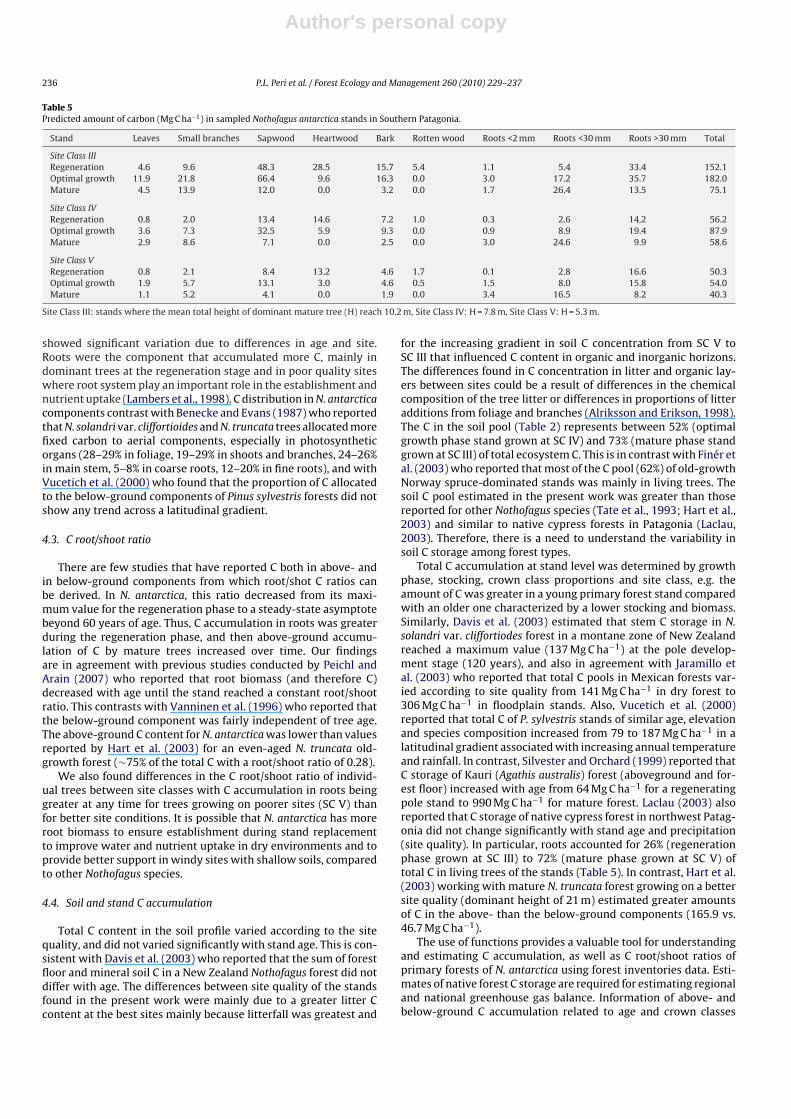
The equations for total C accumulation from individual treeswere used to estimate the C storage at the stand level using forestinventory data. Total C storage in N. antarctica forest ranged from40.3 Mg C ha−1 for mature stands grown at SC V to 182.0 Mg C ha−1
for optimal growth stands at SC III (Table 5). In all studied site qual-ity classes, total C accumulation was greater at the development
stage of optimal growth (21–110 years). Sapwood contained more Cin SC III (66.4 Mg C ha−1) than SC IV (32.5 Mg C ha−1), while mediumroots contained more C in the SC V (15.8 Mg C ha−1) stands.
4. Discussion
4.1. C concentrations
A C concentration of 50% in dry biomass components of trees iswidely used as a constant conversion factor for C stock estimation(Bert and Danjon, 2006). In the present study, mean tissue C con-centration varied from 46.3% in medium roots of dominant trees to56.1% in rotten wood for trees grown in SC V. This range is slightlylower than that for ten temperate tree species in China (43.4–55.6%)(Zhang et al., 2009), but it is wider that those described for 41 NorthAmerica tree species (46.3–55.2%) (Lamlom and Savidge, 2003).Therefore, tree age, crown class and site quality of the stands needto be considered to provide an accurate forest C stock estimationfor N. antarctica. For example, when using the general default valueof 50% C concentration, it was calculated that total C accumulationof individual trees had been on average underestimated by 1.1%and C accumulation in roots overestimated by 1.4% of most of theobserved data (Figs. 1 and 3).
C concentration in tree components decreased from dominantto suppressed trees. There are no reports of C concentrations inrelation to the degree of crown suppression for N. antarctica. Thesechanges are consistent with Lambers et al. (1998) who reported thatplants have greater C concentrations of ‘least expensive’ (in terms ofATP required for biosynthesis) structural carbohydrates and lignincompounds when growth conditions become less favourable com-

Author's personal copy
234 P.L. Peri et al. / Forest Ecology and Management 260 (2010) 229–237
Fig. 2. Carbon accumulation rates (kg C tree−1 year−1) for Nothofagus antarctica trees against age sorted by four crown classes. (a) Site Class III, (b) Site Class IV, and (c) SiteClass V. Site Class III: stands where the mean total height of dominant mature tree (H) reach 10.2 m, Site Class IV: H = 7.8 m, Site Class V: H = 5.3 m.
pared with high concentration of ‘most expensive’ lipid and proteincompounds characteristic of fast-growing species. Furthermore,tissues of fast-growing species that have high protein concentra-tions (an expensive constituent) also have greater concentrationof minerals (Poorter, 1994). In this context, dominant trees have alarger crown and root system that may increase their growth rate
Fig. 3. Carbon root/shoot ratio for Nothofagus antarctica trees against age. (�) SiteClass III, (©) Site Class IV, and (�) Site Class V. Site Class III: stands where the meantotal height of dominant mature tree (H) reach 10.2 m, Site Class IV: H = 7.8 m, SiteClass V: H = 5.3 m.
and consequently may decrease the components C concentrationin components of trees. This explanation may be applied to thegreater C concentration in the poorer site quality (SC V) comparedwith trees grown in better environmental conditions (SC III). This isconsistent with Zhang et al. (2009) who reported that mean C con-centration was negatively correlated to mean annual increment oftree biomass. Jaramillo et al. (2003) reported that while C concen-trations did not vary among above-ground components of Mexicantropical dry forests, root C concentrations ranged from 33.4 to 43.4%across all sites and size classes.
C concentration in sapwood, heartwood, bark, fine andcoarse roots components of N. antarctica trees increased withage from regeneration to mature development stages. Thereis a continued increase in the proportion of cell wall com-ponents, e.g. carbonated structures as trees become older(Lambers et al., 1998). Tissues had different C concentrations in N.antarctica. C concentration graded in the following order: heart-wood > rotten wood > sapwood > bark > small branches > coarseroots > leaves > medium roots > fine roots. Zhang et al. (2009) alsoreported that C concentration of fine roots was the lowest (47.1%)among the biomass tissue of 10 temperate tree species.
4.2. Total C accumulation and allocation in tree components
Total C accumulation of individual trees was empirically derivedand summarized into easily transferable coefficients using non-linear regression. Total C accumulation for individual trees of N.antarctica was affected by tree age, crown class and site qual-ity. Total C accumulated for mature dominant trees was six times

Author's personal copy
P.L. Peri et al. / Forest Ecology and Management 260 (2010) 229–237 235
Table 4Carbon allocation (%) in components of Nothofagus antarctica trees for different crown, age and site classes. Data were expressed as percentage of biomass. Site Class III:stands where the mean total height of dominant mature tree (H) reach 10.2 m, Site Class IV: H = 7.8 m, Site Class V: H = 5.3 m.
Age classes Crown class Leaves Small branches Sapwood Heartwood Bark Rotten wood Roots
<2 mm <30 mm >30 mm
Site Class III
111–235 years
D 4.2 6.4 33.0 19.5 11.0 0.9 0.8 3.7 20.5C 3.5 6.6 30.8 19.9 11.5 1.1 0.9 3.5 22.2I 2.5 7.5 33.0 18.1 10.8 2.3 0.7 3.2 21.9S 1.9 4.8 30.2 17.5 8.1 9.8 0.6 3.8 23.3
21–110 years
D 7.6 12.4 34.0 5.5 9.8 0.0 2.0 8.9 19.8C 7.3 11.4 34.4 6.5 9.2 0.0 1.8 9.3 20.1I 6.0 12.8 38.1 4.8 8.0 0.0 1.6 9.2 19.5S 5.2 11.4 39.4 4.4 8.8 0.0 1.3 10.5 19.0
5–20 years
D 7.2 18.4 16.0 0.0 4.4 0.0 2.2 33.5 18.2C 6.8 18.5 14.5 0.0 4.0 0.0 2.3 35.9 18.0I 5.2 19.7 17.1 0.0 3.0 0.0 2.3 34.9 17.8S 4.7 17.4 16.2 0.0 5.4 0.0 2.2 36.2 17.9
Age class effect * ** * ** ** ** * ** *
Crown class effect ** * ns ns ns ns ns ns ns
Site Class IV
111–220 years
D 2.2 4.8 30.1 21.7 9.1 1.3 0.5 4.8 25.6C 0.9 1.9 19.1 31.7 14.9 1.5 0.6 4.7 24.9I 1.3 2.7 18.5 30.4 14.6 2.3 0.5 4.7 25.0S 1.6 4.7 27.5 20.4 12.9 2.3 0.7 4.4 25.4
21–110 years
D 6.2 11.9 34.9 2.1 10.7 0.0 1.1 10.5 22.6C 4.7 8.5 34.5 9.9 9.2 0.0 1.1 10.1 22.0I 2.8 7.1 39.4 7.4 10.2 0.1 1.0 10.1 21.9S 2.5 5.8 39.1 7.5 12.3 0.1 0.9 10.0 21.8
5–20 years
D 6.5 13.6 12.6 0.0 4.0 0.0 5.2 41.1 17.0C 5.3 12.9 11.9 0.0 4.2 0.0 5.3 43.4 17.0I 4.1 15.8 12.4 0.0 4.1 0.0 5.1 41.9 16.6S 4.0 16.4 11.3 0.0 5.0 0.0 5.2 41.5 16.7
Age class effect ** ** * ** * ** ** ** *
Crown class effect * * * ns ns ns ns ns ns
Site Class V
111–200 years
D 1.2 3.2 20.2 25.0 8.4 2.1 0.3 5.9 33.7C 1.7 4.5 17.1 24.7 9.1 2.5 0.2 5.4 34.8I 2.4 4.8 15.5 27.4 9.3 3.1 0.1 5.2 32.2S 1.1 4.2 14.1 28.0 9.4 5.5 0.2 6.0 31.4
21–110 years
D 3.9 8.2 25.9 5.0 7.6 0.3 3.1 15.4 30.5C 3.4 9.1 24.2 6.5 8.0 0.5 2.8 15.7 29.8I 3.9 8.5 23.8 7.0 9.6 1.3 2.7 14.8 28.4S 2.8 16.2 22.9 4.0 8.7 1.6 2.6 13.3 28.0
5–20 years
D 3.7 13.2 11.5 0.0 4.8 0.0 8.6 38.2 20.0C 3.0 12.3 10.3 0.0 4.1 0.0 9.3 41.2 19.8I 2.8 12.5 9.9 0.0 4.2 0.0 9.4 40.1 21.1S 1.9 13.2 8.5 0.0 5.3 0.1 6.2 44.0 20.8
Age class effect ** ** * ** * ** ** ** *
Crown class effect * * ns ns ns * ns ns ns
D: dominant trees, C: codominant trees, I: intermediate trees, S: suppressed trees.ns = non significative.
* P < 0.05.** P < 0.01.
greater than mature suppressed trees, and total C accumulated bymature dominant trees grown at SC III was doubled that for SCV stands. The greater C accumulation of dominant trees at any agecompared to inferior crown classes was very closely related to the Caccumulation rates. This is consistent with Rötzer et al. (2009) whoestimated that the amount of C storage in both above- and below-ground components over time for a mixed beech stand changedwith variations in site conditions, especially when temperature andradiation increased and precipitation decreased. Dominant treesand trees growing in better site qualities had larger crowns withmore biomass of photosynthetic green leaves, and consequentlyhad faster growth rates. In contrast, the leaves of suppressed trees
located in the inferior stratum receive less available light for photo-synthesis and these less active leaves may accumulate less C. Also,crown classes and site quality of N. antarctica stands affected themoment of maximum C accumulation, which was later for sup-pressed trees compared with dominant trees, and earlier for treesgrowing on better quality sites than poor quality sites.
C allocation varied significantly according to tree age and sitequality. This was mainly due to inferior crown classes or treesgrown in poor quality sites developing more structural tissues withlignin in bark, branches and stem components, combined with lowfoliage biomass. Similarly, Swamy et al. (2003) reported that Cstorage in different components of a Gmelina arborea plantation
Author's personal copy
236 P.L. Peri et al. / Forest Ecology and Management 260 (2010) 229–237
Table 5Predicted amount of carbon (Mg C ha−1) in sampled Nothofagus antarctica stands in Southern Patagonia.
Stand Leaves Small branches Sapwood Heartwood Bark Rotten wood Roots <2 mm Roots <30 mm Roots >30 mm Total
Site Class IIIRegeneration 4.6 9.6 48.3 28.5 15.7 5.4 1.1 5.4 33.4 152.1Optimal growth 11.9 21.8 66.4 9.6 16.3 0.0 3.0 17.2 35.7 182.0Mature 4.5 13.9 12.0 0.0 3.2 0.0 1.7 26.4 13.5 75.1
Site Class IVRegeneration 0.8 2.0 13.4 14.6 7.2 1.0 0.3 2.6 14.2 56.2Optimal growth 3.6 7.3 32.5 5.9 9.3 0.0 0.9 8.9 19.4 87.9Mature 2.9 8.6 7.1 0.0 2.5 0.0 3.0 24.6 9.9 58.6
Site Class VRegeneration 0.8 2.1 8.4 13.2 4.6 1.7 0.1 2.8 16.6 50.3Optimal growth 1.9 5.7 13.1 3.0 4.6 0.5 1.5 8.0 15.8 54.0Mature 1.1 5.2 4.1 0.0 1.9 0.0 3.4 16.5 8.2 40.3
Site Class III: stands where the mean total height of dominant mature tree (H) reach 10.2 m, Site Class IV: H = 7.8 m, Site Class V: H = 5.3 m.
showed significant variation due to differences in age and site.Roots were the component that accumulated more C, mainly indominant trees at the regeneration stage and in poor quality siteswhere root system play an important role in the establishment andnutrient uptake (Lambers et al., 1998). C distribution in N. antarcticacomponents contrast with Benecke and Evans (1987) who reportedthat N. solandri var. cliffortioides and N. truncata trees allocated morefixed carbon to aerial components, especially in photosyntheticorgans (28–29% in foliage, 19–29% in shoots and branches, 24–26%in main stem, 5–8% in coarse roots, 12–20% in fine roots), and withVucetich et al. (2000) who found that the proportion of C allocatedto the below-ground components of Pinus sylvestris forests did notshow any trend across a latitudinal gradient.
4.3. C root/shoot ratio
There are few studies that have reported C both in above- andin below-ground components from which root/shot C ratios canbe derived. In N. antarctica, this ratio decreased from its maxi-mum value for the regeneration phase to a steady-state asymptotebeyond 60 years of age. Thus, C accumulation in roots was greaterduring the regeneration phase, and then above-ground accumu-lation of C by mature trees increased over time. Our findingsare in agreement with previous studies conducted by Peichl andArain (2007) who reported that root biomass (and therefore C)decreased with age until the stand reached a constant root/shootratio. This contrasts with Vanninen et al. (1996) who reported thatthe below-ground component was fairly independent of tree age.The above-ground C content for N. antarctica was lower than valuesreported by Hart et al. (2003) for an even-aged N. truncata old-growth forest (∼75% of the total C with a root/shoot ratio of 0.28).
We also found differences in the C root/shoot ratio of individ-ual trees between site classes with C accumulation in roots beinggreater at any time for trees growing on poorer sites (SC V) thanfor better site conditions. It is possible that N. antarctica has moreroot biomass to ensure establishment during stand replacementto improve water and nutrient uptake in dry environments and toprovide better support in windy sites with shallow soils, comparedto other Nothofagus species.
4.4. Soil and stand C accumulation
Total C content in the soil profile varied according to the sitequality, and did not varied significantly with stand age. This is con-sistent with Davis et al. (2003) who reported that the sum of forestfloor and mineral soil C in a New Zealand Nothofagus forest did notdiffer with age. The differences between site quality of the standsfound in the present work were mainly due to a greater litter Ccontent at the best sites mainly because litterfall was greatest and
for the increasing gradient in soil C concentration from SC V toSC III that influenced C content in organic and inorganic horizons.The differences found in C concentration in litter and organic lay-ers between sites could be a result of differences in the chemicalcomposition of the tree litter or differences in proportions of litteradditions from foliage and branches (Alriksson and Erikson, 1998).The C in the soil pool (Table 2) represents between 52% (optimalgrowth phase stand grown at SC IV) and 73% (mature phase standgrown at SC III) of total ecosystem C. This is in contrast with Finér etal. (2003) who reported that most of the C pool (62%) of old-growthNorway spruce-dominated stands was mainly in living trees. Thesoil C pool estimated in the present work was greater than thosereported for other Nothofagus species (Tate et al., 1993; Hart et al.,2003) and similar to native cypress forests in Patagonia (Laclau,2003). Therefore, there is a need to understand the variability insoil C storage among forest types.
Total C accumulation at stand level was determined by growthphase, stocking, crown class proportions and site class, e.g. theamount of C was greater in a young primary forest stand comparedwith an older one characterized by a lower stocking and biomass.Similarly, Davis et al. (2003) estimated that stem C storage in N.solandri var. cliffortiodes forest in a montane zone of New Zealandreached a maximum value (137 Mg C ha−1) at the pole develop-ment stage (120 years), and also in agreement with Jaramillo etal. (2003) who reported that total C pools in Mexican forests var-ied according to site quality from 141 Mg C ha−1 in dry forest to306 Mg C ha−1 in floodplain stands. Also, Vucetich et al. (2000)reported that total C of P. sylvestris stands of similar age, elevationand species composition increased from 79 to 187 Mg C ha−1 in alatitudinal gradient associated with increasing annual temperatureand rainfall. In contrast, Silvester and Orchard (1999) reported thatC storage of Kauri (Agathis australis) forest (aboveground and for-est floor) increased with age from 64 Mg C ha−1 for a regeneratingpole stand to 990 Mg C ha−1 for mature forest. Laclau (2003) alsoreported that C storage of native cypress forest in northwest Patag-onia did not change significantly with stand age and precipitation(site quality). In particular, roots accounted for 26% (regenerationphase grown at SC III) to 72% (mature phase grown at SC V) oftotal C in living trees of the stands (Table 5). In contrast, Hart et al.(2003) working with mature N. truncata forest growing on a bettersite quality (dominant height of 21 m) estimated greater amountsof C in the above- than the below-ground components (165.9 vs.46.7 Mg C ha−1).
The use of functions provides a valuable tool for understandingand estimating C accumulation, as well as C root/shoot ratios ofprimary forests of N. antarctica using forest inventories data. Esti-mates of native forest C storage are required for estimating regionaland national greenhouse gas balance. Information of above- andbelow-ground C accumulation related to age and crown classes

Author's personal copy
P.L. Peri et al. / Forest Ecology and Management 260 (2010) 229–237 237
for N. antarctica have not been previously reported and thereforethe present work provided new knowledge. Thinning in silvopas-toral systems may change the distribution of C allocation withina stand, due to reduction in the number of trees and return of Cfrom litter. Stem-only harvesting rather than whole-tree removal,together with debarking the stem in situ, may reduce the loss of soilC pool from the forest ecosystem. Furthermore, root systems fromremoved trees remain in the system, and could provide C to soilthrough decomposition. Therefore, for any particular forest man-agement system it is important to analyse the development of bothabove- and below-ground C over the forest life cycle for differentsite qualities for accurate quantification of C pools on regional scale.
Acknowledgements
We want to thank Martin Viola and Juan Ruiz for their invaluablehelp during sampling in the field.
Appendix A.
Parameters of the logistic function (Eq. (1)) for total car-bon accumulation of Nothofagus antarctica trees. D: dominant, C:codominant, I: intermediate, S: suppressed trees. Site Class III:stands where the mean total height of dominant mature tree (H)reach 10.2 m, Site Class IV: H = 7.8 m, Site Class V: H = 5.3 m.
a b c R2 ESE
SiteClassIIID 270.2726 −2.7111 97.0055 0.9685 5.6545C 198.7561 −2.9083 107.5396 0.9778 4.4517I 135.5965 −2.5210 119.5705 0.9857 3.7963S 69.3452 −2.2132 131.5974 0.9458 1.6728
SiteClassIVD 197.9876 −3.3789 99.7508 0.9842 8.9682C 162.2860 −3.2102 109.6277 0.9835 6.5961I 107.4877 −3.1330 120.4181 0.9789 4.4120S 28.2356 −3.5395 104.7410 0.9781 1.3534
SiteClassVD 162.4129 −2.7702 115.9879 0.9941 5.7175C 129.2757 −2.6032 134.7408 0.9806 4.3958I 83.7143 −2.5960 129.7488 0.9639 2.3147S 24.5845 −3.1286 80.3045 0.9860 1.6432
Appendix B.
Parameters of the inverse function (Eq. (2)) for the carbonroot/shoot ratio of Nothofagus antarctica trees. Site Class III:stands where the mean total height of dominant mature tree(H) reach 10.2 m, Site Class IV: H = 7.8 m, Site Class V: H = 5.3 m.
a b R2 ESE
Site Class III 0.2712 5.4121 0.9826 0.0475Site Class IV 0.3709 7.4936 0.9759 0.0658Site Class V 0.6135 8.2782 0.9955 0.0694
References
Alriksson, A., Erikson, H.M., 1998. Variations in mineral nutrient and C distributionin the soil and vegetation compartments of five temperate tree species in NESweden. Forest Ecology and Management 108, 261–273.
Benecke, U., Evans, G., 1987. Growth and water use in Nothofagus truncata (hardbeech) in temperate hill country, Nelson, New Zealand. In: Hanxi, Y., Zhan, W.,Jeffers, J.N.R., Ward, P.A. (Eds.), The Temperate Forest Ecosystem, ITE SymposiumNo. 20. Institute of Terrestrial Ecology, Cumbria, Great Britain.
Bert, D., Danjon, F., 2006. Carbon concentration variations in the roots, stem andcrown of mature Pinus pinaster (Aait.). Forest Ecology and Management 222,279–295.
Davis, M.R., Allen, R.B., Clinton, P.W., 2003. Carbon storage along a stand devel-opment sequence in a New Zealand Nothofagus forest. Forest Ecology andManagement 177, 313–321.
Dixon, R.K., Brown, S., Houghton, R.A., Solomon, A.M., Trexler, M.C., Wisniewski,J., 1994. Carbon pools and flux of global forest ecosystems. Science 263,185–190.
Finér, L., Mannerkoski, H., Piirainen, S., Starr, M., 2003. Carbon and nitrogenpools in an old-growth. Norway spruce mixed forest in eastern Finland andchanges associated with clear-cutting. Forest Ecology and Management 174,51–63.
Grigal, D.F., Ohmann, L.F., 1992. Carbon storage in upland forests of the lake states.Soil Science Society of America Journal 56, 935–943.
Hart, P.B.S., Clinton, P.W., Allen, R.B., Nordmeyer, A.H., Evans, G., 2003. Biomassand macro-nutrients (above- and below-ground) in a New Zealand beech(Nothofagus) forest ecosystem: implications for storage and sustainable forestmanagement. Forest Ecology and Management 174, 281–294.
Jaramillo, V.J., Kauffman, J.B., Rentería-Rodríguez, L., Cummings, D.L., Ellingson, L.J.,2003. Biomass, carbon, and nitrogen pools in Mexican tropical dry forest land-scape. Ecosystems 6, 609–629.
Laclau, P., 2003. Biomass and carbon sequestration of ponderosa pine plantationsand native cypress forests in northwest Patagonia. Forest Ecology and Manage-ment 180, 317–333.
Lambers, H., Chapin III, F.S., Pons, T.L., 1998. Plant Physiological Ecology. Springer-Verlag New York Inc., New York, pp. 540.
Lamlom, S.H., Savidge, R.A., 2003. A reassessment of carbon content in wood: vari-ation within and between 41 North American species. Biomass Bioenergy 25,381–388.
Le Goff, N., Ottorini, J.M., 2001. Root biomass and biomass increment in a beech(Fagus sylvatica L.) stand in North-East France. Annals of Forest Science 58, 1–13.
Lencinas, V.M., Martínez Pastur, G., Cellini, J.M., Vukasovic, R., Peri, P.L., Fernandez,M.C., 2002. Incorporación de la altura dominante y la clase de sitio a ecuacionesestándar de volumen para Nothofagus antarctica. Bosques 23, 5–17.
Manabe, S., Wetherald, R.T., 1987. Large-scale changes of soil wetness induced byan increase in atmospheric carbon dioxide. Journal of Atmospheric Science 44,1211–1235.
Peichl, M., Arain, M.A., 2007. Allometry and partitioning of above- and belowgroundtree biomass in an age sequence of white pine forests. Forest Ecology and Man-agement 253, 68–80.
Peri, P.L., Gargaglione, V., Martínez Pastur, G., 2006. Dynamics of above- and below-ground biomass and nutrient accumulation in an age sequence of Nothofagusantarctica forest of Southern Patagonia. Forest Ecology and Management 233,85–99.
Peri, P.L., Gargaglione, V., Martínez Pastur, G., 2008. Above- and belowground nutri-ents storage and biomass accumulation in marginal Nothofagus antarctica forestsin Southern Patagonia. Forest Ecology and Management 255, 2502–2511.
Poorter, H., 1994. Construction costs and payback time of biomass: a wholeplant perspective. In: Roy, J., Garnier, E. (Eds.), A Whole Plant Perspectiveon Carbon–Nitrogen Interactions. SPB Academic Publishing, The Hague, pp.111–127.
Rötzer, T., Seifert, T., Pretzsch, H., 2009. Modelling above and below ground carbondynamics in a mixed beech and spruce stand influenced by climate. EuropeanJournal of Forest Research 128, 171–182.
Silvester, W.B., Orchard, T.A., 1999. The biology of kauri (Agathis australis) in NewZealand. 1. Production, biomass, carbon storage, and litter fall in four forestremnants. New Zealand Journal of Botany 37, 553–571.
Swamy, S.L., Puri, S., Singh, A.K., 2003. Growth, biomass, carbon storage and nutrientdistribution in Gmelina arborea Roxb. Stands on red lateritic soils in central India.Bioresources Technology 90, 109–126.
Tate, K.R., Ross, D.J., O’Brien, B.J., Kelliher, F.M., 1993. Carbon storage and turnover,and respiratory activity, in the litter and soil of an old-growth southern beech(Nothofagus) forest. Soil Biology Biochemistry 25, 1601–1612.
Vanninen, P., Ylitalo, H., Sievänen, R., Mäkelä, A., 1996. Effects of age and site qual-ity on the distribution of biomass in Scots pine (Pinus sylvestris L.). Trees 10,231–238.
Veblen, T.T., Donoso, C., Kitzberger, T., Rebertus, A.J., 1996. Ecology of southernChilean and Argentinean Nothofagus forests. In: Veblen, T., Hill, R., Read, J. (Eds.),The Ecology and Biogeography of Nothofagus Forests. Yale University Press, NewHaven, pp. 293–353.
Vucetich, J.A., Reed, D.D., Breymeyer, A., Degórski, M., Mroz, G.D., Solon, J., Roo-Zielinska, E., Noble, R., 2000. Carbon pools and ecosystem properties along alatitudinal gradient in northern Scots pine (Pinus sylvestris) forests. Forest Ecol-ogy and Management 136, 135–145.
Zhang, Q., Wang, C., Wang, X., Quan, X., 2009. Carbon concentration variabilityof 10 Chinese temperate tree species. Forest Ecology and Management 258,722–727.
Related Documents