International Journal of Management (IJM), ISSN 0976 – 6502(Print), ISSN 0976 - 6510(Online), Volume 5, Issue 3, March (2014), pp. 01-20 © IAEME 1 CAPITAL STRUCTURE AND ECONOMIC PERFORMANCE OF THE FIRM: EVIDENCE FROM ITALY PASQUALE DE LUCA PhD, Researcher, Faculty of Economics at Sapienza University in Rome (Italy) ABSTRACT Financing choices are one of the most critical decision for management by influencing the firm’s behaviour as well as its economic performance and value. Based on the researches of Abor (2005) and Gill, Biger and Mathur (2011) the paper is a moderate attempt to understand the relationship between capital structure and economic performance of Italian large, medium and small firms in manufacturing and service industry listed in Italian Stock Exchange in a period of 5 years (from 2007 to 2011). The analysis found a significant relationship between economic performance of the firm and its financial debt but with non-unique direction. A positive correlation was found in the medium manufacturing firms (between i) ROE and total, long-term and short-term financial debt to total assets; ii) ROA and total and short-term financial debt to total assets; iii) ROI and short-term financial debt to total assets), in the large service firms (between i) ROA and total financial debt to total assets; ii) ROI and long-term financial debt to total assets) and in the small service firms (between ROE and total and short-term financial debt to total assets). Differently a negative correlation was found in the large manufacturing firms (between i) ROE, ROA and short-term financial debt to total assets; ii) ROI and total and long-term financial debt to total assets), in the small manufacturing firms (between ROE and total and short-term financial debt to total assets) and in the large and small service firms (between ROI and short-term financial debt to total assets). In medium service firms were not found correlations. 1. INTRODUCTION The capital structure choices are relevant for the firm not only in order to maximize the returns on equity, but also because they have effects on firm’s ability to deal to its competitive environmental. The financing choices can influence the firm’s behaviour as well as its performance, survivability, business perspectives and market value. Thus, they are one of the most critical decision for management. The capital structure basically refers to the combination of equity and debt a firm uses to INTERNATIONAL JOURNAL OF MANAGEMENT (IJM) ISSN 0976-6502 (Print) ISSN 0976-6510 (Online) Volume 5, Issue 3, March (2014), pp. 01-20 © IAEME: www.iaeme.com/ijm.asp Journal Impact Factor (2014): 7.2230 (Calculated by GISI) www.jifactor.com IJM © I A E M E

Welcome message from author
This document is posted to help you gain knowledge. Please leave a comment to let me know what you think about it! Share it to your friends and learn new things together.
Transcript
International Journal of Management (IJM), ISSN 0976 – 6502(Print), ISSN 0976 - 6510(Online),
Volume 5, Issue 3, March (2014), pp. 01-20 © IAEME
1
CAPITAL STRUCTURE AND ECONOMIC PERFORMANCE OF THE FIRM:
EVIDENCE FROM ITALY
PASQUALE DE LUCA
PhD, Researcher, Faculty of Economics at Sapienza University in Rome (Italy)
ABSTRACT
Financing choices are one of the most critical decision for management by influencing the
firm’s behaviour as well as its economic performance and value.
Based on the researches of Abor (2005) and Gill, Biger and Mathur (2011) the paper is a
moderate attempt to understand the relationship between capital structure and economic performance
of Italian large, medium and small firms in manufacturing and service industry listed in Italian Stock
Exchange in a period of 5 years (from 2007 to 2011).
The analysis found a significant relationship between economic performance of the firm and
its financial debt but with non-unique direction. A positive correlation was found in the medium
manufacturing firms (between i) ROE and total, long-term and short-term financial debt to total
assets; ii) ROA and total and short-term financial debt to total assets; iii) ROI and short-term
financial debt to total assets), in the large service firms (between i) ROA and total financial debt to
total assets; ii) ROI and long-term financial debt to total assets) and in the small service firms
(between ROE and total and short-term financial debt to total assets). Differently a negative
correlation was found in the large manufacturing firms (between i) ROE, ROA and short-term
financial debt to total assets; ii) ROI and total and long-term financial debt to total assets), in the
small manufacturing firms (between ROE and total and short-term financial debt to total assets) and
in the large and small service firms (between ROI and short-term financial debt to total assets). In
medium service firms were not found correlations.
1. INTRODUCTION
The capital structure choices are relevant for the firm not only in order to maximize the
returns on equity, but also because they have effects on firm’s ability to deal to its competitive
environmental. The financing choices can influence the firm’s behaviour as well as its performance,
survivability, business perspectives and market value. Thus, they are one of the most critical decision
for management.
The capital structure basically refers to the combination of equity and debt a firm uses to
INTERNATIONAL JOURNAL OF MANAGEMENT (IJM)
ISSN 0976-6502 (Print)
ISSN 0976-6510 (Online)
Volume 5, Issue 3, March (2014), pp. 01-20
© IAEME: www.iaeme.com/ijm.asp
Journal Impact Factor (2014): 7.2230 (Calculated by GISI)
www.jifactor.com
IJM © I A E M E
International Journal of Management (IJM), ISSN 0976 – 6502(Print), ISSN 0976 - 6510(Online),
Volume 5, Issue 3, March (2014), pp. 01-20 © IAEME
2
finance its operations and investments. Equityholders and debtholders have different level of the risk,
benefit and control. Debtholder bears the default risk, earns a fixed rate of return, and exerts a lower
and indirect control on firm's activities. Differently equityholder bears the most of the risk, his gain
are uncertainly and variables depending to the firm’s performance and its self-financing perspectives,
and exerts a full control on the firm's activities.
More than 50 years later Modigliani and Miller’s (1958) celebrate paper and despite the
theoretical models and empirical researches developed over the following years, the problem of
“optimal” capital structure is still open. Researchers continue to analyse capital structure trying to
determinate whether “optimal” capital structure exists, what are the determinates and in which way
they combine. Theories and empirical researches seem to explain some aspects under certain
condition of the firm’s behaviour. Actually there is still no theory can fully explain the firm’s
behaviour on capital structure decision or, even more, be able to define the optimal capital structure.
The problem is still open.
In this paper the relationship between capital structure and economic performance of the firm
was investigated by integrating studies and researches in strategic management and corporate finance
inside in the framework of the economic theoretical premises.
Traditionally strategic management and corporate finance are considered separately. It is argued they
are based on different paradigms not related and sometimes in opposition with difficulty for manager
to find a linkages (Bettis, 1983; Ward and Grundy, 1996).
Today, the high complexity of the firm and the relationship with its dynamic environment
require a strong integration between skills in corporate strategy and in corporate finance. Finance
plays central role in the government strategic of the firm. It is a relevant player in all business
decisions and influences the system of strategies. Every decision, operational or strategic, has
financial implications that relate to its size. Finance, therefore, has full and rightful place in the
strategic government of the firm. One of the most critical decision for finance in its role of relevant
player in the strategic government of the firm are the capital structure choices. The optimization of
capital structure is relevant since that good performances, the future survivability and business
prospects of the firm depend also on financing decisions. The leverage has an impact on competitive
strategy of the firm and therefore on its economic performance (Barton and Gordon, 1987 and 1988;
Hitt et al., 1991; Kester and Luehrman, 1992; Balakrishnan and Fox, 1993; Short, 1994; Barclay and
Smith, 1995; Kochhar, 1996; Stohs and Mauer, 1996; Shleifer and Vishny, 1997; Kochhar and Hitt,
1998; Simerly and Mingfang Li, 2000; Ozkan, 2002).
The relationship between capital structure and economic performance of the firm is
confirmed by several empirical researches although with non-unique results. Under different
perspectives and assumptions, some researches found a positive relationship while others found a
negative relationship.
The aim of this paper is a moderate attempt to understand the relationship between capital
structure and economic performance of the Italian large, medium and small firms in manufacturing
and services industry listed in Italian Stock Exchange in a period of 5 years (from 2007 to 2011).
Although there have been several researches on the relationship between capital structure and firm
performance, this paper is interesting by considering the particularity of the Italian firms and their
economic and environmental system. In this sense it is sufficient to consider three mainly aspects.
First, the Italian production is made up by small and medium firms run mostly family. Second, the
capital market is largely inefficient and profoundly bank-oriented. Third, there is a high corruption
and illegality at all level.
The paper is organized as follows. The Section-2 presents a review of literature. The Section-
3 discusses the research methodology by defining the data collection, the variables, the hypothesis
and the empirical analysis model. The Section-4 discuss empirical results. Finally Section-5
summarizes the finding of the research and concludes the discussion.
International Journal of Management (IJM), ISSN 0976 – 6502(Print), ISSN 0976 - 6510(Online),
Volume 5, Issue 3, March (2014), pp. 01-20 © IAEME
3
2. LITERATURE REVIEW
2.1. Capital structure theories The relationship between capital structure and firm’s performance is the subject of
considerable debate. It is focused on the question about the real existence of the “optimal” capital
structure as the mix of equity and debt that maximizes the firm’s market value.
The Modigliani-Miller’s theory (1958) is considered the starting point of the modern theory
of the capital structure. Based on strong restrictive assumptions structured on perfect capital market,
MM argued that capital structure choices has irrelevant both on the value of the firm than on its cost
of capital (Proposition I and II).
The MM’s Propositions was based on very restrictive assumptions and do not hold in the real
word. Over the years many theories and empirical researches have been developed by removing the
restrictions assumptions used by MM.
The introductions in the models of many variables lead to postulate the relevance of capital
structure on firm’s performance and its market value. Thus it is possible to postulate the existence of
“optimal” capital structure as the mix of equity and debt that minimizes the cost of capital while
maximizing firm's value.
The main theoretical models about capital structure are the trade-off, the agency costs and the
pecking order.
The trade-off theory (Kraus and Litzenberger, 1973) tries to find “optimal” capital structure
balancing benefits and costs of debt as derived by taxation and financial distress and bankruptcy
costs.
Taxation generates a positive effect of debt on firm performance in order to the tax shield.
They were just Modigliani and Miller (1963), in a subsequent paper, to revise their earlier
Propositions (1958) by incorporating corporate tax other Proposition’s assumptions fixed. They
argued that under capital market imperfection where interest rate on debt are tax deductible, firm
value increases with higher financial leverage. Miller (1977), in a subsequent further study,
introduces the personal tax imposed to individuals in addition to corporate taxation on the firm.
Based on USA tax legislation, Miller identifies three taxes rate that could impact on firm’s value in
order to the relative level and connections: corporate tax rate, shareholders tax rate (imposed on the
income of the dividends) and debholders tax rate (imposed on the income of interest inflows).
In presence of default risk, debt can generate financial distress and bankruptcy costs (Myers,
1984; 2001; Ross, 1977). The use of the debt, above certain levels, increase the operational and
financial risk of the firm, increasing its default probability and bankruptcy and reduce the firm’s
value. Thus it has a negative effect on firm performance and profitability (Johnson, 1997; Bradley et
al., 1984; Titman and Wessels, 1988; Friend and Lang, 1988; MacKie-Mason, 1990; Kale et al.,
1991; Kim et al., 1998; Jordan et al., 1998; Michaelas et al., 1999; Wald, 1999; Esperanca et al.,
2003).
The risk of financial distress is mainly due to the fact that firm might not be able to generate
enough profits to repay interest on debt and return back the debt. Greater is the earning volatility of
the firm, greater is the probability of reduction of the cash flow, greater is the probability of inability
of the firm to fulfil the commitments on debt. Firm with a high business risk has less capacity to
sustain financial risks and has to use less debt (Kim and Sorensen, 1986; Titman, 1984).
Trade-off theory claims that the optimal capital structure is the point at which the marginal cost of
debt, due its negative effects, is equal to its marginal benefits due to its positive effects. At this debt
level the levered firm value is maximized.
The agency costs theory can be use to investigate the effect of debt on performance of the
firm (Jensen and Meckling, 1976; Jensen, 1986).
International Journal of Management (IJM), ISSN 0976 – 6502(Print), ISSN 0976 - 6510(Online),
Volume 5, Issue 3, March (2014), pp. 01-20 © IAEME
4
Considering agency costs of equity and debt, the effect of debt on firm performance is non-unique.
Debt has positive effect on agency cost of equity reducing the conflicts between shareholders and
management due to difference in their utility functions, with consequently different behaviour,
targets, information and operating decisions. While the first want to maximize equity value, the
second have incentive to maximize firm value because it increases their control of the resources,
their power and their compensation. Debt has a discipline function for managers (Jensen, 1986)
because it increase the default risk in order to the cash-out relate debt payment, requiring to
maximize efficiency, thus increasing equity value (Amihud and Lev, 1981; Jensen, 1986; Friend and
Hasbrouck, 1988; Stulz, 1990; Harris and Raviv, 1990 and 1991; Bethel and Liebeskind, 1993;
Hoskisson et al., 1994; Bergh, 1995; Noe and Rebello, 1996; Lane et al., 1998).
On the contrary debt has a negative effect on agency cost of debt increasing the conflicts
between shareholders and debtholders in order to the different claims on the firm (Jensen, 1986).
Equity offers to holders residual claim on firm’s cash flow; debt offer to holders a fixed claim over a
borrowing firm’s cash flow. Thus, it is possible shareholders’ moral hazard and asset-substitutions
(Jensen and Meckling, 1976; Diamond, 1989; Harris and Raviv, 1991). Debtholder try to anticipate
the shareholder’s opportunistic behaviour by lending less debt or increasing its cost.
The packing order theory (Myers, 1984; Myers and Majluf, 1984; Fama and French, 1998 and 2002)
based on asymmetric information in a market and postulates a hierarchy of the finance sources and
not define a “optimal” capital structure.
In asymmetric information contest, insiders are assumed to possess private information about
the firm. The presence of private information influence the perception of the investors about the
firm’s risk with consequent impact on the cost of capital. Thus, the costs of finance vary among
different financial sources (Myers, 1977 and 1984; Brennan and Kraus, 1987; Noe, 1988;
Constantinides and Grundy, 1989; Rajan and Zingales, 1995; Chittenden et al., 1996; Abor, 2005).
The direction of the relationship between capital structure choices and asymmetric information is not
clear (Harris and Raviv, 1991). On one hand, it has been hypothesized that the capital structure
choices can mitigate inefficiencies in the firm’s investment policy due to asymmetric information
reducing over-under investment problems (Myers and Majluf 1984; Myers, 1984; Narayanan, 1988;
Heinkel and Zechner, 1990; Brennan and Kraus, 1987; Noe, 1988; Constantinides and Grundy,
1989). On the other hand, it has been hypothesized that the capital structure choices signals to
investors private information about firm perspectives reducing asymmetric information (Ross, 1977;
Leland and Pyle, 1977; Heinkel, 1982; Poitevin, 1989).
The pecking order theory does not define a “optimal” capital structure but assume that firm
defines its capital structure basing on a finance sources hierarchy.
The theory suggests that firm prefers internal sources of finance instead of external source.
Firm prefers first internal source of finance due to self-finance adapting the dividend policy (payout
ratio) to the investment opportunities. If external source of finance are required, the firm prefers to
resort first to the debt, then hybrid instruments and only finally to equity. Thus there are two kinds of
equity: internal, regarding self-financing, that is at the top of the packing order; external, regarding
the issue of new shares, that is at the bottom of the packing order.
2.2. Capital structure and economic performance of the firm The empirical researches have highlighted other determinants, in addition to the models, that
could affect the capital structure choices. Among these the main are profit, age, size, growth,
industry, asset structure, managerial characteristics and ownership, institutional and macroeconomic
environment of the firm. In this paper the attention was focused on the firm profitability by
investigating the relationship between capital structure choices and economic performance of the
firm.
International Journal of Management (IJM), ISSN 0976 – 6502(Print), ISSN 0976 - 6510(Online),
Volume 5, Issue 3, March (2014), pp. 01-20 © IAEME
5
This relationship was confirmed by several empirical researches although with discordant
results. Based on different point of view, some researches found a positive relationship between
firm's performance and its capital structure.
Roden and Lewell (1995) in a study of leveraged buyout transactions that took place in the
Unites State in a period 1981-1990, found evidence about a systemic relationship between the
proportion and the characteristics of the debt in the buyout financing package and the target firm’s
earnings rate, earnings variability, growth prospects, and its tax and liquidity position.
Nimalathasan and Valeriu (2010) in a study of 13 random selected on 31 listed manufacturing
companies in Sri Lanka for a period 2003-2007, found a positive relationship between capital
structure and firm’s profitability measured by gross profit ratio, operating profit ratio, net profit ratio
of the firm.
Majumdar and Sen (2010) in a study of Indian corporate firms in a period 1988-1993, found
that firms which rely on arm’s-length debt have better performance and are more likely to engage in
advertising and diversification than firms which rely on borrowing from institutional lenders such as
term-lending institutions.
On the contrary several studies found a negative relationship between capital structure and
firm performance.
Friend and Lang (1988) in a study of 984 firms listed in a New York Stock Exchange in a
period 1979-1983 in order to test whether capital structure choices are at least in part motivated by
managerial self interest, found that the level of debt is negatively related to the level of management
investment. Also they found that if the firm has large non-managerial investors, the average debt
ratio is significantly higher than in those with no principal stockholders.
Rajan and Zingales (1995), analysing the determinants of the capital structure choices of the
non-financial corporations of the G-7 countries in period 1987-1991, with regarding to the
relationship between debt and firm’s profitability, found a negative relationship. Similar conclusions
were found by Wald (1999) analysing the factors correlated with capital structure in different
countries.
Gleason, Mathur and Mathur (2000), in a study of 198 retailers in 14 European country
retailers for 1994, found a negative relationship between capital strucurre and firm’s performance
mainly due to agency conflict.
Booth, Aivazian, Demirguc-Kant and Maksimovic (2001), analysing the capital structure
choices of firms in 10 developing countries in comparison with developed countries, found a
negative relationship between debt and firm’s profitability.
Huang and Song (2006), analysing the determinants of capital structure choices of Chinese
listed company, found a negative relationship between debt and firm profitability.
Zeitun and Tian (2007), in a study of 167 Jordanian industrial firms (of which 47 were defaulted
firms in the following year) listed in Amman Stock Exchange in 16 sectors in a period 1989-2003,
found that a significantly negative relationship between capital structure and firm’s performance
measures in both the accounting and market measures.
Gi Shian Su and Hong Tam Vo (2010), in a study of listed firms in Vietnam, found a
significantly negative relationship between return on equity and debt ratio. They show that combined
effect of corporate strategy and capital structure explain well for the difference in firm performance.
Bistrova, Lace and Peleckiene (2011), in a study of 36 blue-chip firms listed on the Baltic Stock
Exchanges in a period 2007-2010, found that the firm pursues conservative capital management
policy. They found that firms having lower debt levels on their accounts are able to demonstrate
higher profitability. Thus, there is a negative relationship between debt and capital profitability.
Gupta, Srivastava and Sharma (2011), in a study of 100 firms listed on National Stock
Exchange of India in period 2006-2010, found a negatively correlation between firm performance
and financial leverage. The firm that has high profitability and good performance have less debt.
International Journal of Management (IJM), ISSN 0976 – 6502(Print), ISSN 0976 - 6510(Online),
Volume 5, Issue 3, March (2014), pp. 01-20 © IAEME
6
Muzir (2011), in a study based on 114 firms listed at the Istanbul Stock Exchange in a period
1994-2003, found that asset expansions through debt may contribute much to firms’ risk exposure in
spite of tax benefits expected especially during economic downturns.
Norvaisiene (2012) in a study of 70 non-financial listed Baltic firms (28 Lithuanian firms, 14
Estonian firms, 28 Latvian firms) for a period 2002-2011, found a negative correlation between debt
level and profitability indicators for Lithuanian and Estonian firms and absence of correlation for
Latvian firms. For firms in Baltic countries higher level of debt leads to lower profitability indicators
and lower current solvency.
Tsuji (2013), in a studies based on Japanese machinery industries firms listed on the Tokyo
Stock Exchange in a period 1981-2011, found a negative relationship between capital structure and
corporate profitability.
Still other empirical researches found contemporary negative and positive relationship
between capital structure and firm performance.
Siemrly and Li (2000), in a study of 700 large U.S. firms in a variety of industry contexts
integrating elements from agency theory and transaction cost economics with strategic management,
found that environmental dynamism moderate the relationship between leverage and performance of
the firm. Leverage produces either positive and negative effects on performance depending on
whether the firm is in stable or dynamic environments. Particularly the high leverage has a positive
impact on performance for firms in stable environments while a negative impact in dynamic
environments.
Mesquita and Lara (2003), in a study on 70 Brazilian firms, found a positive correlation
between short-term debt and firm profitability and a negative relationship between long-term debt
and firm profitability.
Abor (2005), in a study of 22 firms listed in Ghana Stock Exchange during the period 1998-
2002, found a positive relationship between total and short-term debt and firm’s profitability. On the
contrary the results show a significantly negative relationship between long-term debt and firm’s
profitability.
San and Heng (2011), in a study of 49 construction firms listed in Main Board of Bursa
Malaysia in a period 2005-2008, found a positive relationship between return on capital and debt to
equity market value and between earnings per share and long-term debt to capital and a negative
relationship between earnings per share and debt to capital for big firms. Also they found a positive
relationship between operating margin and long-term debt to common equity for medium firms.
Finally they found a negative relationship between earnings per share and debt to capital for small
firms.
Gill, Biger and Mathur (2011), in a study on 272 American service and manufacturing firms
listed on New York Stock Exchange for a period of 3 years (2005-2007), found a positive
relationship between total and short-term debt and profitability of the firm in a service industry. Also
they found a positive relationship between total, long-term and short-term debt and profitability of
the firm in manufacturing industry.
Salehi and Manesh (2012), in a study based on 59 firms listed in Tehran Stock Exchange
during a period 2004-2011, found a negative relationship between profitability and firm growth with
capital structure and a positive relationship between firm size, market size, gross domestic product
growth and inflation rate with capital structure.
3. RESEARCH METHODOLOGY
3.1. Data collection
A database was built from selected firms, manufacturing and service, listed in the three main
Index (FTSE Mib, FTSE Mid Cap, FTSE Small Cap) of Italian Stock Exchange in a period of 5
International Journal of Management (IJM), ISSN 0976 – 6502(Print), ISSN 0976 - 6510(Online),
Volume 5, Issue 3, March (2014), pp. 01-20 © IAEME
7
years (2007-2011). Financial, insurance and real estate firms were excluded. The peculiarity of their
operations, assets structure and liabilities could distort the analysis. Also firms listed after 2007 and
firms which had made extraordinary operations during the observation period were excluded. Firms
selected are 120 of which 79 are manufacturing firms and 41 are service firms.
In this research book value was used. Data was obtained from balance sheet. Despite the market
value expresses the real value of the firm, the book value was used for three main reasons. First, the
market value of the firm is difficult to determinate, subject to the market volatility and the data
choice by reference to the market value is arbitrary. Managers tend to think in term of book value
rather than market value because it is more easily accessible, more accurately recorded and not
subject to market volatility. Second, the measurement of the firm economic performance are usually
based on income statements and the book value measure of leverage is considerate as best proxy of
market value (Rajan and Zingales, 1995; Gupta et al., 2011). Finally, the main cost of debt is the
expected cost of financial distress in the event of bankruptcy. In a financial distress situation, the
value of the firm is near to its book value. Also if bankruptcy occurs, the accurate measure of
debtholders’ liability is the book value of debt and not its market value.
3.2. Variables
The relationship between capital structure and the economic performance of the firm was
investigated by assuming the first as independent variable and the second as dependent variable.
Financial debt was used to examine the capital structure choices. It was measured by using
three indicators: total financial debt to total assets (TFD), short-term financial debt to total assets
(SFD) and long-term financial debt to total assets (LFD).
Economic performance of the firm was measured by using three classic indicators: return on
equity (ROE), return on assets (ROA) and return on investments (ROI).
Three control variables were used: firm size (SF), sales growth (SG) and firm industry (IF).
The firm size variables was defined by using the Index of Stock Market as a proxy. Therefore
all firms included in FTSE Mib (the index includes the top 40 firms by size and liquidity) were
considered large firms (SF-L); similarly all firms includes in FTSE Mid Cap (the index includes the
other 60 firms – excluding firms in FTES Mib – grater size, liquidity and capitalization) were
considered medium firms (SF-M); and finally all firms includes in FTSE Small Cap (the index includes
the other firms – excluding firms in FTSE Mib and FTSE Mid Cap – that meeting the minimum
requirement of liquidity and capitalization) were considered as small firms (SF-S).
The sales growth variable was defined by the percentage variation in revenue per year.
The firm industry variable was defined by distinguishing all firms between manufacturing and
service industry. Therefore it was assigned value one to manufacturing firm (IF(1)) and value zero to
service firms (IF(0)).
3.3. Hypothesis and empirical analysis model
The aim of the paper is to investigate the relationship between financial debt, as a proxy of
capital structure choices and measured by TFD, LFD, SFD, and economic performance, measured by
ROE, ROA and ROI, for large, medium and small firms in manufacturing and service industry.
The basic hypothesis was that financial debt has effects (positive or negative) on the
economic performance of the firm.
This basic hypothesis can be explicated for the large, medium, small manufacturing and
service firms as following:
Hp 1: There is a significant relationship between economic performance (measured by ROE, ROA
and ROI) and the financial debt (measured by TFD, LFD, and SFD) in the large, medium and small
manufacturing firms;
International Journal of Management (IJM), ISSN 0976 – 6502(Print), ISSN 0976 - 6510(Online),
Volume 5, Issue 3, March (2014), pp. 01-20 © IAEME
8
Hp 2: There is a significant relationship between economic performance (measured by ROE, ROA
and ROI) and the financial debt (measured by TFD, LFD, and SFD) in the large, medium and small
service firms.
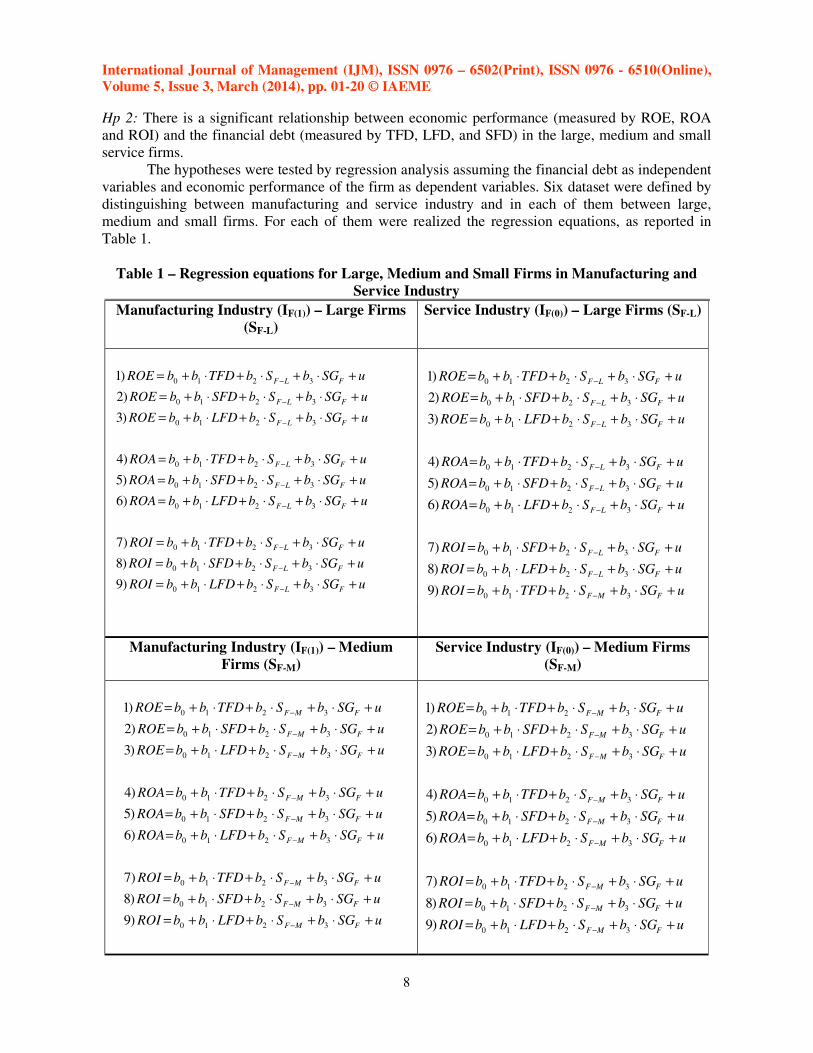
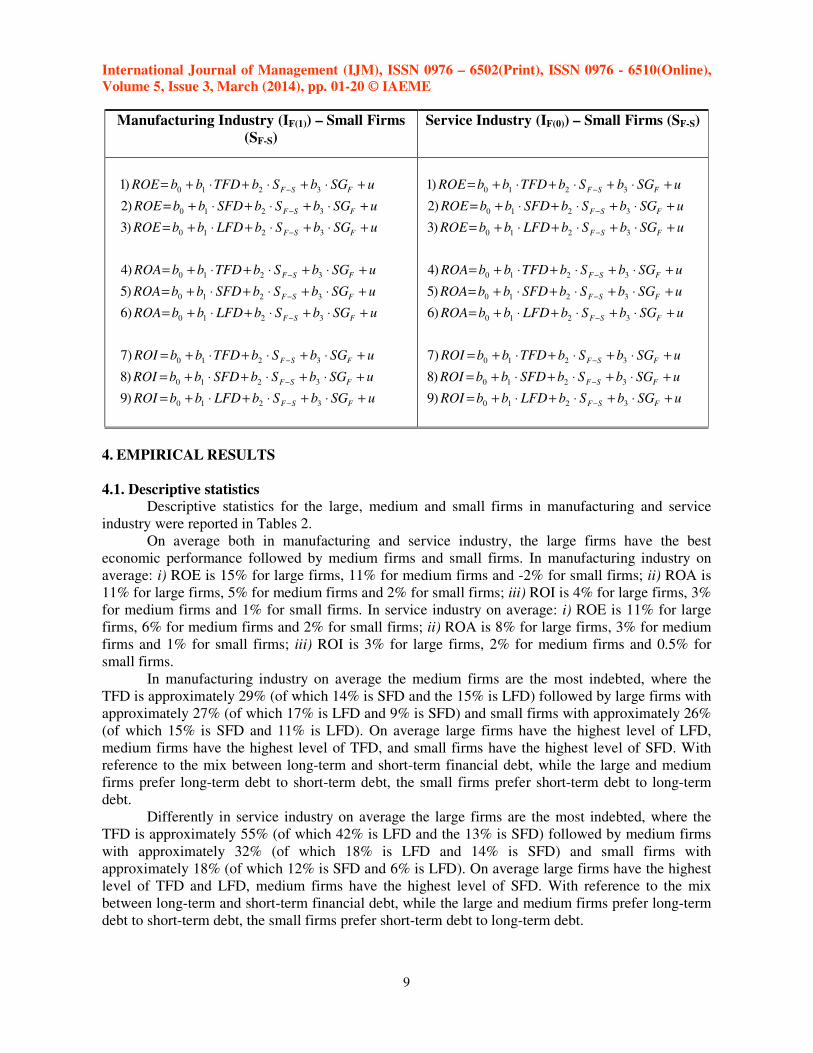
The hypotheses were tested by regression analysis assuming the financial debt as independent
variables and economic performance of the firm as dependent variables. Six dataset were defined by
distinguishing between manufacturing and service industry and in each of them between large,
medium and small firms. For each of them were realized the regression equations, as reported in
Table 1.
Table 1 – Regression equations for Large, Medium and Small Firms in Manufacturing and
Service Industry
Manufacturing Industry (IF(1)) – Large Firms
(SF-L)
Service Industry (IF(0)) – Large Firms (SF-L)
uSGbSbLFDbbROI
uSGbSbSFDbbROI
uSGbSbTFDbbROI
uSGbSbLFDbbROA
uSGbSbSFDbbROA
uSGbSbTFDbbROA
uSGbSbLFDbbROE
uSGbSbSFDbbROE
uSGbSbTFDbbROE
FLF
FLF
FLF
FLF
FLF
FLF
FLF
FLF
FLF
+⋅+⋅+⋅+=
+⋅+⋅+⋅+=
+⋅+⋅+⋅+=
+⋅+⋅+⋅+=
+⋅+⋅+⋅+=
+⋅+⋅+⋅+=
+⋅+⋅+⋅+=
+⋅+⋅+⋅+=
+⋅+⋅+⋅+=
−
−
−
−
−
−
−
−
−
3210
3210
3210
3210
3210
3210
3210
3210
3210
)9
)8
)7
)6
)5
)4
)3
)2
)1
uSGbSbTFDbbROI
uSGbSbLFDbbROI
uSGbSbSFDbbROI
uSGbSbLFDbbROA
uSGbSbSFDbbROA
uSGbSbTFDbbROA
uSGbSbLFDbbROE
uSGbSbSFDbbROE
uSGbSbTFDbbROE
FMF
FLF
FLF
FLF
FLF
FLF
FLF
FLF
FLF
+⋅+⋅+⋅+=
+⋅+⋅+⋅+=
+⋅+⋅+⋅+=
+⋅+⋅+⋅+=
+⋅+⋅+⋅+=
+⋅+⋅+⋅+=
+⋅+⋅+⋅+=
+⋅+⋅+⋅+=
+⋅+⋅+⋅+=
−
−
−
−
−
−
−
−
−
3210
3210
3210
3210
3210
3210
3210
3210
3210
)9
)8
)7
)6
)5
)4
)3
)2
)1
Manufacturing Industry (IF(1)) – Medium
Firms (SF-M)
Service Industry (IF(0)) – Medium Firms
(SF-M)
uSGbSbLFDbbROI
uSGbSbSFDbbROI
uSGbSbTFDbbROI
uSGbSbLFDbbROA
uSGbSbSFDbbROA
uSGbSbTFDbbROA
uSGbSbLFDbbROE
uSGbSbSFDbbROE
uSGbSbTFDbbROE
FMF
FMF
FMF
FMF
FMF
FMF
FMF
FMF
FMF
+⋅+⋅+⋅+=
+⋅+⋅+⋅+=
+⋅+⋅+⋅+=
+⋅+⋅+⋅+=
+⋅+⋅+⋅+=
+⋅+⋅+⋅+=
+⋅+⋅+⋅+=
+⋅+⋅+⋅+=
+⋅+⋅+⋅+=
−
−
−
−
−
−
−
−
−
3210
3210
3210
3210
3210
3210
3210
3210
3210
)9
)8
)7
)6
)5
)4
)3
)2
)1
International Journal of Management (IJM), ISSN 0976 – 6502(Print), ISSN 0976 - 6510(Online),
Volume 5, Issue 3, March (2014), pp. 01-20 © IAEME
9
Manufacturing Industry (IF(1)) – Small Firms
(SF-S)
Service Industry (IF(0)) – Small Firms (SF-S)
uSGbSbLFDbbROI
uSGbSbSFDbbROI
uSGbSbTFDbbROI
uSGbSbLFDbbROA
uSGbSbSFDbbROA
uSGbSbTFDbbROA
uSGbSbLFDbbROE
uSGbSbSFDbbROE
uSGbSbTFDbbROE
FSF
FSF
FSF
FSF
FSF
FSF
FSF
FSF
FSF
+⋅+⋅+⋅+=
+⋅+⋅+⋅+=
+⋅+⋅+⋅+=
+⋅+⋅+⋅+=
+⋅+⋅+⋅+=
+⋅+⋅+⋅+=
+⋅+⋅+⋅+=
+⋅+⋅+⋅+=
+⋅+⋅+⋅+=
−
−
−
−
−
−
−
−
−
3210
3210
3210
3210
3210
3210
3210
3210
3210
)9
)8
)7
)6
)5
)4
)3
)2
)1
4. EMPIRICAL RESULTS
4.1. Descriptive statistics
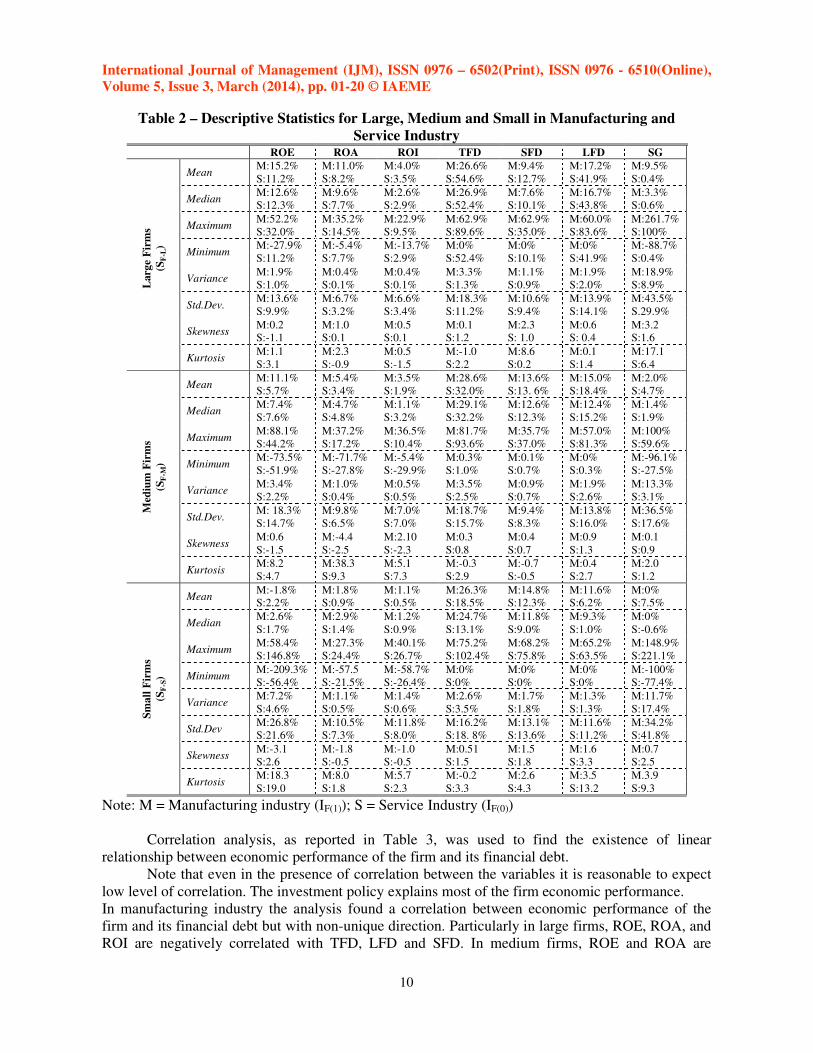
Descriptive statistics for the large, medium and small firms in manufacturing and service
industry were reported in Tables 2.
On average both in manufacturing and service industry, the large firms have the best
economic performance followed by medium firms and small firms. In manufacturing industry on
average: i) ROE is 15% for large firms, 11% for medium firms and -2% for small firms; ii) ROA is
11% for large firms, 5% for medium firms and 2% for small firms; iii) ROI is 4% for large firms, 3%
for medium firms and 1% for small firms. In service industry on average: i) ROE is 11% for large
firms, 6% for medium firms and 2% for small firms; ii) ROA is 8% for large firms, 3% for medium
firms and 1% for small firms; iii) ROI is 3% for large firms, 2% for medium firms and 0.5% for
small firms.
In manufacturing industry on average the medium firms are the most indebted, where the
TFD is approximately 29% (of which 14% is SFD and the 15% is LFD) followed by large firms with
approximately 27% (of which 17% is LFD and 9% is SFD) and small firms with approximately 26%
(of which 15% is SFD and 11% is LFD). On average large firms have the highest level of LFD,
medium firms have the highest level of TFD, and small firms have the highest level of SFD. With
reference to the mix between long-term and short-term financial debt, while the large and medium
firms prefer long-term debt to short-term debt, the small firms prefer short-term debt to long-term
debt.
Differently in service industry on average the large firms are the most indebted, where the
TFD is approximately 55% (of which 42% is LFD and the 13% is SFD) followed by medium firms
with approximately 32% (of which 18% is LFD and 14% is SFD) and small firms with
approximately 18% (of which 12% is SFD and 6% is LFD). On average large firms have the highest
level of TFD and LFD, medium firms have the highest level of SFD. With reference to the mix
between long-term and short-term financial debt, while the large and medium firms prefer long-term
debt to short-term debt, the small firms prefer short-term debt to long-term debt.
International Journal of Management (IJM), ISSN 0976 – 6502(Print), ISSN 0976 - 6510(Online),
Volume 5, Issue 3, March (2014), pp. 01-20 © IAEME
10
Table 2 – Descriptive Statistics for Large, Medium and Small in Manufacturing and
Service Industry
ROE ROA ROI TFD SFD LFD SG L
arg
e F
irm
s
(SF
-L)
Mean M:15.2% M:11.0% M:4.0% M:26.6% M:9.4% M:17.2% M:9.5%
S:11.2% S:8.2% S:3.5% S:54.6% S:12.7% S:41.9% S:0.4%
Median M:12.6% M:9.6% M:2.6% M:26.9% M:7.6% M:16.7% M:3.3%
S:12.3% S:7.7% S:2.9% S:52.4% S:10.1% S:43.8% S:0.6%
Maximum M:52.2% M:35.2% M:22.9% M:62.9% M:62.9% M:60.0% M:261.7%
S:32.0% S:14.5% S:9.5% S:89.6% S:35.0% S:83.6% S:100%
Minimum M:-27.9% M:-5.4% M:-13.7% M:0% M:0% M:0% M:-88.7%
S:11.2% S:7.7% S:2.9% S:52.4% S:10.1% S:41.9% S:0.4%
Variance M:1.9% M:0.4% M:0.4% M:3.3% M:1.1% M:1.9% M:18.9%
S:1.0% S:0.1% S:0.1% S:1.3% S:0.9% S:2.0% S:8.9%
Std.Dev. M:13.6% M:6.7% M:6.6% M:18.3% M:10.6% M:13.9% M:43.5%
S:9.9% S:3.2% S:3.4% S:11.2% S:9.4% S:14.1% S.29.9%
Skewness M:0.2 M:1.0 M:0.5 M:0.1 M:2.3 M:0.6 M:3.2
S:-1.1 S:0.1 S:0.1 S:1.2 S: 1.0 S: 0.4 S:1.6
Kurtosis M:1.1 M:2.3 M:0.5 M:-1.0 M:8.6 M:0.1 M:17.1
S:3.1 S:-0.9 S:-1.5 S:2.2 S:0.2 S:1.4 S:6.4
Med
ium
Fir
ms
(SF
-M)
Mean M:11.1% M:5.4% M:3.5% M:28.6% M:13.6% M:15.0% M:2.0%
S:5.7% S:3.4% S:1.9% S:32.0% S:13. 6% S:18.4% S:4.7%
Median M:7.4% M:4.7% M:1.1% M:29.1% M:12.6% M:12.4% M:1.4%
S:7.6% S:4.8% S:3.2% S:32.2% S:12.3% S:15.2% S:1.9%
Maximum M:88.1% M:37.2% M:36.5% M:81.7% M:35.7% M:57.0% M:100%
S:44.2% S:17.2% S:10.4% S:93.6% S:37.0% S:81.3% S:59.6%
Minimum M:-73.5% M:-71.7% M:-5.4% M:0.3% M:0.1% M:0% M:-96.1%
S:-51.9% S:-27.8% S:-29.9% S:1.0% S:0.7% S:0.3% S:-27.5%
Variance M:3.4% M:1.0% M:0.5% M:3.5% M:0.9% M:1.9% M:13.3%
S:2.2% S:0.4% S:0.5% S:2.5% S:0.7% S:2.6% S:3.1%
Std.Dev. M: 18.3% M:9.8% M:7.0% M:18.7% M:9.4% M:13.8% M:36.5%
S:14.7% S:6.5% S:7.0% S:15.7% S:8.3% S:16.0% S:17.6%
Skewness M:0.6 M:-4.4 M:2.10 M:0.3 M:0.4 M:0.9 M:0.1
S:-1.5 S:-2.5 S:-2.3 S:0.8 S:0.7 S:1.3 S:0.9
Kurtosis M:8.2 M:38.3 M:5.1 M:-0.3 M:-0.7 M:0.4 M:2.0
S:4.7 S:9.3 S:7.3 S:2.9 S:-0.5 S:2.7 S:1.2
Sm
all
Fir
ms
(SF
-S)
Mean M:-1.8% M:1.8% M:1.1% M:26.3% M:14.8% M:11.6% M:0%
S:2.2% S:0.9% S:0.5% S:18.5% S:12.3% S:6.2% S:7.5%
Median M:2.6% M:2.9% M:1.2% M:24.7% M:11.8% M:9.3% M:0%
S:1.7% S:1.4% S:0.9% S:13.1% S:9.0% S:1.0% S:-0.6%
Maximum M:58.4% M:27.3% M:40.1% M:75.2% M:68.2% M:65.2% M:148.9%
S:146.8% S:24.4% S:26.7% S:102.4% S:75.8% S:63.5% S:221.1%
Minimum M:-209.3% M:-57.5 M:-58.7% M:0% M:0% M:0% M:-100%
S:-56.4% S:-21.5% S:-26.4% S:0% S:0% S:0% S:-77.4%
Variance M:7.2% M:1.1% M:1.4% M:2.6% M:1.7% M:1.3% M:11.7%
S:4.6% S:0.5% S:0.6% S:3.5% S:1.8% S:1.3% S:17.4%
Std.Dev M:26.8% M:10.5% M:11.8% M:16.2% M:13.1% M:11.6% M:34.2%
S:21.6% S:7.3% S:8.0% S:18. 8% S:13.6% S:11.2% S:41.8%
Skewness M:-3.1 M:-1.8 M:-1.0 M:0.51 M:1.5 M:1.6 M:0.7
S:2.6 S:-0.5 S:-0.5 S:1.5 S:1.8 S:3.3 S:2.5
Kurtosis M:18.3 M:8.0 M:5.7 M:-0.2 M:2.6 M:3.5 M.3.9
S:19.0 S:1.8 S:2.3 S:3.3 S:4.3 S:13.2 S:9.3
Note: M = Manufacturing industry (IF(1)); S = Service Industry (IF(0))
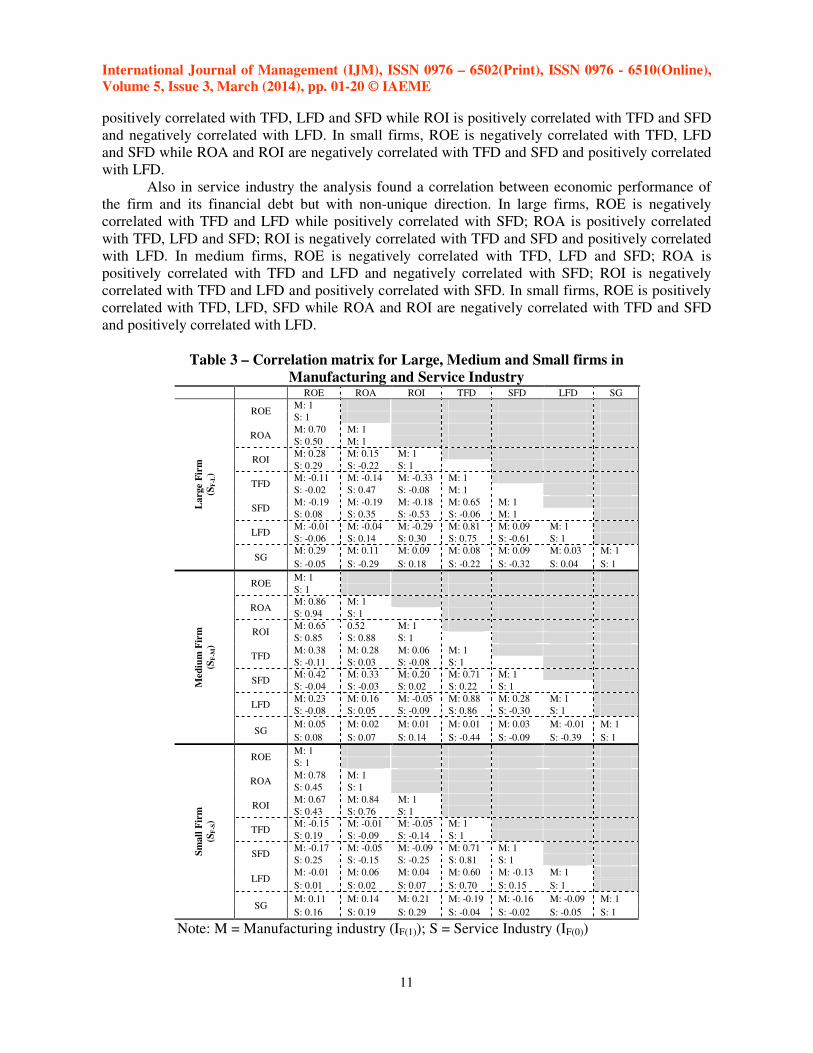
Correlation analysis, as reported in Table 3, was used to find the existence of linear
relationship between economic performance of the firm and its financial debt.
Note that even in the presence of correlation between the variables it is reasonable to expect
low level of correlation. The investment policy explains most of the firm economic performance.
In manufacturing industry the analysis found a correlation between economic performance of the
firm and its financial debt but with non-unique direction. Particularly in large firms, ROE, ROA, and
ROI are negatively correlated with TFD, LFD and SFD. In medium firms, ROE and ROA are
International Journal of Management (IJM), ISSN 0976 – 6502(Print), ISSN 0976 - 6510(Online),
Volume 5, Issue 3, March (2014), pp. 01-20 © IAEME
11
positively correlated with TFD, LFD and SFD while ROI is positively correlated with TFD and SFD
and negatively correlated with LFD. In small firms, ROE is negatively correlated with TFD, LFD
and SFD while ROA and ROI are negatively correlated with TFD and SFD and positively correlated
with LFD.
Also in service industry the analysis found a correlation between economic performance of
the firm and its financial debt but with non-unique direction. In large firms, ROE is negatively
correlated with TFD and LFD while positively correlated with SFD; ROA is positively correlated
with TFD, LFD and SFD; ROI is negatively correlated with TFD and SFD and positively correlated
with LFD. In medium firms, ROE is negatively correlated with TFD, LFD and SFD; ROA is
positively correlated with TFD and LFD and negatively correlated with SFD; ROI is negatively
correlated with TFD and LFD and positively correlated with SFD. In small firms, ROE is positively
correlated with TFD, LFD, SFD while ROA and ROI are negatively correlated with TFD and SFD
and positively correlated with LFD.
Table 3 – Correlation matrix for Large, Medium and Small firms in
Manufacturing and Service Industry
ROE ROA ROI TFD SFD LFD SG
Larg
e F
irm
(SF
-L)
ROE M: 1
S: 1
ROA M: 0.70 M: 1
S: 0.50 M: 1
ROI M: 0.28 M: 0.15 M: 1
S: 0.29 S: -0.22 S: 1
TFD M: -0.11 M: -0.14 M: -0.33 M: 1
S: -0.02 S: 0.47 S: -0.08 M: 1
SFD M: -0.19 M: -0.19 M: -0.18 M: 0.65 M: 1
S: 0.08 S: 0.35 S: -0.53 S: -0.06 M: 1
LFD M: -0.01 M: -0.04 M: -0.29 M: 0.81 M: 0.09 M: 1
S: -0.06 S: 0.14 S: 0.30 S: 0.75 S: -0.61 S: 1
SG M: 0.29 M: 0.11 M: 0.09 M: 0.08 M: 0.09 M: 0.03 M: 1
S: -0.05 S: -0.29 S: 0.18 S: -0.22 S: -0.32 S: 0.04 S: 1
Med
ium
Fir
m
(SF
-M)
ROE M: 1
S: 1
ROA M: 0.86 M: 1
S: 0.94 S: 1
ROI M: 0.65 0.52 M: 1
S: 0.85 S: 0.88 S: 1
TFD M: 0.38 M: 0.28 M: 0.06 M: 1
S: -0.11 S: 0.03 S: -0.08 S: 1
SFD M: 0.42 M: 0.33 M: 0.20 M: 0.71 M: 1
S: -0.04 S: -0.03 S: 0.02 S: 0.22 S: 1
LFD M: 0.23 M: 0.16 M: -0.05 M: 0.88 M: 0.28 M: 1
S: -0.08 S: 0.05 S: -0.09 S: 0.86 S: -0.30 S: 1
SG M: 0.05 M: 0.02 M: 0.01 M: 0.01 M: 0.03 M: -0.01 M: 1
S: 0.08 S: 0.07 S: 0.14 S: -0.44 S: -0.09 S: -0.39 S: 1
Sm
all
Fir
m
(SF
-S)
ROE M: 1
S: 1
ROA M: 0.78 M: 1
S: 0.45 S: 1
ROI M: 0.67 M: 0.84 M: 1
S: 0.43 S: 0.76 S: 1
TFD M: -0.15 M: -0.01 M: -0.05 M: 1
S: 0.19 S: -0.09 S: -0.14 S: 1
SFD M: -0.17 M: -0.05 M: -0.09 M: 0.71 M: 1
S: 0.25 S: -0.15 S: -0.25 S: 0.81 S: 1
LFD M: -0.01 M: 0.06 M: 0.04 M: 0.60 M: -0.13 M: 1
S: 0.01 S: 0.02 S: 0.07 S: 0.70 S: 0.15 S: 1
SG M: 0.11 M: 0.14 M: 0.21 M: -0.19 M: -0.16 M: -0.09 M: 1
S: 0.16 S: 0.19 S: 0.29 S: -0.04 S: -0.02 S: -0.05 S: 1
Note: M = Manufacturing industry (IF(1)); S = Service Industry (IF(0))
International Journal of Management (IJM), ISSN 0976 – 6502(Print), ISSN 0976 - 6510(Online),
Volume 5, Issue 3, March (2014), pp. 01-20 © IAEME
12
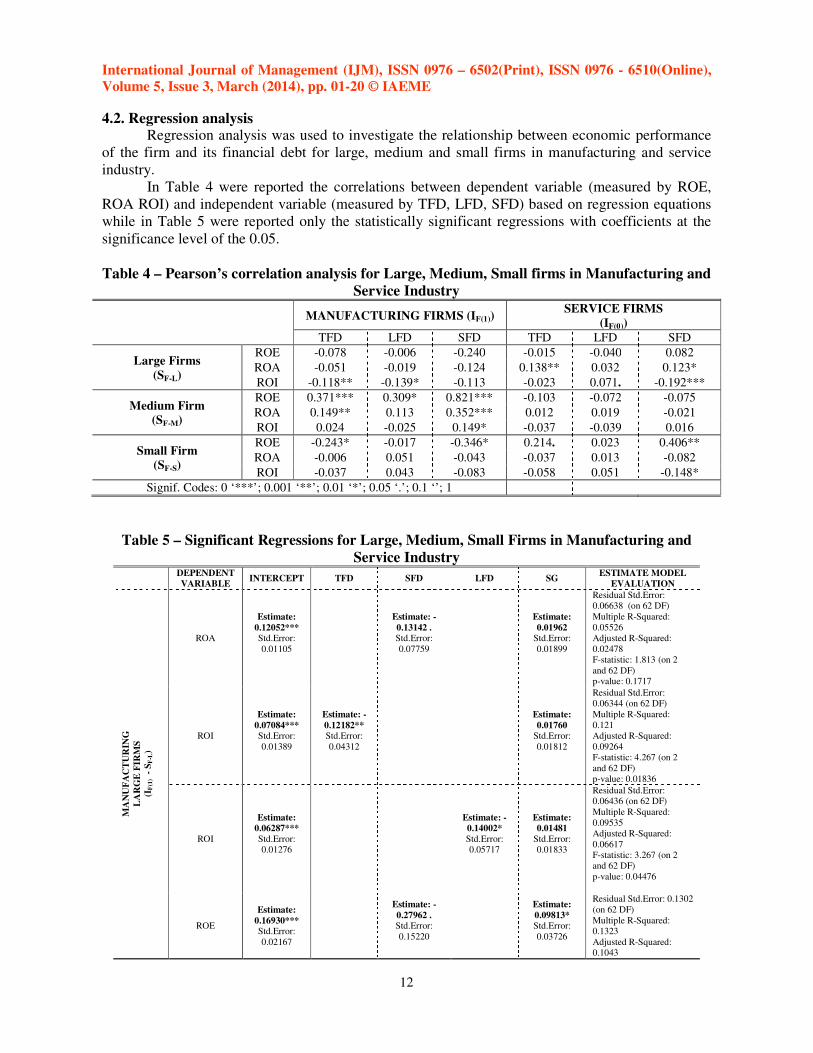
4.2. Regression analysis Regression analysis was used to investigate the relationship between economic performance
of the firm and its financial debt for large, medium and small firms in manufacturing and service
industry.
In Table 4 were reported the correlations between dependent variable (measured by ROE,
ROA ROI) and independent variable (measured by TFD, LFD, SFD) based on regression equations
while in Table 5 were reported only the statistically significant regressions with coefficients at the
significance level of the 0.05.
Table 4 – Pearson’s correlation analysis for Large, Medium, Small firms in Manufacturing and
Service Industry
MANUFACTURING FIRMS (IF(1))
SERVICE FIRMS
(IF(0))
TFD LFD SFD TFD LFD SFD
Large Firms
(SF-L)
ROE -0.078 -0.006 -0.240 -0.015 -0.040 0.082
ROA -0.051 -0.019 -0.124 0.138** 0.032 0.123*
ROI -0.118** -0.139* -0.113 -0.023 0.071. -0.192***
Medium Firm
(SF-M)
ROE 0.371*** 0.309* 0.821*** -0.103 -0.072 -0.075
ROA 0.149** 0.113 0.352*** 0.012 0.019 -0.021
ROI 0.024 -0.025 0.149* -0.037 -0.039 0.016
Small Firm
(SF-S)
ROE -0.243* -0.017 -0.346* 0.214. 0.023 0.406**
ROA -0.006 0.051 -0.043 -0.037 0.013 -0.082
ROI -0.037 0.043 -0.083 -0.058 0.051 -0.148*
Signif. Codes: 0 ‘***’; 0.001 ‘**’; 0.01 ‘*’; 0.05 ‘.’; 0.1 ‘’; 1
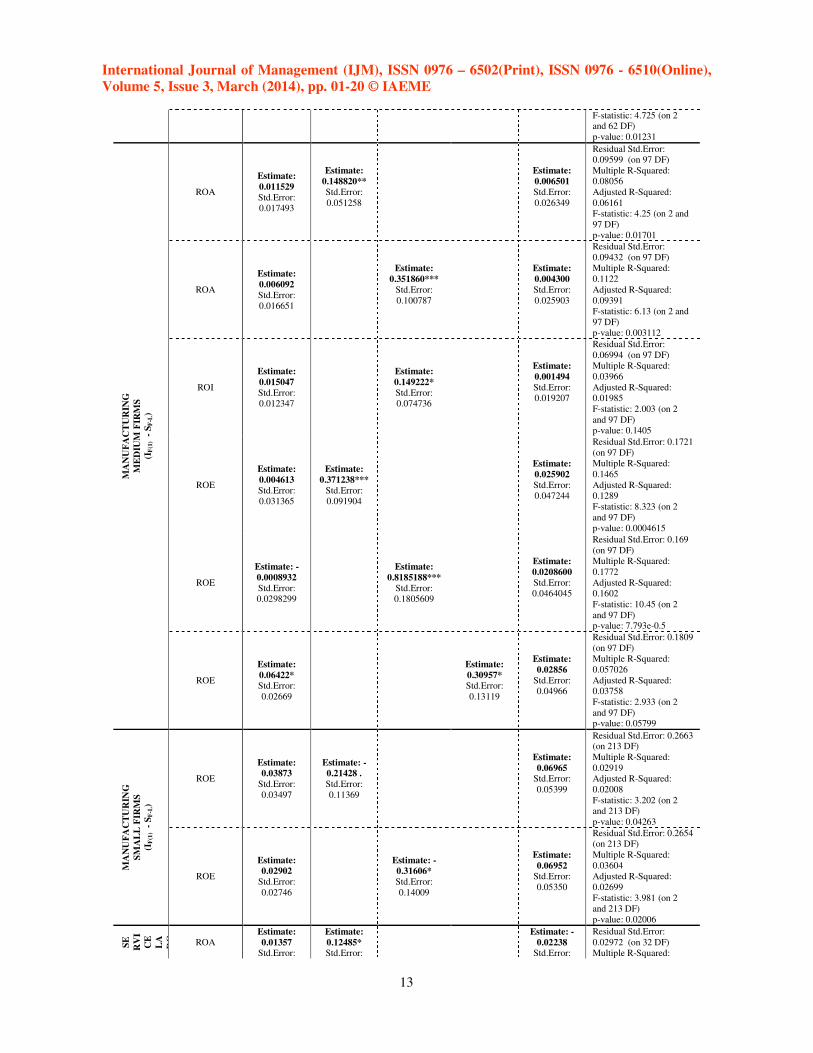
Table 5 – Significant Regressions for Large, Medium, Small Firms in Manufacturing and
Service Industry
DEPENDENT
VARIABLE INTERCEPT TFD SFD LFD SG
ESTIMATE MODEL
EVALUATION
MA
NU
FA
CT
UR
ING
LA
RG
E F
IRM
S
(IF
(1) -
SF
-L)
ROA
Estimate:
0.12052*** Std.Error:
0.01105
Estimate: -
0.13142 . Std.Error:
0.07759
Estimate:
0.01962 Std.Error:
0.01899
Residual Std.Error: 0.06638 (on 62 DF)
Multiple R-Squared:
0.05526 Adjusted R-Squared:
0.02478 F-statistic: 1.813 (on 2
and 62 DF) p-value: 0.1717
ROI
Estimate:
0.07084*** Std.Error:
0.01389
Estimate: -
0.12182** Std.Error:
0.04312
Estimate:
0.01760 Std.Error:
0.01812
Residual Std.Error: 0.06344 (on 62 DF)
Multiple R-Squared:
0.121 Adjusted R-Squared:
0.09264 F-statistic: 4.267 (on 2
and 62 DF) p-value: 0.01836
ROI
Estimate:
0.06287***
Std.Error: 0.01276
Estimate: -
0.14002*
Std.Error: 0.05717
Estimate:
0.01481
Std.Error: 0.01833
Residual Std.Error: 0.06436 (on 62 DF)
Multiple R-Squared:
0.09535 Adjusted R-Squared:
0.06617 F-statistic: 3.267 (on 2 and 62 DF)
p-value: 0.04476
ROE
Estimate:
0.16930*** Std.Error:
0.02167
Estimate: -
0.27962 . Std.Error:
0.15220
Estimate:
0.09813* Std.Error:
0.03726
Residual Std.Error: 0.1302
(on 62 DF)
Multiple R-Squared: 0.1323
Adjusted R-Squared: 0.1043
International Journal of Management (IJM), ISSN 0976 – 6502(Print), ISSN 0976 - 6510(Online),
Volume 5, Issue 3, March (2014), pp. 01-20 © IAEME
13
F-statistic: 4.725 (on 2 and 62 DF)
p-value: 0.01231
MA
NU
FA
CT
UR
ING
ME
DIU
M F
IRM
S
(IF
(1) -
SF
-L)
ROA
Estimate:
0.011529
Std.Error: 0.017493
Estimate:
0.148820**
Std.Error:
0.051258
Estimate:
0.006501
Std.Error:
0.026349
Residual Std.Error: 0.09599 (on 97 DF)
Multiple R-Squared: 0.08056
Adjusted R-Squared:
0.06161 F-statistic: 4.25 (on 2 and
97 DF) p-value: 0.01701
ROA
Estimate:
0.006092
Std.Error: 0.016651
Estimate:
0.351860***
Std.Error:
0.100787
Estimate:
0.004300
Std.Error:
0.025903
Residual Std.Error:
0.09432 (on 97 DF) Multiple R-Squared:
0.1122
Adjusted R-Squared:
0.09391 F-statistic: 6.13 (on 2 and
97 DF) p-value: 0.003112
ROI
Estimate:
0.015047
Std.Error: 0.012347
Estimate:
0.149222*
Std.Error: 0.074736
Estimate:
0.001494
Std.Error: 0.019207
Residual Std.Error:
0.06994 (on 97 DF) Multiple R-Squared:
0.03966
Adjusted R-Squared: 0.01985
F-statistic: 2.003 (on 2
and 97 DF) p-value: 0.1405
ROE
Estimate:
0.004613
Std.Error: 0.031365
Estimate:
0.371238***
Std.Error: 0.091904
Estimate:
0.025902
Std.Error: 0.047244
Residual Std.Error: 0.1721
(on 97 DF) Multiple R-Squared:
0.1465
Adjusted R-Squared: 0.1289
F-statistic: 8.323 (on 2
and 97 DF) p-value: 0.0004615
ROE
Estimate: -
0.0008932
Std.Error: 0.0298299
Estimate:
0.8185188***
Std.Error: 0.1805609
Estimate:
0.0208600
Std.Error: 0.0464045
Residual Std.Error: 0.169
(on 97 DF) Multiple R-Squared:
0.1772
Adjusted R-Squared: 0.1602
F-statistic: 10.45 (on 2
and 97 DF) p-value: 7.793e-0.5
ROE
Estimate:
0.06422* Std.Error:
0.02669
Estimate:
0.30957* Std.Error:
0.13119
Estimate:
0.02856
Std.Error: 0.04966
Residual Std.Error: 0.1809
(on 97 DF) Multiple R-Squared:
0.057026
Adjusted R-Squared: 0.03758
F-statistic: 2.933 (on 2
and 97 DF) p-value: 0.05799
MA
NU
FA
CT
UR
ING
SM
AL
L F
IRM
S
(IF
(1) -
SF
-L)
ROE
Estimate:
0.03873
Std.Error:
0.03497
Estimate: -
0.21428 .
Std.Error:
0.11369
Estimate:
0.06965 Std.Error:
0.05399
Residual Std.Error: 0.2663 (on 213 DF)
Multiple R-Squared:
0.02919 Adjusted R-Squared:
0.02008
F-statistic: 3.202 (on 2 and 213 DF)
p-value: 0.04263
ROE
Estimate:
0.02902
Std.Error:
0.02746
Estimate: -
0.31606*
Std.Error:
0.14009
Estimate:
0.06952 Std.Error:
0.05350
Residual Std.Error: 0.2654 (on 213 DF)
Multiple R-Squared:
0.03604 Adjusted R-Squared:
0.02699
F-statistic: 3.981 (on 2 and 213 DF)
p-value: 0.02006
SE
RV
I
CE
LA
RG ROA
Estimate:
0.01357 Std.Error:
Estimate:
0.12485* Std.Error:
Estimate: -
0.02238 Std.Error:
Residual Std.Error:
0.02972 (on 32 DF) Multiple R-Squared:
International Journal of Management (IJM), ISSN 0976 – 6502(Print), ISSN 0976 - 6510(Online),
Volume 5, Issue 3, March (2014), pp. 01-20 © IAEME
14
0.02562 0.04594 0.01724
0.2579
Adjusted R-Squared: 0.2115 F-statistic: 5.56 (on 2 and
32 DF)
p-value: 0.008461
ROI
Estimate:
0.058905***
Std.Error: 0.008812
Estimate: -
0.190478**
Std.Error: 0.056868
Estimate:
0.001585
Std.Error: 0.017947
Residual Std.Error: 0.03
(on 32 DF)
Multiple R-Squared: 0.2848
Adjusted R-Squared: 0.2401 F-statistic: 6.371 (on 2
and 32 DF)
p-value: 0.004689
ROI
Estimate:
0.00558
Std.Error: 0.017562
Estimate:
0.069704 .
Std.Error: 0.039698
Estimate:
0.019470
Std.Error: 0.018876
Residual Std.Error: 0.0333
(on 32 DF)
Multiple R-Squared: 0.1189
Adjusted R-Squared: 0.06384 F-statistic: 2.159 (on 2
and 32 DF)
p-value: 0.1319
SE
RV
ICE
SM
AL
L F
IRM
S
(IF
(1) -
SF
-L)
ROI
Estimate:
0.01829 . Std.Error:
0.01004
Estimate: -
0.14556**
Std.Error: 0.05428
Estimate:
0.05505**
Std.Error: 0.01758
Residual Std.Error:
0.07522 (on 102 DF) Multiple R-Squared:
0.1446
Adjusted R-Squared: 0.1278 F-statistic: 8.622 (on 2
and 102 DF) p-value: 0.0003472
ROE
Estimate: -
0.02492 Std.Error:
0.02931
Estimate:
0.22147*
Std.Error: 0.10999
Estimate:
0.08594 .
Std.Error: 0.04950
Residual Std.Error: 0.2116 (on 102DF)
Multiple R-Squared:
0.06268
Adjusted R-Squared: 0.0443 F-statistic: 3.411 (on 2
and 102 DF) p-value: 0.03683
ROE
Estimate: -
0.03436 Std.Error:
0.02780
Estimate:
0.40952** Std.Error:
0.15036
Estimate:
0.08424 . Std.Error:
0.04871
Residual Std.Error: 0.2083 (on 102 DF)
Multiple R-Squared:
0.0915 Adjusted R-Squared:
0.07368 F-statistic: 5.136 (on 2
and 102 DF) p-value: 0.007493
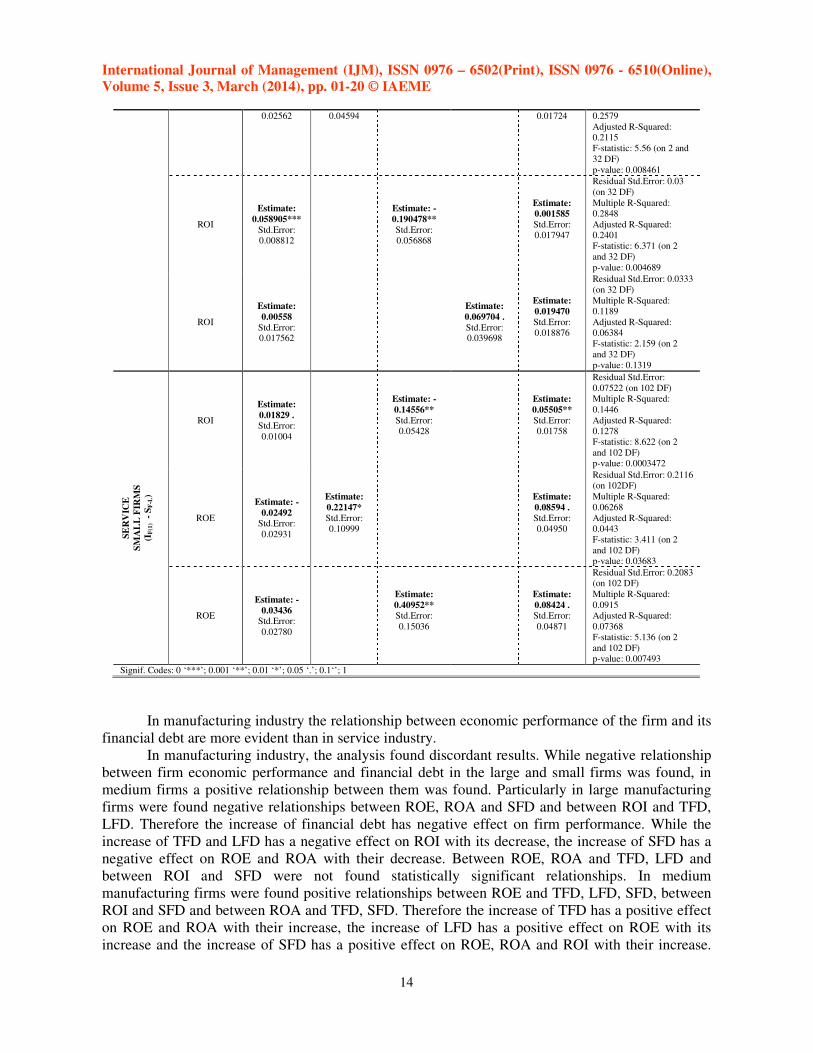
Signif. Codes: 0 ‘***’; 0.001 ‘**’; 0.01 ‘*’; 0.05 ‘.’; 0.1‘’; 1
In manufacturing industry the relationship between economic performance of the firm and its
financial debt are more evident than in service industry.
In manufacturing industry, the analysis found discordant results. While negative relationship
between firm economic performance and financial debt in the large and small firms was found, in
medium firms a positive relationship between them was found. Particularly in large manufacturing
firms were found negative relationships between ROE, ROA and SFD and between ROI and TFD,
LFD. Therefore the increase of financial debt has negative effect on firm performance. While the
increase of TFD and LFD has a negative effect on ROI with its decrease, the increase of SFD has a
negative effect on ROE and ROA with their decrease. Between ROE, ROA and TFD, LFD and
between ROI and SFD were not found statistically significant relationships. In medium
manufacturing firms were found positive relationships between ROE and TFD, LFD, SFD, between
ROI and SFD and between ROA and TFD, SFD. Therefore the increase of TFD has a positive effect
on ROE and ROA with their increase, the increase of LFD has a positive effect on ROE with its
increase and the increase of SFD has a positive effect on ROE, ROA and ROI with their increase.
International Journal of Management (IJM), ISSN 0976 – 6502(Print), ISSN 0976 - 6510(Online),
Volume 5, Issue 3, March (2014), pp. 01-20 © IAEME
15
Between ROI and TFD, LFD and between ROA and LFD were not found statistically significant
relationships. Finally in small manufacturing firms were found negative relationships between ROE
and TFD, SFD. Thus the increase of TFD and SFD has a negative effect on ROE with its decrease.
Between ROA, ROI and TFD, LFD, SFD and between ROE and LFD were not found statistically
significant relationships.
Also in service industry the analysis found discordant results. In large service firms were
found positive relationships between ROA and TFD and between ROI and LFD while a negative
relationship was found between ROI and SFD. Therefore the increase of TFD and LFD has a
positive effect on ROA and ROI respectively with their increase while the increase of SFD has a
negative effects on ROI with its decrease. Between ROE and TFD, LFD, SFD, between ROA and
LFD, SFD, and between ROI and TFD, SFD, were not found statistically significant relationships. In
small service firms were found positive relationships between ROE and TFD, SFD while a negative
relationship was found between ROI and SFD. Therefore the increase of TFD and SFD has positive
effect on ROE while the increase in SFD has negative effect on ROI. Between ROE and LFD,
between ROA and TFD, LFD, SFD, and between ROI and TFD, LFD, were not found statistically
significant relationships. For all medium service firms were not found a statistically significant
relationship between dependent and independent variables.
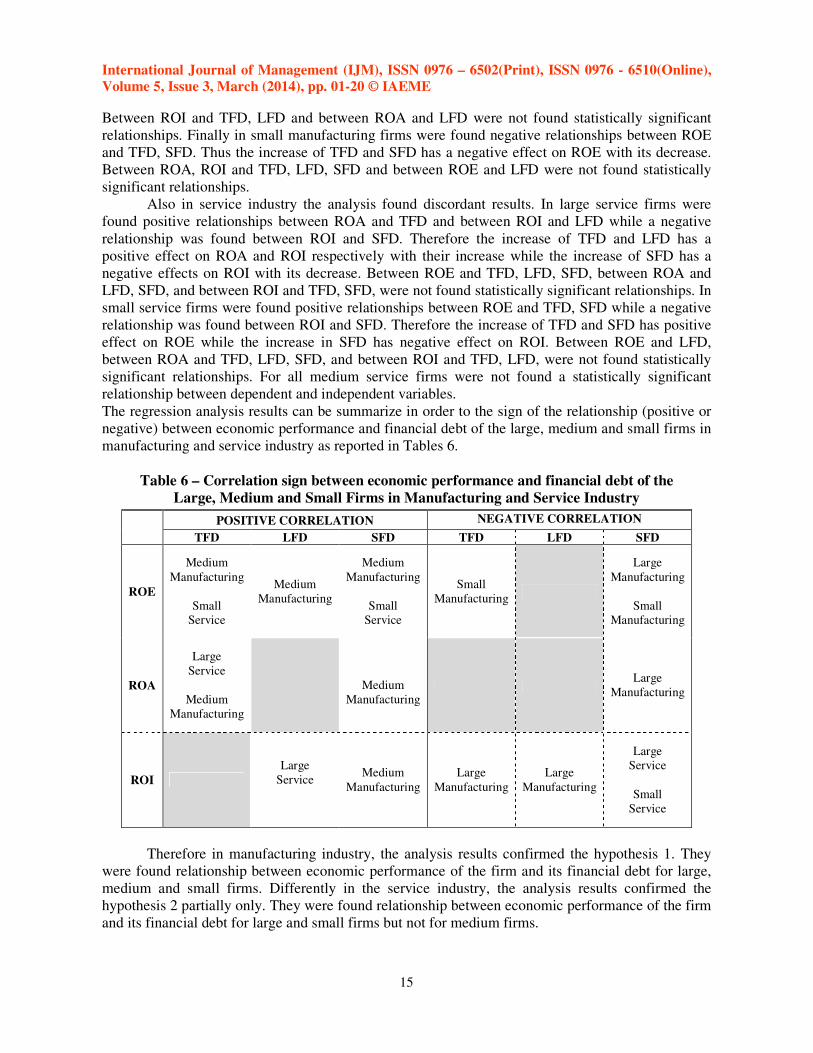
The regression analysis results can be summarize in order to the sign of the relationship (positive or
negative) between economic performance and financial debt of the large, medium and small firms in
manufacturing and service industry as reported in Tables 6.
Table 6 – Correlation sign between economic performance and financial debt of the
Large, Medium and Small Firms in Manufacturing and Service Industry
POSITIVE CORRELATION NEGATIVE CORRELATION
TFD LFD SFD TFD LFD SFD
ROE
Medium
Manufacturing
Small
Service
Medium
Manufacturing
Medium
Manufacturing
Small
Service
Small
Manufacturing
Large
Manufacturing
Small
Manufacturing
ROA
Large
Service
Medium
Manufacturing
Medium
Manufacturing
Large
Manufacturing
ROI
Large
Service
Medium
Manufacturing
Large
Manufacturing
Large
Manufacturing
Large
Service
Small
Service
Therefore in manufacturing industry, the analysis results confirmed the hypothesis 1. They
were found relationship between economic performance of the firm and its financial debt for large,
medium and small firms. Differently in the service industry, the analysis results confirmed the
hypothesis 2 partially only. They were found relationship between economic performance of the firm
and its financial debt for large and small firms but not for medium firms.
International Journal of Management (IJM), ISSN 0976 – 6502(Print), ISSN 0976 - 6510(Online),
Volume 5, Issue 3, March (2014), pp. 01-20 © IAEME
16
5. CONCLUSIONS
This paper is a moderate attempt to understand the relationship between capital structure and
economic performance of the Italian large, medium and small firms in manufacturing and service
industry listed in Italian Stock Exchange.
The basic hypothesis is that the financial debt affects (negatively or positively) the economic
performance of the large, medium and small firms in manufacturing and service industry. The
analysis found a significant relationship between economic performance of the firm and its financial
debt but with discordant results. Also the relationship is more relevant in manufacturing industry
than in service industry.
The results of the analysis can be summarize as following:
1. The economic performances of the firms, on average, are higher in manufacturing industry than
in service industry. On average, both in manufacturing and service industry, the large firm have
the best economic performance followed by medium firm and small firm.
2. In manufacturing industry financial debt is lower than service industry for large and medium
firms. It is relevant to note that Italian firms usually tend to use commercial debt (trade payables)
as a substitute of financial debts. Looking at financial debt duration, both in the manufacturing
and service industry, large and medium firms prefers long-term debt to short-term debt while
small firms prefer short-term debt to long-term debt. It is mainly due to the possibility for the
large and medium firms obtain debt at better condition than small firms.
3. For the large firms the analysis found discordant results between manufacturing and service
industry.
In large manufacturing firms, compared to positive economic performances (on average ROE is
15%, ROA is 11% and ROI is 4%), TFD is 27% (of which LFD is 17% and SFD is 9%). For
these firms, the analysis found a negative correlation between ROI and TFD, LFD, and between
ROA, ROE and SFD.
In large service firms, compared to positive economic performances lower than large
manufacturing firms (on average ROE is 11%, ROA is 8% and ROI is 3%), TFD is higher than
large manufacturing firms (on average 55% of which the LFD is 42% and SFD is 13%). For
these firms, the analysis found a positive correlation between ROA and TFD and between ROI
and LFD and negative correlation between ROI and SFD.
4. Also for the medium firms the analysis found discordant results between manufacturing and
service industry.
In medium manufacturing firms, compared to positive economic performances (on average ROE
is 11%, ROA is 5% and ROI is 3%), TFD is 29% (of which LFD is 15% and SFD is 14%). For
these firms, the analysis found a positive correlation between ROE and TFD, LFD, SFD, between
ROA and TFD, SFD, and between ROI and SFD.
In medium service firms, compared to positive economic performances lower than medium
manufacturing firms (on average ROE is 6%, ROA is 3% and ROI is 2%), TFD is higher than
medium manufacturing firms (on average 32% of which the LFD is 18% and SFD is 14%). For
these firms, the analysis did not found a correlation between ROE, ROA, ROI and TFD, LFD,
SFD.
5. For the small firms the analysis found a concordant results in manufacturing and service industry.
In small manufacturing firms, compared to negative ROE (-2%) and positive ROA (2%) and ROI
(1%), TFD is 26% (of which SFD is 15% and LFD is 12%). For these firms, the analysis found a
negative correlation between ROE and TFD, SFD.
International Journal of Management (IJM), ISSN 0976 – 6502(Print), ISSN 0976 - 6510(Online),
Volume 5, Issue 3, March (2014), pp. 01-20 © IAEME
17
In small service firms, compared to positive economic performances (on average ROE is 2%,
ROA is 1% and ROI is 0.5%), TFD is lower than small manufacturing firms (on average 18% of
which the SFD is 12% and LFD is 6%). For these firms, the analysis found a negative correlation
between ROI and SFD and positive correlation between ROE and TFD, SFD.
Therefore in manufacturing industry, the analysis results confirmed the hypothesis 1 while in
service industry the hypothesis 2 was confirmed only partially.
REFERENCES
1. Abor J., 2005. The effect of capital structure on profitability: empirical analysis of listed firms
in Ghana. Journal of Risk Finance, 6(5), pp. 438-445.
2. Amihud Y., Lev B., 1981. Risk reduction as a managerial motive for conglomerate mergers.
Bell Journal of Economics, 12(2), pp. 605-6017.
3. Balakrishnan S., Fox I., 1993. Asset specificity, firm heterogeneity and capital structure.
Strategic Management Journal, 14 (1), pp.3-16.
4. Barclay M.J., Smith C.W., 1995. The maturity structure of Corporate Debt. Journal of
Finance, 50, pp.609-632.
5. Barton S.L., Gordon P.J., 1987. Corporate strategy: useful perspective for the study of capital
structure?. Academy of Management Review, 12, pp.67-75.
6. Barton S.L., Gordon P.J., 1988. Corporate strategy and capital structure. Strategic
Management Journal, 9(6), pp.623-632.
7. Bergh D.D., 1995. Size and relatedness of units sold. Strategic Management Journal, 16(3),
pp. 221-240.
8. Bethel J.E., Liebeskind J., 1993. The effects of ownership structure on corporate restructuring.
Strategic Management Journal (summer special issue), 14, pp. 15-31.
9. Bettis R., 1983. Modern Financial Theory, Corporate Strategy and Public Policy: Three
Conundrums. Academy of Management Review, 8, 3, pp. 406-415.
10. Bistrova J., Lace N., Peleckiene V., 2011. The Influence of Capital Structure on Baltic
Corporate Performance. Journal of Business Economics and Management, 12(4), pp. 655-669.
11. Booth L., Aivazian V., Demirguc-Kunt, Maksimovic V., 2001. Capital structure in developing
countries. Journal of Finance, 55(1), pp.87-130.
12. Bradley M., Jarrel G.A, Han Kim E., 1984. On the existence of an optimal capital structure:
Theory and evidence. Journal of Finance, 39, pp. 857-880.
13. Brennan M., Kraus A., 1987. Efficient financing under asymmetric information. Journal of
Finance, 42, pp. 1225-1243.
14. Chittenden F., Hall G., Hutchinson P., 1996. Small firm growth, access to capital markets and
financial structure: review of issue and an empirical investigation. Small Business Economics,
8 (1), pp. 59-67.
15. Constantinides G.M., Grundy B.D., 1989. Optimal investment with stock repurchase and
financing as signals. The review of Financial Studies, 2, pp. 445-466.
16. Diamond D.W., 1989. Reputation acquisition in debt markets. Journal of Political Economy,
97, pp. 828-862.
17. Esperanca J.P., Ana P.M.G., Mohamed A.G., 2003. Corporate debt policy of small firms: An
empirical (re)examination. Journal of Small Business and Enterprise Development, 10(1), pp.
62-80.
18. Fama E.F., French K.R., 1998. Taxes, financing decisions, and firm value. Journal of Finance,
vol.53, pp.819-843.
19. Fama E.F., French K.R., 2002. Testing trade-off and pecking order predictions about
dividends and debt. Review of Financial Studies, 15, pp.1-33.
International Journal of Management (IJM), ISSN 0976 – 6502(Print), ISSN 0976 - 6510(Online),
Volume 5, Issue 3, March (2014), pp. 01-20 © IAEME
18
20. Friend I., Lang H.P., 1988. An empirical test of the impact of managerial self-interest on
corporate capital structure. Journal of Finance, 43, pp. 271-281.
21. Friend I., Hasbrouck J., 1988. Determinants of capital structure. Research in Finance, 7(1),
pp. 1-19.
22. Gill A., Biger N., Mathur N., 2011. The Effect of Capital Structure on Profitability: Evidence
from the United States. International Journal of Management, 28(4), pp.3-15.
23. Gi Shian Su, Hong Tam Vo, 2010. The Relationship between Corporate Strategy, Capital
Structure and Firm Performance: An empirical Study of the Listed Companies in Vietnam.
International Research Journal of Finance and Economics, 50, pp. 62-71.
24. Gleason K.C., Mathur L.K., Mathur I., 2000. The Interrelationship between Culture, Capital
Structure and Performance: Evidence from European Retailers. Journal of Business Research,
50(2), pp. 185-191.
25. Gupta P., Srivastava A., Sharma D., 2011. Capital Structure and Economic performance:
Evidence from India, Third Annual American Business Research Conference, Adelphi
University, Long Island, New York on 6-7 June 2011.
26. Harris M., Raviv A., 1990. Capital structure and the information role of debt. Journal of
Finance, 45, pp. 321-349;
27. Harris M., Raviv A., 1991. The theory of Capital Structure. The Journal of Finance, 1, pp.
297-355.
28. Heinkel R., 1982. A theory of capital structure relevance under imperfect information. Journal
of Finance, 37, pp. 1141-1150.
29. Heinkel R., Zechner J., 1990. The role of debt and preferred stock as a solution to adverse
investment incentives. Journal of Financial and Quantitative Analysis, 25, pp. 1-24.
30. Hitt M.A., Hoskisson R.E., Harrison J.S., 1991. Strategic competitiveness in the 1990s:
Challenges and opportunities for U.S. executives. Academy of Management Executive, 5 (2),
pp.7-22.
31. Hoskisson R.E., Johnson J.R.A., Moesel D.D., 1994. Corporate divestiture intensity in
restructuring firms: effects of governance, strategy and performance. Academy of Management
Journal, 37(5), pp. 1207-1238.
32. Huang G., Song F.M., 2006. The Determinants of Capital Structure: Evidence from China.
China Economic Review, 17(1), pp. 14-36.
33. Jensen M.C., 1986. Agency cost of free cash flow, corporate finance and takeovers. American
Economic Review, 76, pp.323-329.
34. Jensen M.C. and Meckling W., 1976. Theory of the firm: Managerial behaviour, agency costs,
and ownership structure. Journal of Financial Economics, 3, pp.305-360.
35. Johnson S.A., 1997. An empirical analysis of the determinants of corporate debt ownership
structure. Journal of Financial and Quantitative Analysis, 32, pp. 47-69.
36. Jordan J., Lowe J., Taylor P., 1998. Strategy and financial policy in UK small firms. Journal
of Business Finance and Accounting, 25(1), pp. 1-27.
37. Kale J.R., Thomas H.N., Ramirez G.G., 1991. The effect of business risk on corporate capital
structure: Theory and evidence. Journal of Finance, 46, pp. 1693-1715.
38. Kester W.C., Luehrman T.A., 1992. The myth of Japan’s low-cost capital. Harvard Business
Review, 70(3), pp.130-138.
39. Kim W.S., Sorensen E.H., 1986. Evidence on the impact of the agency costs of debt on
corporate debt policy. Journal of Financial and Quantitative Analysis, 21, pp. 131.143.
40. Kim C., Mauer D.C., Sherman A.E., 1998. The determinants of corporate liquidity: Theory
and evidence. Journal of Financial and Quantitative Analysis, 33, pp. 335-359.
41. Kochhar R., 1996. Explaining firm capital structure: The role of agency theory vs. transaction
cost economics. Strategic Management Journal, 17(9), pp.713-728.
International Journal of Management (IJM), ISSN 0976 – 6502(Print), ISSN 0976 - 6510(Online),
Volume 5, Issue 3, March (2014), pp. 01-20 © IAEME
19
42. Kochhar R., Hitt M.A., 1998. Linking corporate strategy to capital structure: Diversification
strategy, type and source of financing. Strategic Management Journal, 19(6), pp.601-610.
43. Kraus A., Litzenberger R.H., 1973. A State-Preference Model of Optimal Financial Leverage.
Journal of Finance, pp. 911-922.
44. Lane P.J., Cannella Jr.A.A., Lubatkin M.H., 1998. Agency problems as antecedents to
unrelated mergers and diversification: Amihud and lev reconsidered. Strategic Management
Journal, 19(6), pp. 555-578.
45. Leland H., Pyle D., 1977. Information asymmetrics, financial structure, and financial
intermediation. Journal of Finance, 32, pp. 371-388.
46. MacKie-Mason J.K., 1990. Do taxes effect corporate financing decisions?, Journal of
Finance, 45, pp. 1471-1493.
47. Majumdar S.K., Sen K., 2010. Debt in the Indian Corporate Sector: Its effect on firm strategy
and performance. Decision, 37(3), pp. 30-47.
48. Mesquita J.M.C., Lara J.E., 2003. Capital structure and profitability: the Brazilian case.
Academy of Business and Administration Sciences Conference, Vancouver, July 11-13.
49. Michaelas N., Chittenden F., Poutziouris P., 1999. Financial policy and capital structure
choice in IK SMEs: Empirical evidence from company panel data. Small Business Economics,
12, pp. 113-130.
50. Modigliani F., Miller M., 1958. The Cost of Capital, Corporation Finance and the Theory of
Finance, American Economic Review, 48, pp.261-297.
51. Modigliani F., Miller M., 1963. Corporate income taxes and the cost of capital: A correction.
American Economic Review, 53, pp.433-443.
52. Miller M., 1977. Debt and taxes. Journal of Finance, 32, pp. 261-276.
53. Muzir E., 2011. Triangle Relationship among Firm Size, Capital Structure Choice and
Economic performance. Some Evidence form Turkey. Journal of Management Research,
11(2), pp.87-98.
54. Myers S.C., 1977. Determinants of corporate borrowing. Journal of Financial Economics,
5(5), pp. 147-175.
55. Myers S.C., 1984. The capital structure puzzle. Journal of Finance, 39, pp. 575-592.
56. Myers S.C., 2001. Capital structure. Journal of Economic Perspectives, 15(2), pp. 81-102.
57. Myers S.C., Majluf N.S., 1984. Corporate financing and investment decision when firms have
information that investors do not have. Journal of Financial Economics, 13, pp.187-221.
58. Narayanan M.P., 1988. Debt versus equity under asymmetric information. Journal of
Financial and Quantitative Analysis, 23, pp. 39-51.
59. Nimalathasan B., Valeriu B., 2010. Capital structure and Its Impact on Profitability: A Study
of Listed Manufactoring Companies in Sri Lanka. The Young Economists Journal, 1(15), pp.
7-16.
60. Noe T., 1988. Capital structure and signalling game equilibria. Review of Financial Studies, 1,
pp. 331-356.
61. Noe T., Rebello M.J., 1996. Asymmetric information, managerial opportunism, financing, and
payout policies. Journal of Finance, 51(2), pp. 637-660.
62. Norvaisiene R., 2012. The Impact of Capital Structure on the Performance Efficiency of Baltic
Listed Companies, Inzinerine Ekonomika-Engineering Economics, 23 (5), pp. 505-516.
63. Ozkan A., 2002. The determinants of corporate debt maturity: Evidence from UK firms.
Applied Financial Economics, 12, pp. 19-24.
64. Poitevin M., 1989. Financial signalling and the “deep-pocket” argument. Rand Journal of
Economics, 20, pp. 26-40.
65. Rajan R.G., Zingales L., 1995. What do we know about capital structure: some evidence from
international data. Journal of Finance, 50, pp.1421-1460.
International Journal of Management (IJM), ISSN 0976 – 6502(Print), ISSN 0976 - 6510(Online),
Volume 5, Issue 3, March (2014), pp. 01-20 © IAEME
20
66. Roden D.M., Lewellen W.G., 1995. Corporate capital structure decisions: Evidence from
leveraged buyouts. Financial Management, 24, pp. 76-87.
67. Ross S., 1977. The determination of financial structure: The incentive signalling approach.
Bell Journal of Economics, 8, pp.23-40.
68. San O.T., Heng T.B., 2011. Capital Structure and Corporate Performance of Malaysian
Construction Sector. International Journal of Humanities and Social Science, 1(2), 28-36.
69. Salehi M., Manesh N.B., 2012. A Study of the Roels of Firm and Country on Specific
Determinates in Capital Structure: Iranian Evidence. International Management Review, 8 (2),
pp. 51-62.
70. Shleifer A., Vishny R.W., 1997. A survey of corporate governance. Journal of Finance, 52(2),
pp. 737-783.
71. Short H., 1994. Ownership, control, financial structure and the performance of firms. Journal
of Economic Surveys, 8(3), pp. 203-249.
72. Simerly R.L., Mingfang Li, 2000. Environmental dynamism, capital structure and
performance: a theoretical integration and an empirical test. Strategic management Journal,
21, pp. 31-49.
73. Stohs M.H., Mauer D.C., 1996. The determinants of corporate debt maturity structure. Journal
of Business, 69, pp.279-312.
74. Stulz R., 1990. Managerial discretion and optimal financing policies. Journal of Financial
Economics, 26, pp. 3-27.
75. Titman S., 1984. The effect of capital structure on a firm’s liquidation decisions. Journal of
Financial Economics, 13, pp. 137-151.
76. Titman S., Wessels R., 1988. The determinants of capital structure choice. Journal of Finance,
43(1), pp. 1-19.
77. Tsuji C., 2013. Corporate Profitability and Capital Structure: The Case of the Machinery
Industry Firms of the Tokyo Stock Exchange. International Journal of Business
Administration, 4(3), pp.14-21.
78. Wald J.K., 1999. How firm characteristics affect capital structure: an international
comparison. Journal of Financial Research, 22(2), pp. 161-187.
79. Ward K., Grundy G., 1996. The Strategic Management of Corporate Value. European
Management Journal, 14:3, 321-330.
80. Zeitun R., Tian G.G., 2007. Capital structure and Corporate Performance: Evidence from
Jordan. Australasian Accounting Business & Finance Journal, 1(4), pp. 40-53.
Related Documents