Canada Line Final Project Report COMPETITIVE SELECTION PHASE April 12, 2006

Welcome message from author
This document is posted to help you gain knowledge. Please leave a comment to let me know what you think about it! Share it to your friends and learn new things together.
Transcript

Canada Line Final Project Report COMPETITIVE SELECTION PHASE
April 12, 2006

Page i of ii
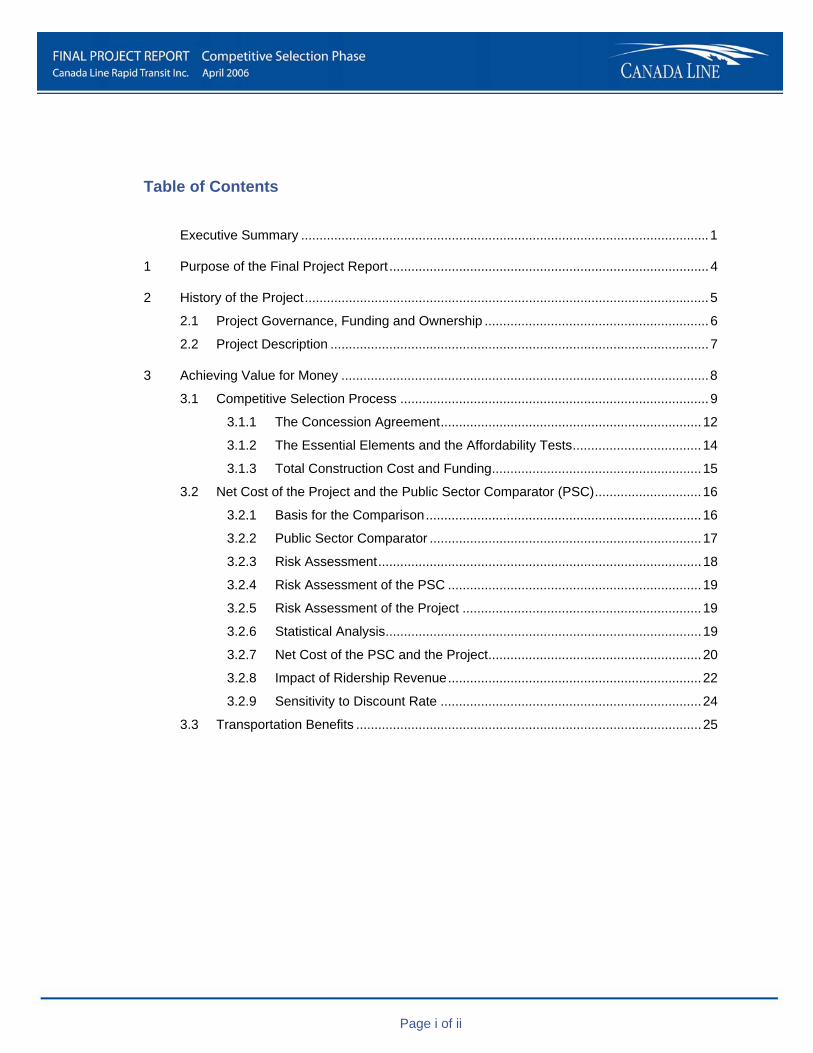
Table of Contents
Executive Summary ...............................................................................................................1
1 Purpose of the Final Project Report.......................................................................................4
2 History of the Project..............................................................................................................5
2.1 Project Governance, Funding and Ownership .............................................................6
2.2 Project Description .......................................................................................................7
3 Achieving Value for Money ....................................................................................................8
3.1 Competitive Selection Process ....................................................................................9
3.1.1 The Concession Agreement.......................................................................12
3.1.2 The Essential Elements and the Affordability Tests...................................14
3.1.3 Total Construction Cost and Funding.........................................................15
3.2 Net Cost of the Project and the Public Sector Comparator (PSC).............................16
3.2.1 Basis for the Comparison...........................................................................16
3.2.2 Public Sector Comparator ..........................................................................17
3.2.3 Risk Assessment........................................................................................18
3.2.4 Risk Assessment of the PSC .....................................................................19
3.2.5 Risk Assessment of the Project .................................................................19
3.2.6 Statistical Analysis......................................................................................19
3.2.7 Net Cost of the PSC and the Project..........................................................20
3.2.8 Impact of Ridership Revenue.....................................................................22
3.2.9 Sensitivity to Discount Rate .......................................................................24
3.3 Transportation Benefits ..............................................................................................25
ii of ii
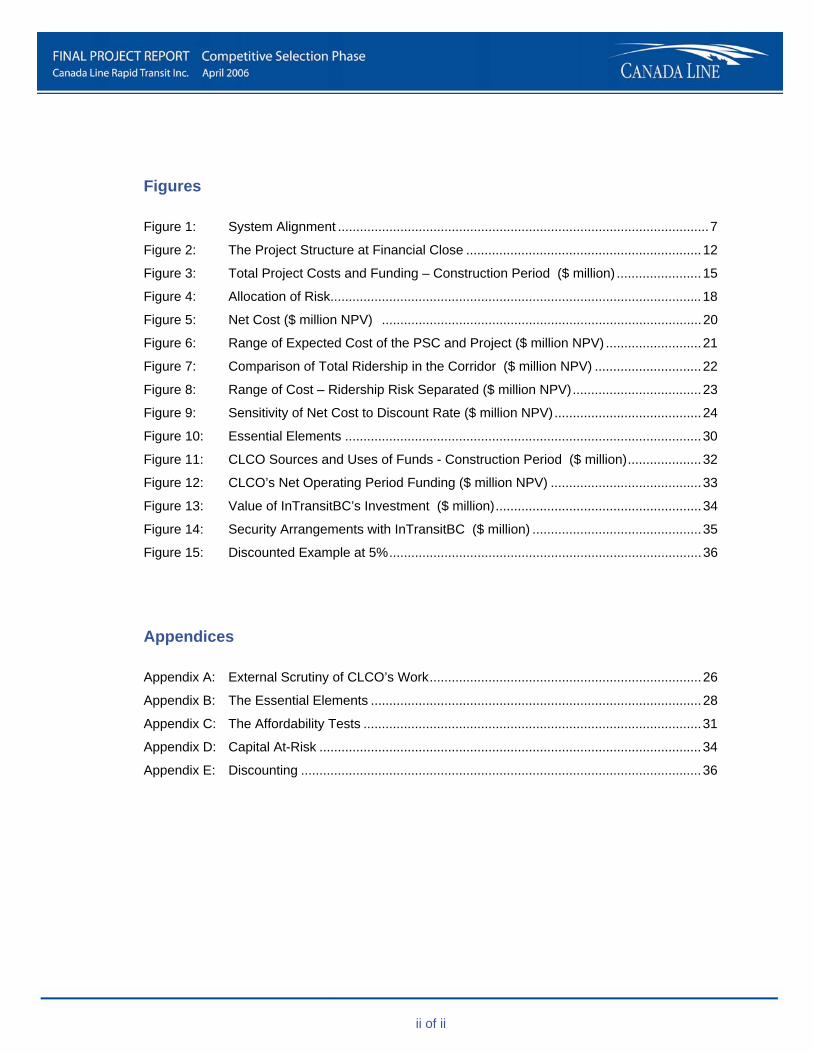
Figures
Figure 1: System Alignment .....................................................................................................7
Figure 2: The Project Structure at Financial Close ................................................................12
Figure 3: Total Project Costs and Funding – Construction Period ($ million) .......................15
Figure 4: Allocation of Risk.....................................................................................................18
Figure 5: Net Cost ($ million NPV) .......................................................................................20
Figure 6: Range of Expected Cost of the PSC and Project ($ million NPV) ..........................21
Figure 7: Comparison of Total Ridership in the Corridor ($ million NPV) .............................22
Figure 8: Range of Cost – Ridership Risk Separated ($ million NPV)...................................23
Figure 9: Sensitivity of Net Cost to Discount Rate ($ million NPV)........................................24
Figure 10: Essential Elements .................................................................................................30
Figure 11: CLCO Sources and Uses of Funds - Construction Period ($ million)....................32
Figure 12: CLCO’s Net Operating Period Funding ($ million NPV) .........................................33
Figure 13: Value of InTransitBC’s Investment ($ million)........................................................34
Figure 14: Security Arrangements with InTransitBC ($ million) ..............................................35
Figure 15: Discounted Example at 5%.....................................................................................36
Appendices
Appendix A: External Scrutiny of CLCO’s Work..........................................................................26
Appendix B: The Essential Elements ..........................................................................................28
Appendix C: The Affordability Tests ............................................................................................31
Appendix D: Capital At-Risk ........................................................................................................34
Appendix E: Discounting .............................................................................................................36
1 of 36
Executive Summary
Project Description and Purpose of Final Project Report
Canada Line is a 19km rail rapid transit system connecting downtown Vancouver, the Vancouver International Airport and Central Richmond. It has 16 stations, two bridges and nine kilometres of tunnel. This is the final report for the procurement stage of the project. Its purpose is to assess value for money. It also includes a discussion of project funding and compliance with public agency funding conditions.
The public funding agencies for Canada Line are: the Government of Canada (Canada), the Province of British Columbia (the Province), the Greater Vancouver Transportation Authority (GVTA), Vancouver International Airport Authority (VIAA) and the City of Vancouver. The procurement stage began with the approval by the Province, GVTA and VIAA to begin a competitive process to select a contractor to design, build, partially finance, operate and maintain the line.
The procurement concluded with execution of a contract (Concession Agreement), between Canada Line Rapid Transit Inc. (CLCO), the company responsible for implementing the project for the public sector, and the selected contractor, InTransitBC.
Value for Money
CLCO concludes that value for money is expected to be achieved based on an analysis of the competitiveness and fairness of the selection process undertaken by CLCO and upon revenue and cost comparisons with a public sector comparator (PSC), which indicates the expected net cost of the project is $92 million Net Present
Value1 (NPV) less than the PSC. The revenue and cost comparisons are based on forward-looking information and consequently, the $92 million NPV differential is not an absolute assertion and the difference may be less or greater than expected based on actual costs and revenues achieved over the 35-year Concession Agreement.
The net cost differential should not be interpreted as a savings available to fund other government expenditures. Rather, the net cost differential arises from a comparison of forecasts of project revenue and costs with forecast of the revenues and costs associated with a hypothetical project funded and managed solely by the public sector (the PSC). The comparison is only made to assist in concluding whether or not the project has delivered value to the taxpayer.
Within Approved Public Sector Funding
Project development funding was provided by the public agencies and project design and construction is jointly funded by the public agencies and the selected contractor, InTransitBC. Performance payments during the operating period are funded by GVTA and the Province.
1 Costs and revenues of the project are expressed as cash flow projections over the term of the Concession Agreement (about 35 years). In order to reflect the time value for money, such cash flows are often presented in Net Present Value (NPV) terms. An NPV is calculated by applying a compounding discount rate to a stream of future cash flows. This calculation reduces these cash flows to a single value reflecting the time value of money. All NPV amounts in this report, unless otherwise stated, are the result of discounting annual costs and revenues to the year 2003, using a 6% nominal discount rate.
2 of 36
This report concludes that approved public sector funding together with InTransitBC’s investment is sufficient to fund project construction:
• $1,331 million (nominal) approved public funds;
• $720 million (nominal) InTransitBC investment;
• total project cost within approved funding of $2.05 billion (nominal), which is equivalent to $1.89 billion ($2003 real)
The approved funding does not fund the cost of those aspects of the project that are directly funded and managed by GVTA and the Cities of Vancouver and Richmond. This includes the provision of GVTA designated policing units, certain operating period insurance policies, GVTA and City funding of major road construction, cost of trolley wires, construction of bus loops and ticket vending machines. The Provincial funding contribution was conditional upon the project being developed as a partnership between the public and private sectors (P3).
GVTA will own the main line from Richmond to Vancouver, and VIAA will own the line from Bridgeport Station to the Airport. InTransitBC will own the rail cars. GVTA will set fares and collect for its account, all fare revenues from the system.
Project Governance
CLCO, a wholly-owned and independently-governed subsidiary of GVTA, managed the competitive selection process and is responsible for overall implementation of the project. CLCO was established to implement the project. Transportation policy supporting the project is the responsibility of GVTA.
On February 1, 2006 RAV Project Management Ltd. changed its legal name to Canada Line Rapid Transit Inc. (CLCO).
History and Competitive Selection
In 2000, Canada, the Province, GVTA, VIAA, and the Cities of Vancouver and Richmond agreed to participate in a three-phase program to evaluate the potential to build rapid transit in the Richmond-Airport-Vancouver corridor by 2010. This concluded with approval to begin the procurement.
CLCO commenced the procurement process in November 2002 by issuing a Request for Expressions of Interest (RFEI). Ten private sector consortia of firms submitted responses that detailed their relevant qualifications and experience. In August 2003, CLCO issued a Request for Proposals (RFP) to four well-qualified proponents, each of whom CLCO concluded were capable of designing, constructing, financing and operating the line.
One of the proponents withdrew in the fall of 2003. The remaining three proponents submitted proposals in response to the RFP in January, 2004.
In July 2004, CLCO issued invitations to two proponent teams to participate in the Best and Final Offer (BAFO) stage. Thereafter, the Board of CLCO identified SNC-Lavalin/Serco as the preferred proponent. In December 2004, CLCO, with the approval of GVTA, entered into final negotiations with SNC-Lavalin/Serco. Subsequently, SNC-Lavalin Inc. formed a limited partnership company called InTransitBC, owned jointly by SNC-Lavalin Inc., the British Columbia Investment Management Corporation and Caisse de dépôt et placement du Québec, to design, build, partially finance, operate and maintain the line. The finalization of project documentation occurred on July 29, 2005 (Financial Close) and InTransitBC began construction of the system shortly thereafter.
The total cost of the procurement phase was $32 million (nominal).
3 of 36
Fair Competitive Selection
Fairness Auditor, Mr. Ted Hughes, O.C., Q.C. confirmed that the competitive selection process was fair and unbiased.
Concession Agreement and Allocation of Risk
The commercial relationship between InTransitBC, CLCO and GVTA (the “parties”) is governed by the Concession Agreement which sets out the rights and obligations of each party in the delivery of the project over 35 years.
Under the terms of the Concession Agreement, InTransitBC is responsible for building the line. Payments to InTransitBC and the project completion date are set out in the Concession Agreement. InTransitBC will be paid after achieving identified milestones during the construction period. During the operating period, payments will be made to InTransitBC for the achievement of performance targets that measure, for example, train frequency, safety and ridership.
The key principle behind the design of the Concession Agreement is that risk should, where possible, be allocated to the party most able to manage and mitigate it. The majority of the construction cost and operating cost risks have been allocated to InTransitBC. Any risks retained by CLCO during construction including, for example, property acquisition, unidentified contaminated soils, and a share of utility relocation costs, are covered by specific contingency funds.
While most of the operating cost risk has been allocated to InTransitBC, GVTA retains the majority of the ridership revenue risk. This is because GVTA controls the majority of the integrated Lower Mainland transportation system, sets fare levels for bus and rail systems, optimizes bus routes and integrates them with rail systems, and markets transit to the public.

4 of 36
1 Purpose of the Final Project Report The Canada Line rapid transit system is being developed as a P3. CLCO made a commitment to publicly report the final assessment of value for money expected to be achieved over the life of the partnership. Value for money assessments capture a range of factors including analyses of revenues and costs, risks retained by the public sector and the overall protection of public interests. CLCO’s assessment of value for money includes an analysis of the competitive selection process and a revenue and cost comparison of the project with a PSC. The PSC is a hypothetical concept based on realistic assumptions intended to provide a risk-adjusted estimate of the project cost with the use of conventional public sector procurement methods where the system would be purchased, financed, operated and maintained by the public sector. The scope of the assessment is limited to determining if the competitive selection process has delivered value for money; it is not an assessment of whether or not the system is the best option for addressing the transportation issues in the Richmond-Airport-Vancouver corridor.
CLCO requested that the Auditor General of British Columbia undertake a review of this Report. CLCO provided the Auditor General with full access to all project information required to support the review process. CLCO is accountable for the contents of this report, including the reasonableness of the facts, assumptions and professional opinions that are presented. This report discusses the assessment of value for money as at July 29, 2005 when the project documentation and financial commitments were finalized (Financial Close).

5 of 36
2 History of the Project Transportation systems for the Richmond-Vancouver corridor have been studied for over 30 years. In 1999, during the consultation program for the TransLink Strategic Transportation Plan (1999), several government agencies expressed renewed interest in a rapid transit network to connect Richmond and Vancouver. Increases in passenger and cargo traffic at Vancouver International Airport prompted interest in a rail link to serve the growing employment base on Sea Island and existing and future passenger terminals.
In September 2000 GVTA, the Province, VIAA, (Local Funding Agencies) and the Cities of Vancouver and Richmond agreed to participate in a three-phase project to evaluate the potential to build rapid transit in the corridor by 2010:
• Phase One – consisted of defining the organization of the project and its objectives;
• Phase Two – included an evaluation of the need to build the line, the potential to fund it and the potential for private investment;
• Phase Three – Project Definition Phase, culminated in a Project Definition Report which was delivered to the participating agencies in February of 2003. The purpose of the report was to define the project and its financial implications to a level that would allow the Local Funding Agencies to decide to proceed with the project. The Project Definition Phase also marked the beginning of the procurement, or competitive selection process. During this phase the agencies issued a Request for Expressions of Interest (RFEI) to determine the level of interest in the market.
The Project Definition Report was the subject of a public consultation process which took place in the spring of 2003. The agencies considered the Project Definition Report and the public commentary. In mid 2003 GVTA, with input from the Local Funding Agencies, approved:
• continuing with the competitive selection process by issuing a Request for Proposals;
• the development of a Concession Agreement (the Agreement) that specified the terms and conditions for the design, construction, finance, operation and maintenance of the system;
• establishing an independently governed subsidiary of GVTA to implement the project, with directors nominated by each of the Province, GVTA and VIAA; and
• its initial financial contributions.
During negotiation of the funding arrangements, the Local Funding Agencies identified specific elements of the project that they considered to be “essential”, which were to be included as conditions of their participation. Collectively, these elements came to be known as the Essential Elements of the project. The Essential Elements describe specific objectives, including travel time, alignment constraints and a construction completion date of no later than November 30, 2009. In addition to the Essential Elements, the Province’s funding commitment was conditional upon the project being structured as a P3.
The Request for Proposals (RFP) was issued in the summer of 2003 and was followed by numerous agency approvals and procurement steps that culminated in the finalization of all project documentation on July 29, 2005 (Financial Close) with InTransitBC, the private sector partner. InTransitBC began construction of the system shortly thereafter.
6 of 36
2.1 Project Governance, Funding and Ownership
CLCO is a wholly-owned subsidiary of GVTA. The majority of its Board of Directors are independent; the other directors are employees of GVTA and VIAA. The company’s mandate is to oversee the development of the system including the procurement, design, and construction of the line. GVTA has recently initiated an overall review of its strategy, including determination of the best approach to managing the operating period of the 35-year Agreement.
The development and construction of the project is jointly funded by Canada, the Province, GVTA, VIAA, the City of Vancouver and InTransitBC. Over the operating period, GVTA and the Province will fund performance payments to InTransitBC. Each agency finances its contributions differently and individually accounts for their cost of financing contributions to CLCO. GVTA, in addition to its contributions to CLCO, is also funding additional costs related to the project, as described in Section 3.1.2.
Once completed, the rapid transit system will connect three major commercial and population centres; downtown Vancouver, Sea Island and the Airport, and Central Richmond. GVTA will own the main line from Richmond to Vancouver, VIAA will own the line from Bridgeport to the Airport and will provide an operating license to GVTA through to the end of the term of the Agreement. InTransitBC will design, construct, partially finance the system, own the train vehicles, and operate and maintain the entire system under an operating license from GVTA through to the end of the Agreement. GVTA will collect all fare revenues and will continue to set system-wide transportation policies and fare levels. As a condition of funding from Canada, the system is now called “Canada Line” and on February 1, 2006, RAV Project Management Ltd. changed its legal name to Canada Line Rapid Transit Inc. (CLCO).
7 of 36
2.2 Project Description
The north-south transportation corridor between downtown Vancouver, the Vancouver International Airport, and downtown Richmond is one of the busiest in Greater Vancouver and is home to one-third of the jobs and 20% of the people in the Lower Mainland. As the population in the corridor and the surrounding region has increased, the corridor’s transportation network has suffered from increasing congestion. There is a long history of analysis of various options to address congestion and increase the capacity of the existing transportation network in this corridor.
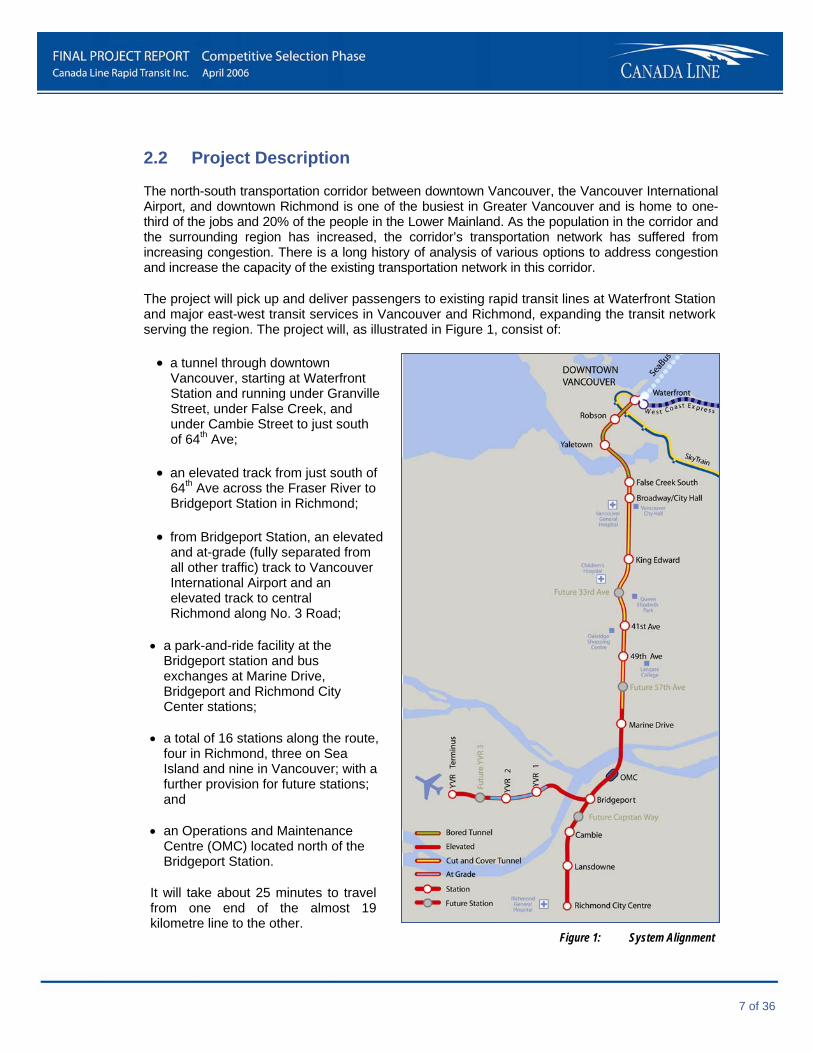
The project will pick up and deliver passengers to existing rapid transit lines at Waterfront Station and major east-west transit services in Vancouver and Richmond, expanding the transit network serving the region. The project will, as illustrated in Figure 1, consist of:
• a tunnel through downtown Vancouver, starting at Waterfront Station and running under Granville Street, under False Creek, and under Cambie Street to just south of 64th Ave;
• an elevated track from just south of 64th Ave across the Fraser River to Bridgeport Station in Richmond;
• from Bridgeport Station, an elevated and at-grade (fully separated from all other traffic) track to Vancouver International Airport and an elevated track to central Richmond along No. 3 Road;
• a park-and-ride facility at the Bridgeport station and bus exchanges at Marine Drive, Bridgeport and Richmond City Center stations;
• a total of 16 stations along the route,
four in Richmond, three on Sea Island and nine in Vancouver; with a further provision for future stations; and
• an Operations and Maintenance
Centre (OMC) located north of the Bridgeport Station.
It will take about 25 minutes to travel from one end of the almost 19 kilometre line to the other.
Figure 1: System Alignment
8 of 36
3 Achieving Value for Money CLCO’s assessment that it has delivered value for money via the competitive selection process is based upon its belief that the:
• procurement process was fair and competitive and has delivered a good outcome in the form of a Concession Agreement that efficiently and effectively allocates risk (see Section 3.1); and
• project is expected to have lower net costs than the PSC (see Section 3.2).
The value for money assertion is further supported by CLCO’s belief that the project is expected to deliver higher transportation benefits (see Section 3.3).
It is important to note that all of the quantitative conclusions in this report are based upon forward-looking information. CLCO has taken care in preparing its analyses; however, it is difficult to forecast future events with certainty and it is not possible to absolutely assert that the project will have lower net costs than the PSC or will meet the affordability tests described in Section 3.1.2 and in Appendix C. Throughout this report, words such as “believes”, “expects”, “forecast” and other similar expressions have been used to identify forward-looking information.
In particular, it is noted that:
• ridership revenue forecasts for the project and the PSC are based on the incremental impact expected on the Lower Mainland integrated transit system;
• ridership revenue forecast during the operating period is based on assumptions that compound over a period of time. Small changes in these assumptions can have a material impact on the overall results, either increasing or decreasing the revenue levels achieved. In addition, the project is part of the Lower Mainland integrated transit system. Changes to this system would have an impact on revenues; and
• a material source of project operating phase funding is the net operating and capital cost savings that GVTA expects to achieve by adjusting bus services in the corridor to improve transit integration. Therefore, future adjustments by GVTA of bus services may impact affordability.
CLCO and GVTA accepted the impact of this uncertainty in deciding to sign the Agreement, and accepted that the cost of the project (over the life of the Agreement) and the revenue sources available in the long-term may differ from those forecast at the time of Financial Close.
9 of 36
3.1 Competitive Selection Process
CLCO commenced the competitive selection process in November 2002 by issuing a Request for Expressions of Interest. Ten private sector consortia of firms submitted responses that detailed their relevant qualifications and experience. In August 2003, CLCO issued Requests for Proposals (RFP) to four well-qualified proponents, each of whom CLCO concluded were capable of designing, constructing, financing and operating the line:
• RAVLink Transportation: Fluor Canada Ltd., Siemens Canada Limited, MTR Corporation Limited, and Balfour Beatty Capital Projects Limited;
• RAVxpress: Bombardier Inc., AMEC, Bouygues Travaux Publics, SA, and Bilfinger Berger;
• SNC-Lavalin/Serco: SNC-Lavalin Inc. and Serco Limited; and
• RAVRail: Alstom Transport, SA; Ledcor Projects Inc.; Connex North America, Inc.; Karyo Communications; Busby & Associates; and MKT Development Group.
RAVRail withdrew in the fall of 2003. The remaining three proponents submitted proposals in response to the RFP in January 2004.
In July 2004, CLCO issued invitations to the RAVxpress and SNC-Lavalin/Serco proponent teams to participate in the Best and Final Offer (“BAFO”) stage. Thereafter, the Board of CLCO identified SNC-Lavalin/Serco as the Preferred Proponent. In December 2004, CLCO, with the approval of GVTA, entered into final negotiations with SNC-Lavalin/Serco.
At the July 29, 2005 Financial Close, SNC-Lavalin/Serco transferred its interests in the project to InTransitBC, a limited partnership owned equally by SNC-Lavalin, British Columbia Investment Management Corporation and Caisse de dépôt et placement du Québec. Serco Limited will participate in the operations of the project.
At the end of each of the RFP and BAFO stages, CLCO appointed formal evaluation committees and sub-committees to evaluate each of the competing proposals. The sub-committees were charged with the obligation of providing fair and unbiased assessments in the following areas: design and construction/technical; operations and maintenance; finance; commercial and legal; and consultation, all in accordance with the procurement instructions provided to the proponents at each of the stages. The sub-committees reported to the evaluation committee, which in turn, made recommendations (in the form of an evaluation report) to the CLCO Board. The committees evaluated the proposals using the criteria included in the instructions; the most important of the criteria being the “Net Cost of the System”, which considered the capital costs, operating costs, ridership revenues and bus cost savings associated with the proposals. In addition, the committees considered:
• strengths of each proposal and of its team’s ability to deliver;
• value of the transportation benefits of the proposals;
• safety; and
• qualitative factors that included approach to communications and public consultation, environmental impact and design aesthetics.
10 of 36
An important objective of the competitive selection process was to maximize competition while ensuring that competing proponents had opportunities to optimize their proposals via consultation with CLCO and GVTA and provide input into the various project requirements (including draft Concession Agreements prepared at each of the RFP and BAFO stages). As a consequence, there was a high degree of interaction between CLCO and the proponents at each of the RFP and BAFO stages.
CLCO adopted several practices to ensure that the interaction during the bidding stages did not compromise the fairness of the process by engaging:
• a third-party, independent consultant to establish ridership forecasts;
• a Conflict Reviewer; and
• a Fairness Auditor.
The use of a single ridership forecasting consultant, accessible to proponents, was required as each competing proposal had innovative designs and options resulting in differing levels of ridership. The draft Concession Agreement provided during the selection process did not define exactly how the system was to be designed. Rather, it primarily specified the performance that the completed system must achieve. As a consequence, during the selection process each of the proponents were free to propose innovative designs to maximize ridership or minimize cost, so long as the designs conformed to the Essential Elements and were capable of meeting the performance specifications.
It was critical that the individual proponents’ ridership forecasts be produced with the use of the same model, with the application of a consistent modelling methodology with complete confidentially to ensure comparability of the various forecasts and to provide proponents with the confidence that their design innovations would not be shared with other proponents. The consultant chosen by CLCO, via a competitive selection process, was Halcrow/TSi. Halcrow/TSi is comprised of Halcrow Group Limited, based in the United Kingdom, and TranSys Consultants International, a British Columbia firm with extensive experience in modelling the Lower Mainland transportation system. The approach to the modelling reflected Halcrow/TSi’s international and local experience.
Similar models are widely used throughout the world to help plan transportation infrastructure. The inputs to these models include detailed descriptions of the region's roads and transit systems, and the locations of population and employment. Travel demand, derived from this land-use information, is assigned to different travel modes (car, bus, walking, etc.) and routes, reflecting the relative attractiveness of each mode and route for an individual trip in terms of journey times, costs and other factors. The models are both calibrated and validated to ensure that they reasonably represent current travel choices and behaviour in the region.
Assumptions for a specific scenario (e.g., the specifics of the PSC reference design) are input into the model, which then generates forecasts for the transport system, such as vehicle volumes, average speed, and transit ridership for that scenario.
Modelling is a difficult and skilled task and all forecasts are inherently subject to uncertainty and transport models are often complex, and thus are rarely error-free. Models are sensitive to both general input assumptions and to specific information about local travellers' behaviour (such as their sensitivity to changes in train frequency or station access time). Input assumptions, such as how rapidly population will grow in a particular municipality in the future, often prove inaccurate.

11 of 36
Travel data is expensive to collect, and models sometimes have to use incomplete or dated information.
In order to make the forecasts from the models as accurate as feasible, the modelling approach used for this project involved:
• further development and use of an existing local model of the region covering the peak hours. This model had been previously used for other projects and proven to give reasonable results;
• development of an associated midday model to provide greater information on the projected ridership;
• development of a separate model for airport passengers;
• extensive travel surveys in the project corridor to ensure that the travel data (used in the development of the models) were both comprehensive and recent;
• testing the models with past changes in the region's transport systems to see how well they were able to forecast the observed changes in travel behaviour;
• benchmarking the forecasts against existing similar transit systems to be found elsewhere in the world; and
• Sensitivity testing of key assumptions and a risk analysis to identify the level of uncertainty associated with the forecasts.
In addition, the model and modelling approach were peer-reviewed by Booz Allen Hamilton, a consultancy firm with extensive international ridership forecasting experience, and assessed by staff of GVTA and other agencies as well as by staff of each of the bidding consortia.
CLCO appointed John Haythorne, a senior partner of the law firm Bull, Housser & Tupper, to assist with the identification and elimination of conflicts of interest with CLCO, the Agencies, and the proponents. In addition, CLCO appointed former Justice Ted Hughes, O.C., Q.C., as a Fairness Auditor with responsibility to review the evaluation process at each stage in the selection process. Mr. Hughes’ reports were positive and are referenced in Appendix A.
The total cost of the procurement phase was $32 million (nominal). These costs are included in the CLCO costs described in section 3.2. The procurement began in December 2002 and ended with Financial Close at the end of July 2005.

12 of 36
3.1.1 The Concession Agreement
The project is governed by the Agreement signed by CLCO, GVTA and InTransitBC (the “parties”) which sets out the rights and obligations of each party in the delivery of the line over 35 years.
Under the Agreement, InTransitBC (see Figure 2) has an obligation to design, construct, operate, maintain, and partially finance the project in accordance with the specifications set out in the Agreement and has the right to receive payments for fulfilling these obligations.
CLCO
Design & Construction SNC-Lavalin
InTransitBC
OperationsSNC-Lavalin/Serco
Bank of Ireland
bcIMC
SNC-Lavalin
Caisse de dépôtCONCESSION AGREEMENT
DEBT
CONTRACTS
EQUITY
Société Générale
Nord LB
Figure 2: The Project Structure at Financial Close
InTransitBC is obliged to construct the line for a fixed price (with the exception of costs associated with risks that are retained by CLCO) and is required to invest additional capital to fund cost overruns for which it is responsible. CLCO will make construction period payments to InTransitBC upon the attainment of defined milestones. These payments will be insufficient to meet the full cost of constructing the line. This funding shortfall requires that InTransitBC raise sufficient private capital (equity and debt) to fund the remaining construction costs. This private capital is critical to the completion of the project and to ensuring effective transfer of risk to InTransitBC over the term of the Agreement. InTransitBC expects to recover its capital during the operating period from performance payments from GVTA and the Province.
During the operating period, performance payments are made to InTransitBC based on achievement of operating specifications defined in the Agreement. The performance payments are used by InTransitBC to meet operating costs and to repay and provide a return on InTransitBC’s capital. The performance payments paid to InTransitBC during the operating phase
13 of 36
will not increase if InTransitBC experiences construction or operating cost overruns that are to its account.
The key principle behind the design of the Agreement is that risk should, where possible, be allocated to the party most able to efficiently manage and mitigate the risk in a cost-effective manner. Allocating risks to InTransitBC that it is not able to efficiently manage or mitigate would increase the overall cost of the project. An example is the acquisition of property, where failure to acquire a site on schedule can have a much larger impact on project cost than the cost of the site itself. In this circumstance, land acquisition risk better resides with CLCO and GVTA – particularly given that GVTA can exercise powers of expropriation not available to InTransitBC.
Another example is ridership risk. Ridership will be influenced by factors that relate to the entire transportation system as well as the specific operation of the project. GVTA controls the majority of the integrated Lower Mainland transportation system, sets fare levels for bus and rail systems, optimizes bus routes and integrates them with rail systems, and markets the various modes of transit to the public. The majority of the ridership risk is therefore logically allocated to GVTA.
InTransitBC is responsible for the operating and maintenance costs of the system. It receives payments that reflect achievement of performance measures for on-time arrivals and quality. Since its performance also influences ridership, it also carries a part of the risk of actual ridership being different than the forecast ridership. During the operating period, 70% of each payment from GVTA to InTransitBC is based on availability, 20% on quality of the service delivered and 10% on achievement of ridership forecasts.
With respect to availability, InTransitBC is required to operate an average of approximately 40 trains per hour. If InTransitBC were to provide only 35 trains per hour it would receive 87.5% (35/40) of its maximum availability and quality payments. Performance at this level on a sustained basis (assuming CLCO or InTransitBC’s lenders did not exercise any contractual remedies) would reduce InTransitBC’s profit by more than 50%.
Quality of service of available trains is to be determined by measuring passenger accessibility, comfort and convenience, general repair and cleanliness of vehicles and stations, and vehicle and station safety. Payments to InTransitBC will be reduced if quality of service does not meet the standards set out in the Agreement.
The ridership forecasts are to be established for every five years of operations as well as at the commencement of the first year and at the end of the second year of operations. The ridership forecasts may be adjusted once per year in response to events that could reasonably be expected to have a material effect on the forecast ridership. Such events include changes in GVTA bus services, the addition of stations and increases in fare levels.
In the unlikely event that InTransitBC fails to meet its obligations over the 35-year term of the Agreement such that it would be declared in default due to non-performance, CLCO could elect to terminate the Agreement. In such an event, CLCO needs to be certain that InTransitBC would have sufficient capital at risk to fund CLCO’s costs to complete or refurbish the project. Given that the risks transferred to InTransitBC are significant, the Agreement is structured such that its capital is at risk if the project suffers cost overruns or poor operating performance. In addition to the at-risk capital, there are corporate guarantees and financial letters of credit to secure the performance of InTransitBC and its construction contractor (SNC-Lavalin) during the construction and operating periods. The presence of the at-risk capital, guarantees, and letters of credit should ensure that the risks transferred to InTransitBC will remain with InTransitBC (see Appendix D for more detail).

14 of 36
3.1.2 The Essential Elements and the Affordability Tests
The Local Funding Agencies established in their funding agreements numerous commercial and technical specifications for the project. The Concession Agreement complies with each of the Essential Elements, with a few minor exceptions, as noted in Appendix B.
GVTA also set requirements for affordability that had to be met before they would approve the project. There are two tests:
1. a construction period test that involves comparing the total forecast construction period costs to the forecast of funding available during that period; and
2. an operating period test that compares the net present value of CLCO’s payments to InTransitBC during the operating period, plus the cost of managing the Agreement, to the net present value of the project’s reasonably forecast sources of funding over the operating period.
The tests exclude the cost of those aspects of the project that are directly funded and managed by GVTA and the Cities of Vancouver and Richmond. This includes the provision of GVTA designated policing units, certain operating period insurance policies, GVTA and City funding of major road construction, cost of trolley wires, construction of bus loops and ticket vending machines. Given that the tests exclude these costs, they cannot be, and are not intended to be interpreted as comprehensive tests of overall affordability.
It should be noted that each of these tests is based on forecasts and assumptions and is subject to uncertainty as discussed in the introduction to Section 3. At Financial Close, CLCO determined that the tests had been met. A detailed discussion of the tests is provided in Appendix C.
15 of 36
3.1.3 Total Construction Cost and Funding
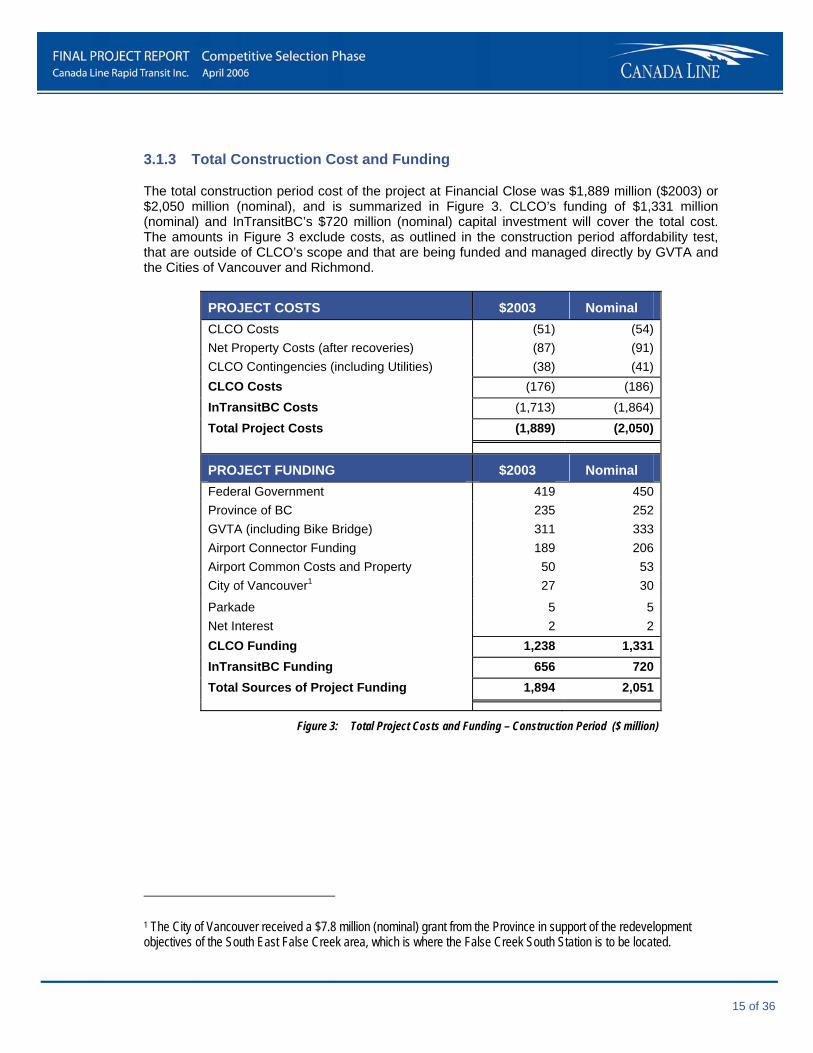
The total construction period cost of the project at Financial Close was $1,889 million ($2003) or $2,050 million (nominal), and is summarized in Figure 3. CLCO’s funding of $1,331 million (nominal) and InTransitBC’s $720 million (nominal) capital investment will cover the total cost. The amounts in Figure 3 exclude costs, as outlined in the construction period affordability test, that are outside of CLCO’s scope and that are being funded and managed directly by GVTA and the Cities of Vancouver and Richmond.
PROJECT COSTS $2003 Nominal CLCO Costs (51) (54)Net Property Costs (after recoveries) (87) (91)CLCO Contingencies (including Utilities) (38) (41)CLCO Costs (176) (186)InTransitBC Costs (1,713) (1,864)Total Project Costs (1,889) (2,050)
PROJECT FUNDING $2003 Nominal Federal Government 419 450 Province of BC 235 252 GVTA (including Bike Bridge) 311 333 Airport Connector Funding 189 206 Airport Common Costs and Property 50 53 City of Vancouver1 27 30
Parkade 5 5 Net Interest 2 2 CLCO Funding 1,238 1,331 InTransitBC Funding 656 720 Total Sources of Project Funding 1,894 2,051
Figure 3: Total Project Costs and Funding – Construction Period ($ million)1
1 The City of Vancouver received a $7.8 million (nominal) grant from the Province in support of the redevelopment objectives of the South East False Creek area, which is where the False Creek South Station is to be located.

16 of 36
3.2 Net Cost of the Project and the Public Sector Comparator (PSC)
To assist with its assessment of value for money, CLCO developed a methodology for comparing:
• the forecast net cost of the PSC; with
• the forecast net cost of the Agreement, including all public sector costs.
The methodology is based on financial and statistical modelling of costs and revenues and associated risks over a 35-year period.
3.2.1 Basis for the Comparison
In addition to allowing proponents to propose different technical solutions, the competitive selection process allowed them to propose different levels of system performance with the requirement that the system meet the Essential Elements. The different levels of system performance could result from different vertical alignments (e.g. the amount of tunnelling, elevated, in-trench or at-grade alignments) and different service patterns (e.g. travel times, station access times and train schedules).
The evaluation criteria established during the competitive selection process was structured to take these differences into account; in particular, to consider the differing amounts of incremental ridership revenues generated relative to the revenues that would be generated if the system was not built. This was achieved by comparing the net cost of the proposals (their gross cost less their forecast incremental ridership revenue) over the 35-year term of the Agreement. For example, a system that cost $1,600 million and that generated $300 million of incremental ridership revenue would have a net cost of $1,300 million. This proposal would be preferred to a system that cost less to build and operate, say $1,550 million but which only generated $200 million of incremental ridership revenue, resulting in a net cost of $1,350 million; $50 million more than the first system (all figures expressed as net present values (NPV)2). The assessment of value for money has been conducted on this basis.
2 Costs and revenues of the project are expressed as cash flow projections over the term of the Agreement (about 35 years). In order to reflect the time value of money, such cash flows are often presented in Net Present Value (NPV) terms. NPV is calculated by applying a compounding discount rate to a stream of future cash flows. This calculation reduces these cash flows to a single value reflecting the time value of money. All NPV amounts in this report, unless otherwise stated, are the result of discounting annual costs and revenues to the year 2003, using a 6% nominal discount rate.
17 of 36
The analysis compares the range of forecast net costs of the project and of the PSC after considering estimates of:
• CLCO and GVTA management costs; • construction costs, including expected (at the 50th percentile) impact of risk; • operating costs, including (at the 50th percentile) impact of risk; • the cost of private capital; and • incremental ridership revenues (at the 50th percentile).
The construction and operating costs include costs within CLCO’s scope as well as costs that are outside of CLCO’s scope, including GVTA and City managed costs, such as the cost of major road construction, cost of trolley wires, construction of bus loops and ticket vending machines, the cost of designated policing units, and ticket vending machine maintenance costs. The value for money analysis does not account for the cost of public funding, because each of the PSC and the project do not bear the cost of financing public sector funding. Nor does the analysis consider the net bus costs saved by GVTA, as these are assumed to be the same for the PSC and the project.
3.2.2 Public Sector Comparator
The PSC is a public sector benchmark for the procurement, design, construction, and operation of the project. Given that the provincial funding was conditional upon the project being developed as a P3, the PSC is a hypothetical concept intended to provide a reasonable comparison with the net cost of the project. The PSC is based on a conceptual design and procurement approach (or reference project) developed by a team of over twenty experienced professionals including transportation engineers and planners, transit system operations experts, quantity surveyors and ridership experts. The PSC team developed the cost and revenue estimates for the PSC and CLCO retained PricewaterhouseCoopers (PwC), a major international consulting firm with significant P3 experience, to model and compare the net cost of the PSC with the project.
The reference project used for the PSC was peer-reviewed and value engineered by a panel of experts from Canada, the US and the UK to ensure it was capable of being constructed and operated efficiently. The value engineering of the reference design resulted in reductions in the PSC construction and operating costs. Overall costs and risks were then assessed based on this reference project and a public sector approach to procurement.
The procurement approach for the reference project assumed the use of several major design-build contracts for tunnelling and elevated guideway construction, with design, price and completion schedule risks allocated to private sector contractors. The remaining construction work, including stations, was assumed to have been completed under separate contracts for design and construction, with the majority of risks retained by the public sector. Responsibility for integration of the civil works and electromechanical systems, operations and maintenance, and all other related risks, were assumed to remain with the public sector.
The cost of the reference project was reviewed and amended at each stage of the procurement process to reflect changes in scope, and more refined estimates of cost and risk as they became available (e.g. property costs were updated following detailed research on property pricing by CLCO). The PSC was effectively competing with the proposals put forward by the private sector proponents during each of the stages of the procurement. Consequently, the PSC was not adjusted to reflect InTransitBC’s innovations. In particular, the PSC does not include higher midday train frequencies, the elimination of a station at the airport, the single tracking of the line in Richmond and

18 of 36
at the airport and the specific alignment and mixture of construction techniques in Vancouver and Richmond. The PSC ridership forecast, as is discussed in Sections 3.2.7 and 3.2.8, is lower than the project forecast. Had the PSC actually been constructed as designed, it is possible that the PSC ridership could be increased by increasing midday train frequencies (but not by improving station access times, as they cannot be materially improved once stations are constructed).
The PSC methodology was reviewed by KPMG, a major international firm with significant P3 experience, and by a former Auditor General for the Province, Mr. George Morfitt (see Appendix A for detail).
3.2.3 Risk Assessment
The net costs of the PSC and the project will vary depending on the allocation and impact of risk. The allocation of risk assumed for the PSC and agreed by contract for the project is summarized in Figure 4.
Risk Project PSC Phase Land acquisition cost and schedule CLCO CLCO Construction Municipal and regulatory permitting, cost CLCO/ InTransitBC CLCO Construction Municipal and regulatory permitting, delay InTransitBC CLCO Construction Undisclosed environmental or archaeological liabilities CLCO CLCO Construction Cost of design build packages InTransitBC CLCO Construction Cost of construction InTransitBC Contractors Construction Construction inflation (labour, steel, etc.) InTransitBC Contractors Construction Construction delay InTransitBC CLCO Construction Utility relocation cost / delay CLCO/InTransitBC CLCO Construction Changed ground condition (tunnels and foundations) InTransitBC CLCO Construction Design integration InTransitBC CLCO Construction Integration between civil works and systems InTransitBC CLCO Construction Public protest, legal action, embargo or blockade CLCO CLCO Construction / Operating Reasonableness of behaviour of Agencies and Cities CLCO CLCO Construction / Operating Force Majeure CLCO/InTransitBC CLCO Construction / Operating Insurance costs IInTransitBC/GVTA CLCO Construction / Operating Condition of civil assets (over the 35-year term) InTransitBC CLCO Construction / Operating Operating performance (over the 35-year term) InTransitBC CLCO Operating Operating costs (over the 35-year term) InTransitBC GVTA Operating Maintenance costs (over the 35-year term) InTransitBC GVTA Operating Useful life of trains and other systems InTransitBC GVTA Operating Ridership revenues ~90% GVTA
~10% InTransitBC 100% GVTA Operating
Figure 4: Allocation of Risk
Figure 4 shows that, under the Agreement, significantly more risk is transferred to InTransitBC than would be transferred under the PSC approach.

19 of 36
3.2.4 Risk Assessment of the PSC
For the PSC, each risk retained by the public sector was assessed in detail by a team that included representatives of CLCO, GVTA, Partnerships BC, Anthony Steadman and Associates (professional cost estimators), British Columbia Rapid Transit Corporation (a subsidiary of GVTA and the operator of the Expo and Millennium Lines), and experts in transit construction and operations. Halcrow/TSi provided ridership forecasts using the same models and methodology used to assess the proposals put forward by the various proponents. The purpose of this team was to establish a consensus view that represented the best professional judgement of the participants of the potential impact of each risk on cost and incremental revenue on a probabilistic basis.
For each cost item, the combined impact of risk was expressed as a premium over a risk-free estimate. The risk-free estimates did not include any allowances for risk, contingency or margin. The risk-free estimates can be considered as the lowest possible price that could be achieved assuming contractors would not charge for risk and that the most optimistic results were achieved in all circumstances.
For construction costs, the risk-free estimates were based on the project cost estimate, after value engineering, less the contingencies included in the cost estimates. For example the cost of constructing elevated guideway was assessed as having a risk-free cost of $162 million ($2003) and the risks allocated to the public sector in respect of elevated guideway were projected to have a minimum impact on cost of 5% (at the 5th percentile), an expected impact of 15% (at the 50th percentile) and a maximum impact of 25% (at the 95th percentile). Based on this example, the range of cost for elevated guideway assessed in the PSC in $2003 was $170 million, $186 million and $203 million at the 5th, 50th and 95th percentile of risk.
3.2.5 Risk Assessment of the Project
CLCO developed a registry, the structure of which is based on precedents developed by the provincial Risk Management Branch, of identified risks associated with the project. The registry was developed with the input of CLCO staff, Local Funding Agency representatives, and management representatives from other major infrastructure projects. CLCO engaged the Performance Improvement and Risk Management Practice of PwC to review the registry and the approach to identifying and estimating risks. The registry was updated throughout the procurement and reflected the specific risk allocation to CLCO in the Concession Agreement at Financial Close. The registry includes descriptions of the potential impact of each risk on cost, delay and incremental revenue.
3.2.6 Statistical Analysis
The aggregate impact of all risks identified and quantified for each of the PSC and the project was assessed using statistical techniques which combine the impact of risks on the net cost of each of the PSC and the project. This type of modelling methodology is widely accepted as valid.
The statistical analysis allows the impact of risks that are expressed in different ways and to differing levels of confidence to be combined or aggregated into an overall risk distribution. For example, many risks have been assessed at the 5th, 50th and 95th percentile (such as the impact of risk on the cost of the guideway) while others, such as ridership, have been assessed at the
20 of 36
20th, 50th and 80th percentile. The statistical analysis expresses a combined risk impact distribution as a range that covers 0 to 100th percentile of risk, even when some specific risks cannot be precisely measured. The 5th and 95th percentile of risk have been chosen as the limits to the distribution of risk as the 0 to 5th percentile range and 95th to 100th percentile range include results that do not have any credible likelihood of occurring.
3.2.7 Net Cost of the PSC and the Project
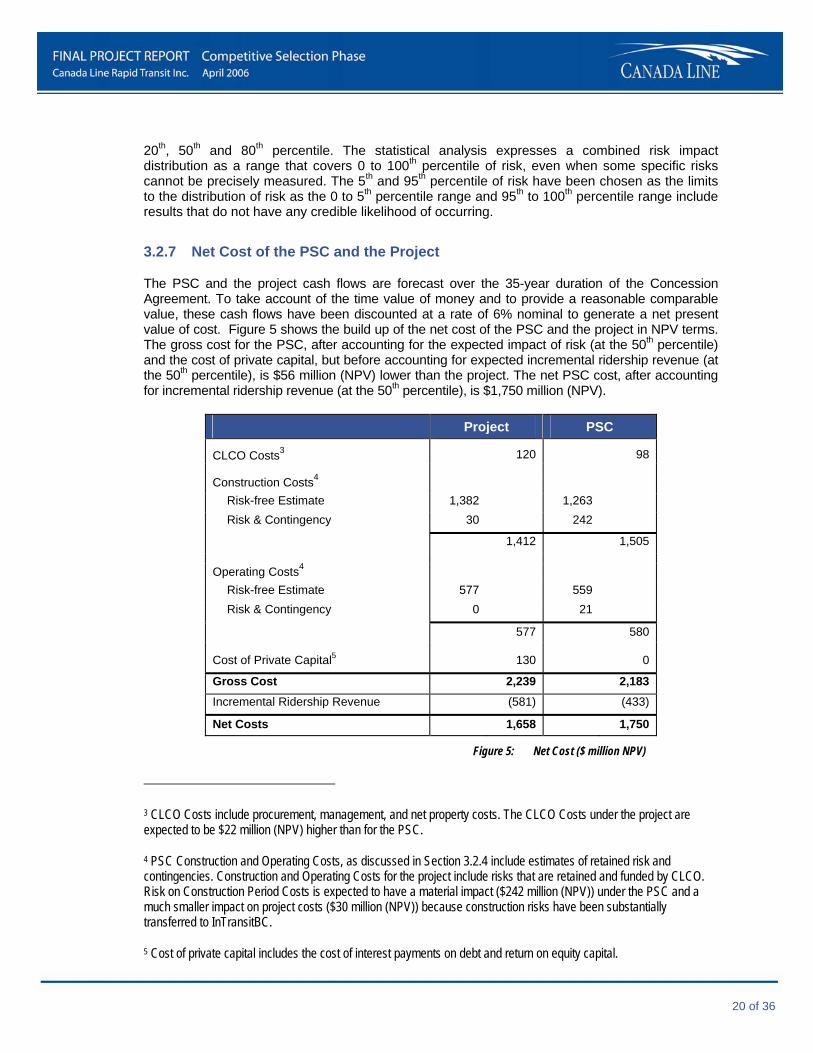
The PSC and the project cash flows are forecast over the 35-year duration of the Concession Agreement. To take account of the time value of money and to provide a reasonable comparable value, these cash flows have been discounted at a rate of 6% nominal to generate a net present value of cost. Figure 5 shows the build up of the net cost of the PSC and the project in NPV terms. The gross cost for the PSC, after accounting for the expected impact of risk (at the 50th percentile) and the cost of private capital, but before accounting for expected incremental ridership revenue (at the 50th percentile), is $56 million (NPV) lower than the project. The net PSC cost, after accounting for incremental ridership revenue (at the 50th percentile), is $1,750 million (NPV).
Project PSC
CLCO Costs3 120 98
Construction Costs4 Risk-free Estimate 1,382 1,263 Risk & Contingency 30 242
1,412 1,505
Operating Costs4 Risk-free Estimate 577 559 Risk & Contingency 0 21
577 580
Cost of Private Capital5 130 0
Gross Cost 2,239 2,183 Incremental Ridership Revenue (581) (433)
Net Costs 1,658 1,750
Figure 5: Net Cost ($ million NPV)3 4 5
3 CLCO Costs include procurement, management, and net property costs. The CLCO Costs under the project are expected to be $22 million (NPV) higher than for the PSC.
4 PSC Construction and Operating Costs, as discussed in Section 3.2.4 include estimates of retained risk and contingencies. Construction and Operating Costs for the project include risks that are retained and funded by CLCO. Risk on Construction Period Costs is expected to have a material impact ($242 million (NPV)) under the PSC and a much smaller impact on project costs ($30 million (NPV)) because construction risks have been substantially transferred to InTransitBC.
5 Cost of private capital includes the cost of interest payments on debt and return on equity capital.

21 of 36
The net cost of the project, including the expected impact of risk (at the 50th percentile) is $1,658 million, or $92 million (NPV) less than the net cost of the PSC. The expected (at the 50th percentile) incremental ridership revenue of the project is $148 million NPV greater than with the PSC. The higher forecast ridership revenue for the project at both peak and midday hours is due to more accessible station designs (shorter access times from the station entrance to the train, e.g., fewer stairs to climb), train design and more frequent train service. Specifically, the higher midday ridership for the project (about one-third higher) is due to more frequent train service at midday.
The range of impact of risk at the 5th and 95th percentile of risk for both the PSC and the project is shown in Figure 6.
1,568
90 229
90
268
1,748
2,018
1,521
1,658
1,750
1,400
1,500
1,600
1,700
1,800
1,900
2,000
2,100
Project PSC
Figure 6: Range of Expected Cost of the PSC and Project ($ million NPV)
Figure 6 shows that:
• risk can be expected to have less combined impact on the net cost of the project than of the PSC (illustrated by the narrower range of costs above) because more risk is transferred to InTransitBC. This means that there is more certainty on the forecast net cost of the project than of the PSC;
0 Project PSC
5th Percentile
50th Percentile
95th Percentile
5th Percentile
50th Percentile
95th Percentile
22 of 36
• at the expected level of risk impact (the 50th percentile of risk, shown in the central boxes) the project has a forecast net cost of $1,658 million, which is $92 million lower than the PSC’s forecast net cost of $1,750 million;
• if the impact of risk is large (at the 95th percentile for both PSC and the project) the forecast net cost of the project is $270 million less than the PSC’s forecast net cost; and
• if the impact of risk is small (at the 5th percentile for both the PSC and project) the forecast net cost of the project is $47 million more than the PSC’s forecast net cost.
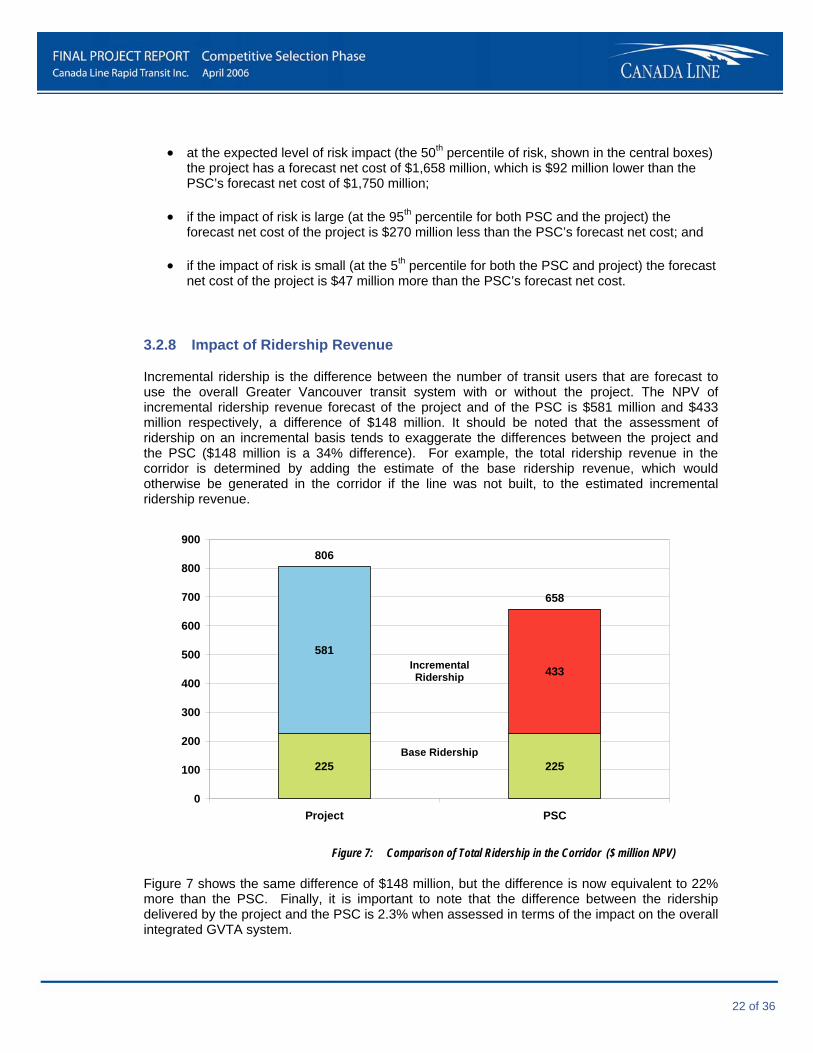
3.2.8 Impact of Ridership Revenue
Incremental ridership is the difference between the number of transit users that are forecast to use the overall Greater Vancouver transit system with or without the project. The NPV of incremental ridership revenue forecast of the project and of the PSC is $581 million and $433 million respectively, a difference of $148 million. It should be noted that the assessment of ridership on an incremental basis tends to exaggerate the differences between the project and the PSC ($148 million is a 34% difference). For example, the total ridership revenue in the corridor is determined by adding the estimate of the base ridership revenue, which would otherwise be generated in the corridor if the line was not built, to the estimated incremental ridership revenue.
225 225
581
433
806
658
0
100
200
300
400
500
600
700
800
900
Project PSC
Figure 7: Comparison of Total Ridership in the Corridor ($ million NPV)
Figure 7 shows the same difference of $148 million, but the difference is now equivalent to 22% more than the PSC. Finally, it is important to note that the difference between the ridership delivered by the project and the PSC is 2.3% when assessed in terms of the impact on the overall integrated GVTA system.
Incremental Ridership
Base Ridership

23 of 36
1,568 47
25 182 25
65
47
1,521
65
221
1,658
1,748
2,018
1,750
1,400
1,500
1,600
1,700
1,800
1,900
2,000
2,100
Project PSC
2525
Figure 8: Range of Cost – Ridership Risk Separated ($ million NPV)
In Figure 8, the range of expected cost at the 5th and 95th percentiles of risk before the inclusion of ridership risk is shown in blue for the project and brown/yellow for the PSC. The amount shown in green is the difference in the overall risk estimate generated by the statistical analysis with and without including a risk range for ridership revenue of plus or minus 15% at the 20th and 80th percentile.
Figure 8 shows that the range of expected net cost of the PSC and the project overlap. However, a significant proportion of the variation relates to incremental ridership revenue. The variability of the forecasts of plus or minus 15% applies equally to the project and the PSC. It would be unreasonable to assume that the minimum cost could be achieved for the project (assuming maximum revenue) while the maximum cost is achieved for the PSC (assuming minimum ridership revenue), or vice versa.
Figure 8 also shows that the risk range of the project is narrower than that of the PSC and that:
• ridership revenue risk is greater for the project (by approximately one third) because it is projected to generate around one third more ridership revenue;
• of the total risk ranges shown at the 5th and 95th percentiles, 72% of the variability of the net cost of the project relates to ridership revenue risk compared to around 19% for the PSC; and
Project PSC
0
5th Percentile
50th Percentile
95th Percentile
5th Percentile
50th Percentile
95th Percentile

24 of 36
• risks other than ridership could have an impact of plus or minus $25 million on the net cost of the project, compared with a range of plus $221 million to minus $182 million for the PSC.
Based on this analysis, the net cost of the project, before considering ridership revenue risk, appears considerably more certain than that of the PSC, reflecting the enhanced risk transfer of the project.
3.2.9 Sensitivity to Discount Rate
The assessment of net cost in this report has been prepared using a discount rate of 6% nominal, which is the rate GVTA uses to assess the economics of various transportation capital projects6. To assess whether the net cost analysis is sensitive to the discount rate, sensitivity analysis has been performed using two discount rates:
• 5% nominal; and
• 7% nominal, the discount rate used during the RFP stage.
The impact of the change in discount rate on cost is greater for the project than the PSC. This is because a greater proportion of the project’s costs occur over the operating period as a portion of capital costs are financed with private capital whereas the full cost of building the line is paid during construction in the PSC.
Figure 9 shows that the difference in Net Cost between the project and the PSC is sensitive to the discount rate utilized; however, the expected (at the 50th percentile) Net Cost of the project remains lower than that of the PSC throughout the sensitivity range.
Discount Rate Net Cost Project Net Cost PSC Difference in Cost
7% nominal 1,539 1,682 143
6% nominal 1,658 1,750 92
5% nominal 1,797 1,824 27
Figure 9: Sensitivity of Net Cost to Discount Rate ($ million NPV)
6 In 2004, GVTA lowered its capital analysis discount rate from 7% to 6%.
25 of 36
3.3 Transportation Benefits
CLCO also evaluated the transportation benefits generated by the project and the PSC and concluded that the project can be expected to provide greater transportation benefits to the Canada Line corridor transportation users than the PSC.
Transportation benefits provide an indication of the relative benefits to users of implementing one system versus another system without performing a detailed benefit/cost analysis. The benefits are measured by assigning an aggregate value to the time that transportation system users would save as a result of the impact of each of the project and the PSC on the corridor transportation system. The transportation benefits are $773 million in NPV terms for the PSC and $849 million in NPV terms for the project over the 35-year term. The project generates $76 million, or 10% more transportation benefits than the PSC. The difference in transportation benefits is related to the expected difference in estimated ridership between the project and the PSC.
26 of 36
Appendix A External Scrutiny of CLCO’s Work
CLCO undertook its work under the guidance and review of its Board. In addition, CLCO referred specific commercial and technical matters and processes to experts for their review and judgment. As an example, CLCO appointed John Haythorne, a senior partner of the law firm Bull, Housser & Tupper, to advise CLCO and the proponents on issues of conflict. Persons involved in the evaluation process provided declarations of any conflicts to the other members of their committee or team prior to discussing any proposals or submissions.
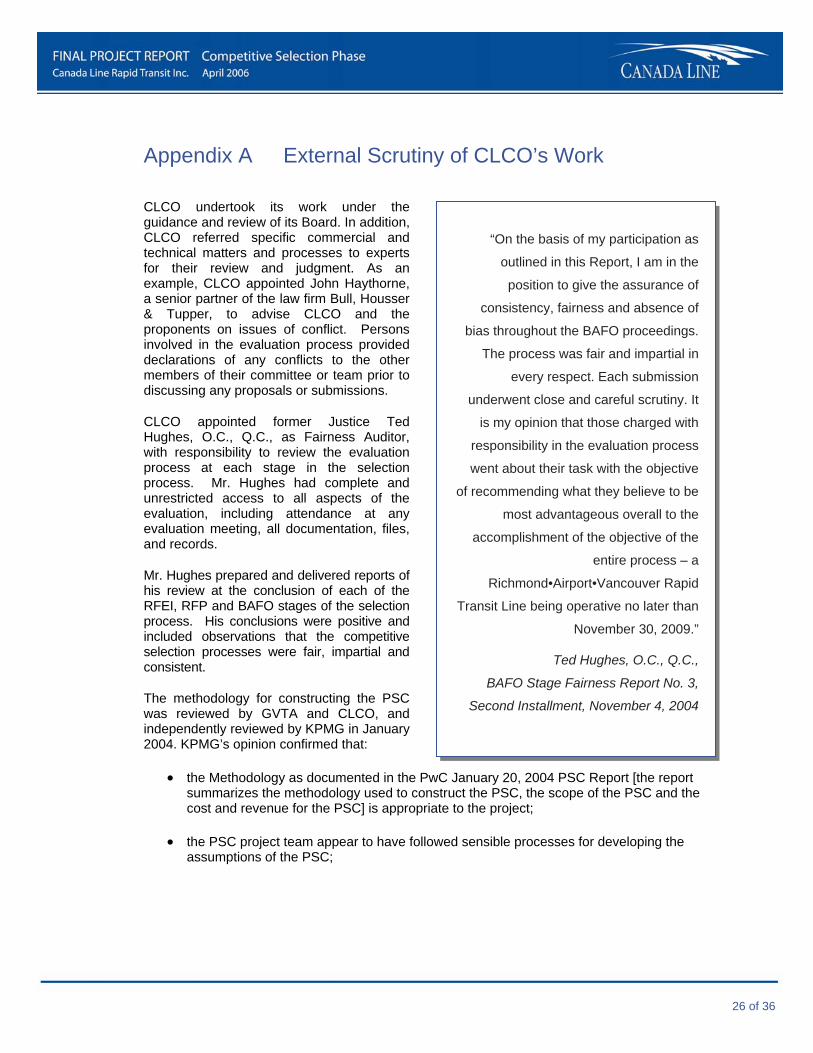
CLCO appointed former Justice Ted Hughes, O.C., Q.C., as Fairness Auditor, with responsibility to review the evaluation process at each stage in the selection process. Mr. Hughes had complete and unrestricted access to all aspects of the evaluation, including attendance at any evaluation meeting, all documentation, files, and records.
Mr. Hughes prepared and delivered reports of his review at the conclusion of each of the RFEI, RFP and BAFO stages of the selection process. His conclusions were positive and included observations that the competitive selection processes were fair, impartial and consistent.
The methodology for constructing the PSC was reviewed by GVTA and CLCO, and independently reviewed by KPMG in January 2004. KPMG’s opinion confirmed that:
• the Methodology as documented in the PwC January 20, 2004 PSC Report [the report summarizes the methodology used to construct the PSC, the scope of the PSC and the cost and revenue for the PSC] is appropriate to the project;
• the PSC project team appear to have followed sensible processes for developing the assumptions of the PSC;
“On the basis of my participation as
outlined in this Report, I am in the
position to give the assurance of
consistency, fairness and absence of
bias throughout the BAFO proceedings.
The process was fair and impartial in
every respect. Each submission
underwent close and careful scrutiny. It
is my opinion that those charged with
responsibility in the evaluation process
went about their task with the objective
of recommending what they believe to be
most advantageous overall to the
accomplishment of the objective of the
entire process – a
Richmond•Airport•Vancouver Rapid
Transit Line being operative no later than
November 30, 2009.”
Ted Hughes, O.C., Q.C.,
BAFO Stage Fairness Report No. 3,
Second Installment, November 4, 2004

27 of 36
• the assumptions driving the PSC have been appropriately and consistently applied; and
• the PSC as documented in the PSC Report represents a reasonable basis for the estimation of the potential public sector costs and risks and the assessment of value for money. Proper value for money analysis will require a like-to-like comparison of the PSC and the cost of the P3 proposal. Careful consideration is needed in reconciling cost and risk profiles between the PSC and the P3 proposal to ensure that the comparison is valid.
In addition, in April 2004, CLCO asked George Morfitt, former Auditor General for the Province of British Columbia, to review the PSC and RFP Stage Value for Money Report.
"... the methodology as documented in Appendix 1 of the PSC Report follows sensible processes for developing the assumptions in the PSC";
"... the PSC as documented in the PSC Report represents a reasonable basis for the estimation of the potential public sector costs and risks for the purpose of assessing value for money"; and
"... the conclusions of the PwC draft report dated March 30, 2004, entitled 'RAV Project: Value for Money' are reasonable."
George Morfitt,
April 2004

28 of 36
Appendix B The Essential Elements
Essential Elements
The Service Commencement date must be on or before November 30, 2009.
Milestone Payments set out in a BAFO Submission must not exceed the Agency funding contributions.
The net new revenues generated by the System together with the operating and debt service savings from reduced bus services and other Contributing Agency contributions, will cover the Availability Payments and Quality Payments during the Operating Period as described in a BAFO Submission.
The proposed System must provide:
• a high standard of design;
• a high level of safety and security; and
• minimal community and environmental impacts.
The vertical alignment will conform to the following:
• from the Southern terminus at Cook Road/Park Road at No. 3 Road to the Bridgeport Station, either at grade or elevated along No. 3 Road to cross the railway tracks near Bridgeport Station (the Southern Terminus has been moved, with the agreement of the Local Contributing Agencies and the City of Richmond, to Saba and No. 3 Road);
• elevated from Bridgeport Station to the Airport terminus, elevated from the Bridgeport Station to 63rd Avenue on Cambie Street (the Airport segment was changed, by agreement, such that a portion of the track will be at-grade, YVR1 station was moved and YVR3 Station has been deferred);
• elevated to cross the Fraser River, Marine Drive and other streets and railways for a fully grade-separated system;
• in trench or in tunnel between 63rd and south of 49th Avenue on Cambie Street for a partially grade-separated system; and/or
• at-grade between 63rd and 46th Avenues for an at-grade system; and from 46th Avenue (or 49th Avenue if a fully separated system) to the Downtown Vancouver terminus, in tunnel.
For a partially grade-separated system, at-grade pedestrian and vehicle crossings must be maintained at Cambie and 49th, 57th and 59th Avenues, with additional at-grade pedestrian crossings in the vicinities of 54th and 62nd Avenues. For a fully grade-separated system, grade-separated pedestrian and vehicle crossings must be maintained at Cambie and 57th and 59th Avenues, with additional pedestrian crossings in the vicinities of 54th and 62nd Avenues.
There will be no net loss of green space on the Cambie Heritage Boulevard in Vancouver and the Heritage landscape and urban design values of the Cambie Heritage Boulevard should be retained. Any trees removed must be replaced with trees of a species and diameter approved by CLCO.
29 of 36
Essential Elements
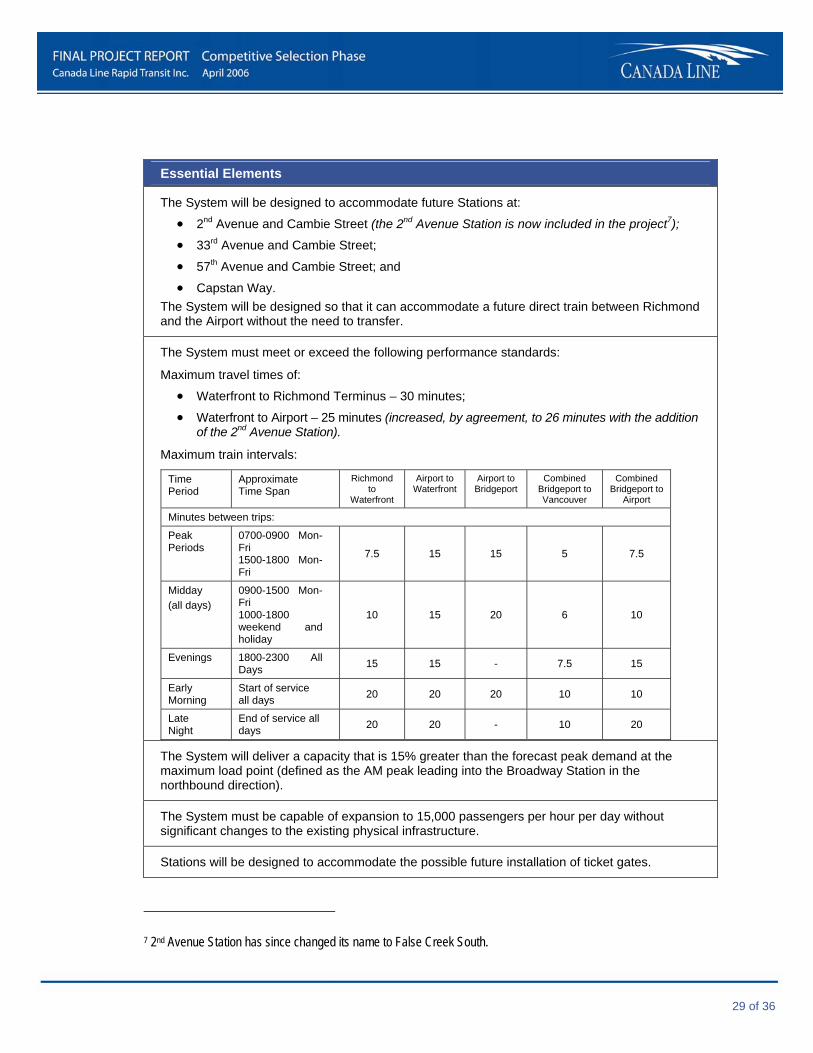
The System will be designed to accommodate future Stations at:
• 2nd Avenue and Cambie Street (the 2nd Avenue Station is now included in the project7);
• 33rd Avenue and Cambie Street;
• 57th Avenue and Cambie Street; and
• Capstan Way. The System will be designed so that it can accommodate a future direct train between Richmond and the Airport without the need to transfer.
The System must meet or exceed the following performance standards:
Maximum travel times of:
• Waterfront to Richmond Terminus – 30 minutes;
• Waterfront to Airport – 25 minutes (increased, by agreement, to 26 minutes with the addition of the 2nd Avenue Station).
Maximum train intervals:
Time Period
Approximate Time Span
Richmond to
Waterfront
Airport to Waterfront
Airport to Bridgeport
Combined Bridgeport to Vancouver
Combined Bridgeport to
Airport
Minutes between trips:
Peak Periods
0700-0900 Mon-Fri 1500-1800 Mon-Fri
7.5 15 15 5 7.5
Midday (all days)
0900-1500 Mon-Fri 1000-1800 weekend and holiday
10 15 20 6 10
Evenings 1800-2300 All Days 15 15 - 7.5 15
Early Morning
Start of service all days 20 20 20 10 10
Late Night
End of service all days 20 20 - 10 20
The System will deliver a capacity that is 15% greater than the forecast peak demand at the maximum load point (defined as the AM peak leading into the Broadway Station in the northbound direction).
The System must be capable of expansion to 15,000 passengers per hour per day without significant changes to the existing physical infrastructure.
Stations will be designed to accommodate the possible future installation of ticket gates.
7 2nd Avenue Station has since changed its name to False Creek South.
30 of 36
Essential Elements
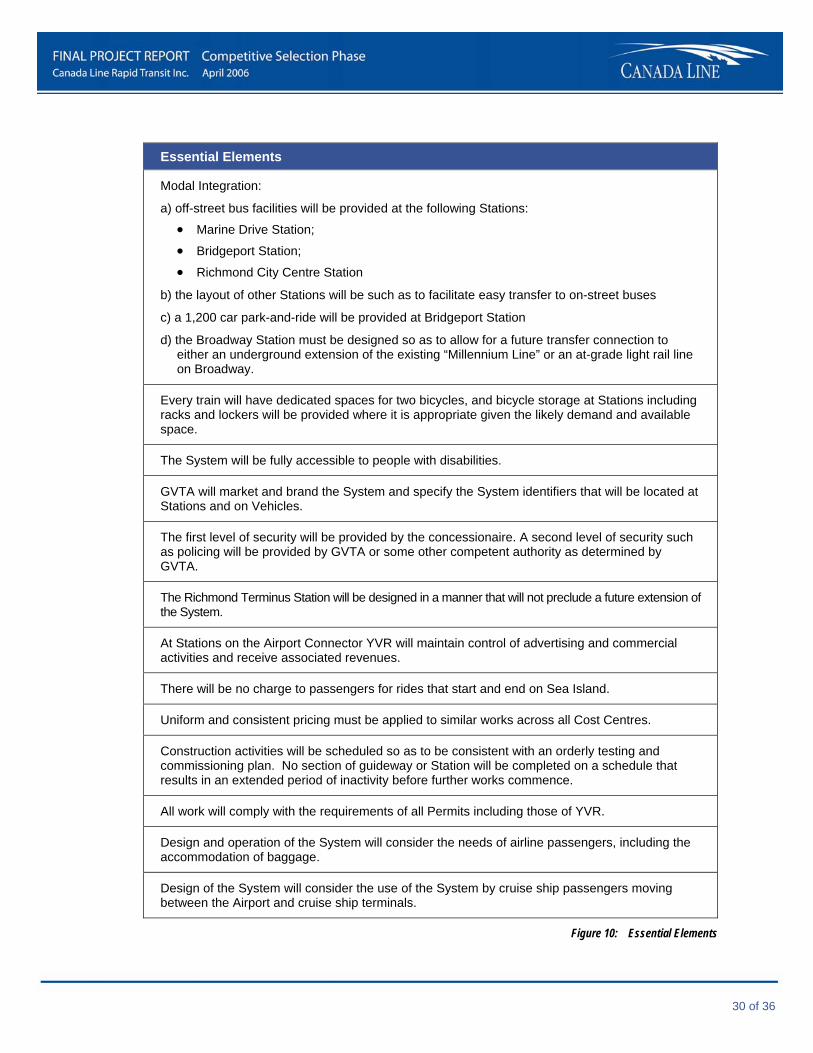
Modal Integration:
a) off-street bus facilities will be provided at the following Stations:
• Marine Drive Station;
• Bridgeport Station;
• Richmond City Centre Station
b) the layout of other Stations will be such as to facilitate easy transfer to on-street buses
c) a 1,200 car park-and-ride will be provided at Bridgeport Station
d) the Broadway Station must be designed so as to allow for a future transfer connection to either an underground extension of the existing “Millennium Line” or an at-grade light rail line on Broadway.
Every train will have dedicated spaces for two bicycles, and bicycle storage at Stations including racks and lockers will be provided where it is appropriate given the likely demand and available space.
The System will be fully accessible to people with disabilities.
GVTA will market and brand the System and specify the System identifiers that will be located at Stations and on Vehicles.
The first level of security will be provided by the concessionaire. A second level of security such as policing will be provided by GVTA or some other competent authority as determined by GVTA.
The Richmond Terminus Station will be designed in a manner that will not preclude a future extension of the System.
At Stations on the Airport Connector YVR will maintain control of advertising and commercial activities and receive associated revenues.
There will be no charge to passengers for rides that start and end on Sea Island.
Uniform and consistent pricing must be applied to similar works across all Cost Centres.
Construction activities will be scheduled so as to be consistent with an orderly testing and commissioning plan. No section of guideway or Station will be completed on a schedule that results in an extended period of inactivity before further works commence.
All work will comply with the requirements of all Permits including those of YVR.
Design and operation of the System will consider the needs of airline passengers, including the accommodation of baggage.
Design of the System will consider the use of the System by cruise ship passengers moving between the Airport and cruise ship terminals.
Figure 10: Essential Elements
31 of 36
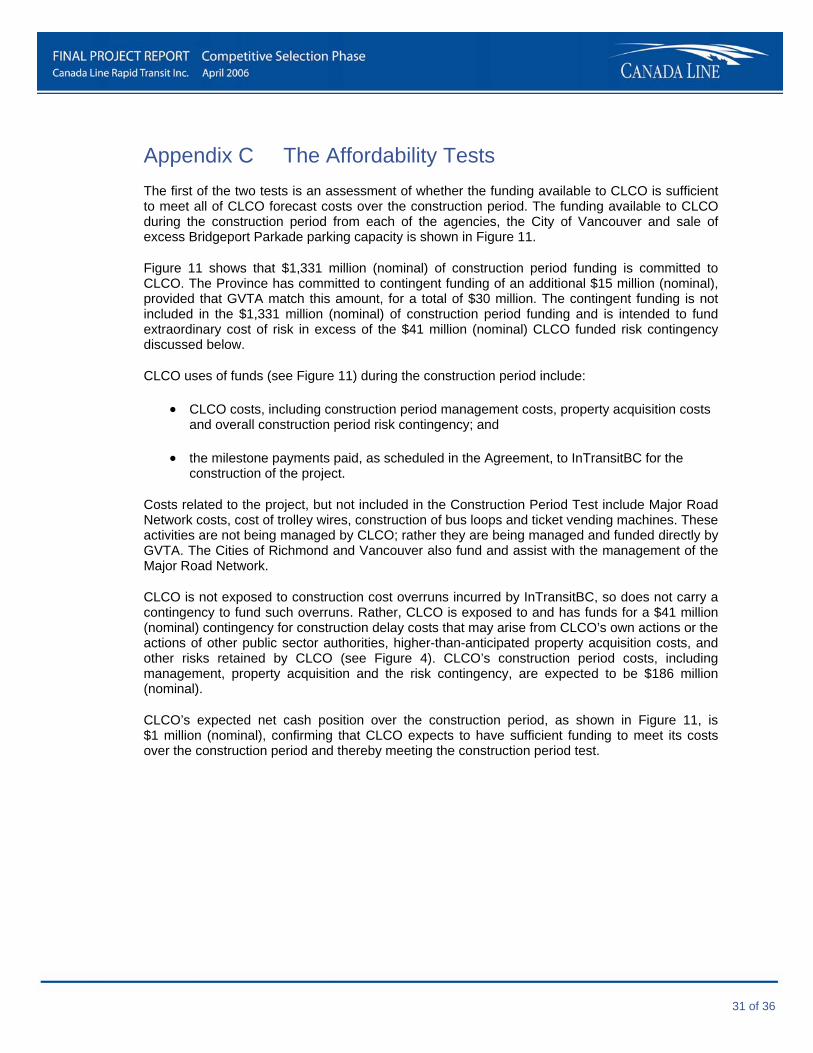
Appendix C The Affordability Tests The first of the two tests is an assessment of whether the funding available to CLCO is sufficient to meet all of CLCO forecast costs over the construction period. The funding available to CLCO during the construction period from each of the agencies, the City of Vancouver and sale of excess Bridgeport Parkade parking capacity is shown in Figure 11.
Figure 11 shows that $1,331 million (nominal) of construction period funding is committed to CLCO. The Province has committed to contingent funding of an additional $15 million (nominal), provided that GVTA match this amount, for a total of $30 million. The contingent funding is not included in the $1,331 million (nominal) of construction period funding and is intended to fund extraordinary cost of risk in excess of the $41 million (nominal) CLCO funded risk contingency discussed below.
CLCO uses of funds (see Figure 11) during the construction period include:
• CLCO costs, including construction period management costs, property acquisition costs and overall construction period risk contingency; and
• the milestone payments paid, as scheduled in the Agreement, to InTransitBC for the construction of the project.
Costs related to the project, but not included in the Construction Period Test include Major Road Network costs, cost of trolley wires, construction of bus loops and ticket vending machines. These activities are not being managed by CLCO; rather they are being managed and funded directly by GVTA. The Cities of Richmond and Vancouver also fund and assist with the management of the Major Road Network.
CLCO is not exposed to construction cost overruns incurred by InTransitBC, so does not carry a contingency to fund such overruns. Rather, CLCO is exposed to and has funds for a $41 million (nominal) contingency for construction delay costs that may arise from CLCO’s own actions or the actions of other public sector authorities, higher-than-anticipated property acquisition costs, and other risks retained by CLCO (see Figure 4). CLCO’s construction period costs, including management, property acquisition and the risk contingency, are expected to be $186 million (nominal).
CLCO’s expected net cash position over the construction period, as shown in Figure 11, is $1 million (nominal), confirming that CLCO expects to have sufficient funding to meet its costs over the construction period and thereby meeting the construction period test.

32 of 36
$2003 Nominal
CLCO SOURCES OF FUNDS: Federal Government 419 450 Province of BC 235 252 GVTA (include Bike Bridge) 311 333 Airport Connector Funding 189 206 Airport Common Costs and Property 50 53 City of Vancouver 27 30 Parkade 5 5 Net Interest 2 2 Total Sources of Funds 1,238 1,331
CLCO USES OF FUNDS: CLCO Costs (51) (54) Net Property Costs (after recoveries) (87) (91) CLCO Contingencies (including utilities) (38) (41) CLCO Direct Costs (176) (186)
Total Mainline Payments (833) (899) Airport Connector Payments (189) (206) False Creek South Payments (27) (30) Bike Bridge Payments (8) (9) CLCO Payments to InTransitBC (1,057) (1,144)
Total Uses of Funds (1,233) (1,330)
CLCO Net Cash Flow 5 1
Figure 11: CLCO Sources and Uses of Funds - Construction Period ($ million)
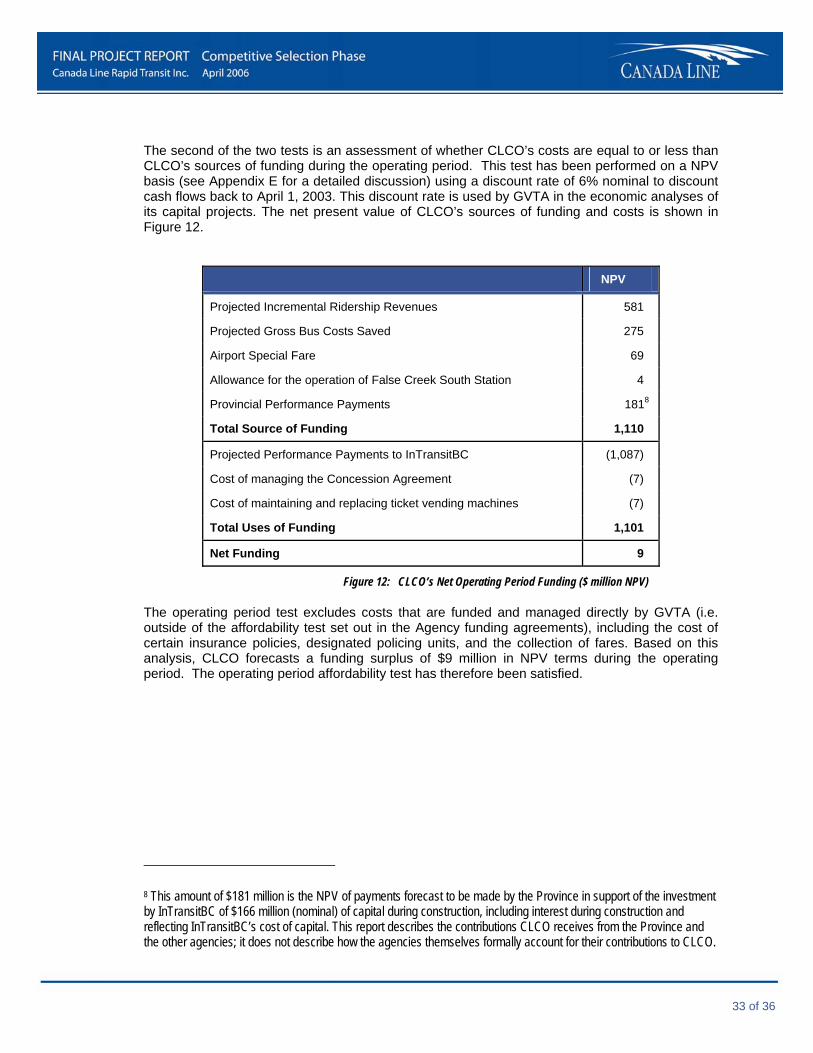
33 of 36
The second of the two tests is an assessment of whether CLCO’s costs are equal to or less than CLCO’s sources of funding during the operating period. This test has been performed on a NPV basis (see Appendix E for a detailed discussion) using a discount rate of 6% nominal to discount cash flows back to April 1, 2003. This discount rate is used by GVTA in the economic analyses of its capital projects. The net present value of CLCO’s sources of funding and costs is shown in Figure 12.
NPV
Projected Incremental Ridership Revenues 581
Projected Gross Bus Costs Saved 275
Airport Special Fare 69
Allowance for the operation of False Creek South Station 4
Provincial Performance Payments 1818
Total Source of Funding 1,110
Projected Performance Payments to InTransitBC (1,087)
Cost of managing the Concession Agreement (7)
Cost of maintaining and replacing ticket vending machines (7)
Total Uses of Funding 1,101
Net Funding 9
Figure 12: CLCO’s Net Operating Period Funding ($ million NPV)
The operating period test excludes costs that are funded and managed directly by GVTA (i.e. outside of the affordability test set out in the Agency funding agreements), including the cost of certain insurance policies, designated policing units, and the collection of fares. Based on this analysis, CLCO forecasts a funding surplus of $9 million in NPV terms during the operating period. The operating period affordability test has therefore been satisfied.
8 This amount of $181 million is the NPV of payments forecast to be made by the Province in support of the investment by InTransitBC of $166 million (nominal) of capital during construction, including interest during construction and reflecting InTransitBC’s cost of capital. This report describes the contributions CLCO receives from the Province and the other agencies; it does not describe how the agencies themselves formally account for their contributions to CLCO.
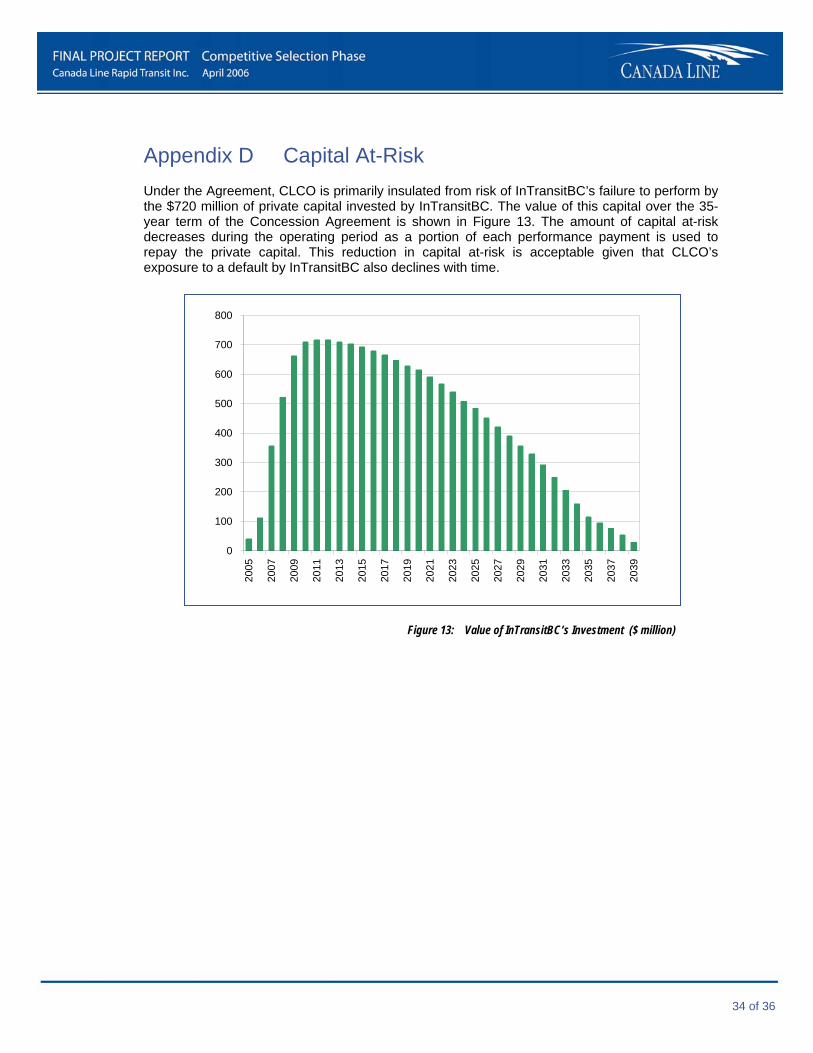
34 of 36
Appendix D Capital At-Risk Under the Agreement, CLCO is primarily insulated from risk of InTransitBC’s failure to perform by the $720 million of private capital invested by InTransitBC. The value of this capital over the 35-year term of the Concession Agreement is shown in Figure 13. The amount of capital at-risk decreases during the operating period as a portion of each performance payment is used to repay the private capital. This reduction in capital at-risk is acceptable given that CLCO’s exposure to a default by InTransitBC also declines with time.
0
100
200
300
400
500
600
700
800
2005
2007
2009
2011
2013
2015
2017
2019
2021
2023
2025
2027
2029
2031
2033
2035
2037
2039
Figure 13: Value of InTransitBC’s Investment ($ million)
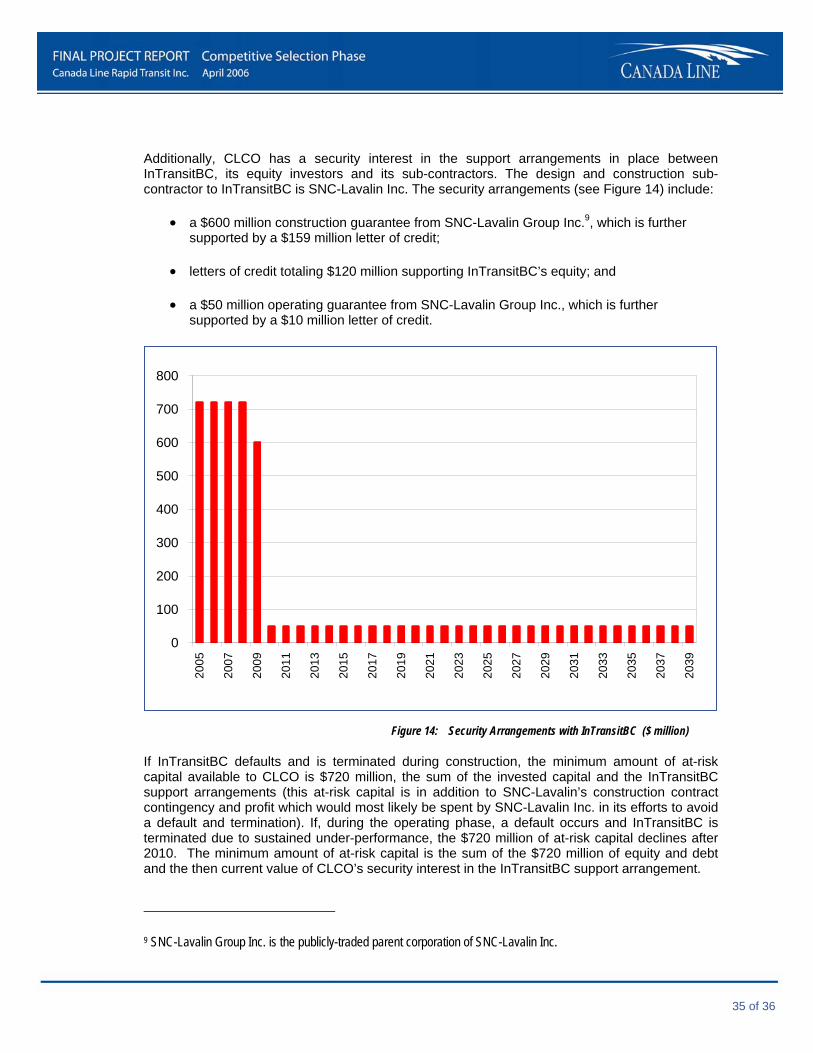
35 of 36
Additionally, CLCO has a security interest in the support arrangements in place between InTransitBC, its equity investors and its sub-contractors. The design and construction sub-contractor to InTransitBC is SNC-Lavalin Inc. The security arrangements (see Figure 14) include:
• a $600 million construction guarantee from SNC-Lavalin Group Inc.9, which is further supported by a $159 million letter of credit;
• letters of credit totaling $120 million supporting InTransitBC’s equity; and
• a $50 million operating guarantee from SNC-Lavalin Group Inc., which is further supported by a $10 million letter of credit.
0
100
200
300
400
500
600
700
800
2005
2007
2009
2011
2013
2015
2017
2019
2021
2023
2025
2027
2029
2031
2033
2035
2037
2039
Figure 14: Security Arrangements with InTransitBC ($ million)
If InTransitBC defaults and is terminated during construction, the minimum amount of at-risk capital available to CLCO is $720 million, the sum of the invested capital and the InTransitBC support arrangements (this at-risk capital is in addition to SNC-Lavalin’s construction contract contingency and profit which would most likely be spent by SNC-Lavalin Inc. in its efforts to avoid a default and termination). If, during the operating phase, a default occurs and InTransitBC is terminated due to sustained under-performance, the $720 million of at-risk capital declines after 2010. The minimum amount of at-risk capital is the sum of the $720 million of equity and debt and the then current value of CLCO’s security interest in the InTransitBC support arrangement.
9 SNC-Lavalin Group Inc. is the publicly-traded parent corporation of SNC-Lavalin Inc.
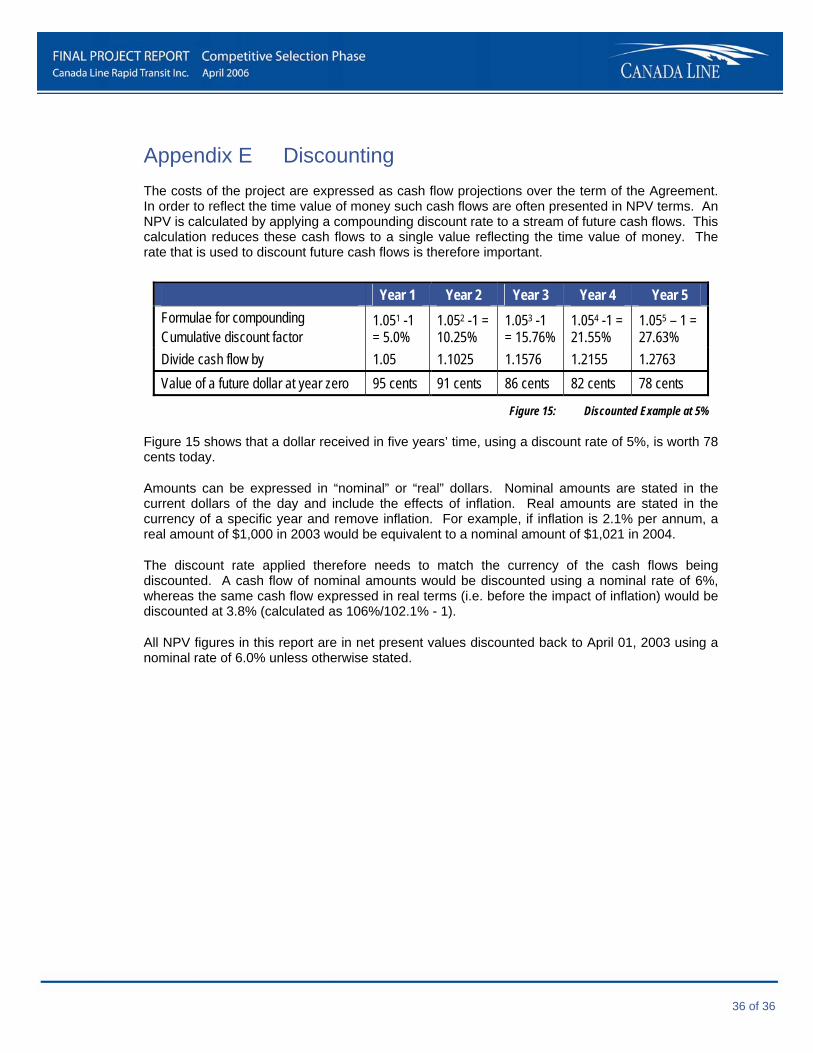
36 of 36
Appendix E Discounting The costs of the project are expressed as cash flow projections over the term of the Agreement. In order to reflect the time value of money such cash flows are often presented in NPV terms. An NPV is calculated by applying a compounding discount rate to a stream of future cash flows. This calculation reduces these cash flows to a single value reflecting the time value of money. The rate that is used to discount future cash flows is therefore important.
Year 1 Year 2 Year 3 Year 4 Year 5 Formulae for compounding Cumulative discount factor
1.051 -1 = 5.0%
1.052 -1 = 10.25%
1.053 -1 = 15.76%
1.054 -1 = 21.55%
1.055 – 1 = 27.63%
Divide cash flow by 1.05 1.1025 1.1576 1.2155 1.2763 Value of a future dollar at year zero 95 cents 91 cents 86 cents 82 cents 78 cents
Figure 15: Discounted Example at 5%
Figure 15 shows that a dollar received in five years’ time, using a discount rate of 5%, is worth 78 cents today.
Amounts can be expressed in “nominal” or “real” dollars. Nominal amounts are stated in the current dollars of the day and include the effects of inflation. Real amounts are stated in the currency of a specific year and remove inflation. For example, if inflation is 2.1% per annum, a real amount of $1,000 in 2003 would be equivalent to a nominal amount of $1,021 in 2004.
The discount rate applied therefore needs to match the currency of the cash flows being discounted. A cash flow of nominal amounts would be discounted using a nominal rate of 6%, whereas the same cash flow expressed in real terms (i.e. before the impact of inflation) would be discounted at 3.8% (calculated as 106%/102.1% - 1).
All NPV figures in this report are in net present values discounted back to April 01, 2003 using a nominal rate of 6.0% unless otherwise stated.
Related Documents