DOI: 10.1542/peds.2007-2564 2009;123;723-730 Pediatrics Burguet, Paul Sagot, Christine Binquet and Jean-Bernard Gouyon Cyril Ferdynus, Catherine Quantin, Michal Abrahamowicz, Robert Platt, Antoine Neonatal Outcomes? Identification of Small-for-Gestational-Age Newborns at Risk of Adverse Can Birth Weight Standards Based on Healthy Populations Improve the http://www.pediatrics.org/cgi/content/full/123/2/723 located on the World Wide Web at: The online version of this article, along with updated information and services, is rights reserved. Print ISSN: 0031-4005. Online ISSN: 1098-4275. Grove Village, Illinois, 60007. Copyright © 2009 by the American Academy of Pediatrics. All and trademarked by the American Academy of Pediatrics, 141 Northwest Point Boulevard, Elk publication, it has been published continuously since 1948. PEDIATRICS is owned, published, PEDIATRICS is the official journal of the American Academy of Pediatrics. A monthly at Edward G. Miner Library on February 10, 2009 www.pediatrics.org Downloaded from

Welcome message from author
This document is posted to help you gain knowledge. Please leave a comment to let me know what you think about it! Share it to your friends and learn new things together.
Transcript
DOI: 10.1542/peds.2007-2564 2009;123;723-730 Pediatrics
Burguet, Paul Sagot, Christine Binquet and Jean-Bernard Gouyon Cyril Ferdynus, Catherine Quantin, Michal Abrahamowicz, Robert Platt, Antoine
Neonatal Outcomes?Identification of Small-for-Gestational-Age Newborns at Risk of Adverse Can Birth Weight Standards Based on Healthy Populations Improve the
http://www.pediatrics.org/cgi/content/full/123/2/723located on the World Wide Web at:
The online version of this article, along with updated information and services, is
rights reserved. Print ISSN: 0031-4005. Online ISSN: 1098-4275. Grove Village, Illinois, 60007. Copyright © 2009 by the American Academy of Pediatrics. All and trademarked by the American Academy of Pediatrics, 141 Northwest Point Boulevard, Elkpublication, it has been published continuously since 1948. PEDIATRICS is owned, published, PEDIATRICS is the official journal of the American Academy of Pediatrics. A monthly
at Edward G. Miner Library on February 10, 2009 www.pediatrics.orgDownloaded from
ARTICLE
Can Birth Weight Standards Based on HealthyPopulations Improve the Identification ofSmall-for-Gestational-Age Newborns at Risk ofAdverse Neonatal Outcomes?Cyril Ferdynus, MSa,b, Catherine Quantin, MD, PhDc,d, Michal Abrahamowicz, PhDe, Robert Platt, PhDe, Antoine Burguet, MD, PhDa,f,
Paul Sagot, MDa,g, Christine Binquet, MD, PhDf, Jean-Bernard Gouyon, MD, PhDa,h
aCentre d’Epidemiologie des Populations EA4184, Universite de Bourgogne, Dijon, France; bCellule d’Evaluation du Reseau Perinatal de Bourgogne, dService deBiostatistiques et d’Informatique Medicale, hService de Pediatrie, and gService d’Obstetrique, CHRU Dijon, France; cINSERM, U866, and fCentre d’Investigation Clinique-Epidemiologie Clinique/Essais Cliniques CIE1, Dijon, France; eDepartment of Epidemiology and Biostatistics, McGill University, Montreal, Quebec, Canada
The authors have indicated they have no financial relationships relevant to this article to disclose.
What’s Known on This Subject
Neonatal BW standards defined on populations that include maternal diseases may beless appropriate for the identification of neonates as SGA and at risk of adverse outcomethan fetal growth standards.
What This Study Adds
The use of neonatal BW standards defined on healthy populations improves the identi-fication of preterm neonates as SGA and at risk of poor neonatal outcome.
ABSTRACT
OBJECTIVES. To develop neonatal growth standards based on (1) the entire population oflive births and (2) a healthy subpopulation and compare them in identifying infantsas small for gestational age and at risk of adverse neonatal outcomes.
PATIENTS AND METHODS.We included all births, between 28 and 41 weeks of gestation,reported in Burgundy (France) from 2000 to 2006. Fetal deaths, multiple births, andchromosomal aberrations were excluded. We first estimated separate birth weightdistributions at each week of gestation for (1) all neonates and (2) only infants bornfrom women without maternal diseases. Small for gestational age was defined as abirth weight below the 10th percentile of the corresponding standard. We assessedthe associations of small for gestational age on the basis of the alternative definitions,with mortality and major neonatal outcomes.
RESULTS.We included 127 584 live births. For term newborns, small for gestational agewas significantly associated with an increased risk of death with both standards. Incontrast, for preterm newborns (32–36 weeks), small for gestational age was notsignificantly associated with mortality and morbidity. Very preterm infants (28–31weeks) identified as small for gestational age according to the healthy-populationstandard were at higher risk of chronic lung disease and intraventricular hemor-rhage. When using the entire-population standard, small for gestational age wasassociated with chronic lung disease but not intraventricular hemorrhage. The areaunder the receiver operating characteristic for predicting an intraventricular hemor-rhage was significantly greater for small for gestational age defined with the healthy-population standard compared with small for gestational age classified with theentire-population standard.
CONCLUSIONS.Neonatal growth standards based on healthy populations could improvethe identification of very preterm neonates as small for gestational age and at risk ofintraventricular hemorrhage. Pediatrics 2009;123:723–730
INTRAUTERINE GROWTH RESTRICTION (IUGR) is defined as reduced growth during fetal life relative to the geneticpotential of the fetus. Infants with IUGR at birth are usually identified by comparing their birth weight (BW) to
a distribution of weights corresponding to the same gestational age (GA) in a population considered as a reference.On the basis of such comparisons, newborns may be classified as small for gestational age (SGA), a proxy for IUGR.In several studies, IUGR has been shown to be associated with increased mortality and morbidity in newborninfants.1,2 However, the relationships between SGA and mortality or morbidity may depend on the reference used.3–5
Indeed, published weight growth references were established by using different populations and methods, and there
www.pediatrics.org/cgi/doi/10.1542/peds.2007-2564
doi:10.1542/peds.2007-2564
KeyWordsbirth weight, growth standard, small forgestational age, intrauterine growthrestriction, adverse neonatal outcome,intraventricular hemorrhage, sepsis
AbbreviationsIUGR—intrauterine growth restrictionBW—birth weightGA—gestational ageSGA—small for gestational ageRDS—respiratory distress syndromeIVH—intraventricular hemorrhagec-PVL—cystic periventricular leukomalaciaCLD—chronic lung diseaseHIE—hypoxic-ischemic encephalopathyOR—odds ratioCI—confidence intervalROC—receiver operating characteristicAUC—area under the curveAGA—appropriate for gestational age
Accepted for publication Jun 3, 2008
Address correspondence to Cyril Ferdynus,MS, Cellule d’Evaluation du Reseau Perinatalde Bourgogne, 1 Boulevard Jeanne d’Arc, BP-77908, 21079 Dijon Cedex, France. E-mail:[email protected]
PEDIATRICS (ISSN Numbers: Print, 0031-4005;Online, 1098-4275). Copyright © 2009 by theAmerican Academy of Pediatrics
PEDIATRICS Volume 123, Number 2, February 2009 723 at Edward G. Miner Library on February 10, 2009 www.pediatrics.orgDownloaded from
is no consensus regarding the “optimal” reference.5–8
Moreover, authors of various studies5,8–10 have recom-mended the use of fetal growth standards rather thanneonatal standards estimated from live birth infants onlyto improve the identification of preterm infants as SGAand at risk of adverse outcomes.
Furthermore, many preterm and very preterm deliv-eries are associated with maternal diseases (especiallyhypertension) that affect the weight of fetuses.11,12 Thus,neonatal BW standards defined on populations, whichinclude these diseases, may not adequately represent thenatural intrauterine growth trajectory of healthy fetus-es.10,13 We can assume that a proxy of normal fetalweight could be obtained from BWs of a population freeof maternal diseases that may impact the weight of fe-tuses. To our knowledge, no authors have performed astudy that compared the relative risks of adverse out-comes associated with an SGA classification based on aBW reference derived from the entire population versusan SGA classification based on a healthy population freeof maternal diseases. Therefore, our aims for this studywere to construct 2 gender- and GA-specific BW stan-dards, 1 based on the entire population of live births andanother obtained on a healthy population from whichinfants with relevant maternal diseases were excluded,and then to compare the ability of the 2 standards toidentify infants with poor neonatal prognosis.
PATIENTS ANDMETHODSSince 2000, all births that occur in Burgundy at or after22 completed weeks of gestation and/or with a BW of�500 g, are systematically recorded in an anonymousdatabase used to regularly assess the Burgundy perinatalnetwork procedures.14 This database contains the data of�99.9% of all births in the region.14 Information aboutclinical events is collected prospectively for mothers andnewborns between birth and hospital discharge. Thisinformation includes individual perinatal data such asmaternal diseases, pregnancy outcome, BW, GA, infantgender, newborns with diseases, and outcomes. The GA,in completed weeks of gestation, is assessed on the basisof the mother’s last menstrual period and confirmed ormodified, when necessary, by routine an early antenatalultrasound scan that is performed, in France, for �95%of pregnant women.15 Standardized definitions of dis-eases, guidelines for coding, validation of data, and com-pleteness of the database are regularly ensured.14
We included in this study all births of infants between28 and 41 weeks of gestation, born in Burgundy be-tween January 2000 and December 2006. Fetal deaths,multiple births, chromosomal aberrations, and infantswith missing BW or gender data were excluded. Infantswith implausible BW for their GA were identifiedthrough a normal mixture model, which estimates theprobability of an infant having an inaccurate GA on thebasis of the GA-specific BW distributions in the entiredatabase.16 All infants with the estimated probability ofincorrect GA above 0.95 were considered to have animplausible BW for their GA and were excluded.
After these exclusions, we estimated BW distributionsfor each week of GA, separately for boys and girls, and
verified their normality with Kolmogorov-Smirnoff andShapiro-Wilks tests. We first estimated distributions byusing all infants of a given gender and born at a given GAto obtain standards based on the entire population(“BurgundyE”). Then, we estimated distributions afterhaving excluded births from mothers with maternal dis-eases known to impact the BW (diabetes, maternal hy-pertension, preeclampsia, eclampsia, abruptio placentae,placenta previa, presumed chorioamnionitis) to obtain a“healthy-population” standard (“BurgundyH”). Finally,for each of the 2 standards, we estimated selected per-centiles (3rd, 10th, 50th, 90th, and 97th) of the gender-specific BW distributions at each GA week between 28and 41. Similar to Kramer et al,17 these percentiles wereestimated by a flexible generalized additive model ,18 inwhich the corresponding empirical percentiles observedat consecutive weeks were smoothed by using smooth-ing splines with 4 degrees of freedom.19
Newborns were then classified as SGA separately ac-cording to the 10th percentile of the entire-population(SGABE) and healthy-population (SGABH) standards.The resulting SGA rates, at each GA, were compared byusing the McNemar test for matched binary data.
We assessed associations between each SGA standardand each of the following major neonatal outcomes:respiratory distress syndrome (RDS), intraventricularhemorrhage (IVH), cystic periventricular leukomalacia(c-PVL), and chronic lung disease (CLD) in preterm in-fants, hypoxic-ischemic encephalopathy (HIE) in termnewborns, and in-hospital mortality in both preterm andterm newborns. The diagnosis of IVH and c-PVL wasassessed by using the same protocol for all very preterminfants (between 28 and 31 GA weeks): each infant had2 sonographic screenings during the first week of life andevery week until 40 weeks of postconceptional age. IVHwas graded according to the Papile et al classification.20
c-PVL was diagnosed on the basis of the presence ofecholucent areas or persistent echogenicity in periven-tricular areas on coronal and sagittal views of cranialultrasounds.21 CLD was diagnosed in surviving neonateswhen the infant required oxygen supplementation be-yond 36 weeks of postconceptional age. In Burgundy,the regional recommendations are to maintain an oxy-gen saturation between 93% and 95% at 36 weeks ofpostconceptional age. The diagnosis of RDS was estab-lished by a clinical assessor according to criteria proposedby Rubaltelli et al22: oxygen dependence increasing dur-ing the first 24 hours of life; exclusion of infection;typical radiologic pattern with reduced air content; andreticulonodular pattern of the lung and air bron-chogram. In-hospital mortality was defined as a deathoccurring during the hospital stay.
Because the risk of an adverse outcome decreasedsharply, in a nonlinear way, with increasing GA, weconducted separate analyses for each of the 3 GA strata,defined on the basis of clinical considerations: very pre-term (28–31 weeks), preterm (32–36 weeks), and termneonates (�37 weeks). Within each stratum, we esti-mated the strength of the association between SGA,defined according to each standard, and the respectiveoutcome by using multiple logistic regression, which
724 FERDYNUS et al at Edward G. Miner Library on February 10, 2009 www.pediatrics.orgDownloaded from
adjusted for a continuous measure of GA and gender.First-order interactions between SGA and each of these2 covariates were tested by a 2-tailed Wald test andexcluded from the model if they did not reach statisticalsignificance at the .05 level. Crude and adjusted oddsratios (ORs) for each SGA definition and their 95%confidence intervals (CIs) were estimated.
To further compare the 2 SGA classifications derived,respectively, from our entire population (SGABE) andfrom the healthy population (SGABH), we then esti-mated the 2 corresponding receiver operating character-istic (ROC) curves separately for each outcome. EachROC curve was estimated by using the 3rd, 10th, and50th percentiles as cutoffs, and the corresponding areaunder the curve (AUC) was calculated. The differencebetween the 2 AUC values were compared by using thetest proposed by Hanley and McNeil.23,24
Statistical analyses were performed by using SAS 8.2(SAS Institute, Inc, Cary, NC) and Stata 8.0 (Stata Corp,College Station, TX) packages. All hypotheses weretested at the 2-tailed .05 significance level.
RESULTSBetween 2000 and 2006, 132 588 newborns from 28 to41 GA weeks were identified in Burgundy. We excluded11 infants (0.007%) with implausible BW for GA, 546(0.41%) fetal deaths, 4141 (3.1%) multiple births, 215(0.2%) infants with chromosomal aberrations, and 91(0.07%) with missing BW or gender information. The“entire-population” BW distributions were estimatedfrom the 127 584 (96.2%) remaining live births.
The “healthy-population” BW distributions were es-timated from the 115 238 of these live births after theexclusion of 12 346 (9.7%) pregnancies with maternaldiseases. The proportion of newborns excluded at eachGA is reported in the last column of Tables 1 (malesubjects) and 2 (female subjects). The rate of exclusionsdecreased linearly, from 60.8% at 28 weeks to 6.6% at
41 weeks (P � .0001). Maternal hypertension was theprincipal cause of exclusions: 31.8% in very preterm,13.8% in preterm, and 3.5% in term newborns (P �.0001).
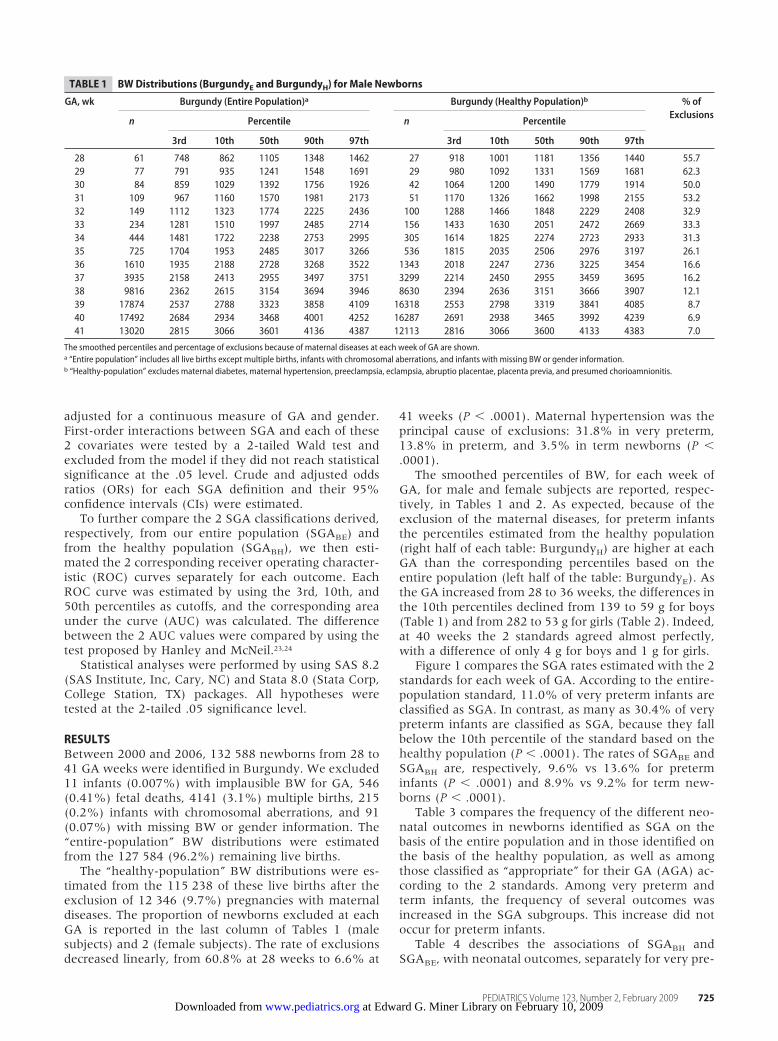
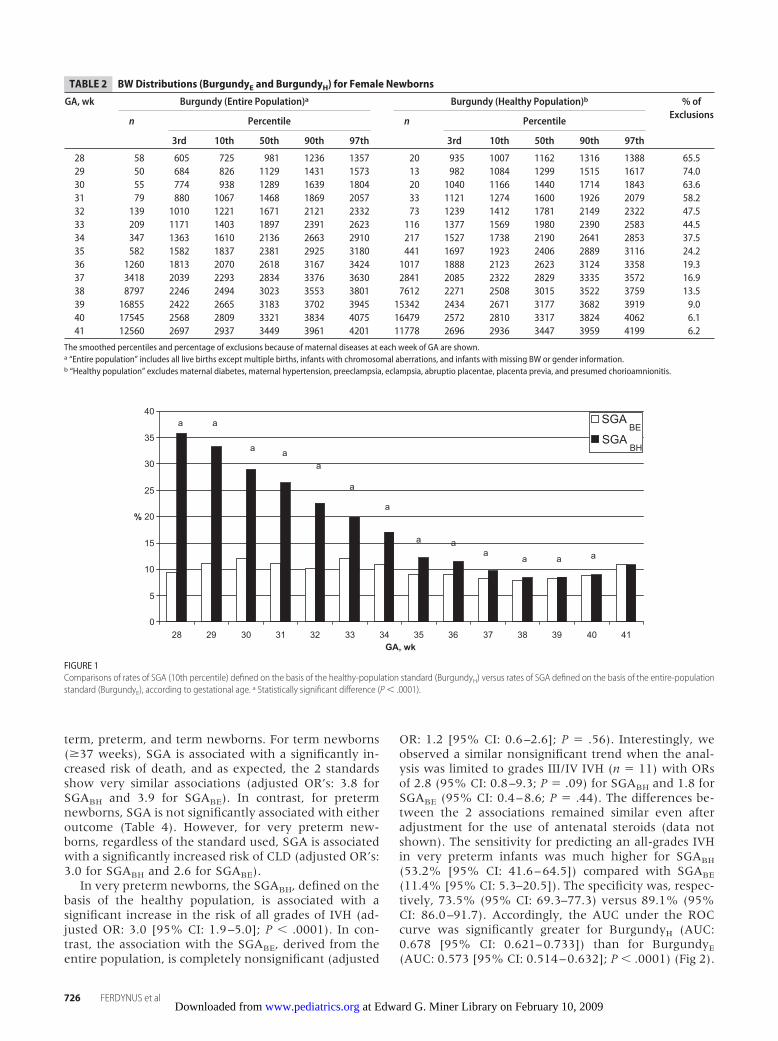
The smoothed percentiles of BW, for each week ofGA, for male and female subjects are reported, respec-tively, in Tables 1 and 2. As expected, because of theexclusion of the maternal diseases, for preterm infantsthe percentiles estimated from the healthy population(right half of each table: BurgundyH) are higher at eachGA than the corresponding percentiles based on theentire population (left half of the table: BurgundyE). Asthe GA increased from 28 to 36 weeks, the differences inthe 10th percentiles declined from 139 to 59 g for boys(Table 1) and from 282 to 53 g for girls (Table 2). Indeed,at 40 weeks the 2 standards agreed almost perfectly,with a difference of only 4 g for boys and 1 g for girls.
Figure 1 compares the SGA rates estimated with the 2standards for each week of GA. According to the entire-population standard, 11.0% of very preterm infants areclassified as SGA. In contrast, as many as 30.4% of verypreterm infants are classified as SGA, because they fallbelow the 10th percentile of the standard based on thehealthy population (P � .0001). The rates of SGABE andSGABH are, respectively, 9.6% vs 13.6% for preterminfants (P � .0001) and 8.9% vs 9.2% for term new-borns (P � .0001).
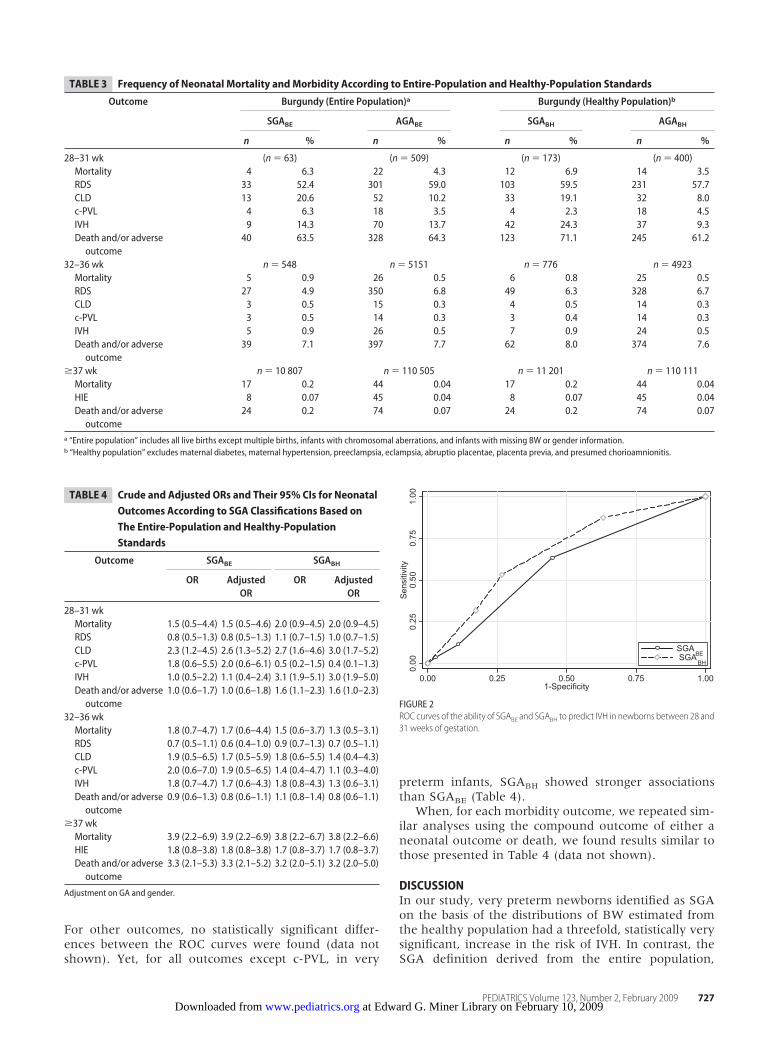
Table 3 compares the frequency of the different neo-natal outcomes in newborns identified as SGA on thebasis of the entire population and in those identified onthe basis of the healthy population, as well as amongthose classified as “appropriate” for their GA (AGA) ac-cording to the 2 standards. Among very preterm andterm infants, the frequency of several outcomes wasincreased in the SGA subgroups. This increase did notoccur for preterm infants.
Table 4 describes the associations of SGABH andSGABE, with neonatal outcomes, separately for very pre-
TABLE 1 BWDistributions (BurgundyE and BurgundyH) for Male Newborns
GA, wk Burgundy (Entire Population)a Burgundy (Healthy Population)b % ofExclusions
n Percentile n Percentile
3rd 10th 50th 90th 97th 3rd 10th 50th 90th 97th
28 61 748 862 1105 1348 1462 27 918 1001 1181 1356 1440 55.729 77 791 935 1241 1548 1691 29 980 1092 1331 1569 1681 62.330 84 859 1029 1392 1756 1926 42 1064 1200 1490 1779 1914 50.031 109 967 1160 1570 1981 2173 51 1170 1326 1662 1998 2155 53.232 149 1112 1323 1774 2225 2436 100 1288 1466 1848 2229 2408 32.933 234 1281 1510 1997 2485 2714 156 1433 1630 2051 2472 2669 33.334 444 1481 1722 2238 2753 2995 305 1614 1825 2274 2723 2933 31.335 725 1704 1953 2485 3017 3266 536 1815 2035 2506 2976 3197 26.136 1610 1935 2188 2728 3268 3522 1343 2018 2247 2736 3225 3454 16.637 3935 2158 2413 2955 3497 3751 3299 2214 2450 2955 3459 3695 16.238 9816 2362 2615 3154 3694 3946 8630 2394 2636 3151 3666 3907 12.139 17874 2537 2788 3323 3858 4109 16318 2553 2798 3319 3841 4085 8.740 17492 2684 2934 3468 4001 4252 16287 2691 2938 3465 3992 4239 6.941 13020 2815 3066 3601 4136 4387 12113 2816 3066 3600 4133 4383 7.0
The smoothed percentiles and percentage of exclusions because of maternal diseases at each week of GA are shown.a “Entire population” includes all live births except multiple births, infants with chromosomal aberrations, and infants with missing BW or gender information.b “Healthy-population” excludes maternal diabetes, maternal hypertension, preeclampsia, eclampsia, abruptio placentae, placenta previa, and presumed chorioamnionitis.
PEDIATRICS Volume 123, Number 2, February 2009 725 at Edward G. Miner Library on February 10, 2009 www.pediatrics.orgDownloaded from
term, preterm, and term newborns. For term newborns(�37 weeks), SGA is associated with a significantly in-creased risk of death, and as expected, the 2 standardsshow very similar associations (adjusted OR’s: 3.8 forSGABH and 3.9 for SGABE). In contrast, for pretermnewborns, SGA is not significantly associated with eitheroutcome (Table 4). However, for very preterm new-borns, regardless of the standard used, SGA is associatedwith a significantly increased risk of CLD (adjusted OR’s:3.0 for SGABH and 2.6 for SGABE).
In very preterm newborns, the SGABH, defined on thebasis of the healthy population, is associated with asignificant increase in the risk of all grades of IVH (ad-justed OR: 3.0 [95% CI: 1.9–5.0]; P � .0001). In con-trast, the association with the SGABE, derived from theentire population, is completely nonsignificant (adjusted
OR: 1.2 [95% CI: 0.6–2.6]; P � .56). Interestingly, weobserved a similar nonsignificant trend when the anal-ysis was limited to grades III/IV IVH (n � 11) with ORsof 2.8 (95% CI: 0.8–9.3; P � .09) for SGABH and 1.8 forSGABE (95% CI: 0.4–8.6; P � .44). The differences be-tween the 2 associations remained similar even afteradjustment for the use of antenatal steroids (data notshown). The sensitivity for predicting an all-grades IVHin very preterm infants was much higher for SGABH
(53.2% [95% CI: 41.6–64.5]) compared with SGABE
(11.4% [95% CI: 5.3–20.5]). The specificity was, respec-tively, 73.5% (95% CI: 69.3–77.3) versus 89.1% (95%CI: 86.0–91.7). Accordingly, the AUC under the ROCcurve was significantly greater for BurgundyH (AUC:0.678 [95% CI: 0.621–0.733]) than for BurgundyE
(AUC: 0.573 [95% CI: 0.514–0.632]; P � .0001) (Fig 2).
0
5
10
15
20
25
30
35
40
28 29 30 31 32 33 34 35 36 37 38 39 40 41GA, wk
%
a a
a aa
a
a
a aa
a a a
SGABH
SGABE
FIGURE 1Comparisons of rates of SGA (10th percentile) defined on the basis of the healthy-population standard (BurgundyH) versus rates of SGA defined on the basis of the entire-populationstandard (BurgundyE), according to gestational age. a Statistically significant difference (P � .0001).
TABLE 2 BWDistributions (BurgundyE and BurgundyH) for Female Newborns
GA, wk Burgundy (Entire Population)a Burgundy (Healthy Population)b % ofExclusions
n Percentile n Percentile
3rd 10th 50th 90th 97th 3rd 10th 50th 90th 97th
28 58 605 725 981 1236 1357 20 935 1007 1162 1316 1388 65.529 50 684 826 1129 1431 1573 13 982 1084 1299 1515 1617 74.030 55 774 938 1289 1639 1804 20 1040 1166 1440 1714 1843 63.631 79 880 1067 1468 1869 2057 33 1121 1274 1600 1926 2079 58.232 139 1010 1221 1671 2121 2332 73 1239 1412 1781 2149 2322 47.533 209 1171 1403 1897 2391 2623 116 1377 1569 1980 2390 2583 44.534 347 1363 1610 2136 2663 2910 217 1527 1738 2190 2641 2853 37.535 582 1582 1837 2381 2925 3180 441 1697 1923 2406 2889 3116 24.236 1260 1813 2070 2618 3167 3424 1017 1888 2123 2623 3124 3358 19.337 3418 2039 2293 2834 3376 3630 2841 2085 2322 2829 3335 3572 16.938 8797 2246 2494 3023 3553 3801 7612 2271 2508 3015 3522 3759 13.539 16855 2422 2665 3183 3702 3945 15342 2434 2671 3177 3682 3919 9.040 17545 2568 2809 3321 3834 4075 16479 2572 2810 3317 3824 4062 6.141 12560 2697 2937 3449 3961 4201 11778 2696 2936 3447 3959 4199 6.2
The smoothed percentiles and percentage of exclusions because of maternal diseases at each week of GA are shown.a “Entire population” includes all live births except multiple births, infants with chromosomal aberrations, and infants with missing BW or gender information.b “Healthy population” excludes maternal diabetes, maternal hypertension, preeclampsia, eclampsia, abruptio placentae, placenta previa, and presumed chorioamnionitis.
726 FERDYNUS et al at Edward G. Miner Library on February 10, 2009 www.pediatrics.orgDownloaded from
For other outcomes, no statistically significant differ-ences between the ROC curves were found (data notshown). Yet, for all outcomes except c-PVL, in very
preterm infants, SGABH showed stronger associationsthan SGABE (Table 4).
When, for each morbidity outcome, we repeated sim-ilar analyses using the compound outcome of either aneonatal outcome or death, we found results similar tothose presented in Table 4 (data not shown).
DISCUSSIONIn our study, very preterm newborns identified as SGAon the basis of the distributions of BW estimated fromthe healthy population had a threefold, statistically verysignificant, increase in the risk of IVH. In contrast, theSGA definition derived from the entire population,
TABLE 3 Frequency of Neonatal Mortality andMorbidity According to Entire-Population and Healthy-Population Standards
Outcome Burgundy (Entire Population)a Burgundy (Healthy Population)b
SGABE AGABE SGABH AGABH
n % n % n % n %
28–31 wk (n � 63) (n � 509) (n � 173) (n � 400)Mortality 4 6.3 22 4.3 12 6.9 14 3.5RDS 33 52.4 301 59.0 103 59.5 231 57.7CLD 13 20.6 52 10.2 33 19.1 32 8.0c-PVL 4 6.3 18 3.5 4 2.3 18 4.5IVH 9 14.3 70 13.7 42 24.3 37 9.3Death and/or adverseoutcome
40 63.5 328 64.3 123 71.1 245 61.2
32–36 wk n � 548 n � 5151 n � 776 n � 4923Mortality 5 0.9 26 0.5 6 0.8 25 0.5RDS 27 4.9 350 6.8 49 6.3 328 6.7CLD 3 0.5 15 0.3 4 0.5 14 0.3c-PVL 3 0.5 14 0.3 3 0.4 14 0.3IVH 5 0.9 26 0.5 7 0.9 24 0.5Death and/or adverseoutcome
39 7.1 397 7.7 62 8.0 374 7.6
�37 wk n � 10 807 n � 110 505 n � 11 201 n � 110 111Mortality 17 0.2 44 0.04 17 0.2 44 0.04HIE 8 0.07 45 0.04 8 0.07 45 0.04Death and/or adverseoutcome
24 0.2 74 0.07 24 0.2 74 0.07
a “Entire population” includes all live births except multiple births, infants with chromosomal aberrations, and infants with missing BW or gender information.b “Healthy population” excludes maternal diabetes, maternal hypertension, preeclampsia, eclampsia, abruptio placentae, placenta previa, and presumed chorioamnionitis.
TABLE 4 Crude and Adjusted ORs and Their 95% CIs for NeonatalOutcomes According to SGA Classifications Based onThe Entire-Population and Healthy-PopulationStandards
Outcome SGABE SGABH
OR AdjustedOR
OR AdjustedOR
28–31 wkMortality 1.5 (0.5–4.4) 1.5 (0.5–4.6) 2.0 (0.9–4.5) 2.0 (0.9–4.5)RDS 0.8 (0.5–1.3) 0.8 (0.5–1.3) 1.1 (0.7–1.5) 1.0 (0.7–1.5)CLD 2.3 (1.2–4.5) 2.6 (1.3–5.2) 2.7 (1.6–4.6) 3.0 (1.7–5.2)c-PVL 1.8 (0.6–5.5) 2.0 (0.6–6.1) 0.5 (0.2–1.5) 0.4 (0.1–1.3)IVH 1.0 (0.5–2.2) 1.1 (0.4–2.4) 3.1 (1.9–5.1) 3.0 (1.9–5.0)Death and/or adverseoutcome
1.0 (0.6–1.7) 1.0 (0.6–1.8) 1.6 (1.1–2.3) 1.6 (1.0–2.3)
32–36 wkMortality 1.8 (0.7–4.7) 1.7 (0.6–4.4) 1.5 (0.6–3.7) 1.3 (0.5–3.1)RDS 0.7 (0.5–1.1) 0.6 (0.4–1.0) 0.9 (0.7–1.3) 0.7 (0.5–1.1)CLD 1.9 (0.5–6.5) 1.7 (0.5–5.9) 1.8 (0.6–5.5) 1.4 (0.4–4.3)c-PVL 2.0 (0.6–7.0) 1.9 (0.5–6.5) 1.4 (0.4–4.7) 1.1 (0.3–4.0)IVH 1.8 (0.7–4.7) 1.7 (0.6–4.3) 1.8 (0.8–4.3) 1.3 (0.6–3.1)Death and/or adverseoutcome
0.9 (0.6–1.3) 0.8 (0.6–1.1) 1.1 (0.8–1.4) 0.8 (0.6–1.1)
�37 wkMortality 3.9 (2.2–6.9) 3.9 (2.2–6.9) 3.8 (2.2–6.7) 3.8 (2.2–6.6)HIE 1.8 (0.8–3.8) 1.8 (0.8–3.8) 1.7 (0.8–3.7) 1.7 (0.8–3.7)Death and/or adverseoutcome
3.3 (2.1–5.3) 3.3 (2.1–5.2) 3.2 (2.0–5.1) 3.2 (2.0–5.0)
Adjustment on GA and gender.
0.00
0.25
0.50
0.75
1.00
Sens
itivi
ty
0.00 0.25 0.50 0.75 1.001-Specificity
SGA BESGA BH
FIGURE 2ROC curves of the ability of SGABE and SGABH to predict IVH in newborns between 28 and31 weeks of gestation.
PEDIATRICS Volume 123, Number 2, February 2009 727 at Edward G. Miner Library on February 10, 2009 www.pediatrics.orgDownloaded from
which included births affected by maternal diseases, wasnot associated with IVH. Accordingly, using the standardderived from the healthy population rather than fromthe entire population permitted a significant improve-ment in the identification of very preterm newborns atincreased risk of IVH, as indicated by a significantlyhigher AUC under the ROC curve.
Our results were obtained from a large validated pop-ulation database, the completeness and quality of whichare regularly assessed.14 In particular, GA is systemati-cally assessed by early ultrasound scan. These elementscertainly contributed to the fact that we identified onlyan extremely low rate of infants with implausible BW forGA (�0.01%), although we relied on the state-of-the-art methodology to eliminate such outliers.16 Our data-base did not provide complete information on maternalsmoking, and its prevalence (4.2%) was likely underes-timated.15 Fitzgerald et al25 reported that the associationbetween maternal smoking and SGA risk also variedwith GA and became significant only after 32 weeks ofgestation. Given these findings, our results for newbornsbetween 28 and 31 weeks’ GA should not be materiallyaffected by the incomplete information on maternalsmoking. We checked, in a sensitivity analysis, that theexclusions of mothers known to have smoked duringtheir pregnancy provided the same results (data notshown). Information about some other maternal dis-eases (thrombophilias, significant renal disease, and col-lagen vascular diseases) was not present in our database.We assumed that most of theses pathologies were ex-cluded because of exclusion of maternal hypertension.
We found important differences between BW of theentire population and the healthy population, especiallyat low GA. The differences decreased with GA, becausematernal diseases, excluded from the healthy popula-tion, were more prevalent among preterm newborns.These differences were similar to those reported in pre-vious studies when comparing a fetal growth standardobtained from uncomplicated pregnancies against a neo-natal growth standard obtained from the entire popula-tion.5,8 Accordingly, we found that the rates of SGA,based on the healthy population, were higher in pretermthan in term newborns. As expected, the rates of SGApreterm newborns, classified with our healthy-popula-tion–based standard, were significantly higher thanthose obtained from the standard based on the entirepopulation. Most importantly, the SGA rates based onthe healthy-population standard were similar to thosereported when using a fetal growth standard obtainedfrom uncomplicated pregnancies.4,5,10 These findings areconsistent with our hypothesis that BW distributionsbased on a population free of maternal diseases couldapproach the normal fetal weight.
In very preterm newborns, classified as SGA with ourhealthy-population standard, we found a marginallynonsignificant increase of the risk of death (P � .08).Previous studies4,5 revealed a similar increase of the riskof death in preterm SGA newborns classified with a fetalgrowth standard obtained from uncomplicated pregnan-cies. Our marginally nonsignificant result could be ex-plained by a limited statistical power because of only 26
hospital neonatal deaths among very preterm newborns.Furthermore, several studies1,5,26–29 revealed an increaseof the risk of death in SGA preterm newborns classifiedwith a neonatal weight standard obtained from the en-tire population, especially below 28 weeks.26,28We didnot observe this important increase of the risk of deathin very preterm SGABE newborns. This may be becauseof exclusions of births below 28 weeks, which were toofew to reliably estimate the percentiles of GA-specificBW distributions.
Our results suggested a marginally nonsignificantlyreduced risk of RDS in preterm newborns classified asSGA, after adjustment for GA and gender (P � .06 forSGABE and P � .09 for SGABH), regardless of the stan-dard used (Table 4). A similar protective effect was re-ported in previous studies.5,27 In contrast, some otherstudies revealed an increased risk of RDS in SGA pretermnewborns.1,5,30 Ley et al4 found that SGA was associatedwith an increased risk of RDS in newborns below 29weeks’ GA and a protective effect in newborns between29 and 32 weeks’ GA, suggesting a relationship withpreeclampsia. Additional investigation is required toclarify the relationship between preeclampsia, SGA, andRDS.
Furthermore, we found a statistically significantthreefold increase of the risk of IVH, in very pretermneonates classified as SGA based on our healthy-popu-lation BW distribution, even after adjustment for GAand gender. In contrast, we found no statistically signif-icant association when SGA was derived from entire-population, which included births affected by maternaldiseases (Table 4). These findings are similar to previ-ously reported findings of an association between SGAand IVH, based on a fetal standard, obtained fromhealthy mothers,5 but no association when neonatalstandards, obtained from entire-populations, wereused.5,11,27,29–33 IVH is a common cerebral morbiditywhose frequency and seriousness are closely related tothe degree of prematurity.34,35 We were able to demon-strate that SGABH was significantly more predictive of anIVH in very preterm newborns than SGABE, because thecorresponding ROC curve had significantly higher AUC.
CONCLUSIONSIn this study, we found that using healthy-populationBW standards was advantageous in very preterm infants,especially for the identification of newborns at risk ofIVH. For these newborns, we found that neonatal BWstandards based on healthy-populations gave similar re-sults to those reported in studies that used fetal stan-dards for the identification of IUGR at risk of adverseneonatal outcomes. However, the choice betweenhealthy-population or entire-population BW standardsdid not affect the results of the analysis of IUGR forpreterm and at term infants. Authors performing futurestudies should investigate the association between thecauses of IUGR and adverse neonatal outcomes, andpotential benefits of deriving SGA standards from differ-ent populations.
728 FERDYNUS et al at Edward G. Miner Library on February 10, 2009 www.pediatrics.orgDownloaded from
ACKNOWLEDGMENTSWe thank the members of the Burgundy perinatal net-work and all physicians in hospitals of the Burgundyregion (CH de Sens, Auxerre, Nevers, Dijon, Beaune,Chalon-sur-Saone, Macon, Montceau-les-Mines, Paray-le-Monial, Le Creusot, Semur en Auxois, Chatillon surSeine, Autun, Decize, Clinique Sainte-Marthe, Cliniquede Chenove, Clinique d’Auxerre, and Clinique du No-hain).
Michal Abrahamowicz is a James McGill Professor ofBiostatistics at McGill University.
REFERENCES1. Bernstein IM, Horbar JD, Badger GJ, Ohlsson AAG. Morbidity
and mortality among very-low-birth-weight neonates with in-trauterine growth restriction. Vermont Oxford Network. Am JObstet Gynecol. 2000;182(1 pt 1):198–206
2. Garite T, Clark R, Thorp J. Intrauterine growth restrictionincreases morbidity and mortality among premature neonates.Am J Obstet Gynecol. 2004;191(2):481–487
3. Tyson JE, Kennedy K, Broyles S, Rosenfeld CR. The small forgestational age infant: accelerated or delayed pulmonary mat-uration? Increased or decreased survival? Pediatrics. 1995;95(4):534–538
4. Ley D, Wide-Swensson D, Lindroth M, Svenningsen N,Marsal K. Respiratory distress syndrome in infants withimpaired intrauterine growth. Acta Paediatr. 1997;86(10):1090 –1096
5. Zaw W, Gagnon R, da Silva O. The risks of adverse neonataloutcome among preterm small for gestational age infants ac-cording to neonatal versus fetal growth standards. Pediatrics.2003;111(6 pt 1):1273–1277
6. Mamelle N, Munoz F, Martin JL, Laumon B, Grandjean H.Fetal growth from the AUDIPOG study. II. Application for thediagnosis of intrauterine growth retardation [in French]. JGynecol Obstet Biol Reprod (Paris). 1996;25(1):71–77
7. Clausson B, Gardosi J, Francis A, Cnattingius S. Perinatal out-come in SGA births defined by customised versus population-based birth weight standards. Br J Obstet Gynaecol. 2001;108(8):830–834
8. Lackman F, Capewell V, Richardson B, daSilva O, Gagnon R.The risks of spontaneous preterm delivery and perinatal mor-tality in relation to size at birth according to fetal versus neo-natal growth standards. Am J Obstet Gynecol. 2001;184(5):946–953
9. Ott WJ. Intrauterine growth retardation and preterm delivery.Am J Obstet Gynecol. 1993;168(6 pt 1):1710–1717
10. Marsal K, Persson PH, Larsen T, Lilja H, Selbing A, Sultan B.Intrauterine growth curves based on ultrasonically estimatedfoetal weights. Acta Paediatr. 1996;85(7):843–848
11. Ancel PY, Marret S, Larroque B, et al. Are maternal hyperten-sion and small-for-gestational age risk factors for severe intra-ventricular hemorrhage and cystic periventricular leukomala-cia? Results of the EPIPAGE cohort study. Am J Obstet Gynecol.2005;193(1):178–184
12. Steer P. The epidemiology of preterm labour. Br J Obstet Gynae-col. 2005;112(suppl 1):1–3
13. Zeitlin J, Ancel PY, Saurel-Cubizolles MJ, Papiernik E. Therelationship between intrauterine growth restriction and pre-term delivery: an empirical approach using data from a Euro-pean case-control study. Br J Obstet Gynaecol. 2000;107(6):750–758
14. Cornet B, Gouyon JB, Binquet C, et al. Using discharge ab-stracts as a tool to assess a regional perinatal network. RevEpidemiol Sante Publique. 2001;49(6):583–593
15. Blondel B, Supernant K, Du Mazaubrun CGB. Enquete NationalePerinatale. 2003. Available at: www.sante.gouv.fr/htm/dossiers/perinat03/sommaire.htm. Accessed November 2008
16. Platt R, Abrahamowicz M, Kramer M, et al. Detecting andeliminating erroneous gestational ages: a normal mixturemodel. Stat Med. 2001;20(23):3491–3503
17. Kramer M, Platt R, Wen SW, et al. A new and improved popu-lation-based Canadian reference for birth weight for gestationalage. Pediatrics. 2001;108(2). Available at: www.pediatrics.org/cgi/content/full/108/2/e35
18. Hastie T, Tibshirani R. Generalized Additive Models. London,United Kingdom: Chapman & Hall; 1990
19. Abrahamowicz M, du Berger R, Grover SA. Flexible modelingof the effects of serum cholesterol on coronary heart diseasemortality. Am J Epidemiol. 1997;145(8):714–729
20. Papile LA, Burstein J, Burstein R, Koffler H. Incidence andevolution of subependymal and intraventricular hemorrhage:a study of infants with birth weights less than 1500 gm. J Pe-diatr. 1978;92(4):529–534
21. Fawer CL, Calame A, Perentes EAA. Periventricularleukomalacia: a correlation study between real-time ultra-sound and autopsy findings: periventricular leukomalacia inthe neonate. Neuroradiology. 1985;27(4):292–300
22. Rubaltelli FF, Bonafe L, Tangucci M, Spagnolo A, Dani C.Epidemiology of neonatal acute respiratory disorders: a mul-ticenter study on incidence and fatality rates of neonatalacute respiratory disorders according to gestational age, ma-ternal age, pregnancy complications and type of delivery.Italian Group of Neonatal Pneumology. Biol Neonate. 1998;74(1):7–15
23. Hanley JA, McNeil BJ. The meaning and use of the area undera receiver operating characteristic (ROC) curve. Radiology.1982;143(1):29–36
24. Hanley JA, McNeil BJ. A method of comparing the areas underreceiving operating characteristic curves derived from the samecases. Radiology. 1983;148(3):839–843
25. Fitzgerald K, Cai J, Hoff G, Dew P, Okah F. Clinical manifes-tation of small-for-gestational-age risk pregnancy from smok-ing is gestational age dependent. Am J Perinatol. 2007;24(9):519–524
26. Piper JM, Xenakis EM, McFarland M, Elliott BD, Berkus MD,Langer O. Do growth-retarded premature infants have differ-ent rates of perinatal morbidity and mortality than appropri-ately grown premature infants? Obstet Gynecol. 1996;87(2):169–174
27. Bartels DB, Kreienbrock L, Dammann O, Wenzlaff P, Poets CF.Population based study on the outcome of small for gestationalage newborns. Arch Dis Child Fetal Neonatal Ed. 2005;90(1):F53–F59
28. Sharma P, McKay K, Rosenkrantz TSNH. Comparisons of mor-tality and pre-discharge respiratory outcomes in small-for-gestational-age and appropriate-for-gestational-age prematureinfants. BMC Pediatr. 2004:4;9
29. Simchen MJ, Beiner ME, Strauss-Liviathan N, et al. Neonataloutcome in growth-restricted versus appropriately grown pre-term infants. Am J Perinatol. 2000;17(4):187–192
30. Regev RH, Lusky A, Dolfin T, Litmanovitz I, Arnon S, Reich-man B. Excess mortality and morbidity among small-for-gestational-age premature infants: a population-based study.J Pediatr. 2003;143(2):186–191
31. Gortner L, Wauer RR, Stock GJ, et al. Neonatal outcome insmall for gestational age infants: do they really better? J PerinatMed. 1999;27(6):484–489
32. Bardin C, Zelkowitz P, Papageorgiou A. Outcome of small-
PEDIATRICS Volume 123, Number 2, February 2009 729 at Edward G. Miner Library on February 10, 2009 www.pediatrics.orgDownloaded from
for-gestational age and appropriate-for-gestational age in-fants born before 27 weeks of gestation. Pediatrics. 1997;100(2). Available at: www.pediatrics.org/cgi/content/full/100/2/e4
33. Reiss I, Landmann E, Heckmann M, Misselwitz B, Gortner L.Increased risk of bronchopulmonary dysplasia and increasedmortality in very preterm infants being small for gestationalage. Arch Gynecol Obstet. 2003;269(1):40–44
34. Ancel PY, Livinec F, Larroque B, et al. Cerebral palsy amongvery preterm children in relation to gestational age and neo-natal ultrasound abnormalities: the EPIPAGE cohort study.Pediatrics. 2006;117(3):828–835
35. Patra K, Wilson-Costello D, Taylor HG, Mercuri-Minich N,Hack M. Grades I-II intraventricular hemorrhage in extremelylow birth weight infants: effects on neurodevelopment. J Pedi-atr. 2006;149(2):169–173
A LONGER, COLDER RIDE TO TREAT CARDIAC ARREST
“Starting on Jan. 1, New York City ambulances will take many cardiac arrestpatients only to hospitals that use a delicate cooling therapy believed toreduce the chances of brain damage and increase the chances of survival,even if it means bypassing closer emergency rooms. Dr David J. Prezant, chiefmedical officer of the New York Fire Department, acknowledged the culturechange and the possibility that some hospitals would feel slighted. But heargued that scientific data shows the survival rate of cardiac arrest patientstreated with therapeutic hypothermia, as the cooling process is called, is somuch better than with conventional treatment that it would be irresponsiblenot to provide it. New York joins a handful of other American cities, includingSeattle, Boston and Miami, as well as Vienna and London, in requiringtransport to hospitals with cooling systems. But given New York’s largepopulation and concentration of hospitals, the policy may provide the largesttest to date of therapeutic hypothermia. The American Heart Associationendorsed cooling for some types of cardiac arrest patients after 2 studies on itseffectiveness were published in The New England Journal of Medicine in 2002.One study found that 55% of the patients who received the cooling treatmentended up with moderate or no brain damage, compared with 39% whoreceived standard treatment. About 41% of the cooled patients died within 6months, compared with 55% of the others. Inducing moderate cooling of thebody within 6 hours, for 24 hours, followed by gradual warming, slowscerebral metabolism and seems to reduce such injuries, studies have shown.New York-Presbyterian has been a leader in hypothermia in New York, but anumber of other major hospitals—including Mount Sinai, Bellevue HospitalCenter and St Vincent’s Hospital Manhattan, Elmhurst Hospital Center inQueens, Maimonides Medical Center in Brooklyn and Staten Island Univer-sity Hospital—also practice cooling.”
Hartocollis A. New York Times. December 4, 2008Noted by JFL, MD
730 FERDYNUS et al at Edward G. Miner Library on February 10, 2009 www.pediatrics.orgDownloaded from

DOI: 10.1542/peds.2007-2564 2009;123;723-730 Pediatrics
Burguet, Paul Sagot, Christine Binquet and Jean-Bernard Gouyon Cyril Ferdynus, Catherine Quantin, Michal Abrahamowicz, Robert Platt, Antoine
Neonatal Outcomes?Identification of Small-for-Gestational-Age Newborns at Risk of Adverse Can Birth Weight Standards Based on Healthy Populations Improve the
& ServicesUpdated Information
http://www.pediatrics.org/cgi/content/full/123/2/723including high-resolution figures, can be found at:
References
http://www.pediatrics.org/cgi/content/full/123/2/723#BIBLat: This article cites 31 articles, 7 of which you can access for free
Subspecialty Collections
nhttp://www.pediatrics.org/cgi/collection/premature_and_newbor
Premature & Newbornfollowing collection(s): This article, along with others on similar topics, appears in the
Permissions & Licensing
http://www.pediatrics.org/misc/Permissions.shtmltables) or in its entirety can be found online at: Information about reproducing this article in parts (figures,
Reprints http://www.pediatrics.org/misc/reprints.shtml
Information about ordering reprints can be found online:
at Edward G. Miner Library on February 10, 2009 www.pediatrics.orgDownloaded from
Related Documents