California Energy Commission – Tracking Progress Last updated December 2018 Renewable Energy 1 Renewable Energy Advancing the use and availability of renewable energy is critical to achieving California’s ambitious climate change goals. California has pursued a suite of policies and programs aimed at advancing renewable energy in California and ensuring all Californians, including low-income and disadvantaged communities, benefit from this transition. This report presents California’s progress in meeting its renewable energy goals and provides an updated analysis through 2018 of the state’s renewable energy generation, installed capacity, and the trends, opportunities and challenges associated with the state’s renewable energy transition. More detailed figures and tables are included in the appendix. Annual Renewable Percentage: Renewables Portfolio Standard Progress An increasing percentage of energy consumed by Californians comes from renewable sources. A key mandate advancing the use of renewable has been the Renewables Portfolio Standard (RPS), which requires California load-serving entities 1 (LSEs) to increase their procurement of eligible renewable energy resources (solar, wind, geothermal, biomass, and small hydroelectric) to 33 percent of retail sales by 2020 and 60 percent of retail sales by 2030. Based on an approximation of electric generation from RPS-eligible sources divided by forecasted electricity retail sales for the year 2018, the Energy Commission estimates that 34 percent of California’s retail electricity sales in 2018 will be provided by RPS-eligible renewable resources, shown in Figure 1. 2 Although this number is not a final RPS determination, this is an important indicator for progress in achieving California’s RPS goals. Figure 1. Estimated Current Renewables Portfolio Standard Progress Source: California Energy Commission, staff analysis November 2018 Governor Brown’s Legacy – Goals Set and Achieved California has a history of establishing and achieving ambitious renewable energy goals. (See Figure 2.) Under the leadership of Governor Brown over the past eight years, the state has expanded these goals in an unprecedented way. Among the accomplishments realized during 1 LSEs are defined in the Energy Commission’s RPS Eligibility Guidebook as “a term used to refer to retail sellers, POUs, and all other entities serving retail sales of electricity in California that are obligated to participate in California’s RPS” (https://efiling.energy.ca.gov/getdocument.aspx?tn=217317, p. 82). 2 Large hydroelectric facilities, generally defined as 30 MW or larger, with some exceptions, are not eligible for the RPS in California, therefore generation from large hydroelectric facilities is not included in this calculation. Refer to California’s Renewables Portfolio Standard Eligibility Guidebook, Ninth Edition (Revised) for a detailed description of RPS eligibility requirements. In 2017, large hydroelectric represented nearly 15 percent of California’s Total System Electric Generation, defined as the sum of all in-state generation plus net electricity imports.

Welcome message from author
This document is posted to help you gain knowledge. Please leave a comment to let me know what you think about it! Share it to your friends and learn new things together.
Transcript

California Energy Commission – Tracking Progress
Last updated December 2018 Renewable Energy 1
Renewable Energy
Advancing the use and availability of renewable energy is critical to achieving California’s ambitious climate change goals. California has pursued a suite of policies and programs aimed at advancing renewable energy in California and ensuring all Californians, including low-income and disadvantaged communities, benefit from this transition. This report presents California’s progress in meeting its renewable energy goals and provides an updated analysis through 2018 of the state’s renewable energy generation, installed capacity, and the trends, opportunities and challenges associated with the state’s renewable energy transition. More detailed figures and tables are included in the appendix.
Annual Renewable Percentage: Renewables Portfolio Standard Progress
An increasing percentage of energy consumed by Californians comes from renewable sources. A key mandate advancing the use of renewable has been the Renewables Portfolio Standard (RPS), which requires California load-serving entities1 (LSEs) to increase their procurement of eligible renewable energy resources (solar, wind, geothermal, biomass, and small hydroelectric) to 33 percent of retail sales by 2020 and 60 percent of retail sales by 2030.
Based on an approximation of electric generation from RPS-eligible sources divided by forecasted electricity retail sales for the year 2018, the Energy Commission estimates that 34 percent of California’s retail electricity sales in 2018 will be provided by RPS-eligible renewable resources, shown in Figure 1.2 Although this number is not a final RPS determination, this is an important indicator for progress in achieving California’s RPS goals.
Figure 1. Estimated Current Renewables Portfolio Standard Progress
Source: California Energy Commission, staff analysis November 2018
Governor Brown’s Legacy – Goals Set and Achieved California has a history of establishing and achieving ambitious renewable energy goals. (See Figure 2.) Under the leadership of Governor Brown over the past eight years, the state has expanded these goals in an unprecedented way. Among the accomplishments realized during
1 LSEs are defined in the Energy Commission’s RPS Eligibility Guidebook as “a term used to refer to retail sellers, POUs, and all other entities serving retail sales of electricity in California that are obligated to participate in California’s RPS” (https://efiling.energy.ca.gov/getdocument.aspx?tn=217317, p. 82).
2 Large hydroelectric facilities, generally defined as 30 MW or larger, with some exceptions, are not eligible for the RPS in California, therefore generation from large hydroelectric facilities is not included in this calculation. Refer to California’s Renewables Portfolio Standard Eligibility Guidebook, Ninth Edition (Revised) for a detailed description of RPS eligibility requirements. In 2017, large hydroelectric represented nearly 15 percent of California’s Total System Electric Generation, defined as the sum of all in-state generation plus net electricity imports.
California Energy Commission – Tracking Progress
Last updated December 2018 Renewable Energy 2
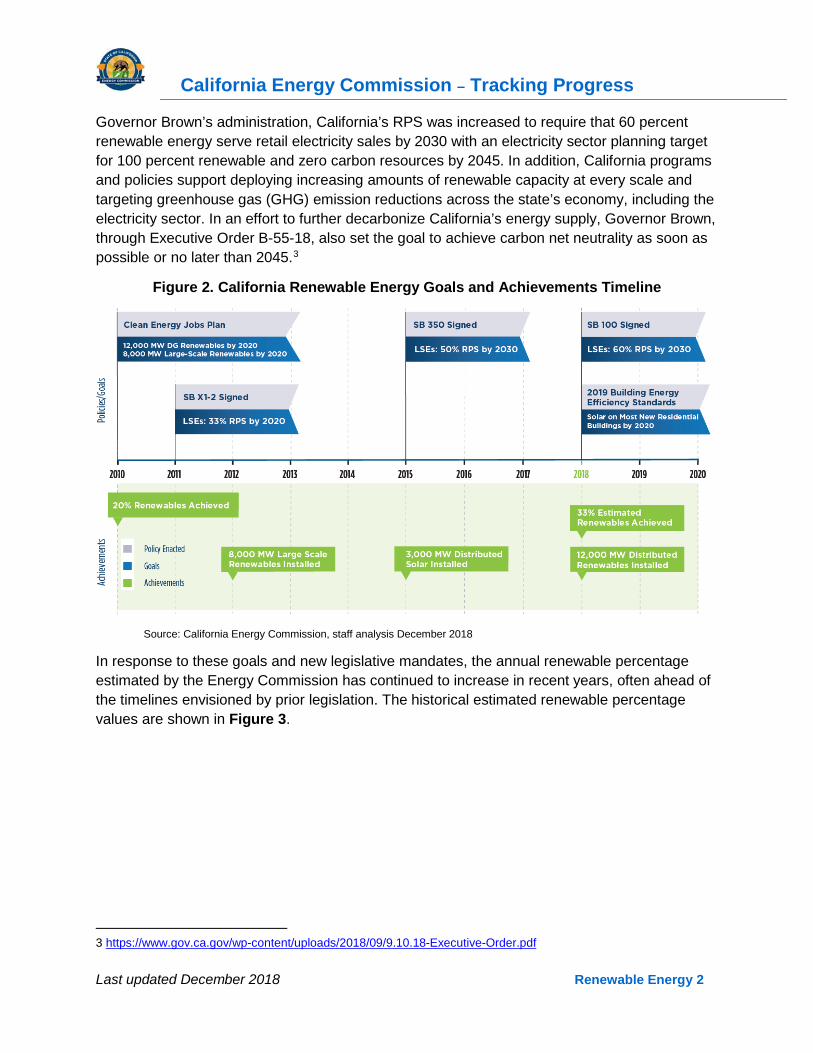
Governor Brown’s administration, California’s RPS was increased to require that 60 percent renewable energy serve retail electricity sales by 2030 with an electricity sector planning target for 100 percent renewable and zero carbon resources by 2045. In addition, California programs and policies support deploying increasing amounts of renewable capacity at every scale and targeting greenhouse gas (GHG) emission reductions across the state’s economy, including the electricity sector. In an effort to further decarbonize California’s energy supply, Governor Brown, through Executive Order B-55-18, also set the goal to achieve carbon net neutrality as soon as possible or no later than 2045.3
Figure 2. California Renewable Energy Goals and Achievements Timeline
Source: California Energy Commission, staff analysis December 2018
In response to these goals and new legislative mandates, the annual renewable percentage estimated by the Energy Commission has continued to increase in recent years, often ahead of the timelines envisioned by prior legislation. The historical estimated renewable percentage values are shown in Figure 3.
3 https://www.gov.ca.gov/wp-content/uploads/2018/09/9.10.18-Executive-Order.pdf

California Energy Commission – Tracking Progress
Last updated December 2018 Renewable Energy 3
Figure 3. Reported Annual Renewable Percentage Estimates
Source: California Energy Commission, staff analysis November 2018
Renewable Energy Serving California Consumers
Renewables Portfolio Standard
On September 10, 2018, Governor Brown signed Senate Bill (SB) 100 (De León, Chapter 312, Statutes of 2018) increasing California’s RPS target to 60 percent by 2030.4 LSEs demonstrate compliance with the RPS through the use of Renewable Energy Credits (RECs), certificates of proof associated with the generation of 1 megawatt-hour (MWh) of electricity from a California RPS-certified renewable energy resource. LSEs report the retirement of RECs to support their claims of procurement to meet their RPS requirements.
The RPS establishes multiyear compliance periods in recognition that given resources may not be continuously and/or cost-effectively available, and a utility’s procurement may vary to some degree from one year to another. For each compliance period, the RPS requires all LSEs in the state to achieve escalating procurement targets.5 LSEs are also required to procure a “balanced portfolio” of resources over each compliance period.6 In Compliance Period (CP) 3, which covers 2017-2020, LSEs are required to procure increasing amounts of renewable electricity each year ramping up to achieve at least 33 percent of retail sales by December 31, 2020. An LSE’s compliance with RPS requirements will be determined based on the aggregated sales and procurement over the entire four-year period.
4 https://leginfo.legislature.ca.gov/faces/billNavClient.xhtml?bill_id=201720180SB100
5 Compliance Period Targets for POUs are defined in California Code of Regulations (CCR) Title 20, Section 3204(a) and in CPUC Decision D. 11-12-020 for retail sellers. The Energy Commission has not at this time formally amended the CCR Title 20, Section 3204 to incorporate the statutorily defined targets for 2024, 2027, and 2030.
6 Public Utilities Code Sections 399.16 and 399.30.
California Energy Commission – Tracking Progress
Last updated December 2018 Renewable Energy 4
California LSEs have been very successful in meeting the RPS requirements. According to annual reported information, that has not yet been verified, some entities indicate procurement of renewable energy in excess of the near term RPS goals. For example, San Diego Gas & Electric reported a 44 percent renewable procurement percentage in 2017, far exceeding the 2020 goal. According to the California Public Utilities Commission (CPUC), which oversees the RPS compliance of retail sellers, 14 retail sellers, including the three large investor-owned utilities (IOUs) that served the majority of California’s sales, were found to be in compliance in CP 1.7 The remaining six retail sellers were non-compliant.8 The Energy Commission oversees compliance for 43 publicly owned utilities (POUs). Of the 41 POUs that have been found in compliance for the 2011-2013 period to date, 26 met the procurement targets and portfolio balance requirements and 15 POUs applied optional compliance measures to satisfy one or more procurement requirements.9 In CP 2, which covers 2014-2016, only six POUs have reported the use of optional compliance measures to satisfy their RPS procurement requirements. Verified results for CP 2 are expected to be complete in early 2019, with compliance determinations to follow.
Statewide Renewable Generation
For 2018, solar continues to represent the largest portion of renewable generation serving California load. Solar and wind generation together accounted for more than 69 percent of all renewable electricity generation, not including behind-the-meter (BTM) or off-grid solar generation.
Figure 4 shows renewable generation from facilities serving California load from 1983–2018 by resource type, including BTM solar resources. The estimated 2018 total renewable generation, including out-of-state generation delivered to California and BTM solar generation, is 97,358 GWh, including an estimated 13,618 GWh of BTM solar. In the past five years, solar generation has increased by nearly 490 percent and BTM solar resources increasing by approximately 310 percent. These generation estimates do not include 74 GWhs from BTM wind resources. Figure 4 also shows key policy changes in 2002, 2006, 2011, 2015, and 2018 that have supported renewable resource development.
7 Two retail sellers found out of compliance in CP 1 have waivers pending before the CPUC that could excuse noncompliance, if approved.
8 Information on entities found in compliance and those determined to be non-compliant is available at: http://www.cpuc.ca.gov/General.aspx?id=3856
9 The Energy Commission cannot make a compliance determination for the Los Angeles Department of Water and Power until its verified results are adopted at a Commission Business Meeting, verified results have not been finalized due to a pending appeal. The final compliance determination for the Port of Stockton is pending the resolution of a complaint of alleged noncompliance.

California Energy Commission – Tracking Progress
Last updated December 2018 Renewable Energy 5
Figure 4. Total Renewable Generation Serving California Load by Resource Type
Source: California Energy Commission, staff analysis November 2018
Renewables Generation Profiles
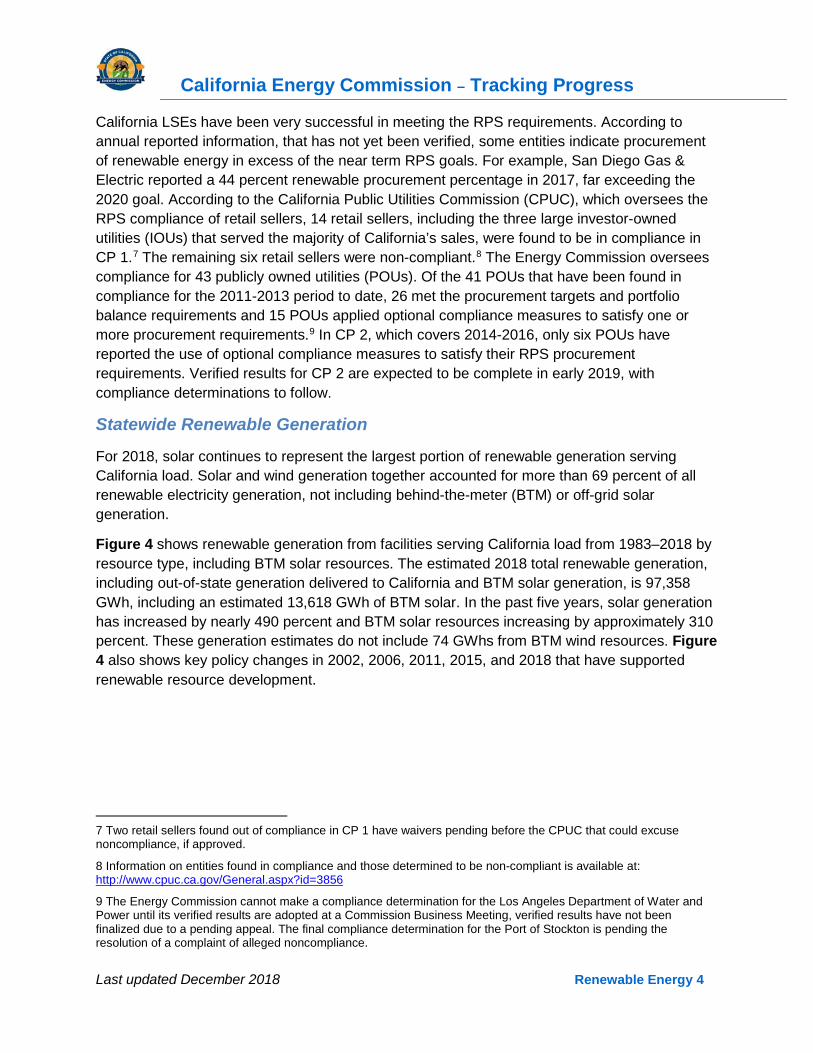
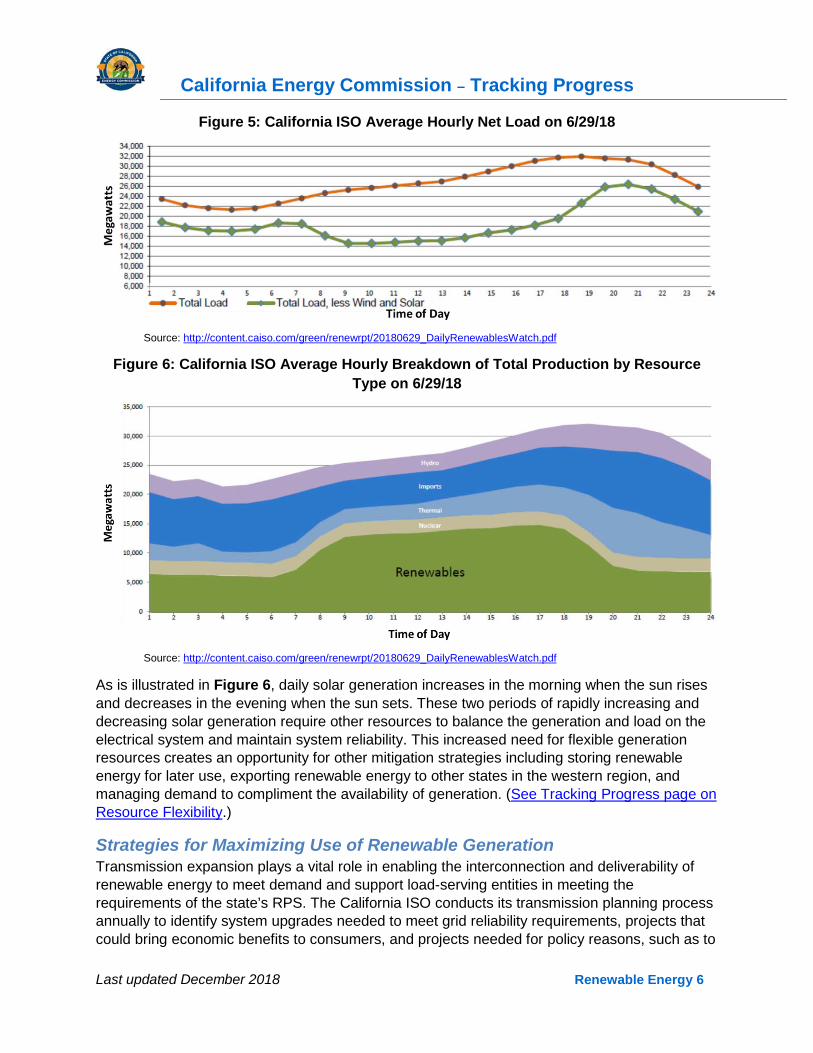
The rapid growth in renewables, particularly solar generation, has dramatically changed California’s generation profile, and California’s grid operators have had to adapt to these changes. For example, for one minute on May 26, 2018, an average of 73.9 percent of load on the California Independent System Operator (California ISO) grid was served by RPS resources.10 California ISO experienced a new instantaneous solar generation record on June 29, 2018, when solar capacity peaked at 10,739 megawatts (MW).11 Figure 5 shows the total load and the total load less wind and solar on June 29, 2018, when renewables served a peak load of 13,570 MW.12 Figure 6 shows the California ISO’s 24-hour snapshot of the overall resource profile, demonstrating how much of the state’s overall production on that day came from renewables.13 The amount of curtailment, when generation is reduced because it exceeds expected demand, on June 29, 2018, was low. As summer cooling demand increases, curtailment typically decreases. On June 29, 2018, the largest hourly curtailment occurred in between 7 A.M. and 8 A.M. with 12 MWh curtailed, and the total generation curtailed on that date was 32 MWh.14
10 https://efiling.energy.ca.gov/GetDocument.aspx?tn=223856
11 https://www.caiso.com/Documents/MonthlyStats-Jun2018.pdf
12 Ibid. 13 http://content.caiso.com/green/renewrpt/20180629_DailyRenewablesWatch.pdf
14 http://www.caiso.com/Documents/Wind_SolarReal-TimeDispatchCurtailmentReportJun29_2018.pdf
California Energy Commission – Tracking Progress
Last updated December 2018 Renewable Energy 6
Figure 5: California ISO Average Hourly Net Load on 6/29/18
Source: http://content.caiso.com/green/renewrpt/20180629_DailyRenewablesWatch.pdf
Figure 6: California ISO Average Hourly Breakdown of Total Production by Resource Type on 6/29/18
Source: http://content.caiso.com/green/renewrpt/20180629_DailyRenewablesWatch.pdf
As is illustrated in Figure 6, daily solar generation increases in the morning when the sun rises and decreases in the evening when the sun sets. These two periods of rapidly increasing and decreasing solar generation require other resources to balance the generation and load on the electrical system and maintain system reliability. This increased need for flexible generation resources creates an opportunity for other mitigation strategies including storing renewable energy for later use, exporting renewable energy to other states in the western region, and managing demand to compliment the availability of generation. (See Tracking Progress page on Resource Flexibility.)
Strategies for Maximizing Use of Renewable Generation Transmission expansion plays a vital role in enabling the interconnection and deliverability of renewable energy to meet demand and support load-serving entities in meeting the requirements of the state’s RPS. The California ISO conducts its transmission planning process annually to identify system upgrades needed to meet grid reliability requirements, projects that could bring economic benefits to consumers, and projects needed for policy reasons, such as to
California Energy Commission – Tracking Progress
Last updated December 2018 Renewable Energy 7
meet California’s renewable and clean energy goals.15 Transmission constraints inhibit the ability of California to both export excess generation, like mid-day solar, or to import generation, such as afternoon wind from out of state, to help balance regional resources during steep afternoon ramp periods when demand grows and solar generation declines. Additionally, expanded transmission could increase opportunities for broader participation in the western Energy Imbalance Market, a California ISO established real-time market to buy and sell generation through the western region, and export excess renewable generation.16
Storage is another tool that can maximize the benefits of renewable energy resources and help ensure the reliability of the electrical grid.17 Energy storage technologies capture potential energy, electricity, or heat for later use, which can be particularly helpful to balance times when there is too much or not enough electricity to meet demand. The state is seeing significant growth in the installation of energy storage at large generation facilities, commercial sites, and even individual homes. The variety of storage technologies in commercial use or in the research and development phase is also growing. (See the Tracking Progress page on Energy Storage.)
Renewable Capacity
California Installed Renewable Capacity Figure 7 shows California installed renewable electricity capacity totaled an estimated 30,759 MW as of December 31, 2018. This total includes nearly 7,955 MW of solar BTM capacity (excluding very small amounts of BTM wind and biomass) from homes and businesses throughout the state.18 Large-scale renewables make up about 57 percent of total statewide capacity, or about 17,470 MW.19 Solar represents the majority of renewable capacity installed in the state.
15 For more information, see the Transmission Expansion for Delivering Renewable Energy – Tracking Progress, https://www.energy.ca.gov/renewables/tracking_progress/documents/transmission_expansion_projects.pdf
16 https://www.westerneim.com/Pages/About/default.aspx
17 A summary of California’s progress in supporting the development and integration of energy storage is available in the Energy Storage Tracking Progress report. California Energy Commission, Energy Storage Tracking Progress report, http://www.energy.ca.gov/renewables/tracking_progress/documents/energy_storage.pdf
18 Total installed rounded values Ibid.
19 Generation facilities larger than 20 MW in capacity.

California Energy Commission – Tracking Progress
Last updated December 2018 Renewable Energy 8
Figure 7. Annual Cumulative Installed Renewable Capacity Since 1983 (Including BTM Solar)
Source: California Energy Commission, staff analysis November 2018
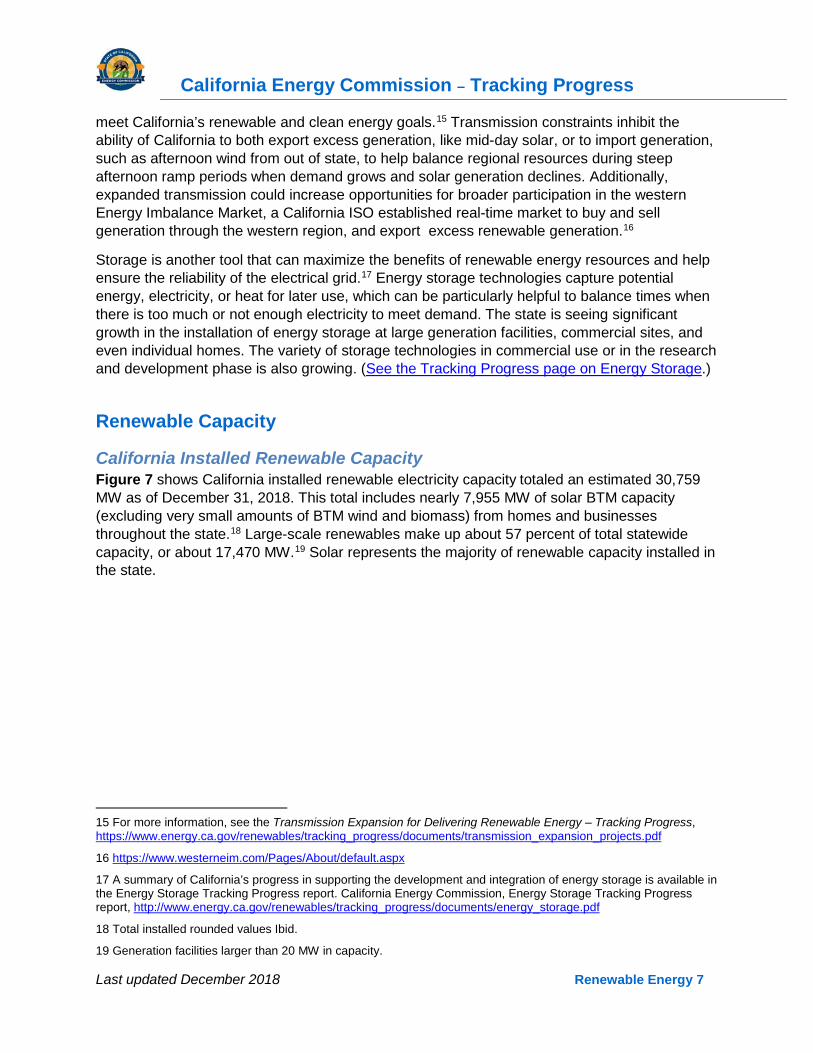
To support achieving its GHG emission reduction and renewable energy goals. California continues to implement policies and programs to increase renewable energy capacity in the state. To help support the growth of renewables and expand California’s economy, in 2010 then Attorney General and candidate for Governor, Edmund G. Brown Jr., announced his Clean Energy Jobs Plan. This plan included a goal of adding 20,000 MW of renewable capacity by 2020, composed of 8,000 MW of large-scale renewable generation and 12,000 MW of renewable distributed generation.20 Figure 8 shows the progress toward meeting these California capacity goals.
20 All local renewable generation with a capacity less than 20 MW.
California Energy Commission – Tracking Progress
Last updated December 2018 Renewable Energy 9
Figure 8. California Capacity Goals Achieved
Source: California Energy Commission, staff analysis November 2018
California now has more than doubled the 8,000 MW large-scale renewables capacity goals. According to data collected by the Energy Commission, the 12,000 MW distributed generation goal also has been met.
Renewable Capacity Across the State Renewable energy capacity from large-scale facilities has expanded across California, with regional resources and available transmission playing a role in the development patterns. California has also seen significant growth in the amount of installed distributed generation, often under a “net-energy-metering” agreement.
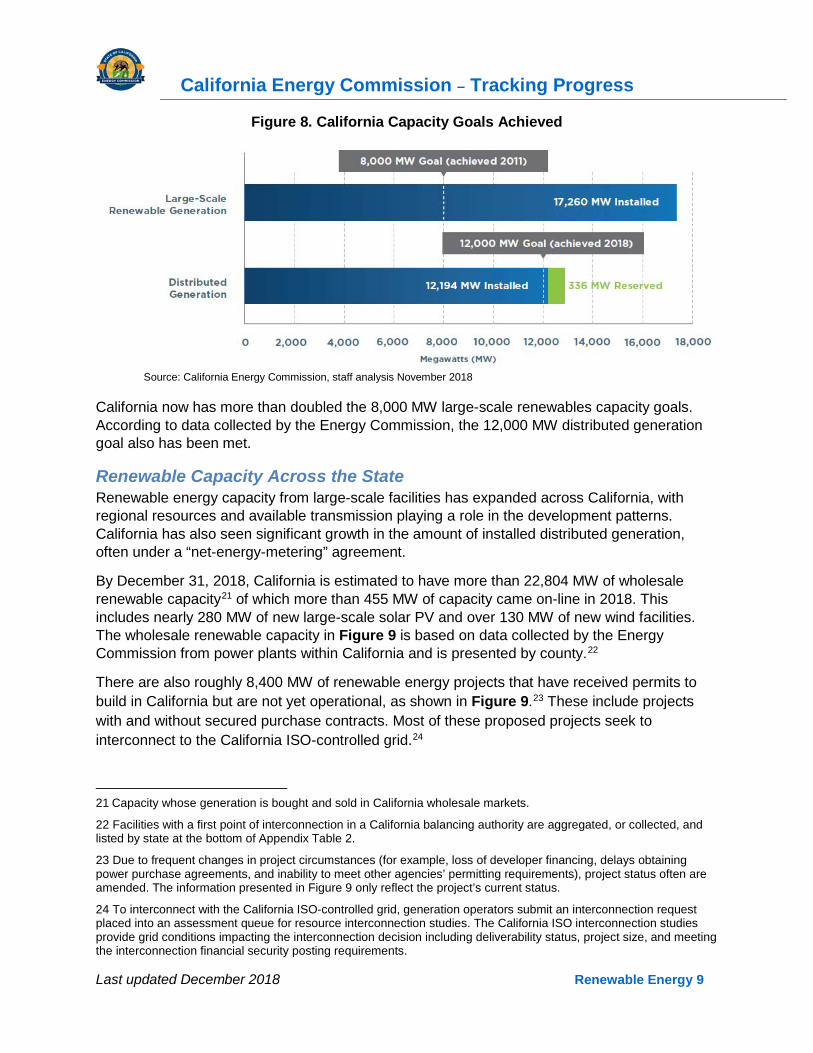
By December 31, 2018, California is estimated to have more than 22,804 MW of wholesale renewable capacity21 of which more than 455 MW of capacity came on-line in 2018. This includes nearly 280 MW of new large-scale solar PV and over 130 MW of new wind facilities. The wholesale renewable capacity in Figure 9 is based on data collected by the Energy Commission from power plants within California and is presented by county.22
There are also roughly 8,400 MW of renewable energy projects that have received permits to build in California but are not yet operational, as shown in Figure 9.23 These include projects with and without secured purchase contracts. Most of these proposed projects seek to interconnect to the California ISO-controlled grid.24
21 Capacity whose generation is bought and sold in California wholesale markets.
22 Facilities with a first point of interconnection in a California balancing authority are aggregated, or collected, and listed by state at the bottom of Appendix Table 2.
23 Due to frequent changes in project circumstances (for example, loss of developer financing, delays obtaining power purchase agreements, and inability to meet other agencies’ permitting requirements), project status often are amended. The information presented in Figure 9 only reflect the project’s current status.
24 To interconnect with the California ISO-controlled grid, generation operators submit an interconnection request placed into an assessment queue for resource interconnection studies. The California ISO interconnection studies provide grid conditions impacting the interconnection decision including deliverability status, project size, and meeting the interconnection financial security posting requirements.
California Energy Commission – Tracking Progress
Last updated December 2018 Renewable Energy 10
In addition to showing RPS-eligible wholesale facilities, and permitted projects, Figure 9 also shows the geographic capacity across California counties for on-line distributed generation systems, including BTM (as of June 30, 2018).
Figure 9. Map of Renewable Capacity for On-Line Distributed Generation Systems, RPS-Eligible Wholesale Facilities, and Permitted Projects
Source: California Energy Commission, staff analysis November 2018

California Energy Commission – Tracking Progress
Last updated December 2018 Renewable Energy 11
Distributed Generation: California’s Million Solar Roofs Initiative In 2006, the landmark Million Solar Roofs Initiative was codified under Senate Bill 1 (Murray, Chapter 132, Statutes of 2006), which set forth a goal of installing solar photovoltaic systems on one million roofs by the end of 2018. SB1 and other legislation created the basis for a suite of incentive programs offered by the Energy Commission, the CPUC, and the state’s POUs. These efforts are also broadly referred to as the California Solar Initiative (CSI). The Energy Commission’s incentive program, the New Solar Homes Partnership, was established with a 360 MW goal for installation of distributed solar on newly constructed homes. The overall goals for all CSI incentive efforts was 3,000 MW of solar energy systems on homes and businesses by the end of 2016. Figure 10 shows the progress made towards achieving the NSHP and the overall CSI capacity goals.
Figure 10. California Capacity Goals Achieved
Source: California Energy Commission, staff analysis December 10, 2018.
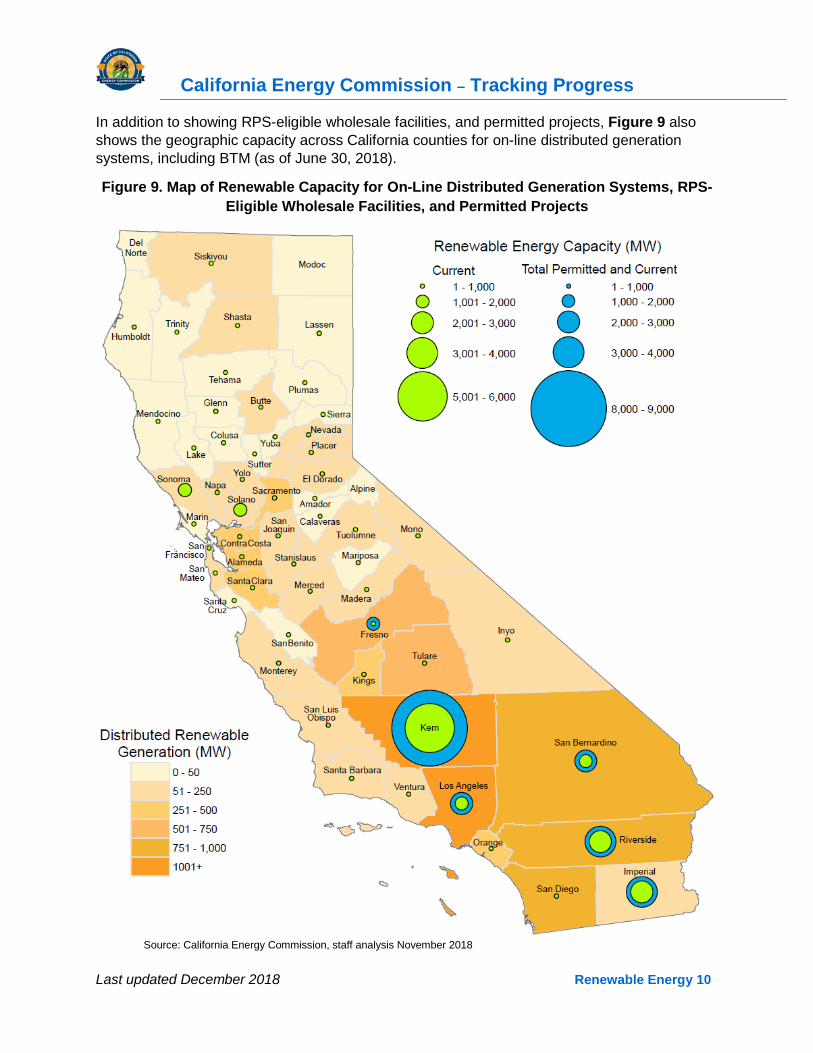
California is also approaching the goal of a million solar roofs. Since 2006, there has been steady progress, and Energy Commission staff estimates that by the end of 2018, over 958,000 solar systems will be installed across California. Supporting this growth of distributed generation resources has been a rapid decline in the costs to install solar on homes and businesses. Figure 11 shows the progress toward achieving California’s Million Solar Roofs goal and the concurrent decline in the cost of solar systems.
California Energy Commission – Tracking Progress
Last updated December 2018 Renewable Energy 12
Figure 11. Status of California’s Million Solar Roofs
Source: California Energy Commission, staff analysis November 2018
One factor that contributed to the growth in solar installations and the contemporaneous price decline was the suite of well-designed incentive programs that provided financial support to every housing type throughout the state. The CSI incentive programs were designed to provide a declining-rate incentive structure, recognizing that the earliest adopters would pay the highest prices but that over time the need for incentives to offset costs would decline, ultimately leading to a self-sustaining solar industry in which solar PV could be cost-competitive without subsidy. The programs were also designed to address the specific needs of new versus existing housing, multi-family and affordable housing projects, and certain commercial buildings. The POUs individually administered programs for existing buildings. The CPUC administered a general-market program for existing commercial and residential buildings in IOU territories, also known as the CSI, and two programs for low-income customers, the Multi-Family Affordable Solar Housing (MASH) and Single-Family Affordable Solar Homes (SASH). As mentioned, the Energy Commission administers the NSHP which was focused on newly constructed residential buildings including single family, multi-family, and affordable housing components. The Energy Commission also establishes the foundational equipment standards for all CSI programs and also maintains equipment lists25 of eligible PV modules, inverters, and other solar equipment.
25 While equipment on the lists have undergone tests to achieve minimal safety and performance standards, the Energy Commission does not independently confirm manufacturers' self-reported information. The Energy Commission and the State of California make no claim or warranty on the equipment and its safety, performance, or durability.

California Energy Commission – Tracking Progress
Last updated December 2018 Renewable Energy 13
Table 1 summarizes the installed renewable capacity and current status of the state incentive programs.
Table 1. Summary of State Incentive Programs
Program Agency Sector Incentivized
Installed Capacity Current Status MW Count California Solar Initiative (CSI) General Market Program 26
CPUC Existing buildings in IOU territories
1,900 143,000 Closed to new applications as of December 31, 2016.27
Multifamily Affordable Solar Homes (MASH) 28
CPUC
Multifamily affordable housing in IOU territories
40 (16 MW
Reserved) 470
Program is currently fully subscribed and are no longer taking new applications. New applications may be accepted if new funding becomes available due to project cancellations.
Single family Affordable Solar Homes (SASH) 29
CPUC
Low-income single family homeowners in IOU territories
24 7,900 Actively enrolling new participants.
New Solar Homes Partnership (NSHP)
CEC New residential construction in IOU territories
138 (13 affordable
housing) 44,000
Closed to new applications as of June 1, 2018. Payments through 2021.30
SB1 POU Programs
Various POUs31
All sectors in POU territories 500 59,000 Most programs closed
to new applications. Source: California Energy Commission, staff compilation gathered from footnoted sources. Displayed numbers are rounded.
26 2018 CSI Annual Program Assessment http://www.cpuc.ca.gov/WorkArea/DownloadAsset.aspx?id=6442457977
27 Exceeded the 1,750 MW Installation goal. For more information, see http://www.gosolarcalifornia.ca.gov/about/csi.php. 28 CSI MASH Program. Accessed October 2018. https://www.californiasolarstatistics.ca.gov/reports/mash_budget/
29 SASH Semi-Annual Progress Report July 2018 http://www.cpuc.ca.gov/WorkArea/DownloadAsset.aspx?id=6442458883
30 In 2015, Senate Bill 83 (Committee on Budget and Fiscal Review Chapter 24, Statues of 2015) extended the life of the NSHP program and required all incentives to be encumbered through the issuance of reservations no later than June 1, 2018, and disbursed no later than December 31, 2021. 31 The POUs are required by SB1 to annually report to the Energy Commission program participation and installations through December 31, 2016.
California Energy Commission – Tracking Progress
Last updated December 2018 Renewable Energy 14
Require Solar on New Homes Beginning in 2020 Building on the success of the NSHP, which supported reductions in the cost for solar and adoption of solar in the building industry, in May 2018, the Energy Commission adopted the 2019 Building Energy Efficiency Standards requiring the installation of solar photovoltaic systems on the majority of new homes, starting January 1, 2020. With continuing solar cost declines, solar is now cost-effective for new home construction across the state. This commitment to building highly energy efficient housing that is served by on-site or community-based solar photovoltaic systems will play an important role in California achieving the goal of a zero net carbon economy by 2045.32
California Benefits From Dramatic Decreases in the Cost of Renewables Continued cost declines in renewable energy sources, mainly solar and wind energy, have helped maintain a fast pace of market growth for renewables. As part of the U.S. Department of Energy’s (DOE) SunShot program, the Lawrence Berkeley National Laboratory (LBNL) reports the median installed prices for solar energy systems quarterly and annually by system size. The most recent LBNL report shows that for projects completed in 2017 there have been dramatic price declines over time. From 2000-2017, the average price decline was roughly $0.5/W per year in the three customer categories shown below averaging 6 percent per year for residential, 8 percent for small (≤500 kW) non-residential systems, and 11 percent for large (>500 kW) non-residential systems. As Figure 12 shows, the prices declines were not steady, but instead marked by periods of steep drops and leveling off. In 2009 prices began to decline again, steeply at first, an approximate average of $1/W per year through 2013. These price drops have slowed considerably with median prices falling by $0.2/W (6 percent) for residential systems, by $0.4/W (11 percent) for small non-residential, and by $0.1/W (5 percent) for large non-residential systems. This pace of declines has been fairly consistent since 2014. Figure 12 displays median installed system costs (solid line) and the 20th-80th percentile range (shaded areas) for residential systems (green), small nonresidential systems (≤500 kW in red), and large nonresidential systems (>500 kW in blue).33
32 http://www.energy.ca.gov/releases/2018_releases/2018-05-09_building_standards_adopted_nr.html.
33 Barbose, Galen, Naïm Dargouth Kristina LaCommare, Dev Millstein, and Joe Rand. September 2018. Tracking the Sun – Installed Price Trends for Distributed Photovoltaic Systems in the United States – 2018 Edition. Lawrence Berkeley National Laboratory https://emp.lbl.gov/sites/default/files/tracking_the_sun_2018_edition_final_0.pdf. Page 18.

California Energy Commission – Tracking Progress
Last updated December 2018 Renewable Energy 15
Figure 12. U.S. Residential and Nonresidential PV System Prices
Source: U.S. Dept. of Energy, Tracking the Sun 10
The installed cost of wind has also decreased over time. The DOE reported that for projects completed in 2017, the national average capacity-weighted installed cost was about $1.61/watt, down $0.80/watt from 2010.34 An additional 50 MW of wind power capacity were added in California in 2017, bringing the total capacity to 5,555 MW.
The wholesale cost for renewable electricity has also seen large reductions between 2008 and 2016, as the price of utility scale solar contracts reported to the CPUC has gone down 77 percent. Between 2007 and 2015 reported prices of RPS contracts declined an average of 9.5 percent per year. Further, in 2017, the trend of falling contract costs resumed and reached a historic low price of $47/MWh for average annual RPS eligible energy contracts for all technology types.35 These wholesale price declines have made solar and wind cost competitive with traditional energy resources promoting broader adoption.36
In April 2018, the Lawrence Berkeley National Laboratory (LBNL) reported on their study of income trends of residential PV adopters.37 The analysis, based on actual income from Experian, focused on single-family rooftop PV installations through 2016 from 13 U.S. states. LBNL concluded that single-family rooftop PV installations have been trending towards
34 Wiser, Ryan and Mark Bollinger. August 2018. 2017 Wind Technologies Market Report, Lawrence Berkeley National Laboratory. https://www.energy.gov/sites/prod/files/2018/08/f54/2017_wind_technologies_market_report_8.15.18.v2.pdf. The majority of recent wind installations are in the U.S. interior and not in California. These national costs may not closely track California costs.
35 http://www.cpuc.ca.gov/uploadedFiles/CPUC_Public_Website/Content/Utilities_and_Industries/Energy_-_Electricity_and_Natural_Gas/Renewables%20Portfolio%20Standard%20Annual%20Report%202018.pdf
36 https://www.lazard.com/perspective/levelized-cost-of-energy-2017/
37 Lawrence Berkeley National Laboratory, “Income Trends of Residential PV Adopters – An analysis of household-level income estimates,” April 2018, https://emp.lbl.gov/publications/income-trends-residential-pv-adopters/?utm_source=newsletter98&utm_medium=email&utm_campaign=Constant%20Contact

California Energy Commission – Tracking Progress
Last updated December 2018 Renewable Energy 16
moderate-income (middle class)38 households in recent years – the median annual income for PV adopters in this study has dropped from $100,000 in 2010 to $87,000 in 2016. The study identified home ownership as one of the main differences among income groups regarding PV adoption, thus reinforcing the importance of business models and programs to assist renters. LBNL aims to extend their analyses to include multi-family homes and community solar participants.
California Trends & Opportunities
Ensuring the Benefits of Renewable Energy Reach All Californians In achieving the state’s climate and renewable energy goals, the Energy Commission is taking steps to ensure that the benefits are realized by all Californians, including low-income residents and those in the most vulnerable communities.
In December 2016, the Energy Commission published a report, as mandated by SB 350,39 that explored the barriers to and opportunities for expanding low-income customers’ access to energy efficiency, weatherization, and renewable energy investments. One of the barriers mentioned in the report was the lack of low-income renters’ ability to participate in and benefit from renewable energy developments. Among a range of suggested actions, the report recommended that the state enable economic advantages of solar to be readily accessible to low-income and disadvantaged populations across California.
Impacted state agencies have been working together closely with the Governor’s Office over the past two years to implement this and the other recommendations from the report. A summary of efforts and accomplishments for including low-income and disadvantaged communities with the state’s energy initiatives can be found in a separate Energy Commission Tracking Progress document focused on Energy Equity Indicators, which is also available as an interactive web map and a Tracking Progress page.40
Several existing programs overseen by the Energy Commission are performing well in providing opportunities for low-income and disadvantaged consumers to participate in the clean energy economy. For example, since the beginning of 2007, the NSHP program has awarded roughly 22 percent of program funding, equivalent to almost $41 million, to projects located in low-income or disadvantaged census tracts.41 Other Energy Commission programs have fared even better in this regard. Looking forward, the recently announced Renewable Energy for Agriculture
38 Consistent with the Pew Research Center this study defines 2016 United States “middle class” households as those with incomes from $36,106 to $107,778.
39 Low-Income Barriers Study, Part A: Overcoming Barriers to Energy Efficiency and Renewables for Low-Income Customers and Small Business Contracting Opportunities in Disadvantaged Communities, December 2016, CEC-300-2016-009-CMF. https://efiling.energy.ca.gov/getdocument.aspx?tn=214830
40 California Energy Commission’s Energy Equity Indicators website http://www.energy.ca.gov/sb350/barriers_report/equity-indicators.html.
41 Energy Commission Project Equity Dashboard, Accessed on 12/17/2018. http://caenergy.maps.arcgis.com/apps/opsdashboard/index.html#/b69f4ef960f74a22b464e6363881af59
California Energy Commission – Tracking Progress
Last updated December 2018 Renewable Energy 17
Program (REAP) aims to further develop renewable energy capacity on agricultural lands, with a preference for funding to be awarded to projects located in disadvantaged communities.42
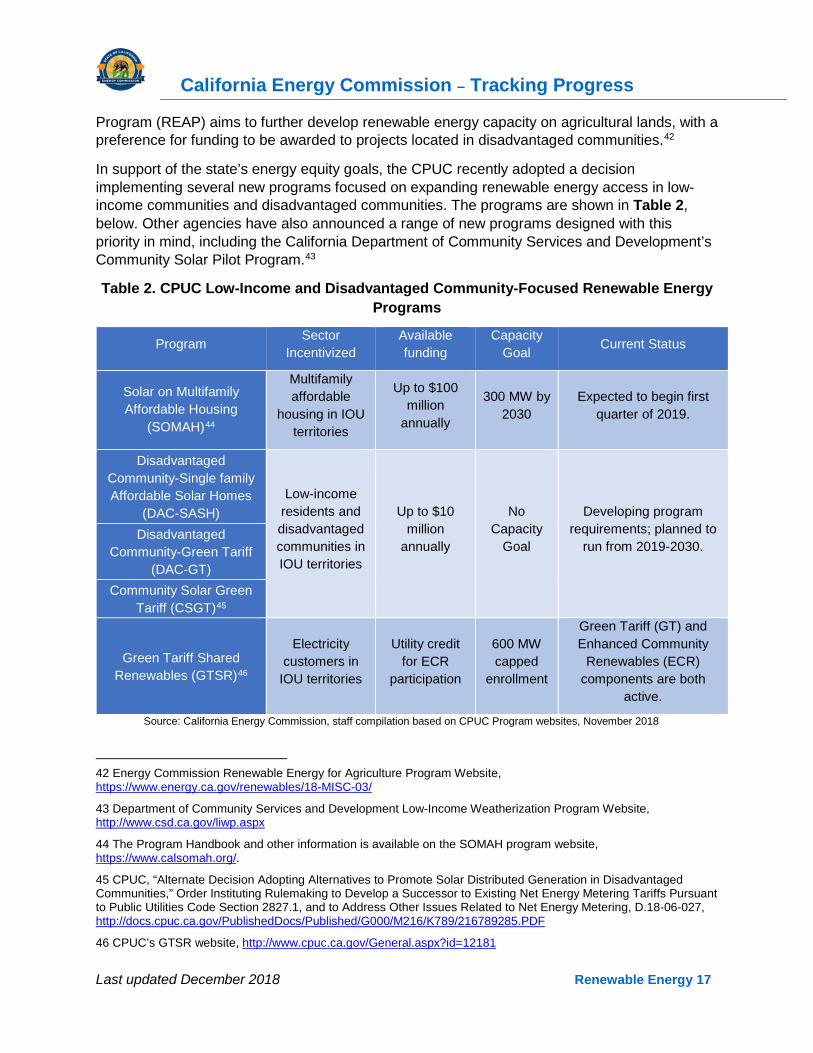
In support of the state’s energy equity goals, the CPUC recently adopted a decision implementing several new programs focused on expanding renewable energy access in low-income communities and disadvantaged communities. The programs are shown in Table 2, below. Other agencies have also announced a range of new programs designed with this priority in mind, including the California Department of Community Services and Development’s Community Solar Pilot Program.43
Table 2. CPUC Low-Income and Disadvantaged Community-Focused Renewable Energy Programs
Program Sector Incentivized
Available funding
Capacity Goal Current Status
Solar on Multifamily Affordable Housing
(SOMAH)44
Multifamily affordable
housing in IOU territories
Up to $100 million
annually
300 MW by 2030
Expected to begin first quarter of 2019.
Disadvantaged Community-Single family Affordable Solar Homes
(DAC-SASH) Low-income
residents and disadvantaged communities in IOU territories
Up to $10 million
annually
No Capacity
Goal
Developing program requirements; planned to
run from 2019-2030. Disadvantaged
Community-Green Tariff (DAC-GT)
Community Solar Green Tariff (CSGT)45
Green Tariff Shared Renewables (GTSR)46
Electricity customers in
IOU territories
Utility credit for ECR
participation
600 MW capped
enrollment
Green Tariff (GT) and Enhanced Community
Renewables (ECR) components are both
active.
Source: California Energy Commission, staff compilation based on CPUC Program websites, November 2018
42 Energy Commission Renewable Energy for Agriculture Program Website, https://www.energy.ca.gov/renewables/18-MISC-03/ 43 Department of Community Services and Development Low-Income Weatherization Program Website, http://www.csd.ca.gov/liwp.aspx 44 The Program Handbook and other information is available on the SOMAH program website, https://www.calsomah.org/.
45 CPUC, “Alternate Decision Adopting Alternatives to Promote Solar Distributed Generation in Disadvantaged Communities,” Order Instituting Rulemaking to Develop a Successor to Existing Net Energy Metering Tariffs Pursuant to Public Utilities Code Section 2827.1, and to Address Other Issues Related to Net Energy Metering, D.18-06-027, http://docs.cpuc.ca.gov/PublishedDocs/Published/G000/M216/K789/216789285.PDF
46 CPUC’s GTSR website, http://www.cpuc.ca.gov/General.aspx?id=12181
California Energy Commission – Tracking Progress
Last updated December 2018 Renewable Energy 18
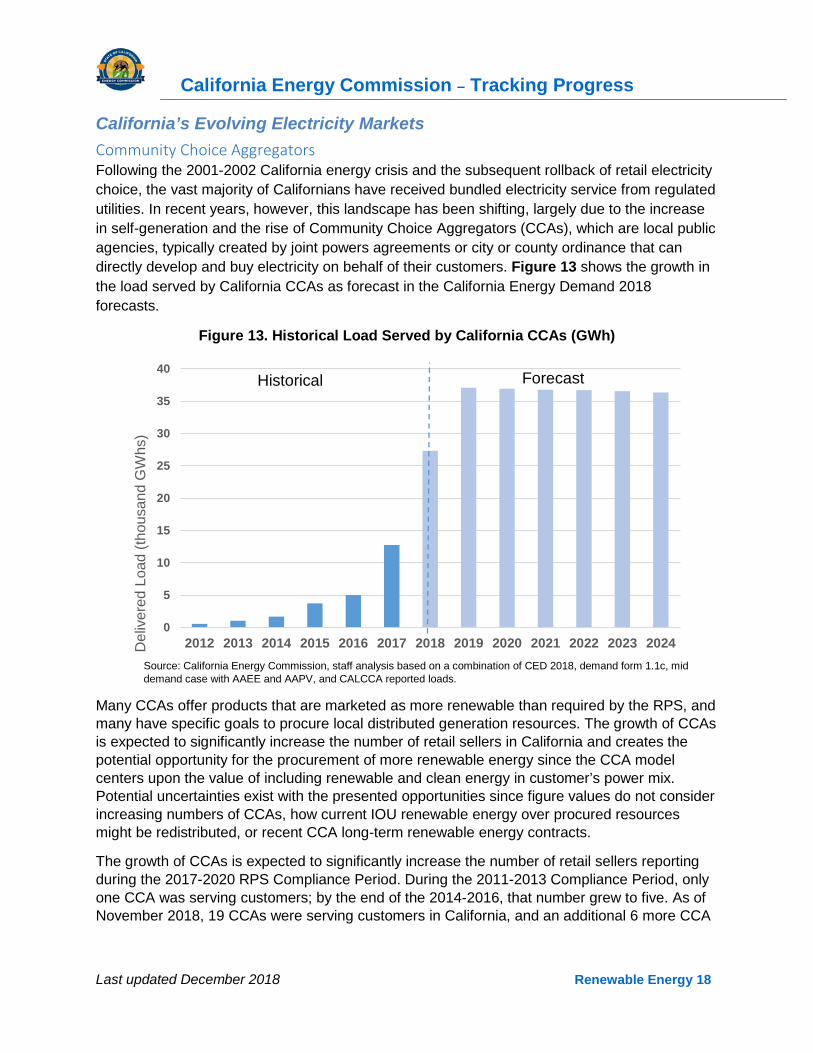
California’s Evolving Electricity Markets Community Choice Aggregators Following the 2001-2002 California energy crisis and the subsequent rollback of retail electricity choice, the vast majority of Californians have received bundled electricity service from regulated utilities. In recent years, however, this landscape has been shifting, largely due to the increase in self-generation and the rise of Community Choice Aggregators (CCAs), which are local public agencies, typically created by joint powers agreements or city or county ordinance that can directly develop and buy electricity on behalf of their customers. Figure 13 shows the growth in the load served by California CCAs as forecast in the California Energy Demand 2018 forecasts.
Figure 13. Historical Load Served by California CCAs (GWh)
Source: California Energy Commission, staff analysis based on a combination of CED 2018, demand form 1.1c, mid demand case with AAEE and AAPV, and CALCCA reported loads.
Many CCAs offer products that are marketed as more renewable than required by the RPS, and many have specific goals to procure local distributed generation resources. The growth of CCAs is expected to significantly increase the number of retail sellers in California and creates the potential opportunity for the procurement of more renewable energy since the CCA model centers upon the value of including renewable and clean energy in customer’s power mix. Potential uncertainties exist with the presented opportunities since figure values do not consider increasing numbers of CCAs, how current IOU renewable energy over procured resources might be redistributed, or recent CCA long-term renewable energy contracts.
The growth of CCAs is expected to significantly increase the number of retail sellers reporting during the 2017-2020 RPS Compliance Period. During the 2011-2013 Compliance Period, only one CCA was serving customers; by the end of the 2014-2016, that number grew to five. As of November 2018, 19 CCAs were serving customers in California, and an additional 6 more CCA
0
5
10
15
20
25
30
35
40
2012 2013 2014 2015 2016 2017 2018 2019 2020 2021 2022 2023 2024Del
iver
ed L
oad
(thou
sand
GW
hs)
ForecastHistorical

California Energy Commission – Tracking Progress
Last updated December 2018 Renewable Energy 19
launches or expansions are anticipated through 2020.47 Figure 14 shows the entities, by the end of 2018, operating as, anticipating launching, or investigating becoming a CCA. RPS compliance reports submitted by the operational CCAs during the first and second RPS compliance periods indicate that they have met current RPS targets.48
Figure 14. Operational, Pending, and Potential CCAs49
Source: California Energy Commission, staff updated Gridworks Community Choice Aggregation and California’s Clean Energy Future, June 201850 to reflect recent anticipated and actual launches.
47 CPUC 2018 Annual RPS Report to the Legislature, http://www.cpuc.ca.gov/uploadedFiles/CPUC_Public_Website/Content/Utilities_and_Industries/Energy_-_Electricity_and_Natural_Gas/Renewables%20Portfolio%20Standard%20Annual%20Report%202018.pdf..
48 CPUC 2017 Annual RPS Report. During RPS Compliance Period 1, only MCE was operational. The other CCAs listed came on-line during Compliance Period 2, except Silicon Valley Clean Energy, which came on-line in 2017 and therefore has not yet been subject to compliance reporting.
49 Does not reflect the 2018 launch of Clean Power Alliance of Southern California phase 2, King City, the December 2018 launch of SJCE’s commercial Total Green, or the delay in the launch of Desert Community and the remainder of SJCE.
50 https://gridworks.org/wp-content/uploads/2018/06/Gridworks_CCA-Clean-Energy-Overview_final-1.pdf

California Energy Commission – Tracking Progress
Last updated December 2018 Renewable Energy 20
The CPUC’s report titled, California Customer Choice, An Evaluation of Regulatory Framework Options for an Evolving Energy Market reports that by the end of 2018, as much as 25 percent of IOU retail electric load will be served by a combination of rooftop solar, CCAs and direct access providers.51 A CPUC staff white paper further predicted that this number could grow to 85 percent in the next decade, which would represent as many as 15 million to 20 million customers.52 The potential widespread growth of CCAs presents opportunities and challenges for renewable development, as well as raising broader considerations of reliability, load uncertainty, and cost allocation. There are also potential uncertainties raised by recent fee changes impacting CCAs.53 At the same time the growth of California CCAs presents a significant opportunity to exceed the state’s RPS. Recently CalCCA highlighted that CCAs signed more than 2,000 MW of long-term renewable contracts.54
Non-Utility Support for Renewable Energy Development As renewable power continues to become more cost competitive and sustainability and environmental programs expand, corporations and other non-utility entities are accelerating their direct purchasing of renewable power. Many corporations, universities, and military bases are committed to increasing the use of renewable electricity, and their actions are contributing to the growth of renewable energy in California. In IOU territories, corporations and other entities participate in the existing limited Direct Access programs,55 negotiate highly renewable products from their host utility, purchase unbundled RECs, and enter into virtual power purchase agreements (PPAs).
These accelerated renewable direct purchases are bolstered by initiatives such as RE100, uniting companies committed to using 100 percent renewable electricity to power their business operations.56 RE100 members include some of California’s largest companies, such as Apple, Google, and Salesforce, and membership has diversified in recent years to include more than just technology companies. The Business Renewables Center reports that corporations purchased 6.43 GW of clean energy nationally through December 14, 2018, which exceeds both the 2.78 GW contracted in 2017 and nearly doubles the previous record of 3.22 GW contracted in 2015.57
51 CPUC, page 4. Accessed November 16, 2018. http://www.cpuc.ca.gov/uploadedFiles/CPUC_Public_Website/Content/Utilities_and_Industries/Energy_-_Electricity_and_Natural_Gas/Cal%20Customer%20Choice%20Report%208-7-18%20rm.pdf
52 CPUC, Consumer and Retail Choice, the Role of the Utility, and an Evolving Regulatory Framework, Staff White Paper, May 2017. http://www.cpuc.ca.gov/uploadedFiles/CPUC_Public_Website/Content/News_Room/News_and_Updates/Retail%20Choice%20White%20Paper%205%208%2017.pdf.
53 http://docs.cpuc.ca.gov/PublishedDocs/Published/G000/M232/K161/232161603.PDF
54 https://cal-cca.org/wp-content/uploads/2018/11/CalCCA-Renewable-Energy-Map-11.15.18-Final.pdf
55 http://www.cpuc.ca.gov/General.aspx?id=7881
56 http://there100.org/re100
57 http://businessrenewables.org/corporate-transactions/, accessed December 18, 2018.

California Energy Commission – Tracking Progress
Last updated December 2018 Renewable Energy 21
Organizations from the public sector are also taking action that has direct impact on increasing the state’s use of renewable energy. Universities and military organizations have both increased their direct procurement of renewable resources through bilateral PPAs. The University of California system announced in September 2018 that it is committing to 100 percent clean electricity supplies by 2025, 20 years ahead of the new goal established by SB 100. This commitment will cover all 10 of its campuses and related facilities.58 The military is also a strong advocate of renewable energy, and California military installations have been early adopters in developing on-site renewable generation to directly serve their electricity needs, fueled by the understanding that national security and energy security are interconnected. Military procurements of renewables are expected to further increase over the coming years, with the U.S. Department of Defense having a stated goal of producing or procuring at least 25 percent of its total facility energy use from renewable sources by 2025.59 .
Recent corporate procurements in California include Kaiser Permanente, which announced in September 2018 that it finalized a PPA that will provide the financial certainty to enable construction of 180 MW of utility-scale renewable capacity including a 131 MW solar integrated with storage facility in Riverside County.60 According to a National Renewable Energy Laboratory (NREL) analysis, California had 822 MW of renewable energy purchased by corporations as of September 2017.61 Furthering this trend towards direct corporate purchase of renewables, an analysis by Baker McKenzie found that in the United States in 2017, the volume of offtake agreements62 signed with corporations exceeded the total number of contracts signed with all other offtakers, including utilities.63 The demand for renewable generation from corporate offtakers is expected to increase as corporations look to decarbonize their full supply chains and support the use of renewables to fuel energy-intensive operations, such as data centers.
Globally, according to REN21, corporate entities actively sourced 465 TWh (terawatt hours) of renewable electricity through 2017. While tracking and measuring corporate sourcing options and initiatives can be difficult, corporate offtakers and direct investors can be credited with spurring renewable energy generation more rapidly than would have happened without them.64
58 https://www.utilitydive.com/news/university-of-california-system-commits-to-100-clean-energy-by-2025/532419/
59 https://acore.org/wp-content/uploads/2018/10/ACORE_Issue-Brief_-The-Role-of-Renewable-Energy-in-National-Security.pdf 60 https://share.kaiserpermanente.org/article/kaiser-permanente-finalizes-agreement-to-enable-carbon-neutrality-in-2020/
61 https://www.nrel.gov/docs/fy17osti/69080.pdf
62 An agreement between a producer of a resource and a buyer of a resource to purchase or sell portions of the producer's future production. Source: www.investopedia.com/terms/o/offtake-agreement.asp.
63 https://www.bakermckenzie.com/-/media/files/insight/publications/2018/07/fc_emi_riseofcorporateppas_jul18.pdf?la=en
64 http://www.ren21.net/gsr-2018/chapters/chapter_08/chapter_08/
California Energy Commission – Tracking Progress
Last updated December 2018 Renewable Energy 22
Contacts:
• Tracking progress report: Malachi Weng-Gutierrez, [email protected]
• Renewable generation: Hazel Aragon, [email protected]
• Renewable capacity: Michael Nyberg, [email protected].
• Behind the Meter-generation: Sudhakar Konala, [email protected]
• Renewable energy facilities permitting: Joseph Merrill, [email protected]
Media inquiries should be sent to the Media and Public Communications Office at (916) 654-4989 or by email at [email protected].
The Appendix provides resources for more information on Energy Commission programs, projects, state energy goals, California electricity retail sales, and data sources used for the figures and tables in this report.
Next Update:
August 2019
Related Documents