Calculation of the carbon footprint and analysis of vehicle recycling from an environmental point of view Environment CYTOTOXICITY CAUSED BY METAL OXIDE NANOPARTICLES IN HUMAN NEURONAL CELLS Vehicle recycling, to make any sense, must produce an environmental benefit, reducing the use of raw materials and the associated energy expenditure. One part of this study sets out to calculate this saving in raw materials resulting from the recycling of end‐of‐life vehicles (ELVs). Hitherto attention has been paid only to compliance with recycling rates laid down by Real Decreto (Royal Decree) 1383/2002 [1], without taking into account the energy expenditure of the ELV processing chain itself. This expenditure fuels CO 2 emissions, which this article attempts to quantify in terms of the carbon footprint (CF). To complete the picture, vehicle recycling and the concomitant reuse of parts avoids emissions that would otherwise have been generated by the manufacture of these parts. Data from the CESVIMAP Authorised Treatment Facility (ATF) and three other ATFs have been analysed to ascertain the CO 2 emissions deriving from their activity. By P. MÁS ALIQUE. Doctor in Industrial Engineering. Dean of the Facultad de Ciencias y Artes UCAV. D. MUÑOZ JIMÉNEZ. Industrial Engineer. UCAV Professor SAVING OF RAW MATERIALS Vehicle recycling is an essential activity. Every year about 700,000 vehicles reach the end of their useful life in Spain and the only viable option, rather than filling up landfill sites with cars, is to recycle them. Real Decreto 383/2002 lays down the guidelines for correct environmental treatment of ELVs as well as some recycling goals. Since the law has come into force, Spain’s vehicle recycling industry has changed beyond recognition to meet its provisions, the old‐style scrapyards being transformed into modern Authorised Treatment Facilities (ATFs). A previous article published in this review gave a snapshot of this sector today [2] . Vehicle recycling was not invented yesterday. Even the old Ford factories used to harness the economic and environmental benefits of this activity. “During the Great Depression,” according to M. Braungart and W. McDonough, “the factory even took on the treatment of used cars. A disassembly line was set up, whose workers took out from each car the radiator, windscreens, tyres and upholstery as it moved down the line, until the bodywork and chassis were finally chucked into a huge press. It has to be admitted that the process was very primitive, based on brute force rather than any sophisticated design, but it was a striking illustration of the premise that ‘waste = food’ and a pioneer step towards the reuse of industrial material» [3] . This study sets out to answer the following questions: Year 33 N131 Third quarter 2013

Welcome message from author
This document is posted to help you gain knowledge. Please leave a comment to let me know what you think about it! Share it to your friends and learn new things together.
Transcript

Calculation of the carbon footprint and analysis of vehiclerecycling from an environmental point of viewEnvironment
CYTOTOXICITY CAUSED BY METAL OXIDE NANOPARTICLES IN HUMANNEURONAL CELLS
Vehicle recycling, to make any sense, must produce an environmentalbenefit, reducing the use of raw materials and the associated energyexpenditure. One part of this study sets out to calculate this saving in rawmaterials resulting from the recycling of end‐of‐life vehicles (ELVs).Hitherto attention has been paid only to compliance with recycling rateslaid down by Real Decreto (Royal Decree) 1383/2002 [1], without takinginto account the energy expenditure of the ELV processing chain itself.This expenditure fuels CO2 emissions, which this article attempts toquantify in terms of the carbon footprint (CF). To complete the picture,vehicle recycling and the concomitant reuse of parts avoids emissions thatwould otherwise have been generated by the manufacture of these parts.Data from the CESVIMAP Authorised Treatment Facility (ATF) and threeother ATFs have been analysed to ascertain the CO2 emissions derivingfrom their activity.
By P. MÁS ALIQUE. Doctor in Industrial Engineering. Dean of the Facultad de Ciencias y Artes UCAV.D. MUÑOZ JIMÉNEZ. Industrial Engineer. UCAV Professor
SAVING OF RAW MATERIALS
Vehicle recycling is an essential activity. Every year about 700,000 vehicles reach the end of their useful life in Spain andthe only viable option, rather than filling up landfill sites with cars, is to recycle them. Real Decreto 383/2002 lays downthe guidelines for correct environmental treatment of ELVs as well as some recycling goals. Since the law has come intoforce, Spain’s vehicle recycling industry has changed beyond recognition to meet its provisions, the old‐style scrapyardsbeing transformed into modern Authorised Treatment Facilities (ATFs). A previous article published in this review gave a
snapshot of this sector today [2].
Vehicle recycling was not invented yesterday. Even the old Ford factories used to harness the economic andenvironmental benefits of this activity. “During the Great Depression,” according to M. Braungart and W. McDonough, “thefactory even took on the treatment of used cars. A disassembly line was set up, whose workers took out from each car theradiator, windscreens, tyres and upholstery as it moved down the line, until the bodywork and chassis were finallychucked into a huge press. It has to be admitted that the process was very primitive, based on brute force rather than anysophisticated design, but it was a striking illustration of the premise that ‘waste = food’ and a pioneer step towards thereuse of industrial material» [3].
This study sets out to answer the following questions:
Year 33 N131 Third quarter 2013

Until now no due account hasbeen taken of the energy
expenditure and, ipso facto, theemissions deriving from the ELV
treatment itself
How much does recycling an end‐of‐life vehicle cost in energy expenditure?
How much does ELV recycling save in CO2 emissions?
Until now no due account has been taken of the energy expenditure and, ipso facto, the emissions deriving from ELVtreatment. It stands to reason that a correct environmental treatment of ELVs is necessary but no CF calculation has yetbeen made. The crux of the matter is this: to find out the gross saving in CO2 emissions deriving from ELV recycling, weneed to ascertain also the emissions generated by the recycling treatment itself as well as by the manufacture of thevarious ELV component parts. Of the whole ELV treatment chain only the first step has been analysed to date, i.e., the ATFwith the established limits and scopes.
Objectives and Methodology
The objectives of this study are the following:
Determine the saving in raw materials and landfill area deriving from the recycling activity.
Establish the carbon footprint of the recycling activity.
Establish the manufacture/recycling energy balance.
Draw up the methodologies corresponding to the above goals.
The following method was used: firstly a study was made of the general ELV recycling process together with fieldworkvisits to various ATFs. These visits were used for culling information. Contact was also made with another ATF from whichfurther information was obtained. A thoroughgoing trawl of past studies and research was made; the results of thisliterature review were then compared with the data obtained from manufacturers and ATFs. After analysing all thisinformation a choice was then made of the CF‐calculation method, defining comparison parameters. Finally the dueconclusions were drawn and compared with those of other studies.
Different ATF types analysedFour ATFs with very different characteristics and business methods have collaborated in this study, as we will see below.The photos also illustrate their diversity.
The first is CesviRecambios. This is a newly built ATF with a high degree of automation in the management of parts andcomponents. It also has its own characteristic inhouse recycling scheme.
ATF 1 is one of the typical cases arising from the passing of RD 1383/2002, i.e., an old scrapyard converted into an ATF. Ithas the idiosyncrasy of not being connected up to the power grid. It gets its power from photovoltaic panels together witha small wind power generator and battery accumulators. To cover peak demand it also has a diesel power generator.
ATF 2, also newly built, does not deal only with ELVs but also various types ofwaste such as paper, plastic batteries, scrap metal, etc. This ATF also has abaler.
The first three ATFs are in Ávila, while ATF 3 is in Galicia. Really it is two ATFsin one, an old one adapted to the RD and a newly designed and built one.
The most important general comments to be made on the AFFs visited andstudied are the following:
Each ATF has its own parts management strategy. The usual practice is to store depolluted ELVs for the selling off ofsmall parts or larger sets. This is basically a «no skin off my nose» approach.
The level of reuse is closely tied in with the age, state and type of ELV. It stands to reason that the amount ofreusable parts is different for a 5‐year old and 10‐year old car. Another salient factor is the reason why the car inquestion became an ELV, whether due to an accident, age, mechanical fault, etc. Recycling a 4x4 or an upmarketvehicle is also a very different proposition from a utility vehicle.
The demand for reused pieces governs the management of depolluted ELVs; together with the other abovementionedfactors it also determines when the ELV is sent for shredding.

Saving of material
The following paragraphs give a nutshell account of the conclusions drawn from the literature review:
The recycling percentage of any ELV will depend on the process applied.
Component remanufacturing is a very good practice from the reuse point of view, saving a large amount of materialand avoiding a significant amount of emissions.The study thereof goes beyond the remit of this article.
Glass tends to end up in the landfill site since it is seldom dismantled from the bodywork. Only sellable items arerecovered for reuse, such as doors
The very market dynamic assures 75% recycling in weight of the ELV.
The percentage recycling rate taken for Spain will be 83.1%, taking into account both reuse and recycling, and 85.6%if energy recovery is also factored into the equation [4].
No trustworthy ELV recycling figures have been found for Spain. Press declarations by managers of the sectorassociations claim that 100% of vehicles removed from the road are recycled. According to EU data this is close to thetruth in Germany and Holland, while data from the Canadian market suggest that this country clocks up a rate of 94%.
Figure 1 shows the weight percentages of the various materials making up a typical vehicle. These figures have beenobtained by the authors from the literature review, broken down in greater detail in the full study, without taking fuelinto account and based on a typical ELV weight of 946 kilograms; figures have been taken above all from the EuropeanMarket.
Figure 1. Materials of a typical vehicle. Source: Drawn up by the authors.
Information from collaborating ATFsTable 1 has been drawn up from the annual waste declarations that collaborating ATFs had to submit to regional authorities

The energy saving from recyclingthe 671,927 end‐of‐life vehiclestaken off the road in Spain is
in 2010 and 2011.
Table 1. Reuse information from collaborating ATFs. Source: Drawn up by the authors.
ATF Vehiclesprocessed
Total weight(kg)
Materialreused (kg)
Fuel (kg) Rest(kg)
% reuse Kg materialreused / ELV
ATF 1 453 516.559 93.110 1.600 421.849 18,03 205,54
ATF 2 540 591.494 30.360 700 560.434 5,13 56,22
ATF 31 1.054 1.040676 89.006 1.600 950.070 8,55 84,45
ATF 32 1.269 1.218.240 56.129 2.500 1.159611 4,61 44,23
Total 3.316 3.366.969 268.605 6.400 3.091.964 7,98 81,00
The above figures show that the reuse rate is very low (ranging from 4.61 to 18.03% with a mean of 7.98%), producing areuse by weight of between 44.23 and 205.54 kg per ELV, with a mean weight of 81 kg per ELV.
Furthermore, these figures should be taken with some caution. In two visits to ATFs whose figures were used herein, thecommercial practice carried out did not seem at all conducive to an accurate estimation of the weight of components soldfor reuse. Engines and gearboxes, for example, are sold but not ferrous or nonferrous material.
Another factor to bear in mind here is that the vehicle weight is taken from the official full‐tank weight recorded on itstechnical inspection (Spanish MOT) card; in general the tank is not in fact full, so there is a built‐in error from the start.
Elimination of the initial fuel weight inflates the percentage of material reused or recycled. Nonetheless, the initial datawill be maintained for the sake of consistency with official figures and also the difficulty of ascertaining fuel tankcapacities of each and every vehicle recycled in the various ATFs.
It nonetheless turns out that some regional authorities (comunidad autónoma) rely on approximations for calculating thepercentage of material reused, in default of any trustworthy information in the annual waste declarations [5].
Information on CesviRecambiosThe recycling model of CesviRecambios differs from that of the other ATFs, which we might call conventional. CESVIMAP’srecycling facility, in theory, receives only road‐accident vehicles with a maximum age of four years, although this latterstipulation is not always observed at the current time.
Tables 2 and 3 show the CesviRecambios figures. Note that the reuse percentage is clearly higher than that of the otherATFs.
Table 2. CesviRecambios reuse information. Source: CESVIMAP.
CAT 2003 2004 2005 2006 2007 2008 2009 2010 2011
No. of vehicles dismantled 1.757 1.995 2.526 2.834 2.899 2.319 2.491 2.460
No. of certificates issued 1.275 2.169 2.494 2.788 2.921 2.293 2.517 2.518
Mean weight per vehicle 900 1.224 1.238 1.239,5 1.252 1.280 1.256 1.304 1.316
Parts recovery by weight 45% 43% 50% 51% 48% 43% 39% 61% 44%
Table 3. CESVIMAP 2011 Information. Source: CESVIMAP.
ATF Vehiclesprocessed
Total weight(kg)
Materialreused (kg)
Fuel (kg) Rest(kg) % reuse Kg materialreused / ELV
Cesvi 2.460 3.237.360 1.424.440 41.735 1.834.800 44 579
Ninety Seat Ibiza 2002 vehicles were individually monitored to find out in detailthe sets of parts set aside for reuse; in four of the vehicles the componentsdismantled for reuse were weighed. This particular make was chosen for this

tantamount to the yearlyconsumption of 51,844
households
If we compare the percentage ofmaterial recovered for reuse byCesviRecambios and by the other
check because it was the vehicle most commonly dealt with in ATFs in 2010 and2011.
We can now make a comparison between the general data and the informationgleaned from the 90 monitored vehicles. The mean vehicle weight will be taken to be 1080 kg (as the average weight ofthe four vehicles studied). An analysis of these four vehicles throws up the results shown in Table 4.
Table 4. Figures of the monitored Seat Ibizas. Source: CESVIMAP.
Vehicle Weight kg Direct sale by CESVIMAP kg ( C ) % weight
V1 1.080 415,36 38,46
V2 1.100 334,19 30,38
V3 1.080 212,76 19,7
V4 1.060 46,8 4,42
Total 4.320 1.009,08 23,36
The results of the 90 individually monitored vehicles (mean weight 1080 Kg) are shown in Table 5.
Table 5. Seat Ibiza 2011 data. Source: CESVIMAP.
No. ofvehicles
Total Weight (kg) Direct sale byCESVIMAP kg ( C )
% weight Sent torecoverers kg
(R)
%weight
Rest towaste
managers
%weight
90 97.200 18.467.771 19,01 7.484,15 7,7 71.239.079 73,29
In Table 2 the percentage of «parts recovery by weight» (C+R) ranges from 39 to 61%, with vehicles of medium weight from1224 to 1304 kilograms, growing steadily over the years.
As already pointed out, the recycling weights are higher for upmarket than downmarket vehicles, so these findings areconsistent.
That said, to ascertain the true recovery percentage, an analysis would have to be made of the whole supply chain fromCESVIMAP to the various agents involved in the process.
These materials can be broken down into four main groups, as with any other ATF, namely:
Direct sale (C). Those materials sold by CESVIMAP directly to the customer for vehicle assembly.
Material for recoverers (R). Material sent to recovery companies. This material, after the corresponding checks andrecovery operations, is then marketed for reuse.
Material recycling through the whole chain of balers, shredders, media separation plants, energy recovery and landfillsite, taking into account the special circumstances for batteries and tyres.
Sundry waste resulting from the various intermediate operations carried out in the abovementioned processes.
If we compare the percentage of material recovered for reuse by CesviRecambios and by the other ATFs studied herein,we find that CesviRecambios’s figures between 2004 and 2010 (Table 2) did not fall below 39%, the figures for theindividually monitored Ibiza 2002 vehicles were 23.26%, while the mean figure for the other four ATFs was 7.98%.
It is clear that Cesvi‐Recambios’s model is the most efficient from the reuse point of view, probably due to the ability tochoose the vehicles worked on and a better commercial management.
Information from the literature reviewNo trustworthy material‐recovery figures can be drawn from the informationobtained from the various ATFs, for two main reasons. Firstly, the inbuilt errordue to inclusion of the fuel weight in the official vehicle weights. This errorcan be set at about 3.5% on the basis of a preliminary calculation taking into

ATFs studied herein, we findthat CesviRecambios’s figuresbetween 2004 and 2010 did notfall below 39%, the figures for
the monitored Ibiza 2002vehicles were 23.26%, while themean figure for the other four
ATFs was 7.98%
account the various types of cars and 4x4s (according to the manufacturer’sfigures for the vehicle of reference, the fuel weight accounts for 3.43%).Secondly, there is no available information for breaking down the variouscomponents dealt with into materials. This means that the information, even atthe level of the aforementioned annual waste reports to be sent up to regionalauthorities, is not minimally dependable.
What can be deduced from the information obtained is that the ATF modelaffects the percentage of reused components.
Table 6 shows the savings obtained for the various materials due to recycling, energy saving and emissions. These findingshave been taken from the report cited herein as [6]. The blank fields mean there is no information in the source used.
Tabla 6. Ahorro de materiales. Fuente: Elaboración propia a partir de datos de [6].
Material Weight of secondary rawmaterial x 100,000 ELV
(tonnes)
Ore saving (tonnes) Energy saving TJ /100,000 ELV
CO2 emissionreduction tonnes /
100,000 ELVs
Saving ofspace in
landfill site(m3)
Steel 69.939,556 76.933,21 of iron ore44.061,92 of coal
3.846,68 of limestone
160,86 67.841,37 1.608.861
Aluminium 2.554,2 20.433,6 of bauxite 113,92 8.939,70 19.412
Copper 922,35 12,54 747,10
Lead 595,98 5,88 959,53
Prima facie, these figures might seem rather unenlightening. They do not tell us how much energy is saved or establish acomparison with any known consumption. A few tweaks, however, can in fact give us a good idea of the saving that,according to these figures, would derive from recycling the 671,927 ELVs taken off the road in Spain in 2011. If for every100,000 ELVs there is a saving – only in steel, aluminium, copper and lead – of 293.2 TJ, this is tantamount to the yearlyconsumption of 51,844 households. The figure for annual household consumption (10,521 kWh = 0.038TJ) has been takenfrom [7].
Likewise, the recycling of cars in Spain in 2011 has saved landfill space equivalent to 11 football stadiums the size of RealMadrid’s Santiago Bernabeu. Several sources consulted equate 1Hm3 with 1 Santiago Bernabéu Stadium.
Carbon Footprint
The carbon footprint (CF) is the chosen method for assessing the environmental impact of vehicle recycling. What exactlyis the CF and what does it allow us to do? It is an indicator for measuring the environmental impact due to greenhousegases (GHGs) emitted by any product during its manufacture, use, at the end of its useful life or throughout its wholelifecycle or by any activity or event, etc. It should be noted here that the CF is not the only environmental impactindicator but it is the one bearing the strictest relation to global warming and climate change. The unit usually employedis metric tons of CO2 equivalent.
Calculation and analysis of the CF will allow us to do all the following:
Identify and measure the GHG emission sources.
Propose GHG‐reduction or ‐mitigation measures on the basis of the above.
Convert any energy expenditure into a single unit, whether this be kWh, litres of fuel, m3 of natural gas, etc.
Compare scope‐sharing products and/or services from an environmental point of view.
The calculation was based on the ISO/DIS 14067 standard [8], in draft form at the time of writing. The standard ISO/TS14067:2013 was published in May 2013. This tackles CF calculation via the product or service lifecycle concept. In our study
the service lifecycle will be the vehicle recycling activity.
In view of the impossibility of obtaining total ELV‐recycling CF figures, a partial ELV‐recycling CF was calculated solelyfrom one ATF. This approach fits in perfectly with ISO 14067. In the future, moreover, the data of all the other agentsinvolved in the ELV treatment chain, downstream from the ATF, can be phased in as they become available. In otherwords, each waste management firm will have its own CF together with all the other agents like parts remanufacturingfirms, shredders, media separation plants, etc. Neither should we lose sight of the fact that the necessary transportarrangements for the waste, ELV and parts, etc, also make a direct contribution to this activity’s CO2 emissions.
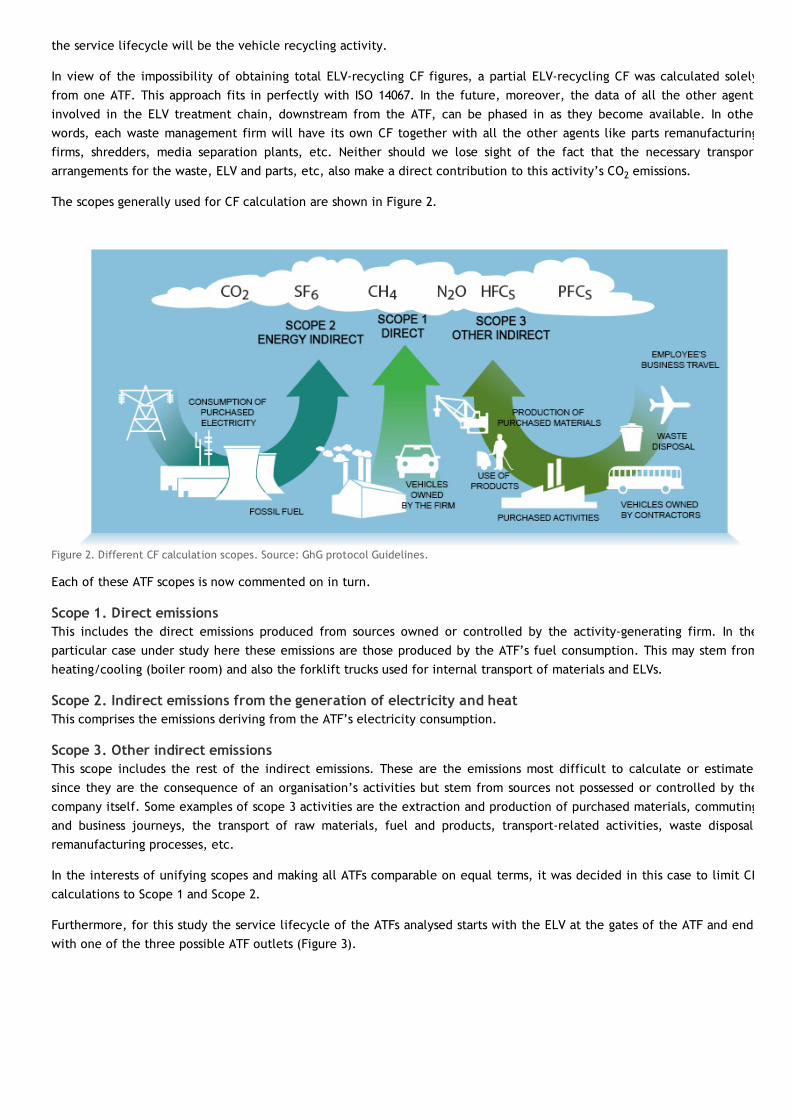
The scopes generally used for CF calculation are shown in Figure 2.
Figure 2. Different CF calculation scopes. Source: GhG protocol Guidelines.
Each of these ATF scopes is now commented on in turn.
Scope 1. Direct emissionsThis includes the direct emissions produced from sources owned or controlled by the activity‐generating firm. In theparticular case under study here these emissions are those produced by the ATF’s fuel consumption. This may stem fromheating/cooling (boiler room) and also the forklift trucks used for internal transport of materials and ELVs.
Scope 2. Indirect emissions from the generation of electricity and heatThis comprises the emissions deriving from the ATF’s electricity consumption.
Scope 3. Other indirect emissionsThis scope includes the rest of the indirect emissions. These are the emissions most difficult to calculate or estimate,since they are the consequence of an organisation’s activities but stem from sources not possessed or controlled by thecompany itself. Some examples of scope 3 activities are the extraction and production of purchased materials, commutingand business journeys, the transport of raw materials, fuel and products, transport‐related activities, waste disposal,remanufacturing processes, etc.
In the interests of unifying scopes and making all ATFs comparable on equal terms, it was decided in this case to limit CFcalculations to Scope 1 and Scope 2.
Furthermore, for this study the service lifecycle of the ATFs analysed starts with the ELV at the gates of the ATF and endswith one of the three possible ATF outlets (Figure 3).

Figure 3. Scope included in the ATF’s CF calculation. Source: Drawn up by the authors.
Waste removed by authorised handlers, including also the management of non‐hazardous waste such as scrap metal,plastic, etc.
Sale of reused parts to customers. A priori it is assumed that everything stored is destined for reuse.
Sale of parts to remanufacturing firms.
The starting basis for calculating an ATF’s CF was the annual fuel‐consumption figures (gasoil, natural gas) furnished by thecollaborating ATFs, working from the base year of 2011 for all of them.

An essential step here was to establish the emissions deriving from the ATF’s own activity, hiving off any otherconsumption not attributable thereto. It was therefore necessary to discount from the ATF’s annual energy consumptionfigures any consumption not in fact attributable to its own activity and therefore falling outside the established scope. Forexample, it was necessary to discount the electricity consumption of ATF 2’s baler, the energy consumption of the callcentre sharing the site with Cesvirecambios, etc.
Once the consumption figures had been whittled down to that directly attributable to the ATF’s activity, conversionfactors were then used to turn these figures into metric tons of CO2 equivalent. The scope 1 emission factors were takenfrom [9] based on Annex 8 of the report Inventarios de GEI 1998‐2008 (2010) and are shown below:
Gasoil A: 2,61 kg CO2/l
Gasoil C: 2,79 kg CO2/l
Natural gas: 2,15 kg CO2/Nm3
Scope 2 calculations were based on the data furnished by the power supply firms themselves.
Table 7 has been drawn up on the basis of the ELVs governed by RD 1383/2002. In all cases, moreover, all parts sent forremanufacturing are considered to be reused parts and the CF of this process is not attributable to the ATF.
Table 7. ATF environmental efficiency indices. Source: Drawn up by the authors.
EMISSIONS VEHICLES TREATED ENVIRONMENTAL EFFICIENCY INDICES
Scope 1 (tons CO2 eq) Scope2
(tonsCO2
eq)
Total(tonsCO2
eq)
NºELVs
Tonstreated
Tonsreused
%reused
CF/ELV(kgCO2
/ELV)
CF/treused
CESVI 108,982 35,459 144,441 2.460 3.237,36 1.424,44 44,00 58,72 0,1014
ATF 1 12,661 0,000 12,661 453 516,56 93,11 18,03 27,95 0,1360
ATF 2 3,654 7,885 11,5393 540 591,49 30,36 5,13 21,37 0,3801
ATF 3 12,779 7,552 20,331 2.323 2.258,92 145,14 6,42 8,75 0,1401
This table, broken down into three main sections, gives a good snapshot of the ATFs analysed, allowing a rapid comparisonof the environmental performance of facilities of very different type, characteristics and working systems.
The input data are:
Emissions. This gives the calculated emissions for each ATF, broken down into scopes 1 and 2, plus the sum of both.
Vehicles treated. This is data previously calculated in tables 1 and 3. It should be remembered here that the primarydata come from the annual waste declaration reports of each ATF.
The output, on the other hand is the proposed environmental efficiency indices. A brief comment is now made on eachone:
Percentage reuse. This is calculated as the quotient of tons reused and tons treated. It gives a first environmentalgauge of the ATF and reflects the number of parts that have been reused. Remember here that every part reusedavoids the emissions that would otherwise have been generated by its manufacture as well as reducing the emissionsof the recycling process that now does not need to continue.
Carbon footprint for each ELV treated (kg CO2/ELV). This is obtained by dividing total emissions by the number ofELVs treated. There is a huge difference between the highest and lowest. The trouble with this index is that it doesnot factor in reuse. This means that a higher energy‐consuming and therefore emission‐generating ATF might eitherbe one that is less efficient in dealing with each ELV (depollution, disposal and part management) or one that needsto consume more energy to reuse more parts.

CF is an indicator for measuringthe environmental impact due to
greenhouse gases (GHGs)emitted by any product during
its manufacture, use, at the endof its useful life or throughoutits whole lifecycle or by anyactivity or event, etc. In thisstudy it is used to quantify anATF’s environmental impact
Carbon footprint tons divided by tons reused. This index takes into account both emissions and the number of partsreused. It is therefore deemed to be the best gauge of an ATF’s environmental efficiency, which will be greater thenearer this index comes to zero. Cesvirecambios records the most favourable index because, even though it records ahigher CF/ELV than the rest, it also boasts the highest reuse percentage.
Discussion of results and comparison with other studies
Figure 4 shows in graph form the CO2 emissions throughout the whole lifecycleof a vehicle according to the literature review [10]. The calculation of emissionsin use phase was again based on a Seat Ibiza 2002 with a useful life of 150,000kilometres.
The phase generating most emissions is clearly vehicle use. As this pie chartshows, the emissions of the other phases, in decreasing order, are the obtainingof raw materials, manufacture, maintenance (due to the need of changing oil,tyres, spare parts, etc) and lastly, the phase dealt with herein: ELV disposal. The34 kilograms of CO2 accounted for by this phase may seem negligible incomparison to the rest.
In the authors’ opinion the figures of this particular study [10] are not veryaccurate for the disposal phase. Only the energy consumption of the shredder has been taken into consideration, asobtained from the GaBi 4 database on a straight‐line basis. In this present study an ATF’s CF has been calculated in termsof scopes 1 and 2 only, ranging from 8 to 58 kilograms of CO2, without taking material transport into account.
Another study that is enlightening for comparison purposes is the one carried out by [11]. This has served for drawing upthe graph shown in Figure 5, which also taps into one of the advantages of using CF as a calculation tool, which isprecisely the ability to compare services reduced to the common denominator of kg CO2/ELV.

There is no known study that hashitherto worked with real ATFenergy‐consumption data, in
order to be able to calculate theemissions attributable to theATF activity itself. Likewise,
most of the literature revieweddoes not take into account ATF
energy consumption
Figure 4. Emissions (kg CO2) in an automobile’s lifecycle. Source: Drawn up by the authors on the basis of the figures given in [10].
Figure 5. Emissions (kg CO2) in the automobile recycling phase. Source: Drawn up by the authors from the figures of [11].
The following conclusions can be drawn from the abovementioned comparisons:
The scopes of both studies are different and the results therefore have to be taken with some caution. Nonetheless,the two documents can be compared, bearing in mind what each has included within its scope.
ATF emissions in [10] are considered to be negligible while [11] puts them at 0.26 kilograms of CO2 for the USA.Figures for Germany are not available.
“Separation” as used in [11] refers to separation of the nonferrous fraction or, more strictly, the nonmagneticfraction. If we lump together shredding and separation in [11] to bring it into line with the typical shredding plant,then the emissions of both studies do turn out to be roughly equivalent. 34 [10]; 21.87‐USA, 16.21‐Germany [11] (unitskg CO2/ELV).
A factor considered by one study to be negligible, i.e. transport, is considered by the other to be the biggestcontributor to emissions in the vehicle recycling stage.
In view of these results, there is no known study that has hitherto worked withreal ATF energy‐consumption data, in order to be able to calculate theemissions attributable to the ATF activity itself. Likewise, most of the literaturereviewed does not take into account ATF energy consumption.
Optimisation of transport between the various agents is another factor to betaken into account. The USA’s transport‐related emissions almost doubleGermany’s; as pointed out in the literature itself, this is largely due to the factthat the distances travelled are less in Germany than in the USA.
Conclusions
The conclusions and results are dealt with in terms of the previously defined study objectives, tagging on generalconclusions drawn throughout the study.

Objective 1. Ascertain the recycling activity’s carbon footprintCF is a good indicator of GHG emissions but needs to be rounded out for comparing businesses of different scope.ATFs of many different characteristics have been visited so the comparison could not possibly be made in terms of thecarbon footprint alone.
The CF of one of the ATFs is much bigger than the rest; this indicates a higher level of GHG emissions. A facility visit,however, shows that this is largely due to the fact that this plant includes a disassembly line in a closed building withconcomitant heating and automated stores.
The indicator CF/t Reuse, which divides CO2 emissions in tons by tons of material reused, enables us to compare ATFsof very different types, bearing in mind both the GHG emissions and the amount of material reused.
Table 7 shows that the emission readings are very diverse; the same goes for tons reused. Hence the need for acomparison‐enabling ratio.
There are many studies of materials, ASR, recycling percentage, etc., but very few of concomitant energyconsumption; none of these, moreover, has worked with real energy‐consumption data. Both the CF and automobile‐lifecycle studies usually overlook the disposal and recycling phase. This would seem to indicate a certain lack ofinterest by researchers in the recycling aspect.
Objective 2. Determine the saving in raw materials and landfill area deriving from the recycling activityThe percentage reuse in weight, in terms of components directly sold by ATFs for reuse, varied from 4.61% to 61% in2010 and 2011, depending on the type of ATF and its modus operandi.
The information gleaned from the waste declarations is not totally reliable, especially in terms of weightcalculations.
The savings in raw materials and landfill area are shown in Table 6.
Component reuse is by way of direct sale from the ATF or by sending them for remanufacturing.
Objective 3. Draw up the methodologies corresponding to the above goalsUse of the standard ISO 14067 is considered to be satisfactory.
Comparing the CFs of businesses with different scopes calls for the use of ratios.
The accuracy and reliability of the results depends on the quality of the information used. The use of official andgenerally‐accepted information does not necessarily guarantee the validity of the process.
The literature review reveals the current state of the procedure from a technical and scientific point of view.
The literature review enables theoretical and actual results to be compared.
The fieldwork is necessary not only to obtain real information but also to find out the habitual practice in the sector.
Vehicle manufacturers’ information is vital for a correct analysis of this matter. The ideal situation would be availableinformation on vehicle manufacture’s CF.
Conclusions of a general typeThe literature review seems to show lack of interest in and awareness of vehicle recycling by society in general andby manufacturers in particular.
Although remanufacturing, consisting in the repair of used components for resale, is a habitual practice in theautomobile sector, in our opinion it has yet to be developed to its full potential.
ACKNOWLEDGEMENTS
This study has been carried out on a grant awarded by FUNDACIÓN MAPFRE. Our thanks also go to Cesvirecambios and theother three collaborating ATFs for their contribution to this study.
BY WAY OF A GLOSSARY
ELV: End‐of‐life vehicle.
GHG: Greenhouse gases.
ATF: Authorised treatment facility.

CF: Carbon footprint.
TO FIND OUT MORE
1. Real Decreto 1383/2002, de 20 de diciembre, sobre gestion de vehiculos al final de su vida util. BOE núm 3.
2. L. Pelayo. «El tratamiento de vehículos fuera de uso en España y su evolución». Seguridad y Medio Ambiente, nº 123,pp. 36‐49, 2011.
3. M. Braungart y W. McDonough. Cradle to cradle (De la cuna a la cuna). Rediseñando la forma en que hacemos lascosas, Madrid: Mc GrawHill, 2005, p. 152.
4. SIGRAUTO. «Informe‐resumen de la prueba de seguimiento de niveles de recuperacion de vehículos al final de su vidaútil», 2011.
5. Generalitat Valenciana. Plan integral de residuos 2010, Conselleria de Medio Ambiente, Agua, Urbanismo y Vivienda,2010.
6. S. Grimes, J. Donaldson y G. Cebrián Gómez. Report on the environmental benefits of recycling, BIR, 2008.
7. IDAE Secretaria General Departamento de Planificación y Estudios. «Proyecto SECH‐SPAHOUSEC. Análisis del consumoenergético del sector residencial en España», 16 de julio de 2011.
8. ISO/DIS 14067. Carbon footprint of products ‐ Requeriments and guideliness for quantification and communication,2012.
9. Oficina Catalana de Cambio Climático. «Guía práctica para el cálculo de emisiones de gases de efecto invernadero(GEI)», www20.gencat.cat/docs/canviclimatic/Home/Politiques/Politiques catalanes/La mitigacio del canviclimatic/Guia de calcul demissions de CO2/120301_Guia practica calcul emissions_rev_ES.pdf, 2012.
10. J. M. López Martínez, J. Sánchez Alejo y A. Mora Sotomayor. «Consumo de energía y emisiones asociadas a laconstrucción y mantenimiento de vehículos». Madrid, 2008.
11. J. Staudinger y G. A. Keoleian. «Management on End‐of Life (ELVs) in the US», Center for Sustainable Systems,University of Michigan. March 2001.
12. J. C. M. O. a. K. R. B. S. Jeongsoo Yu. «Emerging issues on urban mining in automobile recycling: outlook on resourcerecycling in East Asia». Integrated Waste Management ‐ Volumen II. 2011.
Related Documents