Chapter 20.3: Global Warming Reminder: Carbon Footprint Calculation due on Tues. 17th http://www.nature.org/ initiatives/climatechange/ calculator/?src=l12 Bring results of your calculation

Welcome message from author
This document is posted to help you gain knowledge. Please leave a comment to let me know what you think about it! Share it to your friends and learn new things together.
Transcript

Chapter 20.3:Global Warming
Reminder: Carbon Footprint Calculation due on Tues. 17th
http://www.nature.org/initiatives/climatechange/calculator/?src=l12
Bring results of your calculation to class

Natural and Anthropogenic Factors in Climate
Variations in: Insolation intensity Land surface changes
Earth’s orbit
Atmospheric and aerosol composition

Natural Cycles in Global Temperatures:
Variations in the earth’s orbit Milankovitch theory: explanation of how
natural changes in the earth’s climate can be explained by changes in the Earth’s orbit around the Sun.
1. Eccentricity
2. Precession
3. Obliquity

EccentricityChanges in the shape of the earth’s orbit. Change from circular to elliptical and back takes ~100,000 years.

Precession of the earth’s axis of rotation: “wobble”
In 11,000 years
Today, earth is closest to sun ‘in July
Always about ~23.5 degree tilt
Closest in JulyJanuary
JulyJanuary
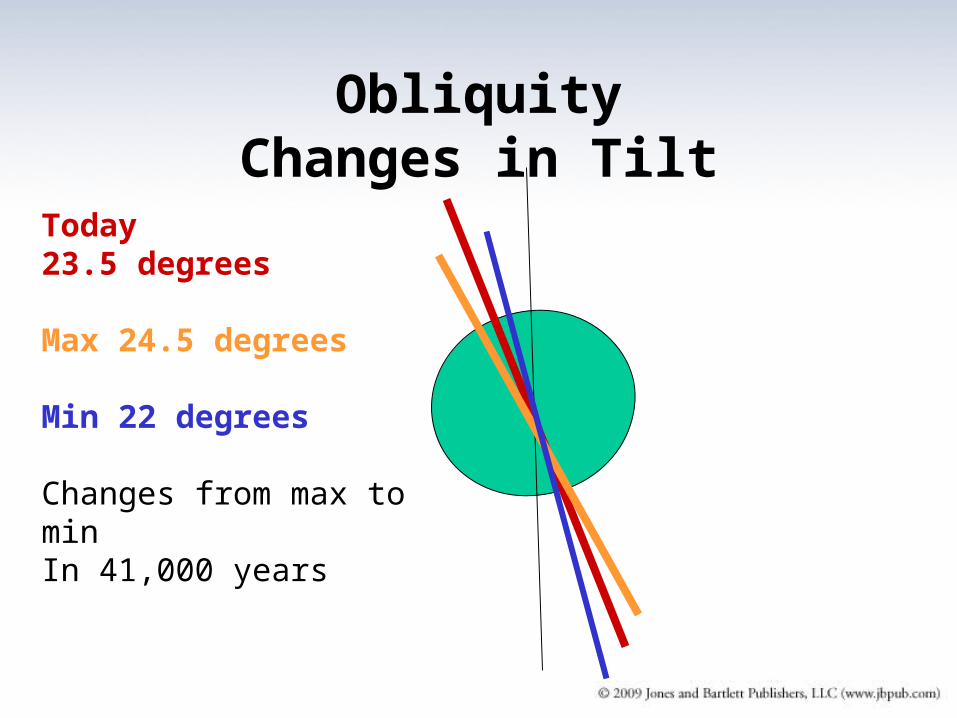
ObliquityChanges in Tilt
Today 23.5 degrees
Max 24.5 degrees
Min 22 degrees
Changes from max to min In 41,000 years
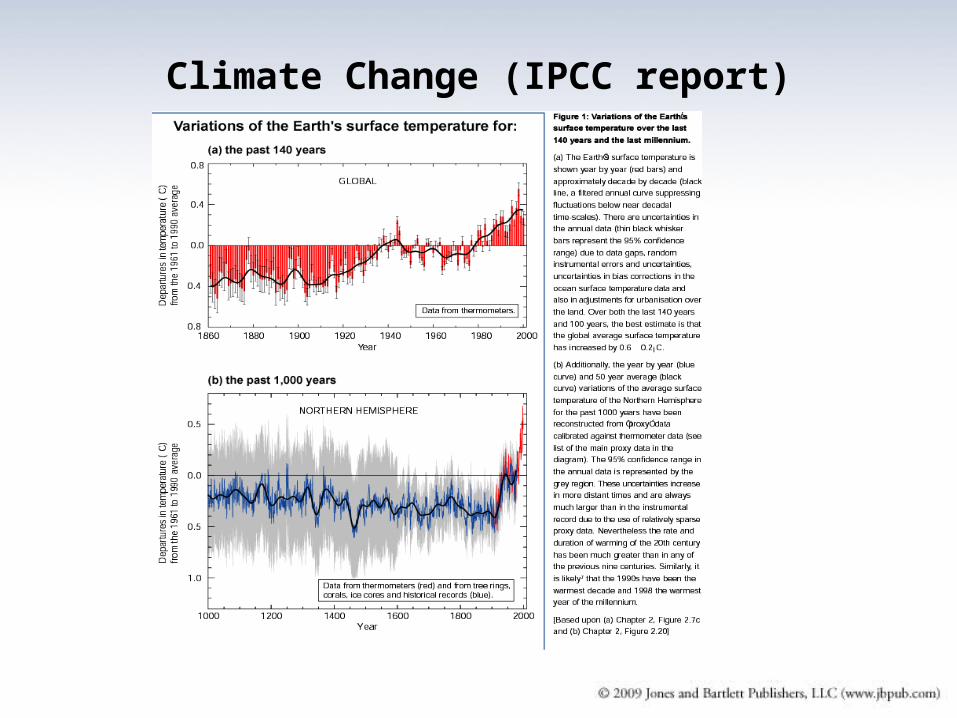
Climate Change (IPCC report)

FIGURE 17a: Global energy balance: The influx of solar radiation and its fate
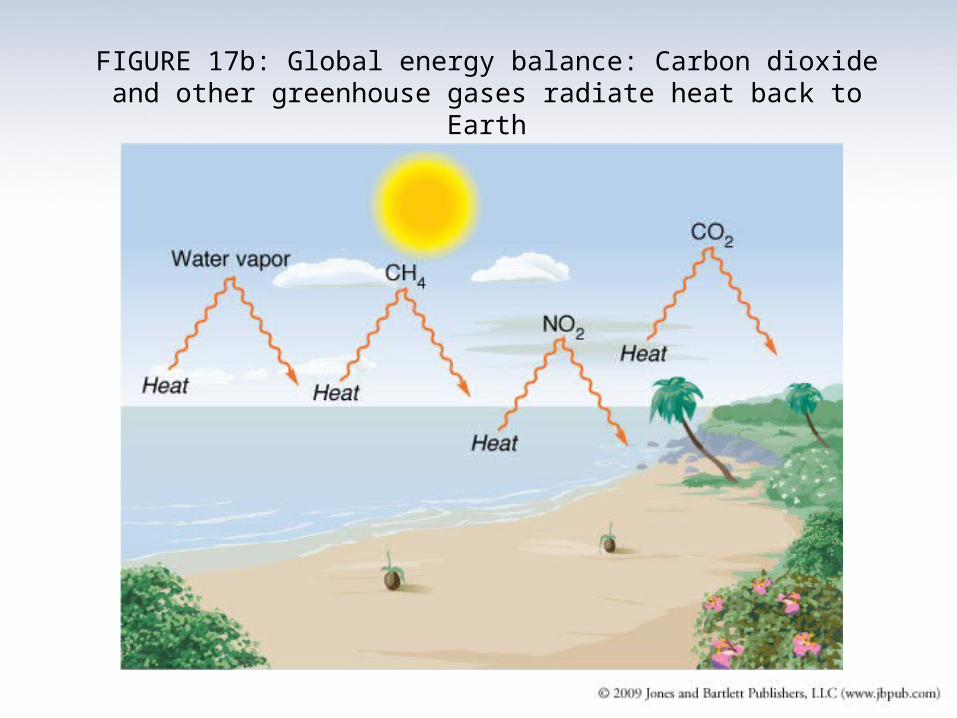
FIGURE 17b: Global energy balance: Carbon dioxide and other greenhouse gases radiate heat back to Earth

FIGURE T02: Major Greenhouse Gases and Their Characteristics
Source: Data from World Watch Institute, U.S. EPA, and Journal of Geophysical Research.

FIGURE 18: Natural Cycles
Reproduced with kind permission from Springer Science+Business Media: Clim. Change, A slippery slope: How much global warming constitutes "dangerous anthropogenic interference?" vol. 68, 2005, pp. 269-279, J. E. Hansen.
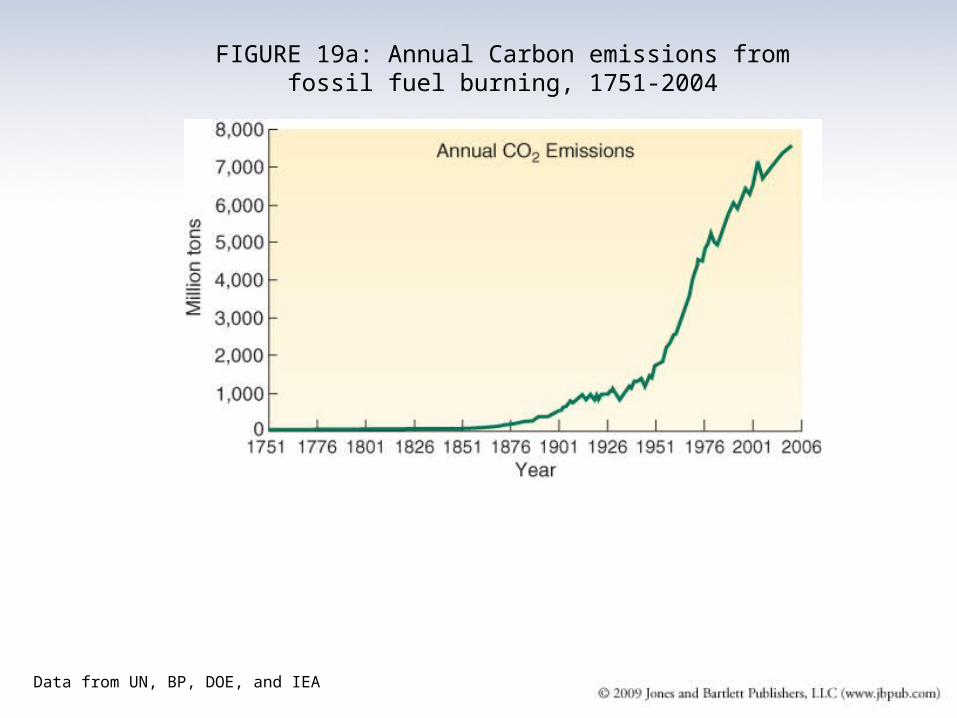
FIGURE 19a: Annual Carbon emissions from fossil fuel burning, 1751-2004
Data from UN, BP, DOE, and IEA

FIGURE 20: Comparing the average sea surface temperature during 1951-1980 to the average temperature during 2001-2005
Courtesy of GISS/NASA

FIGURE 21: Loss of arctic sea ice
Courtesy of Josefino Comiso and NASA/Goddard Space Flight Center Scientific Visualization Studio

FIGURE 22: The number of tornadoes each year is on the rise
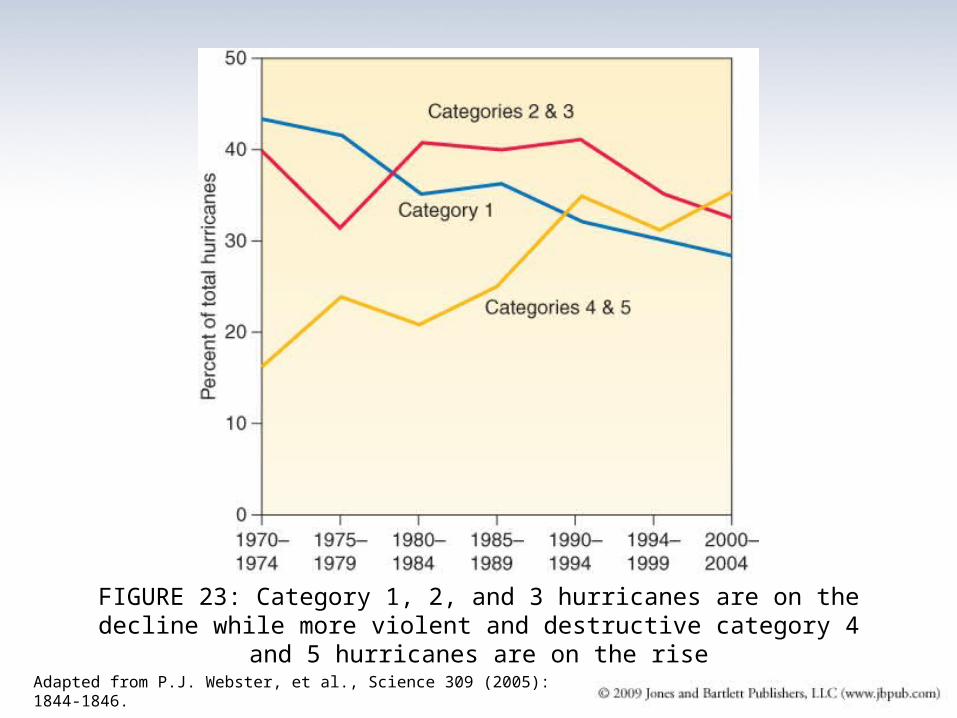
FIGURE 23: Category 1, 2, and 3 hurricanes are on the decline while more violent and destructive category 4 and 5 hurricanes
are on the riseAdapted from P.J. Webster, et al., Science 309 (2005): 1844-1846.


FIGURE 26: This tiny Island in Tuvalu is losing ground to rising sea levels caused by global warming
© Ashley Cooper/Alamy Images
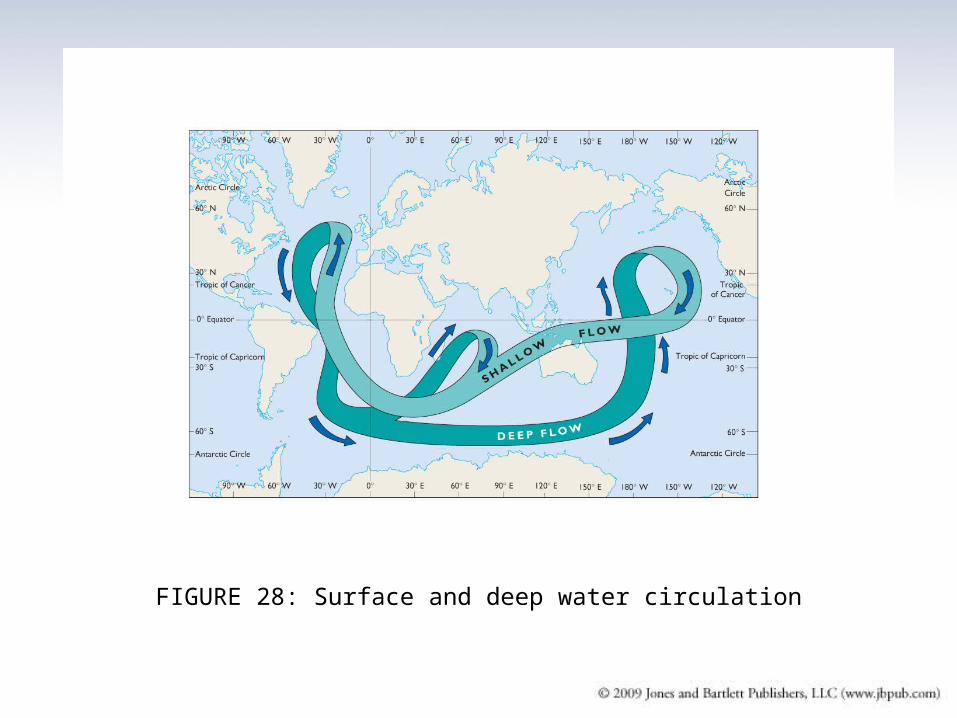
FIGURE 28: Surface and deep water circulation

FIGURE 29: Computer projections of sea ice (blue) and actual measurements (red), indicating that the computer models
underestimate melting© 2008 University Corporation for Atmospheric Research, illustration by Steve Deyo.

FIGURE 30: Dangerous feedback
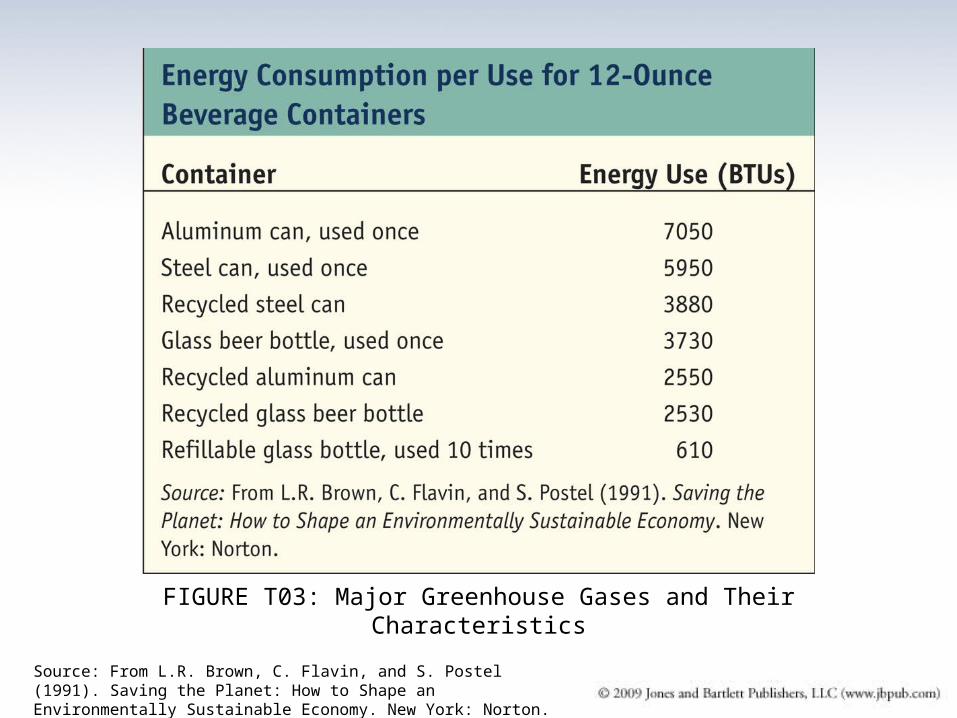
FIGURE T03: Major Greenhouse Gases and Their Characteristics
Source: From L.R. Brown, C. Flavin, and S. Postel (1991). Saving the Planet: How to Shape an Environmentally Sustainable Economy. New York: Norton.

It is virtually certain that the climate is warming, and that it has warmed by about 0.7 deg. C over the last 100 years.
It is very likely that humans are responsible for most of the recent warming.
If we do nothing to reduce our emissions of greenhouse gases, future warming will likely be at least two degrees Celsius over the next century.
Such a climate change brings with it a risk of serious adverse impacts on our environment and society.
Texas A&M Climate Change Statement
Redesigning human systems according to sound principles of sustainability could help alleviate the problem of global warming.
Recycling and energy efficiency greatly reduce energy demand and cut greenhouse gas emissions.
Renewable energy technologies can provide us with much-needed power, with little or no impact on global climate.
Population stabilization can help reduce our demand for fossil fuels and other greenhouse-enhancing activities such as deforestation.
Restoring forests, especially in the tropics, could have a profound effect on global carbon dioxide levels.
Solving the Problem Sustainably
Related Documents