SciVerse Scopus Venezia’s conference 20 th September, 2010 Edoardo Ramos Account Development Manager, South Europe Massimiliano Carloni Key Account Manager, Italy

Welcome message from author
This document is posted to help you gain knowledge. Please leave a comment to let me know what you think about it! Share it to your friends and learn new things together.
Transcript

SciVerse ScopusVenezia’s conference20th September, 2010
Edoardo RamosAccount Development Manager, South Europe
Massimiliano CarloniKey Account Manager, Italy

Contatti

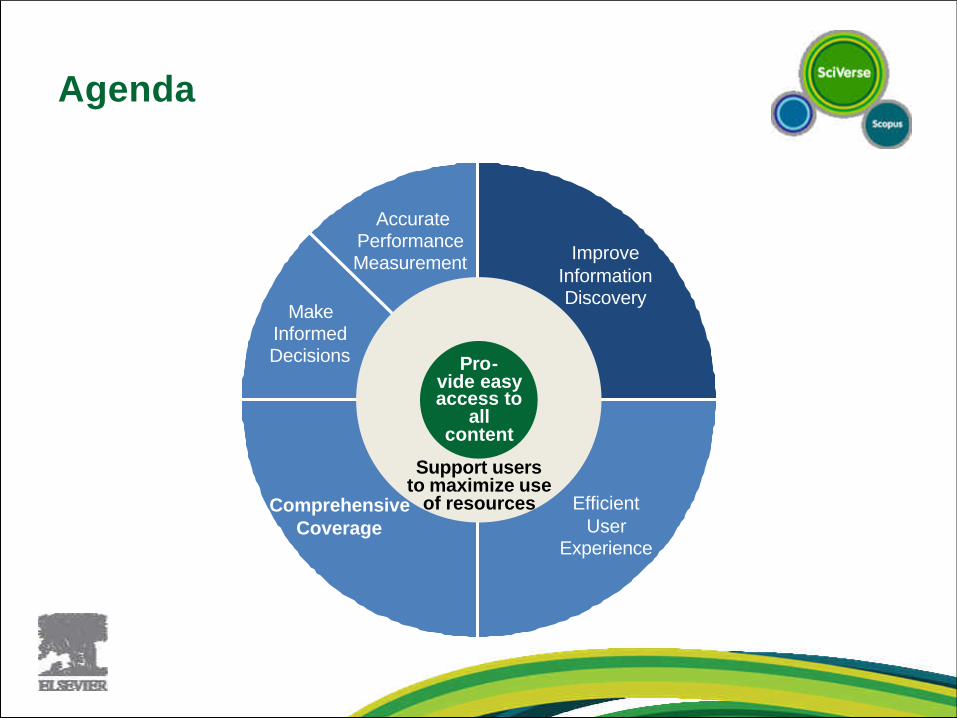
Agenda
Improve Information Discovery
Efficient User
Experience
ComprehensiveCoverage
Make Informed Decisions
Accurate Performance Measurement
Support usersto maximize use
of resources
Pro-vide easy access to
all content
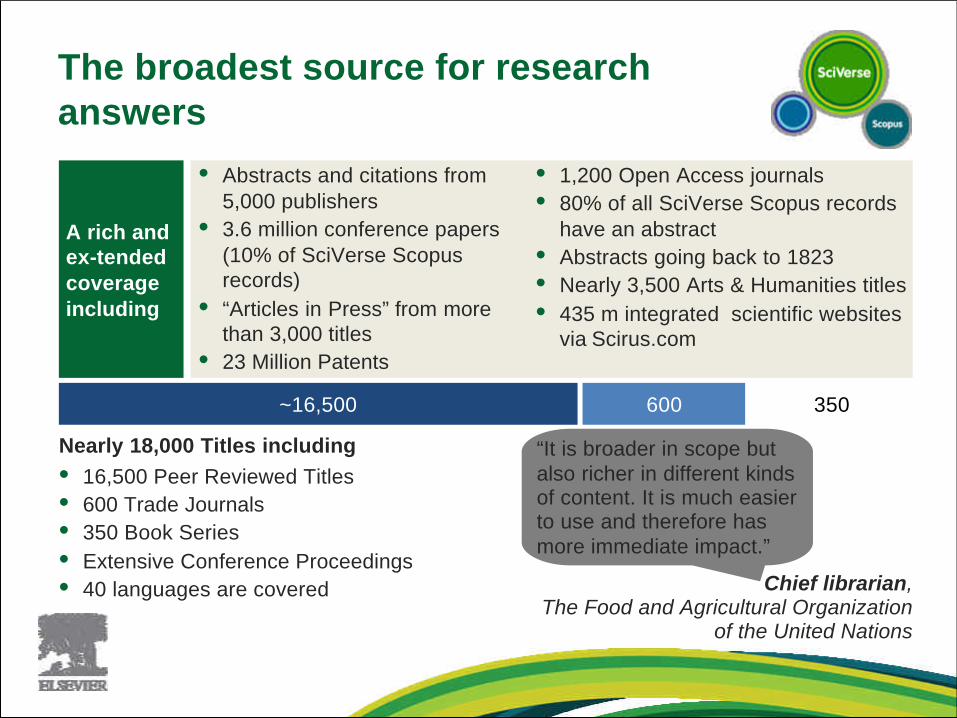
A rich and ex-tended coverage including
• Abstracts and citations from5,000 publishers
• 3.6 million conference papers(10% of SciVerse Scopus records)
• “Articles in Press” from more than 3,000 titles
• 23 Million Patents
• 1,200 Open Access journals• 80% of all SciVerse Scopus records
have an abstract• Abstracts going back to 1823• Nearly 3,500 Arts & Humanities titles • 435 m integrated scientific websites
via Scirus.com
The broadest source for research answers
~16,500 600 350
Nearly 18,000 Titles including• 16,500 Peer Reviewed Titles • 600 Trade Journals• 350 Book Series• Extensive Conference Proceedings• 40 languages are covered
“It is broader in scope but also richer in different kinds of content. It is much easier to use and therefore has more immediate impact.”
Chief librarian,The Food and Agricultural Organization
of the United Nations

Content Selection and Advisory Board (CSAB) – SciVerse Scopus Subject Chairs: An inter-national and independent network of experts
Mr. Ger SpikmanAgricultural & Biological Sciences; Immunology & Microbiology
Karen Holland ProfessorNursing; Health Professions
James D. WrightProfessorSocial Sciences
Peter StambrookProfessor & Chairman Pharmacology, Toxi-cology and Pharma-ceutics; Biochemistry, Genetics & Molecular Biology; Neuroscience
Dr. David RewMedicine
Gerard PfannProfessorEconomics / Business
Jörg-Rüdiger SackProfessorComputer Science
Dr. Richard WhatmoreArts & Humanities
Dr. Peter MillerPsychology, Dentistry & Veterinary Sciences
Peter BrimblecombeProfessorEarth & Planetary Science, Environ-mental Science
Dr. Evan BieskePhysics & Astronomy, Chemistry, Chemical Engineering, Mathe-matics, Energy, Material Sciences
Manolis PapadrakakisProfessorEngineering

• Level of peer-review• Diversity in provenance of editors• Diversity in provenance of authors
• Conformity with journal’s aims & scope• Readability of articles
Selection Criteria used by Content Selection Advisory Board
Eligibility• Peer-review• English abstracts• Regular publication
Journal Policy
• English language abstracts available• All cited references in Roman alphabet• Convincing editorial concept / policy
Presentation of content
• Academic contribution to the field• Clarity of abstracts
Citedness• Citedness of journal articles in SciVerse Scopus• Citedness of editors in SciVerse Scopus
Regularity • No delay in publication schedule
Accessibility• Content available online• English-language journal home page• Quality of home page
2008 selection round: 65% of suggested titles were rejected due to rigorous quality check

18,000 high-quality titles across multiple disciplines
Number of titles per subject area (titles can belong to multiple disciplines)
TotalLife Science
2,850
Social Science /
Arts & Humanities
17,300
3,742
PhysicalScience
5,842
Health Science(100%
Medline)
5,300 Titles can belong to multiple disciplines
Number of journal titles
“The coverage provided by SciVerse Scopus is balanced in terms of subject areas when compared with
Ulrich’s core.”
De Moya Scientometrics 2007
Agenda
Improve Information Discovery
Efficient User
Experience
ComprehensiveCoverage
Make Informed Decisions
Accurate Performance Measurement
Support usersto maximize use
of resources
Pro-vide easy access to
all content

Scopus Author Profile
Screenshot: Scopus Author Information
Amy Knapp, Assistant University Librarian for Public Services and Departmental Libraries, USA
“Author identification in Scopus is so easy to use and solves a problem that experienced users have long expressed a frustrationwith. It also builds on an existing strength of Scopus; supporting the collaboration between authors.”
Every author with more than 1 article in Scopus has an Author Profile.
The profile shows valuable information about the author, such as:
•Variations of his names already grouped together,
•Most recent affiliation
•Number of articles on Scopus and the citations received
•List of co-authors
•Author’s H Index
•The feedback button allows authors to ask for corrections.
Screenshot: Scopus Author Information
Access to the Expertise of Other Researchers

H-Index
H-GRAPHS
“The H-index is the highest number of papers a scientist has that have at least that number of citations” . Nature (2005).
Published by Jorge E. Hirsch in August 2005.
An author with H-Index 13 has at least 13 articles published that received at least 13 citations.
DEFINITION
EXAMPLE
Available from Author Profiles and Citation Tracker pages.
H Index calculation in Scopus only considers articles published from 1996 onwards.
H-INDEX on SCOPUS

Author Feedback Tool

Affiliation Profile

17
Analytics – Journal Analyzer
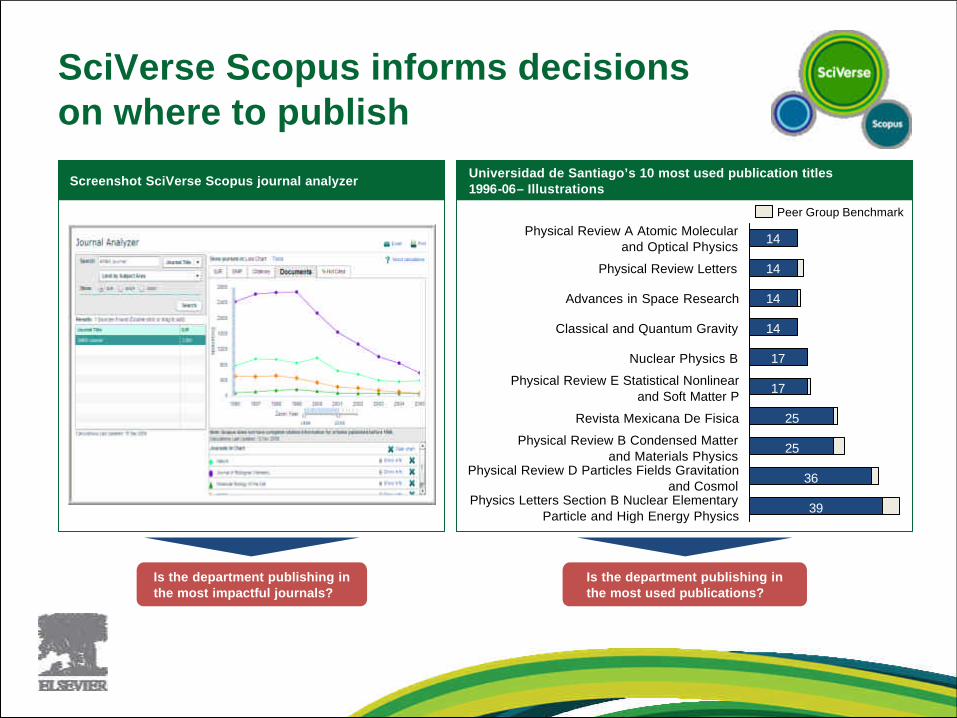
SciVerse Scopus informs decisions on where to publish
Screenshot SciVerse Scopus journal analyzer Universidad de Santiago’s 10 most used publication titles1996-06– Illustrations
Is the department publishing inthe most impactful journals?
25
36
39
Classical and Quantum Gravity
Advances in Space Research
Physical Review Letters
Physical Review A Atomic Molecularand Optical Physics
25
Nuclear Physics B
17
Physics Letters Section B Nuclear ElementaryParticle and High Energy Physics
17
Physical Review E Statistical Nonlinearand Soft Matter P
14
Physical Review B Condensed Matterand Materials Physics
14
Revista Mexicana De Fisica
14
Physical Review D Particles Fields Gravitationand Cosmol
14
Peer Group Benchmark
Is the department publishing inthe most used publications?

19
Apply to nearly 18,000 journals, proceedings and book seriesAre refreshed twice per year to ensure currency of metrics
Allow for a direct comparison of journals, independent of their subject classification
Are integrated into the Scopus Journal Analyzer Are FREELY available
Analytics – New Metrics

20
New Metrics - SNIP
• Created by Professor Henk Moed at CTWS, University of Leiden.
• Measures contextual citation impact by weighting citations based on the total
number of citations in a subject field.
• The impact of a single citation is given higher value in subject areas where
citations are less likely, and vice versa.
• Characteristics:• Measures contextual citation impact by “normalizing” citation values.
• Takes a research field’s citation frequency into account.
• Considers immediacy, how quickly a paper is likely to have an impact in a given field
.
• Accounts for how well the field is covered by the underlying database.
• Calculates without use of a journal’s subject classification to avoid delimitation.
• Counters any potential for editorial manipulation.
SOURCE NORMALIZED IMPACT PER PAPER (SNIP)

21
New Metrics - SJR
• Developed by Professor Félix de Moya, Research Professor at Consejo
Superior de Investigaciones Científicas (CSIC).
• “Prestige” metric based on the idea that “all citations are not created equal”.
With SJR, the subject field, quality and reputation of the journal has a direct
effect on the value of a citation.
• Characteristics:• Is weighted by the prestige of the journal, thereby “leveling the playing field” among
journals.
• Eliminates manipulation: raise the SJR ranking by being published in more reputable
journals.
• “Shares” a journal’s prestige equally over the total number of citations in that journal.
• Normalizes for differences in citation behavior between subject fields.
SCIMAGO JOURNAL RANKING (SJR)

Agenda
Support usersto maximize use
of library
Provide easy
accessto all
content
Improve Information Discovery
Efficient User
Experience
Most Comprehensive
Coverage
Make Informed Decisions
Accurate Performance Measurement
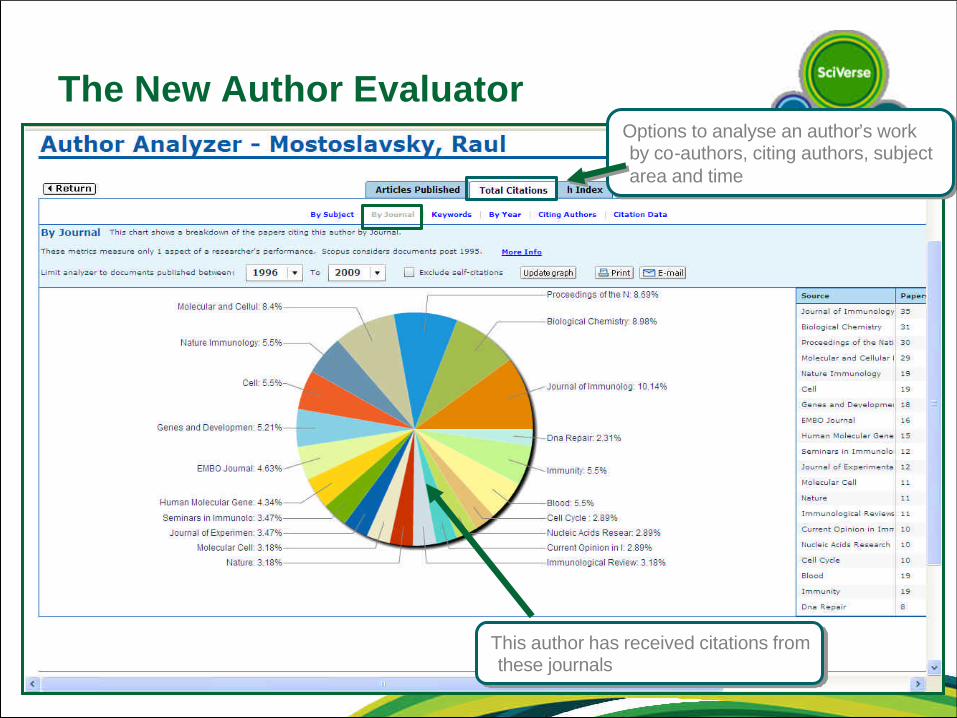
The New Author Evaluator
This author has received citations from these journals
This author has received citations from these journals
Options to analyse an author’s work by co-authors, citing authors, subject area and time
Options to analyse an author’s work by co-authors, citing authors, subject area and time

The New Author Evaluator

The New Author Evaluator

The New Affiliation Profile

Adopted by OECD for research statistics
• For more than 40 years, OECD has been one of the world's largest and most reliable sources of comparable statistics, and economic and social data
• OECD monitors trends, analyses and forecasts economic develop-ments and researches social changes or evolving patterns in trade, environment, agriculture, technology, taxation and more
• The Organisation provides a sett-ing where governments compare policy experiences, seek answers to common problems, identify good practice and coordinate domestic and international policies
Monitoring, analysing and forecasting

Adopted by ARC for ERA
More info on:http://www.arc.gov.au/era/default.htm
Assessment of research quality within Australia's higher education institutions using a combination of indicators and expert review by committees comprising experienced, internationally-recognized experts.
ERA uses leading researchers to evaluate research in eight discipline clusters.
ERA will detail areas within institutions and disciplines that are internationally competitive, as well as point to emerging areas where there are opportunities for development and further investment.
Early January 2010 – Aug/Sep 2010First trial (PCE) in 2009Scopus selected as source informationprovider and partner

Italy – Percentile threshold reports
Benchmark Italian output (publication and citations) against the world for each of the 27 main subject areas

Italy – Collaboration based output
CAGR (2004-2009)
0.00%
2.00%
4.00%
6.00%
8.00%
10.00%
12.00%
Universitadi Pisa
Universitadegli Studidi Torino
Universitadegli Studidi Padova
Alma MaterStudiorumUniversitadi Bologna
Universitadegli Studidi Milano
Universitadegli Studidi Napoli
Federico II
Universitadegli Studidi Roma LaSapienza
Universitadegli Studidi Firenze
ConsiglioNazionale
delleRicerche
Universities
CAGR (%)
International Collaboration with institutions from one of the following countries:UK, US, France, Sweden, Finland, Switzerland, Spain, Japan, Canada, Germany, Korea, Netherlands and China

Agenda
Support usersto maximize use
of library
Provide easy
accessto all
content
Improve Information Discovery
Efficient User
Experience
Most Comprehensive
Coverage
Make Informed Decisions
Accurate Performance Measurement
Make Informed Decisions
Traditional Metrics
New Methodology
++

Research Group Managers
DepartmentHeads
ProvostsDirectors
DeansDeans
SciVal Spotlight
SciVal Funding
SciStrata
Researchers Researchers
The birth of a concept the SciVal Suite

Funding
Spotlight
Strata
“Showcase”
• Competencies help to identify funding opportunities where the institution has strengths
• Funding information can be mapped to competencies to help identify who receives funding and what strategic partnerships are ‘profitable’
• Interdisciplinary clusters can form relevant groups and benchmark within an interdisciplinary context
• Performance of top researchers and/or groups in interdisciplinary clusters can be evaluated along traditional metrics
• Awarded grants can be showcased in context of produced research output and expertise
• Most influential researchers in traditional disciplines can be shown publicly.
Integration Between Modules Enhances Outcomes

35
Assessment
• “I am well informed of my high performing areas, but I am not sure of all the new growing areas in detail.”
• “Which areas have we been growing in the past few years”
Strategic Decision-making
• “How much advantage/disadvantage do I have compared to my peers?”
• “Looking globally, which research areas are the high growth areas?”
Recruitment
• “Who should I recruit to strengthen this research area?”
• “I want to know more in detail about the international candidates”
Institutional Collaboration
• “Which institution should we collaborate with to strengthen our life science research field?”
• “What are our target collaboration institution good at”
Example of DemandExample of Demand Spotlight FeaturesSpotlight Features
University AAAUniversity AAA
University AAAAAUniversity AAAAA
Spotlight evaluates and supports the research strategy process
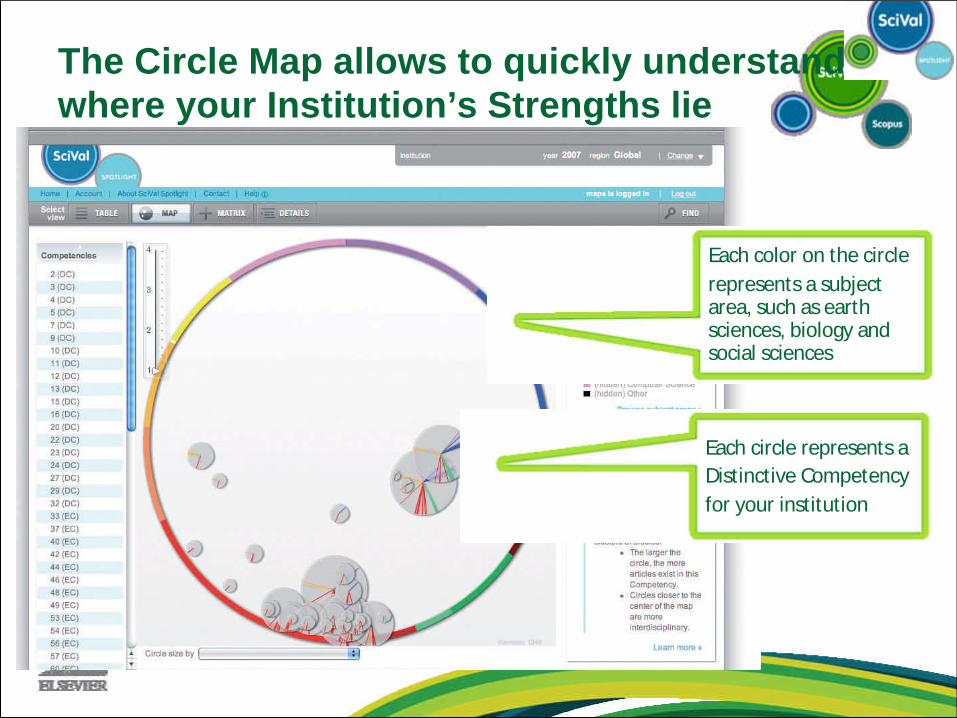
Each color on the circlerepresents a subject area, such as earth sciences, biology and social sciences
Each circle represents aDistinctive Competencyfor your institution
The Circle Map allows to quickly understand where your Institution’s Strengths lie

37
Key ScreenshotsKey ScreenshotsImplications
GLOBAL 2007GLOBAL 2007 What are my strengths, compared to my peers globally?• Can compare “globally,
regionally and/or domestically”• Can chose “year”
In detail, which specific area am I good at?
• Not only top performing area, but also emerging areas
cosmological constant; spherically symmetric; extra dimensionsgenetic algorithm; genetic algorithms; evolutionary algorithmelectron microscopy; transmission electron; liquid crystallineskeletal muscle; magnetic resonance; resistance trainingcompression algorithm; image compression; lossless compressionhumanoid robot; biped robot; humanoid robotscircadian clock; suprachiasmatic nucleus; clock genesangular momentum; string theory; asymptotically flatatomic force; force microscopy; organic mono layersphase transition; magnetic phase; geometrically frustratedammonia-oxidizing bacteria; bacteria AOB; wastewater treatmenthydrogen embrittlement; strain rate; crack growthneural networks; neural network; learning algorithmbose-einstein condensates; bose-einstein condensate; gross-pitaevskii equationppÌ? collisions; cross section; production crossoxygen carriers; red blood; human serumelectrical resistivity; single crystals; thermoelectric powererror bounds; floating-point arithmetic; high-level synthesisdiamond films; cvd diamond; field-effect transistorsubiquitous computing; context information; sensor networks
Key words related to each competencyKey words related to each competency
LIFE SCIENCE RELATED
AREAS
LIFE SCIENCE RELATED
AREAS
Scenario: “Should I strengthen my Life Science Dept? If so, how?”
What are my current strengths, in detail?

38
University AAAAAUniversity AAAAA
How much advantage do I have compared to my nearest competitor
Is th
is a
gro
win
g a
rea
of r
esea
rch
Scenario: “Should I strengthen my Life Science Dept? If so, how?”
Which area should I invest in the future?

One over-riding need – PEOPLE EVALUATION

SciStrata: our proposition

How good is this researcher?

Compare short-list for recruitment
Make groups of researchers, such as ‘What If?’ groups
Visually show excellentperformance
Objective up-to-date data
Choose the most highly-valued KPIs

Scival Funding
Opportunities: Save time finding or discovering new opportunities in a fragmented landscape
Awarded grants: See what’s happening in the funding landscape and determine the ‘right’ strategy to secure grants
Recommendations: Find guidance on where to apply to, based on publication profiles

• Supports research institutions that wish to showcase their research output and accomplishments.
• A suite of solutions to aid different showcasing needs, e.g.
• Scopus API for filling IRs (Scopus customers)
• Data feed for filling IRs (non-Scopus customers)
• Pilots underway to test a web-based solution
Scival Showcase
Related Documents


![[MS-SAMR]: Security Account Manager (SAM) Remote Protocol ... · PDF fileSecurity Account Manager ... [MS-SAMR]: Security Account Manager (SAM) Remote Protocol ... Security Account](https://static.cupdf.com/doc/110x72/5aa2a23b7f8b9a1f6d8d81c5/ms-samr-security-account-manager-sam-remote-protocol-account-manager-.jpg)