© ABCC Australia 2015 new-physics.com MAPPING THE CMB Cosmic Adventure: 10.02

Welcome message from author
This document is posted to help you gain knowledge. Please leave a comment to let me know what you think about it! Share it to your friends and learn new things together.
Transcript
© ABCC Australia 2015 new-physics.com
MAPPING THE CMB
Cosmic Adventure: 10.02
© ABCC Australia 2015 new-physics.com
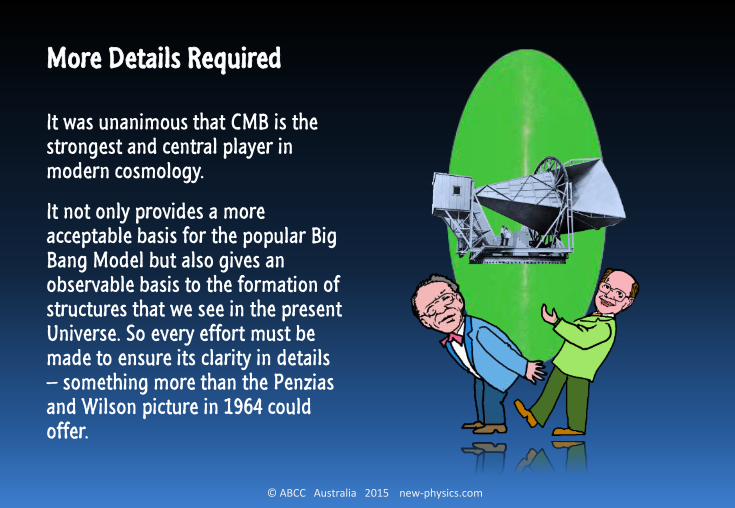
More Details Required
It was unanimous that CMB is the strongest and central player in modern cosmology.
It not only provides a more acceptable basis for the popular Big Bang Model but also gives an observable basis to the formation of structures that we see in the present Universe. So every effort must be made to ensure its clarity in details – something more than the Penzias and Wilson picture in 1964 could offer.

© ABCC Australia 2015 new-physics.com
Direct measurement by Satellites
So starting in the 1980s, a series of satellites were launched in an effort to obtain more detailed information about the CMB. A series of high precision measurements marked newer and better milestone in cosmology. Among the most notable satellite projects are:
COBE, WMAP, and Planck.
© ABCC Australia 2015 new-physics.com
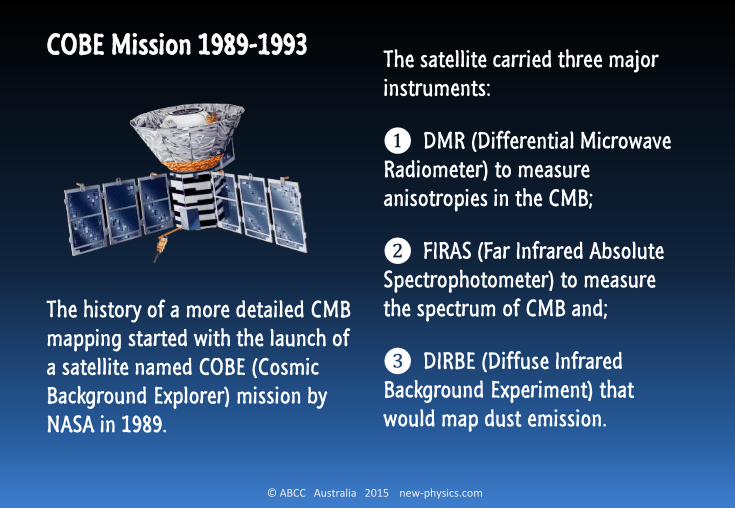
COBE Mission 1989-1993
The history of a more detailed CMB mapping started with the launch of a satellite named COBE (Cosmic Background Explorer) mission by NASA in 1989.
The satellite carried three major instruments:
❶ DMR (Differential Microwave Radiometer) to measure anisotropies in the CMB;
❷ FIRAS (Far Infrared Absolute Spectrophotometer) to measure the spectrum of CMB and;
❸ DIRBE (Diffuse Infrared Background Experiment) that would map dust emission.

© ABCC Australia 2015 new-physics.com
COBE maps
The work was supplemented by many other experiments and finally delivered the relatively blurred blotch-map. The FIRAS proved that the spectrum of the CMB matches that of a perfect black body of temperature 2.726 K; the DMR instrument found anisotropies in the cosmic microwave background at a level of 1 part in 105.
Manzoor A. Malik. International Journal of Astronomy 2013, 2(2): 17-22
Figure credit: NASA science team
© ABCC Australia 2015 new-physics.com
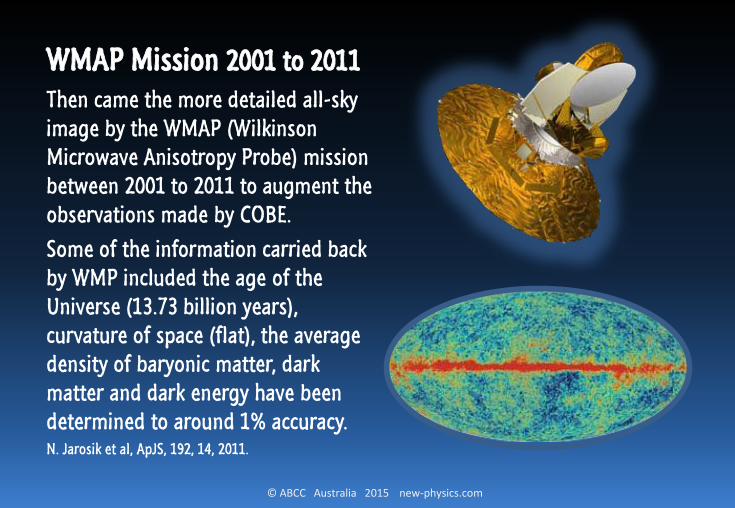
WMAP Mission 2001 to 2011
Then came the more detailed all-sky image by the WMAP (Wilkinson Microwave Anisotropy Probe) mission between 2001 to 2011 to augment the observations made by COBE.
Some of the information carried back by WMP included the age of the Universe (13.73 billion years), curvature of space (flat), the average density of baryonic matter, dark matter and dark energy have been determined to around 1% accuracy. N. Jarosik et al, ApJS, 192, 14, 2011.
© ABCC Australia 2015 new-physics.com
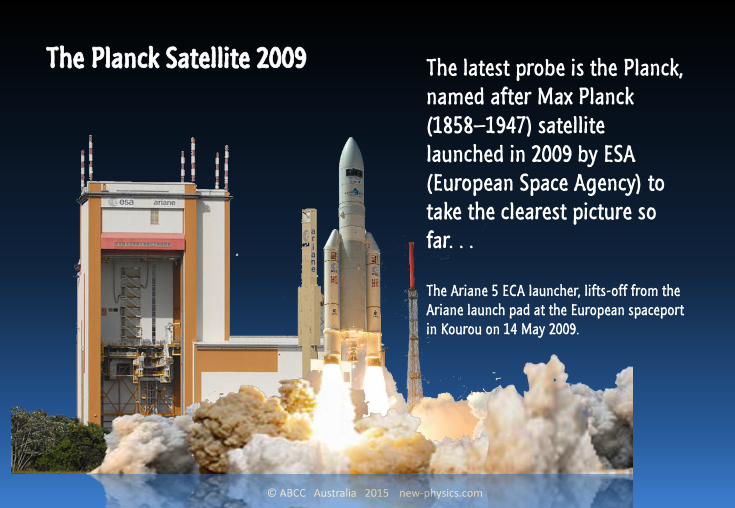
The Planck Satellite 2009 The latest probe is the Planck, named after Max Planck (1858–1947) satellite launched in 2009 by ESA (European Space Agency) to take the clearest picture so far. . .
The Ariane 5 ECA launcher, lifts-off from the Ariane launch pad at the European spaceport in Kourou on 14 May 2009.
© ABCC Australia 2015 new-physics.com

© ABCC Australia 2015 new-physics.com
Best Map of CMB from Planck
From the Planck, scientists now have the best map ever of the cosmic microwave background. The colour variations in the map represent minute differences in temperature and density.

© ABCC Australia 2015 new-physics.com
The Progress in Resolution
PLANCK
WMAP
COBE
1989-1993
2001-2011
2009-2013Ongoing

© ABCC Australia 2015 new-physics.com
Progress in Resolution
HORN
1965 1992 2003 2009

© ABCC Australia 2015 new-physics.com
Better Details
The observation has been done over 15 months. The details are tremendous as compared with those collected by COBE and WMAP. Starting with the relatively blurred blotch-map brought by the COBE mission, to a more detailed all-sky image by the WMAP mission, and now the clearest picture yet by Planck.

© ABCC Australia 2015 new-physics.com
Mollweide Projection
In order to show all the facets of a globe in one piece, the Mollweideprojection technique is employed. The method was first published by mathematician and astronomer Karl Brandan Mollweide (1774 – 1825) of Leipzig in 1805. It enables the making of projections for global maps of the world or night sky.

© ABCC Australia 2015 new-physics.com
CMB Map Projection
Scientists use the same method to project the spherical CMB map onto one elliptical map. Shown here are the Planck maps being coalesced into an elliptical one.

© ABCC Australia 2015 new-physics.com
The Mask
However there are a few strong extragalactic microwave and radio sources around as well. They tend to interfere with the picture. So the scientists made a “mask” to remove the offending parts of the picture.
© ABCC Australia 2015 new-physics.com
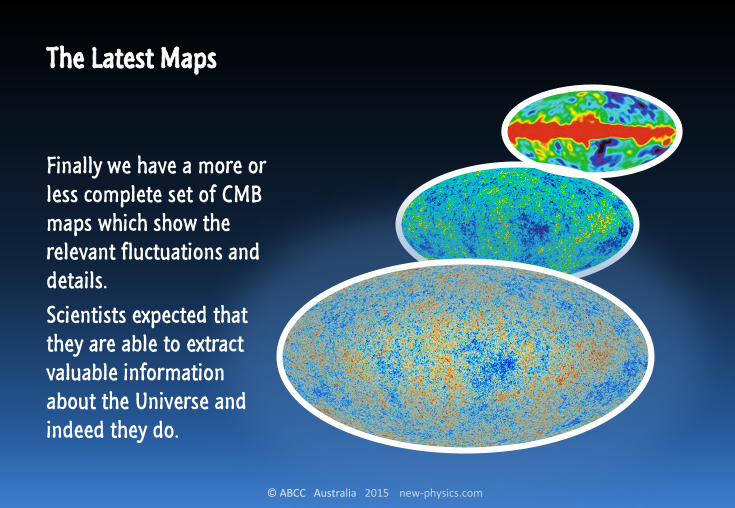
The Latest Maps
Finally we have a more or less complete set of CMB maps which show the relevant fluctuations and details.
Scientists expected that they are able to extract valuable information about the Universe and indeed they do.
© ABCC Australia 2015 new-physics.com
CMB ANALYSIS
To be continued on: Cosmic Adventure 10.03
Related Documents