July 25, 2003, file: c:\fling step\fling step.tex “Fling-Step” vs Filtering: Effects on Response Spectra and Peak Motions David M. Boore Introduction This is a brief note comparing response spectra for the north-south component of the TCU068 recording of the 1999 Chi-Chi earthquake processed using a correction for the “fling-step” and using low-cut filtering. I’ve been meaning to comment on what I understand to be the correction for ”fling-step”, one of the tasks of Working Group 1 of the PEER NGA project. Because I will not be here for the WG1 discussions, I thought I should launch a pre-emptive strike (my missile might be a dud). This is my only shot at what is a somewhat moving target (I’ve seen nothing written down and am responding to oral comments made by Norm Abrahamson at various PEER NGA meetings.) The displacement derived from the TCU068 record has an overshoot before settling down to a large residual displacement, and for this reason it is a prime example of a record with a “fling-step”. I may be missing something, but I do not understand from wave propagation how to separate the far-, intermediate, and near-field terms that in the aggregate determine the ground motion. The separation between these terms is somewhat artificial, depending on distance and the frequency of motion. The residual displacement is a consequence of wave propagation from a finite dislocation; its form is entirely predicted by the elastodynamic equations — the residual displacement is not produced by some other physical process. One reason given for removing “fling-step” is that it might contaminate response spectra and peak motions when included with data that do not show obvious residual displacements in regression analyses to derive equations for predicting strong ground motions. My conclusion is that if the effects of residual displacements are to be removed (and I am not convinced that they should be removed), filtering works as well as the somewhat arbitrary procedure of removing the “fling-step” by subtracting a single cycle of a sine wave from the acceleration time series.

Welcome message from author
This document is posted to help you gain knowledge. Please leave a comment to let me know what you think about it! Share it to your friends and learn new things together.
Transcript

July 25, 2003, file: c:\fling step\fling step.tex
“Fling-Step” vs Filtering: Effects on Response Spectra and Peak Motions
David M. Boore
Introduction
This is a brief note comparing response spectra for the north-south component of theTCU068 recording of the 1999 Chi-Chi earthquake processed using a correction for the“fling-step” and using low-cut filtering. I’ve been meaning to comment on what Iunderstand to be the correction for ”fling-step”, one of the tasks of Working Group 1of the PEER NGA project. Because I will not be here for the WG1 discussions, I thoughtI should launch a pre-emptive strike (my missile might be a dud). This is my only shot atwhat is a somewhat moving target (I’ve seen nothing written down and am responding tooral comments made by Norm Abrahamson at various PEER NGA meetings.)
The displacement derived from the TCU068 record has an overshoot before settling downto a large residual displacement, and for this reason it is a prime example of a recordwith a “fling-step”. I may be missing something, but I do not understand from wavepropagation how to separate the far-, intermediate, and near-field terms that in theaggregate determine the ground motion. The separation between these terms is somewhatartificial, depending on distance and the frequency of motion. The residual displacement isa consequence of wave propagation from a finite dislocation; its form is entirely predictedby the elastodynamic equations — the residual displacement is not produced by some otherphysical process. One reason given for removing “fling-step” is that it might contaminateresponse spectra and peak motions when included with data that do not show obviousresidual displacements in regression analyses to derive equations for predicting strongground motions. My conclusion is that if the effects of residual displacements are tobe removed (and I am not convinced that they should be removed), filtering works as wellas the somewhat arbitrary procedure of removing the “fling-step” by subtracting a singlecycle of a sine wave from the acceleration time series.
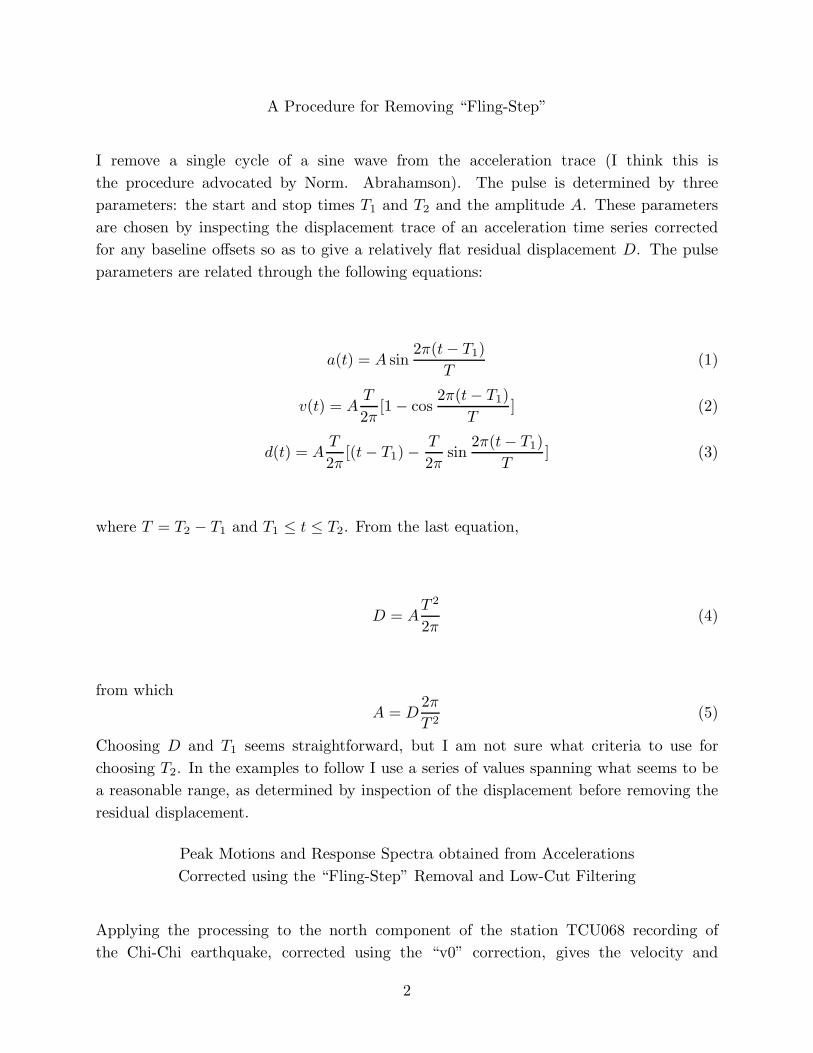
A Procedure for Removing “Fling-Step”
I remove a single cycle of a sine wave from the acceleration trace (I think this isthe procedure advocated by Norm. Abrahamson). The pulse is determined by threeparameters: the start and stop times T1 and T2 and the amplitude A. These parametersare chosen by inspecting the displacement trace of an acceleration time series correctedfor any baseline offsets so as to give a relatively flat residual displacement D. The pulseparameters are related through the following equations:
a(t) = A sin2π(t − T1)
T(1)
v(t) = AT
2π[1 − cos
2π(t − T1)T
] (2)
d(t) = AT
2π[(t − T1) − T
2πsin
2π(t − T1)T
] (3)
where T = T2 − T1 and T1 ≤ t ≤ T2. From the last equation,
D = AT 2
2π(4)
from whichA = D
2π
T 2(5)
Choosing D and T1 seems straightforward, but I am not sure what criteria to use forchoosing T2. In the examples to follow I use a series of values spanning what seems to bea reasonable range, as determined by inspection of the displacement before removing theresidual displacement.
Peak Motions and Response Spectra obtained from AccelerationsCorrected using the “Fling-Step” Removal and Low-Cut Filtering
Applying the processing to the north component of the station TCU068 recording ofthe Chi-Chi earthquake, corrected using the “v0” correction, gives the velocity and
2
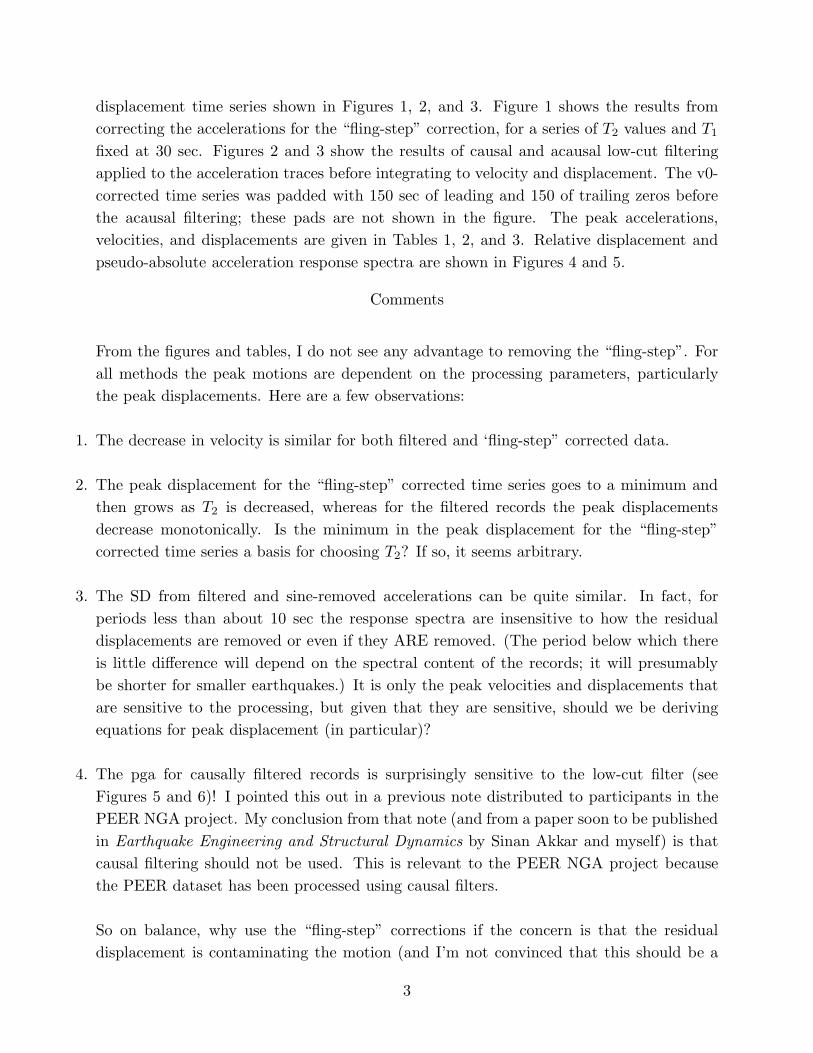
displacement time series shown in Figures 1, 2, and 3. Figure 1 shows the results fromcorrecting the accelerations for the “fling-step” correction, for a series of T2 values and T1
fixed at 30 sec. Figures 2 and 3 show the results of causal and acausal low-cut filteringapplied to the acceleration traces before integrating to velocity and displacement. The v0-corrected time series was padded with 150 sec of leading and 150 of trailing zeros beforethe acausal filtering; these pads are not shown in the figure. The peak accelerations,velocities, and displacements are given in Tables 1, 2, and 3. Relative displacement andpseudo-absolute acceleration response spectra are shown in Figures 4 and 5.
Comments
From the figures and tables, I do not see any advantage to removing the “fling-step”. Forall methods the peak motions are dependent on the processing parameters, particularlythe peak displacements. Here are a few observations:
1. The decrease in velocity is similar for both filtered and ‘fling-step” corrected data.
2. The peak displacement for the “fling-step” corrected time series goes to a minimum andthen grows as T2 is decreased, whereas for the filtered records the peak displacementsdecrease monotonically. Is the minimum in the peak displacement for the “fling-step”corrected time series a basis for choosing T2? If so, it seems arbitrary.
3. The SD from filtered and sine-removed accelerations can be quite similar. In fact, forperiods less than about 10 sec the response spectra are insensitive to how the residualdisplacements are removed or even if they ARE removed. (The period below which thereis little difference will depend on the spectral content of the records; it will presumablybe shorter for smaller earthquakes.) It is only the peak velocities and displacements thatare sensitive to the processing, but given that they are sensitive, should we be derivingequations for peak displacement (in particular)?
4. The pga for causally filtered records is surprisingly sensitive to the low-cut filter (seeFigures 5 and 6)! I pointed this out in a previous note distributed to participants in thePEER NGA project. My conclusion from that note (and from a paper soon to be publishedin Earthquake Engineering and Structural Dynamics by Sinan Akkar and myself) is thatcausal filtering should not be used. This is relevant to the PEER NGA project becausethe PEER dataset has been processed using causal filters.
So on balance, why use the “fling-step” corrections if the concern is that the residualdisplacement is contaminating the motion (and I’m not convinced that this should be a
3

concern)? The choice of T2 in the correction is just as arbitrary as the choice of the low-cutfilter corner, and in both cases the response spectra at lower periods is insensitive to thechoice (except for the “extreme” cases of T2 = 35 sec and flc = 0.08 Hz).
4

Table 1. Acceleration peak values, from headers of smc files. “68nt2v0” is the unfilteredfile with “v0” baseline correction; “68nt100, 050, 025, 012” are the baseline-correctedfile after causal filtering at 100, 50, 25, and 12.5 sec, respectively. The “68pt” files aresimilar, except that acausal filtering of a zero-padded record was used. Finally, the “rmvsn”files are the result of removing a sine from 68nt2v0a.smc, with T1 = 30 sec and T2 = 50,45, 40, and 35 sec (illogically, “01” in the file name corresponds to T2 = 50 sec; the otherfile names give the value of T2).
5

Table 2. Velocity peak values, from headers of smc files.
6

Table 3. Displacement peak values, from headers of smc files.
7

20 30 40 50 60 70
-300
-200
-100
0
100
200
300
Vel
ocity
(cm
/s)
No filteringSine pulse removed from acceleration, T2 = 50 sec.Sine pulse removed from acceleration, T2 = 45 sec.Sine pulse removed from acceleration, T2 = 40 sec.Sine pulse removed from acceleration, T2 = 35 sec.
File
:C:\f
lings
tep\
68n_
rmvs
n_t2
_35_
40_4
5_50
_vd.
draw
;Dat
e:20
03-0
7-25
;Tim
e:18
:00:
59
20 30 40 50 60 70
-500
0
500
Time (s)
Dis
plac
emen
t(c
m)
Displacement corresponding to sine pulsesNo filteringSine pulse removed from acceleration, T2 = 50 sec.Sine pulse removed from acceleration, T2 = 45 sec.Sine pulse removed from acceleration, T2 = 40 sec.Sine pulse removed from acceleration, T2 = 35 sec.
Figure 1. The velocity and displacement time series derived from the TCU068 recording,using the “v0” correction (fit a straightline to the later part of velocity and remove a stepin acceleration with amplitude equal to the slope of the fitted line, starting at the timegiven by the intersection of the fitted line and the zero line in velocity; the result is labeled“No filtering”) and using the “fling-step” correction with T1 = 30 sec and T2 = 35, 40, 45,and 50 sec.
8

20 30 40 50 60 70
-300
-200
-100
0
100
200
300
Vel
ocity
(cm
/s)
68NT2V0V.SMC_H68NT100V.SMC_H68NT050V.SMC_H68NT025V.SMC_H68NT012V.SMC_H
File
:C:\f
lings
tep\
68n_
caus
al_f
ltr_n
o_si
n_vd
.dra
w;D
ate:
2003
-07-
25;T
ime:
18:1
3:49
20 30 40 50 60 70
0
500
Time (s)
Dis
plac
emen
t(c
m)
No filteringTc= 100 sec, causalTc= 50 sec, causalTc= 25 sec, causalTc= 12.5 sec, causal
Figure 2. The velocity and displacement time series derived from the TCU068 recording,using the “v0” correction (fit a straightline to the later part of velocity and remove a stepin acceleration with amplitude equal to the slope of the fitted line, starting at the timegiven by the intersection of the fitted line and the zero line in velocity; the result is labeled“No filtering”) and using low-cut causal Butterworth filters, with filter corner periods of12.5, 25, 50, and 100 sec.
9

20 30 40 50 60 70
-300
-200
-100
0
100
200
300
Vel
ocity
(cm
/s)
68NT2V0V.SMC_H68PT100V.SMC_H68PT050V.SMC_H68PT025V.SMC_H68PT012V.SMC_H
File
:C:\f
lings
tep\
68n_
acau
sal_
fltr_
no_s
in_v
d.dr
aw;D
ate:
2003
-07-
25;T
ime:
18:1
9:55
20 30 40 50 60 70
0
500
Time (s)
Dis
plac
emen
t(c
m)
No filteringTc= 100 sec, acausalTc= 50 sec, acausalTc= 25 sec, acausalTc= 12.5 sec, acausal
Figure 3. The velocity and displacement time series derived from the TCU068 recording,using the “v0” correction (fit a straightline to the later part of velocity and remove a stepin acceleration with amplitude equal to the slope of the fitted line, starting at the timegiven by the intersection of the fitted line and the zero line in velocity; the result is labeled“No filtering”) and using low-cut acausal Butterworth filters, with filter corner periods of12.5, 25, 50, and 100 sec.
10

1 101 102101
102
103
period (sec)
5%-d
ampe
dS
Dre
spon
se(c
m)
no filtering; t2 (=31.0 s) from zero intercept of fitted velocitySine pulse removed from acceleration, T2 = 50 secTc = 100 s, causalTc = 50 s, causalTc = 25 s, causalTc = 12.5 s, causal
TCU068, NS
1 101 102101
102
103
period (sec)
5%-d
ampe
dS
Dre
spon
se(c
m)
no filtering; t2 (=31.0 s) from zero intercept of fitted velocitySine pulse removed from acceleration, T2 = 50 secTc = 100 s, acausalTc = 50 s, acausalTc = 25 s, acausalTc = 12.5 s, acausal
TCU068, NS
1 101 102101
102
103
period (sec)
5%-d
ampe
dS
Dre
spon
se(c
m)
no filtering; t2 (=31.0 s) from zero intercept of fitted velocitySine pulse removed from acceleration, T2= 50 secSine pulse removed from acceleration, T2= 45 secSine pulse removed from acceleration, T2= 40 secSine pulse removed from acceleration, T2= 35 sec
TCU068, NS
File
:C:\f
lings
tep\
68n_
sd_a
ll.dr
aw;D
ate:
2003
-07-
25;T
ime:
17:0
1:51
Figure 4. 5%-damped relative displacement response spectra for the time series processedusing the “fling-step” removal and using causal and acausal filters.
11

10-2 10-1 1 101 102101
102
103
period (sec)
5%-d
ampe
dP
AA
resp
onse
(cm
/sec
2 )
no filtering; t2 (=31.0 s) from zero intercept of fitted velocitySine pulse removed from acceleration, T2 = 50 secTc = 100 s, causalTc = 50 s, causalTc = 25 s, causalTc = 12.5 s, causal
TCU068, NS
10-2 10-1 1 101 102101
102
103
period (sec)
5%-d
ampe
dP
AA
resp
onse
(cm
/sec
2 )
no filtering; t2 (=31.0 s) from zero intercept of fitted velocitySine pulse removed from acceleration, T2 = 50 secTc = 100 s, acausalTc = 50 s, acausalTc = 25 s, acausalTc = 12.5 s, acausal
TCU068, NS
10-2 10-1 1 101 102101
102
103
period (sec)
5%-d
ampe
dP
AA
resp
onse
(cm
/sec
2 )
no filtering; t2 (=31.0 s) from zero intercept of fitted velocitySine pulse removed from acceleration, T2= 50 secSine pulse removed from acceleration, T2= 45 secSine pulse removed from acceleration, T2= 40 secSine pulse removed from acceleration, T2= 35 sec
TCU068, NS
File
:C:\f
lings
tep\
68n_
paa_
all.d
raw
;Dat
e:20
03-0
7-25
;Tim
e:16
:58:
00
Figure 5. 5%-damped pseudo absolute acceleration response spectra for the time seriesprocessed using the “fling-step” removal and using causal and acausal filters.
12

34 34.5 35 35.5 36 36.5 37
-600
-400
-200
0
200
Time (s)
Acc
eler
atio
n(c
m/s
ec2 )
68NT2V0A.SMC_H68NT100A.SMC_H68NT050A.SMC_H68NT025A.SMC_H68NT012A.SMC_H
File
:C:\f
lings
tep\
68n_
caus
al_f
ltr_a
.dra
w;D
ate:
2003
-07-
25;T
ime:
18:2
9:10
Figure 6. Acceleration time series after applying low-cut causal Butterworth filters atan expanded time scale for the regio of largest accelerations. This shows the surprisingsensitivity of high frequencies to large corner periods when using a causal filter; acomparable plot using acausal filter shows little difference for the time series obtainedusing different corner periods.
13
Related Documents