• J ! [I " , t , -. ,,¢,., k ': k MINISTRY OIF SUPPLY AERONAUTICAL RESEARCH COUNCIL REPORTS AND MEMORANDA Speeds and Norma~ Accelerations of Boeing C//ppe£ Aircraft on l~4orth and South Atlantic Routes By D. To JONE% M.A.B.Sc. F.S.S. Cro~n Copyright Reserved LONDON: HER MAJESTY'S STATIONERY OFFICE x952 FOUR SHILLINGS NET

Welcome message from author
This document is posted to help you gain knowledge. Please leave a comment to let me know what you think about it! Share it to your friends and learn new things together.
Transcript

• J
!
[I " , t , - . , , ¢ , . , k ' :
k
MINISTRY OIF SUPPLY
AERONAUTICAL RESEARCH COUNCIL
REPORTS AND MEMORANDA
Speeds and Norma~ Accelerations of Boeing C//ppe£ Aircraft on l~4orth and
South Atlantic Routes By
D. To JONE% M . A . B . S c . F.S.S.
Cro~n Copyright Reserved
LONDON: HER MAJESTY'S STATIONERY OFFICE
x952
F O U R S H I L L I N G S N E T

$ ¢,
Speeds, and Aircraft
Normal Accelerations of .Boeing Clipper on North and South Atlantic Routes
By D. T. JoNEs, M.A., B.Sc., F.S.S.
COMMUNICATED BY THE PmNCIPAL DIR~CTOI~ OF SCIENTIFIC R~SEARCH (AIR), MINISTRY OF SUPPLY
Reports and Memoranda No. 2 6 3 3"
May, 19+8
Summary.--This report presents results obtained from V-g recorders fitted to Boeing Clipper aircraft o n the North and South Atlantic routes between September, 1944 and May, 1946. The records cover about 3,300 flying hours and show that the maximum speed recorded is 215 m.p.h. (I.A.S.) and the maximum upward and downward accelerations are 2-3g and --0-3g respectively.
The two main groups of records considered differ from one another not only in respect of route but also in seasonal conditions and in proportion of flights made in wartime. Therefore, differences between the results cannot be simply ascribed to differences of route.
I t appears from the anMysis that tile maximum speed likely to be a t ta~ed in a large flying time is somewhat greater in one group (North Atlantic) than in the other (South Atlantic) and that the maximum accelerations on the other hand are likely to be less for the former than the latter.
1. Introduction.--1.1. One of several operational research projects on civil air transports was to determine by V-g recorders the maximum speeds and normal accelerations experienced by Boeing Clipper aircraft of the British Overseas Airways Corporation on the North and South Atlantic routes. Some preliminary results were reported by Hain Taylor 1 and the project has since been terminated by the withdrawal of these aircraft from service. The purpose of the present report is to provide a complete record of the results of this investigation.
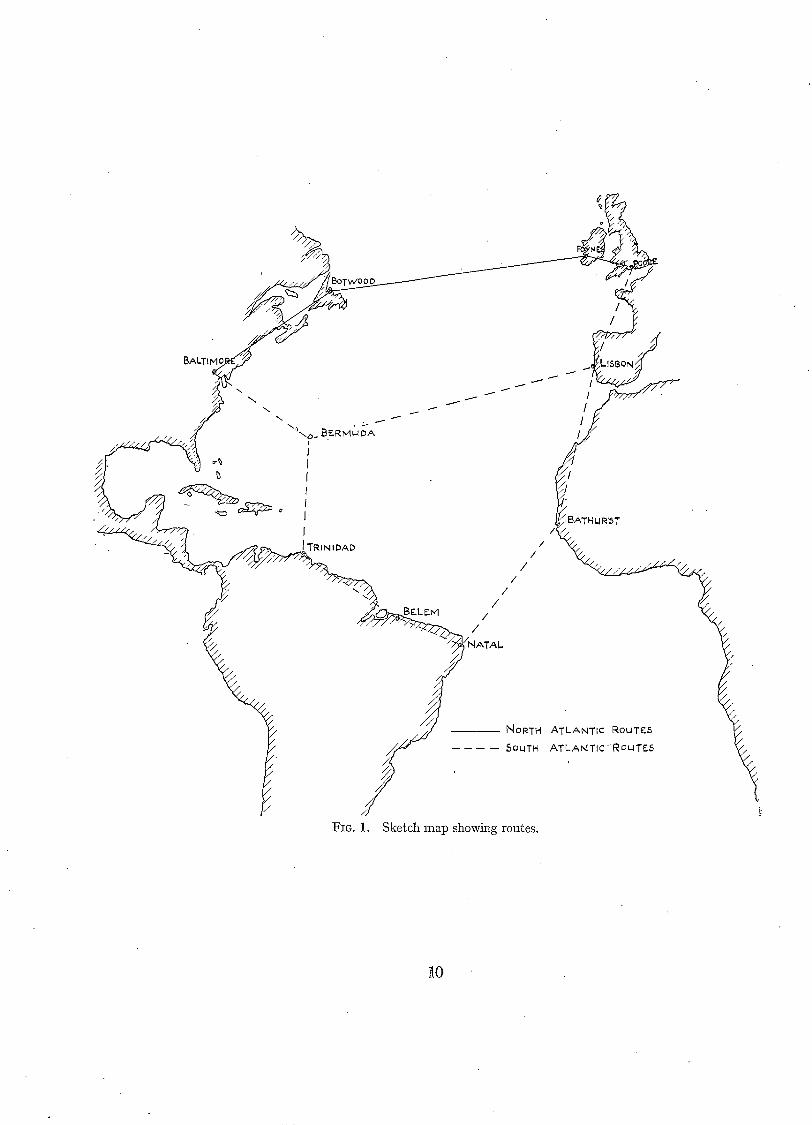
1.2. Both routes terminate at Poole in [England and Baltimore in the U.S.A., the North Atlantic route proceeding via Foynes and Botwood, and the South Atlantic route including Lisbon, Bathurst, Natal, Belem, Trinidad and Bermuda (see Fig. 1). Records for the South Atlantic were received between March, 1945 and May, 1946, and those for the North between September, 1944 and October, 1945.
1.3. Brief particulars of the Boeing Clipper are given in Appendix II.
2. Data and their Presentation.--2.1. South Atlantic.--The total number of V-g records for tim South Atlantic was 138 covering a flying time of 2,200 hours. The flying times of these records varied widely, the extreme values being 60 hours and 10 hours per record. Variations in the flying time bias the values of speed and acceleration and therefore, for the purpose of the a~nalysis - (described in Appendix I), records having a reasonably constant time only were used. The largest number of such records was 77 and the average flying time per record was about 11 hours. The total flying time for these records was 838 hours.
*R.A.E. Report Structures 25--received 20th October, 1948.
1 (5150.9)
- 1 ,
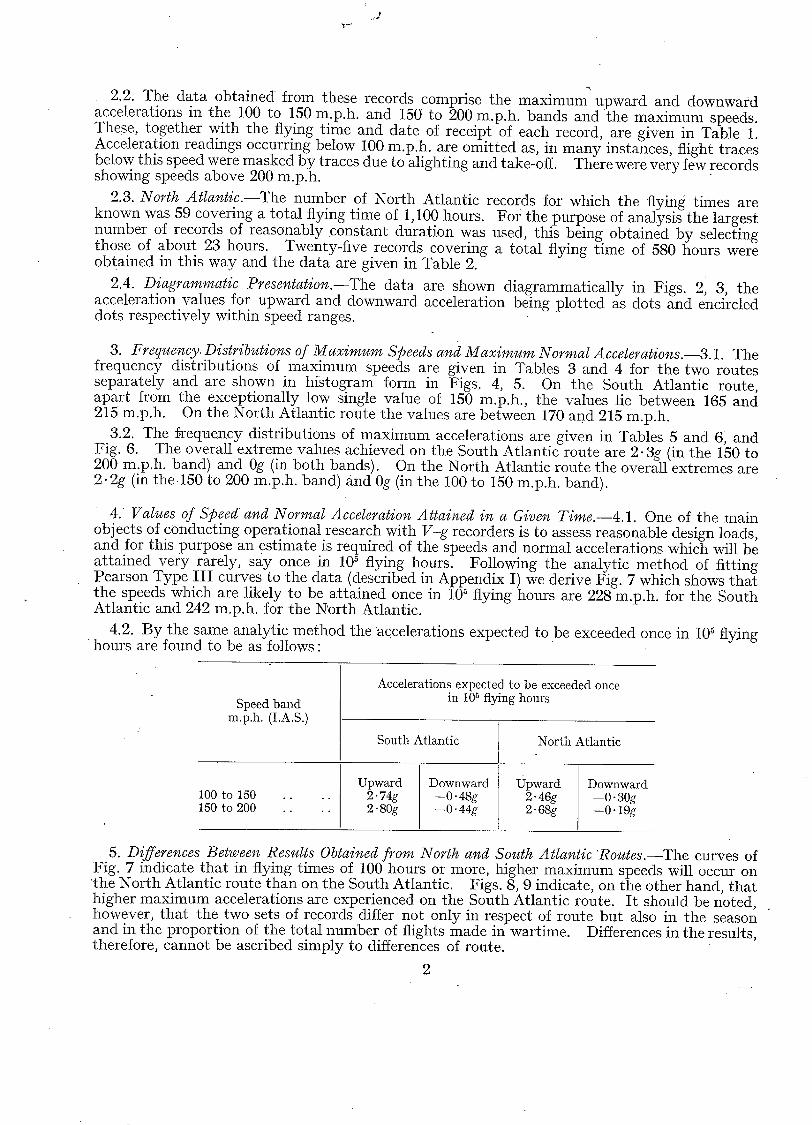
2.2. The data obtained from these records comprise the maximum upward and downward accelerations in the 100 to 150 m.p.h, and 150 to 200 m.p.h, bands and the maximum speeds. These, together with the flying time and date of receipt of each record, are given in Table 1. Acceleration readings occurring below 100m.p.h. are omitted as, in many instances, flight traces below this speed were masked by traces due to alighting and take-off. There were very few records showing speeds above 200 m.p.h.
2.3. North Atlantic.--The number of North Atlantic records for which the flying times are known was 59 covering a total flying time of 1,100 hours. For the purpose of analysis the largest number of records of reasonably constant duration was used, this being obtained by selecting those of about 23 hours. Twenty-five records covering a total flying time of 580 hours were obtained in this way and the data are given in Table 2.
2.4. Diagrammatic Presentation.--The data are shown diagrammatically in Figs. 21 3, the acceleration values for upward and downward acceleration being plotted as dots and encircled dots respectively within speed ranges.
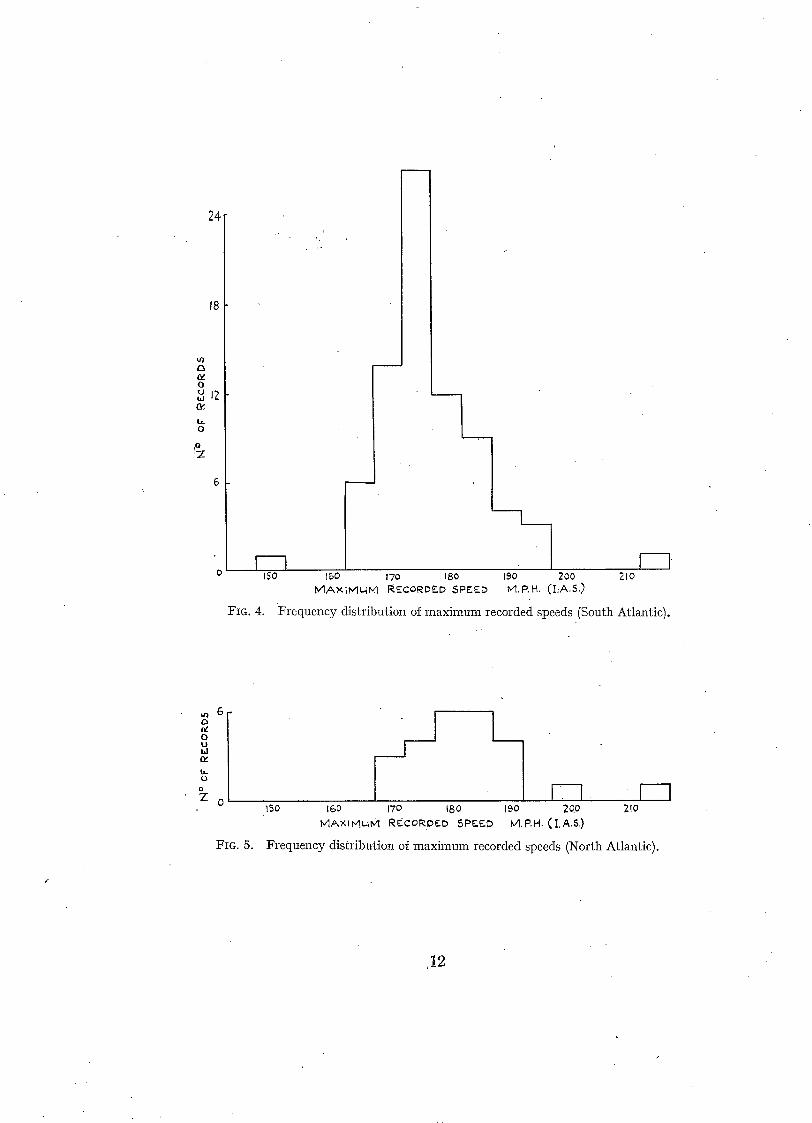
3. Frequency Distributions of Maximum Speeds and Maximum Normal Accelerations.--& 1. The frequency distributions of maximum speeds are given in Tables 3 and 4 for the two routes separately and are shown in histogram form in Figs, 4, 5. On the South Atlantic route, apart from the exceptionally low single value of 150 m.p.h., the values lie between 165 and 215 m.p.h. On the North At]antic route the values are between 170 and 215 m.p.h.
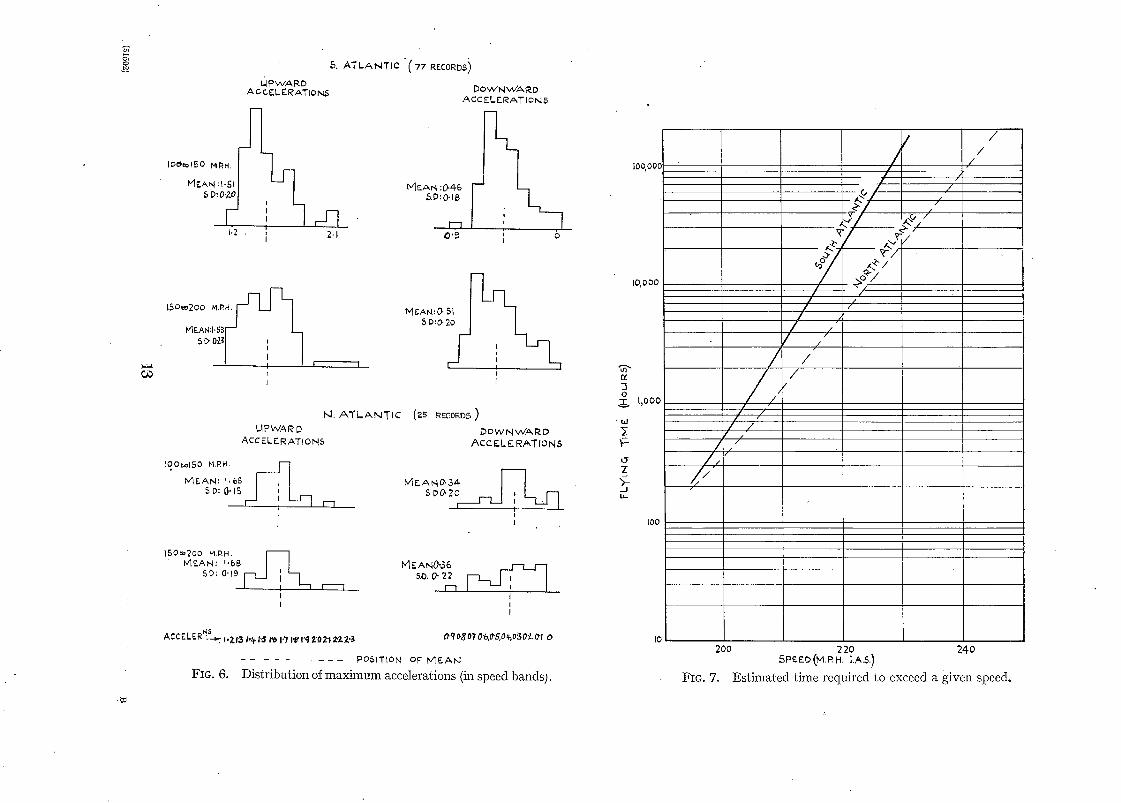
3.2. The frequency distributions of maximum accelerations are given in Tables 5 and 61 and Fig. 6. Tile overall extreme values achieved on the South Atlantic route are 2.3g (in the 150 to 200 m.p.h, band) and 0g (in both bands). On the North Atlantic route the overall extremes are 2.2g (in the 150 to 200 m.p.h, band) and 0g (in the 100 to 150 m.p.h, band).
4. Values of Speed and Normal Acceleration Attained in a Given Time.--4.1. One of the main objects of conducting operational research with V-g recorders is to assess reasonable design loads, and for this purpose an estimate is required of the speeds and normal accelerations which will be at tained very rarely, say once in 105 flying hours. Following the analytic method of fitting Pearson Type n I curves to the data (described in Appendix I) we derive Fig. 7 which shows tha t the speeds which are likely to be attained once in 105 flying hours are 228 m.p.h, for the South Atlantic and 242 m.p.h, for the North Atlantic.
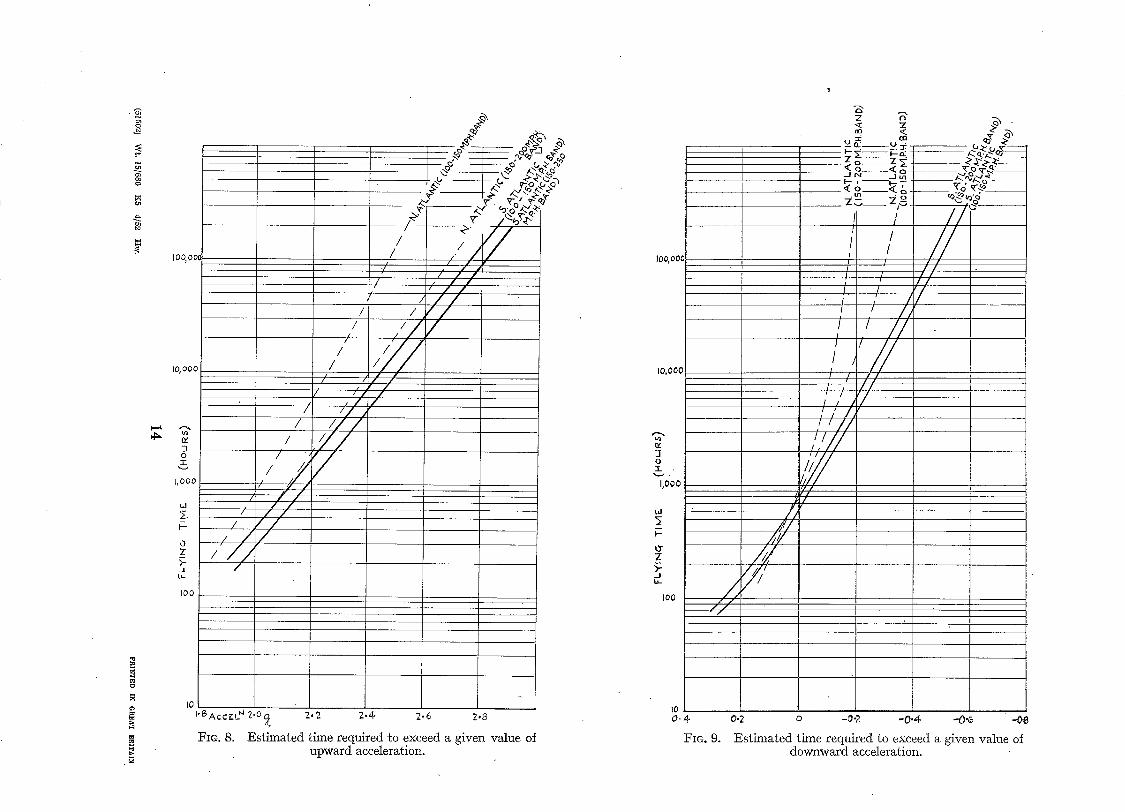
4.2. By the same analytic method the accelerations expected to be exceeded once in 105 flying h o u r s are found to be as follows:
Speed band m.p.h. (I.A.S.)
100 to 150 150 to 200
Accelerations expected to be exceeded once in 105 flying hours
• o • °
South Atlantic
Upward 2.74g 2.80g
Downward -o.48g --0" 44g
North Atlantic
Upward 2.46g 2.68g
Downward --0-30g --0-19g
5. Differences Between Results Obtained from North and South Atlantic Routes.--The curves of Fig. 7 indicate tha t in flying times of 100 hours or more, higher maximum speeds will occur on the North Atlantic route than on the South Atlantic. Figs. 8, 9 indicate, on the other hand, tha t higher maximum accelerations are experienced on the South Atlantic route. I t should be noted, however, tha t the two sets of records differ not only in respect of route but also in the season and in the proportion of the total number of flights made in wartime. Differences in the results, therefore, cannot be ascribed simply to differences of route.
2
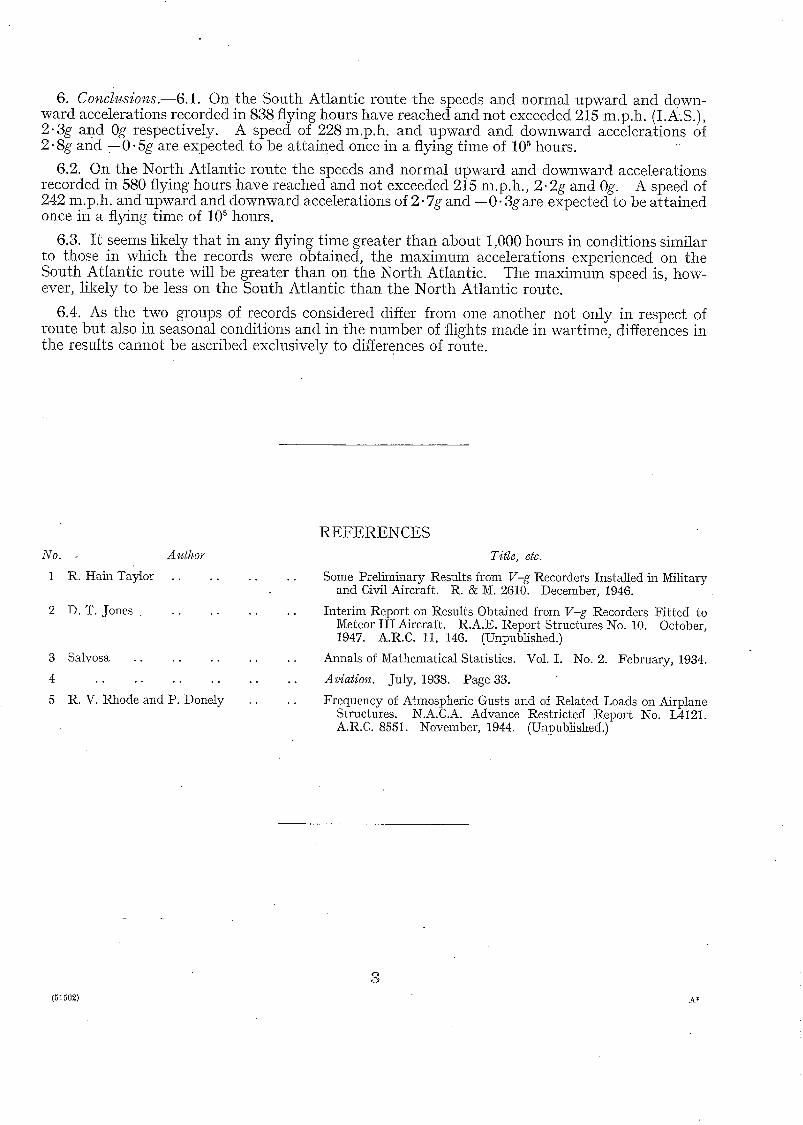
6. Conclusions.--6.1. On the South Atlantic route the speeds and normal upward and down- ward accelerations recorded in 838 flying hours have reached and not exceeded 215 m.p.h. (I.A.S.), 2-3g and 0g respectively. A speed of 228 m.p.h, and upward and downward accelerations of 2.8g and 7 0 " 5g are expected to be at tained once in a flying time of 105 hours.
6.2. On the North Atlantic route the speeds and normal upward and downward accelerations recorded in 580 flying hours have reached and not exceeded 215 m.p.h., 2.2g and 0g. A speed of 242 m.p.h, and upward and downward accelerations of 2.7g and - -0 .3g are expected to be attained once In a flying time of 105 hours.
6.3. I t seems likely tha t in any flying time greater than about 1,000 hours in conditions similar to those in which the records were obtained, the maximum accelerations experienced on the South Atlantic route will be greater than on the North Atlantic. The maximum speed is, how- ever, likely to be less on the South Atlantic than the North Atlantic route.
6.4. As the two groups of records considered differ from one another not only in respect of route but also in seasonal conditions and in the number of flights made in wartime, differences in the results cannot be ascribed exclusively to differences of route.
No. Author
1 R. Hain Taylor . .
2 D . T . Jones . .
3 Salvosa . . . . . . . . . .
4 . . . . . . . . . . . .
5 R .V . Rhode and P. Donely . . . .
REFERENCES
Title, etc.
Some Preliminary Results from V-g Recorders Installed in Military and Civil Aircraft. R. & M. 2610. December, 1946.
Interim Report on Results Obtained from V%~ Recorders Fit ted to Meteor I I I Aircraft. R.A.E. Report Structures No. 10. October, 1947. A.R.C. 11, 146. (Unpublished.)
Annals of Mathematical Statistics. Vol. I. No. 2. February, 1934.
Aviation. July, 1938. Page 33.
Frequency of Atmospheric Gusts and of Related Loads on Airplane Structures. N.A.C.A. Advance Restricted Report No. L4121. A.R.C. 8551. November, 1944. (Unpublished.)
3 (51502) A*
A P P E N D I X I
A~bplication of Pearson Ty~be I IZ Curves to the Estimation of Probabilities of Exceeding Given Values of Speed and Acceleration
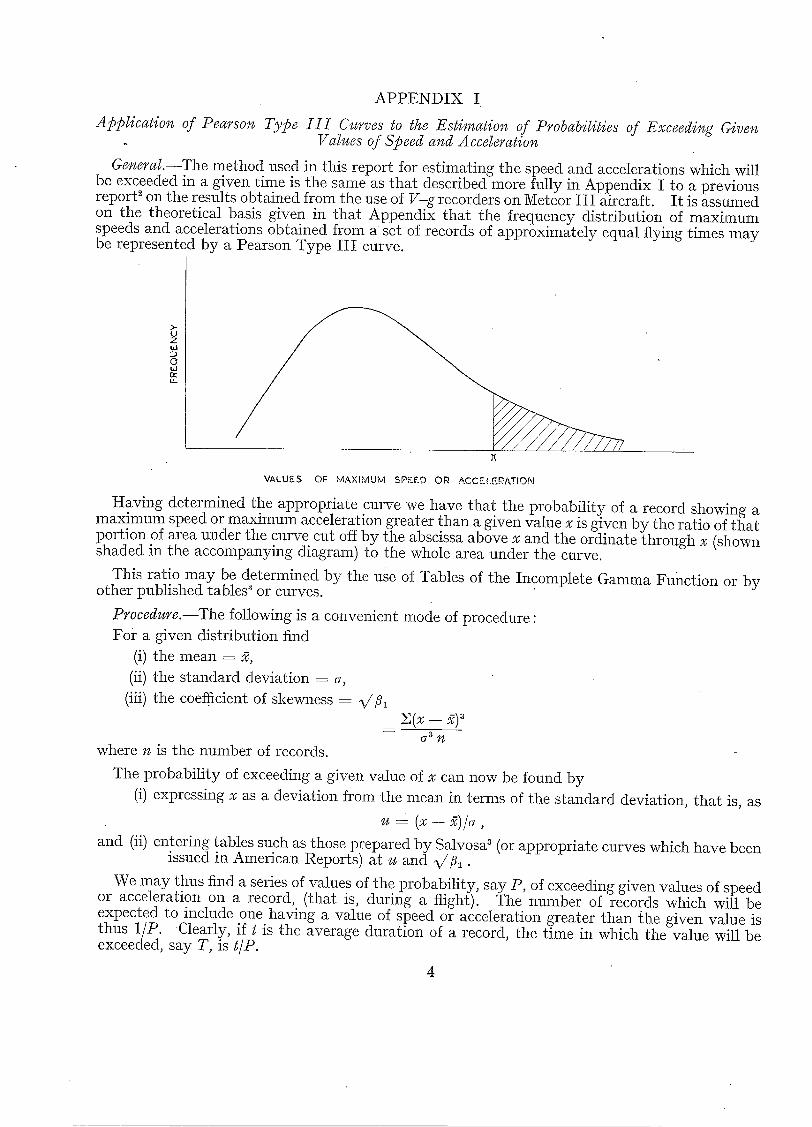
Gemral.--The method used in this report for estimating the speed and accelerations which will be exceeded in a given time is the same as that described more fully in Appendix I to a previous report s on the results obtained from the use of V-g recorders on Meteor III aircraft. I t is assumed on the theoretical basis given in that Appendix that the frequency distribution of maximum speeds and accelerations obtained from a set of records of approximately equal flying times may be represented by a Pearson Type 1II curve.
>- U Z
O t ~ r~ ta_
X
VAtUES OF M,~,Xt~..4UM SPSED O~ ~.CC~L~#ATtON
Having determined the appropriate curve we have that the probability of a record showing a maximum speed or maximum acceleration greater than a given value x is given by the ratio of that portion of area under the curve cut off by the abscissa above x and the ordinate through x (shown shaded in the accompanying diagram) to the whole area under the curve.
This ratio may be determined by the use of Tables of the Incomplete Gamma Function or by other published tables 3 or curves.
Procedure.--The following is a convenient mode of procedure : For a given distribution find
(i) the mean = 2,
(ii) the standard deviation = ~,
(iii) the coefficient of skewness = ~//~1
where ~ is the number of records.
The probability of exceeding a given value of x can now be found by
(i) expressing x as a deviation from the mean in terms of the standard deviation, that is, as
u = 2 ) / . ,
and (ii) entering tables such as those prepared by Salvosa 3 (or appropriate curves which have been issued in American Reports) at u and ~/~1.
We may thus find a series of values of the probability, say P, of exceeding given values of speed or acceleration on a record, (that is, during a flight). The number of records which will be expected to include one having a value of speed or acceleration greater than {he given value is thus lIP. Clearly, if t is the average duration of a record, the time in which the value will be exceeded, say T, is tiP.
4
In order to construct a curve of T against x a few arbitrary values of x should be chosen, the corresponding values of u found, and hence values of P and tip determined. The points thus obtained can be conveniently plotted on semi-logarithmic paper, of say five cycles, and it is then possible to read off the time in which a given value will be exceeded once.
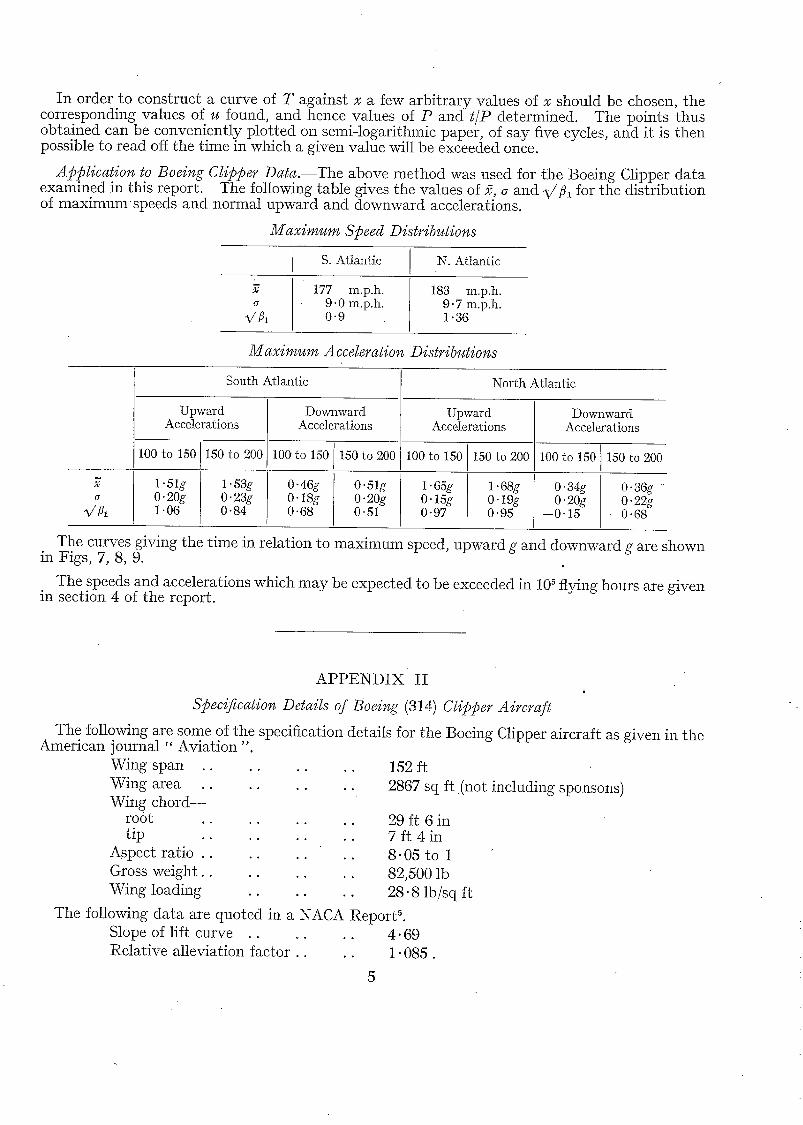
Application to Boeing Clipper Data.--The above method was used for -the Boeing Clipper data examined in this report. The following table gives the values of 2, ~ and ~/fl, for the distribution of maximumspeeds and normal upward and downward accelerations.
Maximum Speed Distributions
S. Atlantic N. Atlantic
x 177 m.p.h. 183 m.p.h. 9.0 m.p.h. 9- 7 m.p.h.
~/~1 0.9 1.36
Maximum Acceleration Distributions
South Atlantic North Atlantic
Upward Downward Upward Downward Accelerations Accelerations Accelerations Accelerations
100 to 150 150 to 200 100to150 150 to 200 100 to 150 150 to 200 100to150 150 to 200
1.51g 1.53g 0.46g 0.51g 1.65g 1-68g 0.34g 0.36g (r 0.20g 0.23g 0.I8g 0.20g 0.1Sg 0.I9g 0.20g 0.22g
~//~1 1.06 0-84 0.68 0.51 0-97 0.95 --0.15 --0.68
The curves giving the time in relation to maximum speed, upward g and downward g are shown in Figs, 7, 8, 9.
The speeds and accelerations which may be expected to be exceeded in 105 flying hours are given in section 4 of the report.
A P P E N D I X II
Specificatio¢¢ Details of BoeiK~ (314) Clipper Aircraft
The following are some of the specification details for the Boeing Clipper aircraft as given in the American journal " Avia t ion"
Wing span . . . . . . . . Wing area . . . . . . . . Wing chord--
root . . . . . . . . tip . . . . . . . .
Aspect ratio . . . . . . . . Gross weight . . . . . . . . Wing loading . . . . . .
152 ft 2867 sq It (not including sponsons)
29 ft 6 in 7 It 4 in 8.05 to 1 82,500 lb 28.8 lb/sq ft
The following data are quoted in a NACA ReportL Slope of lift curve . . . . . . 4.69 Relative alleviation factor . . . . 1.085.
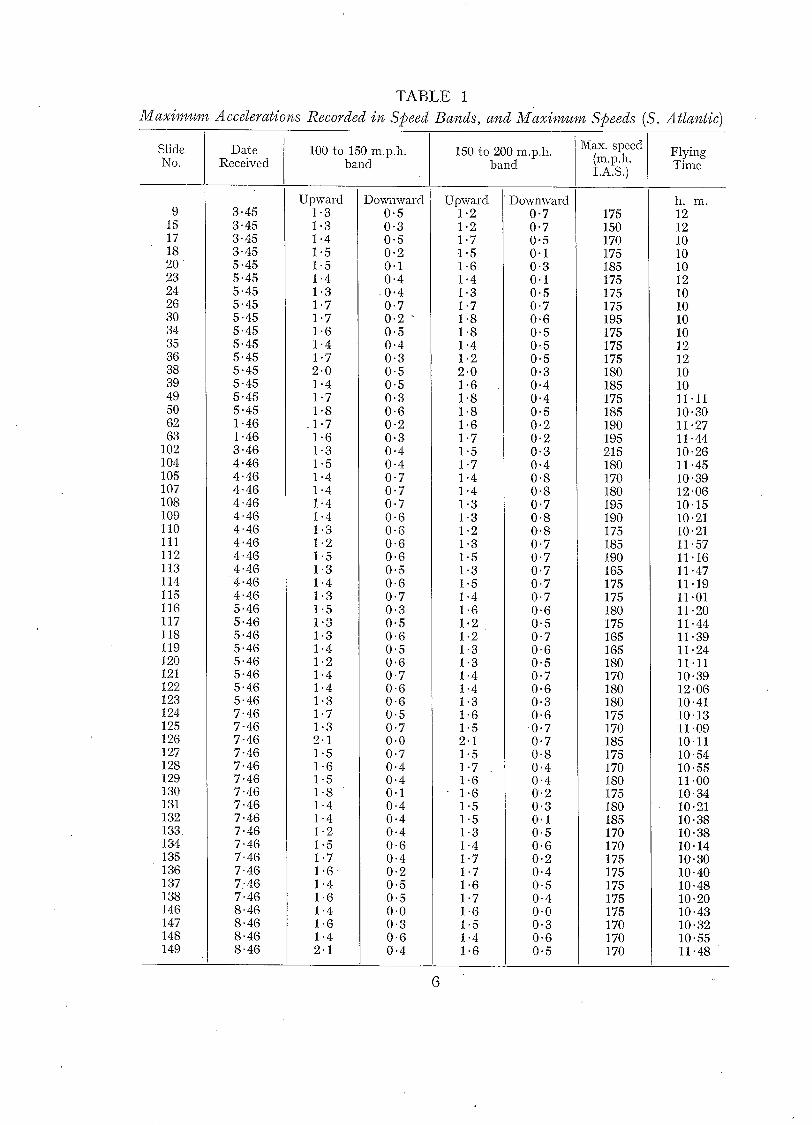
TABLE 1
Maximum Accelerations Recorded in S2~eed Bands, and Maximum S25eeds (S. Atlantic)
Slide No.
Date Received
100 to 150 m.p.h. band
150 to 200 m.p.h. band
~{ax. speed (m.p.h. Flying I.A.S.) Time
9 15 17 18 2 0 23 24 26 30 34 35 36 38 39 49 5O 62 63
102 104 105 107 108 109 110 111 112 113 114 115 116 117 118 119 120 121 122 123 124 125 126 127 128 129 130 131 132 133 134 135 136 137 138 146 147 148 149
3"45 3 '45 3'45 3"45 5 '45 5 '45 5 '45 5"45 5"45 5"45 5.45 5-45 5-45 5-45 5.45 5.45 1.46 1.46 3.46 4.46 4.46 4.46 4.46 4.46 4.46 4.46 4 '46 4.46
4 . 4 6 4.46 5.46 5.46 5.46 5.46 5.46 5.46 5.46 5.46 7.46 7-46 7-46 7-46 7-46 7.46 7.46 7.46 7.46 7.46 7.46 7.46 7.46 7..46 7.46 8.46 8.46 8.46 8.46
Upward 1"3 1-3 1-4 1.5 1.5 1 '4 1.3 1.7 1.7 1.6 1'4 1.7 2.0 1.4 1"7 1"8
.1"7 1"6 1-3 1-5 1-4 1.4 1"4 1.4 1"3 1.2 1.5 1"3 1.4 1.3 1.5 1"3 1.3 1.4 1.2 1.4 1.4 1.3 1.7 1.3 2.1 1.5 1"6 1.5 1-8 1-4 1"4 1-2 1.5 1.7 1 . 6 1 '4 1.6 1.4 1.6 1.4 2.1
Downward 0-5 0-3 0-5 0.2 0.1 0.4
0 . 4 0.7 0 . 2 0.5 0.4 0.3 0.5 0.5 0.3 0.6 0-2 0-3 0-4 0.4 0-7 0 .7 0 .7 0.6 0.6 0.6 0.6 0.5 0.6 0.7 0.3 0.5 0.6 0.5 0.6 0.7 0.6 0.6 0.5 0.7 0.0 0.7 0-4 0.4 0-1 0.4 0.4 0.4 0.6 0.4 0.2 0.5 0.5 0.0 0.3 0.6 0.4
Upward 1.2 1.2 1-7 1.5 1.6 1.4 1.3 1.7 1.8 1.8 1.4 1.2 2 .0 1.6 1.8 1.8 1.6 1-7 1-5 1.7 1-4 1.4 1.3 1.3 1.2 1.3 1.5 1.3 1.5 1.4 1.6 1.2 1.2 1.3 1.3 1.4 1.4 1.3 1.6 1.5 2-1 1.5 1-7 1-6 1-6 1.5 1.5 1.3 1.4 1.7 1.7 1.6 1.7 1.6 1.5 1.4 1.6
Downward 0.7 0.7 0.5 0.1 0.3 0.1 0.5 0.7 0.6 0.5 0.5 0.5 0.3 0.4 0.4 0.5 0.2 0.2 0-3 0.4 0-8 0-8 0 .7 0.8 0.8 0.7 0.7 0.7 0.7 0.7 0.6 0.5 0.7 0.6 0.5 0.7 0.6 0.3 0.6
0 . 7 0-7 0-8 0.4 0.4 0.2 0.3 0.1 0.5 0.6 0.2 0.4 0.5 0.4 0.0 0.3 0.6 0-5
175 150 170 175 185 175 175 175 195 175 175 175 180 185 175 185 190 195 215 180 170 180 195 190 175 185 190 165 175 175 180 175 165 165 180 170 180 180 175 170 185 175 170 180 175 180 185 170 170 175 175 175 175 175 170 170 170
h. m . 12 12 10 10 10 12 10 10 10 10 12 12 10 10 11.11 10.30 11.27 11.44 10.26 11.45 10.39 12.06 10.15 10.21 10.21 11.57 11.16 11-47 11.19 11.01 11.20 11.44 11.39 11.24 11.11 10.39 12.06 10.41 10.13 11.09 10.11 10.54 10.55 11.00 10.34 10.21 10-38 10.38 10.14 10.30 10.40 10.48 10.20 10.43 10.32 10.55 11.48
6
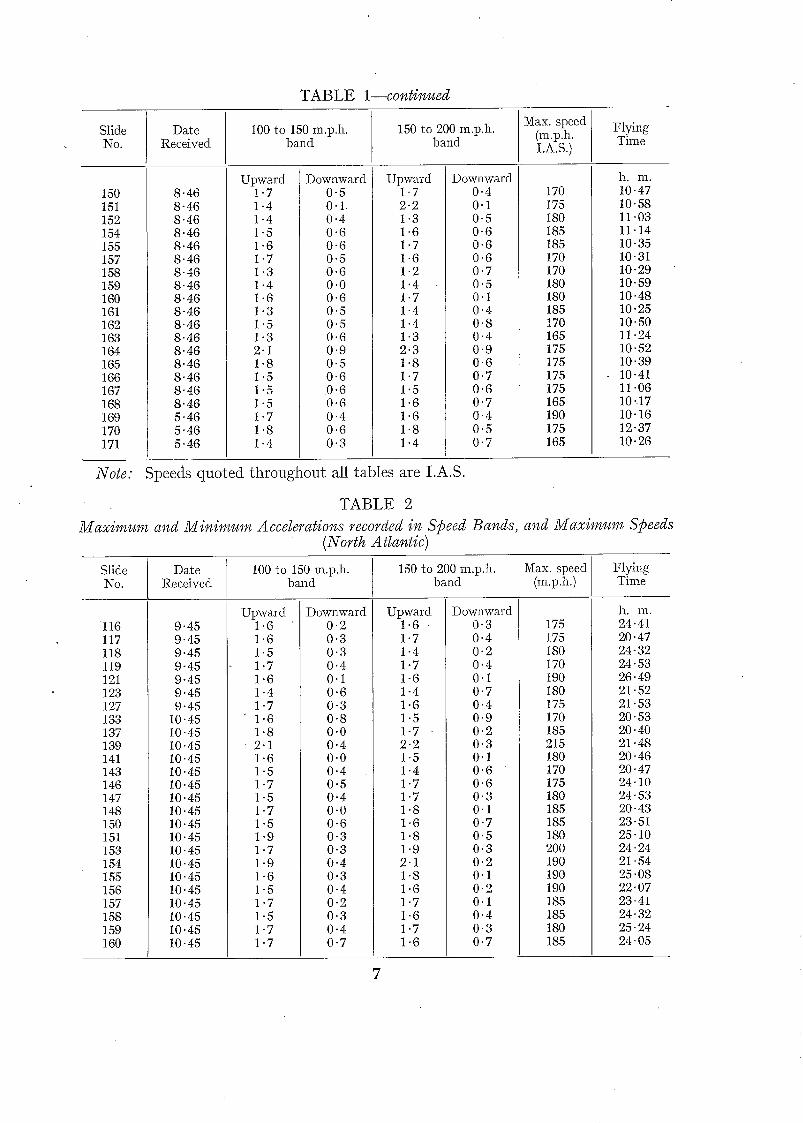
TABLE 1--continued
Slide :No.
Date Received
100 to 150 m.p.h. band
150 to 200 m.p.h. band
Max. speed (m.p.h. i.A.s)
Flying Time
150 151 152 154 155 157 158 159 160 161 162 163 164 165 166 167 168 169 170 171
8"46 8"46 8"46 8"46 8"46 8"46 8 '46 8 '46 8' 46 8"46 8 '46 8 '46 8 '46 8"46 8 '46 8 '46 8"46 5 '46 5 '46 5 '46
Upward 1.7 1-4 1-4 1-5 1-6 1.7 1.3 1.4 1.6 1.3 1.5 1.3 2.1 1.8 1.5 1.5 1.5 1.7 1.8 1.4
Downward 0.5 0 . 1 0.4 0.6 0.6 0,5 0,6 0.0 0.6 0.5 0.5 0.6 0.9 0.5 0.6 0 . 6 0.6 0.4 0.6 0.3
Upward 1.7 2.2 1.3 1.6 1.7 1.6 1.2 1.4 1.7 1.4 1-4 1.3 2.3 1.8 1.7 1.5 1.6 1.6 1.8 1.4
Downward 0"4 0"1 0"5 0.6 0-6 0-6 0-7 0-5 0.1 0"4 0"8 0.4 0"9 0"6 0"7 0-6 0"7 0"4 0"5 0"7
170 175 180 185 185 170 170 180 180 185 170 165 175 175 175 175 165 190 175 165
h. Ill. 10.47 10.58 11.03 11.14 10"35 10'31 10"29 10"59 10"48 10"25 10.50 11.24 10.52 10.39 10.41 11.06 10..17 10.16 12.37 10.26
Note: Speeds quoted throughout all tables are I.A.S.
TABLE 2 Maximum and Minimum Accelerations recorded in Speed Bands, and Maximum Speeds
(North Atlantic)
Slide Date 100 to 150 m.p.h. 150 to 200 m.p.h. 5fax. speed Flying No. Received band band (m.p.h.) Time
116 117 118 119 121 123 127 133 137 139 141 143 146 147 148 150 151 153 154 155 156 157 158 159 160
9"45 9"45 9"45 9"45 9-45 9"45 9"48
10" 45 10- 45 10"45 10" 45 10.45 10.45 1 0 . 4 5
10.45 10.45 10"45 10.45 10.45 10.45 10.45 10"45 10"45 10.45 10.45
Upward 1.6 1.6 1.5 1.7 1.6 1.4 1-7
• 1-6 1.8
2 . 1 1-6 1-5 1-7 1-5 1-7 1-5 1-9 1-7 1.9 1-6 1-5 1-7 1-5 1-7 1-7
Downward 0.2 0.3 0.3 0.4 0-1 0-6 0-3 0-8 0-0 0-4 0-0 0-4 0-5 0-4 0 .0 0 .6 0.3 0 .3 0 .4 0.3 0.4 0.2 0 .3 0 .4 0 .7
Upward 1 . 6 1.7 1-4 1-7 1-6 1-4 1-6 1-5 1-7 2.2 1.5 1.4 1.7 1.7 1.8 1.6 1.8 1.9 2.1 1.8 1.6 1.7 1.6 1.7 1.6
Downward 0-3 0-4 0-2 0-4 0.1 0.7 0 .4 0.9 0-2 0.3 0.1 0.6 0.6 0.3 0.1 0.7 0.5 0.3 0.2 0.1 0.2 0.1 0.4 0.3 0.7
175 175 180 170 190 180 175 170 185 215 180 170 175 180 185 185 180 200 190 190 190 185 185 180 185
h. 1D.. 24.41 20- 47 24- 32 24.53 26" 49 21" 52 21.53 20" 53 20" 40 21 "48 20" 46 20' 47 24.10 24' 53 20.43 23" 51 25" 10 24" 24 21.54 25.08 22.07 23' 41 24.32 25.24 24' 05
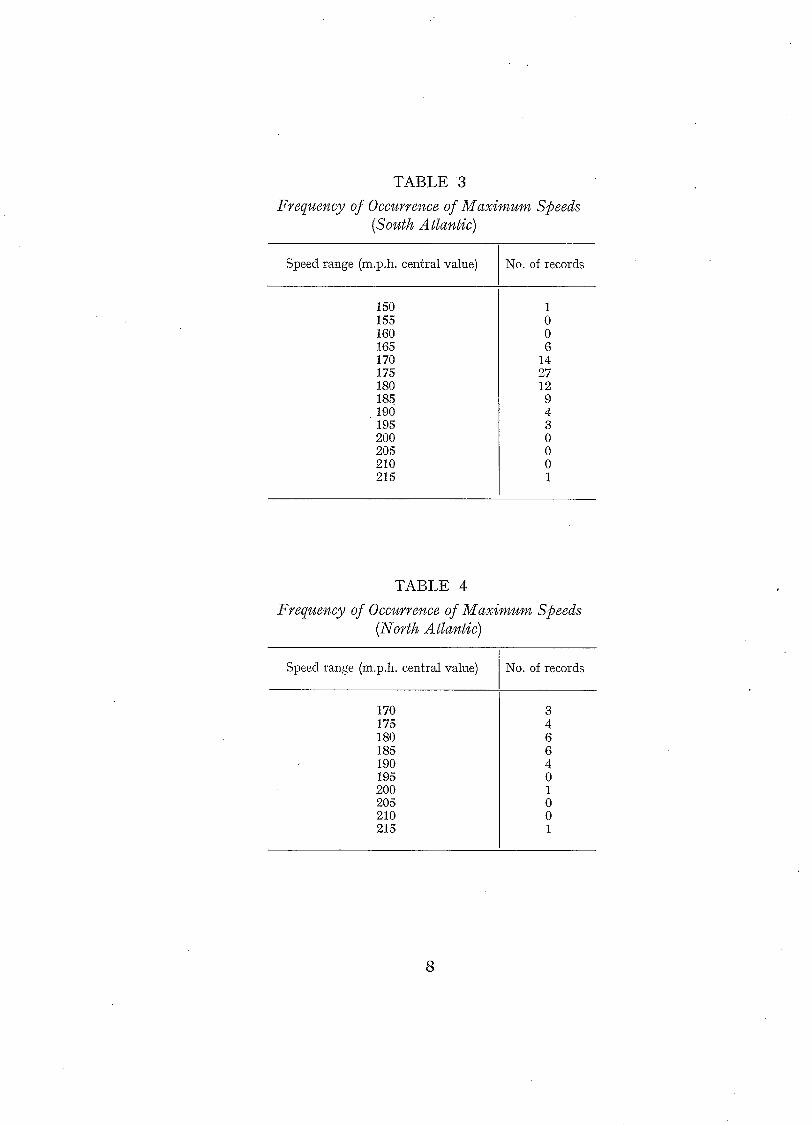
TABLE 3
Frequency of Occurrence of Maximum Speeds (South Atlantic)
Speed range (m.p.h. central value) No. of records
150 155 160 165 170 175 180 185 190 195 200 205 210 215
1 0 0 6
14 27 12 9 4 3 0 0 0 1
TABLE 4
Frequency of Occurrence of Maximum Speeds (North Atlantic)
Speed range (m.p.h. central value) No. of records
170 175 180 185 190 195 200 205 210 215
8
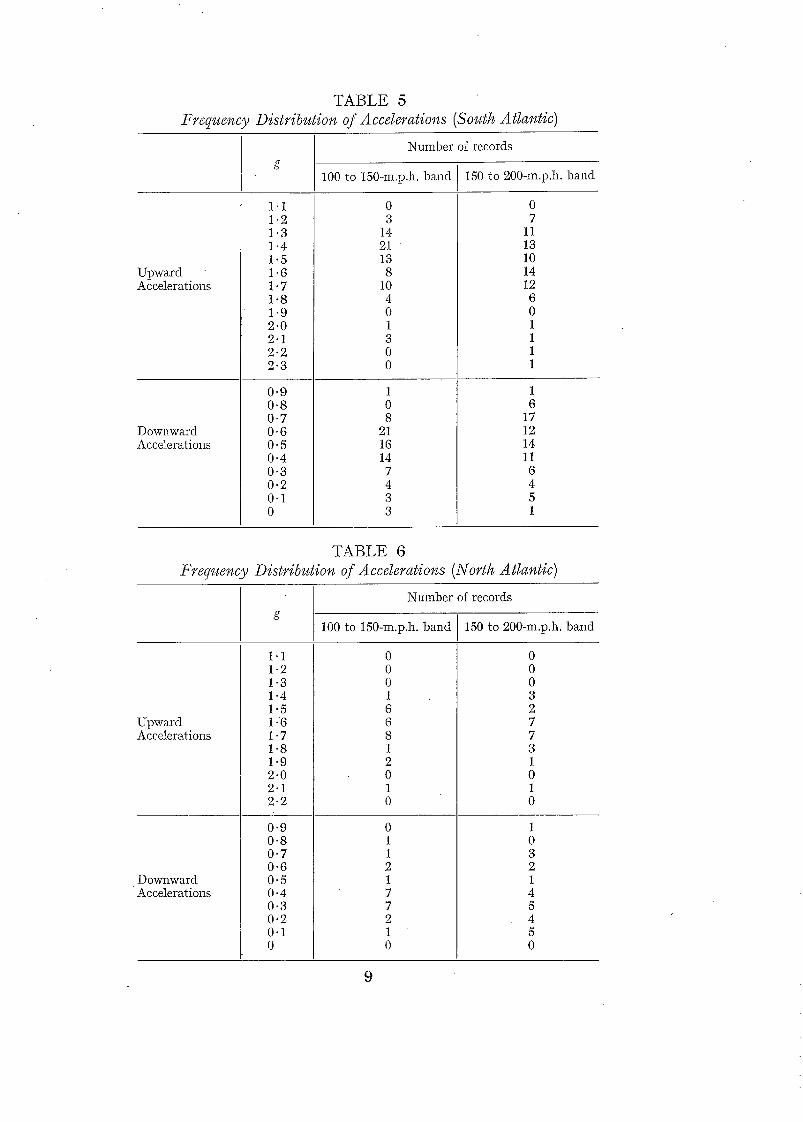
TABLE 5 Frequency Distribution of Accelerations (South Atlantic)
Upward Accelerations
Downward Accelerations
1"1 1.2 1.3 1.4 1.5 1-6 1-7 1.8 1"9 2.0 2-1 2 .2 2.3
0.9 0"8 0"7 0"6 0.5 0.4 0"3 0.2 0"1 0
Number of records
100 to 150-m.p.tl. band
0 3
14 21 13 8
io 4 0 1 3 0 0
1 0 8
21 16 14 7 4 3 3
150 to 200-m.p.h. band
0 7
11 13 10 14 12 6 0 1 1 1 1
1 6
17 12 14 11 6 4 5 1
TABLE 6 Frequency Distribution of Accelerations (North Atlantic)
Upward Accelerations
Downward Accelerat ions
1"1 1.2 1"3 1.4 1"5 1.6 1.7 1.8 1.9 2"0 2"1 2"2
0.9 0.8 0.7 0.6 0.5 0.4 0.3 0.2 0.1 0
Number of records
100 to 150-m.p.h. band
0 0 0 1 6 6 8 1 2 0 1 0
0 1 1 2 1 7 7 2 1 0
150 to 200-m.p.h. band
1 0 3 2 1 4 5 4 5 0
9
!fz
y
\
b
S, / .
• I
I I I I I I I I TRINIDAD
I
/ l
I
I
I
/ t
/
~BATHUR#T
"~+K J .
/// /NATAI..
" J - NORTH ATLANTIC P.OUT¢-.,~
f - SOUTH ATLANTI¢ -RoL. ITE5
FIG. 1. Sketch map showing routes.
/
]tO

-I
MPV,/ARD ACCELERATION5 ESTIMATED AS L IKELy TO BE EXCEEDED ONCE iN IO5 FLYING FIOLJ~5
• .
I t I J , I I i I t t J
. . . . : 2 : . . : : : " . . I " ' : : : : I : : : : : ' " I J I ~ : i u I I B i I 4 I I I I ~ . . . . . i
O~X ®®®( )@0®® ®~O@O®( eeeoeeee~ ~,e eee eeeee _oeeeo( ~e ~'! .e~ ~e
~ ( ~ )00
100~150 H.P.H. BAND 15t~,200 M.RH.BAND
S T E A D y LEVEL FLtr.,HT
~ " DO',A/N WAR D ACCELERATION,5 ESTHvIATED AS L I K E L y To BE EXCEEDED ONCE 11,4 IO 5 F'LYINq HouR5
FIG. 2.
• UPWARD AccELERATIONS ® DOWNWARD AccELERATION,5
Diagram of recorded accelerations (South Atlantic).
- I
UPWARD AccELERATION5 ESTIMATED A,5 LIKELy T ° 8E
E ~ C E ~ D E D o N C E IN IO s FLyIr',,4G HoL.IR5
I e • I m P I
i o i p ~ I
~®
®®®(
t®® ,tO0
10Or, olBO ivl. P.H. BAND i
, . ' : : , , f m D , l i D
t D I
200
151¢;o20o M.P.H. BAND I
FIG. 3.
: ;
STE.ADY LEVEL F L I q H . _ . T _ _ _
Do vv'N vv"A R O AcCE.LERATION5 ==---EBTIMATE.D A,5 LIKELY TO BE
EXCEEDED ONcE IN LoSFLyING H0UR8
LIP'WARD AccELERATIONS ® DOWNWARD ACCELERATION,5
Diagram of recorded accelerations (North Atlantic).
11
24
18
t/)
n t O
I v
0
,&
I I 150
FIG. 4.
160 V I A × I NI I,..I I'~
I
17o 180 190 200 RECORDED SPEED M.p.H. (I:A.S.)
21o
Frequency distribution of maximum recorded speeds (South Atlantic).
,?, ~X
o
Z o
FIG. 5.
I 1--
150 16o 17o 180 19o 20.0 210
Frequency distribution of maximum recorded speeds (North Atlantic).
I2
v
c~
5. ATLANTIC "( 77 RECORDS}
L4PwARD A c-C~'LERATIQN$
~ O:O-~ ! ~
~'~ ' i z.I
DOWNWARD ACCELC'RATION6
MEAN :0-46 ~ ~ 5.D:0'18
1
0 ' 9 b
~EAN:I.S3 r -
5 o:l~/,[ I ' 1 I i i
i I
6 O:O, 20
i
i I
M. ATLAMTIC L1PWA R D
AcCF-..LER ATIObt6
Ioo~,x5o M,RH. ]
Iv'~SAN: I, 6B I 5D: 0'iS
(25 IRECORD5 )
D o Vv" N,,A/A R D Acc~" g F_ RATIO N.S
N'I ~" A N 0'34- S m0"20
.,I I
I5o~,2oo M.nH, [ ~ ] ~4~AN: 1,6B I . I
SO: 0.I9 ~ i I_ ,. A ] I I
I I
N.5
FIG. 6.
~EAN0-36 S.O, ~22 f--1
o~'egc-? OY,,a'go.,osoz ov o
. . . . . . . . . . POSITION OF MEAM Distribution of m a x i m u m accelerations (in speed bands).
Ioo, ooo
lqooo
rv ] 0 1,000
,b.l IE g-
CI Z >- J
lOO
/
/ /
/ ~ / / / / /
. / j" / /
/ ' /
/
/
/ , /
/ . /
/
200 220 240 sPa~'D(~ P.H I A.S)
FIG. 7. Es t imated t ime required to exceed a given speed.
edl
¢.n
edl to
IOC
I0,000
o i
1 , 0 0 0
Y, I--
,3- Z
- -o '
.~-~ I.~ ~" . ' ~ ~,,,. ~,
/// ,,,,.)~//~ / / ' ~
/ // //// ~ / /
i // ' / / i
/ i / I /
///~ .a b -
1 0 0
10 I'SAcc~L~ 2-0 ~ 2.2 7..4 2.6 X.S
FIG. 8. Estimated time required to exceed a given value of upward acceleration.
1 0 0 , 0 0 0
I0,000
J 0 r .
1 , 0 0 0
u l
k--
t Y z >- J
I00
i i i
/ / / i / / / 11 i i / /
. / I / / /
i I / Y
U~
/.4,
10 O . z
FIG. 9.
0.2 o -0. -0 -4 - 0 ~ -~ Est imated t ime required to exceed a given value of
downward acceleration.
E. & M. No. 2633 01,C40) . . . . . . . . . . .
A.RA). Technical RepOrt . i
Publications of the Aeronautical Research Council
ANNUAL TECHNICAL REPORTS OF T H E AERONAUTICAL RESEARCH COUNCIL (BOUND VOLUMES) - -
I934-35 Voi. L Aerodynamics. Out ofprint. Vol. II. Seaplanes, Structures, Engines, Materials, etc. 4os. (4os. 8d.)
I935-36 Vol. I. Aerodynamics. 3o~. (3os. 7d.) Vol. II. Structures, Flutter, Engines, Seaplanes, etc. 3os. (3os. 7d.)
x936 Vol. I. Aerodynamics General, Performance, Airscrews, Flutter and Spinning. 4os- (4os. 9d.)
Vol. II. Stability and Control, Structures, Seaplanes, Engines, e tc . 5os. (SOS. Iod.)
I937 Vol. L Aerodynamics General, Performance, Airscrews, Flutte~ and Spinning. 4os. (4os. Iod.)
Vol. II. Stability and Control, Structures, Seaplanes, Engines, etc. 6os. (6Is.)
i938 Vol. I. Aerodynamics General, Performance, Airscrews. 5os. (Sis.) VOl. II. Stability and Control, Flutter, Structures, Seaplanes, Wind Tunnels,
Materials. 3os. (3os. 9d.)
I939 Vol. I. Aerodynamics General, Fertormance, Airscrews, Engines. 5oJ. (5os. IId.) Vol. II. Stability and Control, Flutter and Vibrat,_'on, Instruments, Structures,
Seaplanes, etc. 63s. (64s. 2d.)
x94o Aero and Hydrodynamics, Aerotoils, Airscrews, Engines, Flutter, Icing, Stability and Control, Structures, and a miscdlaneous section. 5os. (Sis.)
Certain ot/~er reports proper to t,~e I94o volume wi l l subsequently be included in a separate volume.
ANNUAL REPORTS OF T H E AERONAUTICAL RESEARCH COUNCIL-- I933-34 Is. 6d. (IS. 8d.) x934-35 Is. 6d. (Is. 8,/.)
April I, I935 to December 3x, I936. 4 s. (4 s. 4d.) I937 zs. (us. 2d.) I938 IS. 6d. (IS. 8d.)
~939-48 3s. (3 s. 2d.)
INDEX T O ALL REPORTS AND MEMORANDA PUBLISHED IN T H E ANNUAL TECHNICAL REPORTS, AND SEPARATELY--
April, I950 R. & M. No. 2600. 2s. 6d. (2s. 7½d.)
INDEXES TO T H E TECHNICAL REPORTS OF T H E AERONAUTICAL RESEARCH COUNCIL- -
December I, I 936 - - June 30, I939. July r, I939 - - June 3 o, I945. July ~, I945 - - June 30, I946. July I, I 9 4 6 - - December 3I, I946. January I, I947 - - June 30, I947.
R. & M. No. I85O. IS. 3 d. (IS. 4½d.) R. & M. No. I95o. Is. (Is. I½d.) R. & M. No. 2050. Is. (Is. I½d.) R. & M. No. 215o. ' Is. 3d. (Is. 4½d.) R. & M. Nol 2250. zs. 3d. (Is. 4½d-)
Prices in brackets include postage.
Obtainable fi'om
HER MAJESTY'S STATIONERY OFFICE York House, Kingsway, LONDON, W.C.2 429 Ox~brd Street, LONDON, W.1
P.O. Box 569, LONDON, S.~.I 13a Castle Street, EmNBURaH, 2 1 St. Andrew's Crescent, CN~DIFF 39 King Street, ~¢~NC~STER, 2 Tower Lane, BRISTOL, 1
2 Edmtind Street, BXmWN~, 3 80 Chichester Street, BELF~ST
or t h r o u g h a n y bookse l le r .
S.O. Code No. 23-2633
Related Documents