FINAL REPORT DELAWARE RIVER TAILWATERS MONITORING, FLEXIBLE FLOW MANAGEMENT PROGRAM, OCT. 1, 2007- May 31, 2011 New York State Department of Environmental Conservation Albany, NY 1223 Contributors: Norman D. McBride Jim Daley Bob Anygal Dan Zielinski Date: May 20, 2012

Welcome message from author
This document is posted to help you gain knowledge. Please leave a comment to let me know what you think about it! Share it to your friends and learn new things together.
Transcript
FINAL REPORT DELAWARE RIVER TAILWATERS MONITORING, FLEXIBLE FLOW MANAGEMENT PROGRAM, OCT. 1, 2007- May 31, 2011 New York State Department of Environmental Conservation Albany, NY 1223 Contributors: Norman D. McBride Jim Daley Bob Anygal Dan Zielinski Date: May 20, 2012

і
DELAWARE RIVER TAILWATERS MONITORING, FLEXIBLE FLOW MANAGEMENT PROGRAM, OCT. 1, 2007-MAY 31, 2011 EXECUTIVE SUMMARY Overall, the FFMP releases program was effective in maintaining flow and temperature
targets in the East Branch, West Branch, and Neversink River tailwater reaches. No thermal
stress days were recorded for the East Branch or the West Branch and only 11 (2 in 2008 and 9
in 2010) in the Neversink River. FFMP summer base flows to the West Branch were inadequate
in maintaining desirable summer water temperatures in the upper Delaware River but this was
also true of all earlier releases programs. Thermal stress days on the Delaware River for the
summers of 2008 through 2010 ranged from 0 to 25 at Lordville (RM 321) and 4 to 58 at
Callicoon (RM 303). Complaints that FFMP worsened summer water temperatures in the
Delaware River are unfounded.
Trout populations were unaffected by FFMP since it takes six years for the ages 1-5 year
classes of trout to fully reflect the releases program being evaluated. It is recommended that
future trout population studies not be a part of any short term releases program monitoring
requirements.
The FFMP releases program was not without problems. The spring of 2008 “bouncing” or
“yo-yoing” of release rates over a short time period was eliminated as procedures were
effectively implemented to avoid automatic adjustments of release rates based only on the
storage thresholds incorporated into the rule curves for FFMP. Although thermal banks were
absent when FFMP was implemented, public pressure during a 2008 heat wave resulted in a
thermal release and development of a thermal bank. Angler groups remain unhappy with the

іі
small size (1,340 cfs) of the bank and restrictions on its use. The last unresolved issue remains
the large and rapid reduction in release rates from an extended period of high flow to the base
release, usually in September or October, when a major rain event is forecasted. As a result, there
is widespread and rapid dewatering of the stream channel, primarily to the West Branch and
Delaware River, which causes stranding and mortality of aquatic invertebrates and forces
fingerling and yearling trout from the streambank edges to deeper water where they are subject
to predation by larger trout. This is a major issue that needs to be addressed.
Frequent and large summer spill mitigation releases, particularly to the West Branch, could
result in premature depletion of the coldwater (hypolimnion) volume in Cannonsville Reservoir.
Such depletion in conjunction with a late August to September heat wave could result in a major
and potentially catastrophic fish kill to the West Branch and Cannonsville Reservoir trout
populations. Consideration should be given to reducing the frequency and size of summer spill
mitigation releases to the West Branch. Furthermore, given the potentially high demands placed
on a limited quantity of cold water and the importance of this resource to both reservoir and
tailwater fisheries, completion of a rigorous quantitative assessment of the risk of a late summer
fish kill due to depletion of the Cannonsville Reservoir hypolimnion should be seriously
considered in the development of any future releases program.

INTRODUCTION The tailwater portions of the West Branch Delaware River (West Branch), East Branch
Delaware River (East Branch), Neversink River, and upper reaches of the mainstream
Delaware River comprise one of the best wild trout fisheries in New York. Stream flows on
these rivers are greatly influenced by releases from three New York City reservoirs:
Cannonsville Reservoir on the West Branch, Peptacton Reservoir on the East Branch, and
Neversink Reservoir on the Neversink River (Figure 1). These water supply reservoirs were
constructed to provide water to New York City.
The volume and timing of releases from these reservoirs were stipulated in the U.S.
Supreme Court decrees of 1931 and 1954. Modern reservoir release regulations for the
Delaware tailwaters have evolved since 1976, when the New York legislature created Article 15,
Title 8 of the New York State Environmental Conservation Law. Regulations (Part 671 of
6NYCRR) were adopted pursuant to the legislation, and the New York regulations were
subsequently incorporated into Delaware River Basin statute (DRBC Docket D-77-20-CP).
Modifications to reservoir operations must have the unanimous consent of all parties to the
Supreme Court decree. These parties are the states of Delaware, New Jersey, New York,
Pennsylvania, and New York City. The releases program currently in effect is called the
Flexible Flow Management Program (FFMP).
The FFMP for the upper Delaware River Tailwaters was implemented October 1, 2007,
and was scheduled to run through May 31, 2011, a period of 3.7 years. According to the Decree
Parties agreement establishing this program, FFMP was designed to provide safe and reliable

2
supplies of water essential to serve the needs of over 17 million people who depend on water
from the City’s Cannonsville, Pepacton and Neversink Reservoirs (City Delaware Basin
Reservoirs) and their tailwaters, and the Delaware River; to manage discharges from the City
Delaware Basin Reservoirs; to provide flows to help control temperatures in the tailwaters to
help sustain cold water fisheries; to assist in mitigating the impacts of flooding; and to provide
flows in the main stem and the Delaware Bay to help protect ecological health, support
withdrawal and non-withdrawal uses, and repel salinity.
As part of the FFMP agreement, the New York State Department of Environmental
Conservation (DEC) monitored the releases program to evaluate its effectiveness in protecting
the coldwater ecosystem below the reservoirs. This report summarizes the impact of FFMP on
summer water temperatures and trout populations.
FLEXIBLE FLOW MANAGEMENT PROGRAM
FFMP releases were determined by fixed release schedules that depend on season,
reservoir storage level, and the amount of water made available from the New York City
diversion for the program during a given year. Release schedules were developed with 0, 10, 20,
and 35 MGD of water made available. The 35 MGD release schedule (Table 1) was the standard
during this 3.7 year period of FFMP from October 1, 2007 through May 31, 2011, with the L2
storage level releases considered the normal.The L3, L4, and L5 releases occur when the
reservoir system is in drought watch, warning, and emergency, respectively. Drought watch
occurs when the combined capacity of the reservoir system declines to 40% capacity. The Ll-a,
Ll-b, and Ll-c releases, which can vary depending on time of year, generally occurs when the
combined capacity of the three reservoirs is at 95%, 90%, and under 90% respectively. See the
3
Delaware River Master home web page (http://water.usgs.gov/osw/odrm/index.html) for the
operational details concerning FFMP.
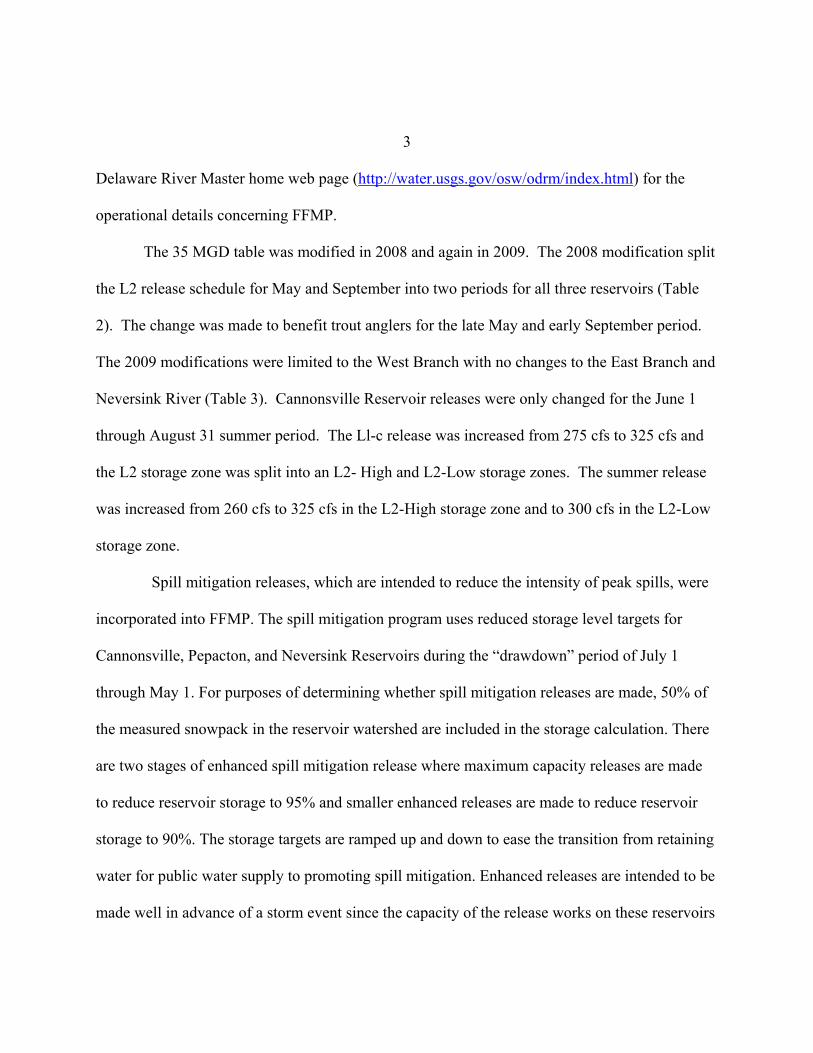
The 35 MGD table was modified in 2008 and again in 2009. The 2008 modification split
the L2 release schedule for May and September into two periods for all three reservoirs (Table
2). The change was made to benefit trout anglers for the late May and early September period.
The 2009 modifications were limited to the West Branch with no changes to the East Branch and
Neversink River (Table 3). Cannonsville Reservoir releases were only changed for the June 1
through August 31 summer period. The Ll-c release was increased from 275 cfs to 325 cfs and
the L2 storage zone was split into an L2- High and L2-Low storage zones. The summer release
was increased from 260 cfs to 325 cfs in the L2-High storage zone and to 300 cfs in the L2-Low
storage zone.
Spill mitigation releases, which are intended to reduce the intensity of peak spills, were
incorporated into FFMP. The spill mitigation program uses reduced storage level targets for
Cannonsville, Pepacton, and Neversink Reservoirs during the “drawdown” period of July 1
through May 1. For purposes of determining whether spill mitigation releases are made, 50% of
the measured snowpack in the reservoir watershed are included in the storage calculation. There
are two stages of enhanced spill mitigation release where maximum capacity releases are made
to reduce reservoir storage to 95% and smaller enhanced releases are made to reduce reservoir
storage to 90%. The storage targets are ramped up and down to ease the transition from retaining
water for public water supply to promoting spill mitigation. Enhanced releases are intended to be
made well in advance of a storm event since the capacity of the release works on these reservoirs

4
is relatively small compared to flood control structures. Enhanced releases are discontinued
when downstream flooding is forecasted to prevent an increase in downstream flood stages.
A primary objective of the FFMP was to eliminate “banks” of water that were relied
upon in earlier lower agreements to meet temperature and/or habitat flow targets. These banks
proved to be problematic for several reasons. First, meeting temperature and/or flow targets
involves combining weather forecasts, current stream conditions, models and experience to
predict how much water needs to be released to maintain flow or temperature targets days in
advance. This has proven to be very difficult and requires staff to constantly monitor stream
conditions. Second, various interested parties have different views on when and how water
should be released from a bank, often resulting in pressure on DEC to release water when
circumstances may not warrant it. Finally, water in the banks often went unused at the end of the
season and therefore did not provide any habitat benefits to the system. Although a thermal bank
was absent when FFMP was implemented, public pressure during a 2008 heat wave resulted in a
thermal release and development of a 1,340 cfs thermal bank.
THE DELAWARE TAILWATERS
Water releases from three large New York City water supply reservoirs in the Delaware
River basin are critical for maintaining trout populations in approximately 70 miles of
downstream tailwaters (Figure 1). Releases from the Neversink Reservoir are intended to
maintain trout conditions in 16 miles of Neversink River downstream to Bridgeville. Pepacton
Reservoir releases to the East Branch are designed to provide trout habitat for 17 miles

5
downstream to the confluence with the Beaver Kill. From Cannonsville Reservoir on the West
Branch, releases are intended to produce trout conditions for the entire 18 miles downstream to
Hancock as well as in an additional 18 miles of the Delaware River between Hancock and
Hankins. Each of these four rivers are described in greater detail below.
East Branch Delaware River
The East Branch downstream of Pepacton Reservoir flows for 32.1 miles before merging
with the West Branch to form the Delaware River (Figure 1). The tailwater reach extends 17
miles downriver from the dam to the confluence with the Beaver Kill. The East branch
downstream of the Beaver Kill also supports a wild trout fishery but this reach normally does not
receive any thermal benefits from the cold water releases at the Pepacton reservoir dam. The
tailwater reach will be referred to as the upper East Branch in this report.
The upper East Branch is a medium size river with an average daily flow of 387 cfs for
the 1955-2009 monitoring period at the USGS Harvard gage (USGS website). Stream flows and
summer water temperatures in the river are largely dependent on water releases from Pepacton
Reservoir. Prior to the 2007-2011 FFMP releases protocols, base releases to the upper East
Branch typically ranged from 45 to 95 cfs depending on time of year.
Summer cold water releases are intended to make the upper East Branch suitable for trout
throughout its 17.0 mile length. However, the lowermost three miles supports marginal trout
habitat as evidenced by the sparse wild trout population. Brown trout are the dominant trout
species with brook and rainbow trout present throughout the upper East Branch. The wild trout
population in portions of the upper East Branch is supplemented with the stocking of 1,500
yearling and 800 two year old brown trout annually which is equivalent to about 67 yearlings and

6
7 older fish per acre in the stocked reach. Yearling trout are stocked in the 5.1 mile reach from
the Corbett Bridge downstream to 1.5 miles below the Shinhopple Bridge. The two year old fish
are stocked in the 9.1 mile reach from Downsville downstream to 1.5 miles below the
Shinhopple Bridge. Yearling trout are stocked in the 5.1 mile reach from the Corbett Bridge
downstream to 1.5 mile below the Shinhopple Bridge. The two year fish are stocked in the 9.0
mile reach from Downsville downstream to 5.1 mile below the Shinhopple Bridge.
Trout population studies were conducted at three standardized study sites from 1993
through 1995 and again in 1996 and 2002 at one site. Trout density and biomass in the river from
1993 through 1995 average 93 trout/acre (range was 2 to 311 trout/acre) and 17.0 lbs/acre (range
was 1.4 to 44.7 lbs/acre). Trout per mile averaged 613 yearlings and older fish (range was 31 to
3,390 trout/mi) and 44 legal (≥ 12 in) fish/mile (range was 5 to 170 trout/mi). One site from this
previous study plus three new sites were sampled annually from 2004 through 2007. The trout
density and biomass from this study averaged 77 trout/acre (range was 5 to 173 trout/acre) and
37.6 lbs/acre (range was 0.4 to 105.5 lbs/acre). Trout per mile averaged 962 yearling and older
fish (range was 50 to 2,159 trout/mi) and 192 legal (≥ 12 in) fish/mi (range was 0 to 583 legal
trout/mi).
The East Branch trout fishery is managed under a 12 inch minimum size limit and a two
fish daily creel limit throughout its entire length with the trout season running from April 1
through October 15. From Shinhopple downstream, additional fishing opportunity is provided by
allowing catch and release fishing only from October 16 through November 30. Upstream of
Shinhopple to the dam, all fishing is prohibited once the regular trout season closes to protect
spawning trout. The last angler survey on the East Branch was conducted in 2006. In that survey,

7
fishing pressure on the upper East Branch totaled15,905 hours or 7,490 trips (McBride et al
2008). This effort averaged 67 hours/acre, 32 trips/acre, or 441 trips/mile. However, 42% of the
total effort occurred in the 4.1 mile downstream to Corbett reach and another 33% on the 5.7
Shinhopple to Harvard reach. Anglers averaged 0.28 trout/hour in the upper East Branch with
brown trout the dominant trout caught and creeled.
Angler diary cooperators from 2002 through 2007 had average annual trout catch rates
ranging from 0.59 to 1.21 fish/h and 0.22 to 0.72 legal (≥ 12 in) fish/h. The six year average
catch rate was 0.92 trout/h and 0.50 legal trout/h. The percentage of trout caught that were legal
size, 15 in plus, and 20 inplus averaged 54% (range was 36 to 60%), 27% (range was 9 to 35%)
and 3% (range was 1 to 5%), respectively. Wild brown trout dominated the catch (69%) followed
by hatchery brown trout (28%), brook trout (3%), and rainbow trout (1%).
West Branch Delaware River
The West Branch downstream of Cannonsville Reservoir flows for 17.7 miles before
merging with the East Branch to form the Delaware River (Figure 1). The upper 10.2 miles is
located entirely in New York while the lower 7.5 miles of river forms the state boundary
between New York and Pennsylvania. It is a large river with an average daily flow of 861 cfs for
the 1964-2009 monitoring period at the USGS Hale Eddy gage (USGS website). Stream flows
and summer water temperatures in the river are largely dependent on water releases from
Cannonsville Reservoir. Prior to the 2007-2011 FFMP releases, base releases generally ranged
from 33 to 325 cfs depending on the time of year. River Master directed releases, which NYC
typically makes to the West Branch, can exceed 1400 cfs and are frequent during a dry summer
and fall.

8
Summer cold water releases make the West Branch suitable for trout throughout its 17.7
mile length. Trout populations consist primarily of brown trout with rainbow trout also found
throughout the river. Brook trout are rare with rainbow trout more common in the border water
reach. The river supports a wild trout fishery that was last stocked in 1994. However, a small
number of hatchery brown trout from the Oquaga Creek stocking migrate downstream into the
Deposit area of the West Branch.
Trout population studies have been conducted most years since 1993 at four
standardized study sites. From 1993 through 2006, trout density and biomass in the river
averaged 59 fish/acre (range was 7 to 191 fish/acre) and 41.7 lbs/acre (range was 4.7 to 166.1
lbs/acre). Yearling and older trout per mile averaged 1,163 fish (range was 100 to 3,906
trout/mile) with 504 legal (≥12 in) fish/mile (range was 42 to 2,269 trout/mile). Trout are
generally more abundant in the upper reaches. The two study sites closest to the dam have more
trout (48 to 66 lbs/acre) than the two downriver study sites (26 to 28 lbs/acre).
The trout fishery is managed under special regulations, either catch and release with
artificial lures only (1 reach totaling 2.0 mile) or a 12 inch minimum size trout with a two fish
daily creel limit (2 reaches totaling 14.3 miles). The New York trout season opens April 1 and
closes October 15. On the reach forming the state boundary between New York and
Pennsylvania, the trout season opens the first Saturday after April 11 and closes October 15. On
the border water reach, catch and release fishing with artificial only is allowed for the entire
period outside the regular trout season. For the reach entirely in New York, all fishing is
prohibited once the trout season closes in order to protect spawning trout.

9
Although the last angler survey on the West Branch was conducted in 2006, the data
should not be considered representative due to the adverse impact of the June flood event that
year. The last representative creel survey occurred in 1999. During the 1999 creel survey, fishing
pressure on the West Branch totaled 63,972 hours or 15,123 trips for an average of 140
hours/acre, 33 trips/acre, or 928 trips/mile (McBride 2003). However angler effort is not
uniformly distributed. In the upper 4.4 mile reach, fishing pressure averaged 238 hours/acre
compared to only 110 hours/acre for the lower 11.9 miles of river. New York City prohibits
fishing in the 1.4 mile reach between the dam and the weir at Stilesville. Anglers in 1999
averaged 0.66 trout/hour with catch rates averaging 0.82 trout/hour in the upper 4.4 miles and
0.51 trout/hour in the lower 11.9 miles of river. The creel rate was a low 0.03 fish/hour. The
creeled catch was dominated by brown trout with anglers creeling an estimated 1,601 wild brown
trout, 128 hatchery brown trout, 55 reservoir brown trout, and 68 rainbow trout (McBride 2003).
Angler diary cooperators from 2002 through 2007 had average annual trout catch rates
ranging from 0.38 to 0.79 fish/h and 0.20 to 0.55 legal (≥ 12 in) fish/h. The six year average
catch rate was 0.69 trout/h and 0.45 legal trout/h. The percentage of trout caught that were legal
size, 15 in. plus, and 20 in. plus averaged 66% (range was 52 to 77%), 37% (range was 19 to
48%), and 5% (range was 1-8%), respectively. Wild brown trout dominated the catch (90%)
followed by rainbow trout (9%), brook trout (≤1%) and hatchery brown trout (≤1%).
Delaware River
The Delaware River, below the confluence of the East and West Branches flows for 321
miles before entering the Atlantic Ocean and forms the state boundary between New York and

10
Pennsylvania for the uppermost 74 miles. This very large river has an average annual daily flow
of 2,921 cfs for the 1975-2009 monitoring period at the USGS Callicoon gage (USGS website).
Summer water temperatures are strongly influenced by the warm East Branch and the volume of
cold water being released to the West Branch. At the confluence, the East Branch side of the
river can be up to 25°F warmer than the West Branch side of the river. In general, base releases
from Cannonsville Reservoir are insufficient in providing significant cold water benefits to the
Delaware River. Large River Master directed releases or thermal releases are required to provide
these cold water benefits. Originally, Callicoon was considered the downstream end of the
tailwaters but now it is Hankins which is 18 miles below the confluence of the East and West
Branches (Figure 1). However the DEC and Pennsylvania Fish and Boat Commission white
paper defines Lordville (Figure 1) as the lower boundary of good trout water under its
recommended release program.
The wild trout population is dominated by rainbow trout but brown trout are common.
Due to the Delaware River’s large size, fish sampling has been ineffective. The limited sampling
undertaken suggests that trout abundance averages 5 to 10 lbs/acre (Sanford 1992: McBride
1995) with warm water fishes such as smallmouth bass and walleye common. The river also
supports an American shad fishery in late spring. In recent years, striped bass have been
appearing in the upper river reaches.
The trout fishery is managed under a 14 inch size limit and a one fish daily limit
throughout the river. The trout season runs from the first Saturday after April 11 through October
15. Catch and release fishing for trout outside the regular trout season is permitted throughout the
river.

11
No creel survey of the entire trout reach has been conducted on the Delaware River;
however, a 2.3 mile reach by Lordville (Figure 1) was last censussed in 1999. Fishing pressure
on this reach totaled 3,722 hours or 1,149 trips (McBride 2003) which averaged 37 hours/acre,
11 trips/acre, or 500 trips/mile. These anglers averaged 0.32 trout/hour and reportedly creeled no
trout (McBride 2003).
Anglers diary cooperators from 2002 through 2007 had average annual trout catch rates
ranging from 0.25 to 0.65 fish/h and 0.19 to 0.47 legal (≥ 14 in) fish/h. The six year average
catch rate was 0.48 trout/h and 0.31 legal trout/h. The percentage of trout caught that were legal
size, 18 in. plus, and 20 in plus averaged 64% (range was 51 to 77%), 19% (range was 11 to
24%) and 4% (range was 2 to 8%). Rainbow trout dominated the catch (61%) followed by wild
brown trout (38%), brook trout (≤1%), and hatchery brown trout (≤1%).
Neversink River
The Neversink River downstream of Neversink Reservoir flows for 40.3 miles before
entering the Delaware River at Port Jervis (Figure 1). The tailwater reach extends from the dam
downstream 16.3 miles to Bridgeville. Although the trout fishery extends another 14 miles
downriver, this reach receives essentially no thermal benefits from the cold water releases at the
dam.
It is a small river with an average daily flow of 251 cfs for the 1993-2009 monitoring
period at the USGS Bridgeville gage (USGS website). Stream flows and summer water
temperatures in the tailwater reach are largely dependent on water releases from Neversink
Reservoir. Prior to the 2007-2011 FFMP releases protocol, base releases to the river ranged from
25 to 53 cfs depending on time of year.

12
The tailwater reach supports a wild trout population dominated by brown trout. Brook
trout are occasionally found while wild rainbow trout are absent. The wild trout population is
supplemented with the annual stocking of 6,500 yearling brown trout at an average rate of 116
fish/acre. In addition, a private group stocks several thousand 13 to 17 inch and larger brook,
brown and rainbow trout annually at one stocking location in the area of Avon Lodge (Angyal
2004).
The tailwater trout fishery is managed under a 9 inch minimum size limit and five fish
daily creel limit throughout its 16.3 mile length. The trout season opens April 1 and closes
October 15.
Trout population studies were conducted at three standardized site 8 to 9 times from 1992
through 2006. Trout density and biomass in the tailwater reach averaged 83 trout/acre (range
was 4 to 405 trout/acre) and 40.3 lbs/acre (range was 0.7 to 110.2 lbs/acre). Trout per mile
average 181 yearling and older fish/mile (range was 22 to 402 fish/mile) and 121 legal (≥9 in)
fish/mile (range was 0 to 339 legal fish/mile). The number of 12 inch and larger trout average 39
fish/mile (range was 0 to 95 fish/mi).
The last angler survey on the Neversink River tailwater was conducted in 2006.
In that survey, fishing pressure totaled 11,328 hours or 4,356 trips on the tailwater reach
(McBride et al 2008). Fishing effort averaged 135 hours/acre, 52 trips/acre, or 267 trips/mile.
However, angler effort was not evenly distributed. Fishing pressure was lowest on the reach
closest to the dam (26 hours/acre) and highest in the Avon Lodge reach at 291 hour/acre. Anglers
in 1999 averaged 0.67 trout/hour (range was 0.31 to 0.78 trout/hour) and 0.57 legal (≥9 in)
trout/hour (range was 0.24 to 0.64 fish/hour). Catch rates of 0.31 trout/hour were lowest near the

13
dam compared to the average of 0.70 trout/hour downstream between Woodbourne and
Bridgeville.
METHODS
Flow Measurements
Flow immediately below each reservoir (release or release plus spill) were measured and
recorded at USGS gages at Neversink, Downsville, and Stilesville and further downstream at the
habitat references sites at Bridgeville, Harvard, and Hale Eddy.
Temperature Monitoring
Thermal data were obtained from eight permanent USGS gages and 21 Onset Optic
“Stow Away” thermographs installed and maintained by DEC staff on the upper East Branch,
West Branch, Delaware River, and Neversink River. The thermographs have a resolution of
0.2°C and were set to record temperature hourly. Thermographs were placed in the deepest water
that personnel could access. All thermographs were encased in a length of heavy pipe and
chained to a stake or adjacent rock. Accuracy of the thermographs was checked against a hand
held calibrated mercury thermometer. Ideally, thermographs were placed by June 1 and removed
by September 30. However, placement and removal dates were dependent upon suitable flows.
Placement in 2009 occurred after July 1 for the West Branch, East Branch, and upper Delaware
River because of unusually high flows in late May and June.
Data analysis involved selecting the highest of the 24 hour recordings as the daily
maximum and the mean of the 24 hourly recordings as the daily average. Daily maxima and
weekly averages are presented for the summer period and compared to existing regulatory
criteria or biological standards developed from the fisheries literature (Elliot 2001)

14
Thermal stress day observations were used because they permit comparison with water
temperature data by site within the same river between years. A thermal stress day occurs when
the maximum water temperature equals or exceeds 75°F and/or the water temperature equals or
exceeds 72°F for an entire 24 hour period (Sheppard 1983). Although useful for comparative
purposes, the thermal stress day criteria defined by Sheppard (1983) was never intended to be
used as targets to define favorable temperature conditions for trout (Hulbert 1987).
Trout Population Sampling
The four upper East Branch and four West Branch study sites were sampled for trout
with a 14 foot flat bottom aluminum boat equipped with a 2500 W Honda generator in
conjunction with a Smith-Root variable pulsator. AC current was rectified to DC with voltage
typically set at 1061 volts. Anodes were of the umbrella type with four droppers per ring. The
cathode was mounted off hull in front of the boat. The three Neversink River study sites were
sampled with a 12 foot commercially manufactured (Smith-Root) electrofishing boat with a 5000
W generator and variable pulsator. With this boat, the aluminum hull was utilized as the cathode.
Voltage was typically set at 883V.
Multiple electrofishing runs were made in pools with, against, perpendicular, and at
angles to the current. All yearling and older trout were collected, measured for total length to the
nearest mm, marked with a hole punch or caudal clip, and transferred to a fish holding cage until
sampling was completed. Fish were then released in the pool where they were captured. Trout
≥305 mm (12 in) were weighed to the nearest 5 g. Scales were taken from at least 5 trout per
centimeter group except for obvious hatchery or wild yearlings. Sampling was typically
conducted from late June through August.

15
All population estimates were calculated using the Chapman version of the Petersen
mark-recapture formula (Ricker 1975):
N= M C
R
Where N = estimated population M= number of fish marked C= number of fish examined for marks R= number of recaptures (marked) in sample
Confidence intervals were calculated with the formula:
[(M+1)(C+1)(M-R)(C-R)]/[(R+1)(R+1)(R+2)]
to compute variance. The 95% confidence limits for the estimate is plus or minus two times the
square root of this variance.
Trout data from the marking and recapture effort were grouped into 1.0 inch size
groups and the percentage of fish in each group determined from the total number of fish
collected. This percentage was then multiplied by the estimated total trout population to estimate
the number of trout for each inch group. The number of wild brown trout, hatchery brown trout,
rainbow trout, and brook trout were then calculated based on their capture percentages within
each inch group. For each trout <12 inches, weight was determined from the metric length
equation (W(lbs) = L(mm)³/45454545) in the New York stocking guidelines (Engstrom-Heg
1990). This equation assumes a condition factor of 1.0. Mean weight for each inch group was
then calculated, multiplied by the estimated number in that group, and totaled to determine
biomass. The estimated population size and biomass was then divided by the study reach area to
determine trout density and pounds per acre.

16
RESULTS
WEST BRANCH
Air Temperature
The Deposit weather station in 2008, 2009 and 2010 recorded a maximum air temperature
of 94°F, 90°F, and 96°F, respectively. Temperatures 90°F or higher occurred on three days in
2008, once in 2009, and seven days in 2010. The summer (June 1- Sept. 15) of 2010 was the
warmest of the three years that FFMP was in effect. There were 37 days that summer when the
air temperature was 85°F or higher compared to 19 days in 2008 and 11 days in 2009. The
summer of 2009 was unusually cool with 49 days when the maximum air temperature was 75°F
or lower compared to 26 days in 2008 and 28 days in 2010.
Peak Flows
Peak flows at the USGS gage in Hale Eddy in 2008, 2009, and 2010 were 11,400, 8,200
and 9,150 cfs, respectively. These peak flows were low compared to the peak flow of 17,500,
21,500, and 43,400 cfs recorded in 2004, 2005 and 2006, respectively. The 2004, 2005, and 2006
peak flow events ranked fourth, second, and first since Cannonsville Reservoir became
operational in 1963.
Spill Mitigation Releases
Spill mitigation releases, ranging from 110 to 2,116 cfs, were made to the West Branch on
522 days between June 1, 2009 and May 31, 2011 (Table 4). No such releases were made
between June 1, 2008 and May 31, 2009. These releases were made most frequently during the
winter and spring quarters. The high frequency of summer spill mitigation releases in 2009
reflected the wet summer and high reservoir levels that year.
17
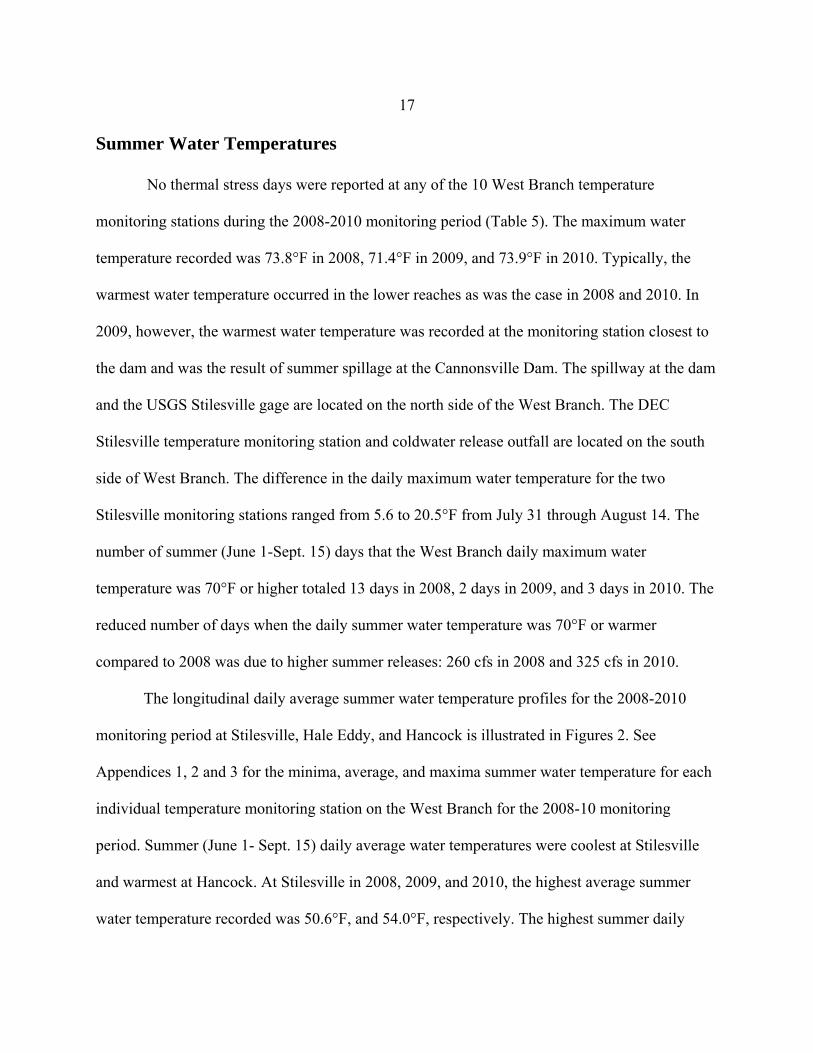
Summer Water Temperatures
No thermal stress days were reported at any of the 10 West Branch temperature
monitoring stations during the 2008-2010 monitoring period (Table 5). The maximum water
temperature recorded was 73.8°F in 2008, 71.4°F in 2009, and 73.9°F in 2010. Typically, the
warmest water temperature occurred in the lower reaches as was the case in 2008 and 2010. In
2009, however, the warmest water temperature was recorded at the monitoring station closest to
the dam and was the result of summer spillage at the Cannonsville Dam. The spillway at the dam
and the USGS Stilesville gage are located on the north side of the West Branch. The DEC
Stilesville temperature monitoring station and coldwater release outfall are located on the south
side of West Branch. The difference in the daily maximum water temperature for the two
Stilesville monitoring stations ranged from 5.6 to 20.5°F from July 31 through August 14. The
number of summer (June 1-Sept. 15) days that the West Branch daily maximum water
temperature was 70°F or higher totaled 13 days in 2008, 2 days in 2009, and 3 days in 2010. The
reduced number of days when the daily summer water temperature was 70°F or warmer
compared to 2008 was due to higher summer releases: 260 cfs in 2008 and 325 cfs in 2010.
The longitudinal daily average summer water temperature profiles for the 2008-2010
monitoring period at Stilesville, Hale Eddy, and Hancock is illustrated in Figures 2. See
Appendices 1, 2 and 3 for the minima, average, and maxima summer water temperature for each
individual temperature monitoring station on the West Branch for the 2008-10 monitoring
period. Summer (June 1- Sept. 15) daily average water temperatures were coolest at Stilesville
and warmest at Hancock. At Stilesville in 2008, 2009, and 2010, the highest average summer
water temperature recorded was 50.6°F, and 54.0°F, respectively. The highest summer daily

18
average water temperatures at Hale Eddy was 62.1°F in 2008, 60.7°F in2009, and 59.9°F in
2010. At Hancock in 2008, 2009, and 2010, the highest daily average summer water
temperatures recorded was 68.1°F, 64.7°F, and 67.6°F, respectively.
During the summer of 2008 at Stilesville, the daily average water temperature was less
than 50°F for all but two days. There were 69 days in 2009 and 28 days in 2010 when the daily
average summer water temperature at Stilesville was 50°F or higher. The number of days at Hale
Eddy where the daily average summer water temperature was above 60°F in 2008, 2009, and
2010 totaled 3, 3, and 0, respectively. At Hancock, the daily average summer water temperature
in 2008, 2009, and 2010 was 65°F or higher on 23, 0, and 11 days, respectively.
Thermal Releases
Thermal releases were made to the West Branch on two occasions to alleviate thermal
stress to trout in the Delaware River. During the summer of 2008 and 2010, thermal releases
were made over a three day period each year. Thermal releases ranged from 274 to 657 cfs in
2008 and 514 to 524 cfs in 2010 (Table 4).
Trout Populations
The four standardized sites on the West Branch were sampled in 2009 and 2010. See
Appendices 5 and 6 for the site specific trout catch and population estimates at the four West
Branch study sites in 2009 and 2010. In 2009, trout density ranged from 19 to 187 trout/acre
compared to 30 to 193 trout/acre in 2010 (Table 6). Trout biomass in 2009 ranged from 23.7 to
68.2 lbs/acre compared to 25.4 to 88.6 lbs/acre in 2010 (Table 6). Trout abundance and biomass
was highest at the Hale Eddy study site in 2009 and the Stilesville study site in 2010.

19
Compared to long term averages (Table 7), trout abundance in 2009 at Stilesville and the
No Kill study sites were comparable to the long term average, up at Hale Eddy and down at Balls
Eddy, Trout biomass in 2009 at Stilesville and Balls Eddy were comparable to the long term
averages, down at the No Kill, and up at Hale Eddy (Table 7). The trout estimate and biomass for
Hale Eddy in 2009 was a record high. In 2010, trout abundance and biomass was higher than the
long term averages for the Stilesville, No Kill, and Balls Eddy study site. Trout abundance was
down at Balls Eddy but the biomass was comparable to the long term average.
Brown trout dominated fish collections both years. In 2009 and 2010, a total of 2,417
yearling and older trout (excluding recaptures) were collected including 2,209 wild brown trout,
188 rainbow trout, 18 hatchery brown trout, and 2 brook trout. Rainbow trout generally become
more abundant down river. Brown trout comprised 95 to 96% of the trout collected at the
Stilesville study site compared to 53 to 59% at the Balls Eddy study site. Of the 2,417 trout
collected in 2009 and 2010, 24% were legal (≥ 12 in) size, 16% were 16 inches or larger, and 2%
were 20 inches or larger, (Table 8). In 2009, the Balls Eddy study site had the highest percentage
for all three size groups; however, the sample size was small (36 fish) and may not be
representative. In 2010, the No Kill study site had the highest percentage of legal size trout and
trout 16 inches or larger with the Hale Eddy study site having the highest percentage of 20 inch
or larger trout.
The abundance and size distribution of yearling and older wild brown trout collected
during this and earlier studies are shown in Figure 3. Fish under nine inches, which consists
primarily of yearling with some small two year old brown trout, generally dominated fish

20
collections in 2009 and 2010. The exception is the 2009 fish collection at Balls Eddy (Figure 3).
The record abundance of trout and brown trout at Hale Eddy in 2009 was due to very abundant
yearling brown trout which was attributed to the dense aquatic weed beds present that year.
Normally aquatic weeds are very sparse at this study site.
UPPER EAST BRANCH
Air Temperature
The Deposit weather station in 2008, 2009, and 2010 recorded a maximum air
temperature of 94°F, 90°F, and 96°F, respectively. Temperatures 90°F or higher occurred on
three days in 2008, once in 2009, and seven days in 2010. The summer (June 1-Sept 15) of 2010
was the warmest of the three summers that FFMP was in effect with 37 days that the air
temperature was 85°F or higher compared to 19 days in 2008 and 11 days in 2009. The summer
of 2009 was unusually cool with 45 days when the air temperature was 75°F or lower compared
to 26 days in 2008 and 28 days in 2010.
Peak Flows
Peak flows at the USGS gage at Harvard for 2008, 2009, and 2010 were 10,500, 4,500,
and 7,990 cfs, respectively. These peak flows were low compared to the peak flow of 20,600,
21,300, and 22,100 cfs recorded in 2004, 2005, and 2006, respectively. The 2004, 2005, and
2006 peak flow events ranked third, second, and first for the 52 year period since 1954.
Spill Mitigation Releases
Spill mitigation releases, ranging from 74 to 704 cfs, were made to the upper East Branch
on 459 days between September 1, 2008 and May 31, 2011 (Table 4). These releases were made

21
most frequently during the winter and spring quarters. The high frequency of summer spill
mitigation releases in 2009 was due to the wet summer and high reservoir levels.
Summer Water Temperatures
No thermal stress days were recorded at any of the seven upper East Branch tailwater
temperature monitoring stations during the 2008-10 summer (June1-Sept 15) monitoring period
(Table 5). This is in contrast to the 21 and 35 thermal stress days recorded at Fishs Eddy, which
is 4.6 miles downstream of the East Branch temperature monitoring site, on the lower East
Branch in 2008 and 2010, respectively (Table 5). The maximum water temperature recorded on
the Upper East Branch was 73.2°F in 2008, 67.5°F in 2009, and 73.2°F in 2010. The number of
summer days that the Upper East Branch daily maximum water temperature was 70°F or higher
totaled 12 days in 2008, 0 days in 2009, and 14 days in 2010.
The longitudinal daily average summer water temperature profiles for the 2008-10
monitoring period at Downsville, Harvard, East Branch and Fishs Eddy is illustrated in Figure 4.
See Appendices 1, 2, and 3 for the daily maxima, average, and minima water temperature for
each individual temperature monitoring station on the East Branch for the 2008-10 study period.
Average daily summer, (June 1-Sept.15) were coolest at Downsville and warmest at East Branch.
At Downsville in 2008, 2009, and 2010, the highest average daily water temperature recorded
was 50.2°F, 53.3°F, and 50.2°F, respectively. The highest summer daily average water
temperature at Harvard was 68.4°F in 2008 and 2010 and 65.4°F in 2009. At the East Branch
monitoring station, the highest summer daily average water temperature recorded in 2008, 2009,
and 2010 was 70.9°F, 63.8°F, and 70.9°F, respectively.

22
During the summer of 2008 and 2010, the daily average summer water temperature at
Downsville was less than 50°F for all but one day. In 2009, there were five days when the
average summer water temperature at Downsville was 50°F or higher. The number of days at
Harvard where the daily average summer water temperature was above 65°F in 2008, 2009,and
2010 totaled 13, 1, and 11 days, respectively. At the East Branch monitoring station, there were
28 days in 2008 and 29 days in 2010 compared to 0 days in 2009 where the daily average
summer water temperature was 65°F or higher. The daily average summer water temperature
was 70°F or higher at the East Branch monitoring site for 12 days in 2008 and 2 days in 2010.
Thermal Releases
No thermal releases were made to the upper East Branch during the FFMP study period.
Trout Populations
The four standardized sites on the Upper East Branch were sampled from 2008 through
2010. See Appendices 4, 5, and 6 for the site specific trout catch for the 2008-10 study period.
Trout density ranged from 11 to 235 fish/acre in 2008, 21 to 217 fish/acre in 2009, and 16 to 413
fish/acre in 2010 (Table 6). Trout biomass in 2008 ranged from 6.2 to 19.5 lbs/acre, 11.5 to 24.3
lbs/acre in 2009, and 12.1 to 49.0 lbs/acre in 2010 (Table 6). Trout abundance was highest for all
three years at the T28 Pool study site. The highest trout biomass was recorded in 2008 and 2010
at the T 28 study site and at the Cabin Pool study site in 2009.
Trout abundance at the Airport Pool was down for all three years compared to the long
term average and up for all three years at the T28 Pool (Table 7). At the Cabin Pool, trout
abundance was down in 2008, similar in 2009, and up in 2010 compared to the long term

23
average. At the T 22 Pool, trout abundance was down in 2008, up in 2009, and similar in 2010
compared to the long term averages.
Brown trout dominated fish collections for the 2008-10 monitoring period. During the
three year study, a total of 1,487 yearling and older trout (excluding recaptures) were collected,
including 1,470 wild brown trout, 9 hatchery brown trout, 6 rainbow trout, 1 brook trout, and 1
hatchery rainbow trout. Of the 1,487 trout collected over this three year period, 4% were legal (≥
12 in.) size, 2% were 16 inches or larger, and 1% were 20 inches or larger (Table 8). Except for
2010, the T22 study site had the highest percentage of legal size and larger trout; however, the
sample size was very small at 12 to 19 trout annually and may not be representative.
The abundance and size distribution of yearling and older wild brown trout during this
and earlier studies are shown in Figure 5. Fish under 9 inches, which consists primarily of
yearling with some small two year brown trout, dominated the 2008-10 fish collections.
NEVERSINK RIVER
Air Temperature
The Liberty weather station in 2008, 2009, and 2010 recorded maximum air temperature
of 91°F, 90°F, and 95°F, respectively. Temperatures 90°F or higher occurred on four days in
2008, once in 2009, and four days in 2010. Both the 2008 and 2010 summers (June 1-Sept.15)
were equally warm as both had four days of 90°F or higher air temperatures. In 2008, there were
15 days when summer air temperatures were 85°F or higher compared to 18 days in 2010. The
summer of 2009 was unusually cool with 72 days when the air temperature was 75°F or lower
compared to 49 days in 2008 and 40 days in 2010.

24
Peak Flows
Peak flows at the USGS gage in Bridgeville for 2008, 2009, and 2010 were 7,640, 3,860,
and 4,460 cfs, respectively. These peak flows were low compared to the record flows of 25,900,
12,500, and 11,100 recorded in 2005, 2006 and 2007. Since the gage was established in 1993, the
2005, 2006, and 2007 peak flows ranked first, second, and third, respectively.
Spill Mitigation Releases
Spill mitigation releases, ranging from 60 to 203 cfs, were made to the Neversink River on
452 days between June 1, 2009 and May 31, 2011 (Table 4). No such releases were made
between June 1, 2008 and May 31, 2009. These releases were made most frequently during the
winter and spring quarters. The high frequency of summer spill mitigation releases in 2009 was
due to the wet summer and high reservoir levels that year.
Water Temperatures
A total of 11 thermal stress days were recorded at the five Neversink River tailwater
temperature monitoring stations during the 2008-10 summer (June 1-Sept 15) monitoring period
(Table 5). Thermal stress days were only recorded at the Bridgeville monitoring station with two
in 2008 and nine in 2010 (Table 5). The maximum water temperatures recorded was 76.6°F in
2008, 72.5°F in 2009, and 77.7°F in 2010. The number of summer days that the Neversink River
daily maxima water temperature was 70°F or higher totaled 37 days in 2008, 9 days in 2009, and
53 days in 2010.
The longitudinal daily average summer water temperature profiles for the 2008-10
monitoring period at Hasbrouck, Fallsburg, and Bridgeville are illustrated in Figure 6. See
Appendices 1, 2, and 3 for the daily maxima, average, and minima water temperature for each

25
individual temperature monitoring station on the Neversink River for the 2008-10 study period.
Average daily summer water temperatures were coolest at Hasbrouck and warmest at
Bridgeville. At Hasbrouck in 2008, 2009, and 2010, the highest daily average summer water
temperature recorded was 58.7°F, 69.4°F, and 56.3°F, respectively. The highest summer daily
average water temperature at Fallsburg was 62.7 ˚F in 2008, 70.1˚F in 2009, and 62.0˚F in 2010.
At Bridgeville in 2008, 2009, and 2010, the highest daily average summer water temperature was
71.0˚F, 69.4˚F, and 72.6˚F, respectively. The warmer daily average summer water temperature in
2009 compared to the 2008 and 2010 was due to spillage at the Neversink Reservoir dam from
June 17 through June 26 and July 31 through August 4.
During the summer of 2008 and 2010 at Hasbrouck, the average daily water temperature
was less than 55˚F for all but five and two days, respectively. In 2009, the average summer water
temperature was 55˚F or higher on 33 days and 60˚F or higher for 13 days. At Fallsburg from
2008 through 2010, the number of days that the daily average summer water temperature was
60˚F or higher averaged 19 days (range was 18-20 days). The number of days at Bridgeville
when the daily average summer water temperature was 65˚F or higher totaled 44 days in 2008,
26 days in 2009, and 64 days in 2010 with only one day in 2008, 0 days in 2009, and six days in
2010 when the average daily water temperature was 70˚F or higher.
Thermal Releases
No thermal releases were made to the Neversink Tailwaters during the FFMP study period.
Fish Populations Studies
The three standardized sites on the Neversink River were sampled from 2008 through
2010. See Appendices 4, 5, and 6 for the site specific trout catch for the 2008-10 study period.

26
Trout density ranged from 45 to 165 fish/acre in 2008, 76 to 273 fish/acre in 2009, and 44 to 337
trout/acre in 2010 (Table 6). Trout biomass in 2008 ranged from 23.7 to 99.7 lbs/acre, 19.4 to
117.9 lbs/acre in 2009, and 18.6 to 141.2 lbs/acre in 2010 (Table 6). Trout abundance and
biomass for all three years was highest at the Ranch Road site.
Compared to long term averages (Table 7) trout abundance at Hasbrouck was down in
2008 and 2010 and up in 2009. At Fallsburg, trout abundance was up in 2009 and comparable in
2008 and 2010. At Ranch Road, trout abundance was up in 2009 and 2010 and comparable in
2008 to the long term averages.
Brown trout dominated fish collection for the 2008-10 monitoring period. During this
three year period, a total of 385 yearling and older trout (excluding recaptures) were collected
including 319 wild brown trout, 60 hatchery brown trout, and 6 brook trout. Of the 385 trout
collected over the three year period, 24% were 12 inches and larger, 8% were 16 inches and
larger and only 0.2% were 20 inches and larger (Table 8). The Ranch Road site had the highest
percentage of trout that were 12 inches and larger. The Hasbrouck site had the highest percentage
of trout that were 16 inches and larger. Trout 20 inches and larger were very rare with only one
individual collected at Hasbrouck in 2008. The abundance and size distribution of yearling and
older brown trout during this and earlier studies are shown in Figure 7. Fish under 9 inches,
which consists primarily of yearling with some small two year brown trout, dominated the 2008-
10 fish collections.

27
DELAWARE RIVER
Air Temperature
The Deposit weather station in 2008, 2009, and 2010, recorded maximum air temperatures
of 94°F, 90°F, and 96°F, respectively. Temperatures 90°F or higher occurred on three days in
2008, once in 2009, and seven days in 2010. The summer (June 1-Sept 15) of 2010 was the
warmest of the three years that FFMP was in effect. There were 37 days that summer when the
air temperature was 85°F or higher compared to 19 days in 2008 and 11 days in 2009.
The summer of 2009 was unusually cool with 49 days when the maximum air temperature was
75°F or lower compared to 26 days in 2008 and 28 days in 2010.
PEAK FLOWS
Peak flows at the USGS gage in Callicoon for the 2008, 2009, and 2010 were 46,200,
30,900, and 35,500 cfs, respectively. These peak flows were low compared to the peak flows of
107,000, 114,000, and 144,000 cfs recorded during 2004, 2005, and 2006, respectively. The
2004, 2005, and 2006 peak events ranked third, second, and first since the Callicoon gage was
established in 1976.
Summer Water Temperatures
The number of thermal stress days ranged from none at four temperature monitoring
stations in 2009 to 58 at Callicoon in 2010 (Table 5). Thermal stress days in 2008 and 2010
increased from the upstream to downstream monitoring sites. At Lordville (RM 321), there were
18 thermal stress days in 2008, 0 in 2009, and 25 in 2010 (Table 5). At Callicoon (RM 303), there were
45 thermal stress days in 2008, 4 in 2009, and 58 in 2010 (Table 5). The maximum summer
water temperature recorded on the upper Delaware River in 2008, 2009, and 2010 was 84.7°F,

28
78.3°F, and 86.7°F, respectively. The number of summer (June 1-Sept 15), days that the daily
maxima water temperature was 70°F or higher was 92 days in 2008, 29 days in 2009, and 78
days in 2010 at Callicoon compare to 58 days in 2008, 7 days in 2009, and 52 days in 2010 at
Lordville.
The longitudinal daily average summer water temperature profiles for the 2008-10
monitoring period at Leonards, Abe Lord, and Callicoon are illustrated in Figure 8. See
Appendices 1, 2, and 3 for the daily maxima, average, and minima water temperature for each
individual temperature monitoring station on the upper Delaware River. Summer daily average
water temperatures were coolest at Leonards and warmest at Callicoon. At Leonards in 2008,
2009, and 2010, the highest average daily summer water temperature was 74.2°F, 68.2°F, and
74.2°F, respectively. The highest summer average water temperature at Abe Lord was 77.8°F in
2008, 70.6° in 2009, and 77.4°F in 2010. At Callicoon, it was 80.7°F in 2008, 75.1°F in 2009,
and 83.1°F in 2010. At Leonard’s, the average daily water temperature was 70°F or higher for 19
days in 2008 and 20 days in 2010, but less than 70°F all summer in 2009. The number of days
at Abe Lord where the daily average summer water temperature was 70°F or higher totaled 34
days in 2008, 1 day in 2009, and 41 days in 2010 including three days in 2008 and seven days in
2010 when the daily average water temperature was 75°F or higher. At Callicoon in 2008, 2009,
and 2010, there were 68, 11, and 62 days when the daily average summer water temperature was
70°F or higher including 25, 1, and 34 days when the average daily water temperature was 75°F
or higher.

29
Thermal Releases
Thermal releases were made to the West Branch on two occasions to alleviate thermal
stress to trout in the Delaware River. During the summer of 2008 and 2010, thermal releases
were made over a three day period each year. Thermal releases in 2008 ranged from 274 to 657
cfs and 514 to 524 cfs in 2010 (Table 4).
Spill Mitigation Releases
Although spill mitigation releases are not made to the Delaware River, it does benefit from
those releases that are made to the upper East Branch and West Branch. Summer spill mitigation
releases from the West Branch are most beneficial because of the beneficial impacts to water
temperatures. See Table 4 for the seasonal frequency of spill mitigation releases to the West
Branch and East Branch.
Trout Population Studies
No trout sampling occurred on the Delaware River during the FFMP monitoring period.
DISCUSSION
FFMP represents a major improvement over Revision 1 which remains the only approved
Decree Parties releases program for the upper Delaware. As such, the Decree Parties can
mandate a return to Revision 1 anytime they choose. Revision 1 was in effect from 1983 through
1996. Since then, various experimental releases programs have been implemented with FFMP
the latest version. Figure 9 compares the original FFMP and Revision 1 releases for the West
Branch, East Branch, and the Neversink River. Except for 60 days on the West Branch between
June 15 and August 15 and 61 days in April and October on both the East Branch and Neversink
River, FFMP releases were higher than Revision 1 releases. The shortfall on the West Branch

30
under FFMP was eliminated when the summer releases were increased from 260 cfs to 325 cfs
for 2009 and 2010. Another major advantage of FFMP was that releases to all three rivers during
drought watch, warning, and emergency were increased dramatically. Prior to implementation of
FFMP, drought watch, warning, and emergency releases which varied depending on time of year
ranged from 8 to 23 cfs on the West Branch, 6 to 19 cfs on the East Branch, and 5 to 15 cfs on
the Neversink River. Under FFMP, drought releases to the West Branch were 50 to 175 cfs, 40 to
100 cfs to the East Branch, and 25 to 75 cfs to the Neversink River (Table 1).
Despite the improvement of FFMP over Revision 1, FFMP was not necessarily an
improvement over Revision 7 (May1, 2004 to Sept 30, 2007) which immediately proceeded
implementation of FFMP. Revision 7 differed from all other releases program to date in that it
was designed to maintain habitat flow targets throughout the year as follows: 225 cfs on the West
Branch at Hale Eddy, 175 cfs on the upper East Branch at Harvard, and 115 cfs on the Neversink
River at Bridgeville. Releases were adjusted daily as needed to maintain the habitat flow targets.
Additional releases could be made for thermal protection and this included the Delaware River.
In retrospect, the West Branch summer flow target should have been at least 325 cfs. The
defiencies of Revision 7 were many. It was very labor intensive because of the daily monitoring
that was required to ensure that flow and temperature targets were being met and the increased
record keeping. The 20,000 cfs Habitat Bank created annually under Revision 7 was too small to
meet both habitat and temperature targets. As a result, thermal protection was eliminated in June,
2006 to ensure that flow targets on the three tailwater rivers were met for the longest period
possible. According to Elliot et al (2005), the Habitat Bank was expected to be adequate for

31
about 50% of the historic water years. Lastly, releases could be reduced to a minimum during
periods of high run off.
An early problem of FFMP became apparent in late spring, 2008, as multiple transitions
between FFMP reservoir release rates over short periods of time resulted in large, frequent
variations in streamflow, particularly to the West Branch. This “bouncing” or “yo-yoing”
resulted in numerous complaints by anglers. Improved procedures were needed to avoid
automatic adjustment of release rates based only on the storage thresholds incorporated in the
rule curves of the FFMP. To address this issue, the Decree Parties adopted the following FFMP
modification June 1, 2009:
To more naturally affect downward or upward transitions between discharge mitigation
rates may be ramped in cooperation with NYSDEC, generally over a period of three days
at Cannonsville and Pepacton Reservoirs or two days at Neversink Reservoir.
Adoption of this modification corrected the yo-yoing that occurred in the spring of 2008 since
there has been no complaints since.
River Master directed releases, typically made to the West Branch, are common during a
relatively dry summer or fall such as experienced in 2008 and 2010. These directed releases are
necessary to maintain the flow target at Montague, New Jersey (Figure 1) and can continue into
the early and late fall. Thus, West Branch flows can be much higher then the scheduled base
releases. The problem occurs when the weather forecasts calls for heavy precipitation in the
Delaware River basin. Consequently, the directed release is rapidly reduced to the base release
three to four days prior to the projected rains. In 2010, the 800 cfs release on September 28 was
reduced to 116 cfs on September 29. This rapid reduction in release even with ramping dewaters
large sections of the West Branch and the Delaware River. When this occurs, complaints to

32
DEC, NYCDEP, and the DRBC are numerous. Water is not the issue because the River Master
may order a resumption of directed releases if the forecasted precipitation does not occur
or is much lighter than projected. This problem, which is not unique to FFMP, can be greatly
alleviated by maintaining a 300 cfs release to the West Branch. This release would keep the
entire West Branch stream channel wetted which would eliminate angler concerns about
dewatering and stranding on the trout population and invertebrate community. The Delaware
River would also benefit because the minimum flow would be about 200 cfs higher than what
now occurs under this scenario.
Dewatering impacts the trout population by forcing fingerling and yearling trout which are
normally found along the stream bank into the deeper water frequented by the larger trout.
Predation by the larger trout on these smaller trout could be significant. The overall impact on
trout populations is not known. Dewatering also impacts the aquatic invertebrate community.
Being much less mobile, invertebrates are often stranded and subject to higher than normal
mortality, which will result in reduced populations. These problems, as already stated, can be
minimized if the Directed Releases to the West Branch were maintained at 300 cfs until such
releases are no longer required. Inevitably, River Master directed releases will end with releases
returning to potentially low levels specified in the release protocols.
The biggest disadvantage of FFMP was that the 6,000 to 9,000 cfs thermal bank created
under Revision 1 that could be used to mitigate spikes in water temperatures stressful to trout
was eliminated. The absence of a thermal bank to mitigate warming water temperatures,

33
primarily in the Delaware River, is a major issue among anglers whose concerns were realized
by the June 2008 heat wave. This heat wave resulted in peak water temperatures of 81.1°F at
Lordville and 84.7°F at Callicoon with 75°F or warmer temperatures for seven consecutive days
at Lordville and 10 days at Callicoon. The mean daily water temperature was 70°F or warmer for
8 continuous days at Lordville and 11 days at Callicoon. These very stressful water temperatures
with no mitigation resulted in numerous complaints to DEC, NYCDEP, and DRBC. The growing
public pressure resulted in thermal releases of 274 to 657 cfs for the June 9-11 period. Following
this emergency thermal release, the Decree Parties agreed to establish a 1,340 cfs bank but it
could only be used when the three day average of forecasted daily maximum air temperatures for
the Hancock area exceeds 90°F and the minimum exceeds 65°F. Angling groups remain
dissatisfied because the thermal bank was too small and its use was too stringent.
Contrary to popular opinion, FFMP did not worsen the worsen summer water
temperatures in the Delaware River. Figures 10 and 11 shows the frequency of summer days that
the daily maximum and average water temperature was at least 70°F, 72°F, 75°F, and 80°F at
Lordville and Callicoon. The frequency of warm water summer water temperatures in the
Delaware River is comparable to other years when summer weather was warm. It must be
pointed out that Cannonsville base releases since 1963 provided minimal thermal benefits to the
Delaware River downstream of the confluence of the East and West Branches. Cooling benefits to the
Delaware River only occur when large River Master directed releases are made. However, the
joint NY-PA joint fisheries paper (2010) recommended improvements to FFMP for the
coldwater ecosystems in the Delaware River Tailwaters. This paper recommended a 500-525 cfs
summer releases to the West Branch which should provide good habitat and thermal protection
to the Delaware River downstream to Lordville, a distance of 10.7 miles. This “good”

34
designation means that opportunities for a coldwater fishery will be maintained. However,
elevated water temperatures will occasionally be an issue and the year-round abundance of
coldwater species are not expected to be as prevalent as in sections with the “Excellent”
protection level such as the West Branch. Summer water temperatures will occasionally exceed
a daily maximum of 75°F for short periods and water temperatures greater than 68°F occur more
frequently than for sections with “Excellent” protection.
Despite its inability to maintain suitable summer water temperatures in the upper
Delaware River, FFMP was very successful in maintaining suitable summer water temperatures
in the West Branch, upper East Branch and Neversink River tailwaters. Average daily summer
water temperatures rarely exceeded 70°F and were mostly in the mid to upper 60°F or lower. It
was 70°F or higher on the upper East Branch three times (1 in 2008 and 2 in 2010), seven times
on the Neversink River (1 in 2008 and 6 in 2010) and never on the West Branch. Another
indicator for the effectiveness of FFMP was the absence of thermal stress days on the West
Branch and upper East Branch throughout this study and for only 11 days (2 in 2008 and 9 in
2009) on the Neversink River (Table 5). In comparison, the number of thermal stress days on the
Delaware River ranged from 8 to 58 in 2008 and 2010 with the number of stress days increasing
down river (Table 5).
Frequent and large summer spill mitigation releases have the potential to deplete the
coldwater volume in one or more of the three reservoirs (Cannonsville, Pepacton, and Neversink)
prior to the end of summer. Such a scenario places both the tailwater and reservoir trout fishery
at risk due to elevated water temperatures. The reservoir and river most at risk in this situation
are Cannonsville and the West Branch. With the changing weather and climate change, it is only

35
a matter of time before there is a late August or September heat wave. Were this to occur and the
release water was 65°F, the water temperature 17 mi downriver of the dam in the Hancock area
could approach or exceed 80°F with a major or potentially catastrophic fish kill occurring. To
minimize this potential risk, summer spill mitigation releases from Cannonsville Reservoir
should be reduced. Ideally, the coldwater volume in Cannonsville Reservoir should last through
at least September 15 but preferably through September 30.
Trout Studies
Trout population studies were conducted on the upper East Branch and Neversink River
from 2008 through 2010. The West Branch trout studies were conducted in 2009 and 2010. This
data was summarized in the results section and tabulated or illustrated in the tables and figures
section. Unfortunately, the 3.7 year period that FFMP was in effect was not a long enough time
period to demonstrate positive or negative impacts to the trout populations in these three
tailwater rivers. The problem is that sampling was largely evaluating trout populations that
reflect river flows and releases in prior years. Stream trout can live up to eight years or so with a
new generation produced annually. In the upper Delaware system, the majority of desirable size
or catchable trout are three to five years old which typically range from 13 to 20 inches long.
FFMP from 2008 through 2010 has an impact on Age 0 trout in 2008, Age 0 and 1 trout in 2009,
and Ages 0, 1, and 2 trout in 2010. Due to the small size (≤ 3 inches) of Age 0 trout, the large
size of the tailwater rivers, and the boat shocker sampling methodology, a qualitative assessment
was not possible and no attempt was made to assess fingerling trout production.
To properly evaluate the impact of FFMP or any other releases program on trout
populations, the minimum time frame should be six years and preferably 10 so that the Ages 1-5
year classes fully reflect the releases program being evaluated as demonstrated in Table 9. Trout

36
older than Age 5 are rare and are not important to any evaluation unless the numbers of older fish
increase dramatically. Since year 6 is the first year that Ages 1-5 trout are fully represented, it
would be desirable to extend the study through year 10 so that there is five years of data to
properly evaluate the impact of a releases program on trout population. From this, it is obvious
that an assessment of the impact of FFMP on tailwater trout populations is not possible. Thus,
further discussion of the FFMP releases on tailwater trout populations is not warranted. It is
recommended that future trout population studies not be part of any short term releases program
monitoring requirements.
Consideration also needs to be given for modifying spill mitigation releases particularly
from Cannonsville Reservior to the West Branch. Large and frequent summer spill mitigation
releases could deplete the coldwater volume which will result in warmer water being released. If
this were to occur in conjunction with a late season (September) heat wave, the trout fishery in
both the West Branch and Cannonsville Reservoir could suffer a major and potentially
catastrophic fish kill. To minimize this risk, summer spill mitigation releases to the West Branch
need to be reduced. In any case, a thorough quantitative assessment of the risks associated with
depletion of the hypolimnion should be included in the development of any future releases
agreement with similar provisions for spill mitigation.
SUMMARY
Overall, FFMP worked well with some glitches that were addressed and corrected once
identified. It worked well enough that this FFMP provided the framework for the new releases
agreement that took effect June 1, 2011. Among angler groups, two main issues remain that need
to be addressed. The first is the small size of the thermal bank (1,340 cfs) created in 2008 and the

37
restrictions on its use. The other major issue is the large and rapid reduction in release rates from
high to the base release rate when a major rain event is forecasted which may or may not occur.
As a result, there is widespread rapid dewatering of the stream channel, primarily to the West
Branch and Delaware River, which causes stranding and mortality of aquatic invertebrates. This
dewatering also forces fingerling and yearling trout from the edges of the river to deeper water
where they are subject to increased predation by larger trout. The short and long term impacts of
these dewatering events are not known. This is an issue that needs to be addressed.
Consideration also needs to be given for modifying summer spill mitigation releases
particularly from Cannonsville Reservoir to the West Branch. Large and frequent summer spill
mitigation releases could deplete the coldwater volume which will result in warmer water being
released. If this were to occur in conjunction with a late August or September heat wave, the
trout fishery in both the West Branch and Cannonsville Reservoir could suffer a major and
potentially catastrophic fish kill. In the absence of a more rigorous quantitative risk assessment,
summer spill releases to the West Branch need to be reduced to minimize this risk.
Trout populations were unaffected by FFMP. Since it takes six years for the Ages 1-5
yearlings of trout to fully reflect the releases program being evaluated, it was recommended that
future trout population studies not be part of any short term releases program monitoring
requirements.
Literature Cited
Angyal, R.K. 2004. 1999 Neversink River creel census. NYS Department of Environmental Conservation, Region 3 Fisheries Office, New Paltz, NY: 30 pp.
Elliot, WP. 2001. Delaware River Tailwaters experimental releases monitoring, 1977- 1999.
NYS Department of Environmental Conservation, Bureau of Fisheries, Albany, NY: 74 pp.

38
Elliot, W.P, R.K. Angyal, and N.D McBride. 2005 Delaware tailwater monitoring report, 2004. NYS Department of Environmental Conservation, Bureau of Fisheries, Albany, NY: 94 pp.
Engstrom-Heg,R. 1990. Guidelines for stocking trout streams in New York State. NYS
Department of Environmental Conservation, Bureau of Fisheries, Albany, NY: 107 pp.
Hulbert, P.J. 1987. Impacts of drought conditions on selected fishery resources in the upper Delaware River basin in 1995- an overview. NYS Department of Environmental Conservation, Bureau of Fisheries, Albany, NY: 37 pp.
McBride, N.D, R. Angyal, D. Zielinski, R. Klosowski, R. Bode, and W. Elliot, 2008. Draft:
Final report Delaware River tailwater monitoring. NYS Department of Environmental Conservation, Region 4 Fishereies Office,Stamford, NY: 99 pp
McBride, N.D. 2003 Delaware Tailwaters creel census. Federal Aid Project NY FA-5-R
(Final report for Job 201). NYS Department of Environmental Conservation, Region 4 Fisheries Office, Stamford, NY: 68 pp.
______. 1995. Summary of 1993 and 1994 trout population studies on the upper Delaware Tailwater. NYS Department of Environmental Conservation, Region 4 Fisheries Office, Stamford, NY: 45 pp.
New York State Department of Environmental Conservation and the Pennsylvania Fish and
Boat Commission, 2010. Recommend improvements of the Flexable Flow Management program for coldwater ecosystem protection in the Delaware River tailwaters. New York State Department of Conservation, Bureau of Fisheries, Albany, NY: 36 pp.
Ricker, W.E. 1975. Computation and interpretation of biological statistics of fish
populations. Fisheries Research Board of Canada. Bulletin 119: 382 pp.
Sanford, D.K. 1992. A fishery management plan for the upper Delaware Tailwaters. NYS Department of Environmental Conservation, Region 4 Fisheries Office, Stamford, NY: 89 pp.
Sheppard, J.D. 1983. New York Reservoir releases monitoring and evaluation program:
summary report. NYS Department of Environmental Conservation, Bureau of Fisheries, Albany, NY: 151 pp.

Figure 1: Map of the upper Delaware tailwaters.

0
10
20
30
40
50
60
70
0
2,000
4,000
6,000
8,000
10,000
1-Jun 8-Jun 15-Jun 22-Jun 29-Jun 6-Jul 13-Jul 20-Jul 27-Jul 3-Aug 10-Aug 17-Aug 24-Aug 31-Aug 7-Sep 14-Sep 21-Sep 28-Sep 5-Oct 12-Oct
Tem
pera
ture
(°F)
2008
Flow
(CFS)
0
10
20
30
40
50
60
70
0
2,000
4,000
6,000
8,000
10,000
1-Jun 8-Jun 15-Jun 22-Jun 29-Jun 6-Jul 13-Jul 20-Jul 27-Jul 3-Aug 10-Aug 17-Aug 24-Aug 31-Aug 7-Sep 14-Sep 21-Sep 28-Sep 5-Oct 12-Oct
Tem
pera
ture
(°F)
Flow
(CFS
)
2009
0
10
20
30
40
50
60
70
0
2,000
4,000
6,000
8,000
10,000
1-Jun 8-Jun 15-Jun 22-Jun 29-Jun 6-Jul 13-Jul 20-Jul 27-Jul 3-Aug 10-Aug 17-Aug 24-Aug 31-Aug 7-Sep 14-Sep 21-Sep 28-Sep 5-Oct 12-Oct
Tem
pera
ture
(°F)
Flow
(CFS
)
2010
flow @ Hale Eddy flow @ Stilesville Temperature @ Hancock Temperature @ Hale Eddy Temperature @ Stilesville
Figure 2: Longitudinal summer daily average water temperature profile on the West Branch at Stilesville, Hale Eddy, and Hancock along with daily average flows at Hale Eddy and Stilesville, 2008-2010.

0
50
100
150
200
250
1993 1994 1995 1996 1997 1998 1999 2000 2001 2002 2003 2004 2005 2006 2007 2008 2009 2010
Fish
/acr
eStilesville
2.1 mi below dam
16+ in
13-15 in
9-12 in
< 9 in
0
20
40
60
80
100
120
1993 1994 1995 1996 1997 1998 1999 2000 2001 2002 2003 2004 2005 2006 2007 2008 2009 2010
Fish
/acr
e
No Kill3.9 mi below dam
16+ in13-15 in9-12 in< 9 in
0
20
40
60
80
100
120
140
160
180
200
1993 1994 1995 1996 1997 1998 1999 2000 2001 2002 2003 2004 2005 2006 2007 2008 2009 2010
Fish
/acr
e
Hale Eddy7.9 mi below dam
16+ in
13-15 in
9-12 in
< 9 in
0
10
20
30
40
50
60
70
1993 1994 1995 1996 1997 1998 1999 2000 2001 2002 2003 2004 2005 2006 2007 2008 2009 2010
Fish
/acr
e
Balls Eddy12.7 mi below dam
16+ in
13-15 in
9-12 in
< 9 in
Figure 3: Abundance of yearling and older wild brown trout by size group at four West Branch study sites, 1993-2010. Note: vertical scale is different for each graph.

0
10
20
30
40
50
60
70
80
0
2,000
4,000
6,000
8,000
10,000
1-Jun 8-Jun 15-Jun 22-Jun 29-Jun 6-Jul 13-Jul 20-Jul 27-Jul 3-Aug 10-Aug 17-Aug 24-Aug 31-Aug 7-Sep 14-Sep 21-Sep 28-Sep
Flow
(CFS
)
2008
flow @ Harvard flow @ Downsville Temperature @ Fishes Eddy
Temperature @ East Branch Temperature @ Harvard Temperature @ Downsville
0
10
20
30
40
50
60
70
80
0
2,000
4,000
6,000
8,000
10,000
1-Jun 8-Jun 15-Jun 22-Jun 29-Jun 6-Jul 13-Jul 20-Jul 27-Jul 3-Aug 10-Aug 17-Aug 24-Aug 31-Aug 7-Sep 14-Sep 21-Sep 28-Sep
Tem
pera
ture
(°F)
Flow
(CFS
)
2009
0
10
20
30
40
50
60
70
80
0
2,000
4,000
6,000
8,000
10,000
1-Jun 8-Jun 15-Jun 22-Jun 29-Jun 6-Jul 13-Jul 20-Jul 27-Jul 3-Aug 10-Aug 17-Aug 24-Aug 31-Aug 7-Sep 14-Sep 21-Sep 28-Sep
Tem
pera
ture
(°F)
Flow
(CFS
)
2010
Tem
pera
ture
(°F)
Figure 4: Longitudinal summer daily average water temperature profile on the East Branch at Downsville, Harvard, East Branch, and Fishs Eddy along with daily average flows at Downsville and Harvard, 2008-10.

0
50
100
150
200
250
300
350
400
450
500
1993 1994 1995 1996 1997 1998 1999 2000 2001 2002 2003 2004 2005 2006 2007 2008 2009 2010
Fish
/acr
eAirport Pool
4.2 mi below dam
16+ in
13-15 in
9-12 in
< 9 in
0
50
100
150
200
250
300
350
400
450
1993 1994 1995 1996 1997 1998 1999 2000 2001 2002 2003 2004 2005 2006 2007 2008 2009 2010
Fish
/acr
e
T28 Pool6.3 mi below dam
16+ in
13-15 in
9-12 in
< 9 in
0
50
100
150
200
250
300
199319941995199619971998199920002001200220032004200520062007200820092010
Fish
/acr
e
Cabin Pool9.9 mi below dam
16+ in
13-15 in
9-12 in
< 9 in
0
5
10
15
20
25
1993 1994 1995 1996 1997 1998 1999 2000 2001 2002 2003 2004 2005 2006 2007 2008 2009 2010
Fish
/acr
e
T22 Pool14.9 mi below dam
16+ in
13-15 in
9-12 in
< 9 in
Figure 5: Abundance of yearling and older wild brown trout by size group at four East Branch study sites, 1993-2011. Note: vertical scale different on each graph.

0
10
20
30
40
50
60
70
80
0
1,000
2,000
3,000
4,000
1-Jun 8-Jun 15-Jun 22-Jun 29-Jun 6-Jul 13-Jul 20-Jul 27-Jul 3-Aug 10-Aug 17-Aug 24-Aug 31-Aug 7-Sep 14-Sep 21-Sep 28-Sep 5-Oct
Tem
pera
ture
(°F)
Flow
(CFS
)
2008
flow @ Bridgeville flow @ NeversinkAverage temperature @ Bridgeville Average temperature @ above FallsburgAverage temperature @ Hasbrouck
0
10
20
30
40
50
60
70
80
0
1,000
2,000
3,000
4,000
1-Jun 8-Jun 15-Jun 22-Jun 29-Jun 6-Jul 13-Jul 20-Jul 27-Jul 3-Aug 10-Aug 17-Aug 24-Aug 31-Aug 7-Sep 14-Sep 21-Sep 28-Sep 5-Oct
Tem
pera
ture
(°F)
Flow
(CFS
)
2009
0
10
20
30
40
50
60
70
80
0
1,000
2,000
3,000
4,000
1-Jun 8-Jun 15-Jun 22-Jun 29-Jun 6-Jul 13-Jul 20-Jul 27-Jul 3-Aug 10-Aug 17-Aug 24-Aug 31-Aug 7-Sep 14-Sep 21-Sep 28-Sep 5-Oct
Tem
pera
ture
(°F)
Flow
(CFS
)
2010
Figure 6: Longitudinal summer average water temperature profile on the Neversink River at Bridgeville, Fallsburg, and Hasbrouck along with daily average flows at Bridgeville and Neversink just below the dam, 2008-10.

0
50
100
150
200
250
300
350
400
450
1992199319941995199619971998199920002001200220032004200520062007200820092010
Fish
/acr
eHasbrouck
2.8 mi below dam
16+ in
13-15 in
9-12 in
< 9 in
0
20
40
60
80
100
120
140
19921993 19941995 19961997 19981999 20002001 20022003 20042005 20062007 20082009 2010
Fish
/acr
e
Fallsburg8.0 mi below dam
16+ in
13-15 in
9-12 in
< 9 in
0
50
100
150
200
250
300
350
1992 1993 1994 1995 1996 1997 1998 1999 2000 2001 2002 2003 2004 2005 2006 2007 2008 2009 2010
Fish
/acr
e
Ranch Road12.9 mi below dam
16+ in
13-15 in
9-12 in
< 9 in
Figure 7: Size distribution of wild brown trout collected from three locations on the Neversink River, 1993-2010.

0
10
20
30
40
50
60
70
80
90
0
2,000
4,000
6,000
8,000
10,000
1-Jun 8-Jun 15-Jun 22-Jun 29-Jun 6-Jul 13-Jul 20-Jul 27-Jul 3-Aug 10-Aug 17-Aug 24-Aug 31-Aug 7-Sep 14-Sep 21-Sep 28-Sep
Tem
pera
ture
(°F)
Flow
(CFS
)
2008
0
10
20
30
40
50
60
70
80
0
4,000
8,000
12,000
16,000
20,000
1-Jun 8-Jun 15-Jun 22-Jun 29-Jun 6-Jul 13-Jul 20-Jul 27-Jul 3-Aug 10-Aug 17-Aug 24-Aug 31-Aug 7-Sep 14-Sep 21-Sep 28-Sep
Tem
pera
ture
(°F)
Flow
(CFS
)
2009
flow @ Callicoon flow @ Lordville flow @ StilesvilleTemperature @ Callicoon Temperature @ Abe Lord Temperature @ LeonardsTemperature @ Hancock
0
10
20
30
40
50
60
70
80
90
0
2,000
4,000
6,000
8,000
10,000
1-Jun 8-Jun 15-Jun 22-Jun 29-Jun 6-Jul 13-Jul 20-Jul 27-Jul 3-Aug 10-Aug 17-Aug 24-Aug 31-Aug 7-Sep 14-Sep 21-Sep 28-Sep
Tem
pera
ture
(°F)
Flow
(CFS
)
2010
Figure 8: Longitudinal summer daily average temperature profile on the West Branch at Han- cock and Leonards Abe Lord, and Callicoon on the Delaware River along with the daily average flows at Stilesville on the West Branch and Lordville and Callicoon on the Delaware River, 2008-2010.

0
50
100
150
200
250
300
350
1 19 37 55 73 91 109 127 145 163 181 199 217 235 253 271 289 307 325 343
CFS
Rel
ease
Julian Days
West Branch Base Releases
Rev 1
FFMP
0
20
40
60
80
100
120
140
160
1 19 37 55 73 91 109 127 145 163 181 199 217 235 253 271 289 307 325 343 361
CFS
Rel
ease
Julian Days
East Branch Base Releases
Rev 1
FFMP
0
20
40
60
80
100
120
1 19 37 55 73 91 109 127 145 163 181 199 217 235 253 271 289 307 325 343 361
CFS
Rel
ease
Julian Days
Neversink River Base Releases
Rev 1
FFMP
Figure 9: Comparison of Revision 1 and the original FFMP base flow releases from Cannonsville, Pepacton, and Neversink Reservoirs.
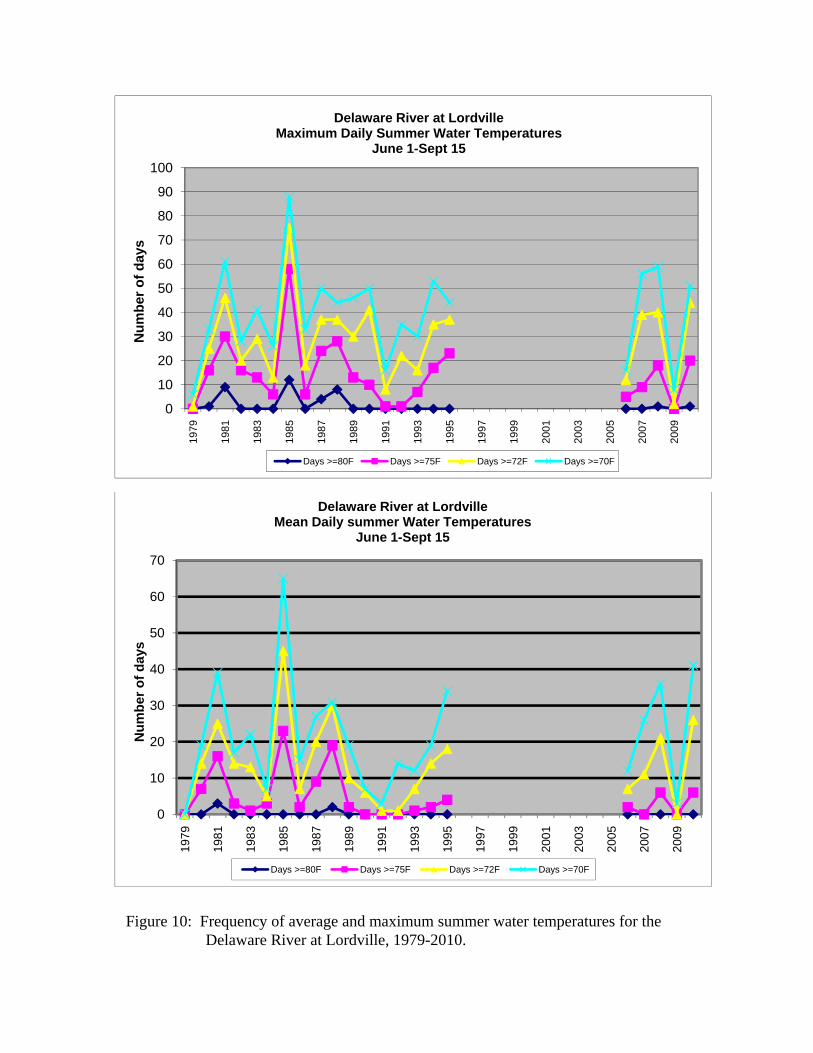
0
10
20
30
40
50
60
70
80
90
100
1979
1981
1983
1985
1987
1989
1991
1993
1995
1997
1999
2001
2003
2005
2007
2009
Num
ber o
f day
sDelaware River at Lordville
Maximum Daily Summer Water TemperaturesJune 1-Sept 15
Days >=80F Days >=75F Days >=72F Days >=70F
0
10
20
30
40
50
60
70
1979
1981
1983
1985
1987
1989
1991
1993
1995
1997
1999
2001
2003
2005
2007
2009
Num
ber o
f day
s
Delaware River at LordvilleMean Daily summer Water Temperatures
June 1-Sept 15
Days >=80F Days >=75F Days >=72F Days >=70F
Figure 10: Frequency of average and maximum summer water temperatures for the Delaware River at Lordville, 1979-2010.

0
10
20
30
40
50
60
70
80
90
100N
umbe
r of d
ays
Delaware River at CallicoonMaximum Daily Summer Water Temperatures
June1-Sept 15
Days >=80F Days >=75F Days >=72F Days >=70F
0
10
20
30
40
50
60
70
80
Num
ber o
f Day
s
Delaware River at CallicoonMean Daily Summer Water Temperatures
June 1-Sept 15
Days >=80F Days >=75F Days >=72F Days >=70F
Figure 11: Frequency of mean and maximum summer water temperatures for the Delaware River at Callicoon, 1979-2010.

Table 1: Original schedule of FFMP releases (cfs) from Cannonsville, Pepacton, and Neversink Reservoirs with 35 MGD available. Effective date Oct 1, 2007.
SpringCannonsville Dec 1 - Apr 1 - May 1 - Jun 1 - Jun 16 - Jul 1 - Sep 1 - Oct 1 -Storage Zone Mar 31 Apr 30 May 31 Jun 15 Jun 30 Aug 31 Sep 30 Nov 30
L1-a 1500 1500 * * 1500 1500 1500 1500L1-b 250 * * * * 350 275 250L1-c 110 110 225 275 275 275 140 110L2 80 80 215 260 260 260 115 80L3 70 70 100 175 175 175 95 70L4 55 55 75 130 130 130 55 60L5 50 50 50 120 120 120 50 50
SpringPepacton Dec 1 - Apr 1 - May 1 - Jun 1 - Jun 16 - Jul 1 - Sep 1 - Oct 1 -
Storage Zone 31-Mar 30-Apr 20-May 15-Jun 30-Jun 31-Aug 15-Sep 30-NovL1-a 700 700 * * 700 700 700 700L1-b 185 * * * * 250 200 185L1-c 85 85 120 150 150 150 100 85L2 65 65 110 140 140 140 85 60L3 55 55 80 100 100 100 55 55L4 45 45 50 85 85 85 40 40L5 40 40 40 80 80 80 30 30
SpringNeversink Dec 1 - Apr 1 - May 1 - Jun 1 - Jun 16 - Jul 1 - Sep 1 - Oct 1 -
Storage Zone 31-Mar 30-Apr 20-May 15-Jun 30-Jun 31-Aug 15-Sep 30-NovL1-a 190 190 * * 190 190 190 190L1-b 100 * * * * 125 85 95L1-c 65 65 90 110 110 110 75 60L2 45 45 85 100 100 100 70 45L3 40 40 50 75 75 75 40 40L4 35 35 40 60 60 60 30 30L5 30 30 30 55 55 55 25 25
*Storage zone does not apply during this period. Releases will be made in accordance with zone L1-c.
Winter Summer Fall
Winter Summer Fall
Winter Summer Fall

Table 2: Modified FFMP with split May and September schedule of releases (cfs) with 35 MGD available from Cannonsville, Pepacton, and Neversink Reservoirs. Effective date December 10, 2008.
Cannonsville Dec 1 - Apr 1 - May 1 - May 21 - Jun 1 - Jun 16 - Jul 1 - Sep 1 - Sep 16 - Oct 1 -Storage Zone Mar 31 Apr 30 May 20 May 31 Jun 15 Jun 30 Aug 31 Sep 15 Sep 30 Nov 30
L1-a 1500 1500 * * * 1500 1500 1500 1500 1500L1-b 250 * * * * * 350 300 275 250L1-c 110 110 200 250 275 275 275 275 140 110L2 80 80 190 240 260 260 260 260 115 80L3 70 70 100 100 175 175 175 95 95 70L4 55 55 75 75 130 130 130 55 55 60L5 50 50 50 50 120 120 120 50 50 50
Pepacton Dec 1 - Apr 1 - May 1 - May 21 - Jun 1 - Jun 16 - Jul 1 - Sep 1 - Sep 16 - Oct 1 -Storage Zone 31-Mar 30-Apr 20-May 31-May 15-Jun 30-Jun 31-Aug 15-Sep 30-Sep 30-Nov
L1-a 700 700 * * * 700 700 700 700 700L1-b 185 * * * * * 250 200 200 185L1-c 85 85 110 130 150 150 150 150 100 85L2 65 65 100 125 140 140 140 140 85 60L3 55 55 80 80 100 100 100 55 55 55L4 45 45 50 50 85 85 85 40 40 40L5 40 40 40 40 80 80 80 30 30 30
Neversink Dec 1 - Apr 1 - May 1 - May 21 - Jun 1 - Jun 16 - Jul 1 - Sep 1 - Sep 16 - Oct 1 -Storage Zone 31-Mar 30-Apr 20-May 31-May 15-Jun 30-Jun 31-Aug 15-Sep 30-Sep 30-Nov
L1-a 190 190 * * * 190 190 190 190 190L1-b 100 * * * * * 125 125 85 95L1-c 65 65 85 100 110 110 110 110 75 60L2 45 45 75 90 100 100 100 100 70 45L3 40 40 50 50 75 75 75 40 40 40L4 35 35 40 40 60 60 60 30 30 30L5 30 30 30 30 55 55 55 25 25 25
Winter Spring Summer Fall
Winter Spring Summer Fall
Winter Spring Summer Fall

Table 3: Modified FFMP with increased L1-c, L2-High, and L2-Low Cannonsville Reservoir releases and no changes for Pepacton and Neversink Reservoirs. Effective date June 1, 2009.
Cannonsville Dec 1 - Apr 1 - May 1 - May 21 - Jun 1 - Jun 16 - Jul 1 - Sep 1 - Sep 16 - Oct 1 -Storage Zone Mar 31 Apr 30 May 20 May 31 June 15 Jun 30 Aug 31 Sep 15 Sep 30 Nov 30
L1-a 1500 1500 * * * 1500 1500 1500 1500 1500L1-b 250 * * * * * 350 275 275 250L1-c 110 110 200 250 325 325 325 275 140 110
L2-High 80 80 190 240 325 325 325 260 115 80L2-Low 80 80 190 240 300 300 300 260 115 80
L3 70 70 100 100 175 175 175 95 95 70L4 55 55 75 75 130 130 130 55 55 60L5 50 50 50 50 120 120 120 50 50 50
Pepacton Dec 1 - Apr 1 - May 1 - May 21 - Jun 1 - Jun 16 - Jul 1 - Sep 1 - Sep 16 - Oct 1 -Storage Zone 31-Mar 30-Apr 20-May 31-May 15-Jun 30-Jun 31-Aug 15-Sep 30-Sep 30-Nov
L1-a 700 700 * * * 700 700 700 700 700L1-b 185 * * * * * 250 200 200 185L1-c 85 85 110 130 150 150 150 150 100 85
L2-H/L 65 65 100 125 140 140 140 140 85 60L3 55 55 80 80 100 100 100 55 55 55L4 45 45 50 50 85 85 85 40 40 40L5 40 40 40 40 80 80 80 30 30 30
Neversink Dec 1 - Apr 1 - May 1 - May 21 - Jun 1 - Jun 16 - Jul 1 - Sep 1 - Sep 16 - Oct 1 -Storage Zone 31-Mar 30-Apr 20-May 31-May 15-Jun 30-Jun 31-Aug 15-Sep 30-Sep 30-Nov
L1-a 190 190 * * * 190 190 190 190 190L1-b 100 * * * * * 125 125 85 95L1-c 65 65 85 100 110 110 110 110 75 60
L2-H/L 45 45 75 90 100 100 100 100 70 45L3 40 40 50 50 75 75 75 40 40 40L4 35 35 40 40 60 60 60 30 30 30L5 30 30 30 30 55 55 55 25 25 25
Summer Fall
Winter Spring Summer Fall
Winter Spring Summer Fall
Winter Spring

Table 4: Summary of FFMP thermal, directed, and spill mitigation releases (CFS) from Cannonsville, Pepacton, and Neversink Reservoirs, 2008‐11.
Thermal Releases Directed Releases Spill Mitigation ReleasesDays Min Max Days Min Max Days Min Max
Cannonsville Reservoir Made Release Release Average Made Release Release Average Made Release Release Average2008 Summer 6/1‐8/31 3 274 657 458 46 268 989 5802008 Fall 9/1‐11/30 38 144 982 6402009 Winter 12/1‐2/282009 Spring 3/1‐5/31
2009 Summer 6/1‐8/31 84 320 1505 9162009 Fall 9/1‐11/30 18 374 569 464 20 357 8552010 Winter 12/1‐2/28 76 173 2116 10552010 Spring 3/1‐5/31 60 110 1504 820
2010 Summer 6/1‐8/31 3 514 524 520 46 343 1293 748 16 348 419 4102010 Fall 9/1‐11/30 26 463 1129 842 91 115 1129 3582011 Winter 12/1‐2/28 90 195 1505 5562011 Spring 3/1‐5/31 85 186 1510 975
Pepacton Reservoir2008 Summer 6/1‐8/312008 Fall 9/1‐11/30 6 272 285 2822009 Winter 12/1‐2/282009 Spring 3/1‐5/31
2009 Summer 6/1‐8/31 84 141 704 3582009 Fall 9/1‐11/30 6 272 285 2832010 Winter 12/1‐2/28 89 85 701 4862010 Spring 3/1‐5/31 60 85 295 128
2010 Summer 6/1‐8/312010 Fall 9/1‐11/30 49 84 88 852011 Winter 12/1‐2/28 90 74 206 1352011 Spring 3/1‐5/31 81 83 702 362
Neversink Reservoir2008 Summer 6/1‐8/312008 Fall 9/1‐11/302009 Winter 12/1‐2/282009 Spring 3/1‐5/31
2009 Summer 6/1‐8/31 84 110 190 1292009 Fall 9/1‐11/302010 Winter 12/1‐2/28 79 65 203 1442010 Spring 3/1‐5/31 58 65 101 85
2010 Summer 6/1‐8/312010 Fall 9/1‐11/30 49 60 63 602011 Winter 12/1‐2/28 90 65 190 932011 Spring 3/1‐5/31 92 63 190 111
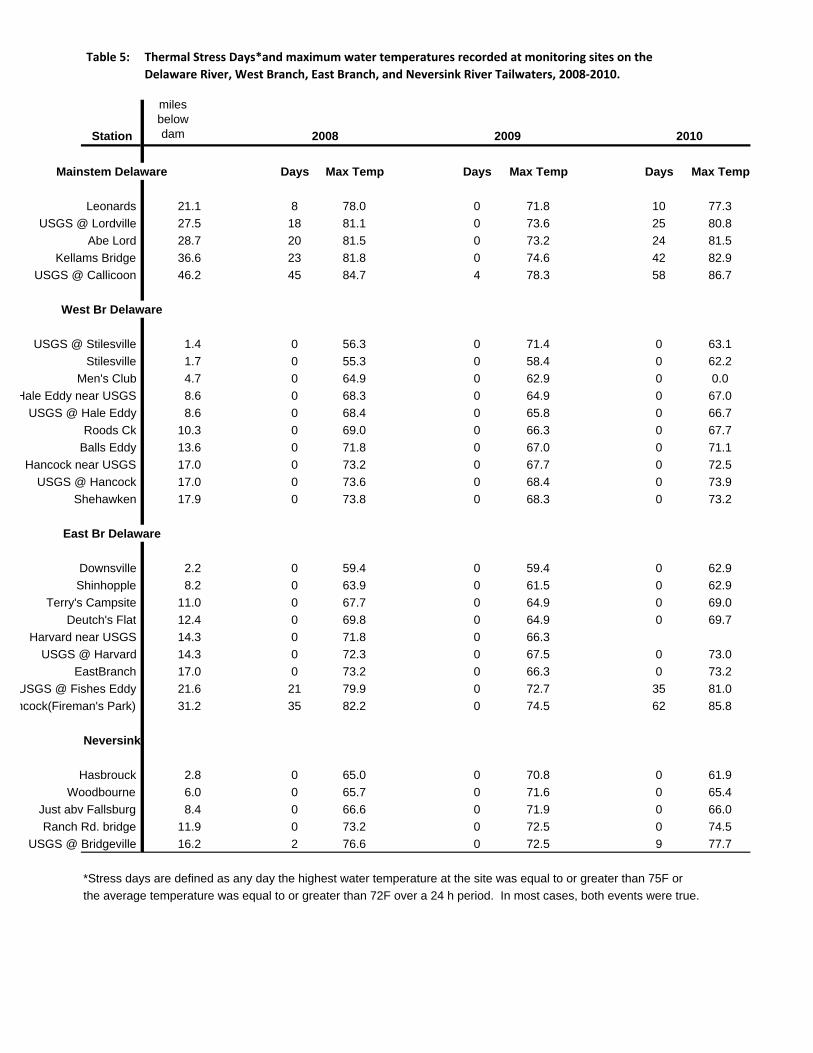
Table 5: Thermal Stress Days*and maximum water temperatures recorded at monitoring sites on the Delaware River, West Branch, East Branch, and Neversink River Tailwaters, 2008‐2010.
Station
miles below dam
Mainstem Delaware Days Max Temp Days Max Temp Days Max Temp
Leonards 21.1 8 78.0 0 71.8 10 77.3USGS @ Lordville 27.5 18 81.1 0 73.6 25 80.8
Abe Lord 28.7 20 81.5 0 73.2 24 81.5Kellams Bridge 36.6 23 81.8 0 74.6 42 82.9
USGS @ Callicoon 46.2 45 84.7 4 78.3 58 86.7
West Br Delaware
USGS @ Stilesville 1.4 0 56.3 0 71.4 0 63.1Stilesville 1.7 0 55.3 0 58.4 0 62.2
Men's Club 4.7 0 64.9 0 62.9 0 0.0Hale Eddy near USGS 8.6 0 68.3 0 64.9 0 67.0
USGS @ Hale Eddy 8.6 0 68.4 0 65.8 0 66.7Roods Ck 10.3 0 69.0 0 66.3 0 67.7
Balls Eddy 13.6 0 71.8 0 67.0 0 71.1Hancock near USGS 17.0 0 73.2 0 67.7 0 72.5
USGS @ Hancock 17.0 0 73.6 0 68.4 0 73.9Shehawken 17.9 0 73.8 0 68.3 0 73.2
East Br Delaware
Downsville 2.2 0 59.4 0 59.4 0 62.9Shinhopple 8.2 0 63.9 0 61.5 0 62.9
Terry's Campsite 11.0 0 67.7 0 64.9 0 69.0Deutch's Flat 12.4 0 69.8 0 64.9 0 69.7
Harvard near USGS 14.3 0 71.8 0 66.3USGS @ Harvard 14.3 0 72.3 0 67.5 0 73.0
EastBranch 17.0 0 73.2 0 66.3 0 73.2USGS @ Fishes Eddy 21.6 21 79.9 0 72.7 35 81.0ncock(Fireman's Park) 31.2 35 82.2 0 74.5 62 85.8
Neversink
Hasbrouck 2.8 0 65.0 0 70.8 0 61.9Woodbourne 6.0 0 65.7 0 71.6 0 65.4
Just abv Fallsburg 8.4 0 66.6 0 71.9 0 66.0Ranch Rd. bridge 11.9 0 73.2 0 72.5 0 74.5
USGS @ Bridgeville 16.2 2 76.6 0 72.5 9 77.7
*Stress days are defined as any day the highest water temperature at the site was equal to or greater than 75F orthe average temperature was equal to or greater than 72F over a 24 h period. In most cases, both events were true.
201020092008

Table 6: Summary of trout abundance (trout/acre) and biomass (lbs/acre) at foursites on the West Branch, four sites on the East Branch, and three sites onthe Neversink River, 2008‐10. Figures in parentheses are 95% confidence intervals.
TROUT DENSITY (FISH/ACRE)MilesBelowDam 2008 2009 2010
West Branch Stilesville 2.1 120.7 192.8
(86.7‐154.7) (150.3‐235.3)
No Kill 3.9 50.4 76.8(25.7‐75.1) (51.6‐102.0)
Hale Eddy 7.9 187.3 79.4(98.0‐276.6) (54.9‐103.9)
Balls Eddy 12.7 19.1 30¹(0‐38.8)
East Branch Airport 4.2 58.8 59.5 106.2
(39.3‐78.3) (44.7‐74.3) (82.9‐129.5)
T28 6.3 234.5 216.9 412.7(181.0‐288.0) (146.5‐287.3) (274.7‐550.7)
Cabin 9.9 78.5 122.8 245.4(49.2‐107.8) (99.8‐145.8) (136.9‐353.9)
T22 14.9 11.1 21.2 15.9(3.7‐18.5) (3.7‐38.7) (8.5‐23.3)
Neversink River Hasbrouck 2.8 45.2 131.0 44.4
(20.2‐70.2) (23.9‐238.1) (13.4‐75.4)
Fallsburg 8.0 54.8 76.0 55.5(11.7‐97.9) (22.6‐129.4) (26.0‐85.0)
Ranch Road 12.9 165.3 272.9 336.7(105.3‐225.3) (178.9‐366.9) (216.7‐456.7)
TROUT BIOMASS (LBS/ACRE)West Branch Stilesville 2.1 68.2 88.6 No Kill 3.9 29.4 65.3 Hale Eddy 7.9 74.1 50.3 Balls Eddy 12.7 23.7 25.4
East Branch Airport 4.2 6.2 11.5 17.3 T28 6.3 19.5 20.4 49.0 Cabin 9.9 15.6 24.3 30.9 T22 14.9 7.0 17.2 12.1
Neversink River Hasbrouck 2.8 26.7 42.2 41.1 Fallsburg 8.0 23.7 19.4 18.6 Ranch Road 12.9 99.7 117.9 141.2
¹Based on electrofishing efficiency since the estimate with one recapture was way to high to be believable.
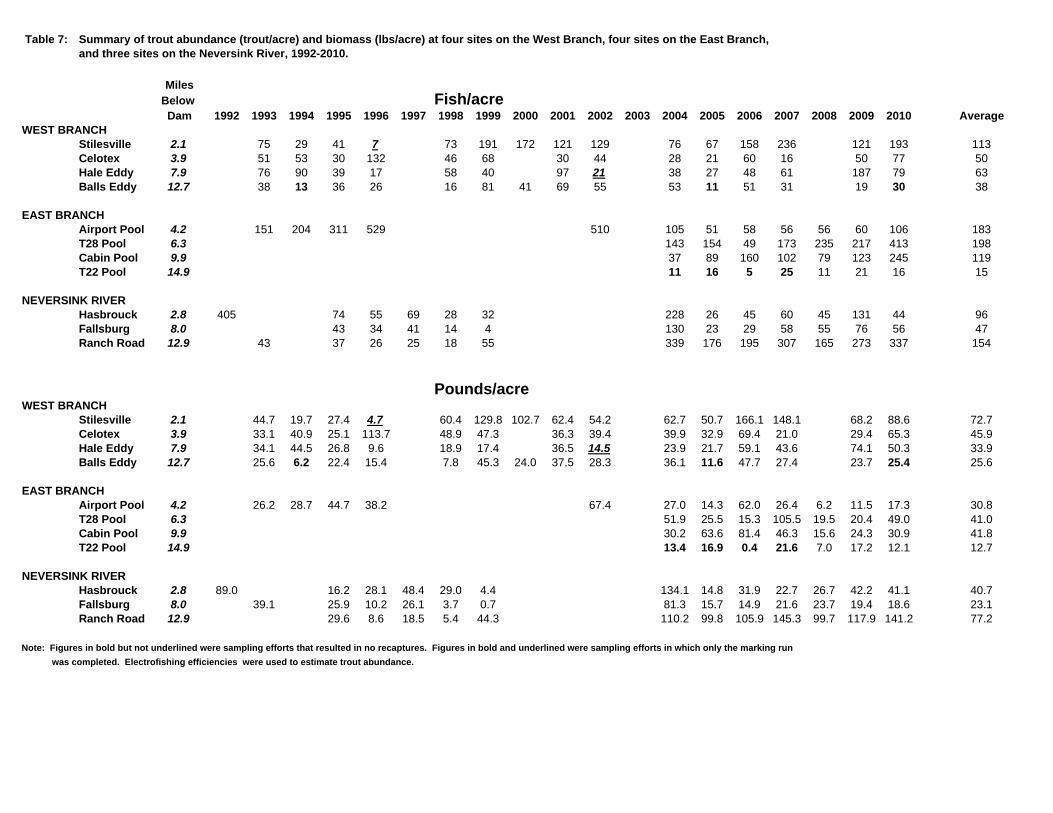
Table 7: Summary of trout abundance (trout/acre) and biomass (lbs/acre) at four sites on the West Branch, four sites on the East Branch,and three sites on the Neversink River, 1992-2010.
MilesBelow Fish/acreDam 1992 1993 1994 1995 1996 1997 1998 1999 2000 2001 2002 2003 2004 2005 2006 2007 2008 2009 2010 Average
WEST BRANCHStilesville 2.1 75 29 41 7 73 191 172 121 129 76 67 158 236 121 193 113Celotex 3.9 51 53 30 132 46 68 30 44 28 21 60 16 50 77 50Hale Eddy 7.9 76 90 39 17 58 40 97 21 38 27 48 61 187 79 63Balls Eddy 12.7 38 13 36 26 16 81 41 69 55 53 11 51 31 19 30 38
EAST BRANCHAirport Pool 4.2 151 204 311 529 510 105 51 58 56 56 60 106 183T28 Pool 6.3 143 154 49 173 235 217 413 198Cabin Pool 9.9 37 89 160 102 79 123 245 119T22 Pool 14.9 11 16 5 25 11 21 16 15
NEVERSINK RIVERHasbrouck 2.8 405 74 55 69 28 32 228 26 45 60 45 131 44 96Fallsburg 8.0 43 34 41 14 4 130 23 29 58 55 76 56 47Ranch Road 12.9 43 37 26 25 18 55 339 176 195 307 165 273 337 154
Pounds/acreWEST BRANCH
Stilesville 2.1 44.7 19.7 27.4 4.7 60.4 129.8 102.7 62.4 54.2 62.7 50.7 166.1 148.1 68.2 88.6 72.7Celotex 3.9 33.1 40.9 25.1 113.7 48.9 47.3 36.3 39.4 39.9 32.9 69.4 21.0 29.4 65.3 45.9Hale Eddy 7.9 34.1 44.5 26.8 9.6 18.9 17.4 36.5 14.5 23.9 21.7 59.1 43.6 74.1 50.3 33.9Balls Eddy 12.7 25.6 6.2 22.4 15.4 7.8 45.3 24.0 37.5 28.3 36.1 11.6 47.7 27.4 23.7 25.4 25.6
EAST BRANCHAirport Pool 4.2 26.2 28.7 44.7 38.2 67.4 27.0 14.3 62.0 26.4 6.2 11.5 17.3 30.8T28 Pool 6.3 51.9 25.5 15.3 105.5 19.5 20.4 49.0 41.0Cabin Pool 9.9 30.2 63.6 81.4 46.3 15.6 24.3 30.9 41.8T22 Pool 14.9 13.4 16.9 0.4 21.6 7.0 17.2 12.1 12.7
NEVERSINK RIVERHasbrouck 2.8 89.0 16.2 28.1 48.4 29.0 4.4 134.1 14.8 31.9 22.7 26.7 42.2 41.1 40.7Fallsburg 8.0 39.1 25.9 10.2 26.1 3.7 0.7 81.3 15.7 14.9 21.6 23.7 19.4 18.6 23.1Ranch Road 12.9 29.6 8.6 18.5 5.4 44.3 110.2 99.8 105.9 145.3 99.7 117.9 141.2 77.2
Note: Figures in bold but not underlined were sampling efforts that resulted in no recaptures. Figures in bold and underlined were sampling efforts in which only the marking run was completed. Electrofishing efficiencies were used to estimate trout abundance.

Table 8: Size and percentage distribution of 12 in and larger trout collected from the West Branch, East Branch, and Neversink River for each study site from 2008‐2010.
Total > 12 in > 16 in > 20 inYear Trout N (%) N (%) N (%)
West BranchStilesville 2009 351 95 (27) 61 (17) 5 (1)
No Kill 2009 208 48 (23) 39 (19) 7 (3)Hale Eddy 2009 409 63 (15) 37 (9) 7 (2)Balls Eddy 2009 36 20 (56) 15 (42) 2 (6)
Totals 1004 226 (23) 152 (15) 12 (2)
Stilesville 2010 549 131 (24) 59 (11) 4 (1)No Kill 2010 401 182 (45) 95 (24) 10 (2)
Hale Eddy 2010 358 104 (29) 53 (15) 13 (4)Balls Eddy 2010 105 49 (47) 17 (16) 1 (1)
Totals 1413 466 (33) 224 (16) 28 (2)
East BranchAirport Pool 2008 83 2 (2) 1 (1) 0
T28 Pool 2008 180 2 (1) 1 (1) 1 (1)Cabin Pool 2008 142 6 (4) 5 (4 ) 3 (2)T22 Pool 2008 12 4 (33) 1 (8) 1 (8)
Totals 417 14 (3) 8 (2) 5 (1)
Airport Pool 2009 95 3 (3) 2 (2) 0T28 Pool 2009 136 1 (1) 1 (1) 0
Cabin Pool 2009 186 5 (3) 3 (2) 2 (1)T22 Pool 2009 18 6 (33) 4 (22) 1 (6)
Totals 435 15 (3) 10 (2) 3 (1)
Airport Pool 2010 161 5 (3) 2 (1) 2 (1)T28 Pool 2010 207 4 (2) 4 (2) 2 (1)
Cabin Pool 2010 248 7 (3) 1 (<1) 0T22 Pool 2010 19 8 (42) 3 (6) 0
Totals 635 24 (4) 10 (2) 4 (1)
Neversink RiverHasbrouck 2008 22 6(27) 4(18) 1(5)Fallsburg 2008 28 6(21) 4(14) 0
Ranch Road 2008 49 14(29) 4(8) 0Totals 99 26(26) 12(12) 1(1)
Hasbrouck 2009 33 5(15) 2(6) 0Fallsburg 2009 38 4(11) 1(3) 0
Ranch Road 2009 74 15(20) 4(5) 0Totals 145 24(17) 7(5) 0
Hasbrouck 2010 18 8(44) 6(33) 0Fallsburg 2010 37 15(20) 4(5) 0
Ranch Road 2010 86 21(24) 2(2) 0Totals 141 44(31) 12(9) 0

Table 9: Comparison of study year and year class presence.
Year ClassAge 0 Age 1 Age 2 Age 3 Age 4 Age 5
Year 1 0 Year 1Year 2 0 1 Year 2Year 3 0 1 2 Year 3Year 4 0 1 2 3 Year 4Year 5 0 1 2 3 4 Year 5Year 6 0 1 2 3 4 5 Year 6Year 7 0 1 2 3 4 5 Year 7Year 8 0 1 2 3 4 5 Year 8Year 9 0 1 2 3 4 5 Year 9Year 10 0 1 2 3 4 5 Year 10

Appendix 1:
UPPER DELAWARE TAILWATERS
Maxima, minima, and average summer water temperature profile for each temperature monitoring site, 2008
West Branch: Appendices 1A to 1J East Branch: Appendices 1K to 1S
Neversink River: Appendices 1T to 1X Delaware River: Appendices 1Y to 1CC

55
60
65
70
75
2,000
3,000
4,000
pera
ture
(°F)
ow (C
FS)
Appendix 1A. Summer daily average, maximum, and minimum water temperature profiles from the USGS gage on the West Branch at Stilesville, along with daily average flows at Stilesville,
2008.
30
35
40
45
50
0
1,000
1-Jun 8-Jun 15-Jun 22-Jun 29-Jun 6-Jul 13-Jul 20-Jul 27-Jul 3-Aug 10-Aug 17-Aug 24-Aug 31-Aug 7-Sep 14-Sep 21-Sep 28-Sep 5-Oct
Tem
p
Flo
flow @ Stilesville Average temperature @ Stilesville Maximum temperature @ Stilesville Minimum temperature @ Stilesville

55
60
65
70
75
2,000
3,000
4,000
pera
ture
(°F)
ow (C
FS)
Appendix 1B. Summer daily average, maximum, and minimum water temperature profiles on the West Branch at Stilesville, along with daily average flows at Stilesville, 2008.
30
35
40
45
50
0
1,000
1-Jun 8-Jun 15-Jun 22-Jun 29-Jun 6-Jul 13-Jul 20-Jul 27-Jul 3-Aug 10-Aug 17-Aug 24-Aug 31-Aug 7-Sep 14-Sep 21-Sep 28-Sep 5-Oct
Tem
p
Flo
flow @ Stilesville Average temperature @ Stilesville Maximum temperature @ Stilesville Minimum temperature @ Stilesville

55
60
65
70
75
2,000
3,000
4,000
pera
ture
(°F)
ow (C
FS)
Appendix 1C. Summer daily average, maximum, and minimum water temperature profiles on the West Branch at Mens Club, along with daily average flows at Stilesville, 2008.
30
35
40
45
50
0
1,000
1-Jun 8-Jun 15-Jun 22-Jun 29-Jun 6-Jul 13-Jul 20-Jul 27-Jul 3-Aug 10-Aug 17-Aug 24-Aug 31-Aug 7-Sep 14-Sep 21-Sep 28-Sep 5-Oct
Tem
p
Flo
flow @ Stilesville Average temperature @ Mens Club Maximum temperature @ Mens Club Minimum temperature @ Mens Club

55
60
65
70
75
2,000
3,000
4,000
pera
ture
(°F)
ow (C
FS)
Appendix 1D. Summer daily average, maximum, and minimum water temperature profiles on the West Branch at Hale Eddy, along with daily average flows at Stilesville, 2008.
30
35
40
45
50
0
1,000
1-Jun 8-Jun 15-Jun 22-Jun 29-Jun 6-Jul 13-Jul 20-Jul 27-Jul 3-Aug 10-Aug 17-Aug 24-Aug 31-Aug 7-Sep 14-Sep 21-Sep 28-Sep 5-Oct
Tem
p
Flo
flow @ Stilesville Average temperature @ Hale Eddy Maximum temperature @ Hale Eddy Minimum temperature @ Hale Eddy

55
60
65
70
75
2,000
3,000
4,000
pera
ture
(°F)
ow (C
FS)
Appendix 1E. Summer daily average, maximum, and minimum water temperature profiles from the USGS gage on the West Branch at Hale Eddy, along with daily average flows at Stilesville, 2008.
30
35
40
45
50
0
1,000
1-Jun 8-Jun 15-Jun 22-Jun 29-Jun 6-Jul 13-Jul 20-Jul 27-Jul 3-Aug 10-Aug 17-Aug 24-Aug 31-Aug 7-Sep 14-Sep 21-Sep 28-Sep 5-Oct
Tem
p
Flo
flow @ Stilesville Average temperature @ Hale Eddy Maximum temperature @ Hale Eddy Minimum temperature @ Hale Eddy
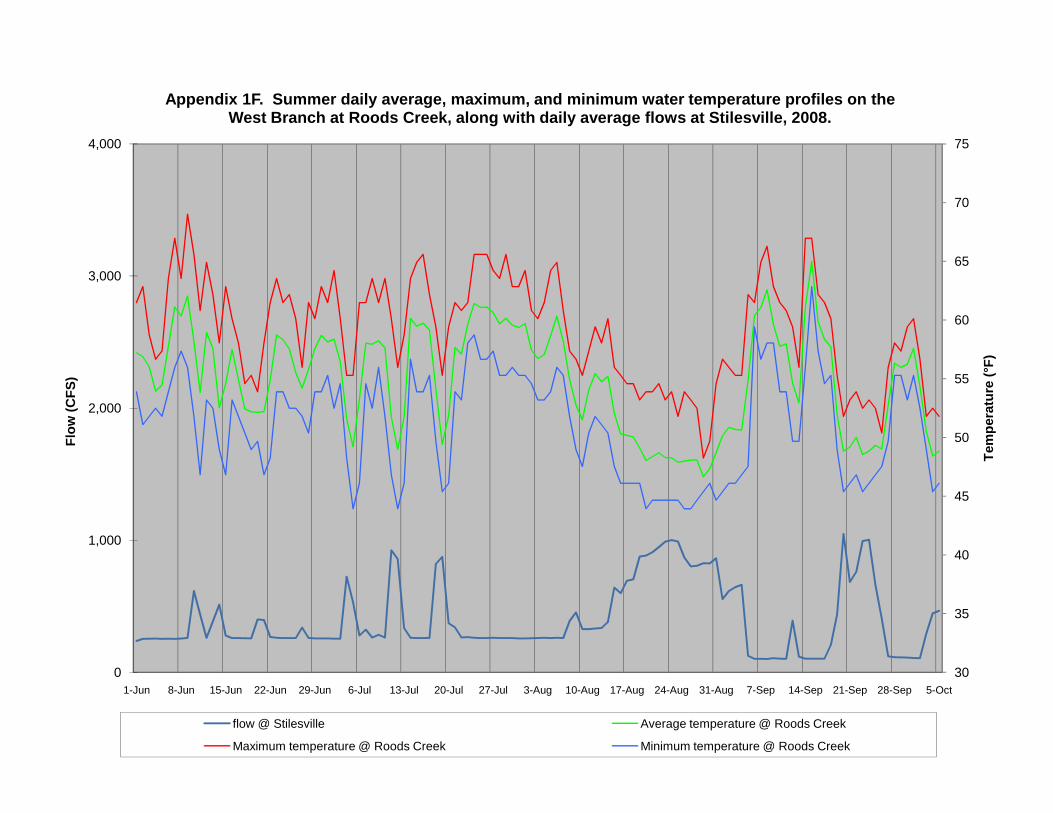
55
60
65
70
75
2,000
3,000
4,000
pera
ture
(°F)
ow (C
FS)
Appendix 1F. Summer daily average, maximum, and minimum water temperature profiles on the West Branch at Roods Creek, along with daily average flows at Stilesville, 2008.
30
35
40
45
50
0
1,000
1-Jun 8-Jun 15-Jun 22-Jun 29-Jun 6-Jul 13-Jul 20-Jul 27-Jul 3-Aug 10-Aug 17-Aug 24-Aug 31-Aug 7-Sep 14-Sep 21-Sep 28-Sep 5-Oct
Tem
p
Flo
flow @ Stilesville Average temperature @ Roods Creek
Maximum temperature @ Roods Creek Minimum temperature @ Roods Creek

55
60
65
70
75
2,000
3,000
4,000
pera
ture
(°F)
ow (C
FS)
Appendix 1G. Summer daily average, maximum, and minimum water temperature profiles on the West Branch at Balls Eddy, along with daily average flows at Stilesville, 2008.
30
35
40
45
50
0
1,000
1-Jun 8-Jun 15-Jun 22-Jun 29-Jun 6-Jul 13-Jul 20-Jul 27-Jul 3-Aug 10-Aug 17-Aug 24-Aug 31-Aug 7-Sep 14-Sep 21-Sep 28-Sep 5-Oct
Tem
p
Flo
flow @ Stilesville Average temperature @ Balls Eddy Maximum temperature @ Balls Eddy Minimum temperature @ Balls Eddy

55
60
65
70
75
2,000
3,000
4,000
pera
ture
(°F)
ow (C
FS)
Appendix 1H. Summer daily average, maximum, and minimum water temperature profiles on the West Branch at Hancock, along with daily average flows at Stilesville, 2008.
30
35
40
45
50
0
1,000
1-Jun 8-Jun 15-Jun 22-Jun 29-Jun 6-Jul 13-Jul 20-Jul 27-Jul 3-Aug 10-Aug 17-Aug 24-Aug 31-Aug 7-Sep 14-Sep 21-Sep 28-Sep 5-Oct
Tem
p
Flo
flow @ Stilesville Average temperature @ Hancock Maximum temperature @ Hancock Minimum temperature @ Hancock

55
60
65
70
75
2,000
3,000
4,000
pera
ture
(°F)
ow (C
FS)
Appendix 1I. Summer daily average, maximum, and minimum water temperature profiles from the USGS gage on the West Branch at Hancock, along with daily average flows at Stilesville, 2008.
30
35
40
45
50
0
1,000
1-Jun 8-Jun 15-Jun 22-Jun 29-Jun 6-Jul 13-Jul 20-Jul 27-Jul 3-Aug 10-Aug 17-Aug 24-Aug 31-Aug 7-Sep 14-Sep 21-Sep 28-Sep 5-Oct
Tem
p
Flo
flow @ Stilesville Average temperature @ Hancock Maximum temperature @ Hancock Minimum temperature @ Hancock

55
60
65
70
75
2,000
3,000
4,000
pera
ture
(°F)
ow (C
FS)
Appendix 1J. Summer daily average, maximum, and minimum water temperature profiles on the West Branch at Shehawken, along with daily average flows at Stilesville, 2008.
30
35
40
45
50
0
1,000
1-Jun 8-Jun 15-Jun 22-Jun 29-Jun 6-Jul 13-Jul 20-Jul 27-Jul 3-Aug 10-Aug 17-Aug 24-Aug 31-Aug 7-Sep 14-Sep 21-Sep 28-Sep 5-Oct
Tem
p
Flo
flow @ Stilesville Average temperature @ Shehawken
Maximum temperature @ Shehawken Minimum temperature @ Shehawken

60
65
70
75
2,000
3,000
4,000
pera
ture
(°F)
ow (C
FS)
Appendix 1K. Summer daily average, maximum, and minimum water temperature profiles on the East Branch at Downsville, along with daily average flows at Downsville, 2008.
40
45
50
55
0
1,000
3-Jun 10-Jun 17-Jun 24-Jun 1-Jul 8-Jul 15-Jul 22-Jul 29-Jul 5-Aug 12-Aug 19-Aug 26-Aug 2-Sep 9-Sep 16-Sep 23-Sep 30-Sep 7-Oct
Tem
p
Flo
flow @ Downsville Average temperature @ Downsville
Maximum temperature @ Downsville Minimum temperature @ Downsville

60
65
70
75
2,000
3,000
4,000
pera
ture
(°F)
ow (C
FS)
Appendix 1L. Summer daily average, maximum, and minimum water temperature profiles on the East Branch at Shinhopple, along with daily average flows at Downsville, 2008.
40
45
50
55
0
1,000
3-Jun 10-Jun 17-Jun 24-Jun 1-Jul 8-Jul 15-Jul 22-Jul 29-Jul 5-Aug 12-Aug 19-Aug 26-Aug 2-Sep 9-Sep 16-Sep 23-Sep 30-Sep 7-Oct
Tem
p
Flo
flow @ Downsville Average temperature @ Shinhopple
Maximum temperature @ Shinhopple Minimum temperature @ Shinhopple
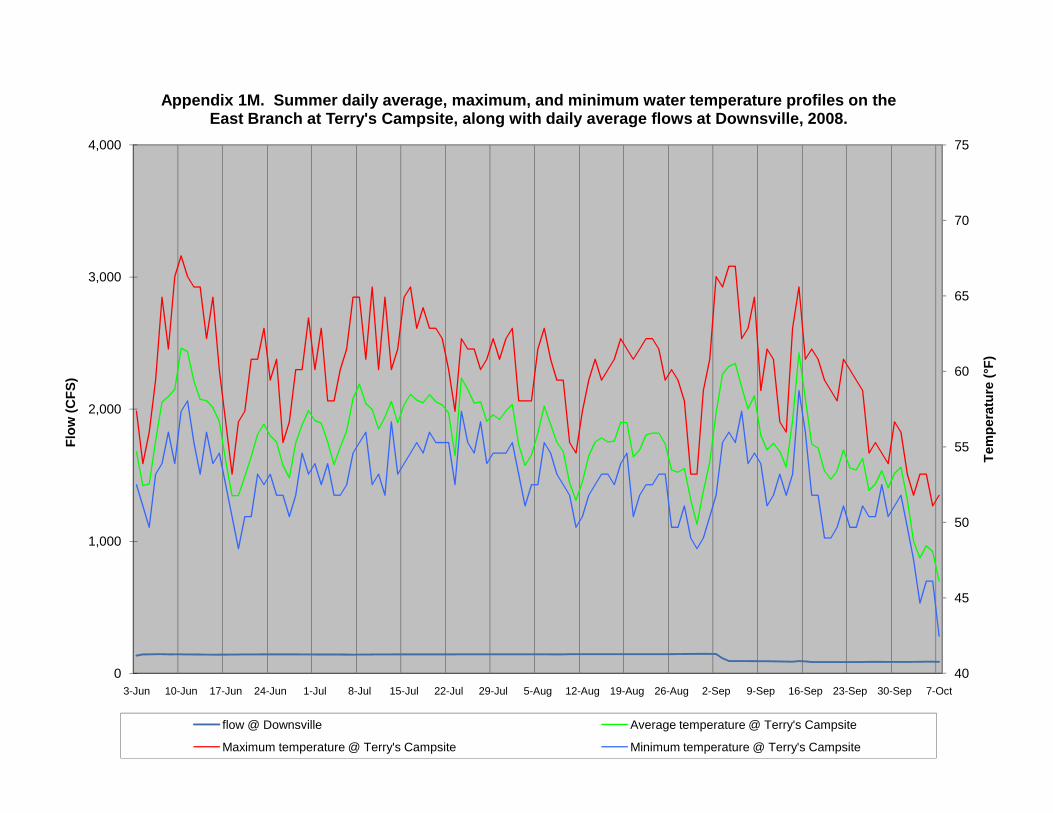
60
65
70
75
2,000
3,000
4,000
pera
ture
(°F)
ow (C
FS)
Appendix 1M. Summer daily average, maximum, and minimum water temperature profiles on the East Branch at Terry's Campsite, along with daily average flows at Downsville, 2008.
40
45
50
55
0
1,000
3-Jun 10-Jun 17-Jun 24-Jun 1-Jul 8-Jul 15-Jul 22-Jul 29-Jul 5-Aug 12-Aug 19-Aug 26-Aug 2-Sep 9-Sep 16-Sep 23-Sep 30-Sep 7-Oct
Tem
p
Flo
flow @ Downsville Average temperature @ Terry's Campsite
Maximum temperature @ Terry's Campsite Minimum temperature @ Terry's Campsite

60
65
70
75
2,000
3,000
4,000
pera
ture
(°F)
ow (C
FS)
Appendix 1N. Summer daily average, maximum, and minimum water temperature profiles on the East Branch at Deutch's Flat, along with daily average flows at Downsville, 2008.
40
45
50
55
0
1,000
3-Jun 10-Jun 17-Jun 24-Jun 1-Jul 8-Jul 15-Jul 22-Jul 29-Jul 5-Aug 12-Aug 19-Aug 26-Aug 2-Sep 9-Sep 16-Sep 23-Sep 30-Sep 7-Oct
Tem
p
Flo
flow @ Downsville Average temperature @ Deutch's Flat
Maximum temperature @ Deutch's Flat Minimum temperature @ Deutch's Flat
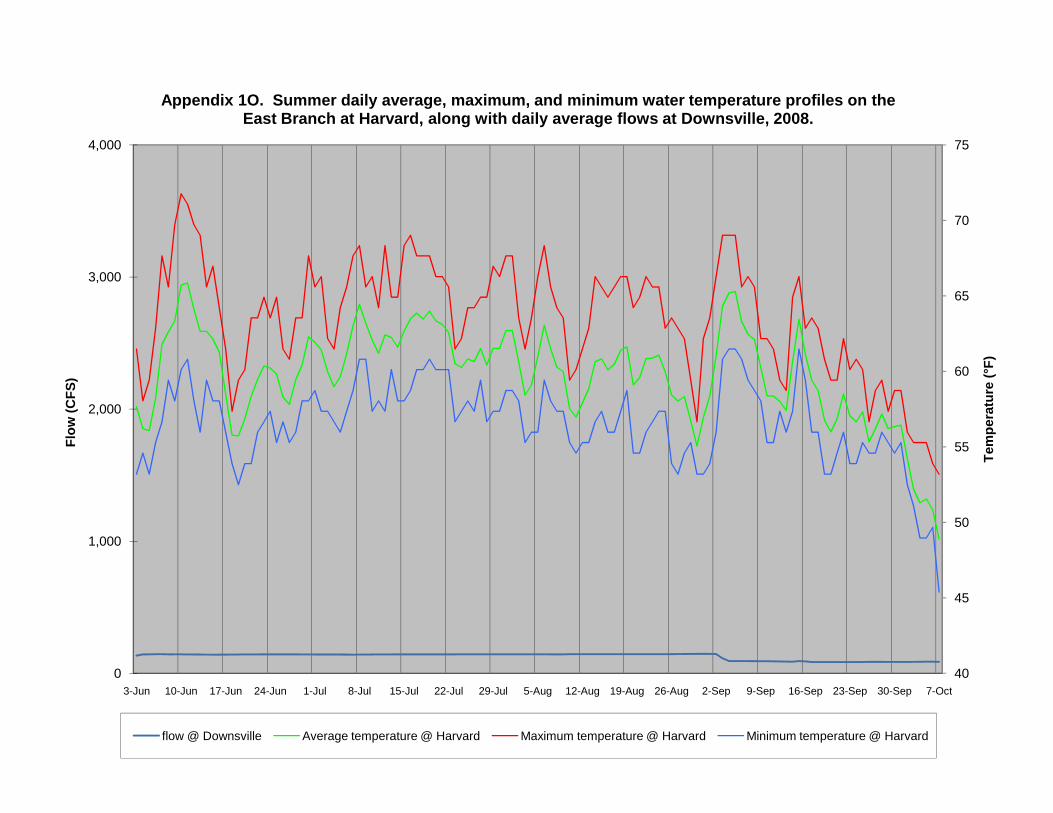
60
65
70
75
2,000
3,000
4,000
pera
ture
(°F)
ow (C
FS)
Appendix 1O. Summer daily average, maximum, and minimum water temperature profiles on the East Branch at Harvard, along with daily average flows at Downsville, 2008.
40
45
50
55
0
1,000
3-Jun 10-Jun 17-Jun 24-Jun 1-Jul 8-Jul 15-Jul 22-Jul 29-Jul 5-Aug 12-Aug 19-Aug 26-Aug 2-Sep 9-Sep 16-Sep 23-Sep 30-Sep 7-Oct
Tem
p
Flo
flow @ Downsville Average temperature @ Harvard Maximum temperature @ Harvard Minimum temperature @ Harvard

60
65
70
75
2,000
3,000
4,000
pera
ture
(°F)
ow (C
FS)
Appendix 1P. Summer daily average, maximum, and minimum water temperature profiles from the USGS gage on the East Branch at Harvard, along with daily average flows at Downsville, 2008.
40
45
50
55
0
1,000
3-Jun 10-Jun 17-Jun 24-Jun 1-Jul 8-Jul 15-Jul 22-Jul 29-Jul 5-Aug 12-Aug 19-Aug 26-Aug 2-Sep 9-Sep 16-Sep 23-Sep 30-Sep 7-Oct
Tem
p
Flo
flow @ Downsville Average temperature @ Harvard Maximum temperature @ Harvard Minimum temperature @ Harvard

60
65
70
75
2,000
3,000
4,000
pera
ture
(°F)
ow (C
FS)
Appendix 1Q. Summer daily average, maximum, and minimum water temperature profiles on the East Branch at East Branch, along with daily average flows at Downsville, 2008.
40
45
50
55
0
1,000
3-Jun 10-Jun 17-Jun 24-Jun 1-Jul 8-Jul 15-Jul 22-Jul 29-Jul 5-Aug 12-Aug 19-Aug 26-Aug 2-Sep 9-Sep 16-Sep 23-Sep 30-Sep 7-Oct
Tem
p
Flo
flow @ Downsville Average temperature @ East Branch
Maximum temperature @ East Branch Minimum temperature @ East Branch

65
70
75
80
85
2,000
3,000
4,000
pera
ture
(°F)
ow (C
FS)
Appendix 1R. Summer daily average, maximum, and minimum water temperature profiles from the USGS gage on the East Branch at Fishs Eddy, along with daily average flows at Downsville, 2008.
45
50
55
60
0
1,000
3-Jun 10-Jun 17-Jun 24-Jun 1-Jul 8-Jul 15-Jul 22-Jul 29-Jul 5-Aug 12-Aug 19-Aug 26-Aug 2-Sep 9-Sep 16-Sep 23-Sep 30-Sep 7-Oct
Tem
p
Flo
flow @ Downsville Average temperature @ Fishes Eddy
Maximum temperature @ Fishes Eddy Minimum temperature @ Fishes Eddy

65
70
75
80
85
2,000
3,000
4,000
pera
ture
(°F)
ow (C
FS)
Appendix 1S. Summer daily average, maximum, and minimum water temperature profiles on the East Branch at Hancock, along with daily average flows at Downsville, 2008.
45
50
55
60
0
1,000
3-Jun 10-Jun 17-Jun 24-Jun 1-Jul 8-Jul 15-Jul 22-Jul 29-Jul 5-Aug 12-Aug 19-Aug 26-Aug 2-Sep 9-Sep 16-Sep 23-Sep 30-Sep
Tem
p
Flo
flow @ Downsville Average temperature @ Hancock Maximum temperature @ Hancock Minimum temperature @ Hancock

60
65
70
75
2,000
3,000
4,000
pera
ture
(°F)
ow (C
FS)
Appendix 1T. Summer daily average, maximum, and minimum water temperature profiles on the Neversink at Hasbrouck, along with daily average flows at Neversink, 2008.
40
45
50
55
0
1,000
3-Jun 10-Jun 17-Jun 24-Jun 1-Jul 8-Jul 15-Jul 22-Jul 29-Jul 5-Aug 12-Aug 19-Aug 26-Aug 2-Sep 9-Sep 16-Sep 23-Sep 30-Sep 7-Oct
Tem
p
Flo
flow @ Neversink Average temperature @ Hasbrouck Maximum temperature @ Hasbrouck Minimum temperature @ Hasbrouck

60
65
70
75
2,000
3,000
4,000
pera
ture
(°F)
ow (C
FS)
Appendix 1U. Summer daily average, maximum, and minimum water temperature profiles on the Neversink at Woodbourne, along with daily average flows at Neversink, 2008.
40
45
50
55
0
1,000
3-Jun 10-Jun 17-Jun 24-Jun 1-Jul 8-Jul 15-Jul 22-Jul 29-Jul 5-Aug 12-Aug 19-Aug 26-Aug 2-Sep 9-Sep 16-Sep 23-Sep 30-Sep 7-Oct
Tem
p
Flo
flow @ Neversink Average temperature @ Woodbourne
Maximum temperature @ Woodbourne Minimum temperature @ Woodbourne

60
65
70
75
2,000
3,000
4,000
pera
ture
(°F)
ow (C
FS)
Appendix 1V. Summer daily average, maximum, and minimum water temperature profiles on the Neversink just above Fallsburg, along with daily average flows at Neversink, 2008.
40
45
50
55
0
1,000
3-Jun 10-Jun 17-Jun 24-Jun 1-Jul 8-Jul 15-Jul 22-Jul 29-Jul 5-Aug 12-Aug 19-Aug 26-Aug 2-Sep 9-Sep 16-Sep 23-Sep 30-Sep 7-Oct
Tem
p
Flo
flow @ Neversink Average temperature @ above Fallsburg
Maximum temperature @ above Fallsburg Minimum temperature @ above Fallsburg

60
65
70
75
2,000
3,000
4,000
pera
ture
(°F)
ow (C
FS)
Appendix 1W. Summer daily average, maximum, and minimum water temperature profiles on the Neversink at Ranch Rd bridge, along with daily average flows at Neversink, 2008.
40
45
50
55
0
1,000
3-Jun 10-Jun 17-Jun 24-Jun 1-Jul 8-Jul 15-Jul 22-Jul 29-Jul 5-Aug 12-Aug 19-Aug 26-Aug 2-Sep 9-Sep 16-Sep 23-Sep 30-Sep 7-Oct
Tem
p
Flo
flow @ Neversink Average temperature @ Ranch Rd Bridge
Maximum temperature @ Ranch Rd Bridge Minimum temperature @ Ranch Rd Bridge

60
65
70
75
80
2,000
3,000
4,000
pera
ture
(°F)
ow (C
FS)
Appendix 1X. Summer daily average, maximum, and minimum water temperature profiles on the Neversink at Bridgeville, along with daily average flows at Bridgeville & Neversink, 2008.
40
45
50
55
0
1,000
3-Jun 10-Jun 17-Jun 24-Jun 1-Jul 8-Jul 15-Jul 22-Jul 29-Jul 5-Aug 12-Aug 19-Aug 26-Aug 2-Sep 9-Sep 16-Sep 23-Sep 30-Sep 7-Oct
Tem
p
Flo
flow @ Neversink flow @ Bridgeville Average temperature @ Bridgeville
Maximum temperature @ Bridgeville Minimum temperature @ Bridgeville

60
65
70
75
80
6,000
8,000
10,000
pera
ture
(°F)
ow (C
FS)
Appendix 1Y. Summer daily average, maximum, and minimum water temperature profiles on the Delaware River at Leonards, along with daily average flows at Stilesville on the West Branch and
Lordville, 2008.
40
45
50
55
0
2,000
4,000
1-Jun 8-Jun 15-Jun 22-Jun 29-Jun 6-Jul 13-Jul 20-Jul 27-Jul 3-Aug 10-Aug 17-Aug 24-Aug 31-Aug 7-Sep 14-Sep 21-Sep 28-Sep 5-Oct
Tem
p
Flo
flow @ Stilesville flow @ Lordville Average temperature @ Leonards
Maximum temperature @ Leonards Minimum temperature @ Leonards

65
70
75
80
85
6,000
8,000
10,000
pera
ture
(°F)
ow (C
FS)
Appendix 1Z. Summer daily average, maximum, and minimum water temperature profiles on the Delaware River at Lordville, along with daily average flows at Stilesville on the West Branch and
Lordville, 2008.
45
50
55
60
0
2,000
4,000
1-Jun 8-Jun 15-Jun 22-Jun 29-Jun 6-Jul 13-Jul 20-Jul 27-Jul 3-Aug 10-Aug 17-Aug 24-Aug 31-Aug 7-Sep 14-Sep 21-Sep 28-Sep 5-Oct
Tem
p
Flo
flow @ Stilesville flow @ Lordville Average temperature @ Lordville
Maximum temperature @ Lordville Minimum temperature @ Lordville

65
70
75
80
85
6,000
8,000
10,000
pera
ture
(°F)
ow (C
FS)
Appendix 1AA. Summer daily average, maximum, and minimum water temperature profiles on the Delaware River at Abe Lord, along with daily average flows at Stilesville on the West Branch and
Lordville, 2008.
45
50
55
60
0
2,000
4,000
1-Jun 8-Jun 15-Jun 22-Jun 29-Jun 6-Jul 13-Jul 20-Jul 27-Jul 3-Aug 10-Aug 17-Aug 24-Aug 31-Aug 7-Sep 14-Sep 21-Sep 28-Sep 5-Oct
Tem
p
Flo
flow @ Stilesville flow @ Lordville Average temperature @ Abe Lord
Maximum temperature @ Abe Lord Minimum temperature @ Abe Lord

65
70
75
80
85
6,000
8,000
10,000
pera
ture
(°F)
ow (C
FS)
Appendix 1BB. Summer daily average, maximum, and minimum water temperature profiles on the Delaware River at Kellams Bridge, along with daily average flows at Stilesville on the West Branch
and Lordville, 2008.
45
50
55
60
0
2,000
4,000
1-Jun 8-Jun 15-Jun 22-Jun 29-Jun 6-Jul 13-Jul 20-Jul 27-Jul 3-Aug 10-Aug 17-Aug 24-Aug 31-Aug 7-Sep 14-Sep 21-Sep 28-Sep 5-Oct
Tem
p
Flo
flow @ Stilesville flow @ Lordville Average temperature @ Kellams Bridge
Maximum temperature @ Kellams Bridge Minimum temperature @ Kellams Bridge

70
75
80
85
90
6,000
8,000
10,000
pera
ture
(°F)
ow (C
FS)
Appendix 1CC. Summer daily average, maximum, and minimum water temperature profiles on the Delaware River at Callicoon, along with daily average flows at Stilesville on the West Branch
and Lordville, 2008.
50
55
60
65
0
2,000
4,000
1-Jun 8-Jun 15-Jun 22-Jun 29-Jun 6-Jul 13-Jul 20-Jul 27-Jul 3-Aug 10-Aug 17-Aug 24-Aug 31-Aug 7-Sep 14-Sep 21-Sep 28-Sep 5-Oct
Tem
p
Flo
flow @ Stilesville flow @ Lordville Average temperature @ Callicoon
Maximum temperature @ Callicoon Minimum temperature @ Callicoon

Appendix 2:
UPPER DELAWARE TAILWATERS
Maxima, minima, and average summer water temperature profile for each temperature monitoring site, 2009
West Branch: Appendices 2A to 2J East Branch: Appendices 2K to 2S
Neversink River: Appendices 2T to 2X Delaware River: Appendices 2Y to 2CC

55
60
65
70
75
2,000
3,000
4,000
pera
ture
(°F)
ow (C
FS)
Appendix 2A. Summer daily average, maximum, and minimum water temperature profiles from the USGS gage on the West Branch at Stilesville, along with daily average flows at Stilesville, 2009.
30
35
40
45
50
0
1,000
1-Jun 8-Jun 15-Jun 22-Jun 29-Jun 6-Jul 13-Jul 20-Jul 27-Jul 3-Aug 10-Aug 17-Aug 24-Aug 31-Aug 7-Sep 14-Sep 21-Sep 28-Sep 5-Oct
Tem
p
Flo
flow @ Stilesville Average temperature @ Stilesville Maximum temperature @ Stilesville Minimum temperature @ Stilesville

55
60
65
70
75
2,000
3,000
4,000
pera
ture
(°F)
ow (C
FS)
Appendix 2B. Summer daily average, maximum, and minimum water temperature profiles on the West Branch at Stilesville, along with daily average flows at Stilesville, 2009.
30
35
40
45
50
0
1,000
1-Jun 8-Jun 15-Jun 22-Jun 29-Jun 6-Jul 13-Jul 20-Jul 27-Jul 3-Aug 10-Aug 17-Aug 24-Aug 31-Aug 7-Sep 14-Sep 21-Sep 28-Sep 5-Oct
Tem
p
Flo
flow @ Stilesville Average temperature @ Stilesville Maximum temperature @ Stilesville Minimum temperature @ Stilesville

55
60
65
70
75
2,000
3,000
4,000
pera
ture
(°F)
ow (C
FS)
Appendix 2C. Summer daily average, maximum, and minimum water temperature profiles on the West Branch at Mens Club, along with daily average flows at Stilesville, 2009.
30
35
40
45
50
0
1,000
1-Jun 8-Jun 15-Jun 22-Jun 29-Jun 6-Jul 13-Jul 20-Jul 27-Jul 3-Aug 10-Aug 17-Aug 24-Aug 31-Aug 7-Sep 14-Sep 21-Sep 28-Sep 5-Oct
Tem
p
Flo
flow @ Stilesville Average temperature @ Mens Club Maximum temperature @ Mens Club Minimum temperature @ Mens Club

55
60
65
70
75
2,000
3,000
4,000
pera
ture
(°F)
ow (C
FS)
Appendix 2D. Summer daily average, maximum, and minimum water temperature profiles on the West Branch at Hale Eddy, along with daily average flows at Stilesville, 2009.
30
35
40
45
50
0
1,000
1-Jun 8-Jun 15-Jun 22-Jun 29-Jun 6-Jul 13-Jul 20-Jul 27-Jul 3-Aug 10-Aug 17-Aug 24-Aug 31-Aug 7-Sep 14-Sep 21-Sep 28-Sep 5-Oct
Tem
p
Flo
flow @ Stilesville Average temperature @ Hale Eddy Maximum temperature @ Hale Eddy Minimum temperature @ Hale Eddy

55
60
65
70
75
2,000
3,000
4,000
pera
ture
(°F)
ow (C
FS)
Appendix 2E. Summer daily average, maximum, and minimum water temperature profiles from the USGS gage on the West Branch at Hale Eddy, along with daily average flows at Stilesville, 2009.
30
35
40
45
50
0
1,000
1-Jun 8-Jun 15-Jun 22-Jun 29-Jun 6-Jul 13-Jul 20-Jul 27-Jul 3-Aug 10-Aug 17-Aug 24-Aug 31-Aug 7-Sep 14-Sep 21-Sep 28-Sep 5-Oct
Tem
p
Flo
flow @ Stilesville Average temperature @ Hale Eddy Maximum temperature @ Hale Eddy Minimum temperature @ Hale Eddy

55
60
65
70
75
2,000
3,000
4,000
pera
ture
(°F)
ow (C
FS)
Appendix 2F. Summer daily average, maximum, and minimum water temperature profiles on the West Branch at Roods Creek, along with daily average flows at Stilesville, 2009.
30
35
40
45
50
0
1,000
1-Jun 8-Jun 15-Jun 22-Jun 29-Jun 6-Jul 13-Jul 20-Jul 27-Jul 3-Aug 10-Aug 17-Aug 24-Aug 31-Aug 7-Sep 14-Sep 21-Sep 28-Sep 5-Oct
Tem
p
Flo
flow @ Stilesville Average temperature @ Roods Creek
Maximum temperature @ Roods Creek Minimum temperature @ Roods Creek

55
60
65
70
75
2,000
3,000
4,000
pera
ture
(°F)
ow (C
FS)
Appendix 2G. Summer daily average, maximum, and minimum water temperature profiles on the West Branch at Balls Eddy, along with daily average flows at Stilesville, 2009.
30
35
40
45
50
0
1,000
1-Jun 8-Jun 15-Jun 22-Jun 29-Jun 6-Jul 13-Jul 20-Jul 27-Jul 3-Aug 10-Aug 17-Aug 24-Aug 31-Aug 7-Sep 14-Sep 21-Sep 28-Sep 5-Oct
Tem
p
Flo
flow @ Stilesville Average temperature @ Balls Eddy Maximum temperature @ Balls Eddy Minimum temperature @ Balls Eddy

55
60
65
70
75
2,000
3,000
4,000
pera
ture
(°F)
ow (C
FS)
Appendix 2H. Summer daily average, maximum, and minimum water temperature profiles on the West Branch at Hancock, along with daily average flows at Stilesville, 2009.
30
35
40
45
50
0
1,000
1-Jun 8-Jun 15-Jun 22-Jun 29-Jun 6-Jul 13-Jul 20-Jul 27-Jul 3-Aug 10-Aug 17-Aug 24-Aug 31-Aug 7-Sep 14-Sep 21-Sep 28-Sep 5-Oct
Tem
p
Flo
flow @ Stilesville Average temperature @ Hancock Maximum temperature @ Hancock Minimum temperature @ Hancock

55
60
65
70
75
2,000
3,000
4,000
pera
ture
(°F)
ow (C
FS)
Appendix 2I. Summer daily average, maximum, and minimum water temperature profiles from the USGS gage on the West Branch at Hancock, along with daily average flows at Stilesville, 2009.
30
35
40
45
50
0
1,000
1-Jun 8-Jun 15-Jun 22-Jun 29-Jun 6-Jul 13-Jul 20-Jul 27-Jul 3-Aug 10-Aug 17-Aug 24-Aug 31-Aug 7-Sep 14-Sep 21-Sep 28-Sep 5-Oct
Tem
p
Flo
flow @ Stilesville Average temperature @ Hancock Maximum temperature @ Hancock Minimum temperature @ Hancock

55
60
65
70
75
2,000
3,000
4,000
pera
ture
(°F)
ow (C
FS)
Appendix 2J. Summer daily average, maximum, and minimum water temperature profiles on the West Branch at Shehawken, along with daily average flows at Stilesville, 2009.
30
35
40
45
50
0
1,000
1-Jun 8-Jun 15-Jun 22-Jun 29-Jun 6-Jul 13-Jul 20-Jul 27-Jul 3-Aug 10-Aug 17-Aug 24-Aug 31-Aug 7-Sep 14-Sep 21-Sep 28-Sep 5-Oct
Tem
p
Flo
flow @ Stilesville Average temperature @ Shehawken
Maximum temperature @ Shehawken Minimum temperature @ Shehawken

60
65
70
75
2,000
3,000
4,000
pera
ture
(°F)
ow (C
FS)
Appendix 2K. Summer daily average, maximum, and minimum water temperature profiles on the East Branch at Downsville, along with daily average flows at Downsville, 2009.
40
45
50
55
0
1,000
3-Jun 10-Jun 17-Jun 24-Jun 1-Jul 8-Jul 15-Jul 22-Jul 29-Jul 5-Aug 12-Aug 19-Aug 26-Aug 2-Sep 9-Sep 16-Sep 23-Sep 30-Sep 7-Oct
Tem
p
Flo
flow @ Downsville Average temperature @ Downsville
Maximum temperature @ Downsville Minimum temperature @ Downsville

60
65
70
75
2,000
3,000
4,000
pera
ture
(°F)
ow (C
FS)
Appendix 2L. Summer daily average, maximum, and minimum water temperature profiles on the East Branch at Shinhopple, along with daily average flows at Downsville, 2009.
40
45
50
55
0
1,000
3-Jun 10-Jun 17-Jun 24-Jun 1-Jul 8-Jul 15-Jul 22-Jul 29-Jul 5-Aug 12-Aug 19-Aug 26-Aug 2-Sep 9-Sep 16-Sep 23-Sep 30-Sep 7-Oct
Tem
p
Flo
flow @ Downsville Average temperature @ Shinhopple
Maximum temperature @ Shinhopple Minimum temperature @ Shinhopple

60
65
70
75
2,000
3,000
4,000
pera
ture
(°F)
ow (C
FS)
Appendix 2M. Summer daily average, maximum, and minimum water temperature profiles on the East Branch at Terry's Campsite, along with daily average flows at Downsville, 2009.
40
45
50
55
0
1,000
3-Jun 10-Jun 17-Jun 24-Jun 1-Jul 8-Jul 15-Jul 22-Jul 29-Jul 5-Aug 12-Aug 19-Aug 26-Aug 2-Sep 9-Sep 16-Sep 23-Sep 30-Sep 7-Oct
Tem
p
Flo
flow @ Downsville Average temperature @ Terry's Campsite
Maximum temperature @ Terry's Campsite Minimum temperature @ Terry's Campsite

60
65
70
75
2,000
3,000
4,000
pera
ture
(°F)
ow (C
FS)
Appendix 2N. Summer daily average, maximum, and minimum water temperature profiles on the East Branch at Deutch's Flat, along with daily average flows at Downsville, 2009.
40
45
50
55
0
1,000
3-Jun 10-Jun 17-Jun 24-Jun 1-Jul 8-Jul 15-Jul 22-Jul 29-Jul 5-Aug 12-Aug 19-Aug 26-Aug 2-Sep 9-Sep 16-Sep 23-Sep 30-Sep 7-Oct
Tem
p
Flo
flow @ Downsville Average temperature @ Deutch's Flat
Maximum temperature @ Deutch's Flat Minimum temperature @ Deutch's Flat

60
65
70
75
2,000
3,000
4,000
pera
ture
(°F)
ow (C
FS)
Appendix 2O. Summer daily average, maximum, and minimum water temperature profiles on the East Branch at Harvard, along with daily average flows at Downsville, 2009.
40
45
50
55
0
1,000
3-Jun 10-Jun 17-Jun 24-Jun 1-Jul 8-Jul 15-Jul 22-Jul 29-Jul 5-Aug 12-Aug 19-Aug 26-Aug 2-Sep 9-Sep 16-Sep 23-Sep 30-Sep 7-Oct
Tem
p
Flo
flow @ Downsville Average temperature @ Harvard Maximum temperature @ Harvard Minimum temperature @ Harvard

60
65
70
75
2,000
3,000
4,000
pera
ture
(°F)
ow (C
FS)
Appendix 2P. Summer daily average, maximum, and minimum water temperature profiles from the USGS gage on the East Branch at Harvard, along with daily average flows at Downsville, 2009.
40
45
50
55
0
1,000
3-Jun 10-Jun 17-Jun 24-Jun 1-Jul 8-Jul 15-Jul 22-Jul 29-Jul 5-Aug 12-Aug 19-Aug 26-Aug 2-Sep 9-Sep 16-Sep 23-Sep 30-Sep 7-Oct
Tem
p
Flo
flow @ Downsville Average temperature @ Harvard Maximum temperature @ Harvard Minimum temperature @ Harvard

60
65
70
75
2,000
3,000
4,000
pera
ture
(°F)
ow (C
FS)
Appendix 2Q. Summer daily average, maximum, and minimum water temperature profiles on the East Branch at East Branch, along with daily average flows at Downsville, 2009.
40
45
50
55
0
1,000
3-Jun 10-Jun 17-Jun 24-Jun 1-Jul 8-Jul 15-Jul 22-Jul 29-Jul 5-Aug 12-Aug 19-Aug 26-Aug 2-Sep 9-Sep 16-Sep 23-Sep 30-Sep 7-Oct
Tem
p
Flo
flow @ Downsville Average temperature @ East Branch
Maximum temperature @ East Branch Minimum temperature @ East Branch

60
65
70
75
80
2,000
3,000
4,000
pera
ture
(°F)
ow (C
FS)
Appendix 2R. Summer daily average, maximum, and minimum water temperature profiles from the USGS gage on the East Branch at Fishs Eddy, along with daily average flows at Downsville, 2009.
40
45
50
55
0
1,000
3-Jun 10-Jun 17-Jun 24-Jun 1-Jul 8-Jul 15-Jul 22-Jul 29-Jul 5-Aug 12-Aug 19-Aug 26-Aug 2-Sep 9-Sep 16-Sep 23-Sep 30-Sep 7-Oct
Tem
p
Flo
flow @ Downsville Average temperature @ Fishes Eddy
Maximum temperature @ Fishes Eddy Minimum temperature @ Fishes Eddy

60
65
70
75
80
2,000
3,000
4,000
pera
ture
(°F)
ow (C
FS)
Appendix 2S. Summer daily average, maximum, and minimum water temperature profiles on the East Branch at Hancock, along with daily average flows at Downsville, 2009.
40
45
50
55
0
1,000
3-Jun 10-Jun 17-Jun 24-Jun 1-Jul 8-Jul 15-Jul 22-Jul 29-Jul 5-Aug 12-Aug 19-Aug 26-Aug 2-Sep 9-Sep 16-Sep 23-Sep 30-Sep
Tem
p
Flo
flow @ Downsville Average temperature @ Hancock Maximum temperature @ Hancock Minimum temperature @ Hancock

60
65
70
75
2,000
3,000
4,000
pera
ture
(°F)
ow (C
FS)
Appendix 2T. Summer daily average, maximum, and minimum water temperature profiles on the Neversink at Hasbrouck, along with daily average flows at Neversink, 2009.
40
45
50
55
0
1,000
3-Jun 10-Jun 17-Jun 24-Jun 1-Jul 8-Jul 15-Jul 22-Jul 29-Jul 5-Aug 12-Aug 19-Aug 26-Aug 2-Sep 9-Sep 16-Sep 23-Sep 30-Sep 7-Oct
Tem
p
Flo
flow @ Neversink Average temperature @ Hasbrouck Maximum temperature @ Hasbrouck Minimum temperature @ Hasbrouck

60
65
70
75
2,000
3,000
4,000
pera
ture
(°F)
ow (C
FS)
Appendix 2U. Summer daily average, maximum, and minimum water temperature profiles on the Neversink at Woodbourne, along with daily average flows at Neversink, 2009.
40
45
50
55
0
1,000
3-Jun 10-Jun 17-Jun 24-Jun 1-Jul 8-Jul 15-Jul 22-Jul 29-Jul 5-Aug 12-Aug 19-Aug 26-Aug 2-Sep 9-Sep 16-Sep 23-Sep 30-Sep 7-Oct
Tem
p
Flo
flow @ Neversink Average temperature @ Woodbourne
Maximum temperature @ Woodbourne Minimum temperature @ Woodbourne

60
65
70
75
2,000
3,000
4,000
pera
ture
(°F)
ow (C
FS)
Appendix 2V. Summer daily average, maximum, and minimum water temperature profiles on the Neversink just above Fallsburg, along with daily average flows at Neversink, 2009.
40
45
50
55
0
1,000
3-Jun 10-Jun 17-Jun 24-Jun 1-Jul 8-Jul 15-Jul 22-Jul 29-Jul 5-Aug 12-Aug 19-Aug 26-Aug 2-Sep 9-Sep 16-Sep 23-Sep 30-Sep 7-Oct
Tem
p
Flo
flow @ Neversink Average temperature @ above Fallsburg
Maximum temperature @ above Fallsburg Minimum temperature @ above Fallsburg

60
65
70
75
2,000
3,000
4,000
pera
ture
(°F)
ow (C
FS)
Appendix 2W. Summer daily average, maximum, and minimum water temperature profiles on the Neversink at Ranch Rd bridge, along with daily average flows at Neversink, 2009.
40
45
50
55
0
1,000
3-Jun 10-Jun 17-Jun 24-Jun 1-Jul 8-Jul 15-Jul 22-Jul 29-Jul 5-Aug 12-Aug 19-Aug 26-Aug 2-Sep 9-Sep 16-Sep 23-Sep 30-Sep 7-Oct
Tem
p
Flo
flow @ Neversink Average temperature @ Ranch Rd Bridge
Maximum temperature @ Ranch Rd Bridge Minimum temperature @ Ranch Rd Bridge

60
65
70
75
2,000
3,000
4,000
pera
ture
(°F)
ow (C
FS)
Appendix 2X. Summer daily average, maximum, and minimum water temperature profiles on the Neversink at Bridgeville, along with daily average flows at Bridgeville & Neversink, 2009.
40
45
50
55
0
1,000
3-Jun 10-Jun 17-Jun 24-Jun 1-Jul 8-Jul 15-Jul 22-Jul 29-Jul 5-Aug 12-Aug 19-Aug 26-Aug 2-Sep 9-Sep 16-Sep 23-Sep 30-Sep 7-Oct
Tem
p
Flo
flow @ Neversink flow @ Bridgeville Average temperature @ Bridgeville
Maximum temperature @ Bridgeville Minimum temperature @ Bridgeville

60
65
70
75
80
12,000
16,000
20,000
pera
ture
(°F)
ow (C
FS)
Appendix 2Y. Summer daily average, maximum, and minimum water temperature profiles on the Delaware River at Leonards, along with daily average flows at Stilesville on the West Branch and
Lordville, 2009.
40
45
50
55
0
4,000
8,000
1-Jun 8-Jun 15-Jun 22-Jun 29-Jun 6-Jul 13-Jul 20-Jul 27-Jul 3-Aug 10-Aug 17-Aug 24-Aug 31-Aug 7-Sep 14-Sep 21-Sep 28-Sep 5-Oct
Tem
p
Flo
flow @ Stilesville flow @ Lordville Average temperature @ Leonards
Maximum temperature @ Leonards Minimum temperature @ Leonards

60
65
70
75
80
12,000
16,000
20,000
pera
ture
(°F)
ow (C
FS)
Appendix 2Z. Summer daily average, maximum, and minimum water temperature profiles on the Delaware River at Lordville, along with daily average flows at Stilesville on the West Branch and
Lordville, 2009.
40
45
50
55
0
4,000
8,000
1-Jun 8-Jun 15-Jun 22-Jun 29-Jun 6-Jul 13-Jul 20-Jul 27-Jul 3-Aug 10-Aug 17-Aug 24-Aug 31-Aug 7-Sep 14-Sep 21-Sep 28-Sep 5-Oct
Tem
p
Flo
flow @ Stilesville flow @ Lordville Average temperature @ Lordville
Maximum temperature @ Lordville Minimum temperature @ Lordville

60
65
70
75
80
12,000
16,000
20,000
pera
ture
(°F)
ow (C
FS)
Appendix 2AA. Summer daily average, maximum, and minimum water temperature profiles on the Delaware River at Abe Lord, along with daily average flows at Stilesville on the West Branch
and Lordville, 2009.
40
45
50
55
0
4,000
8,000
1-Jun 8-Jun 15-Jun 22-Jun 29-Jun 6-Jul 13-Jul 20-Jul 27-Jul 3-Aug 10-Aug 17-Aug 24-Aug 31-Aug 7-Sep 14-Sep 21-Sep 28-Sep 5-Oct
Tem
p
Flo
flow @ Stilesville flow @ Lordville Average temperature @ Abe Lord
Maximum temperature @ Abe Lord Minimum temperature @ Abe Lord

60
65
70
75
80
12,000
16,000
20,000
pera
ture
(°F)
ow (C
FS)
Appendix 2BB. Summer daily average, maximum, and minimum water temperature profiles on the Delaware River at Kellams Bridge, along with daily average flows at Stilesville on the West Branch
and Lordville, 2009.
40
45
50
55
0
4,000
8,000
1-Jun 8-Jun 15-Jun 22-Jun 29-Jun 6-Jul 13-Jul 20-Jul 27-Jul 3-Aug 10-Aug 17-Aug 24-Aug 31-Aug 7-Sep 14-Sep 21-Sep 28-Sep 5-Oct
Tem
p
Flo
flow @ Stilesville flow @ Lordville Average temperature @ Kellams Bridge
Maximum temperature @ Kellams Bridge Minimum temperature @ Kellams Bridge

60
65
70
75
80
12,000
16,000
20,000
pera
ture
(°F)
ow (C
FS)
Appendix 2CC. Summer daily average, maximum, and minimum water temperature profiles on the Delaware River at Callicoon, along with daily average flows at Stilesville on the West Branch and
Lordville, 2009.
40
45
50
55
0
4,000
8,000
1-Jun 8-Jun 15-Jun 22-Jun 29-Jun 6-Jul 13-Jul 20-Jul 27-Jul 3-Aug 10-Aug 17-Aug 24-Aug 31-Aug 7-Sep 14-Sep 21-Sep 28-Sep 5-Oct
Tem
p
Flo
flow @ Stilesville flow @ Lordville Average temperature @ Callicoon
Maximum temperature @ Callicoon Minimum temperature @ Callicoon
Appendix 3:
UPPER DELAWARE TAILWATERS
Maxima, minima, and average summer water temperature profile for each temperature monitoring site, 2010
West Branch: Appendices 3A to 3I East Branch: Appendices 3J to 3Q
Neversink River: Appendices 3R to 3V Delaware River: Appendices 3W to 3AA
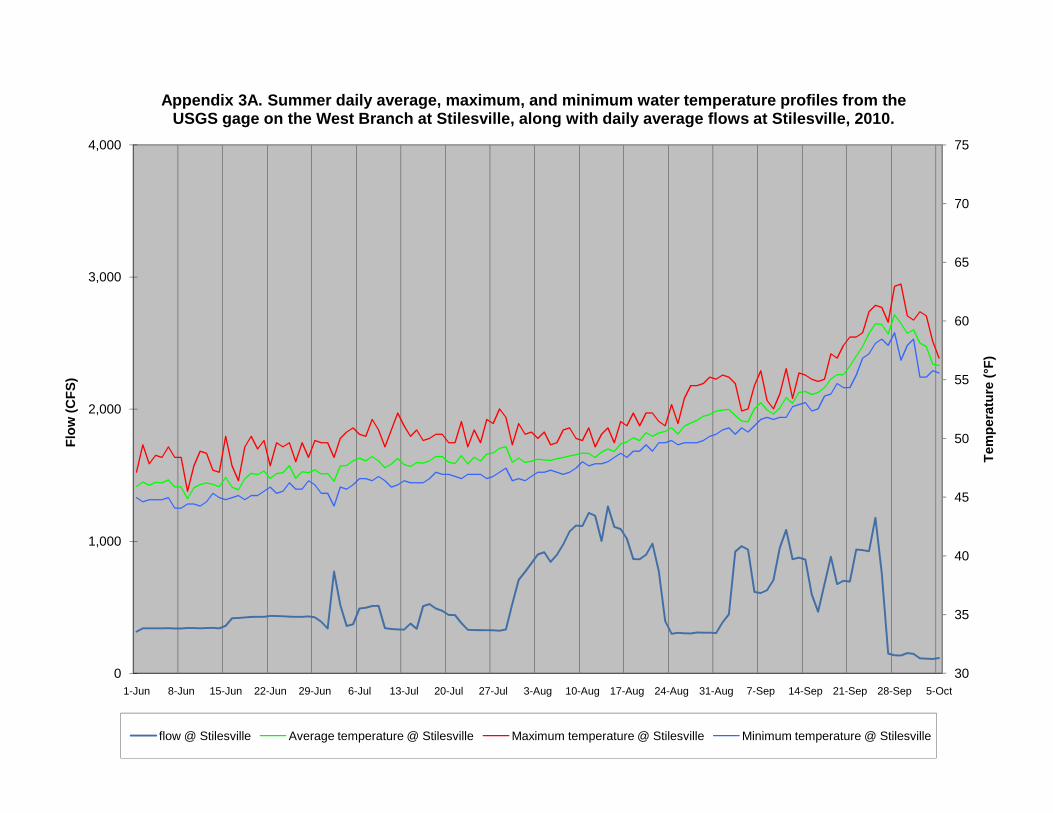
55
60
65
70
75
2,000
3,000
4,000
pera
ture
(°F)
ow (C
FS)
Appendix 3A. Summer daily average, maximum, and minimum water temperature profiles from the USGS gage on the West Branch at Stilesville, along with daily average flows at Stilesville, 2010.
30
35
40
45
50
0
1,000
1-Jun 8-Jun 15-Jun 22-Jun 29-Jun 6-Jul 13-Jul 20-Jul 27-Jul 3-Aug 10-Aug 17-Aug 24-Aug 31-Aug 7-Sep 14-Sep 21-Sep 28-Sep 5-Oct
Tem
p
Flo
flow @ Stilesville Average temperature @ Stilesville Maximum temperature @ Stilesville Minimum temperature @ Stilesville

55
60
65
70
75
2,000
3,000
4,000
pera
ture
(°F)
ow (C
FS)
Appendix 3B. Summer daily average, maximum, and minimum water temperature profiles on the West Branch at Stilesville, along with daily average flows at Stilesville, 2010.
30
35
40
45
50
0
1,000
1-Jun 8-Jun 15-Jun 22-Jun 29-Jun 6-Jul 13-Jul 20-Jul 27-Jul 3-Aug 10-Aug 17-Aug 24-Aug 31-Aug 7-Sep 14-Sep 21-Sep 28-Sep 5-Oct
Tem
p
Flo
flow @ Stilesville Average temperature @ Stilesville Maximum temperature @ Stilesville Minimum temperature @ Stilesville

55
60
65
70
75
2,000
3,000
4,000
pera
ture
(°F)
ow (C
FS)
Appendix 3C. Summer daily average, maximum, and minimum water temperature profiles on the West Branch at Hale Eddy, along with daily average flows at Stilesville, 2010.
30
35
40
45
50
0
1,000
1-Jun 8-Jun 15-Jun 22-Jun 29-Jun 6-Jul 13-Jul 20-Jul 27-Jul 3-Aug 10-Aug 17-Aug 24-Aug 31-Aug 7-Sep 14-Sep 21-Sep 28-Sep 5-Oct
Tem
p
Flo
flow @ Stilesville Average temperature @ Hale Eddy Maximum temperature @ Hale Eddy Minimum temperature @ Hale Eddy

55
60
65
70
75
2,000
3,000
4,000
pera
ture
(°F)
ow (C
FS)
Appendix 3D. Summer daily average, maximum, and minimum water temperature profiles from the USGS gage on the West Branch at Hale Eddy, along with daily average flows at Stilesville, 2010.
30
35
40
45
50
0
1,000
1-Jun 8-Jun 15-Jun 22-Jun 29-Jun 6-Jul 13-Jul 20-Jul 27-Jul 3-Aug 10-Aug 17-Aug 24-Aug 31-Aug 7-Sep 14-Sep 21-Sep 28-Sep 5-Oct
Tem
p
Flo
flow @ Stilesville Average temperature @ Hale Eddy Maximum temperature @ Hale Eddy Minimum temperature @ Hale Eddy

55
60
65
70
75
2,000
3,000
4,000
pera
ture
(°F)
ow (C
FS)
Appendix 3E. Summer daily average, maximum, and minimum water temperature profiles on the West Branch at Roods Creek, along with daily average flows at Stilesville, 2010.
30
35
40
45
50
0
1,000
1-Jun 8-Jun 15-Jun 22-Jun 29-Jun 6-Jul 13-Jul 20-Jul 27-Jul 3-Aug 10-Aug 17-Aug 24-Aug 31-Aug 7-Sep 14-Sep 21-Sep 28-Sep 5-Oct
Tem
p
Flo
flow @ Stilesville Average temperature @ Roods Creek
Maximum temperature @ Roods Creek Minimum temperature @ Roods Creek

55
60
65
70
75
2,000
3,000
4,000
pera
ture
(°F)
ow (C
FS)
Appendix 3F. Summer daily average, maximum, and minimum water temperature profiles on the West Branch at Balls Eddy, along with daily average flows at Stilesville, 2010.
30
35
40
45
50
0
1,000
1-Jun 8-Jun 15-Jun 22-Jun 29-Jun 6-Jul 13-Jul 20-Jul 27-Jul 3-Aug 10-Aug 17-Aug 24-Aug 31-Aug 7-Sep 14-Sep 21-Sep 28-Sep 5-Oct
Tem
p
Flo
flow @ Stilesville Average temperature @ Balls Eddy Maximum temperature @ Balls Eddy Minimum temperature @ Balls Eddy

55
60
65
70
75
2,000
3,000
4,000
pera
ture
(°F)
ow (C
FS)
Appendix 3G. Summer daily average, maximum, and minimum water temperature profiles on the West Branch at Hancock, along with daily average flows at Stilesville, 2010.
30
35
40
45
50
0
1,000
1-Jun 8-Jun 15-Jun 22-Jun 29-Jun 6-Jul 13-Jul 20-Jul 27-Jul 3-Aug 10-Aug 17-Aug 24-Aug 31-Aug 7-Sep 14-Sep 21-Sep 28-Sep 5-Oct
Tem
p
Flo
flow @ Stilesville Average temperature @ Hancock Maximum temperature @ Hancock Minimum temperature @ Hancock

55
60
65
70
75
2,000
3,000
4,000
pera
ture
(°F)
ow (C
FS)
Appendix 3H. Summer daily average, maximum, and minimum water temperature profiles from the USGS gage on the West Branch at Hancock, along with daily average flows at Stilesville, 2010.
30
35
40
45
50
0
1,000
1-Jun 8-Jun 15-Jun 22-Jun 29-Jun 6-Jul 13-Jul 20-Jul 27-Jul 3-Aug 10-Aug 17-Aug 24-Aug 31-Aug 7-Sep 14-Sep 21-Sep 28-Sep 5-Oct
Tem
p
Flo
flow @ Stilesville Average temperature @ Hancock Maximum temperature @ Hancock Minimum temperature @ Hancock
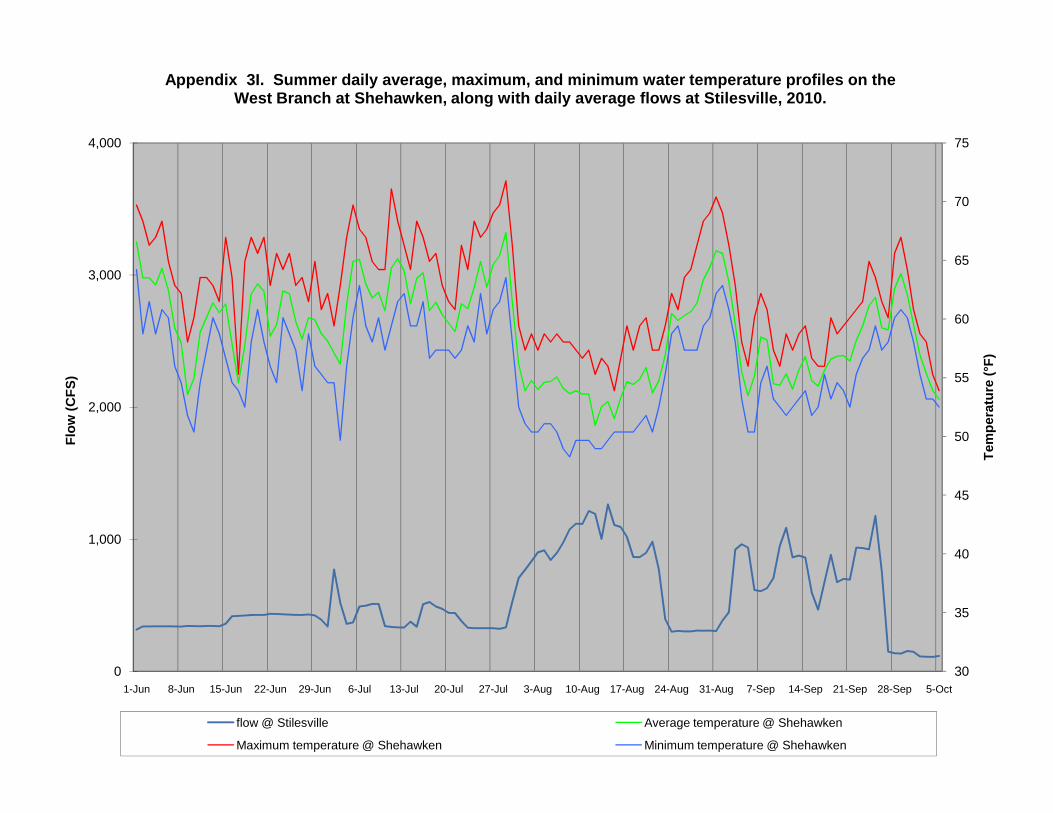
55
60
65
70
75
2,000
3,000
4,000
pera
ture
(°F)
ow (C
FS)
Appendix 3I. Summer daily average, maximum, and minimum water temperature profiles on the West Branch at Shehawken, along with daily average flows at Stilesville, 2010.
30
35
40
45
50
0
1,000
1-Jun 8-Jun 15-Jun 22-Jun 29-Jun 6-Jul 13-Jul 20-Jul 27-Jul 3-Aug 10-Aug 17-Aug 24-Aug 31-Aug 7-Sep 14-Sep 21-Sep 28-Sep 5-Oct
Tem
p
Flo
flow @ Stilesville Average temperature @ Shehawken
Maximum temperature @ Shehawken Minimum temperature @ Shehawken

60
65
70
75
2,000
3,000
4,000
pera
ture
(°F)
ow (C
FS)
Appendix 3J. Summer daily average, maximum, and minimum water temperature profiles on the East Branch at Downsville, along with daily average flows at Downsville, 2010.
40
45
50
55
0
1,000
3-Jun 10-Jun 17-Jun 24-Jun 1-Jul 8-Jul 15-Jul 22-Jul 29-Jul 5-Aug 12-Aug 19-Aug 26-Aug 2-Sep 9-Sep 16-Sep 23-Sep 30-Sep 7-Oct
Tem
p
Flo
flow @ Downsville Average temperature @ Downsville
Maximum temperature @ Downsville Minimum temperature @ Downsville

60
65
70
75
2,000
3,000
4,000
pera
ture
(°F)
ow (C
FS)
Appendix 3K. Summer daily average, maximum, and minimum water temperature profiles on the East Branch at Shinhopple, along with daily average flows at Downsville, 2010.
40
45
50
55
0
1,000
3-Jun 10-Jun 17-Jun 24-Jun 1-Jul 8-Jul 15-Jul 22-Jul 29-Jul 5-Aug 12-Aug 19-Aug 26-Aug 2-Sep 9-Sep 16-Sep 23-Sep 30-Sep 7-Oct
Tem
p
Flo
flow @ Downsville Average temperature @ Shinhopple
Maximum temperature @ Shinhopple Minimum temperature @ Shinhopple
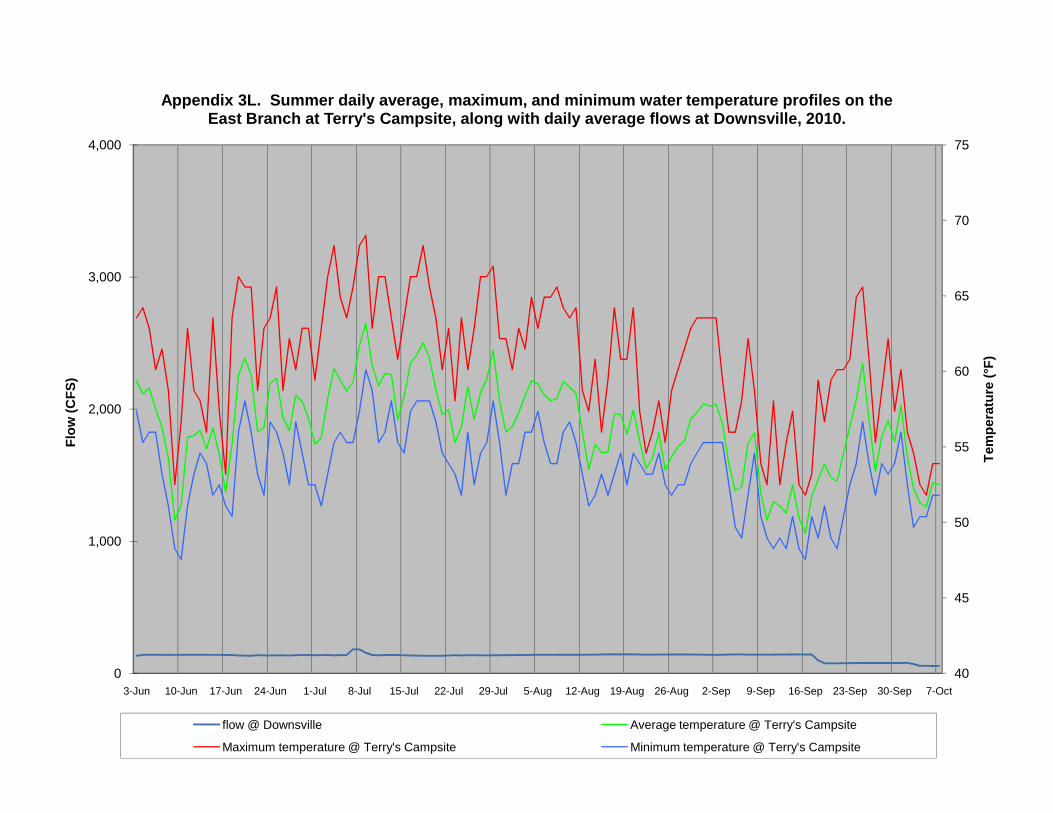
60
65
70
75
2,000
3,000
4,000
pera
ture
(°F)
ow (C
FS)
Appendix 3L. Summer daily average, maximum, and minimum water temperature profiles on the East Branch at Terry's Campsite, along with daily average flows at Downsville, 2010.
40
45
50
55
0
1,000
3-Jun 10-Jun 17-Jun 24-Jun 1-Jul 8-Jul 15-Jul 22-Jul 29-Jul 5-Aug 12-Aug 19-Aug 26-Aug 2-Sep 9-Sep 16-Sep 23-Sep 30-Sep 7-Oct
Tem
p
Flo
flow @ Downsville Average temperature @ Terry's Campsite
Maximum temperature @ Terry's Campsite Minimum temperature @ Terry's Campsite

60
65
70
75
2,000
3,000
4,000
pera
ture
(°F)
ow (C
FS)
Appendix 3M. Summer daily average, maximum, and minimum water temperature profiles on the East Branch at Deutch's Flat, along with daily average flows at Downsville, 2010.
40
45
50
55
0
1,000
3-Jun 10-Jun 17-Jun 24-Jun 1-Jul 8-Jul 15-Jul 22-Jul 29-Jul 5-Aug 12-Aug 19-Aug 26-Aug 2-Sep 9-Sep 16-Sep 23-Sep 30-Sep 7-Oct
Tem
p
Flo
flow @ Downsville Average temperature @ Deutch's Flat
Maximum temperature @ Deutch's Flat Minimum temperature @ Deutch's Flat

60
65
70
75
2,000
3,000
4,000
pera
ture
(°F)
ow (C
FS)
Appendix 3N. Summer daily average, maximum, and minimum water temperature profiles from the USGS gage on the East Branch at Harvard, along with daily average flows at Downsville, 2010.
40
45
50
55
0
1,000
3-Jun 10-Jun 17-Jun 24-Jun 1-Jul 8-Jul 15-Jul 22-Jul 29-Jul 5-Aug 12-Aug 19-Aug 26-Aug 2-Sep 9-Sep 16-Sep 23-Sep 30-Sep 7-Oct
Tem
p
Flo
flow @ Downsville Average temperature @ Harvard Maximum temperature @ Harvard Minimum temperature @ Harvard
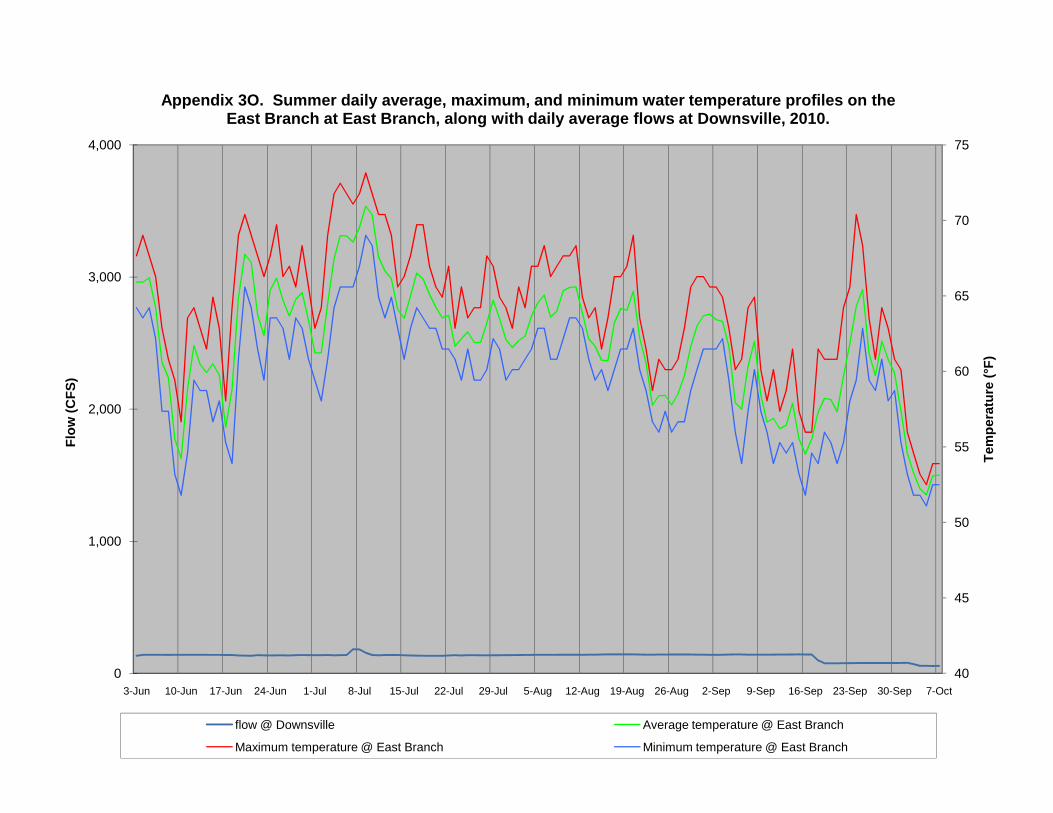
60
65
70
75
2,000
3,000
4,000
pera
ture
(°F)
ow (C
FS)
Appendix 3O. Summer daily average, maximum, and minimum water temperature profiles on the East Branch at East Branch, along with daily average flows at Downsville, 2010.
40
45
50
55
0
1,000
3-Jun 10-Jun 17-Jun 24-Jun 1-Jul 8-Jul 15-Jul 22-Jul 29-Jul 5-Aug 12-Aug 19-Aug 26-Aug 2-Sep 9-Sep 16-Sep 23-Sep 30-Sep 7-Oct
Tem
p
Flo
flow @ Downsville Average temperature @ East Branch
Maximum temperature @ East Branch Minimum temperature @ East Branch

65
70
75
80
85
2,000
3,000
4,000
pera
ture
(°F)
ow (C
FS)
Appendix 3P. Summer daily average, maximum, and minimum water temperature profiles from the USGS gage on the East Branch at Fishs Eddy, along with daily average flows at Downsville, 2010.
45
50
55
60
0
1,000
3-Jun 10-Jun 17-Jun 24-Jun 1-Jul 8-Jul 15-Jul 22-Jul 29-Jul 5-Aug 12-Aug 19-Aug 26-Aug 2-Sep 9-Sep 16-Sep 23-Sep 30-Sep 7-Oct
Tem
p
Flo
flow @ Downsville Average temperature @ Fishes Eddy
Maximum temperature @ Fishes Eddy Minimum temperature @ Fishes Eddy

70
75
80
85
90
2,000
3,000
4,000
pera
ture
(°F)
ow (C
FS)
Appendix 3Q. Summer daily average, maximum, and minimum water temperature profiles on the East Branch at Hancock, along with daily average flows at Downsville, 2010.
50
55
60
65
0
1,000
3-Jun 10-Jun 17-Jun 24-Jun 1-Jul 8-Jul 15-Jul 22-Jul 29-Jul 5-Aug 12-Aug 19-Aug 26-Aug 2-Sep 9-Sep 16-Sep 23-Sep 30-Sep
Tem
p
Flo
flow @ Downsville Average temperature @ Hancock Maximum temperature @ Hancock Minimum temperature @ Hancock

60
65
70
75
2,000
3,000
4,000
pera
ture
(°F)
ow (C
FS)
Appendix 3R. Summer daily average, maximum, and minimum water temperature profiles on the Neversink at Hasbrouck, along with daily average flows at Neversink, 2010.
40
45
50
55
0
1,000
3-Jun 10-Jun 17-Jun 24-Jun 1-Jul 8-Jul 15-Jul 22-Jul 29-Jul 5-Aug 12-Aug 19-Aug 26-Aug 2-Sep 9-Sep 16-Sep 23-Sep 30-Sep 7-Oct
Tem
p
Flo
flow @ Neversink Average temperature @ Hasbrouck Maximum temperature @ Hasbrouck Minimum temperature @ Hasbrouck

60
65
70
75
2,000
3,000
4,000
pera
ture
(°F)
ow (C
FS)
Appendix 3S. Summer daily average, maximum, and minimum water temperature profiles on the Neversink at Woodbourne, along with daily average flows at Neversink, 2010.
40
45
50
55
0
1,000
3-Jun 10-Jun 17-Jun 24-Jun 1-Jul 8-Jul 15-Jul 22-Jul 29-Jul 5-Aug 12-Aug 19-Aug 26-Aug 2-Sep 9-Sep 16-Sep 23-Sep 30-Sep 7-Oct
TemFl
o
flow @ Neversink Average temperature @ Woodbourne
Maximum temperature @ Woodbourne Minimum temperature @ Woodbourne

60
65
70
75
2,000
3,000
4,000
pera
ture
(°F)
ow (C
FS)
Appendix 3T. Summer daily average, maximum, and minimum water temperature profiles on the Neversink just above Fallsburg, along with daily average flows at Neversink, 2010.
40
45
50
55
0
1,000
3-Jun 10-Jun 17-Jun 24-Jun 1-Jul 8-Jul 15-Jul 22-Jul 29-Jul 5-Aug 12-Aug 19-Aug 26-Aug 2-Sep 9-Sep 16-Sep 23-Sep 30-Sep 7-Oct
Tem
p
Flo
flow @ Neversink Average temperature @ above Fallsburg
Maximum temperature @ above Fallsburg Minimum temperature @ above Fallsburg

60
65
70
75
2,000
3,000
4,000
pera
ture
(°F)
ow (C
FS)
Appendix 3U. Summer daily average, maximum, and minimum water temperature profiles on the Neversink at Ranch Rd bridge, along with daily average flows at Neversink, 2010.
40
45
50
55
0
1,000
3-Jun 10-Jun 17-Jun 24-Jun 1-Jul 8-Jul 15-Jul 22-Jul 29-Jul 5-Aug 12-Aug 19-Aug 26-Aug 2-Sep 9-Sep 16-Sep 23-Sep 30-Sep 7-Oct
Tem
p
Flo
flow @ Neversink Average temperature @ Ranch Rd Bridge
Maximum temperature @ Ranch Rd Bridge Minimum temperature @ Ranch Rd Bridge

60
65
70
75
80
2,000
3,000
4,000
pera
ture
(°F)
ow (C
FS)
Appendix 3V. Summer daily average, maximum, and minimum water temperature profiles on the Neversink at Bridgeville, along with daily average flows at Bridgeville & Neversink, 2010.
40
45
50
55
0
1,000
3-Jun 10-Jun 17-Jun 24-Jun 1-Jul 8-Jul 15-Jul 22-Jul 29-Jul 5-Aug 12-Aug 19-Aug 26-Aug 2-Sep 9-Sep 16-Sep 23-Sep 30-Sep 7-Oct
Tem
p
Flo
flow @ Neversink flow @ Bridgeville Average temperature @ Bridgeville
Maximum temperature @ Bridgeville Minimum temperature @ Bridgeville

60
65
70
75
80
6,000
8,000
10,000
pera
ture
(°F)
ow (C
FS)
Appendix 3W. Summer daily average, maximum, and minimum water temperature profiles on the Delaware River at Leonards, along with daily average flows at Stilesville on the West Branch and
Lordville, 2010.
40
45
50
55
0
2,000
4,000
1-Jun 8-Jun 15-Jun 22-Jun 29-Jun 6-Jul 13-Jul 20-Jul 27-Jul 3-Aug 10-Aug 17-Aug 24-Aug 31-Aug 7-Sep 14-Sep 21-Sep 28-Sep 5-Oct
Tem
p
Flo
flow @ Stilesville flow @ Lordville Average temperature @ Leonards
Maximum temperature @ Leonards Minimum temperature @ Leonards

65
70
75
80
85
6,000
8,000
10,000
pera
ture
(°F)
ow (C
FS)
Appendix 3X. Summer daily average, maximum, and minimum water temperature profiles on the Delaware River at Lordville, along with daily average flows at Stilesville on the West Branch and
Lordville, 2010.
45
50
55
60
0
2,000
4,000
1-Jun 8-Jun 15-Jun 22-Jun 29-Jun 6-Jul 13-Jul 20-Jul 27-Jul 3-Aug 10-Aug 17-Aug 24-Aug 31-Aug 7-Sep 14-Sep 21-Sep 28-Sep 5-Oct
Tem
p
Flo
flow @ Stilesville flow @ Lordville Average temperature @ Lordville
Maximum temperature @ Lordville Minimum temperature @ Lordville

65
70
75
80
85
6,000
8,000
10,000
pera
ture
(°F)
ow (C
FS)
Appendix 3Y. Summer daily average, maximum, and minimum water temperature profiles on the Delaware River at Abe Lord, along with daily average flows at Stilesville on the West Branch and
Lordville, 2010.
45
50
55
60
0
2,000
4,000
1-Jun 8-Jun 15-Jun 22-Jun 29-Jun 6-Jul 13-Jul 20-Jul 27-Jul 3-Aug 10-Aug 17-Aug 24-Aug 31-Aug 7-Sep 14-Sep 21-Sep 28-Sep 5-Oct
Tem
p
Flo
flow @ Stilesville flow @ Lordville Average temperature @ Abe Lord
Maximum temperature @ Abe Lord Minimum temperature @ Abe Lord

65
70
75
80
85
6,000
8,000
10,000
pera
ture
(°F)
ow (C
FS)
Appendix 3Z. Summer daily average, maximum, and minimum water temperature profiles on the Delaware River at Kellams Bridge, along with daily average flows at Stilesville on the West Branch
and Lordville, 2010.
45
50
55
60
0
2,000
4,000
1-Jun 8-Jun 15-Jun 22-Jun 29-Jun 6-Jul 13-Jul 20-Jul 27-Jul 3-Aug 10-Aug 17-Aug 24-Aug 31-Aug 7-Sep 14-Sep 21-Sep 28-Sep 5-Oct
Tem
p
Flo
flow @ Stilesville flow @ Lordville Average temperature @ Kellams Bridge
Maximum temperature @ Kellams Bridge Minimum temperature @ Kellams Bridge
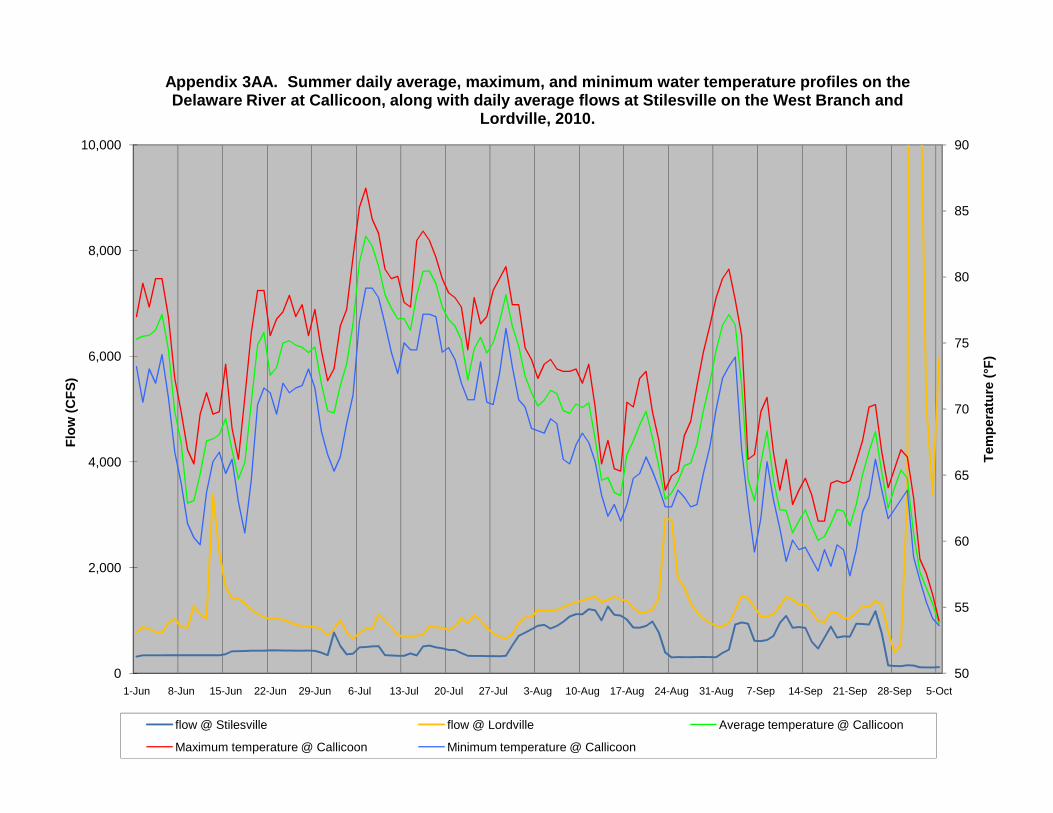
70
75
80
85
90
6,000
8,000
10,000
pera
ture
(°F)
ow (C
FS)
Appendix 3AA. Summer daily average, maximum, and minimum water temperature profiles on the Delaware River at Callicoon, along with daily average flows at Stilesville on the West Branch and
Lordville, 2010.
50
55
60
65
0
2,000
4,000
1-Jun 8-Jun 15-Jun 22-Jun 29-Jun 6-Jul 13-Jul 20-Jul 27-Jul 3-Aug 10-Aug 17-Aug 24-Aug 31-Aug 7-Sep 14-Sep 21-Sep 28-Sep 5-Oct
Tem
p
Flo
flow @ Stilesville flow @ Lordville Average temperature @ Callicoon
Maximum temperature @ Callicoon Minimum temperature @ Callicoon

Appendix 4:
UPPER DELAWARE TAILWATERS
2008 Trout Population Studies
East Branch: Appendices 4A to 4D Neversink River: Appendices 4E to 4G

Appendix 4A: Summary of the 2008 trout population study at Airport Pool on the East Branch.
Airport Pool-2008 June 24-25 4.2 miles below dam 186-179 cfs
Inch Group Number Mean Wt(lbs) Percent BT Estimated N Biomass(lbs) N/acre Lbs/acre3 2 0.0214 0.0241 2 4 0.08 1.4 0.04 28 0.0344 0.3373 28 51 1.75 19.8 0.75 28 0.0555 0.3373 28 51 2.83 19.8 1.16 13 0.0941 0.1566 13 24 2.23 9.2 0.97 7 0.1423 0.0843 7 13 1.81 5.0 0.78 2 0.2363 0.0241 2 4 0.86 1.4 0.39 1 0.2892 0.0120 1 2 0.53 0.7 0.21011121314 1 1.1454 0.0120 1 2 2.08 0.7 0.8151617 1 2.1145 0.0120 1 2 3.85 0.7 1.5Totals 83 1 83 151 16.01 58.8 6.2
Marked Captured Recaps Station length=1077 ft62 35 14 Width=104 ft
Acreage=2.57 acresPopulation = 151 CI = 101-201
CI = +50
Wild Brown TroutNumber Length(in) Weight(lbs) Percent Estimated N Biomass(lbs) N/acre Lbs/acre
Age 1 71 5.18 0.053 0.8554 129 6.88 50.3 2.7Age 2 10 7.80 0.176 0.1205 18 3.20 7.1 1.2Age 3 1 14.13 1.145 0.0120 2 2.08 0.7 0.8Age 4 1 17.52 2.115 0.0120 2 3.85 0.7 1.5
Totals 83 1 151 16.01 58.8 6.2

Appendix 4B: Summary of the 2008 trout population study at the T28 Pool on the East Branch.
T28 Pool-2008 June 26-27 6.3 miles below dam 179-176 cfs
Inch Group Number Mean Wt(lbs) Percent BT HBT RT Estimated N Biomass(lbs) N/acre Lbs/acre3 3 0.0207 0.0167 3 6 0.12 3.9 0.14 81 0.0347 0.4500 81 150 5.20 105.5 3.75 66 0.0581 0.3667 66 122 7.10 86.0 5.06 11 0.0930 0.0611 11 20 1.89 14.3 1.37 3 0.1611 0.0167 3 6 0.89 3.9 0.68 10 0.2080 0.0556 9 1 19 3.85 13.0 2.79 4 0.3196 0.0222 2 2 7 2.37 5.2 1.7
10111213 1 0.9031 0.0056 1 2 1.67 1.3 1.214151617181920 1 2.5110 0.0056 1 2 4.65 1.3 3.3Totals 180 1.0 177 2 1 333 27.73 234.5 19.5
Marked Captured Recaps Station length=653 ft110 100 33 Width=95 ft
Acreage=1.42 acresPopulation = 333* CI = 257-409
CI = +76 *3 fish died on marking run. Added to the population estimate
Wild Brown TroutNumber Length(in) Weight(lbs) Percent Estimated N Biomass(lbs) N/acre Lbs/acre
Age 1 163 5.06 0.049 0.9056 302 14.86 212.4 10.5Age 2 12 8.51 0.225 0.0667 22 4.99 15.6 3.5Age 3 1 13.62 0.903 0.0056 2 1.67 1.3 1.2Age 5 1 20.24 2.511 0.0056 2 4.65 1.3 3.3
Hatchery Brown TroutAge 1 2 9.67 0.324 0.0111 4 1.20 2.6 0.8
Rainbow TroutAge 2 1 8.19 0.198 0.0056 2 0.37 1.3 0.3
Totals 180 1 333 27.73 234.5 19.5

Appendix 4C: Summary of the 2008 trout population study at the Cabin Pool on the East Branch.
Cabin Pool-2008 July 7-8 9.9 miles below dam 170-170 cfs
Inch Group Number Mean Wt(lbs) Percent BT Estimated N Biomass(lbs) N/acre Lbs/acre4 7 0.0409 0.0493 7 18 0.73 3.9 0.25 62 0.0613 0.4366 62 158 9.66 34.3 2.16 56 0.0972 0.3944 56 142 13.84 30.9 3.07 9 0.1433 0.0634 9 23 3.28 5.0 0.78 1 0.2096 0.0070 1 3 0.53 0.6 0.19 1 0.3356 0.0070 1 3 0.85 0.6 0.2
101112131415 1 1.5198 0.0070 1 3 3.86 0.6 0.816 0.0000 0 0.00 0.0 0.017 2 2.0264 0.0141 2 5 10.30 1.1 2.2181920 1 3.3260 0.0070 1 3 8.46 0.6 1.82122 2 3.9978 0.0141 2 5 20.33 1.1 4.4Totals 142 1 142 361 71.84 78.5 15.6
Marked Captured Recaps Station length=1806 ft96 58 15 Width=111 ft
Acreage=4.60 acresPopulation = 361 CI = 226-496
CI = +135
Wild Brown TroutNumber Length(in) Weight(lbs) Percent Estimated N Biomass(lbs) N/acre Lbs/acre
Age 1 134 6.00 0.081 0.9437 341 27.51 74.1 6.0Age 2 2 9.06 0.273 0.0141 5 1.39 1.1 0.3Age 3 2 16.42 1.652 0.0141 5 8.40 1.1 1.8Age 4 1 17.76 2.269 0.0070 3 5.77 0.6 1.3Age 5 1 20.43 3.326 0.0070 3 8.46 0.6 1.8Age 6 2 22.66 3.998 0.0141 5 20.33 1.1 4.4
Totals 142 1.0000 361 71.84 78.5 15.6

Appendix 4D: Summary of the 2008 trout population study at the T22 Pool on the East Branch.
T22 Pool-2008 July 9-10 14.9 miles below dam 170-170 cfs
Inch Group Number Mean Wt(lbs) Percent BT RT Estimated N Biomass(lbs) N/acre Lbs/acre5 1 0.0757 0.0833 1 2 0.13 0.9 0.16 3 0.101 0.2500 3 5 0.53 2.8 0.37 2 0.138 0.1667 2 4 0.48 1.9 0.389 2 0.299 0.1667 2 4 1.05 1.9 0.6
101112 1 0.7930 0.0833 1 2 1.39 0.9 0.713 1 0.8150 0.0833 1 2 1.43 0.9 0.81415 1 1.4868 0.0833 1 2 2.60 0.9 1.4161718192021 1 3.2599 0.0833 1 2 5.70 0.9 3.0
Totals 12 1 11 1 21 13.31 11.1 7.0
Marked Captured Recaps Station length=948 ft7 7 2 Width=87 ft
Acreage=1.89 acresPopulation = 21 CI = 7-35
CI = +14
Wild Brown TroutNumber Length(in) Weight(lbs) Percent Estimated N Biomass(lbs) N/acre Lbs/acre
Age 1 6 6.68 0.109 0.5000 11 1.15 5.6 0.6Age 2 2 9.39 0.299 0.1667 4 1.05 1.9 0.6Age 3 2 13.11 0.804 0.1667 4 2.81 1.9 1.5Age 6 1 21.14 3.260 0.0833 2 5.70 0.9 3.0
Rainbow TroutAge 3 1 15.16 1.487 0.0833 2 2.60 0.9 1.4
Totals 12 1 21 13.31 11.1 7.0

Appendix 4E: Summary of the 2008 trout population study at Hasbrouck on the Neversink River.
Hasbrouck-2008 July 28-29 2.8 miles below dam 99-99 cfs
Inch Group Number Mean Wt (lbs) Percent BT HBT ST Estimated N Biomass (lbs) N/acre Lbs/acre5 3 0.0696 0.1364 2 1 5 0.36 6.2 0.46 7 0.0915 0.3182 6 1 12 1.11 14.4 1.378 4 0.1992 0.1818 3 1 7 1.38 8.2 1.69 1 0.3157 0.0455 1 2 0.55 2.1 0.6
10 1 0.4330 0.0455 1 2 0.75 2.1 0.91112131415 2 1.3656 0.0909 2 3 4.72 4.1 5.616 2 1.5969 0.0909 2 3 5.52 4.1 6.617 1 1.8722 0.0455 1 2 3.23 2.1 3.818192021 1 2.7753 0.0455 1 2 4.79 2.1 5.7
TOTALS 22 1 19 1 2 38 22.40 45.2 26.7
Marked Captured Recaps Length=330 ft18 7 3 Width=111 ft
Area=0.84 acresPopulation = 38 CI = 17-59
CI = + 21
Wild Brown TroutNumber Length (in) Weight (lbs) Percent Estimated N Biomass (lbs) N/acre Lbs/acre
Age 1 10 6.4 0.098 0.4545 17 1.70 20.6 2.0Age 2 4 9.1 0.282 0.1818 7 1.95 8.2 2.3Age 4 5 17.4 1.859 0.2273 9 16.06 10.3 19.1Age ? 1 15.4 1.278 0.0455 2 2.21 2.1 2.6
Hatchery Brown TroutAge 1 1 8.0 0.187 0.0455 2 0.32 2.1 0.4
Brook TroutAge 1 1 5.91 0.074 0.0455 2 0.13 2.1 0.2
Totals 22 1 38 22.36 45.2 26.6
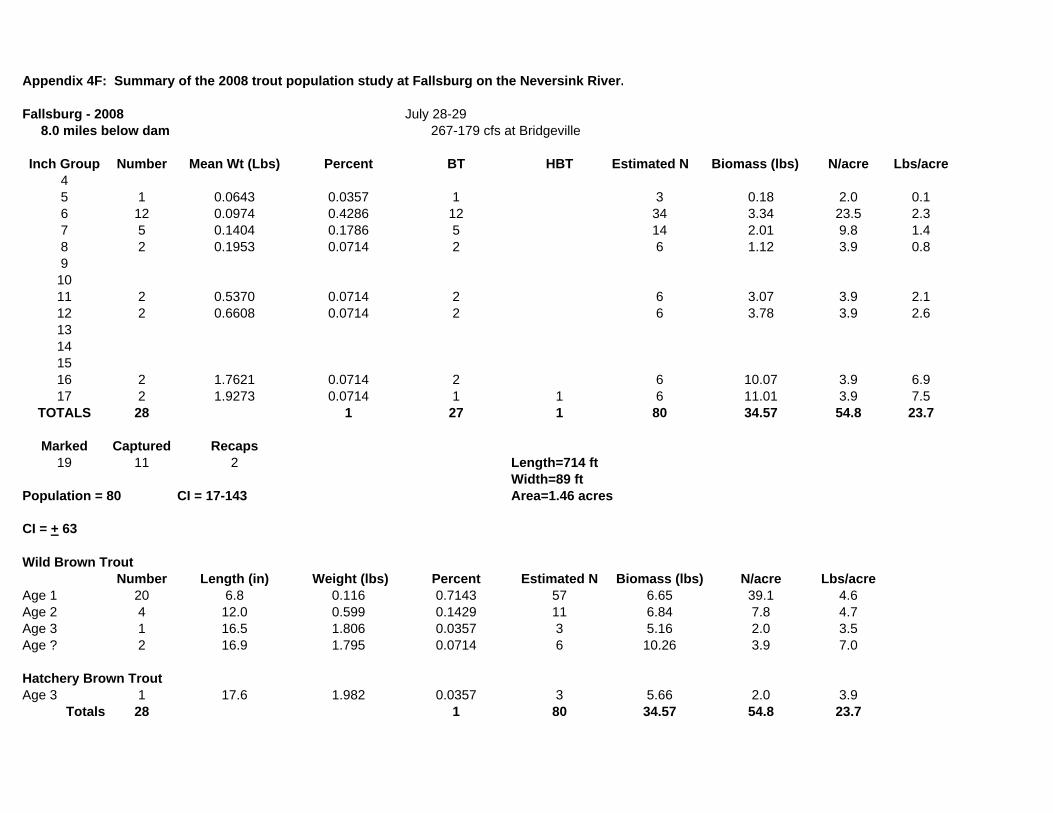
Appendix 4F: Summary of the 2008 trout population study at Fallsburg on the Neversink River.
Fallsburg - 2008 July 28-29 8.0 miles below dam 267-179 cfs at Bridgeville
Inch Group Number Mean Wt (Lbs) Percent BT HBT Estimated N Biomass (lbs) N/acre Lbs/acre45 1 0.0643 0.0357 1 3 0.18 2.0 0.16 12 0.0974 0.4286 12 34 3.34 23.5 2.37 5 0.1404 0.1786 5 14 2.01 9.8 1.48 2 0.1953 0.0714 2 6 1.12 3.9 0.89
1011 2 0.5370 0.0714 2 6 3.07 3.9 2.112 2 0.6608 0.0714 2 6 3.78 3.9 2.613141516 2 1.7621 0.0714 2 6 10.07 3.9 6.917 2 1.9273 0.0714 1 1 6 11.01 3.9 7.5
TOTALS 28 1 27 1 80 34.57 54.8 23.7
Marked Captured Recaps19 11 2 Length=714 ft
Width=89 ftPopulation = 80 CI = 17-143 Area=1.46 acres
CI = + 63
Wild Brown TroutNumber Length (in) Weight (lbs) Percent Estimated N Biomass (lbs) N/acre Lbs/acre
Age 1 20 6.8 0.116 0.7143 57 6.65 39.1 4.6Age 2 4 12.0 0.599 0.1429 11 6.84 7.8 4.7Age 3 1 16.5 1.806 0.0357 3 5.16 2.0 3.5Age ? 2 16.9 1.795 0.0714 6 10.26 3.9 7.0
Hatchery Brown TroutAge 3 1 17.6 1.982 0.0357 3 5.66 2.0 3.9
Totals 28 1 80 34.57 54.8 23.7

Appendix 4G: Summary of the 2008 trout population study at Ranch Road on the Neversink River.
Ranch Road - 2008 July 28-29 12.9 miles below dam 267-179 cfs
Inch Group Number Mean Wt (lbs) Percent BT HBT Estimated N Biomass (lbs) N/acre Lbs/acre5 1 0.0685 0.0204 1 2 0.12 3.4 0.267 6 0.1531 0.1224 6 10 1.56 20.2 3.18 11 0.2197 0.2245 11 19 4.09 37.1 8.29 7 0.2960 0.1429 6 1 12 3.51 23.6 7.0
10 7 0.4007 0.1429 1 6 12 4.75 23.6 9.511 3 0.5570 0.0612 1 2 5 2.83 10.1 5.612 1 0.7048 0.0204 1 2 1.19 3.4 2.413 6 0.8921 0.1224 6 10 9.07 20.2 18.114 1 1.1894 0.0204 1 2 2.01 3.4 4.015 2 1.3216 0.0408 1 1 3 4.48 6.7 8.916 1 1.7621 0.0204 1 2 2.98 3.4 5.91718 1 2.2026 0.0204 1 2 3.73 3.4 7.419 2 2.8634 0.0408 1 1 3 9.70 6.7 19.3
TOTALS 49 1 38 11 83 50.02 165.3 99.7
Marked Captured Recaps Length=486 ft33 26 10 Width=45 ft
Area=0.50 acresPopulation = 83 CI = 53-113
CI = + 30
Wild Brown TroutNumber Length (in) Weight (lbs) Percent Estimated N Biomass (lbs) N/acre Lbs/acre
Age 1 23 8.3 0.216 0.4694 39 8.41 77.6 16.8Age 2 8 13.5 0.906 0.1633 14 12.28 27.0 24.5Age 4 1 19.3 2.423 0.0204 2 4.10 3.4 8.2Age 5 1 18.9 2.203 0.0204 2 3.73 3.4 7.4Age ? 5 12.4 0.836 0.1020 8 7.08 16.9 14.1
Hatchery Brown TroutAge 1 5 10.3 0.402 0.1020 8 3.40 16.9 6.8Age ? 6 12.9 1.084 0.1224 10 11.02 20.2 21.9
Totals 49 1 83 50.02 165.3 99.7

Appendix 5:
UPPER DELAWARE TAILWATERS
2009 Trout Population Studies
West Branch: Appendices 5A to 5D East Branch: Appendices 5E to 5H
Neversink River: Appendices 5I to 5K

Appendix 5A: Summary of the 2009 trout population study at Stilesville on the West Branch.
Stilesville-2009 July 15-16 2.1 miles below dam 372-377 cfs
Inch Group Number Mean Wt(lbs) Percentage BT HBT RT ST Estimated N Biomass(lbs) N/acre Lbs/acre4 30 0.0365 0.0855 30 89 3.26 10.3 0.45 103 0.0610 0.2934 102 1 306 18.69 35.4 2.26 75 0.0964 0.2137 74 1 223 21.50 25.8 2.57 27 0.1385 0.0769 27 80 11.12 9.3 1.38 7 0.2406 0.0199 7 21 5.01 2.4 0.69 8 0.3169 0.0228 6 2 24 7.54 2.8 0.910 5 0.4015 0.0142 5 15 5.97 1.7 0.711 1 0.6167 0.0028 1 3 1.83 0.3 0.212 1 0.6608 0.0028 1 3 1.97 0.3 0.213 7 1.0179 0.0199 6 1 21 21.19 2.4 2.514 7 1.2508 0.0199 5 2 21 26.04 2.4 3.015 19 1.4943 0.0541 18 1 57 84.45 6.5 9.816 26 1.7630 0.0741 22 4 77 136.34 8.9 15.817 21 2.0159 0.0598 18 3 62 125.92 7.2 14.618 8 2.4367 0.0228 5 3 24 57.98 2.8 6.719 1 2.7533 0.0028 1 3 8.19 0.3 0.920 3 3.2599 0.0085 3 9 29.09 1.0 3.421 1 2.9295 0.0028 1 3 8.71 0.3 1.022 0.0000 0 0.00 0.0 0.023 1 5.0661 0.0028 1 3 15.07 0.3 1.7
Totals 351 1 332 3 15 1 1044 589.87 120.7 68.2
Marked Captured Recaps Length=1884 ft227 144 31 Width=200 ft
Area=8.65 acresPopulation = 1044 CI = 750-1,338
CI = + 294 Note: 11 yearling trout died during the marking effort. These 11 fish were added to the estimated N.
Wild Brown TroutNumber Length(in) Weight(lbs) Percent Estimated N Biomass(lbs) N/acre Lbs/acre
Age 1 231 5.88 0.077 0.6581 687 53.10 79.4 6.1Age 2 21 9.53 0.331 0.0598 62 20.68 7.2 2.4Age 3 22 14.94 1.380 0.0627 65 90.27 7.6 10.4Age 4 48 16.64 1.838 0.1368 143 262.45 16.5 30.3Age 5 8 18.77 2.627 0.0228 24 62.50 2.8 7.2Age 6 1 21.06 2.930 0.0028 3 8.71 0.3 1.0Age 7 1 23.82 5.066 0.0028 3 15.07 0.3 1.7
Hatchery Brown TroutAge 1 2 9.65 0.324 0.0057 6 1.93 0.7 0.2Age 4 1 13.82 1.035 0.0028 3 3.08 0.3 0.4
Wild Rainbow TroutAge 1 2 6.10 0.085 0.0057 6 0.50 0.7 0.1Age 3 2 15.35 1.344 0.0057 6 7.99 0.7 0.9Age 4 9 16.80 1.795 0.0256 27 48.05 3.1 5.6Age 5 2 18.70 2.280 0.0057 6 13.56 0.7 1.6
Wild Brook TroutAge 2 1 12.01 0.661 0.0028 3 1.97 0.3 0.2
Totals 351 1 1044 589.87 120.7 68.2

Appendix 5B: Summary of the trout population study at the No Kill on the West Branch.
No Kill-2009 July 22-23 3.9 miles below dam 383 cfs both days
Inch Group Number Mean Wt(lbs) Percentage BT HBT RT Estimated N Biomass(lbs) N/acre Lbs/acre4 3 0.0400 0.0144 3 14 0.56 0.7 0.05 36 0.0655 0.1731 36 168 10.97 8.7 0.66 83 0.0993 0.3990 83 386 38.36 20.1 2.07 34 0.1412 0.1635 34 158 22.35 8.2 1.28 2 0.2133 0.0096 2 9 1.99 0.5 0.19
10 2 0.4528 0.0096 1 1 9 4.21 0.5 0.2111213 1 0.9692 0.0048 1 5 4.51 0.2 0.21415 8 1.4510 0.0385 8 37 54.02 1.9 2.816 10 1.7203 0.0481 10 47 80.06 2.4 4.217 13 1.9061 0.0625 12 1 61 115.32 3.2 6.018 4 2.5110 0.0192 4 19 46.74 1.0 2.419 5 2.6564 0.0240 5 23 61.81 1.2 3.220 1 2.6211 0.0048 1 5 12.20 0.2 0.621 4 3.6013 0.0192 4 19 67.04 1.0 3.52223 1 4.1410 0.0048 1 5 19.27 0.2 1.024 1 5.5507 0.0048 1 5 25.83 0.2 1.3
Totals 208 1 206 1 12 968 565.25 50.4 29.4
Marked Captured Recaps Length=3428 ft134 85 11 Width=244 ft
Area=19.20 acresPopulation = 968 CI = 493-1443
CI = + 475
Wild Brown TroutNumber Length(in) Weight(lbs) Percent Estimated N Biomass(lbs) N/acre Lbs/acre
Age 1 157 6.46 0.100 0.7548 731 73.13 38.1 3.8Age 2 2 9.80 0.353 0.0096 9 3.29 0.5 0.2Age 3 14 16.27 1.617 0.0673 65 105.38 3.4 5.5Age 4 26 17.64 2.105 0.1250 121 254.73 6.3 13.3Age 5 5 19.93 3.079 0.0240 23 71.65 1.2 3.7Age 6 1 23.62 4.141 0.0048 5 19.27 0.2 1.0Age 7 1 24.84 5.551 0.0048 5 25.83 0.2 1.3
Hatchery Brown TroutAge 1 1 10.63 0.433 0.0048 5 2.02 0.2 0.1
Wild Rainbow TroutAge 4 1 17.48 2.137 0.0048 5 9.94 0.2 0.5
Totals 208 1 968 565.25 50.4 29.4

Appendix 5C: Summary of the 2009 trout population study at Hale Eddy on the West Branch.
Hale Eddy-2009 July 20-21 7.9 miles below dam 497 cfs on both days
Inch Group Number Mean Wt(lbs) Percentage BT RT Estimated N Biomass(lbs) N/acre Lbs/acre4 6 0.0375 0.0147 6 44 1.65 2.7 0.15 55 0.0666 0.1345 55 404 26.92 25.2 1.76 146 0.0991 0.3570 145 1 1072 106.26 66.9 6.67 95 0.1464 0.2323 89 6 698 102.18 43.5 6.48 16 0.1985 0.0391 14 2 118 23.33 7.3 1.59 4 0.2939 0.0098 3 1 29 8.64 1.8 0.510 17 0.4109 0.0416 17 125 51.31 7.8 3.211 7 0.5413 0.0171 7 51 27.83 3.2 1.712 5 0.7225 0.0122 5 37 26.53 2.3 1.71314 6 1.0977 0.0147 4 2 44 48.37 2.7 3.015 15 1.4347 0.0367 14 1 110 158.06 6.9 9.916 8 1.7373 0.0196 8 59 102.08 3.7 6.417 10 1.9031 0.0244 10 73 139.78 4.6 8.718 9 2.1953 0.0220 7 2 66 145.12 4.1 9.019 3 2.7533 0.0073 3 22 60.67 1.4 3.820 4 2.8965 0.0098 4 29 85.10 1.8 5.321 2 3.2709 0.0049 2 15 48.05 0.9 3.022 1 3.7004 0.0024 1 7 27.18 0.5 1.7
Totals 409 1 394 15 3004 1189.05 187.3 74.1
Marked Captured Recaps Length=4235 ft202 221 14 Width=165 ft
Area=16.04 acresPopulation = 3004 CI = 1571-4437
CI = + 1433
Wild Brown TroutNumber Length(in) Weight(lbs) Percent Estimated N Biomass(lbs) N/acre Lbs/acre
Age 1 308 6.64 0.110 0.7531 2262 248.57 141.0 15.5Age 2 32 10.67 0.456 0.0782 235 107.11 14.7 6.7Age 3 25 15.89 1.505 0.0611 184 276.32 11.4 17.2Age 4 25 17.96 2.105 0.0611 184 386.49 11.4 24.1Age 5 3 20.93 3.209 0.0073 22 70.70 1.4 4.4Age 6 1 22.64 3.700 0.0024 7 27.18 0.5 1.7
Wild Rainbow TroutAge 1 9 7.63 0.163 0.0220 66 10.76 4.1 0.7Age 2 1 9.88 0.348 0.0024 7 2.56 0.5 0.2Age 3 3 14.66 1.094 0.0073 22 24.10 1.4 1.5Age 4 2 18.64 2.401 0.0049 15 35.27 0.9 2.2
Totals 409 1 3004 1189.05 187.3 74.1

Appendix 5D: Summary of the trout population at Balls Eddy on the West Branch.
Balls Eddy - 2009 Aug 26-27 12.7 miles below dam 643-601 cfs
Inch Group Number Mean Wt(lbs) Percentage BT HBT RT Estimated N Biomass(lbs) N/acre Lbs/acre5 1 0.0713 0.0278 1 5 0.38 0.5 0.067 1 0.1326 0.0278 1 5 0.70 0.5 0.18 6 0.2282 0.1667 2 4 32 7.23 3.2 0.79 4 0.3023 0.1111 1 3 21 6.38 2.1 0.610 4 0.4061 0.1111 2 2 21 8.57 2.1 0.9111213 1 0.8811 0.0278 1 5 4.65 0.5 0.51415 4 1.5474 0.1111 1 1 2 21 32.67 2.1 3.316 5 1.7797 0.1389 3 2 26 46.97 2.6 4.717 5 1.9251 0.1389 4 1 26 50.80 2.6 5.118 1 2.2026 0.0278 1 5 11.63 0.5 1.219 2 2.6652 0.0556 2 11 28.13 1.1 2.820 1 3.4361 0.0278 1 5 18.14 0.5 1.821 1 3.7445 0.0278 1 5 19.76 0.5 2.0
Totals 36 1 19 1 16 190 236.00 19.1 23.7
Marked Captured Recaps Length=2991 ft18 19 1 Width=145 ft
Area=9.96 acresPopulation = 190 CI = 0-386
CI = + 196
Wild Brown TroutNumber Length(in) Weight(lbs) Percent Estimated N Biomass(lbs) N/acre Lbs/acre
Age 1 2 8.58 0.228 0.0556 11 2.41 1.1 0.2Age 2 4 11.04 0.507 0.1111 21 10.71 2.1 1.1Age 3 3 16.46 1.711 0.0833 16 27.09 1.6 2.7Age 4 8 17.74 2.128 0.2222 42 89.86 4.2 9.0Age 5 2 21.26 3.590 0.0556 11 37.90 1.1 3.8
Hatchery Brown TroutAge 2 1 15.59 1.608 0.0278 5 8.49 0.5 0.9
Wild Rainbow TroutAge 1 9 8.34 0.220 0.2500 48 10.44 4.8 1.0Age 2 2 10.45 0.412 0.0556 11 4.35 1.1 0.4Age 3 2 15.94 1.542 0.0556 11 16.28 1.1 1.6Age 4 3 16.99 1.799 0.0833 16 28.48 1.6 2.9
Totals 36 1 190 236.00 19.1 23.7

Appendix 5E: Summary of the 2009 trout population study at the Airport Pool on the East Branch.
Airport Pool-2009 July 8-9 4.2 miles below dam 147-147 cfs
Inch Group Number Mean Wt(lbs) Percent BT Estimated N Biomass(lbs) N/acre Lbs/acre3 1 0.0183 0.0105 1 2 0.03 0.6 0.04 12 0.0378 0.1263 12 19 0.73 7.5 0.35 30 0.0649 0.3158 30 48 3.13 18.8 1.26 21 0.0932 0.2211 21 34 3.15 13.2 1.27 10 0.1481 0.1053 10 16 2.38 6.3 0.98 6 0.2409 0.0632 6 10 2.33 3.8 0.99 9 0.3253 0.0947 9 14 4.72 5.6 1.810 1 0.3778 0.0105 1 2 0.61 0.6 0.211 2 0.6049 0.0211 2 3 1.95 1.3 0.812 1 0.8811 0.0105 1 2 1.42 0.6 0.6131415161718 1 2.6211 0.0105 1 2 4.22 0.6 1.619 1 3.0396 0.0105 1 2 4.90 0.6 1.9Totals 95 1 95 153 29.57 59.5 11.5
Marked Captured Recaps Station length=1077 ft64 53 22 Width=104 ft
Acreage=2.57 acresPopulation = 153 CI = 115-191
CI = + 38
Wild Brown TroutNumber Length(in) Weight(lbs) Percent Estimated N Biomass(lbs) N/acre Lbs/acre
Age 1 71 5.83 0.076 0.7474 114 8.66 44.5 3.4Age 2 19 9.05 0.273 0.2000 31 8.36 11.9 3.3Age 3 3 11.48 0.697 0.0316 5 3.37 1.9 1.3Age 4 2 18.78 2.830 0.0211 3 9.12 1.3 3.5
Totals 95 1 153 29.50 59.5 11.5

Appendix 5F: Summary of the 2009 trout population study at the T28 Pool on the East Branch.
T28 Pool-2009 July 13-14 6.3 miles below dam 147-151 cfs
Inch Group Number Mean Wt(lbs) Percent BT HBT Estimated N Biomass(lbs) N/acre Lbs/acre3 2 0.0192 0.0147 2 5 0.09 3.2 0.14 23 0.0372 0.1691 23 52 1.94 36.7 1.45 60 0.0620 0.4412 60 136 8.43 95.7 5.96 39 0.0940 0.2868 39 88 8.31 62.2 5.87 7 0.1331 0.0515 7 16 2.11 11.2 1.58 2 0.2176 0.0147 2 5 0.99 3.2 0.79 1 0.2783 0.0074 1 2 0.63 1.6 0.41011 1 0.4829 0.0074 1 2 1.09 1.6 0.8121314151617 1 2.3789 0.0074 1 2 5.39 1.6 3.8Totals 136 1 135 1 308 28.97 216.9 20.4
Marked Captured Recaps Station length=653 ft81 74 19 Width=95 ft
Acreage=1.42 acresPopulation = 308 CI = 208-408
CI = + 100
Wild Brown TroutNumber Length(in) Weight(lbs) Percent Estimated N Biomass(lbs) N/acre Lbs/acre
Age 1 133 5.74 0.073 0.9779 301 21.86 212.1 15.4Age 2 2 10.10 0.381 0.0147 5 1.72 3.2 1.2
Hatchery Brown TroutAge 3 1 17.40 2.379 0.0074 2 5.39 1.6 3.8
Totals 136 1 308 28.97 216.9 20.4

Appendix 5G: Summary of the 2009 trout population at the Cabin Pool on the East Branch.
Cabin Pool-2009 July 27-28 9.9 miles below dam 203-191 cfs
Inch Group Number Mean Wt(lbs) Percent BT HBT Estimated N Biomass(lbs) N/acre Lbs/acre4 3 0.0367 0.0161 3 9 0.33 2.0 0.15 34 0.0655 0.1828 34 103 6.76 22.5 1.56 75 0.1002 0.4032 75 228 22.82 49.5 5.07 45 0.1479 0.2419 45 137 20.22 29.7 4.48 12 0.2154 0.0645 12 36 7.85 7.9 1.79 2 0.3191 0.0108 2 6 1.94 1.3 0.4
10 5 0.4277 0.0269 5 15 6.50 3.3 1.411 5 0.5334 0.0269 5 15 8.10 3.3 1.812 1 0.7269 0.0054 1 3 2.21 0.7 0.5131415 1 1.5859 0.0054 1 3 4.82 0.7 1.0161718 1 2.7753 0.0054 1 3 8.43 0.7 1.81920 1 3.6784 0.0054 1 3 11.17 0.7 2.421 1 3.4361 0.0054 1 3 10.44 0.7 2.3
Totals 186 1 185 1 565 111.59 122.8 24.3
Marked Captured Recaps Station length=1806 ft120 83 17 Width=111 ft
Acreage=4.60 acresPopulation = 565 CI = 353-777
CI = + 106
Wild Brown TroutNumber Length(in) Weight(lbs) Percent Estimated N Biomass(lbs) N/acre Lbs/acre
Age 1 164 6.62 0.109 0.8817 498 54.34 108.3 11.8Age 2 18 10.26 0.409 0.0968 55 22.39 11.9 4.9Age 4 1 18.70 2.775 0.0054 3 8.43 0.7 1.8Age 5 2 21.26 3.557 0.0108 6 21.61 1.3 4.7
Hatchery Brown TroutAge 2 1 15.16 1.586 0.0054 3 4.82 0.7 1.0
Totals 186 1 565 111.59 122.8 24.3
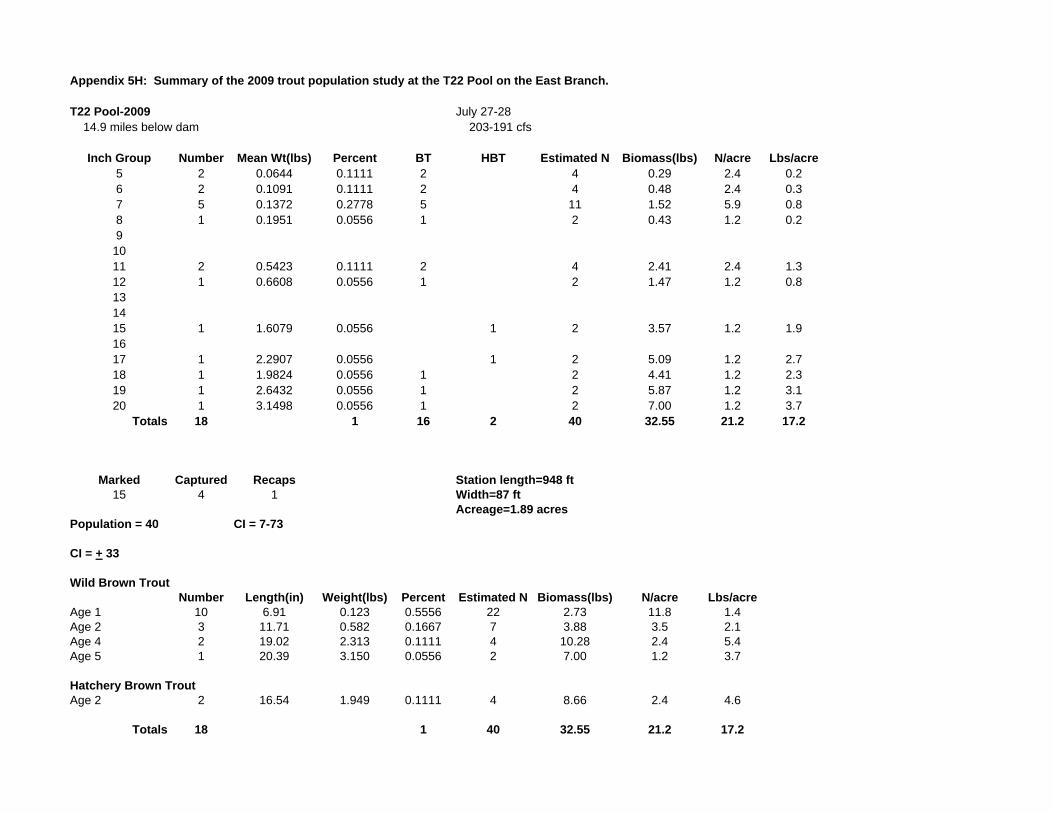
Appendix 5H: Summary of the 2009 trout population study at the T22 Pool on the East Branch.
T22 Pool-2009 July 27-28 14.9 miles below dam 203-191 cfs
Inch Group Number Mean Wt(lbs) Percent BT HBT Estimated N Biomass(lbs) N/acre Lbs/acre5 2 0.0644 0.1111 2 4 0.29 2.4 0.26 2 0.1091 0.1111 2 4 0.48 2.4 0.37 5 0.1372 0.2778 5 11 1.52 5.9 0.88 1 0.1951 0.0556 1 2 0.43 1.2 0.29
1011 2 0.5423 0.1111 2 4 2.41 2.4 1.312 1 0.6608 0.0556 1 2 1.47 1.2 0.8131415 1 1.6079 0.0556 1 2 3.57 1.2 1.91617 1 2.2907 0.0556 1 2 5.09 1.2 2.718 1 1.9824 0.0556 1 2 4.41 1.2 2.319 1 2.6432 0.0556 1 2 5.87 1.2 3.120 1 3.1498 0.0556 1 2 7.00 1.2 3.7
Totals 18 1 16 2 40 32.55 21.2 17.2
Marked Captured Recaps Station length=948 ft15 4 1 Width=87 ft
Acreage=1.89 acresPopulation = 40 CI = 7-73
CI = + 33
Wild Brown TroutNumber Length(in) Weight(lbs) Percent Estimated N Biomass(lbs) N/acre Lbs/acre
Age 1 10 6.91 0.123 0.5556 22 2.73 11.8 1.4Age 2 3 11.71 0.582 0.1667 7 3.88 3.5 2.1Age 4 2 19.02 2.313 0.1111 4 10.28 2.4 5.4Age 5 1 20.39 3.150 0.0556 2 7.00 1.2 3.7
Hatchery Brown TroutAge 2 2 16.54 1.949 0.1111 4 8.66 2.4 4.6
Totals 18 1 40 32.55 21.2 17.2

Appendix 5I: Summary of the 2009 trout population study at Hasbrouck on the Neversink River.
Hasbrouck July 20-21 2.8 miles below dam 113-113 cfs
Inch Group Number Mean Wt (lbs) Percent BT HBT ST Estimated N Biomass (lbs) N/acre Lbs/acre4 1 0.0343 0.0303 1 3 0.11 4.0 0.15 6 0.0593 0.1818 6 20 1.19 23.8 1.46 13 0.0939 0.3939 11 1 1 43 4.07 51.6 4.87 4 0.1321 0.1212 4 13 1.76 15.9 2.18 2 0.2084 0.0606 2 7 1.39 7.9 1.79
10 2 0.3824 0.0606 1 1 7 2.55 7.9 3.01112 1 0.8811 0.0303 1 3 2.94 4.0 3.513 1 0.9692 0.0303 1 3 3.23 4.0 3.81415 1 1.5859 0.0303 1 3 5.29 4.0 6.316 1 1.6300 0.0303 1 3 5.43 4.0 6.51718 1 2.2467 0.0303 1 3 7.49 4.0 8.9
TOTALS 33 1 28 1 4 110 35.45 131.0 42.2
Marked Captured Recaps Length=330 ft21 14 2 Width=111 ft
Area=0.84 acresPopulation = 110 CI = 20-200
CI = + 90
Wild Brown TroutNumber Length (in) Weight (lbs) Percent Estimated N Biomass (lbs) N/acre Lbs/acre
Age 1 21 6.14 0.09 0.6364 70 6.06 83.3 7.2Age 2 4 10.80 0.59 0.1212 13 7.83 15.9 9.3Age 3 2 17.17 1.92 0.0606 7 12.78 7.9 15.2Age ? 1 16.54 1.63 0.0303 3 5.43 4.0 6.5Hatchery Brown TroutAge 1 1 6.38 0.09 0.0303 3 0.31 4.0 0.4
Brook TroutAge 1 2 7.32 0.15 0.0606 7 0.98 7.9 1.2Age 2 2 9.41 0.31 0.0606 7 2.06 7.9 2.4
Totals 33 1 110 35.45 131.0 42.2

Appendix 5J: Summary of the 2009 trout population study at Fallsburg on the Neversink River.
Fallsburg - 2009 July 20-21 8.0 miles below dam
Inch Group Number Means Wt (lbs) Percent BT HBT Estimated N Biomass (lbs) N/acre Lbs/acre5 7 0.0706 0.1842 7 20 1.44 14.0 1.06 12 0.0952 0.3158 12 35 3.34 24.0 2.37 6 0.1337 0.1579 6 18 2.34 12.0 1.68 1 0.2375 0.0263 1 3 0.69 2.0 0.59 3 0.3100 0.0789 1 2 9 2.72 6.0 1.910 4 0.4139 0.1053 2 2 12 4.84 8.0 3.311 1 0.5093 0.0263 1 3 1.49 2.0 1.012 2 0.5293 0.0526 2 6 3.09 4.0 2.11314 1 0.8811 0.0263 1 3 2.57 2.0 1.8151617 1 1.9824 0.0263 1 3 5.79 2.0 4.0
TOTALS 38 1 32 6 111 28.31 76.0 19.4
Marked Captured Recaps Length=714 ft25 16 3 Width=89 ft
Area=1.46 acresPopulation = 111 CI = 33-189
CI = + 78
Brown TroutNumber Mean length (in) Mean weight (lbs) Percent Estimated N Biomass (lbs) N/acre Lbs/acre
Age 1 27 6.75 0.125 0.7105 79 9.85 54.0 6.7Age 2 4 10.82 0.423 0.1053 12 4.95 8.0 3.4Age 3 1 17.80 1.982 0.0263 3 5.79 2.0 4.0
Hatchery Brown TroutAge 1 5 9.87 0.353 0.1316 15 5.16 10.0 3.5Age 2 1 14.17 0.881 0.0263 3 2.57 2.0 1.8
Totals 38 1 111 28.31 76.0 19.4

Appendix 5K: Summary of the 2009 trout population study at Ranch Road on the Neversink River.
Ranch Road - 2009 July 20-21 12.9 miles below dam 189-181 cfs
Inch Group Number Mean Wt (lbs) Percent BT HBT Estimated N Biomass (lb) N/acre Lb/acre5 2 0.0673 0.0270 2 4 0.25 7.4 0.567 18 0.1463 0.2432 18 33 4.87 66.4 9.78 21 0.2244 0.2838 19 2 39 8.72 77.4 17.49 12 0.3007 0.1622 5 7 22 6.68 44.3 13.310 5 0.3895 0.0676 1 4 9 3.61 18.4 7.211 1 0.5366 0.0135 1 2 0.99 3.7 2.012 3 0.7628 0.0405 3 6 4.24 11.1 8.413 6 1.0095 0.0811 2 4 11 11.21 22.1 22.314 1 1.1454 0.0135 1 2 2.12 3.7 4.215 1 1.4317 0.0135 1 2 2.65 3.7 5.316 3 1.8282 0.0405 3 6 10.15 11.1 20.217 1 1.9824 0.0135 1 2 3.67 3.7 7.3
Totals 74 1 55 19 137 59.17 272.9 117.9
Marked Captured Recaps Length=486 ft51 36 13 Width=45 ft
Area=0.50 acresPopulation = 137 CI = 90-184
CI = + 47
Wild Brown TroutNumber Length (in) Weight (lbs) Percent Estimated N Biomass (lbs) N/acre Lbs/acre
Age 1 45 8.05 0.196 0.6081 83 16.30 166.0 32.5Age 2 5 12.76 0.819 0.0676 9 7.58 18.4 15.1Age 3 5 16.20 1.780 0.0676 9 16.47 18.4 32.8
Hatchery Brown TroutAge 1 14 9.76 0.341 0.1892 26 8.83 51.6 17.6Older 5 13.65 1.079 0.0676 9 9.99 18.4 19.9
Totals 74 1 137 59.17 272.9 117.9

Appendix 6:
UPPER DELAWARE TAILWATERS
2010 Trout Population Studies
West Branch: Appendices 6A to 6D East Branch: Appendices 6E to 6H
Neversink River: Appendices 6I to 6K

Appendix 6A: Summary of the 2010 trout population study at Stilesville on the West Branch.
Stilesville - 2010 July 12 & 14 2.1 miles below dam 350-407 cfs
Inch Group Number Mean Wt(lbs) Percentage BT HBT RT Estimated N Biomass(lbs) N/acre Lbs/acre4 22 0.0390 0.0401 22 67 2.61 7.7 0.35 127 0.0634 0.2313 126 1 386 24.45 44.6 2.86 172 0.0974 0.3133 169 3 523 50.88 60.4 5.97 52 0.1464 0.0947 46 6 158 23.12 18.3 2.78 8 0.2057 0.0146 7 1 24 5.00 2.8 0.69 17 0.3166 0.0310 15 2 52 16.35 6.0 1.910 7 0.3956 0.0128 7 21 8.41 2.5 1.011 13 0.5679 0.0237 13 39 22.43 4.6 2.612 23 0.7661 0.0419 21 2 70 53.54 8.1 6.213 21 0.9540 0.0383 17 4 64 60.87 7.4 7.014 9 1.1747 0.0164 8 1 27 32.12 3.2 3.715 19 1.3656 0.0346 18 1 58 78.83 6.7 9.116 13 1.6588 0.0237 13 39 65.52 4.6 7.617 24 2.0558 0.0437 22 2 73 149.90 8.4 17.318 13 2.3111 0.0237 13 39 91.28 4.6 10.619 5 2.6784 0.0091 5 15 40.69 1.8 4.720 2 2.8744 0.0036 2 6 17.47 0.7 2.021 1 3.3040 0.0018 1 3 10.04 0.4 1.222 1 4.3612 0.0018 1 3 13.25 0.4 1.5
Totals 549 1 526 2 21 1668 766.77 192.8 88.6
Marked Captured Recaps Length=1884310 288 53 Width=200 ft ft
Area=8.65 acresPopulation = 1668 CI = 1,300-2,036
CI = +368 Note: Three yearling and one older trout died during the marking effort. These 4 fish were added to the estimated N.
Wild Brown TroutNumber Length(in) Weight(lbs) Percent Estimated N Biomass(lbs) N/acre Lbs/acre
Age 1 351 6.12 0.086 0.6393 1066 91.37 123.3 10.6 Age 2 38 8.93 0.273 0.0692 115 31.56 13.3 3.6 Age 3 70 13.02 0.885 0.1275 213 188.19 24.6 21.8 Age 4 57 17.09 1.888 0.1038 173 327.05 20.0 37.8 Age 5 8 19.00 2.492 0.0146 24 60.56 2.8 7.0 Age 6 2 21.93 3.833 0.0036 6 23.29 0.7 2.7
Hatchery Brown Trout Age 1 2 9.37 0.298 0.0036 6 1.81 0.7 0.2
Wild Rainbow Trout Age 1 11 7.23 0.140 0.0200 33 4.69 3.9 0.5 Age 2 1 12.99 0.881 0.0018 3 2.68 0.4 0.3 Age 3 7 13.89 1.106 0.0128 21 23.52 2.5 2.7 Age 4 2 17.76 1.982 0.0036 6 12.05 0.7 1.4 Totals 549 1 1668 766.77 192.8 88.6

Appendix 6B: Summary of the 2010 trout population study at the No Kill on the West Branch.
No Kill - 2010 July 19-20 3.9 miles below dam 520-478 cfs
Inch Group Number Mean Wt(lbs) Percentage BT HBT RT Estimated N Biomass(lbs) N/acre Lbs/acre4 3 0.0407 0.0075 3 11 0.45 0.6 0.05 40 0.0679 0.0998 40 147 9.99 7.7 0.56 57 0.0987 0.1421 57 210 20.68 10.9 1.17 57 0.1499 0.1421 55 2 210 31.41 10.9 1.68 13 0.2061 0.0324 11 2 48 9.85 2.5 0.59 11 0.3001 0.0274 11 40 12.13 2.1 0.610 16 0.4255 0.0399 12 3 1 59 25.02 3.1 1.311 22 0.5540 0.0549 20 2 81 44.80 4.2 2.312 24 0.7484 0.0599 23 1 88 66.03 4.6 3.413 27 0.9545 0.0673 26 1 99 94.73 5.2 4.914 16 1.1495 0.0399 15 1 59 67.61 3.1 3.515 20 1.3689 0.0499 20 74 100.64 3.8 5.216 19 1.7065 0.0474 17 1 1 70 119.18 3.6 6.217 33 2.0208 0.0823 30 1 2 121 245.12 6.3 12.818 22 2.3078 0.0549 22 81 186.62 4.2 9.719 11 2.5891 0.0274 11 40 104.69 2.1 5.520 6 2.7665 0.0150 6 22 61.02 1.1 3.221 3 3.4508 0.0075 3 11 38.05 0.6 2.022 0.0000 0 0.00 0.0 0.023 1 4.1850 0.0025 1 4 15.38 0.2 0.8
Totals 401 1 383 8 10 1474 1253.41 76.8 65.3
Marked Captured Recaps Length=3428 ft293 129 25 Width=244 ft
Area=19.20 acresPopulation = 1,474 CI = 991-1,957
CI = +483 Note: Three yearling and one older trout died during the marking effort. These 4 fish were added to the estimated N.
Wild Brown TroutNumber Length(in) Weight(lbs) Percent Estimated N Biomass(lbs) N/acre Lbs/acre
Age 1 161 6.66 0.112 0.4015 592 66.08 30.8 3.4Age 2 42 10.84 0.505 0.1047 154 78.03 8.0 4.1Age 3 94 13.70 1.006 0.2344 346 347.51 18.0 18.1Age 4 66 17.73 2.067 0.1646 243 501.50 12.6 26.1Age 5 17 19.23 2.580 0.0424 62 161.20 3.3 8.4Age 6 3 21.04 3.326 0.0075 11 36.68 0.6 1.9
Hatchery Brown Trout Age 1 6 11.33 0.563 0.0150 22 12.41 1.1 0.6Age 2 1 16.93 1.982 0.0025 4 7.29 0.2 0.4Age 3 1 17.40 1.982 0.0025 4 7.29 0.2 0.4
Rainbow TroutAge 1 3 7.69 0.166 0.0075 11 1.83 0.6 0.1Age 2 2 9.78 0.351 0.0050 7 2.58 0.4 0.1Age 3 2 14.13 1.123 0.0050 7 8.26 0.4 0.4Age 4 0.0000Age 5 3 17.22 2.023 0.0075 11 22.31 0.6 1.2 Totals 401 1 1474 1252.95 76.8 65.3

Appendix 6C: Summary of the 2010 trout population study at Hale Eddy on the West Branch.
Hale Eddy- 2010 June 28-29 7.9 miles below dam ~490 cfs both days
Inch Group Number Mean Wt(lbs) Percentage BT HBT RT Estimated N Biomass(lbs) N/acre Lbs/acre4 2 0.0440 0.00559 2 7 0.31 0.4 0.05 37 0.0663 0.10335 37 132 8.73 8.2 0.56 80 0.0972 0.22346 79 1 284 27.66 17.7 1.77 48 0.1506 0.13408 35 13 171 25.71 10.6 1.68 15 0.2251 0.04190 9 6 53 12.01 3.3 0.79 16 0.3095 0.04469 11 5 57 17.61 3.5 1.1
10 32 0.4142 0.08939 28 2 2 114 47.14 7.1 2.911 24 0.5502 0.06704 21 3 85 46.96 5.3 2.912 18 0.7900 0.05028 13 5 64 50.57 4.0 3.213 11 0.9391 0.03073 5 6 39 36.73 2.4 2.314 14 1.1753 0.03911 9 5 50 58.51 3.1 3.615 8 1.3161 0.02235 6 2 28 37.44 1.8 2.316 12 1.5767 0.03352 10 2 43 67.28 2.7 4.217 7 1.9918 0.01955 6 1 25 49.58 1.6 3.118 13 2.2552 0.03631 10 3 46 104.25 2.9 6.519 8 2.5523 0.02235 6 2 28 72.61 1.8 4.520 6 2.9332 0.01676 6 21 62.58 1.3 3.921 5 3.1366 0.01397 5 18 55.77 1.1 3.522 1 3.3040 0.00279 1 4 11.75 0.2 0.723 1 3.7885 0.00279 1 4 13.47 0.2 0.8
Totals 358 1 300 2 56 1273 806.63 79.4 50.3
Marked Captured Recaps Length=4235 ft199 183 28 Width=165 ft
Area=16.04 acresPopulation = 1,273 CI = 880-1,666
CI = +393 Note: Three yearling and one older trout died during the marking effort. These 4 fish were added to the estimated N.
Wild Brown TroutNumber Length(in) Weight(lbs) Percent Estimated N Biomass(lbs) N/acre Lbs/acre
Age 1 143 6.40 0.097 0.3994 508 49.43 31.7 3.1Age 2 60 9.78 0.361 0.1676 213 77.02 13.3 4.8Age 3 50 12.79 0.828 0.1397 178 147.27 11.1 9.2Age 4 33 17.61 1.991 0.0922 117 233.64 7.3 14.6Age 5 12 20.01 2.753 0.0335 43 117.48 2.7 7.3Age 6 2 22.34 3.491 0.0056 7 24.83 0.4 1.5
Hatchery Brown Trout Age 1 2 10.26 0.390 0.0056 7 2.77 0.4 0.2
Rainbow TroutAge 1 17 7.57 0.158 0.0475 60 9.54 3.8 0.6Age 2 15 10.31 0.415 0.0419 53 22.14 3.3 1.4Age 3 17 14.10 1.116 0.0475 60 67.44 3.8 4.2Age 4 4 17.81 1.905 0.0112 14 27.10 0.9 1.7Age 5 3 18.95 2.621 0.0084 11 27.96 0.7 1.7 Totals 358 1 1273 806.63 79.4 50.3

Appendix 6D: Summary of the 2010 trout population study at Balls Eddy on the West Branch.
Balls Eddy - 2010 June 23-24 12.7 miles below dam 498-490 cfs
Inch Group Number Mean Wt(lbs) Percentage BT HBT RT ST Estimated N Biomass(lbs) N/acre Lbs/acre5 10 0.0640 0.0952 8 2 28 1.82 2.9 0.26 11 0.1012 0.1048 6 5 31 3.17 3.1 0.37 10 0.1548 0.0952 8 2 28 4.41 2.9 0.48 6 0.2116 0.0571 4 2 17 3.62 1.7 0.49 10 0.3168 0.0952 1 1 7 1 28 9.02 2.9 0.910 3 0.4240 0.0286 3 9 3.62 0.9 0.411 6 0.5710 0.0571 3 3 17 9.76 1.7 1.012 4 0.7874 0.0381 2 2 11 8.97 1.1 0.913 8 0.9334 0.0762 6 3 23 21.26 2.3 2.114 11 1.2315 0.1048 6 5 31 38.57 3.1 3.915 9 1.5516 0.0857 3 6 26 39.77 2.6 4.016 4 1.8337 0.0381 2 2 11 20.89 1.1 2.117 6 2.1402 0.0571 4 2 17 36.57 1.7 3.718 4 2.2907 0.0381 4 11 26.09 1.1 2.619 2 2.8634 0.0190 1 1 6 16.31 0.6 1.620 1 3.3040 0.0095 1 3 9.41 0.3 0.9
Totals 105 1 62 1 42 1 299 253.25 30.0 25.4
Marked Captured Recaps Length=2,991 ft68 37 Assume 0 Width=145 ft
Area=9.96 acresPopulation = 299
Note: One yearling trout died during the marking effort. This 1 fish was added to the estimated N.Note 1: This estimate derived as follows: (M+C/2)/0.176Note 2: Although 1 marked trout was collected, the estimate was too high to be believable so the estimate was based on 0 recaps.
Wild Brown TroutNumber Length(in) Weight(lbs) Percent Estimated N Biomass(lbs) N/acre Lbs/acre
Age 1 24 6.43 0.098 0.2286 68 6.73 6.9 0.7Age 2 13 8.29 0.207 0.1238 37 7.67 3.7 0.8Age 3 10 9.84 0.345 0.0952 28 9.83 2.9 1.0Age 4 13 11.95 0.674 0.1238 37 24.95 3.7 2.5Age 5 1 13.27 0.815 0.0095 3 2.32 0.3 0.2
Hatchery Brown Trout Age 1 1 9.92 0.3521 0.0095 3 1.00 0.3 0.1
Rainbow TroutAge 1 11 14.01 1.119 0.1048 31 35.06 3.1 3.5Age 2 15 15.35 1.477 0.1429 43 63.10 4.3 6.3Age 3 8 17.18 1.988 0.0762 23 45.29 2.3 4.5Age 4 7 18.83 2.445 0.0667 20 48.74 2.0 4.9Age 5Age 6 1 20.55 3.304 0.0095 3 9.41 0.3 0.9
Brook TroutAge 2 1 9.25 0.2855 0.0095 3 0.81 0.3 0.1 Totals 105 1 299 254.92 30.0 25.6

Appendix 6E: summary of the 2010 trout population study at the Airport Pool on the East Branch.
Airport Pool-2010 June 21-22 4.2 miles below dam 168-166 cfs
Inch Group Number Mean Wt(lbs) Percent BT Estimated N Biomass(lbs) N/acre Lbs/acre3 4 0.0181 0.0248 4 7 0.12 2.6 0.04 41 0.0356 0.2547 41 70 2.47 27.1 1.05 53 0.0581 0.3292 53 90 5.22 35.0 2.06 15 0.0903 0.0932 15 25 2.30 9.9 0.97 21 0.1517 0.1304 21 36 5.40 13.9 2.18 7 0.2145 0.0435 7 12 2.55 4.6 1.09 9 0.3213 0.0559 9 15 4.90 5.9 1.9
10 5 0.4210 0.0311 5 8 3.57 3.3 1.411 1 0.5940 0.0062 1 2 1.01 0.7 0.412 1 0.7489 0.0062 1 2 1.27 0.7 0.513 1 0.9031 0.0062 1 2 1.53 0.7 0.61415 1 1.5419 0.0062 1 2 2.61 0.7 1.01617181920 1 2.9075 0.0062 1 2 4.93 0.7 1.92122 1 3.8326 0.0062 1 2 6.50 0.7 2.5Totals 161 1 161 273 44.39 106.2 17.3
Marked Captured Recaps Station length=1077 ft119 74 32 Width=104 ft
Acreage=2.57 acresPopulation = 273 CI = 213-333
CI=+ 60
Wild Brown TroutNumber Length(in) Weight(lbs) Percent Estimated N Biomass(lbs) N/acre Lbs/acre
Age 1 113 5.18 0.053 0.7019 192 10.12 74.6 3.9Age 2 41 8.39 0.225 0.2547 70 15.61 27.1 6.1Age 3 4 13.05 0.879 0.0248 7 5.96 2.6 2.3Age 4 1 12.60 0.749 0.0062 2 1.27 0.7 0.5Age 5 1 20.71 2.907 0.0062 2 4.93 0.7 1.9Age 6 1 22.13 3.833 0.0062 2 6.50 0.7 2.5
Totals 161 1 273 44.39 106.2 17.3

Appendix 6F: Summary of the 2010 trout population study at the T28 Pool on the East Branch.
T28 Pool-2010 July 1-2 6.3 miles below dam 149-147 cfs
Inch Group Number Mean Wt(lbs) Percent BT ST RT Estimated N Biomass(lbs) N/acre Lbs/acre3 1 0.0227 0.0048 1 3 0.06 2.0 0.04 42 0.0389 0.2029 42 119 4.62 83.7 3.35 117 0.0608 0.5652 116 1 331 20.15 233.3 14.26 40 0.0905 0.1932 40 113 10.24 79.7 7.27 3 0.1520 0.0145 3 8 1.29 6.0 0.989
10111213141516171819 2 2.2026 0.0097 1 1 6 12.47 4.0 8.820 1 3.3700 0.0048 1 3 9.54 2.0 6.721 1 3.9648 0.0048 1 3 11.22 2.0 7.9Totals 207 1 205 1 1 586 69.60 412.7 49.0
Marked Captured Recaps Station length=653 ft132 96 21 Width=95 ft
Area=1.42 acresPopulation = 586 CI = 390-782
CI = + 196
Wild Brown TroutNumber Length(in) Weight(lbs) Percent Estimated N Biomass(lbs) N/acre Lbs/acre
Age 1 200 5.51 0.062 0.9662 566 35.28 398.7 24.8Age 2 2 7.70 0.165 0.0097 6 0.93 4.0 0.7Age 5 3 20.42 3.172 0.0145 8 26.94 6.0 19.0
Rainbow TroutAge 6 1 19.80 2.225 0.0048 3 6.30 2.0 4.4
Brook TroutAge 1 1 5.35 0.055 0.0048 3 0.16 2.0 0.1
Totals 207 1 586 69.60 412.7 49.0

Appendix 6G: Summary of the 2010 trout population study at the Cabin Pool on the East Branch.
Cabin Pool-2010 July 6-8 9.9 miles below dam 179-158 cfs
Inch Group Number Mean Wt(lbs) Percent BT HBT Estimated N Biomass(lbs) N/acre Lbs/acre4 5 0.5790 0.0202 5 23 13.18 4.9 2.95 99 0.0634 0.3992 99 451 28.56 98.0 6.26 108 0.0940 0.4355 108 492 46.21 106.9 10.07 21 0.1384 0.0847 21 96 13.23 20.8 2.98 1 0.1393 0.0040 1 5 0.63 1.0 0.19 3 0.1883 0.0121 2 1 14 2.57 3.0 0.610 3 0.3224 0.0121 3 14 4.40 3.0 1.011 1 0.4427 0.0040 1 5 2.02 1.0 0.412 1 0.4676 0.0040 1 5 2.13 1.0 0.513 1 0.5534 0.0040 1 5 2.52 1.0 0.514 2 0.8260 0.0081 2 9 7.52 2.0 1.615 2 1.2775 0.0081 2 9 11.63 2.0 2.516 1 1.6079 0.0040 1 5 7.32 1.0 1.6Totals 248 1 245 3 1129 141.93 245.4 30.9
Marked Captured Recaps Station length=1806 ft153 109 14 Width=111 ft
Area=4.60 acresPopulation = 1129 CI = 630-1628
CI = + 499
Wild Brown TroutNumber Length(in) Weight(lbs) Percent Estimated N Biomass(lbs) N/acre Lbs/acre
Age 1 230 6.10 0.084 0.9274 1047 88.28 227.6 19.2Age 2 11 9.59 0.347 0.0444 50 17.38 10.9 3.8Age 3 2 14.49 1.134 0.0081 9 10.33 2.0 2.2Age 4 2 15.93 1.432 0.0081 9 13.04 2.0 2.8
Hatchery Brown TroutAge 1 1 9.17 0.278 0.0040 5 1.27 1.0 0.3Age 2 2 14.76 1.278 0.0081 9 11.63 2.0 2.5
Totals 248 1 1129 141.93 245.4 30.9

Appendix 6H: Summary of the 2010 trout population study at the T22 Pool on the East Branch.
T22 Pool-2010 Aug 19-20 14.9 miles below dam 143-142 cfs
Inch Group Number Mean Wt(lbs) Percent BT RT HRT Estimated N Biomass(lbs) N/acre Lbs/acre4 1 0.3041 0.0526 1 2 0.48 0.8 0.356 1 1.0352 0.0526 1 2 1.63 0.8 0.97 2 1.7841 0.1053 2 3 5.63 1.7 3.08 5 0.1221 0.2632 5 8 0.96 4.2 0.59 1 0.2037 0.0526 1 2 0.32 0.8 0.2
1011 1 0.2186 0.0526 1 2 0.35 0.8 0.212 1 0.2186 0.0526 1 2 0.35 0.8 0.213 1 0.2343 0.0526 1 2 0.37 0.8 0.214 2 0.5987 0.1053 1 1 3 1.89 1.7 1.015 1 0.9251 0.0526 1 2 1.46 0.8 0.81617 2 1.3326 0.1053 1 1 3 4.21 1.7 2.21819 1 3.3040 0.0526 1 2 5.22 0.8 2.8Totals 19 1 15 3 1 30 22.87 15.9 12.1
Marked Captured Recaps Station length=948 ft14 9 4 Width=87 ft
Area=1.89 acresPopulation = 30 CI = 16-44
CI = + 14
Wild Brown TroutNumber Length(in) Weight(lbs) Percent Estimated N Biomass(lbs) N/acre Lbs/acre
Age 1 9 7.49 0.165 0.4737 14 2.35 7.5 1.2Age 2 2 12.11 0.599 0.1053 3 1.89 1.7 1.0Age 3 3 14.66 1.197 0.1579 5 5.67 2.5 3.0Age 5 1 19.76 3.304 0.0526 2 5.22 0.8 2.8
Rainbow TroutAge 2 2 11.81 0.670 0.1053 3 2.11 1.7 1.1Age 5 1 17.80 1.806 0.0526 2 2.85 0.8 1.5
Hatchery Rainbow TroutAge 3 1 17.72 1.762 0.0526 2 2.78 0.8 1.5
Totals 19 1 30 22.87 15.9 12.1

Appendix 6I: Summary of the 2010 trout population study at Hasbrouck on the Neversink River.
Hasbrouck - 2010 August 2-4 2.8 mi below dam 95-98 cfs
Inch Group Number Mean Wt (lbs) Percent BT HBT Estimated N Biomass (lbs) N/acre Lb/acre5 2 0.0490 0.1111 2 4 0.20 4.9 0.26 3 0.1159 0.1667 3 6 0.72 7.4 0.97 3 0.1334 0.1667 3 6 0.83 7.4 1.08 1 0.1840 0.0556 1 2 0.38 2.5 0.59 1 0.2783 0.0556 1 2 0.58 2.5 0.7
10111213 1 0.7709 0.0556 1 2 1.60 2.5 1.914 1 1.4097 0.0556 1 2 2.92 2.5 3.51516 1 1.8722 0.0556 1 2 3.88 2.5 4.617 3 2.0705 0.1667 3 6 12.88 7.4 15.318 1 2.0925 0.0556 1 2 4.34 2.5 5.219 1 2.9956 0.0556 1 2 6.21 2.5 7.4
Totals 18 1 17 1 37 34.56 44.4 41.1
Marked Captured Recaps Length=330 ft13 7 2 Width=111 ft
Area=0.84 acresPopulation = 37 CI = 11-63
CI = + 26
Wild Brown TroutNumber Length (in) Weight (lbs) Percent Estimated N Biomass (lbs) N/acre Lbs/acre
Age 1 8 6.55 0.106 0.4444 17 1.75 19.8 2.1Age 2 2 11.06 0.231 0.1111 4 0.96 4.9 1.1Age 3 2 13.82 1.090 0.1111 4 4.52 4.9 5.4Age 4 3 18.52 2.504 0.1667 6 15.58 7.4 18.5Age ? 2 17.24 1.894 0.1111 4 7.86 4.9 9.4
Hatchery Brown TroutAge 2 1 16.34 1.872 0.0556 2 3.88 2.5 4.6
Totals 18 1 37 34.56 44.4 41.1

Appendix 6J: Summary of the 2010 trout population study at Fallsburg on the Neversink River.
Fallsburg - 2010 August 3-4 8.0 miles below dam
Inch Group Number Mean Wt (lbs) Percent BT HBT Estimated N Biomass (lbs) N/acre Lbs/acre5 6 0.0657 0.1622 6 13 0.86 9.0 0.66 14 0.0956 0.3784 14 31 2.93 21.0 2.07 6 0.1471 0.1622 6 13 1.93 9.0 1.38 1 0.1980 0.0270 1 2 0.43 1.5 0.39 4 0.3158 0.1081 1 3 9 2.77 6.0 1.9101112 1 0.7269 0.0270 1 2 1.59 1.5 1.1131415 3 1.3803 0.0811 3 7 9.07 4.5 6.216 1 1.7181 0.0270 1 2 3.76 1.5 2.617 1 1.7621 0.0270 1 2 3.86 1.5 2.6
Totals 37 1 32 5 81 27.20 55.5 18.6
Marked Captured Recaps Length=714 ft22 20 5 Width=89 ft
Area=1.46 acresPopulation = 81 CI = 38-124
CI = + 43
Brown TroutNumber Length (in) Weight (lbs) Percent Estimated N Biomass (lbs) N/acre Lbs/acre
Age 1 27 6.6 0.11 0.7297 59 6.31 40.5 4.3Age 2 2 13.9 1.07 0.0541 4 4.68 3.0 3.2Age 4 2 16.6 1.54 0.0541 4 6.75 3.0 4.6Age ? 1 15.7 1.41 0.0270 2 3.09 1.5 2.1
Hatchery Brown TroutAge 1 3 9.2 0.28 0.0811 7 1.86 4.5 1.3Age 2 1 9.8 0.34 0.0270 2 0.75 1.5 0.5Age 3 1 16.5 1.72 0.0270 2 3.76 1.5 2.6
37 1 81 27.20 55.5 18.6

Appendix 6K: Summary of the 2010 trout population study at Ranch Road on the Neversink River.
Ranch Road - 2010 August 3-4 12.9 miles below dam 119-119 cfs
Inch Group Number Mean Wt (lbs) Percent BT HBT Estimated N Biomass (lbs) N/acre Lbs/acre5 1 0.0743 0.0116 1 2 0.15 3.9 0.36 1 0.1179 0.0116 1 2 0.23 3.9 0.57 17 0.1537 0.1977 17 33 5.14 66.5 10.28 20 0.2174 0.2326 19 1 39 8.55 78.3 17.09 5 0.3038 0.0581 5 10 2.98 19.6 5.910 14 0.4080 0.1628 4 10 28 11.22 54.8 22.411 7 0.5700 0.0814 6 1 14 7.84 27.4 15.612 12 0.6467 0.1395 12 24 15.25 47.0 30.413 5 0.8379 0.0581 4 1 10 8.23 19.6 16.414 1 1.1013 0.0116 1 2 2.16 3.9 4.315 1 1.3559 0.0116 1 2 2.66 3.9 5.316 1 1.5859 0.0116 1 2 3.12 3.9 6.217 1 1.6960 0.0116 1 2 3.33 3.9 6.6
Totals 86 1 71 15 169 70.87 336.7 141.2
Marked Captured Recaps Length=486 ft63 36 13 Width=45 ft
Area=0.50 acresPopulation = 169 CI = 109-229
CI = + 60
Wild Brown TroutNumber Length (in) Weight (lbs) Percent Estimated N Biomass (lbs) N/acre Lbs/acre
Age 1 43 8.13 0.200 0.5000 85 16.92 168.3 33.7Age 2 26 12.04 0.629 0.3023 51 32.14 101.8 64.0Age 3 2 15.39 1.292 0.0233 4 5.08 7.8 10.1
Hatchery Brown TroutAge 1 12 10.28 0.399 0.1395 24 9.40 47.0 18.7Older 3 14.90 1.244 0.0349 6 7.33 11.7 14.6
Totals 86 1 169 70.87 336.7 141.2
Related Documents