REPROGRAMMING OF CELLULAR DIFFERENTIATION BY THE ONCOGENE SYT-SSX2 By Christina Valerie Boma Garcia Dissertation Submitted to the Faculty of the Graduate School of Vanderbilt University in partial fulfillment of requirements for the degree of DOCTOR OF PHILOSOPHY in Cancer Biology December, 2011 Nashville, Tennessee Approved: Dr. Barbara Fingleton Dr. Stephen Brandt Dr. P. Anthony Weil Dr. Josiane Eid

Welcome message from author
This document is posted to help you gain knowledge. Please leave a comment to let me know what you think about it! Share it to your friends and learn new things together.
Transcript
REPROGRAMMING OF CELLULAR DIFFERENTIATION
BY THE ONCOGENE SYT-SSX2
By
Christina Valerie Boma Garcia
Dissertation
Submitted to the Faculty of the
Graduate School of Vanderbilt University
in partial fulfillment of requirements
for the degree of
DOCTOR OF PHILOSOPHY
in
Cancer Biology
December, 2011
Nashville, Tennessee
Approved:
Dr. Barbara Fingleton
Dr. Stephen Brandt
Dr. P. Anthony Weil
Dr. Josiane Eid

ii
AMDG

iii
ACKNOWLEDGEMENTS
I want to thank the Sarcoma Foundation of America and Alex‟s Lemonade
Stand Foundation for providing the financial resources to be able to perform this
research. I would also like to thank the Department of Cancer Biology for their
support and assistance throughout this process.
I would like to acknowledge those who provided me with scientific
assistance for this project. I thank my dissertation committee members Dr.
Barbara Fingleton, Dr. Steve Brandt, and Dr. Tony Weil. I truly value the advice
and guidance they offered as well as the reagents they provided to advance the
project. I would also especially like to thank Christian Shaffer whose help was
invaluable in performing the ChIPSeq and microarray analyses and without
whom I would still be staring at millions of ChIPSeq tags.
I would like to thank my adviser, Dr. Josiane Eid, for being a great mentor
and friend. I will be forever grateful for her concern for my success as a student,
and without her, I would not have been able to achieve everything that I have
done. I will always remember the unspoken lessons in compassion and
determination given by her example, and I hope that my career will be a credit to
all that I have learned from her.
Lastly, I thank my friends and family for being my support. I thank them for
their encouragement and their perspective, for their patience and their
understanding. I am truly blessed to have them in my life.
iv
TABLE OF CONTENTS
Page
DEDICATION ........................................................................................................ ii
ACKNOWLEDGEMENTS ..................................................................................... iii
TABLE OF CONTENTS ....................................................................................... iv
LIST OF TABLES ................................................................................................. vi
LIST OF FIGURES .............................................................................................. vii
LIST OF PUBLICATIONS ................................................................................... viii
LIST OF ABBREVIATIONS .................................................................................. ix
Chapter
I. INTRODUCTION ............................................................................................. 1
Synovial sarcoma ...................................................................................... 1 Clinical features and treatment ............................................................. 1 Molecular features of synovial sarcoma ............................................... 2 Cellular reprogramming and cancer ........................................................... 8 Activation of signaling pathways by SYT-SSX ...................................... 9 Transcriptional deregulation by SYT-SSX .......................................... 10 Tumorigenesis depends on cell-intrinsic and extrinsic factors ............ 12 Epigenetic regulation of development ...................................................... 14 Purpose of this study ............................................................................... 17 II. MATERIALS AND METHODS ........................................................................ 21 Molecular and cellular biology ....................................................................... 21 Computer analyses ....................................................................................... 34 III. REPROGRAMMING OF MESENCHYMAL STEM CELLS BY SYT-SSX2 .................................................................................................... 38 Introduction ................................................................................................... 38 Results .......................................................................................................... 41 SYT-SSX2 expression deregulates developmental programs and differentiation in myoblasts ...................................................................... 41
v
Targeting of SYT-SSX2 to chromatin is required for occupancy of neural genes and induction of the neural phenotype ............................... 44 SYT-SSX2 causes aberrant differentiation in human mesenchymal stem cells ................................................................................................. 49 The role of FGFR2 in SYT-SSX2 differentiation effects ........................... 54 Conclusions ................................................................................................... 59 IV. EPIGENETIC RECRUITMENT AND REGULATION OF SYT-SSX2 ACTIVITY ........................................................................................................... 62 Introduction ................................................................................................... 62 Results .......................................................................................................... 65 SYT-SSX2 binding is heterogeneous and strongly correlates with histone H3 lysine 27 trimethylation .......................................................... 65 Differential binding patterns are associated with transcriptional activity............................................................................... 70 Binding patterns associated with differentially regulated genes ............... 73 Conclusions ................................................................................................... 80 V. DEREGULATION OF POLYCOMB COMPLEX ACTIVITY ............................ 87 Introduction ................................................................................................... 87 Results .......................................................................................................... 89 Bmi1 is phosphorylated in response to various stimuli ............................ 89 Antagonism of Polycomb repression by SYT-SSX2 ................................ 92 Inhibition of Ring1b function by SYT-SSX2 .............................................. 96 Conclusions ................................................................................................... 98 VI. DISCUSSION AND FUTURE DIRECTIONS ............................................... 101 Cellular reprogramming by SYT-SSX2 ........................................................ 101 Epigenetic mechanism of SYT-SSX2 targeting and function....................... 102 Molecular mechanism of Polycomb derepression ....................................... 103 Future directions ......................................................................................... 105 Molecular mechanism of SYT-SSX2 function ........................................ 105 Three-dimensional structure of chromatin .............................................. 106 Therapy and cellular reprogramming ..................................................... 106 APPENDIX A. SUPPLEMENTARY METHODS................................................ 108 APPENDIX B. SUPPLEMENTARY DATA ........................................................ 109 REFERENCES ................................................................................................. 128
vi
LIST OF TABLES
Page Table 1. Distribution of SYT-SSX2 ChIP peaks relative to gene transcription start sites and corresponding genes .............................................. 45 Table 2. Selected list of upregulated genes bound by the SYT-SSX2 complex involved in neural development and function ....................................... 46 Table 3. Selected list of genes involved in neural development and function upregulated by SYT-SSX2 in human mesenchymal stem cells ............ 52 Table 4. Selected list of developmental pathway mediators upregulated by SYT-SSX2 in human mesenchymal stem cells................................................... 53 Table 5. Distribution of SYT-SSX2 peaks per chromosome ............................... 67 Table 6. Number of SYT-SSX2 peaks that overlap epigenetic markers ............. 68 Table 7. Overlap of epigenetic markers with SYT-SSX2 .................................... 69 Table 8. Distribution of SYT-SSX2 peaks overlapping with H3K27me3 with respect to gene TSS ........................................................................................... 70 Table 9. Distribution of SYT-SSX2-overlapping epigenetic markers with respect to upregulated genes ............................................................................. 75 Table 10. Distribution of SYT-SSX2-overlapping epigenetic markers with respect to downregulated genes......................................................................... 75
vii
LIST OF FIGURES
Page Figure 1. Schematic representations of SYT, SSX, and the translocation SYT-SSX ......................................................................................... 5 Figure 2. Alterations in cellular programs in myoblasts by SYT-SSX2 ............... 42 Figure 3. Activation of a neural program by SYT-SSX2 ...................................... 47 Figure 4. SYT-SSX2 deregulates differentiation in mesenchymal stem cells .................................................................................................................... 50 Figure 5. Contribution of FGFR2 to SYT-SSX2 differentiation effects and to cell growth ...................................................................................................... 56 Figure 6. Distribution of SYT-SSX2 peaks with respect to chromosome and epigenetic markers ...................................................................................... 66 Figure 7. Differential pattern of binding between upregulated and downregulated genes targeted by SYT-SSX2 .................................................... 72 Figure 8. Hierarchical clustering of differentially regulated genes....................... 79 Figure 9. Models of SYT-SSX2 recruitment and activity ..................................... 86 Figure 10. Bmi1 is phosphorylated in response to cellular stress ....................... 90 Figure 11. Activation of NGFR by SYT-SSX2 ..................................................... 94 Figure 12. SYT-SSX2 inhibits ubiquitylation activity of Ring1b ........................... 97
viii
LIST OF PUBLICATIONS
Garcia CB, Shaffer CM, Alfaro MP, Smith AL, Sun J, Zhao Z, Young PP, VanSaun M, Eid JE. (2011). “Reprogramming of mesenchymal stem cells by the synovial sarcoma-associated oncogene SYT-SSX2.” Oncogene (in press).
Barco R, Garcia CB, Eid JE. (2009). “The synovial sarcoma-associated
SYTSSX2 oncogene antagonizes the Polycomb complex protein Bmi1.” PLoS One 4: e5060 doi: 10.1371/journal.pone.0005060.
Eid J, Garcia C, Frump A . (2008). ”SSX2 (Synovial Sarcoma, X breakpoint 2).”
Atlas Genet Cytogenet Oncol Haematol. URL : http://AtlasGeneticsOncology.org/Genes/SSX2ID42406chXp11.html
Barco R, Hunt LB, Frump AL, Garcia CB, Benesh A, Caldwell RL, Eid JE. (2007).
“The synovial sarcoma SYT-SSX2 oncogene remodels the cytoskeleton through activation of the ephrin pathway.” Mol Biol Cell 18: 4003-12.
ix
LIST OF ABBREVIATIONS
Acetylated histone H3 lysine 9................................................................... H3K9Ac
Acetylated histone H3 lysine 14 ............................................................... H3K14Ac
Acetylated histone H3 lysine 18 ............................................................... H3K18Ac
Acetylated histone H4 lysine 12 ............................................................... H4K12Ac
B lymphoma Mo-MLV insertion region 1 ......................................................... Bmi1
Bone morphogenetic protein........................................................................... BMP
Brahma-related gene 1 .................................................................................... Brg1
Brahma homolog .............................................................................................. Brm
Chromatin immunoprecipitation ...................................................................... ChIP
ChIP sequencing ...................................................................................... ChIPSeq
Dimethylated histone H3 lysine 4 ........................................................... H3K4me2
Delta-like 1........................................................................................................ Dll1
DNA methylation ........................................................................................ DNA me
Extracellular signal-regulated kinase ............................................................... ERK
Fibroblast growth factor ................................................................................... FGF
Fibroblast growth factor receptor ...................................................................FGFR
Histone deacetylase ..................................................................................... HDAC
(Human) mesenchymal stem cell ............................................................... (h)MSC
Insulin-like growth factor 2 ................................................................................ Igf2
Mammalian Switch/Sucrose Nonfermentable complex homolog ........ (m)SWI/SNF
Monomethylated histone H3 lysine 4 ...................................................... H3K4me1

x
Myogenic differentiation 1 .............................................................................. MyoD
Myogenic factor 5 ........................................................................................... Myf5
Nerve growth factor receptor ........................................................................... Ngfr
Neurofilament .................................................................................................. NEF
Polycomb group ............................................................................................... PcG
Polycomb Repressive Complex 1 .................................................................. PRC1
Polycomb Repressive Complex 2 .................................................................. PRC2
RNA polymerase II .......................................................................................... PolII
Synovial sarcoma .............................................................................................. SS
Synovial sarcoma translocation ....................................................................... SYT
Synovial sarcoma X chromosome breakpoint.................................................. SSX
SSX repressor domain ............................................................................... SSXRD
SYT N-terminal homology ............................................................................... SNH
Transforming growth factor ......................................................................... TGF
Trimethylated histone H3 lysine 4 ........................................................... H3K4me3
Trimethylated histone H3 lysine 27 ....................................................... H3K27me3
Trimethylated histone H3 lysine 36 ....................................................... H3K36me3
Trithorax group ............................................................................................... TrxG
Ubiquitylated histone H2A lysine 119 .......................................................... H2AUb
Ubiquitylated histone H2B lysine 123 .......................................................... H2BUb
Wingless-type MMTV integration site family ..................................................... Wnt
1
CHAPTER I
INTRODUCTION
Synovial sarcoma
Clinical features and treatment
Synovial sarcoma (SS) is an aggressive malignancy with few specific
therapies (Haldar et al., 2008). It is a rare disease, comprising between 7 and 10
percent of all sarcoma cases and is diagnosed primarily in adolescents and
young adults. Tumors are typically found near the joints but can arise in many
locations throughout the body (Ladanyi, 2001; dos Santos et al., 2001). SS
displays a high degree of metastasis, particularly to the lungs as well as the bone
marrow and lymph nodes (dos Santos et al., 2001). The primary treatment
involves tumor resection and may include the addition of radiation or
chemotherapy (Haldar et al., 2008). Even with these interventions, the survival
rates of SS remain low and can range from 25-60% 5-year survival and a 10-year
survival between 10 and 30% (Ladanyi, 2001; dos Santos et al., 2001).
In spite of its name, synovial sarcoma is not actually derived from synovial
tissue and is believed to arise from the transformation of some type of stem cell
with the capacity to differentiate into epithelial and mesenchymal lineages (dos
Santos et al., 2001). This is based on tumor histology which also allows for the
classification of SS into three clinical subtypes: monophasic, biphasic, and poorly
2
differentiated. Monophasic tumors have spindle shaped cells that are small with
little cytoplasm (Haldar et al., 2008). Biphasic tumors have compartments
displaying glandular structures in addition to the spindle cell compartment, and
the cells in poorly differentiated tumors have a morphology intermediate between
the spindle and epithelial cells. Interestingly, all subtypes of SS display markers
of epithelial differentiation making them unique among sarcomas. Another
feature of SS is the presence of a recurrent chromosomal translocation
t(X;18)(p11.2;q11.2) which can be detected in over 90% of all SS tumors (dos
Santos et al., 2001). This genetic abnormality provides a characteristic feature
which can be exploited to understand the molecular biology of synovial sarcoma
tumors and lead to the development of more specific therapies in the future.
Molecular features of synovial sarcoma
Because of its specific association with SS as well as its presence in all
compartments of the tumor and persistence throughout tumor growth, the
product of the t(X;18) translocation is thought to drive SS tumor formation (dos
Santos et al., 2001; Ladanyi, 2001). This mutation results in the aberrant fusion
of the SYT gene (for “synovial sarcoma translocation,” also known as SS18) on
chromosome 18 with one of the SSX (“synovial sarcoma X chromosome
breakpoint”) family members located on the X chromosome (Clark et al., 1994;
Crew et al., 1995; Skytting et al., 1999). The fusion gene is transcribed and
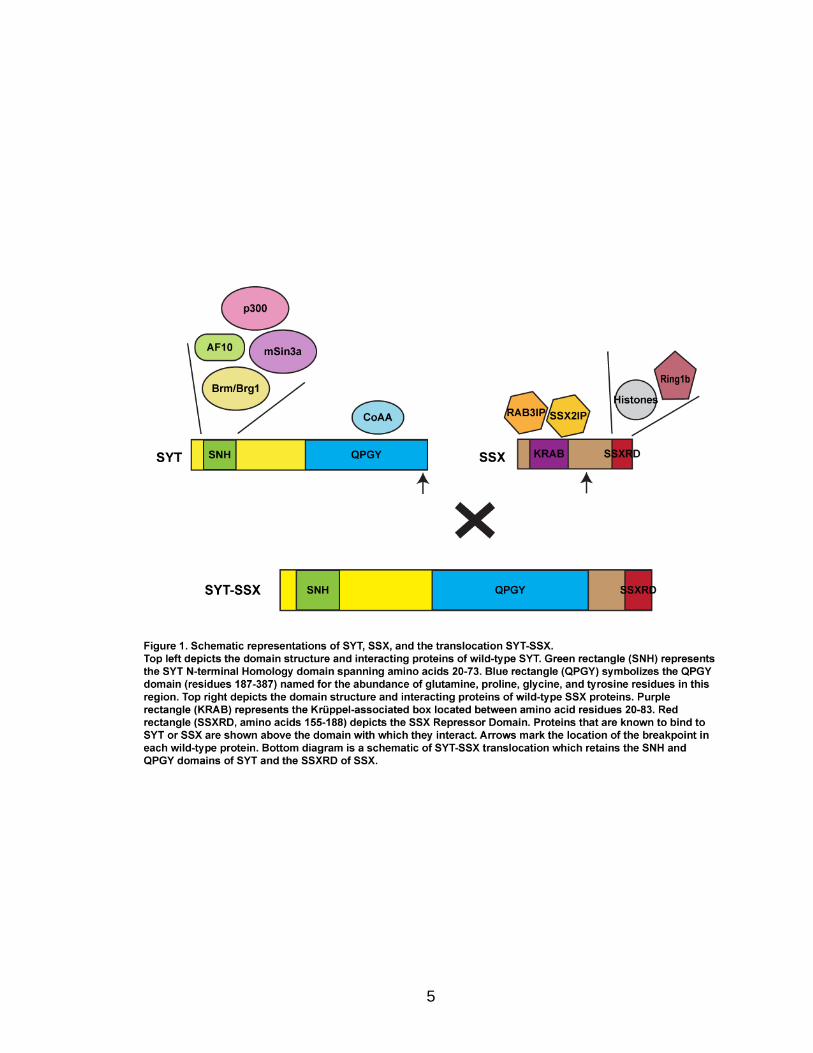
encodes a functional protein in which the C-terminal 78 amino acids of SSX
replace the last 8 amino acids of SYT (Figure 1; Clark et al., 1994). Most
3
translocations involve the same breakpoints in SYT and either SSX1 or SSX2,
but variations in the fusion are seen involving different breakpoints and alternate
family members like SYT-like (SYTL) and SSX4 (Crew et al., 1995; Skytting et
al., 1999; Brodin et al, 2001; Storlazzi et al., 2003). SYT-SSX proteins localize in
the nucleus where they may dictate tumorigenesis through the modulation of
gene transcription (Thaete et al., 1999; Brett et al., 1997; dos Santos et al.,1999).
Both wild-type SYT and SSX proteins are nuclear co-regulators of
transcription, and the subversion of their normal activities could contribute to
cellular transformation. SYT is a ubiquitously expressed protein that is essential
for development. Knock-out animals display embryonic lethality due to placental
and cardiac defects (de Bruijn et al., 1996; de Bruijn et al., 2006b; Kimura et al.,
2009). SYT resides predominantly in the nucleus where it displays a distinct
speckled pattern (Thaete et al., 1999; Brett et al., 1997; dos Santos et al., 1999).
It colocalizes with Brg1 and Brm in these nuclear foci, and this association is
dependent on the N-terminus of SYT (Thaete et al., 1999; Ishida et al., 2004).
This interacting region is evolutionarily conserved and is called the SYT N-
terminal Homology (SNH) domain (Thaete et al., 1999). The SNH domain also
mediates interactions with other proteins including the transcription factor AF10
and the histone modifiers p300 and mSin3a (Figure 1; de Bruijn et al., 2001; Eid
et al., 2000; Ito et al., 2004). SYT contains an additional function domain at its C-
terminus that has transactivation activity. It is referred to as the QPGY domain
because of the abundance of glutamine, proline, glycine, and tyrosine residues
(Figure 1; Thaete et al., 1999; Brett et al., 1997). This bears similarity to the
4
activation domain found in EWS/FUS/TLS proteins and is a domain that is also
seen in the p250 and p250R proteins that are components of the mammalian
SWI/SNF (mSWI/SNF) complex (Thaete et al., 1999; Kato et al., 2002).
Interaction with the nuclear receptor Co-activator Activator (CoAA) protein occurs
through the QPGY domain, and SYT may homo-dimerize through this
module as well (Iwasaki et al., 2005; Perani et al., 2005; Perani et al., 2003).
Notably, SYT lacks a DNA binding domain (Clark et al., 1994), and together
these data indicate that SYT may mediate its function through protein-protein
interactions that regulate transcription.
Early studies on the function of SYT reveal a role in transcriptional
activation; however, the mechanism of its activity is still not understood. Previous
work indicates that SYT plays a role in general transcription, and fusion of SYT to
the Gal4 DNA binding domain results in reporter gene activation (Iwasaki et al.,
2005; Ishida et al., 2004). This can be enhanced by deletion of the N-terminus
and may be due to the association of mSin3a with the SNH domain (Ishida et al.,
2004; Ito et al. 2004). Some evidence suggests that negative regulation of SYT
activity also occurs through its interaction with Brg1/Brm; however, this is not
corroborated by other reports (Ishida et al., 2004; Iwasaki et al., 2005). In
addition, SYT can activate hormone-responsive promoters in a ligand-dependent
manner with its binding partner, CoAA, requiring either Brm or Brg1 and the
QPGY domain (Perani et al., 2005; Iwasaki et al., 2005). In summary, SYT
involvement in transcriptional activation requires its interaction with other proteins
suggesting that it may function as a recruitment factor for multiple complexes.
5
6
Downstream of transcription, SYT appears to play a role in the regulation
of adhesion. Association with p300 occurs specifically in the context of adherent
cells (Eid et al., 2000). Moreover, adhesion to fibronectin is inhibited in the
presence of a C-terminal mutant of SYT lacking the last 8 amino acids
(mimicking the portion of the protein involved in the SYT-SSX translocation) (Eid
et al., 2000). Additional studies have revealed a role for SYT in the formation of
epithelial cysts in 3D culture as well as migration, further highlighting the
importance of SYT in adhesion (Chittezhath et al., 2008; Kimura et al., 2009).
Overall, SYT mediates transcriptional activation through interactions with multiple
proteins and may integrate signals from a variety of pathways including
hormones and extracellular matrix adhesion.
In contrast, the SSX genes encode transcriptional co-repressors whose
physiological function remains unclear. These proteins are typically 188 amino
acids in length, and their genes are found in 2 clusters on the X chromosome that
are approximately 3Mb away from one another (Güre et al., 2002). There are 9
family members in all, and they are characterized by the presence of 2 domains
involved in transcriptional repression: an N-terminal Krüppel-associated box
(KRAB) domain and a C-terminal SSX Repressor Domain (SSXRD) (Figure 1;
Crew et al., 1995; Lim et al., 1998). The primary functional domain of SSX
proteins is the SSXRD, a region that is highly conserved among all family
members (Güre et al., 2002). This domain is responsible for SSX nuclear
localization as well as the bulk of its repressor activity (dos Santos et al., 2000;
Thaete et al., 1999). The KRAB domain is found in a large sub-family of
7
transcriptional repressors, but in SSX proteins, it appears to play a
supplementary role by augmenting repression mediated by the SSXRD (Crew et
al., 1995; Lim et al., 1998; Thaete et al., 1999). Notably, like SYT, SSX proteins
lack a DNA binding domain; therefore, they may also exert their function via
protein-protein interactions (Crew et al., 1995).
Very few interacting partners of SSX proteins have been identified to date.
Early studies reveal nuclear localization of SSX1 and SSX2, and it was later
determined that SSX2 associated with Polycomb proteins (Brett et al., 1997; dos
Santos et al., 1999; dos Santos et al., 2000). The Polycomb proteins are
important regulators of differentiation and development that maintain silencing of
lineage-specific genes through the modulation of chromatin structure (see
below). The interaction between Polycomb proteins and SSX is dependent on the
SSXRD, further highlighting the functional importance of this domain (dos Santos
et al., 2000). In addition, SSX can co-precipitate histone oligomers and oligo-
nucleosomes suggesting that SSX proteins may also be targeted through direct
interactions with chromatin (Kim et al., 2009). Nevertheless, SSX1 binds to the
transcription factor LHX4, and this association leads to the decreased expression
of an LHX4-responsive reporter gene (de Bruijn et al., 2008). Other studies have
identified additional interacting proteins; however, the functional consequences of
SSX binding with these partners has not been elucidated (de Bruijn et al., 2002).
SSX proteins are also of general interest because of their potential role in
many different cancers. The SSX family belongs to a class of proteins known as
cancer-testis (CT) antigens because of their normal tissue distribution and
8
expression in malignancies (Smith and McNeel, 2010). CT antigens are nearly
exclusively expressed in the testis; however, their aberrant expression in a
variety of tumors derived from multiple tissues can produce an immune response
in patients. This opens the possibility of using SSX peptides in vaccines for tumor
immunotherapy for several cancers in addition to synovial sarcoma (Smith and
McNeel, 2010). Thus, SSX as well as SYT are important proteins outside of their
association with SS, and understanding their wild-type functions will expand our
knowledge of both development and cancer.
Cellular Reprogramming and Cancer
Recently, it has been hypothesized that tumors are maintained by a small
population of cancer stem cells (CSCs) that, when isolated, are able to
repopulate the entire tumor with all of its various phenotypes (Lobo et al., 2006).
The mechanism of how CSCs arise is not known; however, there are parallels
between tumorigenesis and the process of cellular reprogramming by which
normal, terminally differentiated somatic cells can be induced to behave like
pluripotent stem cells (Abollo-Jiménez et al., 2010; Castellanos et al., 2010).
Both require the gain of stem cell characteristics as well as the active repression
of a cell‟s endogenous differentiation program (Lobo et al., 2006; Gurdon and
Melton, 2008; Abollo-Jiménez et al., 2010). These alterations, in turn, depend on
changes in gene transcription through the action of lineage-specific transcription
factors, epigenetic regulators, and signaling molecules (Abollo-Jiménez et al.,
9
2010; Castellanos et al., 2010). SYT-SSX expression is associated with the
activation of multiple signaling pathways, and it can interact with a number of
proteins that control transcription through genetic and epigenetic mechanisms.
These data suggest that SYT-SSX mediates transformation through aberrant
cellular reprogramming.
Activation of signaling pathways by SYT-SSX
Many molecules involved in extracellular signaling pathways are activated
in SS tumors and cell lines. A number of studies have reported the upregulation
of various receptor tyrosine kinase pathway components including Igf2, HGF and
c-Met, ephrin ligands and Eph receptors, FGF ligands and receptors, EGFR, and
PDGFR (de Bruijn et al., 2006a; Watanabe et al., 2006; Barco et al., 2007; Ishibe
et al., 2005; Bozzi et al., 2008). Several of these pathways converge on MAPK
signaling leading to changes in cell proliferation, migration, and anchorage-
independent growth and thus contribute to cellular transformation (Fukukawa et
al., 2009; Watanabe et al., 2009; Watanabe et al., 2006). Moreover, the
expression of ligands and their cognate receptors, as in the case of HGF and c-
Met, ephrin and Eph receptors, and FGF signaling molecules, indicates that SYT-
SSX mediates the formation of autocrine signaling loops. This may help to
establish and maintain the transformed program in SS.
The non-canonical Wnt pathway is also active in some SS cell lines
(Fukukawa et al., 2009). Signaling through this pathway affects anchorage-
independent growth through Rac1 and JNK activation (Fukukawa et al., 2009).
10
Similarly, in the absence of canonical signaling events, -catenin localizes in the
nucleus and forms a complex with SYT-SSX2. This complex can activate a
reporter gene, but the endogenous targets of this complex are not known (Pretto
et al., 2006). This is evidence that not only does SYT-SSX activate different
signaling pathways that contribute to the transformed phenotype, but it also has
the capacity to change transcriptional programs directly.
Transcriptional deregulation by SYT-SSX
Based on their wild-type activities, the fusion of SYT to SSX generates a
protein with an enigmatic function as it has the potential to mediate opposing
behaviors. In the translocation, the SNH and QPGY domains of SYT are retained
and fused to the C-terminal end of SSX with the SSXRD remaining intact (Figure
1, Pretto et al., 2006). Because these domains mediate protein-protein
interactions with activators and repressors of transcription, it can be conjectured
that SYT-SSX functions through both aberrant silencing and activation of target
genes that contribute to tumorigenesis.
One mechanism by which SYT-SSX may induce and maintain tumor
formation is through downregulation of tumor suppressor genes. SYT-SSX1 was
shown to associate with wild-type SYT, and both proteins are bound to the
COM1 tumor suppressor promoter region (Ishida et al., 2007). Expression of
SYT-SSX1 led to the downregulation of COM1 which could be abrogated by
exogenous expression of wild-type SYT. This suggests that SYT-SSX acts in a
dominant negative manner to inhibit the normal function of SYT (Ishida et al.,
11
2007). Similarly, SYT-SSX2 directly repressed the activity of EGR1, a putative
tumor suppressor and SYT target gene (Lubieniecka et al., 2008). Wild-type SYT
and SYT-SSX2 associate with the EGR1 promoter; however, SYT-SSX2
uniquely recruits Polycomb proteins to this locus. Altogether, these studies
indicate that silencing of SYT target genes is one method of transcriptional
deregulation mediated by SYT-SSX.
The activation of gene transcription by the fusion protein also contributes
to tumor formation. As mentioned above, the IGF pathway is implicated in SS
formation by a number of studies and correlates with increased cell proliferation
and metastasis (Xie et al., 1999; Allander et al., 2002; de Bruijn et al., 2006a;
Sun et al., 2006; Törnkvist et al., 2008). Furthermore, IGF2 neutralizing
antibodies are able to increase apoptosis in SS cell lines (Sun et al., 2006). SYT-
SSX proteins may directly affect expression of the IGF2 gene through
deregulation of its imprinting (de Bruijn et al., 2006a; Sun et al., 2006; Cironi et
al., 2009). The exact mechanism of how this occurs is unclear, but altered
methylation of the imprinting control region appears to play a role in this process
(Sun et al., 2006; Cironi et al., 2009).
We have already discussed how Polycomb proteins may be aberrantly
targeted to SYT target genes, and previous work in our lab reveals that the
reverse may also occur. SYT-SSX2 expression in U2OS human osteosarcoma
cells leads to a reduction in total protein levels of Bmi1 through enhanced
degradation (Barco et al., 2009). This results in reduced association between
Bmi1 and its functional partner, Ring1b, a global decrease in histone H2A
12
ubiquitylation, the enzymatic activity catalyzed by Ring1b and facilitated by Bmi1,
and the increased expression of Polycomb target genes (Barco et al., 2009).
Together, these data demonstrate that SYT-SSX alters the gene expression
profile of the cell by epigenetic mechanisms.
Additionally, SYT-SSX interacts with sequence-specific transcription
factors to mediate transcriptional activation. SYT-SSX induces the expression of
E-cadherin. E-cadherin protein is found in biphasic SS which displays glandular
differentiation of its epithelioid compartment. Both SYT-SSX1 and SYT-SSX2
activate the E-cadherin promoter through interaction with the repressors Snail
and Slug (Saito et al., 2006). SYT-SSX also binds to LHX4 resulting in the
activation of an LHX4 reporter gene (de Bruijn et al., 2008). LHX4 is involved in
pituitary development and is linked to human disorders related to aberrant
pituitary function (Machinis et al., 2001). Thus SYT-SSX can mediate
transcriptional activation through association with lineage-specific transcription
factors. In summary, the studies described above indicate that SYT-SSX
regulates transcription via both genetic and epigenetic means.
Tumorigenesis depends on cell-intrinsic and extrinsic factors
The process of reprogramming is inefficient and depends on the level of
differentiation in the original cell (Gurdon and Melton, 2008) suggesting that
tumor formation by this mechanism will display similar characteristics. The
potential of SYT-SSX to cause widespread transcriptional deregulation implies
that its expression will always result in transformation; however, this is not the
13
case. SYT-SSX1 induces anchorage-independent growth and tumor formation in
nude mice when expressed in rat 3Y1 fibroblasts (Nagai et al., 2001), yet
additional reports on SYT-SSX-mediated transformation provide conflicting
results. Human MSCs expressing SYT-SSX1 are unable to form tumors in
immune deficient mice (Cironi et al., 2009), and previous work in our lab reveals
that SYT-SSX2 is unable to transform NIH3T3 fibroblasts in vitro (Barco et al.,
2007). This may be due to the ability of SYT-SSX to activate expression of p21, a
direct target of the fusion in some cell types, including NIH3T3 cells (Tsuda et al.,
2005). Interestingly, it is postulated that tumor suppressor pathways function as
barriers to reprogramming (Abollo-Jiménez et al., 2010; Castellanos et al., 2010).
Taken together, these data suggest that transformation by SYT-SSX proteins
only occurs under conditions (intrinsic and extrinsic to the cell) that are
permissive for reprogramming.
In vivo experiments indicate that tumorigenesis also relies on the cell
differentiation status and the surrounding microenvironment. Mouse modeling of
SS revealed that SYT-SSX2 alone could drive tumorigenesis, however, its effect
was limited to transgenic animals in which the oncogene was expressed in Myf5-
positive myoblasts (Haldar et al., 2007). Induction of SYT-SSX2 in less
differentiated myogenic progenitor populations or in more differentiated myocytes
did not result in tumor formation. Moreover, even in Myf5-positive cells, SYT-
SSX2 caused apoptosis in vivo except in populations growing adjacent to the
future cartilage of the rib. Thus, the target cell must meet certain requirements of
14
cell fate commitment and location in order to become transformed by SYT-SSX
(Haldar et al., 2007; Haldar et al., 2009).
Overall, it appears that the fusion protein functions through the recruitment
of regulators that can override the normal transcriptional status at a given locus.
Moreover, contributions from both components of the fusion protein are required
for its molecular activity; therefore, transformation by SYT-SSX depends on its
ability to alter gene expression. This causes the activation of multiple signaling
pathways, silencing of tumor suppressors, and the expression of other genes
resulting in the acquisition of SS-associated phenotypes. In addition, the nature
of the initiating cell is also important, and its properties can determine whether
tumors form. These attributes parallel features of cellular reprogramming and
leads to the hypothesis that SYT-SSX directs tumorigenesis by this process.
Elucidating the characteristics of the aberrant program initiated by SYT-SSX,
therefore, is essential to understanding the biology of SS.
Epigenetic Regulation of Development
Epigenetics refer to inherited changes in gene expression that occur
independently of alterations in the DNA primary structure (Jones and Baylin,
2007). Stem cells employ epigenetic mechanisms to control the expression of
developmental regulators either to maintain multipotency or to carry out cellular
differentiation. Modulation of chromatin structure is one aspect of epigenetic
regulation and is mediated by the action of many proteins the best characterized
15
being the Polycomb group (PcG) proteins and the SWI/SNF complex (Lessard
and Crabtree, 2010).
PcG proteins are an evolutionarily conserved family of proteins that make
up 2 classes of complexes in mammals: Polycomb Repressive Complex 1
(PRC1) and PRC2 (Kerppola, 2009; Schuettengruber et al., 2007). Each complex
has a unique set of core components, some with multiple homologs, as well as
associated activities that characterize it (Kerppola, 2009). The core PRC1
proteins are Bmi1, Cbx, Phc, and Ring1, which catalyzes the ubiquitylation of
histone H2A on lysine 119 (H2AUb) (Kerppola, 2009; Schuettengruber et al.,
2007). In addition, PRC1 can associate with methylated histone tails via the
chromodomain of Cbx proteins (Kerppola, 2009). Through the activity of the Ezh1
and Ezh2 proteins, PRC2 is able to trimethylate histone H3 on lysine 27
(H3K27me3) (Schuettengruber et al., 2007). The other core proteins of PRC2 are
Eed and Suz12 and are required for the methyltransferase activity of the Ezh
proteins (Kerppola, 2009; Simon and Kingston, 2009; Schuettengruber et al.,
2007). Additional factors may associate with both PRCs increasing the variability
of these complexes, and the function of PRC1 and PRC2 may be modulated by
the presence of these proteins (Kerppola, 2009; Simon and Kingston, 2009).
PcG proteins were discovered in Drosophila through mutations resulting in
aberrant development (Simon and Kingston, 2009; Schuettengruber et al., 2007).
It has since been determined that Polycomb proteins function in stem cells to
prevent inappropriate differentiation through the repression of target genes
(Kerppola, 2009). Indeed, many targets of Polycomb are lineage-specific and
16
become activated during development (Lessard and Crabtree, 2010). The
mechanisms of how Polycomb complexes mediate gene silencing are not well-
understood, however, it may occur through chromatin compaction, cooperation
with DNA methylation, or blockade of transcriptional elongation (Kerppola, 2009;
Simon and Kingston, 2009; Schuettengruber et al., 2007).
The activity of Polycomb complexes is antagonized by another class of
proteins known as the Trithorax group (TrxG) (Schuettengruber et al., 2007).
TrxG proteins also function in complexes that fall into 2 categories: histone
methyltransferases and nucleosome remodelers (Schuettengruber et al., 2007).
The mammalian SWI/SNF complex (SWI/SNF, also known as the BAF complex)
is an ATP-dependent chromatin remodeler comprised of 12 proteins and
homologous to a yeast complex bearing the same name (Lessard and Crabtree,
2010). Like Polycomb complexes, SWI/SNF complexes containing alternate
components mediate different functions. For example, Brg1 is required for
embryonic development and mediates the activation of the zygotic genome while
Brm does not appear to be essential for this process (Lessard and Crabtree,
2010). The mechanism of how SWI/SNF complexes abrogate Polycomb
silencing is not clear; however, it may involve the decompaction of chromatin as
well as the activity of other TrxG members.
The PcG and TrxG proteins function to maintain the expression status of
genes when the initiating signal for either repression or activation is gone
(Kerppola, 2009). This indicates that these proteins are responsible for the
persistence of a particular program that was established by another factor.
17
Interestingly, SYT-SSX proteins interact with both PcG proteins and the
SWI/SNF ATPases (Thaete et al., 1999; Nagai et al., 2001; dos Santos et al.,
2000; Barco et al., 2009). The capacity to bring together these opposing
functions implies not only the deregulation of the targets of these complexes but
also the persistence of the altered program in the resulting tumor.
SYT-SSX directly mediates both transcriptional activation and repression
through regulating the activity of PcG complexes (Lubieniecka et al., 2008; Barco
et al., 2009). These data provide a mechanistic basis for epigenetic changes that
may result in cellular reprogramming. Controlling transcription is central to
tumorigenesis by SYT-SSX, thus further defining how the fusion accomplishes
alterations in gene expression is essential to the development of specific
therapies for the treatment of SS.
Purpose of this study
Players that are central to the maintenance of nuclear programs interact
with SYT-SSX proteins. This enables SYT-SSX to dictate its own agenda within a
target cell and propagate that program to daughter cells. Investigating the nature
of the oncogenic program of SYT-SSX is necessary for the generation of more
effective therapeutic interventions. The goal of this study is to define that
program and the mechanism by which it is established.
Chapter 3 discusses the nature of the program activated by SYT-SSX2 in
mesenchymal stem and progenitor cells. SS is a tumor believed to be derived

18
from mesenchymal tissues, and previous studies have suggested that it
originates in stem cells. Upon its expression, SYT-SSX2 induces the expression
of developmental and tissue-specific differentiation regulators. Moreover, a
predominant activation of genes involved in neural lineages (neuronal and glial)
occurs. This is associated with the formation of long projections and the
expression of neurofilament protein. Genome-wide binding studies on SYT-SSX2
reveal that it is targeted to many of the neural-associated genes indicating their
direct regulation by the fusion protein. In addition, SYT-SSX2 is recruited to the
Fgfr2 gene, and its association with Fgfr2 correlates with expression. FGF
signaling mediates the neural phenotype displayed by SYT-SSX2-expressing
cells, and the inhibition of this signaling pathway results in decreased
neurofilament expression in hMSCs transduced with the oncogene and SS tumor
cell lines.
In Chapter 4, the genome-wide binding of SYT-SSX2 is studied in more
depth in order to identify potential mechanisms of recruitment to target loci. SS
likely originates from more than 1 progenitor cell population, and because it
interacts with epigenetic regulators, its exact targets may differ depending on the
initiating cell; however, the mode by which it is recruited will be similar across cell
types. SYT-SSX2 association with the genome is non-random, and it localizes to
distinct regions. Comparison with publicly available datasets defining regions
enriched in specific histone modifications reveals a predominant association with
H3K27me3, the modification characteristic of Polycomb-silenced genes. In fact,
SYT-SSX2 occupies H3K27me3-labeled regions within or near over 70% of
19
positively-regulated and 40% of negatively-regulated genes in oncogene-
expressing cells. These data support a role for SYT-SSX2 in the re-activation of
Polycomb-silenced genes and suggest that Polycomb complexes serve as a
recruitment module for the fusion protein. An additional subset of downregulated
SYT-SSX2 target genes are characterized by association of the protein with
histone modifications that correlate with transcriptional activation. Taken
together, there are at least 2 mechanisms of SYT-SSX2 recruitment to target
genes, one dependent on PcG proteins, and the other Polycomb-independent.
Chapter 5 covers the molecular mechanism of SYT-SSX2-mediated
Polycomb derepression. Previous work shows that SYT-SSX2 abrogates
silencing by PRC1 resulting in transcriptional activation due to enhanced
degradation by Bmi1. A variety of cellular stresses in myoblasts, including SYT-
SSX2 expression, results in alterations of Bmi1 mobility by SDS-PAGE. This is
due to increased phosphorylation. SYT-SSX2 expression also leads to the loss of
Bmi1 from a PRC1 target gene, Ngfr. This change was accompanied by
alterations in histone modifications (from silent to active) and expression of Ngfr
transcripts. Ngfr expression depends on the presence of the N-terminus of SYT,
known to interact with Brg1 and p300. Studies with purified PRC1 components
Ring1b and Bmi1 reveal that the ubiquitin E3-ligase activity of Ring1b is inhibited
in the presence of SYT-SSX2-purified complexes. These data provide the
foundation for additional mechanistic studies and indicate that SYT-SSX2
deregulates PRC1 function by inhibition of Ring1b activity. This may occur
directly or by the recruitment of deubiquitylase activity. In summary, these data

20
support the hypothesis that SYT-SSX2 causes oncogenic transformation by
cellular reprogramming.
21
CHAPTER II
MATERIALS AND METHODS
Molecular and cellular biology
Cell culture
U2OS human osteosarcoma cells, C2C12 mouse myoblasts (ATCC), and HeLa
cells were maintained in DMEM supplemented with 10% FBS. The human
synovial sarcoma SYO-1 cells (Kawai et al., 2004) were provided by T. Ito and M.
Ladanyi and grown in collagen-coated (20 µg/ml) dishes with DMEM and 10%
FBS. Human multipotent bone marrow mesenchymal stem cells (hMSCs) were
acquired from Darwin Prockop‟s laboratory at the Texas A&M Health Science
Center College of Medicine (TAMHSCCOM) Institute for Regenerative Medicine
at Scott and White Hospital and maintained in their recommended growth
medium. These were used in the experiments described throughout Chapter 3
and Appendix B Figure B3 and were early passage. They were isolated
according to protocols established by the Prockop group (Colter et al., 2001;
Sekiya et al., 2002) for the identification of multipotent MSCs. The hMSCs shown
in Appendix B Figure B4 were provided by P. Young and M. Alfaro (Vanderbilt
University, IRB#101438).
22
Antibodies and reagents
Mouse anti-Flag antibody, (Sigma, St. Louis, MO), mouse anti-H3K27me3,
mouse anti-H3K4me3, mouse control IgG MOPC-173, (Abcam, Cambridge, MA),
mouse anti-H3K18Ac (Cell Signaling, Danvers, MA), mouse anti-Ring1b (MBL,
Woburn, MA), mouse anti-Bmi1, mouse anti H3K14Ac, mouse anti- H2AUb
(Millipore, Billerica, MA), were used in chromatin immunoprecipitation (ChIP)
assays and Western blotting. Rabbit polyclonal anti-HA (Sigma), mouse anti-NEF
(light, medium, and heavy neurofilaments; Abcam), mouse anti-alpha-tubulin
(Sigma), rabbit anti-FGFR2 (N-Term, Abgent, San Diego, CA), rabbit polyclonal
anti-SSX2 B56 (Pretto et al., 2006), and mouse monoclonal anti-SYT SV11
(Pretto et al., 2006) antibodies were used for immunofluorescence staining and
Western blotting. Mouse anti-Glu-Glu (2PY, Covance, Princeton, NJ) and mouse
monoclonal anti-HA 12CA5 were used for immunoprecipitation (IP) and Western
blotting. Rabbit anti-Brg1 (Millipore) was used for Western blotting. PD173074
was purchased from Cayman Chemical Company (Ann Arbor, MI). MG132 was
obtained from Calbiochem (San Diego, CA). Sodium orthovanadate was
obtained from Sigma.
Retroviral Infection of C2C12 cells
The double-tagged pOZ-HA-Flag parental vector and pOZ-SYT-SSX2-HA-Flag,
and retroviral production and infection were described previously (Pretto et al.,
2006). The LZRS-2PY-Bmi1 vector was provided by M. van Lohuizen.
Construction of the SXdel3 mutant was described in Barco et al., 2009.
23
mRNA Isolation and Microarray
C2C12 myoblasts infected with retroviral pOZ vector and pOZ-SYT-SSX2 with
greater than 90% efficiency were used as source of RNA. Human MSCs
expressing pOZ and pOZ-SYT-SSX2 were selected as described (Nakatani and
Ogryzko, 2003), prior to RNA isolation. Total cellular RNA was isolated 2 days
and 4 days post-infection from SYT-SSX2- or control vector-expressing C2C12
and hMSCs cells, respectively, using the RNeasy Mini Kit (Qiagen, Valencia, CA)
according to the manufacturer‟s protocol. RNA obtained from 2 independent
experiments with each cell line was submitted to the Vanderbilt Functional
Genomics Shared Resource. cDNA was produced from RNA samples using the
Ambion WT Expression Kit (Applied Biosystems, Foster, CA) then fragmented
and labeled according to the WT Terminal Labeling and Hybridization protocol
(Affymetrix, Santa Clara, CA) prior to hybridization to the Affymetrix Mouse
(C2C12) or Human (MSCs) Gene 1.0 ST array. Signal intensities were
normalized by RMA, and fold enrichment was determined by calculating the ratio
of the linearized signal intensities of the experimental versus control samples (or
the negative reciprocal of the linearized signal ratio for values < 1). Genes with
fold enrichments either greater than 1.6 or less than -1.6 (in C2C12) and greater
than 2.0 or less than -2.0 (in hMSCs) were considered significant. Significant
genes with known functions were manually annotated based on descriptions
given in the GeneCards database (Safran et al., 2010; available at
http://www.genecards.org) and Entrez Gene (Maglott et al., 2006; available at
http://ncbi.nlm.nih.gov/gene).
24
Chromatin Immunoprecipitation
Chromatin immunoprecipitation was carried out as reported (Boyer et al., 2005)
with some modifications. All lysis steps were carried out at 4˚C with rotation.
Nuclei were sonicated (Misonix XL-2000) by performing 8 rounds of 3 x 5s pulses
with at least 20s rest between pulses and 2 min rest between rounds. After
sonication, lysis with 1% Triton-X was extended to 10 minutes at 4˚C with
rotation prior to centrifugation. The supernatant was collected and precleared
with 1µg control IgG bound to protein G Dynabeads (Invitrogen, Carlsbad, CA)
for 1 hour at 4˚C. The precleared lysate was added to 5µg Flag or control mouse
IgG antibody bound to protein G Dynabeads and incubated overnight at 4˚C with
rotation. Washes, elution, and DNA purification were performed as noted. DNA
was precipitated with ethanol (200 mM NaCl with 8 µg glycogen added to
facilitate precipitation) and stored at –80˚C overnight. DNA was pelleted by
centrifugation (13k rpm, 30 minutes), washed 2x with 70% ethanol, and allowed
to dry before resuspension in 10mM Tris pH 8.0.
Analysis of ChIP DNA by Next-Generation Sequencing
250ng of ChIP DNA samples were sequenced by the Illumina Genome Analyzer
II in the Vanderbilt Genome Technology Core. Sample DNA size and
concentration were measured by Pico Chip and NanoDrop, respectively, followed
by further sonication to generate DNA sizes between 150-200bp (Bioruptor,
Diagenode, Denville, NJ; 5 min, low, 30s on and 30s off). Samples were further
prepared by following the Illumina ChIP preparation protocol, then DNA ranging
25
from 150-275bp was gel purified, amplified by PCR, and diluted to 10nM for
cluster generation.
RT-PCR
For RT-PCR analysis, total cellular RNA was isolated as described above, and 1
µg RNA was used to generate cDNA using the Superscript II Reverse
Transcriptase kit (Invitrogen) according to the manufacturer‟s protocol. PCR
conditions for RT-PCR were as follows: 94˚C for 1 min; 33 cycles of 94˚C for 1
min, 54˚C (or 56˚C for Ngfr, Dll1, Igf2, Tle4, Fgfr2, Kdm4b, Dkk3, Rarg, and
Pdgfra) for 1 min, and 72˚C for 1 min 30 sec; 72˚C for 10 min. All PCR reactions
were carried out using Platinum PCR Supermix (Invitrogen) according to the
manufacturer‟s protocol. RT-PCR primer sequences are as follows:
Fgfr2 - Forward 5‟-TGGTCACCATGGCAACCTTGTC-3‟, Reverse 5‟-
TAGCCTCCAATGCGATGCTCCT-3‟; Fgfr3 - Forward 5‟-CCCTCCATCTCC-
TGGCTGAAG-3‟, Reverse 5‟-CACCAGCCACGCAGAGTGATG-3‟; Dll1 -
Forward 5‟-GCCAGGTACCTTCTCTCTGATC-3‟, Reverse 5‟-TGGTGAGTACA-
GTAGTTCAGGTC-„3; Gli2 - Forward 5‟-GGACAGGGATGACTGTAAGCAG-3‟,
Reverse 5‟-CTCTTGGTGCAGCCTGGGATCT-3‟; Hoxb5 - Forward 5‟-CGCCAA-
TTTCACCGAAATAGACG-3‟, Reverse 5‟-CAAGATAACCAGTCCAGGAGAGA-
3‟; Wnt4 - Forward 5‟-CAGGTGTGGCCTTTGCAGTGAC-3‟, Reverse 5‟-CACTG-
CCGGCACTTGACGAAG-3‟; Wnt11 - Forward 5‟-GGCCAAGTTTTCCGATGCT-
CCT-3‟, Reverse 5‟-CCCACCTTCTCATTC-TTCATGCA-3‟; Id2 - Forward 5‟-
CGACTGCTACTCCAAGCTCAAG-3‟, Reverse 5‟-CCTTCTGGTATTCACGCTC-
26
CAC-3‟; Pth1r - Forward 5‟-TGCACTGCACGCGCAACTACAT-3‟, Reverse 5‟-
CCCTGGAAGGAGTTGAAGAGCA-3‟; Sox9 - Forward 5‟-CCCTTCATGAAGA-
TGACCGACG-3‟, Reverse 5‟-CCGTTCTTCACCGACTTCCTCC-3‟; Tle3 -
Forward 5‟-CGGTGAAGGATGAGAAGAACCAC-3‟, Reverse 5‟-GTTGGTGTGT-
TGGACTTGAGCC-3‟; Tle4 - Forward 5‟-TCCTGTGATCGGATTAAGGAAGAG-
3‟, Reverse 5‟-GGAGTCTCTGTCTCTTTGGTGAT-3‟; Ngfr - Forward 5‟-
CAGGACTCGTGTTCTCCTGCC-3‟, Reverse 5‟-CCACAAGGCCCACAACCA-
CAG-3‟; Igf2 - Forward 5‟-GGAAGTCGATGTTGGTGCTTCT-3‟, Reverse 5‟-
CTGAACTCTTTGAGCTCTTTGGC-3‟; Myogenin - Forward 5‟-GCCCAGTGAAT-
GCAACTCCCACA-3‟, Reverse 5‟-CTCTGGACTCCATCTTTCTCTCCT-3‟; Tnnt1
- Forward 5‟-GGCAGAAGATGAGGAAGCGGTG-3‟, Reverse 5‟-CCACGCTTCT-
GTTCTGCCTTGAC-3‟; Kdm4b - Forward 5‟-GGGACTTCAACAGATATGTGG-
CGT-3‟, Reverse 5‟-GCCAGGCAAACGTGGTCTTCCA-3‟; Rarg - Forward 5‟-
CCCGACAGCTATGAACTGAGTCC-3‟, Reverse 5‟-AGGCAGATAGCACTAAGT-
AGCCCA-3‟; Pdgfra - Forward 5‟-GGAGAAACGATCGTGGTGACCTG-3‟,
Reverse 5‟-CCTGACTCTTCTGTACATCAGTGG-3‟; Dkk3 - Forward 5‟-CCTCC-
CAACTATCACAATGAGACC-3‟, Reverse 5‟-GGTGATGAGATCCAGCAGCTGG-
3‟; Gapdh - Forward 5‟-CCTTCATTGACCTCAACTAC-3‟, Reverse 5‟-
GGAAGGCCATGCCAGTGAGC-3‟.
ChIP-PCR Analysis
For ChIP-PCR experiments, ChIP DNA was isolated as described above. Whole
cell extract DNA was taken from precleared lysates prior to addition of antibody-
27
bound beads. PCR conditions for ChIP-PCR were as follows: 94˚C for 5 min; 33
cycles of 94˚C for 1 min, 56˚C for 1 min, and 72˚C for 3 min; 72˚C for 10 min.
PCR reactions were carried out using AmpliTaq Gold 360 DNA Polymerase
(Applied Biosystems) according to the manufacturer‟s protocol. Fgfr2 ChIP
primers are as follows: Forward 5‟-GCGGACTCTCATCTCAACACTG-3‟,
Reverse 5‟-CCTGCCAGC-GATCATCATAAGC-3‟.
Immunofluorescence
Immunofluorescent C2C12 and mesenchymal stem cell staining was generally
performed 2 days post-retroviral (pOZ vectors) or lentiviral infections (shRNA),
following standard protocols. Cells plated on gelatin (C2C12 and hMSCs)- or
collagen (SYO-1)- coated cover slips were fixed in 3% para-formaldehyde,
blocked with 3% goat serum and incubated with the designated primary
antibodies for 2 hours at room temperatures and 30 minutes with the appropriate
secondary antibodies (Alexa-Fluor, Invitrogen).1x PBS solution was used for all
washes. The Zeiss Axioplan2 fluorescent microscope was used for imaging.
Human bone marrow-derived mesenchymal stem cells and differentiation assays
Adipogenic and osteogenic differentiation assays in the hMSCs were conducted
according to the Protocol for Expansion of Human MSCs provided by the Institute
for Regenerative Medicine at Scott and White Hospital (TAMHSCCOM). Oil-Red-
O staining was performed as previously described in (Feldman and Dapson,
1974). The Alkaline Phosphatase kit from Sigma was used for osteogenic
28
staining. Alizarin Red method was provided by the Institute for Regenerative
Medicine at Scott and White Hospital (TAMHSCCOM).
Growth inhibition sulforhodamine B (SRB) assay
Two days after lentiviral FGFR2-shRNA infection, SYO-1 cells were seeded in
96-well plates at 2x10⁴/well and allowed to grow for two additional days. Or, one
day after seeding the SYO-1 cells as described above, PD173074 was added for
a 48 hour-duration. After the indicated times in both experiments, the cells were
fixed with 10%TCA and stained with SRB to measure protein density at 488 nm
excitation and 585 nm emission wavelengths following established protocols
(Vichai and Kirtikara, 2006).
SYT-SSX2 SiRNA
For SYT-SSX2 depletion in SYO-1 cells, one control (INV) and two SSX2-specific
(Si-SSX2A and Si-SSX2B) RNA duplexes were used. Successful depletion with
INV, Si-SSX2A (Pretto et al., 2006), and Si-SSX2B (Lubieniecka et al., 2008)
was previously reported. siLentFect reagent (BioRAD, Hercules, CA) was used
for transfections performed according to company protocols. Protein levels in
cellular lysates and NEF-positivity were quantitated 3 days after siRNA addition.
FGFR2 ShRNA
Lentiviral human FGFR2-specific ShRNA bacterial stocks were purchased from
Sigma (NM_000141). The vector that failed to target FGFR2 (2910) was used as
29
a negative control. It contained the following oliogomer: 5‟-CCGGGCCAACCT-
CTCGAACAGTATTCTCGAGAATACTGTTCGAGAGGTTGGCTTTTT-3‟. Two
lentiviral vectors allowed FGFR2 depletion (clones 833 and 703). They contained
the following targeting sequences: ShRNA 833: 5‟-CCGGCCCAACAATAGGAC-
AGTGCTTCTCGAGAAGCACTGTCCTATTGTTGGGTTTTT-3‟ and ShRNA 703:
5‟-CCGGGCCACCAACCAAATACCAAATCTCGAGATTTGGTATTTGGTTGG-
TGGCTTTTT-3‟. The ShRNA lentiviruses were produced in 293T cells as
previously described (Brown et al., 2009). 20 µg of lentiviral DNA were used to
transfect one 100mm plate of 293T cells. 48 hours post-transfection, the viruses
were harvested and used to infect hMSCs and SYO-1 cells for a 6-hour duration
with added polybrene. The hMSCs were routinely infected with the FGFR2-
shRNA vectors 24 hours after prior transduction with the pOZ and pOZ-SYT-
SSX2 retroviral vectors. Effects of shRNAs on FGFR2 levels and NEF
expression in hMSCs and SYO-1 cells were measured 2 days and 3 days post-
lentiviral infection, respectively.
Generation of bacterial expression plasmids
The bacterial expression plasmids pLM302 and pLM302-yTAF12 were kind gifts
from P.A. Weil. Human Ring1b, mouse Bmi1, and human SYT-SSX2 were PCR
amplified with the following primers:
Ring1b-forward 5‟-GCGCGGATCCTCTCAGGCTGTGCAGACAAAC-3‟, Ring1b-
reverse 5‟-GCGCCTCGAGTCATTTGTGCTCCTTTGTAGGTG; Bmi1-forward 5‟-
GCGCGGATCCCATCGAACAACCAGAATCAAGATC-3‟, Bmi1-reverse 5‟-
30
GCGCCTCGAGCTAACCAGATGCCGTTGCTGATGACC-3‟; SYTSSX2-forward
5‟-GCGCGAATTCGTCTGTGGCTTTCGCGGCCCC-3‟, SYTSSX2-reverse 5‟-
GCGCCTCGAGTTACTCGTCATCTTCCTCAGGGTCGC-3‟. Amplified fragments
were digested with BamH1 and Xho1 (Ring1b and Bmi1) or EcoR1 and Xho1
(SYT-SSX2), gel purified, and ligated into pLM302. Ligation products were
transformed into E.coli DH5 and plated on kanamycin-containing (50 µg/mL)
selection plates. Colonies were screened for the presence of the appropriate
insert and then sequenced.
2PY-Bmi1 immunoprecipitation and -phosphatase assay
MG132- or DMSO-treated C2C12 cells expressing 2PY-Bmi1 were lysed in 20
mM Tris pH 8.0, 150 mM NaCl, 0.5% NP-40, plus protease and phosphatase
inhibitors for 30 minutes at 4˚C with rotation. Cellular debris was pelleted by
centrifugation (13k rpm, 4˚C, 15 minutes), and the supernatant was collected. 1
µL Glu-Glu antibody was added to each supernatant and rotated for 2h at 4˚C,
and antibody-bound proteins were captured with rabbit antiserum to mouse IgG
(whole molecule, Cappel) for 0.5h at 4˚C then protein A sepharose (GE
Healthcare Bio-sciences, Piscataway, NJ) for 0.5h at 4˚C. Beads were washed
twice with lysis buffer lacking inhibitors then once with lysis buffer plus protease
inhibitors. Wash buffer was aspirated and the samples were stored on ice during
-phosphatase preparation. Reaction buffer was prepared in separate tubes
according to the manufacturer‟s protocol (NEB, Ipswich, MA) plus 10 µL/mL
aprotinin and 10 µL/mL leupeptin with and without 5 mM NaF and 10 mM NaOV.
31
500 U phosphatase were added to each tube containing reaction buffer and
activated by incubation at 30˚C for 2 minutes. Enzyme-reaction mixture was
added to the immunoprecipitated material and incubated at 30˚C for 2h with
intermittent mixing. Reactions were quenched by the addition of 2x sample buffer
and stored at -20˚C. Samples were analyzed by SDS-PAGE without boiling to
prevent the dissociation of the antibody chains.
Purification of bacterially-expressed Ring1b, Bmi1, and SYT-SSX2
Expression vectors were transformed into Rosetta 2(DE3)pLysS competent
E.coli (Novagen, Rockland, MA) according to the manufacturer‟s protocol and
grown on kanamycin/chloramphenicol (50 ug/mL kanamycin, 34 ug/mL
chloramphenicol) selection plates. All subsequent growth and induction steps
were performed at 25˚C. Single colonies were inoculated in LB containing
antibiotics and grown overnight. For Bmi1 and Ring1b, overnight cultures were
diluted 1:20 into fresh LB, grown for 2 hours then induced with 0.5 mM IPTG for 4
hours. For SYT-SSX2, 1:20 dilution of overnight cultures was grown for 4h then
induced with 0.1 mM IPTG overnight. After induction, bacteria were pelleted and
resuspended in buffer (20 mM Tris 7.5, 150 mM NaCl or 300 mM NaCl for Bmi1).
Bacteria were treated with lysozyme (0.75 mg/mL) for 20 minutes on ice,
subjected to 2 freeze/thaw cycles, then centrifuged for 1 hour at 12k rpm at 4˚C.
Glycerol was added to the supernatants to a final concentration of 10% (v/v), and
the crude extracts were snap frozen in a dry ice/ethanol bath and stored at -80˚C.
Amylose resin (NEB) was washed with bacterial resuspension buffer, and crude
32
extracts were added to pre-washed resin. Proteins were allowed to bind for 30
minutes at 4˚C with rotation and eluted using 10 mM maltose added to
resuspension buffer. An aliquot of eluate was reserved to measure protein
concentration before the addition of glycerol (10% v/v final concentration), snap
freezing, and storage at -80˚C.
Nucleosome isolation
Nucleosomes were prepared as described by Hernández-Muñoz et al, 2005.
C2C12 or HeLa cells were washed 3 times with 1x PBS then harvested and
pelleted at 2k rpm, 4˚C for 10 minutes. Cells were resuspended in 2 packed cell
volumes of buffer containing 10 mM HEPES pH 7.9, 1.5 mM MgCl2, 10 mM KCl,
0.5 mM DTT and incubated on ice for 10 minutes. Cell suspensions were
transferred to a Dounce homogenizer and lysed with 10 strokes using a loose
pestle. The cell lysates were then centrifuged for 5 minutes at 2.8k rpm (750 x g),
4˚C. Pellets were resuspended in buffer containing 50 mM Tris pH 7.5, 0.34 M
sucrose, 3 mM CaCl2, 60 mM KCl, 0.5 mM PMSF, 0.4 mM benzamidine, 10 µM
leupeptin, and 1 µg/mL aprotinin. The DNA was digested using micrococcal
nuclease (NEB; 325 U/mL lysate) at 37˚C for 10 minutes, and the reaction was
quenched by adding EGTA to a final concentration of 0.05 mM. The extracts
were further lysed by Dounce homogenization (100 strokes, tight pestle) followed
by the addition of 500 mM NaCl (final concentration). Cellular debris was pelleted
(12.1k rpm [14k x g], 4˚C, 20 minutes), and the supernatant was dialyzed
overnight against 20 mM HEPES pH 7.5, 2 mM EDTA, 2 mM EGTA, 650 mM

33
NaCl, 1 mM -mercaptoethanol, 0.5 mM PMSF, 2 mM benzamidine, and 16 mM
-glycerophosphate. 2x sample buffer was added to an aliquot of nucleosome
extract and analyzed by western blotting for the presence of H2A, H2B, H3, and
H4. To check DNA digestion, nucleosome extracts were diluted to 150 mM NaCl,
20 mM HEPES pH 7.5, 2 mM EDTA, and 2 mM EGTA. 20µg proteinase K was
added, and the extracts were incubated overnight at 55˚C. The next day, the
DNA was purified by phenol:chloroform extraction and precipitated overnight with
ethanol (200 mM NaCl and 1µg glycogen were added to facilitate precipitation) at
-80˚C. The DNA was pelleted, washed with 70% ethanol, and air dried before
resuspension in TE and analysis by gel electrophoresis.
Preparation of nuclear extracts
Naïve, pOZ-, or SYT-SSX2-expressing C2C12 cells were washed 3 times with
and harvested in 1x PBS (48 hours post-infection for pOZ and SYT-SSX2
samples). Cells were collected by pulse-spinning and washed once with
hypotonic buffer (10 mM HEPES pH 7.9, 1.5 mM MgCl2, 10 mM KCl, 0.5 mM
DTT). The cells were then incubated in 2 packed cell volumes of hypotonic buffer
for 10 minutes on ice. Cells were lysed by the addition of 2 µL 5% NP-40 and
gentle mixing 5 times by pipet. Nuclei were pelleted by pulse-spinning then lysed
in buffer containing 2 0mM Tris pH 8.0, 300 mM NaCl, 0.5% NP-40, 10%
glycerol, and protease/phosphatase inhibitors for 20 minutes at 4˚C with rotation.
Nuclear debris was pelleted by centrifugation (13k rpm, 15 minutes, 4˚C), and
supernatants were flash frozen and stored at -80˚C.
34
In vitro ubiquitylation assay
Ubiquitylation assays were performed as described previously (Cao et al., 2005)
with some modification. Bacterially purified Ring1b and Bmi1 were added
individually or in complex (equimolar amounts of Ring1b and Bmi1 were
incubated together on ice for 10-15 minutes) to an ubiquitylation reaction mixture
containing 50 mM Tris pH 7.9, 5 mM MgCl2, 2 mM NaF, 0.6 mM DTT, 2 mM ATP,
10 µM okadaic acid, 0.1 µg recombinant human ubiquitin-activating enzyme (E1,
Calbiochem, La Jolla, CA), 0.6 µg recombinant human UbcH5c (E2,
Calbiochem), and 1 µg FLAG-ubiquitin (Sigma, St. Louis, MO). Bacterially
purified SYT-SSX2, pOZ- or SYT-SSX2-expressing cell nuclear extracts, and/or
5 µg of HeLa nucleosomes were added as indicated. Reactions were incubated
for 1 hour at 37˚C and stopped by the addition of 2x sample buffer.
Computer analyses
Data accessibility
All microarray and ChIPSeq data are available at the Gene Expression Omnibus
(available at www.ncbi.nlm.nih.gov/geo/; Edgar et al., 2002) accessions
GSE26562 (C2C12 microarray), GSE26563 (hMSC microarray, GSE26564
(SYT-SSX2 ChIPSeq), and GSE26565 (accession for all datasets).
35
Analysis of SYT-SSX2 ChIPSeq
The Illumina Analysis Pipeline was used for image analysis and base calling.
Sequence reads from the control IgG ChIP and SYT-SSX2 ChIP were aligned to
the mouse genome using Bowtie (Langmead et al., 2009) utilizing the “--best”
option to generate SAM files for each condition. The output SAM files were used
as the input for the Model-based Analysis of ChIPSeq (MACS) program (Zhang
et al., 2008) to determine peak regions in SYT-SSX2-expressing cells using
default parameters except “--mfold” was 16. For each peak, the distance to the
nearest gene was calculated based on the position of the 5‟ end of the peak and
transcription start sites annotated in the UCSC Genome Browser (July 2007,
build mm9) (Kent et al., 2002; Fujita et al., 2010).
Cross-validation of C2C12 Microarray with ChIPSeq
Distances to the nearest upstream and downstream peaks were determined for
each significantly upregulated gene of the C2C12 microarray. Distances were
determined by calculating the average distance between the transcription start
site annotated for the given RefSeq accession (Pruitt et al., 2007) and the
nearest peak summit.
Motif Analysis
ChIPSeq peaks within 10kb upstream of transcription start sites of upregulated
genes were utilized for motif analysis. Repeat elements were masked using the
DUST program (Morgulis et al., 2006) prior to motif search analysis using MEME
36
using default parameters (Bailey and Elkan, 1994). The position-specific
probability matrix derived from MEME was used as input for the TOMTOM
program (used with default parameters) to determine potential transcription factor
binding sites within the motifs (Gupta et al., 2007).
Overlap of SYT-SSX2 with histone modifications, DNA methylation, and PolII in
C2C12 cells
Previously published ChIPSeq datasets for ubiquitylated histone H2B (H2BUb);
mono-, di-, and trimethylated histone H3 lysine 4 (H3K4me1/2/3); acetylated
histone H3 lysine 9 (H3K9Ac), lysine 18 (H3K18Ac), and histone H4 lysine 12
(H4K12Ac); trimethylated histone H3 lysine 27 (H3K27me3) and lysine 36
(H3K36me3); and RNA polymerase II (PolII) were downloaded from the Gene
Expression Omnibus (GEO) accession GSE25308 (Asp et al., 2011). MeDIP-
ChIP data were obtained from GEO accession GSE22077 (Hupkes et al., 2011).
Overlapping regions between individual datasets and SYT-SSX2 were
determined using the Coverage and Intersect tools from the Galaxy program
(available at http://main.g2.bx.psu.edu/) (Giardine et al., 2005; Goecks et al.,
2010; Blankenberg et al., 2010).
Association of SYT-SSX2 ChIPSeq peaks with gene expression
SYT-SSX2 peaks were annotated to the nearest downstream gene on both
strands by measuring the distance from the 5‟ end of the peak to the gene
37
transcription start site (TSS). Peaks associated with differentially expressed
genes were identified.
Hierarchical clustering
Differentially regulated genes containing overlapping sites between SYT-SSX2
and specific epigenetic markers within the gene and up to 50kb upstream of the
TSS were used in the clustering analysis. For each gene, coverage ratios (the
number of bases covered by overlapping regions divided by the total number of
bases in a given window) for the gene body and for 5kb bins upstream of the
TSS (up to 50kb) were calculated for each epigenetic marker. These coverage
ratios served as the input data for the clustering analysis. Hierarchical clustering
was performed separately for up- and downregulated genes using Cluster 3.0 (de
Hoon et al., 2004) with gene and array clustering. The similarity metric used was
Spearman Rank Correlation, and the clustering method used was centroid
linkage. The output file was uploaded to Java Treeview (Saldanha, 2004) for
visualization. Heat map images were downloaded from Java Treeview.
38
CHAPTER III
REPROGRAMMING OF MESENCHYMAL STEM CELLS BY SYT-SSX2
Introduction
SS tumors display a wide spectrum of phenotypes including
characteristics of neural, mesenchymal, and epithelial differentiation (Ladanyi,
2001; Ishibe et al., 2008; Naka et al., 2010). SS tumor cell lines exhibit limited
differentiation potential implying a stem cell origin for this malignancy (Ishibe et
al., 2008; Naka et al., 2010). One study revealed that SYT-SSX silencing in SS
cells permits their differentiation into multiple mesenchymal lineages, while
another group was able to show neuronal differentiation after treatment with
FGF2 or ATRA (all-trans retinoic acid), supporting the hypothesis that SS arises
in human multipotent stem cells (Naka et al., 2010, Ishibe et al., 2008).
Deregulation of normal differentiation driven by SYT-SSX is therefore believed to
be the basis for transformation that leads to cancer development (Naka et al.,
2010). However, it remains to be determined how SYT-SSX expression affects
the differentiation of normal somatic stem cells. Another interesting facet to this
issue is the question of whether SYT-SSX itself confers plasticity on its target cell
or if the plasticity of the tumor cells is solely a reflection of multipotency in the
cell-of-origin. Elucidating the nuances of this topic will be crucial in developing
effective therapies for SS with minimal repercussions to normal tissues.
39
Recent efforts have focused on determining the cell-of-origin for SS since
it is still unclear what cell type is involved the formation of SS tumors.
Distinguishing these target cells is of particular interest since knowledge of their
identity may lead to the development of more effective therapies. It is generally
believed that SS arises from a mesenchymal stem or progenitor cell (Mackall et
al., 2004); however, investigations into the ability of SS tumor cells to differentiate
into multiple lineages have confounded this issue (Naka et al., 2010; Ishibe et al.,
2008). Tumors display increased expression of genes associated with neural
functions like axon growth and signaling suggesting that SS is derived from
neural crest cells. The disparate sites of tumor growth also imply that the
originating cell may be of neural crest lineage. Treatment of cell lines with ATRA
or FGF2 leads to neuronal differentiation adding additional support to this
hypothesis (Ishibe et al., 2008). In contrast, tumor cell lines express osteogenic,
chondrogenic, adipocytic, and hematopoietic markers, and knock-down of the
oncogene causes the expression of additional mesenchymal and hematopoietic
markers and the adoption of a morphology resembling that of MSCs. Moreover,
these cells could also be induced to differentiate into mesenchymal lineages and
macrophage-like cells with the efficiency of differentiation increasing after knock-
down of SYT-SSX1. These results implicate the transformation of a multipotent
stem cell with both mesenchymal and hematopoietic potential (Naka et al., 2010).
While tissue-specific stem cells with this spectrum of differentiated lineages have
not been discovered, neural crest-derived stem cells have the capacity to
differentiate into mesenchymal lineages, and MSCs can be induced to form

40
neurons indicating that these cell populations are capable of forming cell-types
outside of their normal lineages (Shakhova and Sommer, 2010; Chen et al.,
2006).
41
Results
SYT-SSX2 expression deregulates developmental programs and differentiation
in myoblasts
SYT-SSX expression is sufficient to drive tumorigenesis (Nagai et al.,
2001; Haldar et al., 2007) and previous studies show that SYT-SSX fusions
might alter the differentiation potential of synovial sarcoma cells (Naka et al.,
2010; Ishibe et al., 2008). What has been lacking, however, is a thorough
analysis of the initial changes that occur in the mesenchymal precursor cell when
SYT-SSX is expressed. We chose to conduct such analysis in C2C12 myoblasts
because they are a well-characterized, untransformed system of mesenchymal
lineage capable of differentiation into multiple cell types (Odelberg et al., 2000).
Additionally, in a transgenic synovial sarcoma model, SYT-SSX2 expression in
muscle progenitors formed tumors that recapitulated the human disease (Haldar
et al., 2007), further indicating that myoblasts are a relevant model system.
After confirming their myogenic identity with a marker profile and myotube
formation (Appendix B Figure B1), we transduced C2C12 myoblasts with HA-
Flag-SYT-SSX2 or vector control to define their genetic programs. The
microarray analysis generated 700 upregulated and over 800 downregulated
genes. Comparison of this data to a microarray of 8 human synovial sarcomas
(Nielsen et al., 2002) identified nearly 100 upregulated genes shared between
SYT-SSX2-myoblasts and human tumors (Appendix B Table B1). Strikingly,
many of these shared genes were lineage determinants (Pth1r, Ngfr, Hoxb5, and
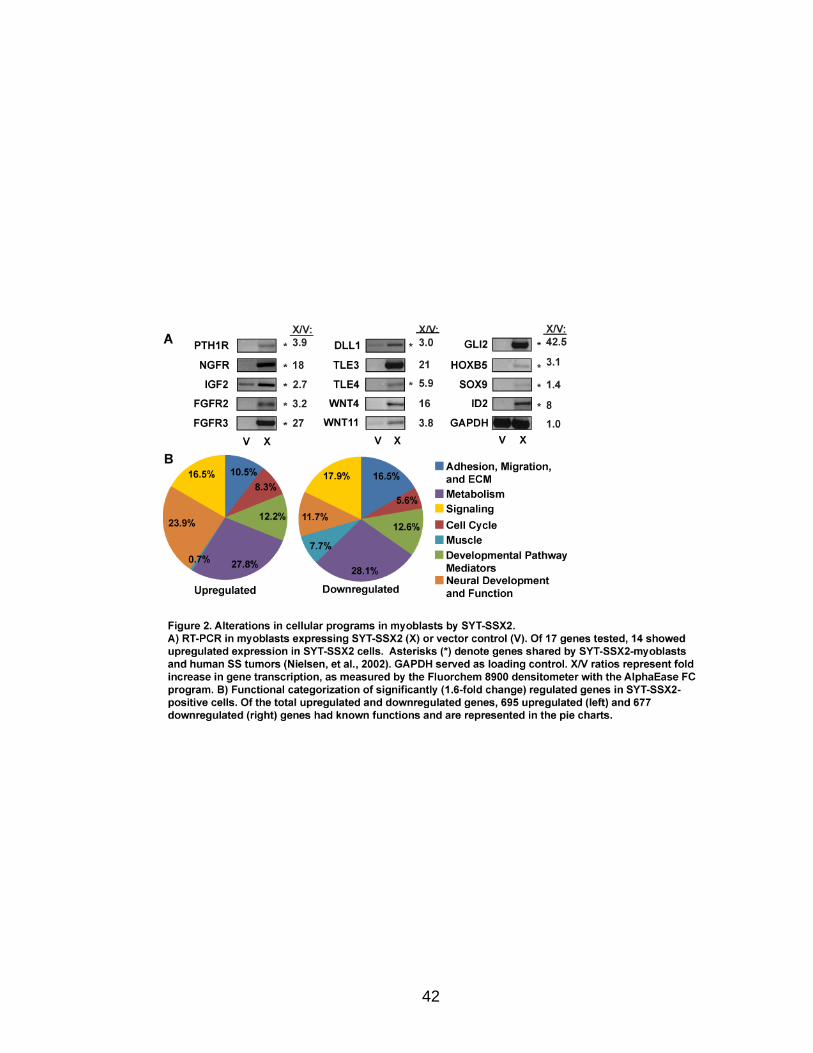
42
43
Sox9) and mediators of developmental pathways such as FGF (Fgfr2 and Fgfr3),
Notch (Dll1), Hedgehog (Gli2), and Wnt (Tle4) (Figure 2A). Their expression was
validated by RT-PCR (Figure 2A, asterisks). Furthermore, upregulation of various
Wnt ligands, (Figure 2A, Wnt4 and Wnt11; Nielsen et al., 2002) in both SYT-
SSX2-myoblasts and human SS tumors reflected a sustained activation of this
pathway.
An overall functional categorization of the upregulated genes revealed 85
(12.2%) to be involved in development (Figure 2B), the majority of which function
in lineage specification (Appendix B Table B2). Similarly, 85 (12.6%) of the
downregulated genes are involved in differentiation and development (Figure
2B). Most striking, however, was the upregulation of 166 genes (23.9%) normally
involved in neural differentiation and function (Figure 2B and Appendix B Table
B3). Notably, we observed a simultaneous downregulation of 52 (7.7%)
myogenic genes (Figure 2B), including terminal differentiation markers (troponin
and muscle-specific myosins) as well as transcriptional controllers of myogenesis
(Myf5, MyoD, and myogenin; Appendix B Table B4 and Figure B2A). These data
suggested a block of myogenic differentiation that was confirmed when SYT-
SSX2-expressing myoblasts failed to form multinucleated myotubes and
continued to grow as mononucleated cells (Appendix B Figure B1). Altogether,
SYT-SSX2 expression in myoblasts led to the abrogation of myogenesis with an
apparent concomitant reprogramming towards neural lineages.
44
Targeting of SYT-SSX2 to chromatin is required for occupancy of neural genes
and induction of the neural phenotype
To identify the specific subset of genes to which the SYT-SSX2 complex is
recruited, we conducted ChIP-Sequencing (ChIPSeq) analysis and determined
the genome-wide occupancy of SYT-SSX2. We used myoblasts transduced with
HA-Flag-SYT-SSX2 due to lack of an appropriate antibody that efficiently
recognizes native SYT-SSX2 epitopes in ChIP experiments. ChIPSeq for SYT-
SSX2 yielded over 19 million unique tags compared with over 16 million unique
tags in the control. Putative SYT-SSX2 target sites were determined by the
Model-based Analysis of ChIPSeq (MACS) program. This analysis validates true
peaks by calculating the significance of each candidate peak relative to the
control using a significance threshold (Zhang et al., 2008). In our study, this
method generated approximately 53,000 peaks with a maximum false discovery
rate of 2.8%. The ChIP peaks were categorized by their distance upstream of
transcription start sites (TSS, +1) and the results are shown in Table 1. On the
whole, the majority of peaks (approximately 60%) are located at distances
greater than 50kb from TSS. Closer to known genes, 20% of the peaks are
located within 20kb upstream of TSS, with over 6000 sites (11.5% of the total
peaks) between 0-10kb (Table 1). 3440 sites are located within 5kb upstream of
TSS corresponding to 1352 genes (Table 1). As an extension of this data, we
also found that SYT-SSX2 bound within a total of 3,290 genes and exclusively
within the body of 821 genes. Given that SYT-SSX2 associates with transcription
regulators, we decided to analyze more closely the genes with SYT-SSX2
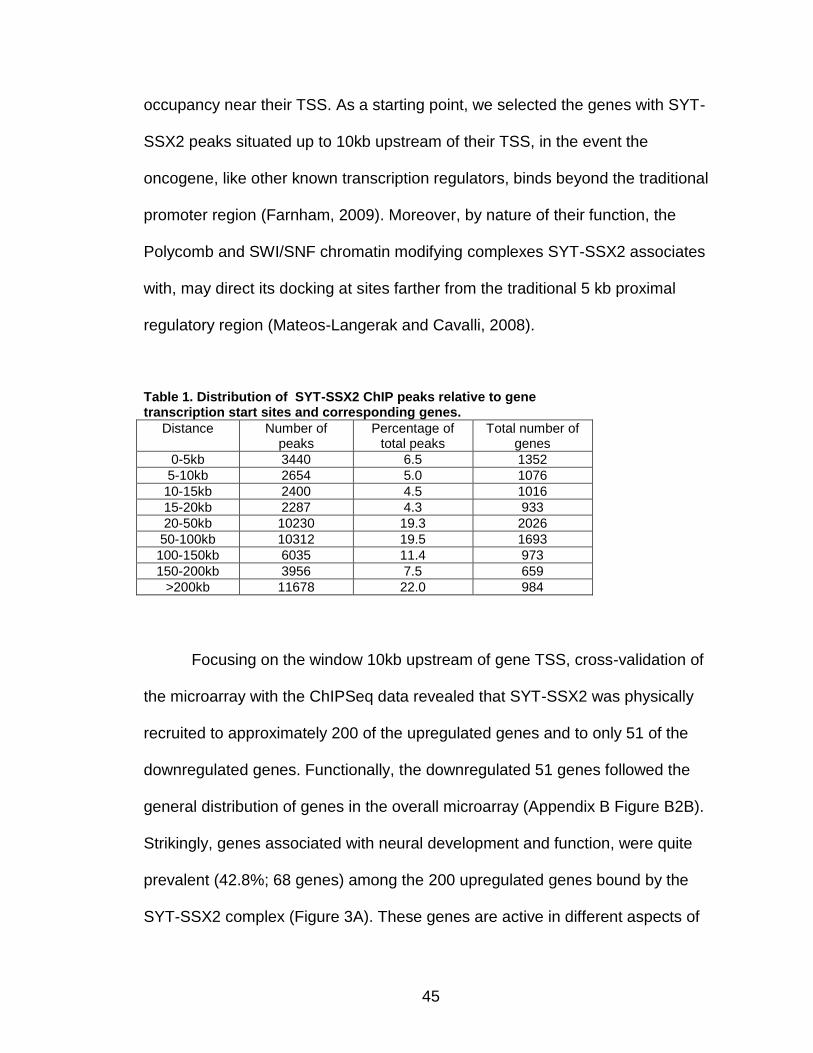
45
occupancy near their TSS. As a starting point, we selected the genes with SYT-
SSX2 peaks situated up to 10kb upstream of their TSS, in the event the
oncogene, like other known transcription regulators, binds beyond the traditional
promoter region (Farnham, 2009). Moreover, by nature of their function, the
Polycomb and SWI/SNF chromatin modifying complexes SYT-SSX2 associates
with, may direct its docking at sites farther from the traditional 5 kb proximal
regulatory region (Mateos-Langerak and Cavalli, 2008).
Table 1. Distribution of SYT-SSX2 ChIP peaks relative to gene transcription start sites and corresponding genes.
Distance Number of peaks
Percentage of total peaks
Total number of genes
0-5kb 3440 6.5 1352
5-10kb 2654 5.0 1076
10-15kb 2400 4.5 1016
15-20kb 2287 4.3 933
20-50kb 10230 19.3 2026
50-100kb 10312 19.5 1693
100-150kb 6035 11.4 973
150-200kb 3956 7.5 659
>200kb 11678 22.0 984
Focusing on the window 10kb upstream of gene TSS, cross-validation of
the microarray with the ChIPSeq data revealed that SYT-SSX2 was physically
recruited to approximately 200 of the upregulated genes and to only 51 of the
downregulated genes. Functionally, the downregulated 51 genes followed the
general distribution of genes in the overall microarray (Appendix B Figure B2B).
Strikingly, genes associated with neural development and function, were quite
prevalent (42.8%; 68 genes) among the 200 upregulated genes bound by the
SYT-SSX2 complex (Figure 3A). These genes are active in different aspects of
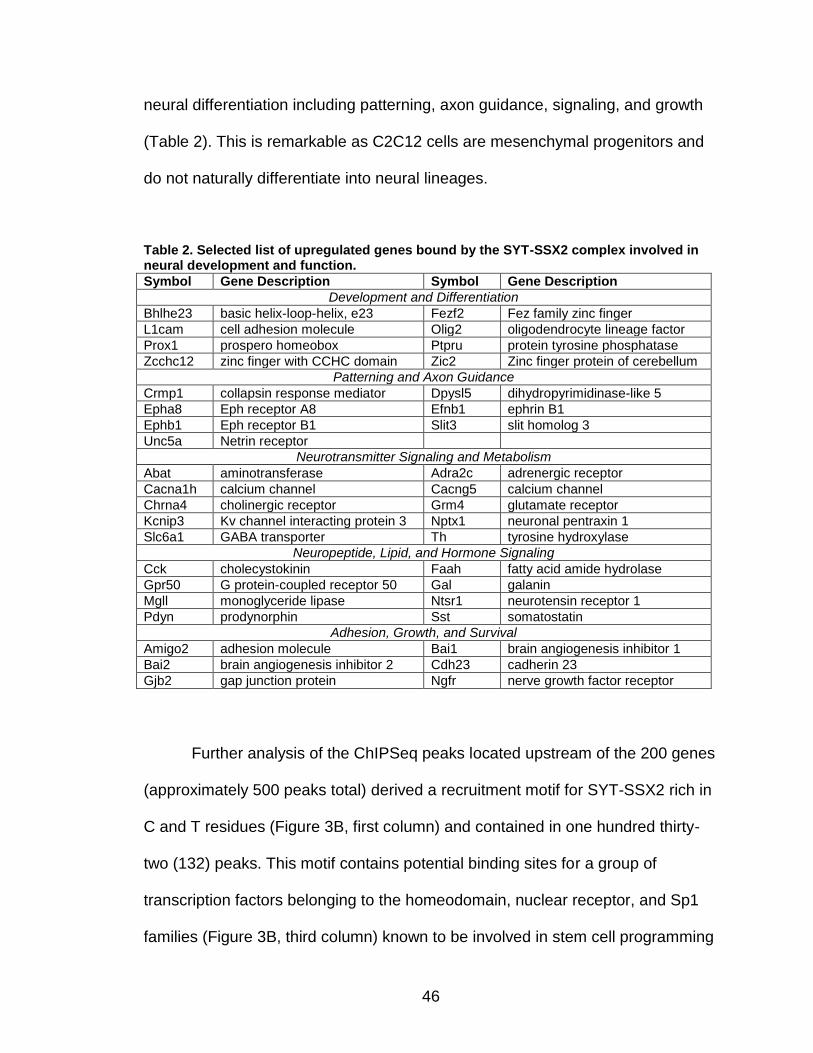
46
neural differentiation including patterning, axon guidance, signaling, and growth
(Table 2). This is remarkable as C2C12 cells are mesenchymal progenitors and
do not naturally differentiate into neural lineages.
Table 2. Selected list of upregulated genes bound by the SYT-SSX2 complex involved in neural development and function.
Symbol Gene Description Symbol Gene Description
Development and Differentiation
Bhlhe23 basic helix-loop-helix, e23 Fezf2 Fez family zinc finger
L1cam cell adhesion molecule Olig2 oligodendrocyte lineage factor
Prox1 prospero homeobox Ptpru protein tyrosine phosphatase
Zcchc12 zinc finger with CCHC domain Zic2 Zinc finger protein of cerebellum
Patterning and Axon Guidance
Crmp1 collapsin response mediator Dpysl5 dihydropyrimidinase-like 5
Epha8 Eph receptor A8 Efnb1 ephrin B1
Ephb1 Eph receptor B1 Slit3 slit homolog 3
Unc5a Netrin receptor
Neurotransmitter Signaling and Metabolism
Abat aminotransferase Adra2c adrenergic receptor
Cacna1h calcium channel Cacng5 calcium channel
Chrna4 cholinergic receptor Grm4 glutamate receptor
Kcnip3 Kv channel interacting protein 3 Nptx1 neuronal pentraxin 1
Slc6a1 GABA transporter Th tyrosine hydroxylase
Neuropeptide, Lipid, and Hormone Signaling
Cck cholecystokinin Faah fatty acid amide hydrolase
Gpr50 G protein-coupled receptor 50 Gal galanin
Mgll monoglyceride lipase Ntsr1 neurotensin receptor 1
Pdyn prodynorphin Sst somatostatin
Adhesion, Growth, and Survival
Amigo2 adhesion molecule Bai1 brain angiogenesis inhibitor 1
Bai2 brain angiogenesis inhibitor 2 Cdh23 cadherin 23
Gjb2 gap junction protein Ngfr nerve growth factor receptor
Further analysis of the ChIPSeq peaks located upstream of the 200 genes
(approximately 500 peaks total) derived a recruitment motif for SYT-SSX2 rich in
C and T residues (Figure 3B, first column) and contained in one hundred thirty-
two (132) peaks. This motif contains potential binding sites for a group of
transcription factors belonging to the homeodomain, nuclear receptor, and Sp1
families (Figure 3B, third column) known to be involved in stem cell programming
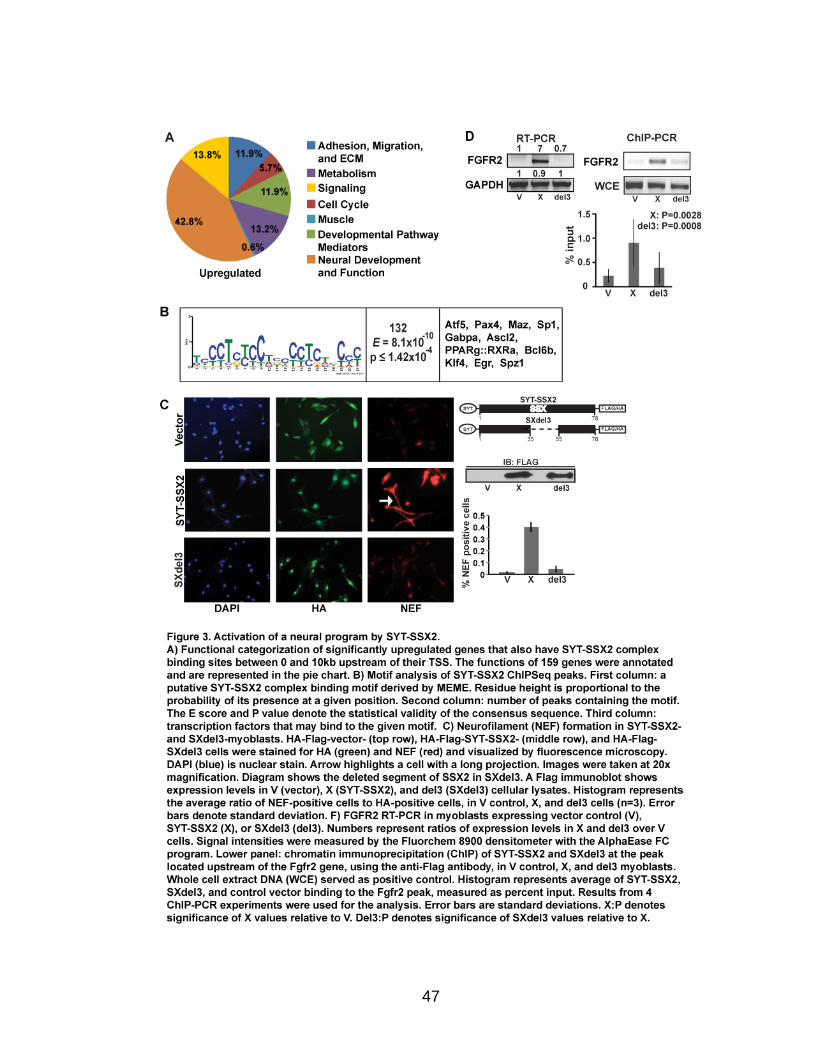
47
48
and differentiation. The extensive association of SYT-SSX2 with neural genes led
us to question if these myoblasts exhibited a matching phenotype. In a
background of 80% to 90% infection efficiency, 40% of SYT-SSX2-myoblasts
expressed neurofilament (NEF, Figure 3C, middle row, right panel and
histogram), while control cells showed minimal (< 2%) neurofilament staining
(Figure 3C, top row, right panel). The empty vector produces a short HA-Flag-
peptide that allows the visualization of positively infected control cells (Figure 3C,
top row, middle panel). Moreover, oncogene-expressing cells exhibited long
projections (Figure 3C, arrow), similar to a phenotype we observed in SYT-
SSX2-expressing fibroblasts (Barco et al., 2007) and consistent with the
neurogenic features noted in synovial sarcoma cells (Ishibe et al., 2008). Overall,
stimulation of a pro-neural program appears to be a pronounced feature of SYT-
SSX2.
Mediators of differentiation including the Wnt, Hedgehog, and FGF
pathways formed an additional 11.9% (19 genes) of the 200 genes occupied by
SYT-SSX2 (Figure 3A; Appendix B Table B2, asterisks). In particular, we noticed
the presence of FGF mediators throughout our analyses. By microarray, a
number of FGF pathway members were upregulated (Appendix B Table B2), and
increased expression of FGF receptors Fgfr2 and Fgfr3 was confirmed by RT-
PCR (Figure 2A). Importantly, the same FGFR2 and FGFR3 were also
upregulated in human synovial sarcomas (Appendix B Table B1; Nielsen et al.,
2002). ChIPSeq analysis indicated that the Fgfr2 gene is directly targeted by
SYT-SSX2, and further ChIP experiments confirmed the presence of SYT-SSX2
49
at the peak located 4.3 kb upstream of the Fgfr2 gene (Figure 3D, ChIP-PCR
panel). Notably, the Fgfr2 peak contains a sequence matching the SYT-SSX2
recruiting motif (Figure 3B). Thus, the FGF receptor appears to be a direct target
of the oncogene.
SYT-SSX2 associates with Polycomb complexes, modulators of chromatin
and lineage determination. To determine whether the ability of SYT-SSX2 to
target chromatin is required for the observed effects, we tested SXdel3, a SYT-
SSX2 mutant with a twenty-residue deletion in its SSX-targeting module (Figure
3C, diagram). SXdel3 is unable to co-localize with Polycomb and antagonize its
Bmi1 component in U2OS cells (Barco et al., 2009). When assayed in C2C12
cells, SXdel3 failed to induce neurofilament formation (Figure 3C, bottom row,
right panel), indicating an inactive neural program. Furthermore, we observed
that the ability of SXdel3 to upregulate FGFR2 expression (Figure 3D, RT-PCR
panel), or bind upstream of the gene (Figure 3D, ChIP-PCR panel and
histogram), was markedly diminished. To summarize, these studies demonstrate
that SYT-SSX2 activates a pro-neural program and blocks normal myogenesis.
Its ability to bind chromatin is required for its transcriptional and phenotypic
effects.
SYT-SSX2 causes aberrant differentiation in human mesenchymal stem cells
Myoblast reprogramming by SYT-SSX2 prompted us to question whether
dictating lineage commitment in undifferentiated precursors is an intrinsic feature
of the oncogene. As synovial sarcoma is thought to arise in a mesenchymal stem
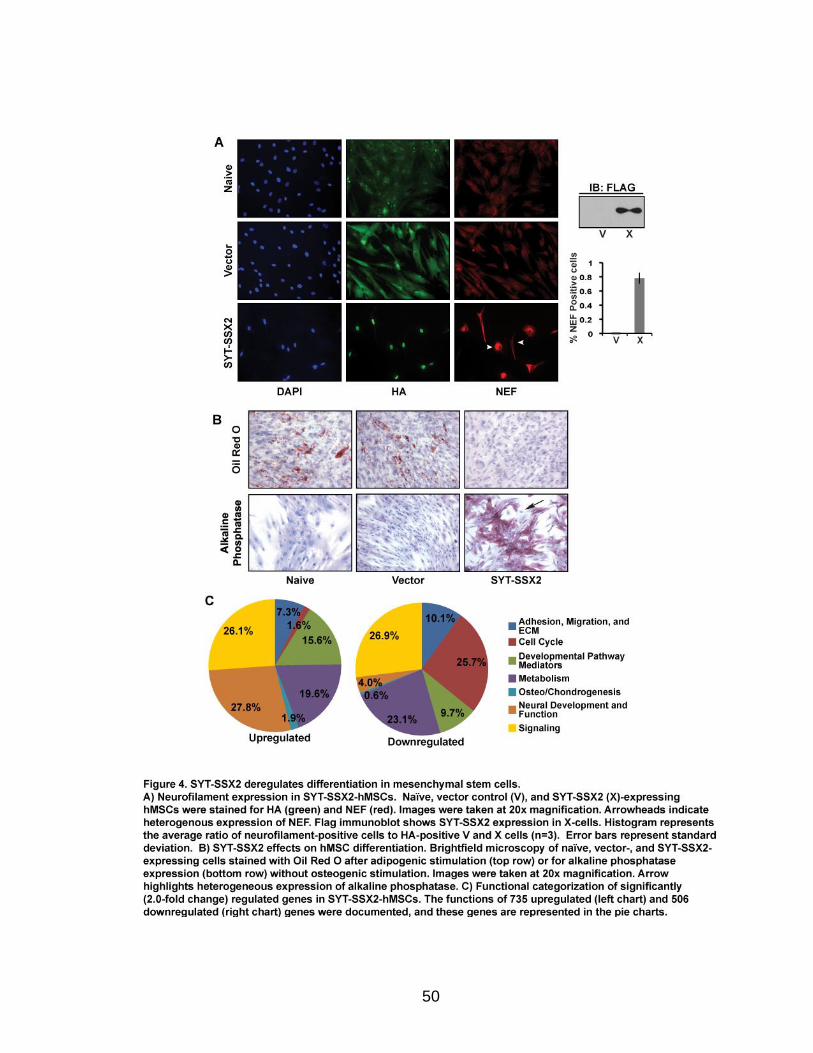
50

51
cell (Naka et al., 2010; Mackall et al., 2004), we questioned whether SYT-SSX2
expression could elicit similar effects in multipotent, human bone marrow-derived
mesenchymal stem cells (hMSCs; Colter et al., 2001; Sekiya et al., 2002;
Appendix B Figure B3). Searching for a neural phenotype in SYT-SSX2-hMSCs,
we observed a robust and heterogeneous NEF expression in a significant
population (Figure 4A, bottom row, right panel and arrowheads). Neither naïve
nor vector-hMSCs produced neurofilaments (Figure 4A, top and middle rows,
right panels).
We next asked whether SYT-SSX2 influenced the ability of hMSCs to
differentiate into their normal lineages. We discovered that oncogene expression
caused a marked inhibition of adipogenesis, while naïve and vector-expressing
cells differentiated normally (Figure 4B, top row). In contrast, SYT-SSX2
expression accelerated osteogenesis as evidenced by an intense alkaline
phosphatase staining 48 hours post-infection without added osteogenic factors
(Figure 4B, bottom row, right panel). As expected, in the absence of inducing
factors, naïve and vector-expressing hMSCs showed minimal alkaline
phosphatase staining, (Figure 4B, bottom row, left and middle panels). Alkaline
phosphatase positivity was heterogeneous (Figure 4B, arrow), indicating that the
early osteogenesis was activated at varying degrees across the cell population.
Inhibition of adipogenesis and acceleration of osteogenesis by SYT-SSX2 were
observed in two additional hMSCs lines, one human (Appendix B Figure B4), and
one murine (Alfaro et al., 2008; data not shown). Altogether, these data suggest
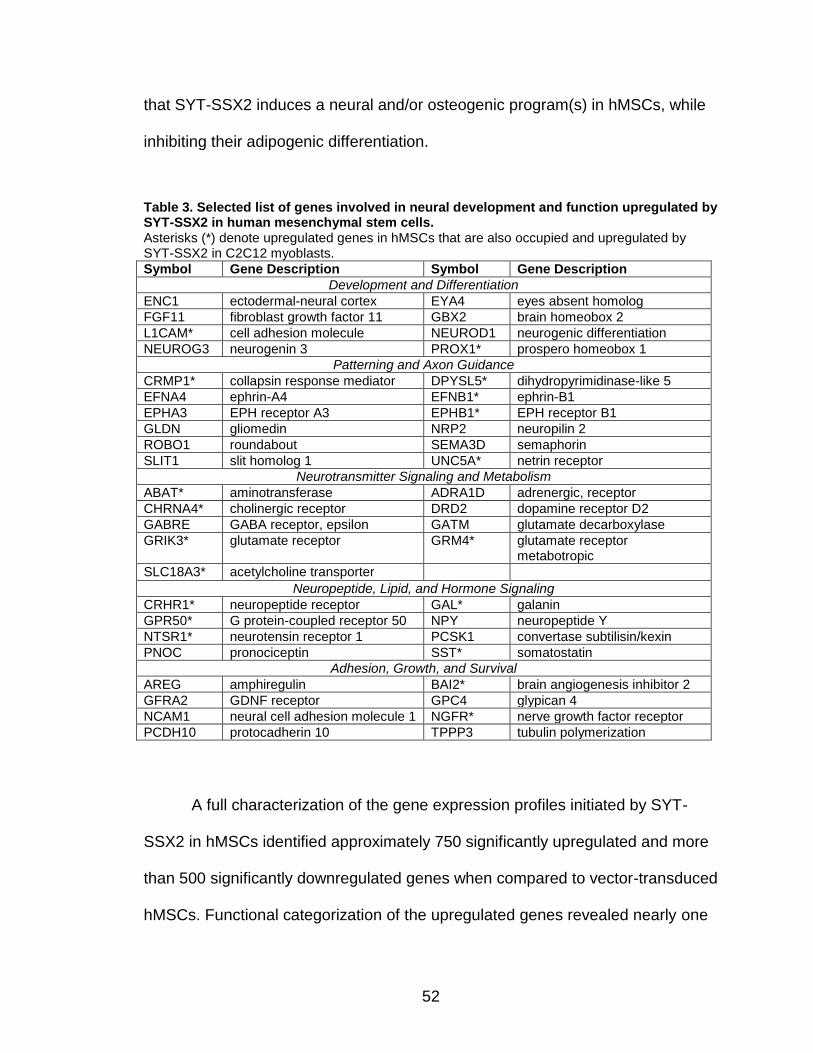
52
that SYT-SSX2 induces a neural and/or osteogenic program(s) in hMSCs, while
inhibiting their adipogenic differentiation.
Table 3. Selected list of genes involved in neural development and function upregulated by SYT-SSX2 in human mesenchymal stem cells. Asterisks (*) denote upregulated genes in hMSCs that are also occupied and upregulated by SYT-SSX2 in C2C12 myoblasts.
Symbol Gene Description Symbol Gene Description
Development and Differentiation
ENC1 ectodermal-neural cortex EYA4 eyes absent homolog FGF11 fibroblast growth factor 11 GBX2 brain homeobox 2 L1CAM* cell adhesion molecule NEUROD1 neurogenic differentiation NEUROG3 neurogenin 3 PROX1* prospero homeobox 1
Patterning and Axon Guidance CRMP1* collapsin response mediator DPYSL5* dihydropyrimidinase-like 5 EFNA4 ephrin-A4 EFNB1* ephrin-B1 EPHA3 EPH receptor A3 EPHB1* EPH receptor B1 GLDN gliomedin NRP2 neuropilin 2
ROBO1 roundabout SEMA3D semaphorin SLIT1 slit homolog 1 UNC5A* netrin receptor
Neurotransmitter Signaling and Metabolism ABAT* aminotransferase ADRA1D adrenergic, receptor CHRNA4* cholinergic receptor DRD2 dopamine receptor D2
GABRE GABA receptor, epsilon GATM glutamate decarboxylase
GRIK3* glutamate receptor GRM4* glutamate receptor metabotropic
SLC18A3* acetylcholine transporter Neuropeptide, Lipid, and Hormone Signaling
CRHR1* neuropeptide receptor GAL* galanin
GPR50* G protein-coupled receptor 50 NPY neuropeptide Y NTSR1* neurotensin receptor 1 PCSK1 convertase subtilisin/kexin PNOC pronociceptin SST* somatostatin
Adhesion, Growth, and Survival
AREG amphiregulin BAI2* brain angiogenesis inhibitor 2 GFRA2 GDNF receptor GPC4 glypican 4 NCAM1 neural cell adhesion molecule 1 NGFR* nerve growth factor receptor
PCDH10 protocadherin 10 TPPP3 tubulin polymerization
A full characterization of the gene expression profiles initiated by SYT-
SSX2 in hMSCs identified approximately 750 significantly upregulated and more
than 500 significantly downregulated genes when compared to vector-transduced
hMSCs. Functional categorization of the upregulated genes revealed nearly one
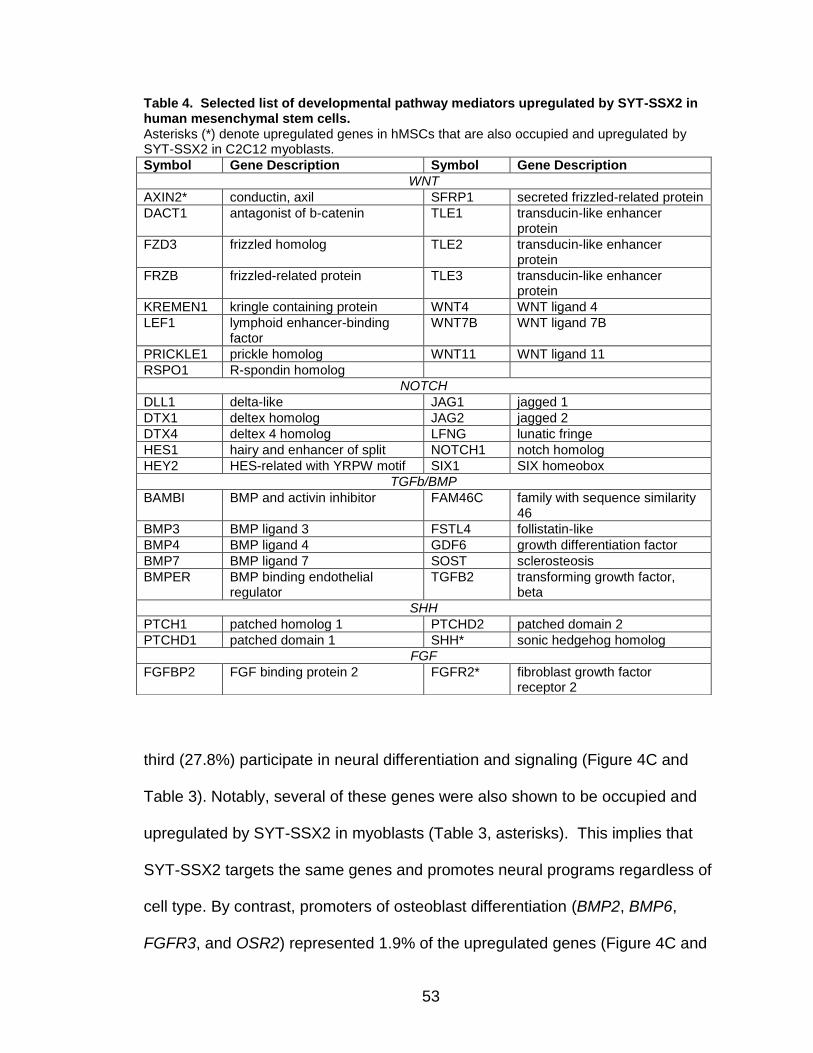
53
Table 4. Selected list of developmental pathway mediators upregulated by SYT-SSX2 in human mesenchymal stem cells. Asterisks (*) denote upregulated genes in hMSCs that are also occupied and upregulated by SYT-SSX2 in C2C12 myoblasts.
third (27.8%) participate in neural differentiation and signaling (Figure 4C and
Table 3). Notably, several of these genes were also shown to be occupied and
upregulated by SYT-SSX2 in myoblasts (Table 3, asterisks). This implies that
SYT-SSX2 targets the same genes and promotes neural programs regardless of
cell type. By contrast, promoters of osteoblast differentiation (BMP2, BMP6,
FGFR3, and OSR2) represented 1.9% of the upregulated genes (Figure 4C and
Symbol Gene Description Symbol Gene Description
WNT
AXIN2* conductin, axil SFRP1 secreted frizzled-related protein
DACT1 antagonist of b-catenin TLE1 transducin-like enhancer protein
FZD3 frizzled homolog TLE2 transducin-like enhancer protein
FRZB frizzled-related protein TLE3 transducin-like enhancer protein
KREMEN1 kringle containing protein WNT4 WNT ligand 4
LEF1 lymphoid enhancer-binding factor
WNT7B WNT ligand 7B
PRICKLE1 prickle homolog WNT11 WNT ligand 11
RSPO1 R-spondin homolog
NOTCH
DLL1 delta-like JAG1 jagged 1
DTX1 deltex homolog JAG2 jagged 2
DTX4 deltex 4 homolog LFNG lunatic fringe
HES1 hairy and enhancer of split NOTCH1 notch homolog
HEY2 HES-related with YRPW motif SIX1 SIX homeobox
TGFb/BMP
BAMBI BMP and activin inhibitor FAM46C family with sequence similarity 46
BMP3 BMP ligand 3 FSTL4 follistatin-like
BMP4 BMP ligand 4 GDF6 growth differentiation factor
BMP7 BMP ligand 7 SOST sclerosteosis
BMPER BMP binding endothelial regulator
TGFB2 transforming growth factor, beta
SHH
PTCH1 patched homolog 1 PTCHD2 patched domain 2
PTCHD1 patched domain 1 SHH* sonic hedgehog homolog
FGF
FGFBP2 FGF binding protein 2 FGFR2* fibroblast growth factor receptor 2
54
Appendix B Table B5). Taken together, these data suggest that SYT-SSX2
indeed activates programs of neural and osteogenic differentiation in hMSCs.
Stem cell controllers such as Wnt, Notch, TGF/BMP, Shh, and FGF
(Figure 4C and Table 4) constituted 16% of the upregulated genes. 3 of these
genes, AXIN2, SHH, and FGFR2, were also upregulated and occupied by SYT-
SSX2 in myoblasts (Table 4, asterisks).
Notably, the C2C12 and the hMSC microarrays overlapped with 248
differentially expressed genes, 85 (34%) of which belonged to the neurogenic
program, and 54 (~22%) were developmental mediators and transcription factors
(Appendix B Table B6).
The role of FGFR2 in SYT-SSX2 differentiation effects
Throughout our analyses Fgfr2 held our interest as it was noticeably
upregulated not only in hMSCs and myoblasts but also in human synovial
sarcoma tumors (Nielsen et al., 2002). Moreover, our ChIPSeq analysis revealed
Fgfr2 as a direct target of SYT-SSX2. Importantly, FGFR2 is a major inducer of
both osteogenesis and neurogenesis during development (Huang et al., 2007;
Villegas et al., 2010) and could be contributing, in part, to the shift in lineage
commitment seen in human MSCs. FGFR2 was, therefore, our prime candidate
for an upstream signaling pathway whose activation would explain induction of
the neural cascade by SYT-SSX2. To assess the contribution of FGFR2 to the
visible effects of SYT-SSX2, we decided to analyze the consequences of its
inhibition in the stem cells. Neurofilament formation and cell growth were both
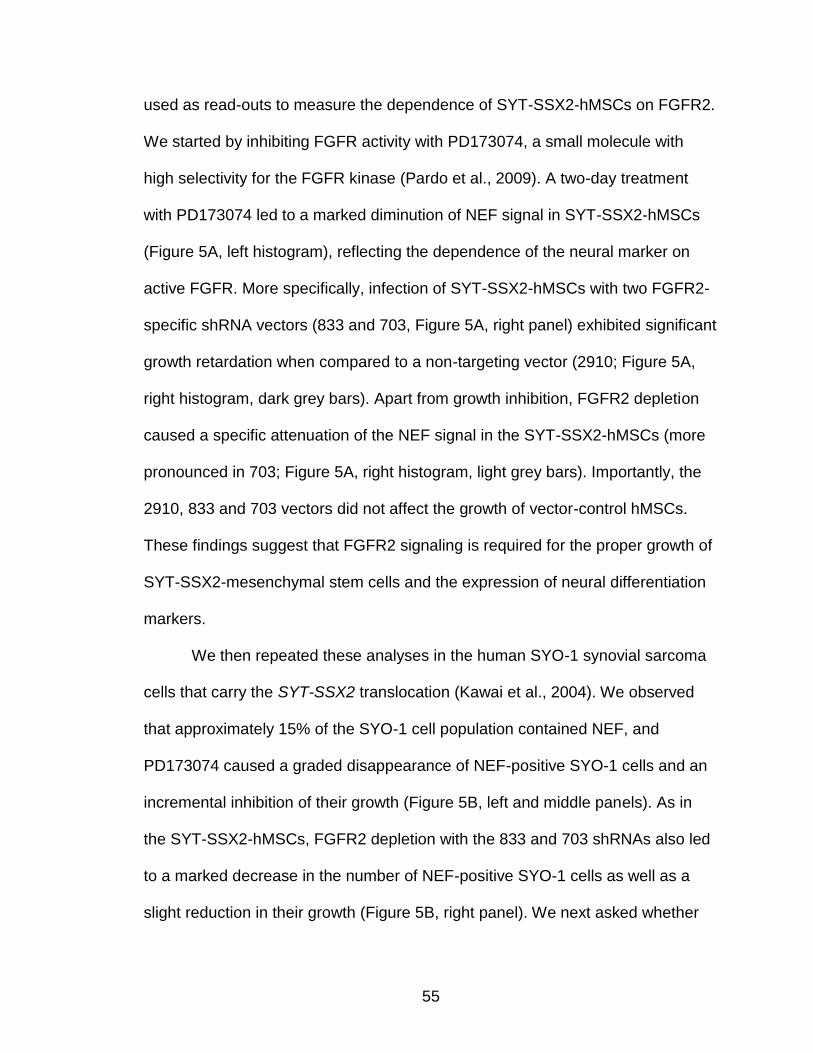
55
used as read-outs to measure the dependence of SYT-SSX2-hMSCs on FGFR2.
We started by inhibiting FGFR activity with PD173074, a small molecule with
high selectivity for the FGFR kinase (Pardo et al., 2009). A two-day treatment
with PD173074 led to a marked diminution of NEF signal in SYT-SSX2-hMSCs
(Figure 5A, left histogram), reflecting the dependence of the neural marker on
active FGFR. More specifically, infection of SYT-SSX2-hMSCs with two FGFR2-
specific shRNA vectors (833 and 703, Figure 5A, right panel) exhibited significant
growth retardation when compared to a non-targeting vector (2910; Figure 5A,
right histogram, dark grey bars). Apart from growth inhibition, FGFR2 depletion
caused a specific attenuation of the NEF signal in the SYT-SSX2-hMSCs (more
pronounced in 703; Figure 5A, right histogram, light grey bars). Importantly, the
2910, 833 and 703 vectors did not affect the growth of vector-control hMSCs.
These findings suggest that FGFR2 signaling is required for the proper growth of
SYT-SSX2-mesenchymal stem cells and the expression of neural differentiation
markers.
We then repeated these analyses in the human SYO-1 synovial sarcoma
cells that carry the SYT-SSX2 translocation (Kawai et al., 2004). We observed
that approximately 15% of the SYO-1 cell population contained NEF, and
PD173074 caused a graded disappearance of NEF-positive SYO-1 cells and an
incremental inhibition of their growth (Figure 5B, left and middle panels). As in
the SYT-SSX2-hMSCs, FGFR2 depletion with the 833 and 703 shRNAs also led
to a marked decrease in the number of NEF-positive SYO-1 cells as well as a
slight reduction in their growth (Figure 5B, right panel). We next asked whether
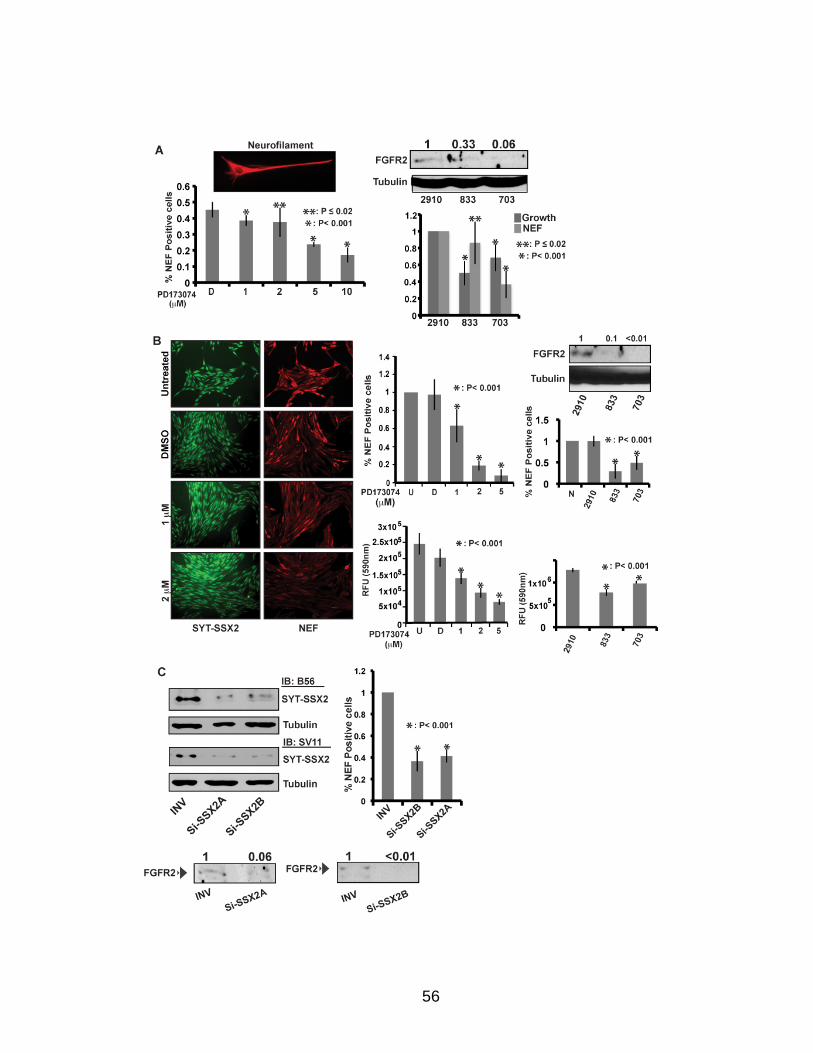
56
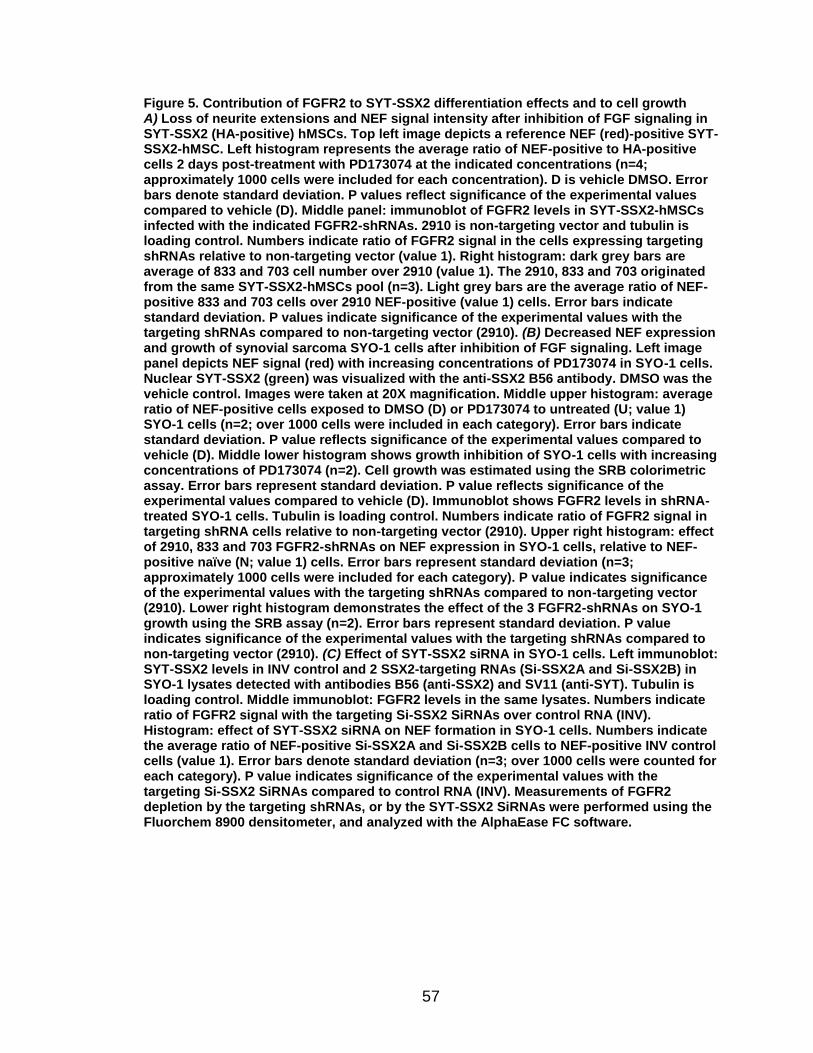
57
Figure 5. Contribution of FGFR2 to SYT-SSX2 differentiation effects and to cell growth A) Loss of neurite extensions and NEF signal intensity after inhibition of FGF signaling in SYT-SSX2 (HA-positive) hMSCs. Top left image depicts a reference NEF (red)-positive SYT-SSX2-hMSC. Left histogram represents the average ratio of NEF-positive to HA-positive cells 2 days post-treatment with PD173074 at the indicated concentrations (n=4; approximately 1000 cells were included for each concentration). D is vehicle DMSO. Error bars denote standard deviation. P values reflect significance of the experimental values compared to vehicle (D). Middle panel: immunoblot of FGFR2 levels in SYT-SSX2-hMSCs infected with the indicated FGFR2-shRNAs. 2910 is non-targeting vector and tubulin is loading control. Numbers indicate ratio of FGFR2 signal in the cells expressing targeting shRNAs relative to non-targeting vector (value 1). Right histogram: dark grey bars are average of 833 and 703 cell number over 2910 (value 1). The 2910, 833 and 703 originated from the same SYT-SSX2-hMSCs pool (n=3). Light grey bars are the average ratio of NEF-positive 833 and 703 cells over 2910 NEF-positive (value 1) cells. Error bars indicate standard deviation. P values indicate significance of the experimental values with the targeting shRNAs compared to non-targeting vector (2910). (B) Decreased NEF expression and growth of synovial sarcoma SYO-1 cells after inhibition of FGF signaling. Left image panel depicts NEF signal (red) with increasing concentrations of PD173074 in SYO-1 cells. Nuclear SYT-SSX2 (green) was visualized with the anti-SSX2 B56 antibody. DMSO was the vehicle control. Images were taken at 20X magnification. Middle upper histogram: average ratio of NEF-positive cells exposed to DMSO (D) or PD173074 to untreated (U; value 1) SYO-1 cells (n=2; over 1000 cells were included in each category). Error bars indicate standard deviation. P value reflects significance of the experimental values compared to vehicle (D). Middle lower histogram shows growth inhibition of SYO-1 cells with increasing concentrations of PD173074 (n=2). Cell growth was estimated using the SRB colorimetric assay. Error bars represent standard deviation. P value reflects significance of the experimental values compared to vehicle (D). Immunoblot shows FGFR2 levels in shRNA-treated SYO-1 cells. Tubulin is loading control. Numbers indicate ratio of FGFR2 signal in targeting shRNA cells relative to non-targeting vector (2910). Upper right histogram: effect of 2910, 833 and 703 FGFR2-shRNAs on NEF expression in SYO-1 cells, relative to NEF-positive naïve (N; value 1) cells. Error bars represent standard deviation (n=3; approximately 1000 cells were included for each category). P value indicates significance of the experimental values with the targeting shRNAs compared to non-targeting vector (2910). Lower right histogram demonstrates the effect of the 3 FGFR2-shRNAs on SYO-1 growth using the SRB assay (n=2). Error bars represent standard deviation. P value indicates significance of the experimental values with the targeting shRNAs compared to non-targeting vector (2910). (C) Effect of SYT-SSX2 siRNA in SYO-1 cells. Left immunoblot: SYT-SSX2 levels in INV control and 2 SSX2-targeting RNAs (Si-SSX2A and Si-SSX2B) in SYO-1 lysates detected with antibodies B56 (anti-SSX2) and SV11 (anti-SYT). Tubulin is loading control. Middle immunoblot: FGFR2 levels in the same lysates. Numbers indicate ratio of FGFR2 signal with the targeting Si-SSX2 SiRNAs over control RNA (INV). Histogram: effect of SYT-SSX2 siRNA on NEF formation in SYO-1 cells. Numbers indicate the average ratio of NEF-positive Si-SSX2A and Si-SSX2B cells to NEF-positive INV control cells (value 1). Error bars denote standard deviation (n=3; over 1000 cells were counted for each category). P value indicates significance of the experimental values with the targeting Si-SSX2 SiRNAs compared to control RNA (INV). Measurements of FGFR2 depletion by the targeting shRNAs, or by the SYT-SSX2 SiRNAs were performed using the Fluorchem 8900 densitometer, and analyzed with the AlphaEase FC software.
58
these events in SYO-1 cells are dependent on SYT-SSX2 expression. We found
that depletion of SYT-SSX2 in SYO-1 cells with specific siRNAs (Figure 5C, left
panel) was accompanied by a concomitant decrease in FGFR2 levels (Figure
5C, lower panels) and a marked decrease in the relative number of NEF-positive
cells (Figure 5C, histogram). We refrained from measuring the effect of SYT-
SSX2 depletion on SYO-1 growth, as the inherent cell toxicity of RNAi assays
would interfere with its accuracy.
In summary, these studies suggest that SYT-SSX2 recruitment to the
Fgfr2 gene results in the activation of FGF signaling, thereby driving the neural
phenotype in hMSCs and affecting their growth. This mechanism appears to be
occurring in the human synovial sarcoma cells as well.

59
Conclusions
The data presented here indicate that the synovial sarcoma oncogene
SYT-SSX2 reprograms mesenchymal stem/progenitor cells by activating a pro-
neural gene network while disrupting normal differentiation. This is most likely
due to the recruitment of SYT-SSX2 to an extensive array of neural genes,
resulting in their activation. This corroborates previous reports in which a neural
phenotype was observed in SYT-SSX-expressing SS cell lines (Ishibe et al.,
2008). Furthermore, knockdown of SYT-SSX in SS cells led to loss of neuronal
features (the present study and Naka et al., 2010).
The upregulation of several mediators representing the central pathways
known to modulate stem cell behavior is another striking result. It uncovers a
propensity of SYT-SSX2 for regulating developmental pathways. This may reflect
an ability of SYT-SSX2 to create an imbalance in the microenvironment of the
cancer cell in vivo, furthering malignancy. We have previously reported that SYT-
SSX2 mediates nuclear translocation and activation of -catenin (Pretto et al.,
2006). Consistent with this finding is the upregulation of Wnt ligands in our
microarray analyses. The crosstalk among Wnt, TGF/BMP, FGF, Hedgehog,
and Notch, and their impact on tumor cell behavior, are the focus of future
studies.
Our high-throughput analyses identify FGFR2 as a critical signaling node
in the behavior of SYT-SSX2-expressing cells. Its enhanced signaling by SYT-
SSX2 may explain the accelerated osteoblastogenesis as well as the dominance
60
of the pro-neural gene profile. With MAPK/ERK and PI3K activation, FGFR2
signaling promotes neurogenesis and skeletogenesis through crosstalk with Wnt,
Hedgehog, Notch, and BMP signals (Ever and Gaiano, 2005; Chadashvili and
Peterson, 2006; Maric et al., 2007; Zhao et al., 2008; Miraoui and Marie, 2010).
Furthermore, the benefit of FGF pathway attenuation to inhibit SS cell growth
was previously reported (Ishibe et al., 2008) and corroborated by our studies.
Chemical inhibition of FGFR2 signaling and its depletion with shRNA causes loss
of neurofilament expression and decreased cell growth in both the SYT-SSX2
hMSCs and the SS SYO-1 tumor cells. Significantly, upregulation of FGF ligands
in the myoblast and hMSC microarrays suggests that SYT-SSX2 establishes an
autocrine FGF signaling loop. If this is the case, identification of FGFR2 as the
mediator of these signals designates it as a candidate for potential SS tumor
reversal. Increased FGFR2 activity is already linked to advanced malignant
phenotypes in endometrial, uterine, ovarian, breast, lung and gastric cancers.
Strategies designed to target FGFR2 in these cancers (Katoh, 2008; Katoh and
Katoh, 2009) are ongoing.
The deregulation of differentiation in our model systems can also be
explained by these findings. FGFR2-induced osteoblast maturation (Miraoui and
Marie, 2010) inhibits adipogenesis in mesenchymal stem cells (Muruganandan et
al., 2009). Similarly, the stimulation of a neural program by SYT-SSX2 may
abrogate myogenesis. In C2C12 cells, the two outcomes are mutually exclusive
(Watanabe et al., 2004). Alternatively, direct silencing of myogenic genes can
also contribute to this phenotype. The ChIPSeq analysis revealed a putative
61
SYT-SSX2 binding site upstream of the downregulated MyoD gene. Additional
studies are underway to test this possibility and identify potential recruitment
factors associated with transcriptional silencing by SYT-SSX2.
In summary, our studies in mesenchymal stem and progenitor cells
uncover a function of SYT-SSX2 in differentiation programming, and our
genome-wide analyses provide a glimpse into the early events of tumor initiation
by the oncogene. Overall, we believe that the deregulation of differentiation is a
manifestation of the ability of SYT-SSX2 to target lineage-specific programs.
FGFR2 was identified as a cardinal player in SYT-SSX2-associated phenotypes,
but it is likely that additional pathway mediators also contribute to SYT-SSX2-
induced characteristics. Future investigation of other targets identified through
this method will lead to a better understanding of the interplay among these
pathways and SS pathology. This combination analysis also provides a powerful
tool in the discovery of novel therapeutic targets and will be advantageous in
understanding the biology of other oncogenic proteins directly affecting
transcriptional programs.
62
CHAPTER IV
EPIGENETIC RECRUITMENT AND REGULATION OF SYT-SSX2 ACTIVITY
Introduction
Dynamic regulation of chromatin structure allows for DNA-dependent
processes to be controlled in an epigenetic fashion, or in other words,
independently of the DNA sequence. Work in recent years has made it
increasingly clear that gene expression not only depends on the presence of
sequence-specific transcription factors but also on the structure of the chromatin
fiber. Moreover, certain post-translational modifications of the core histone
proteins are known to be associated with specific chromatin states. For example,
heterochromatin is characterized by the presence of trimethylated histone H3 at
lysine 9 or 27 (H3K9me3, H3K27me3) and ubiquitylated histone H2A at lysine
119 (H2AUb) (Bannister and Kouzarides, 2011; Trojer and Reinberg, 2007). In
general, histone acetylation is associated with euchromatin and reflects
transcriptional activation (Bannister and Kouzarides, 2011). Gene activity is also
closely correlated with trimethylation of histone H3 on lysine 4 (H3K4me3) and
ubiquitylation of histone H2B on lysine 123 (H2BUb) (Bannister and Kouzarides,
2011; Weake and Workman, 2008). Whether these modifications elicit functional
changes themselves or whether they are part of a larger mechanism regulating
chromatin stability that, in turn, controls DNA-dependent processes is a matter of
63
debate (Henikoff and Shilatifard, 2011). In either case, knowing the complement
of epigenetic markers at a given locus provides valuable information regarding its
functional status.
Indeed, recent evidence suggests that co-regulated gene subsets are
characterized by common histone modification signatures. New computational
methods are now considering histone modifications to predict cell-type specific
transcription factor binding sites more accurately (Wang, 2011; McLeay et al.,
2011). In addition, it has been shown that genes participating in similar functional
pathways that also display identical expression patterns are marked by the same
complement of histone modifications in yeast and mouse myoblasts (Natsume-
Kitatani et al., 2011; Asp et al., 2011). Therefore, the combination of markers
may serve as a signature for transcriptional regulators denoting the coordinated
expression of these genes.
Development is one process during which many genes are coordinately
regulated within specific cell-types. This is directed by sequence-specific
transcription factors. For example, MyoD and REST/NRSF are master regulators
of the myogenic and neurogenic programs, respectively, and these transcription
factors control the expression of genes important in the differentiation and
function of their respective lineages (Weintraub et al., 1989; Schoenherr and
Anderson, 1995). Tissue-specific expression of individual genes may also be
regulated by enhancers, non-coding DNA elements to which multiple
transcription factors may bind. These are diverse regulatory elements that
function independently of distance and orientation relative to their target genes
64
but have some distinguishing characteristics like DNase I hypersensitivity, p300
binding, and common histone modifications such as mono- and dimethylated
histone H3 at lysine 4 and acetylated histone H3 at lysines 9, 14, 18, or 27 (Ong
and Corces, 2011).
In the previous chapter, we described the activation of a neural program
accompanied by the inhibition of the myogenic program in C2C12 myoblasts.
This was due to the specific targeting of neural genes by the SYT-SSX2 fusion
protein. Because the translocation product is known to associate with epigenetic
regulators and that the subsets of genes in euchromatic versus heterchromatic
regions is cell-type specific, we wanted to determine if there was a signature set
of epigenetic markers that was associated with SYT-SSX2 recruitment.
Furthermore, we wanted to ascertain whether a specific set of markers could
predict transcriptional activation or repression mediated by the mutant protein.
65
Results
SYT-SSX2 binding is heterogeneous and strongly correlates with histone H3
lysine 27 trimethylation
In the previous chapter, we described a genomewide ChIPSeq experiment
performed in C2C12 myoblasts expressing the oncogene SYT-SSX2. This
analysis led to the identification of nearly 53,000 regions (or peaks) bound by the
SYT-SSX2 complex. In order to generate a global picture of SYT-SSX2 binding
sites throughout the genome, we performed a sliding window analysis in which
each chromosome was subdivided into 500kb bins, and the number of SYT-
SSX2 peaks in each bin was tabulated.
SYT-SSX2 displays heterogeneous binding among the chromosomes as a
whole and along each chromosome individually (Figure 6A, Appendix B Figure
B5). Nearly 20% of the binding sites (9,750) are located on the X chromosome,
whereas chromosome 3 has 674 binding sites (1.3%) (Table 5). Interestingly,
areas with high levels of binding are located at chromosome ends, notably on
chromosomes 2, 4, 11, 15, and X (Figure 6A, Appendix B Figure B5). This trend
is also seen to a lesser degree on chromosomes 7, 8, 12, and 16-19 (Appendix B
Figure B5).
Binned binding sites appear to cluster loosely into 3 density categories:
low, medium, and high. Low-density clusters are similar to the cluster centered
around 5Mb on chromosome 2 and contain bins with <100 peaks (Figure 6A,
arrowhead). Medium-density clusters contain 1-2 bins with 100-200 peaks
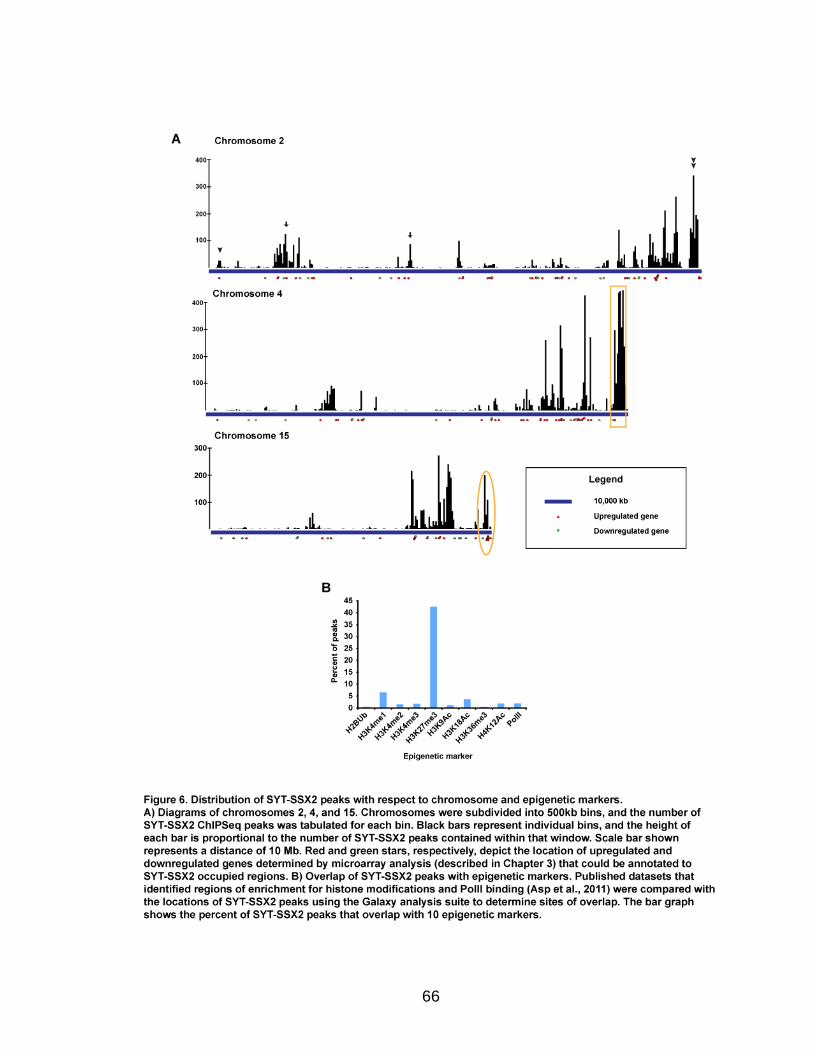
66

67
surrounded by other bins with less than 100 peaks like the clusters centered at
28Mb or 74Mb on chromosome 2 (Figure 6A, arrows). The cluster centered at
179Mb on chromosome 2 (Figure 6A, double arrowhead) is an example of a
high-density cluster which contains bins with >200 peaks with nearby bins
containing >100 peaks. These data indicate that SYT-SSX2 recruitment to target
loci is non-random and displays a preference to specific chromosomal regions.
Table 5. Distribution of SYT-SSX2 peaks per chromosome.
Chromosome Number of peaks
Percentage of peaks
Chromosome Number of peaks
Percentage of peaks
1 1,651 3.1 11 3,712 7.0
2 5,311 10.0 12 2,573 4.9
3 674 1.3 13 1,145 2.2
4 6,309 11.9 14 1,493 2.8
5 4,146 7.8 15 3,202 6.0
6 1,913 3.6 16 798 1.5
7 1,846 3.5 17 1,842 3.5
8 2,759 5.2 18 836 1.6
9 1,466 2.8 19 801 1.5
10 765 1.4 X 9,750 18.4
Previous reports have shown that SYT-SSX2 interacts with proteins
involved in transcriptional regulation by epigenetic mechanisms. Therefore, we
wanted to determine if SYT-SSX2 binding might be associated with specific
epigenetic markers. Previously published genome-wide datasets for histone
modifications and RNA polymerase II binding sites (PolII) (Asp et al., 2011) in
C2C12 myoblasts were compared with our SYT-SSX2 dataset allowing us to
determine the nature of the epigenetic landscape to which SYT-SSX2 was
recruited. Positions of histone modification enrichment and protein binding are
reported as chromosomal positions, thus areas where the datasets intersect can
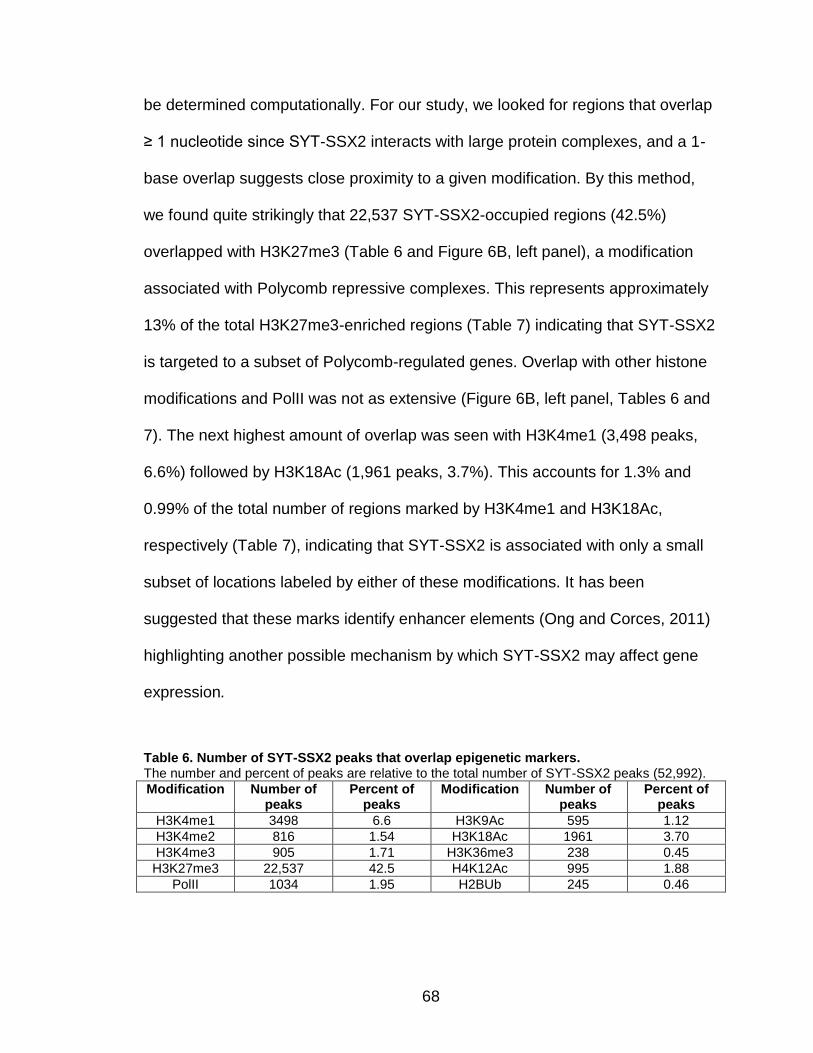
68
be determined computationally. For our study, we looked for regions that overlap
≥ 1 nucleotide since SYT-SSX2 interacts with large protein complexes, and a 1-
base overlap suggests close proximity to a given modification. By this method,
we found quite strikingly that 22,537 SYT-SSX2-occupied regions (42.5%)
overlapped with H3K27me3 (Table 6 and Figure 6B, left panel), a modification
associated with Polycomb repressive complexes. This represents approximately
13% of the total H3K27me3-enriched regions (Table 7) indicating that SYT-SSX2
is targeted to a subset of Polycomb-regulated genes. Overlap with other histone
modifications and PolII was not as extensive (Figure 6B, left panel, Tables 6 and
7). The next highest amount of overlap was seen with H3K4me1 (3,498 peaks,
6.6%) followed by H3K18Ac (1,961 peaks, 3.7%). This accounts for 1.3% and
0.99% of the total number of regions marked by H3K4me1 and H3K18Ac,
respectively (Table 7), indicating that SYT-SSX2 is associated with only a small
subset of locations labeled by either of these modifications. It has been
suggested that these marks identify enhancer elements (Ong and Corces, 2011)
highlighting another possible mechanism by which SYT-SSX2 may affect gene
expression.
Table 6. Number of SYT-SSX2 peaks that overlap epigenetic markers. The number and percent of peaks are relative to the total number of SYT-SSX2 peaks (52,992).
Modification Number of peaks
Percent of peaks
Modification Number of peaks
Percent of peaks
H3K4me1 3498 6.6 H3K9Ac 595 1.12
H3K4me2 816 1.54 H3K18Ac 1961 3.70
H3K4me3 905 1.71 H3K36me3 238 0.45
H3K27me3 22,537 42.5 H4K12Ac 995 1.88
PolII 1034 1.95 H2BUb 245 0.46
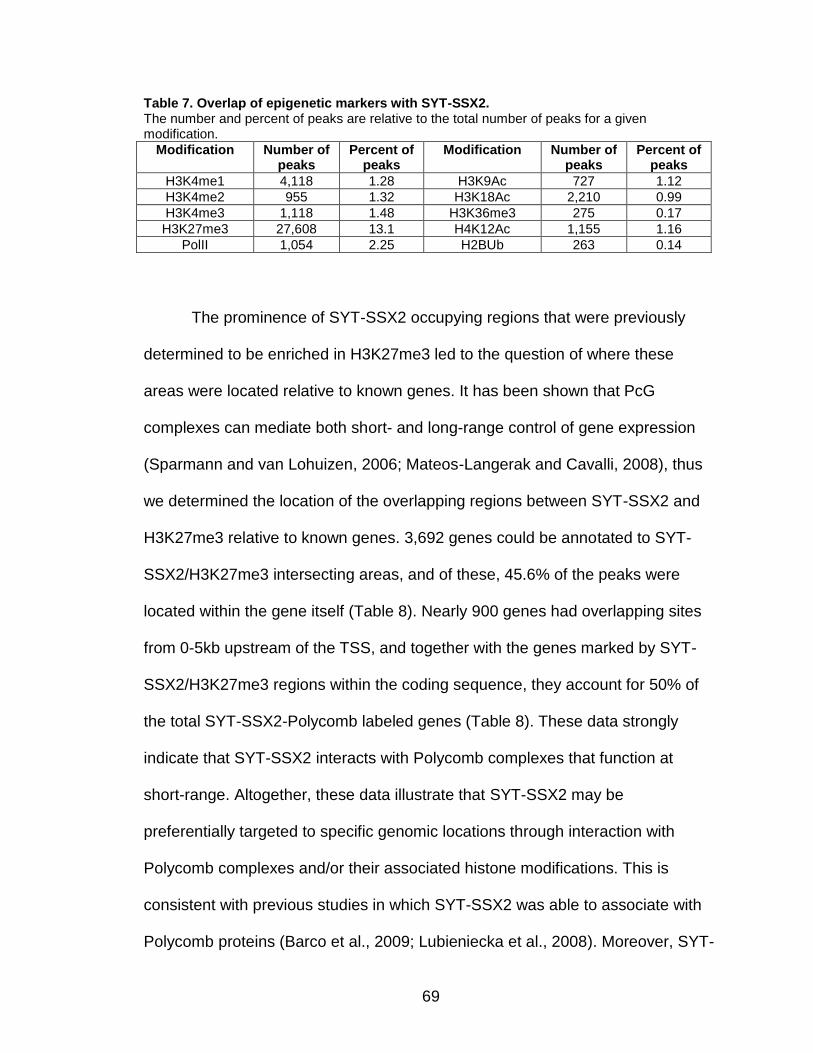
69
Table 7. Overlap of epigenetic markers with SYT-SSX2. The number and percent of peaks are relative to the total number of peaks for a given modification.
Modification Number of peaks
Percent of peaks
Modification Number of peaks
Percent of peaks
H3K4me1 4,118 1.28 H3K9Ac 727 1.12
H3K4me2 955 1.32 H3K18Ac 2,210 0.99
H3K4me3 1,118 1.48 H3K36me3 275 0.17
H3K27me3 27,608 13.1 H4K12Ac 1,155 1.16
PolII 1,054 2.25 H2BUb 263 0.14
The prominence of SYT-SSX2 occupying regions that were previously
determined to be enriched in H3K27me3 led to the question of where these
areas were located relative to known genes. It has been shown that PcG
complexes can mediate both short- and long-range control of gene expression
(Sparmann and van Lohuizen, 2006; Mateos-Langerak and Cavalli, 2008), thus
we determined the location of the overlapping regions between SYT-SSX2 and
H3K27me3 relative to known genes. 3,692 genes could be annotated to SYT-
SSX2/H3K27me3 intersecting areas, and of these, 45.6% of the peaks were
located within the gene itself (Table 8). Nearly 900 genes had overlapping sites
from 0-5kb upstream of the TSS, and together with the genes marked by SYT-
SSX2/H3K27me3 regions within the coding sequence, they account for 50% of
the total SYT-SSX2-Polycomb labeled genes (Table 8). These data strongly
indicate that SYT-SSX2 interacts with Polycomb complexes that function at
short-range. Altogether, these data illustrate that SYT-SSX2 may be
preferentially targeted to specific genomic locations through interaction with
Polycomb complexes and/or their associated histone modifications. This is
consistent with previous studies in which SYT-SSX2 was able to associate with
Polycomb proteins (Barco et al., 2009; Lubieniecka et al., 2008). Moreover, SYT-
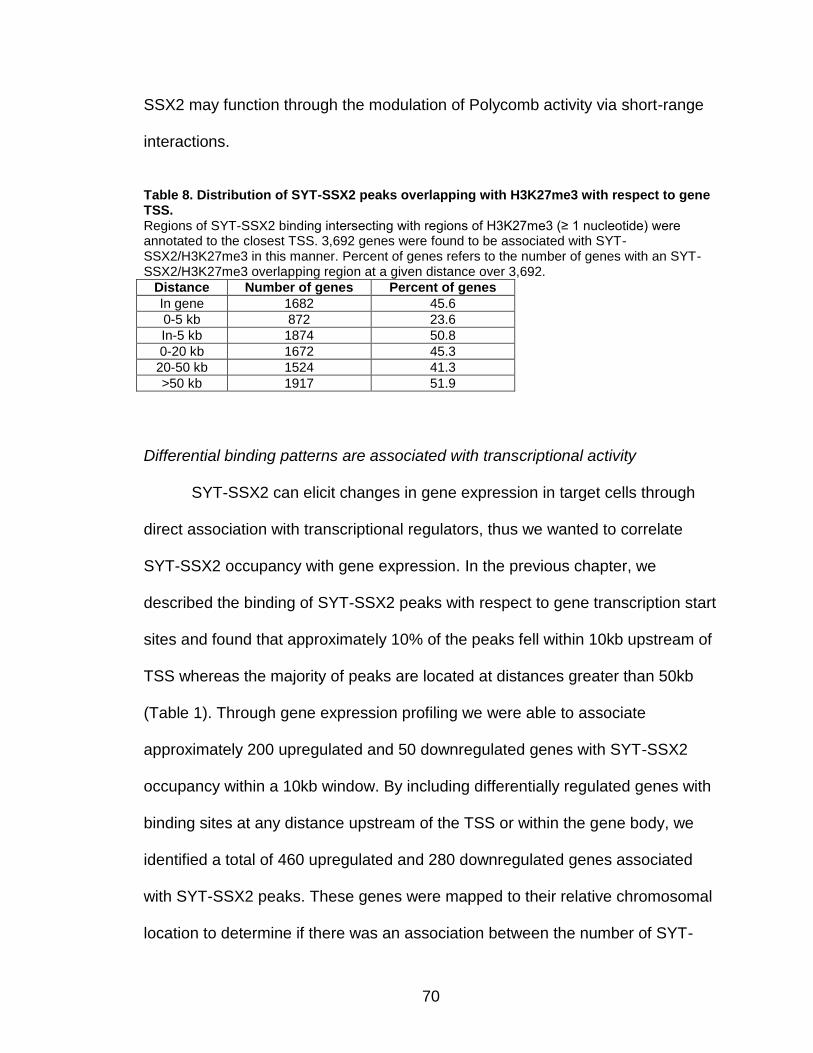
70
SSX2 may function through the modulation of Polycomb activity via short-range
interactions.
Table 8. Distribution of SYT-SSX2 peaks overlapping with H3K27me3 with respect to gene TSS. Regions of SYT-SSX2 binding intersecting with regions of H3K27me3 (≥ 1 nucleotide) were annotated to the closest TSS. 3,692 genes were found to be associated with SYT-SSX2/H3K27me3 in this manner. Percent of genes refers to the number of genes with an SYT-SSX2/H3K27me3 overlapping region at a given distance over 3,692.
Distance Number of genes Percent of genes
In gene 1682 45.6
0-5 kb 872 23.6
In-5 kb 1874 50.8
0-20 kb 1672 45.3
20-50 kb 1524 41.3
>50 kb 1917 51.9
Differential binding patterns are associated with transcriptional activity
SYT-SSX2 can elicit changes in gene expression in target cells through
direct association with transcriptional regulators, thus we wanted to correlate
SYT-SSX2 occupancy with gene expression. In the previous chapter, we
described the binding of SYT-SSX2 peaks with respect to gene transcription start
sites and found that approximately 10% of the peaks fell within 10kb upstream of
TSS whereas the majority of peaks are located at distances greater than 50kb
(Table 1). Through gene expression profiling we were able to associate
approximately 200 upregulated and 50 downregulated genes with SYT-SSX2
occupancy within a 10kb window. By including differentially regulated genes with
binding sites at any distance upstream of the TSS or within the gene body, we
identified a total of 460 upregulated and 280 downregulated genes associated
with SYT-SSX2 peaks. These genes were mapped to their relative chromosomal
location to determine if there was an association between the number of SYT-
71
SSX2 peaks and gene activity. As a general trend, negatively regulated genes
are associated with low-density clusters (Figure 6A) while high-density clusters
most often correspond to positively regulated genes (Figure 6A). Interestingly,
there does not appear to be a correlation between the degree of SYT-SSX2
binding and the number of genes that are either up- or downregulated. On
chromosome 4, a high-density cluster is centered around 153Mb, however only 2
genes (1 upregulated and 1 downregulated) are associated with this area (Figure
6A, box). Conversely, on chromosome 15, a region dense with activated genes
centered at 102Mb most closely corresponds to a low-medium density cluster
(Figure 6A, oval). Taken together, these data indicate that SYT-SSX2 binding
correlates with alterations in gene activity; however, not all binding sites are
associated with changes in gene expression suggesting that SYT-SSX2 may
have additional functions in the nucleus.
We narrowed our focus to study differentially regulated genes locally in
order to determine if gene activation versus repression could be distinguished by
SYT-SSX2 binding patterns. Interestingly, the distribution of SYT-SSX2 binding
sites upstream of the TSS was markedly different depending on whether a gene
was positively or negatively regulated by oncogene expression. Overall, more
than half of the upregulated genes bound by SYT-SSX2 (53.9%) have at least 1
peak within a window from 0-20kb upstream of the TSS. This number decreases
with increasing distance (Figure 7, top panel). In contrast, 21.4% of the genes
that are downregulated and bound by SYT-SSX2 have peaks within a 0-20kb
window upstream of the TSS. This percentage increases with increasing
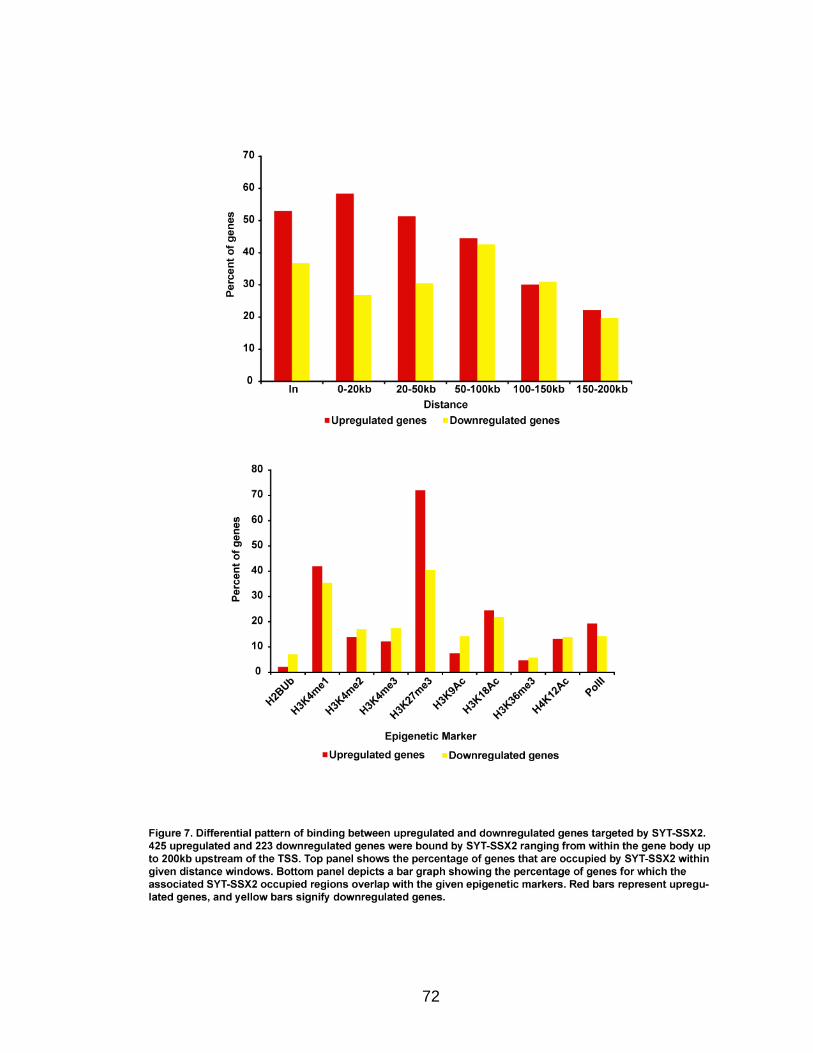
72
73
distance, peaks from 50-100kb then decreases at distances between 100-150kb
and 150-200kb (Figure 7, top panel). These data suggest that SYT-SSX2-
associated transcriptional activation is correlated with binding at close range
whereas transcriptional repression associates with binding at farther distances.
Binding patterns associated with differentially regulated genes
Recently, it has been shown that genes within specific functional
categories can be distinguished by the pattern of histone modifications
surrounding them. This suggests that genes within a particular pathway have a
specific epigenetic signature that allows them to be differentially recognized by
activating and/or repressing factors. In this way, the cell can co-regulate the
expression of genes involved in a given process (Asp et al., 2011; Natsume-
Kitatani et al., 2011). We have hypothesized that SYT-SSX2 targets genes
through an epigenetic mechanism. To further delineate the SYT-SSX2 binding
pattern, overlap of SYT-SSX2 peaks with histone modifications at differentially
regulated genes was determined. Seventy-two percent (72%) of the upregulated
genes and 43.6% of the downregulated genes bound by SYT-SSX2 have
associated peaks that overlap with H3K27me3 (Figure 7, bottom panel)
corroborating previous reports that the fusion protein is targeted to Polycomb-
regulated genes. Surprisingly, 43.6% of the upregulated genes and 33.6% of the
downregulated genes have SYT-SSX2 peaks that overlap with H3K4me1. This is
significant considering that the overlap with H3K4me1 occurs with only 6.6% of
the total SYT-SSX2 peaks overall. Since this modification labels enhancer
74
elements (Ong and Corces, 2011), the association of SYT-SSX2 with these sites
as well as Polycomb target sites suggests that SYT-SSX2 may affect
transcription by modulating both enhancer and Polycomb function.
Next we wanted to discover if the overlap of SYT-SSX2 binding exhibited
any patterns that would allow us to distinguish differentially regulated genes. As a
first step, we tabulated the number SYT-SSX2 peaks for each gene within a
particular expression category (positively or negatively regulated) that overlapped
with histone modifications, PolII binding, and DNA methylation in 5kb windows up
to 50kb upstream of TSS and within the gene. We limited our analyses to this
distance because of the association of SYT-SSX2 with Polycomb-marked
regions at close-range to gene TSS and because of the difficulty in definitively
assigning functional significance to binding sites at farther distances. For this
analysis we also only characterized genes that had SYT-SSX2 binding sites that
overlapped with at least 1 epigenetic marker and identified 314 upregulated and
110 downregulated genes by this criterion. Of these upregulated genes, 50% had
overlapping sites between the fusion protein and H3K27me3 (Table 9). This
percentage decreases with increasing distance consistent with the trend
described above with respect to all genes with SYT-SSX2/H3K27me3
intersecting regions. Also consistent with trends described above, the second
most abundant overlap occurred between SYT-SSX2 and H3K4me1 within the
gene body. Association between SYT-SSX2 and other histone modifications,
particularly those related to transcriptional activation (but not elongation) was
also seen within gene bodies, although to a much lesser extent than either
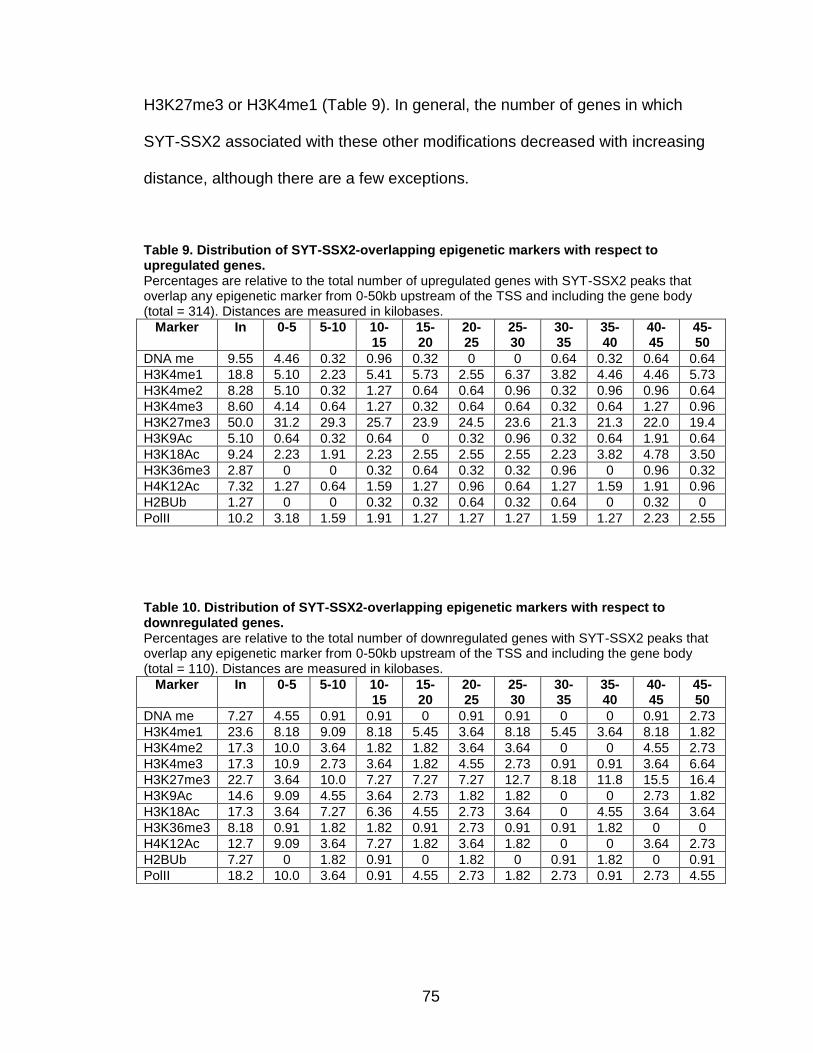
75
H3K27me3 or H3K4me1 (Table 9). In general, the number of genes in which
SYT-SSX2 associated with these other modifications decreased with increasing
distance, although there are a few exceptions.
Table 9. Distribution of SYT-SSX2-overlapping epigenetic markers with respect to upregulated genes. Percentages are relative to the total number of upregulated genes with SYT-SSX2 peaks that overlap any epigenetic marker from 0-50kb upstream of the TSS and including the gene body (total = 314). Distances are measured in kilobases.
Marker In 0-5 5-10 10-15
15-20
20-25
25-30
30-35
35-40
40-45
45-50
DNA me 9.55 4.46 0.32 0.96 0.32 0 0 0.64 0.32 0.64 0.64
H3K4me1 18.8 5.10 2.23 5.41 5.73 2.55 6.37 3.82 4.46 4.46 5.73
H3K4me2 8.28 5.10 0.32 1.27 0.64 0.64 0.96 0.32 0.96 0.96 0.64
H3K4me3 8.60 4.14 0.64 1.27 0.32 0.64 0.64 0.32 0.64 1.27 0.96
H3K27me3 50.0 31.2 29.3 25.7 23.9 24.5 23.6 21.3 21.3 22.0 19.4
H3K9Ac 5.10 0.64 0.32 0.64 0 0.32 0.96 0.32 0.64 1.91 0.64
H3K18Ac 9.24 2.23 1.91 2.23 2.55 2.55 2.55 2.23 3.82 4.78 3.50
H3K36me3 2.87 0 0 0.32 0.64 0.32 0.32 0.96 0 0.96 0.32
H4K12Ac 7.32 1.27 0.64 1.59 1.27 0.96 0.64 1.27 1.59 1.91 0.96
H2BUb 1.27 0 0 0.32 0.32 0.64 0.32 0.64 0 0.32 0
PolII 10.2 3.18 1.59 1.91 1.27 1.27 1.27 1.59 1.27 2.23 2.55
Table 10. Distribution of SYT-SSX2-overlapping epigenetic markers with respect to downregulated genes. Percentages are relative to the total number of downregulated genes with SYT-SSX2 peaks that overlap any epigenetic marker from 0-50kb upstream of the TSS and including the gene body (total = 110). Distances are measured in kilobases.
Marker In 0-5 5-10 10-15
15-20
20-25
25-30
30-35
35-40
40-45
45-50
DNA me 7.27 4.55 0.91 0.91 0 0.91 0.91 0 0 0.91 2.73
H3K4me1 23.6 8.18 9.09 8.18 5.45 3.64 8.18 5.45 3.64 8.18 1.82
H3K4me2 17.3 10.0 3.64 1.82 1.82 3.64 3.64 0 0 4.55 2.73
H3K4me3 17.3 10.9 2.73 3.64 1.82 4.55 2.73 0.91 0.91 3.64 6.64
H3K27me3 22.7 3.64 10.0 7.27 7.27 7.27 12.7 8.18 11.8 15.5 16.4
H3K9Ac 14.6 9.09 4.55 3.64 2.73 1.82 1.82 0 0 2.73 1.82
H3K18Ac 17.3 3.64 7.27 6.36 4.55 2.73 3.64 0 4.55 3.64 3.64
H3K36me3 8.18 0.91 1.82 1.82 0.91 2.73 0.91 0.91 1.82 0 0
H4K12Ac 12.7 9.09 3.64 7.27 1.82 3.64 1.82 0 0 3.64 2.73
H2BUb 7.27 0 1.82 0.91 0 1.82 0 0.91 1.82 0 0.91
PolII 18.2 10.0 3.64 0.91 4.55 2.73 1.82 2.73 0.91 2.73 4.55
76
Of the negatively regulated genes, the highest levels of overlap were also
seen in the gene body and occurred with H3K4me1 and H3K27me3 (Table 10).
For H3K4me1, the number of genes with intersection of this mark with SYT-
SSX2 occupancy generally decreases with increasing distance upstream of the
TSS; however, from 25-30kb and 40-45kb the number of genes with SYT-
SSX2/H3K4me1 regions was increased relative to the surrounding windows
(Table 10). For H3K27me3, a slightly different pattern is seen. The number of
genes with SYT-SSX2/H3K27me3 sites decreases dramatically from 0-5kb but
increases with increasing distance upstream of the TSS (Table 10).
With downregulated genes, SYT-SSX2 also appears to associate with
modifications related to active transcription. Regions enriched in H3K4me2,
H3K4me3, H3K9Ac, H3K18Ac, H4K12Ac, and PolII occupancy overlap with SYT-
SSX2 binding sites in over 10% of the downregulated genes, and markers
associated with transcriptional elongation (H3K36me3 and H2BUb) overlap with
SYT-SSX2 sites in more than 5% of the downregulated genes (compared with
less than 3% of the upregulated genes). In summary, SYT-SSX2 associates with
epigenetic markers, particularly H3K27me3 and H3K4me1. Most of the
upregulated genes in this analysis are marked by H3K27me3, and SYT-SSX2
appears to bind close to the TSS. In contrast, SYT-SSX2 occupies H3K4me1- or
H3K27me3-enriched regions in a similar percentage of downregulated genes and
also associates with more markers of transcriptional activation and elongation.
In order to determine higher order relationships among the histone
modifications themselves and gene expression, and using the criterion that
77
genes were included if they contained a binding site for SYT-SSX2 that
overlapped with at least 1 epigenetic marker, hierarchical clustering was
performed on the differentially regulated genes. To do so, the degree of overlap
between SYT-SSX2 and a given modification was calculated as a ratio of bases
covered per 5kb bin upstream of the TSS or the ratio of bases covered in the
gene body over the total number of bases in the coding sequence. This data
generated a signature of modifications by distance for each gene and was used
in hierarchical clustering analyses.
Analysis of the upregulated genes corroborated earlier results and
identified H3K27me3 as the predominant modification associated with SYT-SSX2
binding and gene expression (Figure 8, top panel). The location and extent of
H3K27me3 was variable across all genes, but there were 2 sub-clusters in which
SYT-SSX2/H3K27me3 intersecting sites were located within the entire range of
distances that we analyzed. The first of those sub-clusters is highlighted in Figure
8 (top panel). It has been reported previously that genes densely covered by
H3K27me3 were involved in the differentiation and development of alternate
lineage pathways, thus we wanted to determine the function of the genes within
this sub-cluster. Based on our previous analysis (Chapter 3), we found that 50%
of these genes are involved in neural development and function. To summarize,
SYT-SSX2 occupies regions within and upstream of upregulated genes that are
enriched in H3K27me3. Functionally, these genes can be subdivided based on
the extent of SYT-SSX2/H3K27me3 intersection and are in line with our previous
observation of the increased expression of neural characteristics and genes.
78
Similar hierarchical clustering was performed on the downregulated
genes. This analysis led to the identification of 2 clusters of genes with
differential signatures. The first is characterized by SYT-SSX2/H3K27me3
overlap from 0-10kb and 20-50kb upstream of gene TSS, whereas the second
cluster is marked by the overlap of SYT-SSX2 with histone modifications related
to transcriptional activation at close ranges (Figure 8, bottom panel).
Interestingly, these two signatures appear to be mutually exclusive. SYT-
SSX2/H3K27me3 overlaps are minimal or absent in the genes marked by close-
range SYT-SSX2 intersection with activating modifications and vice versa (Figure
8, bottom panel). Additionally, unlike the upregulated genes, which were
functionally related based on their clustering, the genes within these clusters
were not clearly associated with a particular pathway or program. Together,
these data suggest that SYT-SSX2-mediated downregulation of gene expression
occurs through different mechanisms, one dependent on recruitment by
Polycomb and the other independent of Polycomb.
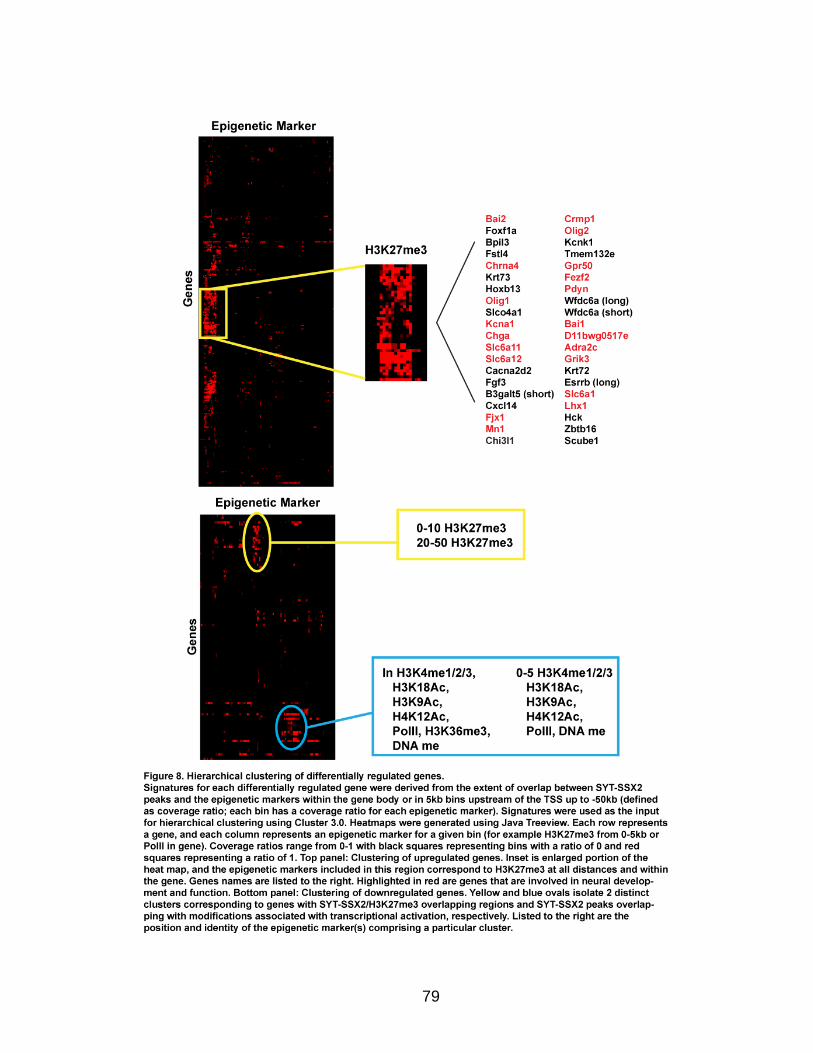
79
80
Conclusions
Genome-wide analysis of SYT-SSX2 distribution and subsequent
alterations in gene expression revealed that both its binding and functional
consequences are non-random events. Heterogeneous binding of the fusion
protein was found across all chromosomes in terms of the number of peaks per
chromosome and density at specific loci on individual chromosomes.
Comparison of these binding sites with epigenetic markers further supported the
preference of SYT-SSX2 for regions bound by Polycomb complexes and
established its association with a subset of Polycomb-regulated loci. In addition,
a small subpopulation of the genes bound by SYT-SSX2 displayed alterations in
expression. These genes were typified by certain epigenetic attributes:
upregulated genes were characterized by the predominant association of SYT-
SSX2 with regions enriched in H3K27me3, whereas downregulated genes could
be subdivided into at least 2 categories distinguished by occupation of the fusion
protein in regions displaying either H3K27me3 enrichment at short- and long-
ranges or the presence of modifications associated with transcriptional activation
within the gene body or near the TSS.
The data described here provide a foundation for uncovering the
mechanism of SYT-SSX2 recruitment. The preeminent association of SYT-SSX2
with H3K27me3 supports previous reports of interaction with Polycomb
complexes (Thaete et al., 1999; dos Santos et al., 2000; Barco et al., 2009) and
indicates that the fusion protein does not simply target to regions of open
81
chromatin by default. Furthermore, because it occupies only a subset of
Polycomb loci, the presence of additional targeting factors, genetic or epigenetic,
is also likely. One possibility is PRC1. The H3K27me3 modification is catalyzed
by PRC2, and it is known that PRC1 and PRC2 do not occupy completely
identical sets of genes within a given cell type (Ku et al., 2008; Asp et al., 2011).
Direct interaction of the fusion protein has only been seen with the PRC1
component Ring1b (Barco et al., 2009), thus it follows that SYT-SSX2 will not
associate with all H3K27me3-labeled regions. Furthermore, PRC1 may also be
recruited to chromatin independently of PRC2 (Kerppola, 2009). Recruitment of
SYT-SSX2 by PRC1 could then explain at least some of the other binding sites
that are not enriched for H3K27me3. Therefore, it would be interesting to
determine the degree of overlap between SYT-SSX2 ChIPSeq and genome-wide
binding patterns of PRC1 in C2C12 cells.
Our genome-wide analyses revealed that SYT-SSX2 is targeted to over
3,000 genes, yet alterations in expression are noted for, at most, 740 of these
targets. This may be due to experimental errors from the high-throughput
analyses in the forms of false-positive SYT-SSX2 peaks or false-negative
changes in gene expression. Alternatively, it is not unprecedented that the
number of binding sites for a particular factor is far greater than the number of
genes that are differentially expressed when that factor is induced. MyoD was
found to bind to the promoter region of 3,719 genes, yet only 384 of these genes
were upregulated during myogenesis (Cao Y et al, 2010). Similarly, the PAX3-
FKHR fusion associated with rhabdomyosarcoma bound to 1,072 genes,
82
however only 95 and 24 of these genes were found to be differentially regulated
in PAX3-FKHR-bearing tumor cells and cell lines, respectively (Cao L et al.,
2010). These data also suggest that additional signals may be required in order
to produce functional outcomes after binding to target loci. In support of this
notion, a recent report studying genome-wide binding of p53 indicated that
differential gene expression upon treatment with etoposide versus actinomycin D
was due to altered p53 phosphorylation rather than changes in binding sites
(Smeenk et al., 2011). In the same way, alterations in gene expression by SYT-
SSX2 may result from subsequent signaling events.
We were able to identify differential signatures for upregulated versus
downregulated genes based on SYT-SSX2 binding site distance as well as the
complement of epigenetic markers underlying SYT-SSX2-occupied regions.
There is an apparent difference based on distance between positively- and
negatively-regulated genes marked by H3K27me3. Most genes with increased
expression have SYT-SSX2 binding sites within the gene body or near the TSS
while greater numbers of genes with decreased expression are occupied at a
distance. This dissimilarity may reflect alternate mechanisms of PRC-mediated
silencing. For example, it has been reported that the structure of PRC1 may differ
when it is proximal to the TSS versus when it is bound distally; functionally, this
results in opposite consequences on gene expression after depletion of PRC1
components (Ren and Kerppola, 2011). Therefore, PRC1 dysfunction caused by
SYT-SSX2 could result in opposite effects. Another explanation may involve the
ability of SYT-SSX2 to interact with Brg1. In ES cells, Brg1 tunes expression of
83
Polycomb target genes resulting in either activation or enhanced silencing, and
so may augment repression rather than antagonize it (Ho et al., 2011).
In addition, a second subcluster of downregulated genes was
characterized by the presence of histone modifications associated with active
transcription within the gene or proximal (0-5kb) to the TSS. Together with the
fact that close-range binding by SYT-SSX2 at Polycomb-regulated genes results
in gene activation, these data indicate that proximal binding by the fusion protein
functions to antagonize the transcriptional status of target genes. Moreover,
previous work has indicated that these are both consequences of aberrant
Polycomb function since SYT-SSX2 has been shown both to antagonize and to
initiate Polycomb silencing (Barco et al., 2009; Lubieniecka et al., 2008). In this
way, SYT-SSX2 may act as a switch protein that generally opposes the gene
expression profile of the cell.
The specificity for the upregulation of neural genes can be explained by a
number of different mechanisms. The first involves the endogenous expression
of certain factors that makes a particular outcome more likely in one cell versus a
different type. It is hypothesized that expression is the result of the balance
between Polycomb and Trithorax activity at a given gene, and some cell types
may possess additional regulators that can affect gene expression once that
balance has been perturbed (Schwartz and Pirotta, 2008; Schwartz et al., 2010).
Interestingly, aberrant expression of E-cadherin results from the co-expression of
SYT-SSX with the either of the tissue-specific transcriptional repressors Snail or
Slug suggesting interaction with repressor molecules directs gene activation by
84
the fusion (Saito et al., 2006). C2C12 cells may then express certain factors that
could guide the expression of neural genes. One potential factor is the
REST/NRSF transcriptional repressor that silences neural genes in alternate
lineages. Inhibition of its activity leads to neurogenesis in C2C12 cells so
misexpression of its target genes by SYT-SSX2 may result in the ectopic neural
program seen in these cells (Watanabe et al., 2004).
An alternate mechanism may involve the activation of tissue-specific
enhancer elements. In ES cells, enhancers that control the expression of inactive
genes involved in differentiation of multiple lineages are labeled by H3K27me3
and H3K4me1. When these elements become active K27 becomes acetylated, a
modification that can be catalyzed by p300 (Rada-Iglesias et al., 2010; Tie et al.,
2009). Recruitment of SYT-SSX2 to these elements by interactions with
Polycomb may lead to increased acetylation of K27 by p300 resulting in their
activation and subsequent perturbations in the balance between silencing and
expression.
These data allow us to propose a model of recruitment and regulation of
target gene expression by SYT-SSX2. In the case of upregulated genes, the
fusion protein is recruited by interactions with PRC1, and gene activity is
determined by the presence of lineage-specific transcription factors or the
activation of specific enhancer elements (Figure 9A). For downregulated genes,
SYT-SSX2 may be recruited by PRC1 or PRC2 at a distance from target
promoters (Figure 9B, top) or directly targeted to activated genes (Figure 9B,
bottom). Recruitment may occur through interactions with the modified histones

85
themselves, the complexes that catalyze those modifications, or additional
proteins like sequence-specific transcription factors. The presence of other
factors is likely to be important in specifying target genes for repression.
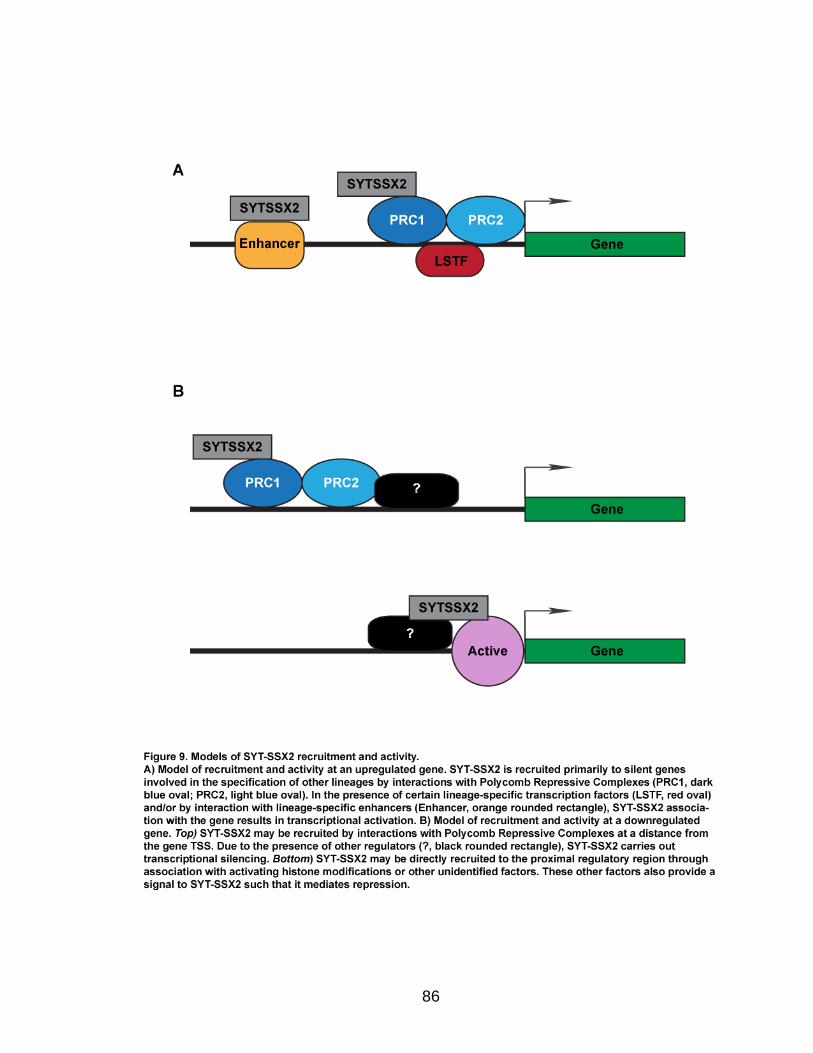
86
87
CHAPTER V
DEREGULATION OF POLYCOMB COMPLEX ACTIVITY
Introduction
The Polycomb proteins are important regulators of gene expression in
development as well as cancer, and much attention has focused on the
mechanism through which these proteins regulate differentiation and contribute
to tumorigenesis. One aspect of Polycomb function that has not been addressed
extensively is how the activity of these proteins is regulated. PRC1 is considered
to be the main controller of gene expression by Polycomb proteins, and the most
detectable function that it performs is the ubiquitylation of histone H2A (Simon
and Kingston, 2009). This is mediated by the Ring1b protein and facilitated by
Bmi1, and accordingly, a few studies have concentrated on the regulation of
these proteins.
Bmi1 protein levels are regulated by proteasomal degradation (Ben-
Saadon et al., 2006), and its association with chromatin depends on
phosphorylation which is modulated by cell cycle progression, mitogen
stimulation, or induction of cellular stress (Voncken et al., 1999; Voncken et al.,
2005). Like Bmi1, Ring1b undergoes phosphorylation. This is catalyzed by p38
MAPK and ERK1/2, and this modification is associated with changes in protein
expression downstream of Ring1b (Rao et al., 2009). Ring1b activity is also
88
controlled by its auto-ubiquitylation as well as an association with Mel18, a Bmi1
homolog (Ben-Saadon et al., 2006; Elderkin et al., 2007).
Previous work in our lab revealed that SYT-SSX2 expression in human
osteosarcoma cells (U2OS) causes loss of Bmi1 protein levels due to its
increased degradation (Barco et al., 2009). This results in decreased association
with its functional partner, Ring1b, and global loss of histone H2A ubiquitylation.
These alterations are also associated with increased expression of putative
Polycomb target genes (Barco et al., 2009). These data indicate that SYT-SSX2
functions, in part, by abrogating PRC1 activity resulting in the erroneous
activation of Polycomb-silenced genes. Because the deregulation of Polycomb
activity seems to be the heart of its function, we wanted to determine the
molecular mechanism through which SYT-SSX2 mediates this effect.
89
Results
Bmi1 is phosphorylated in response to various stimuli
Our previous studies in U2OS cells indicate that enhanced degradation of
Bmi1 is the mechanism through which SYT-SSX2 causes transcriptional
deregulation of Polycomb target genes. To confirm this hypothesis, we
determined Bmi1 protein levels in C2C12 cells after transduction with oncogene-
containing expression vectors. In some experiments, we were able to detect a
decrease in the amount of Bmi1 protein in SYT-SSX2-expressing cells compared
to vector controls (data not shown); however, in the majority of experiments this
decrease was not seen, and we noted a slight shift in the mobility of Bmi1 instead
(Figure 10A). The slower migration of Bmi1 in the presence of SYT-SSX2
suggests that Bmi1 is post-translationally modified in C2C12 cells expressing the
oncogene.
Firstly, because we could recapitulate the findings of our previous study,
albeit with less reproducibility than the U2OS system, and secondly, because we
also saw that SYT-SSX2 led to the accumulation of a slower migrating form of
Bmi1 without a decrease in total protein levels, we hypothesized that the
modified Bmi1 may be an intermediate in its degradation pathway. Differences
between U2OS and C2C12 cells in terms of other regulators may account for the
disparity between outcomes, nevertheless, we suspect that similar mechanisms
are at work in both cell types. It has been reported that Bmi1 is subject to
degradation by the ubiquitin-proteasome pathway (Ben-Saadon et al., 2006);
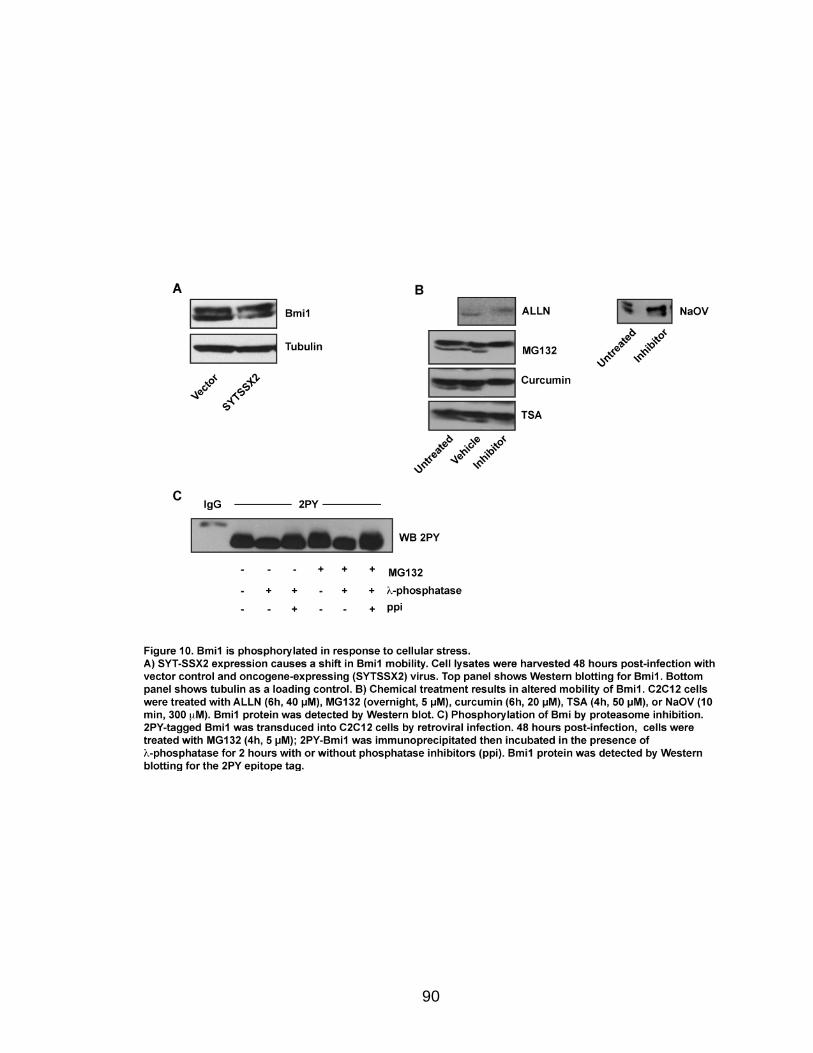
90
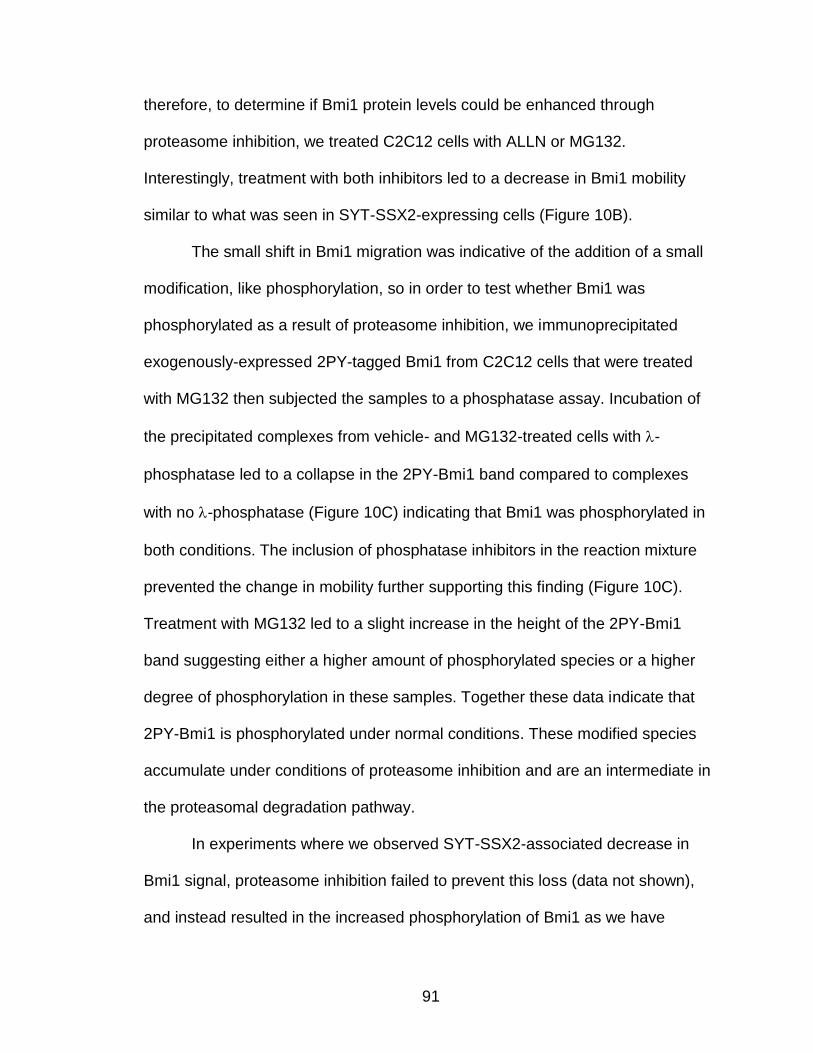
91
therefore, to determine if Bmi1 protein levels could be enhanced through
proteasome inhibition, we treated C2C12 cells with ALLN or MG132.
Interestingly, treatment with both inhibitors led to a decrease in Bmi1 mobility
similar to what was seen in SYT-SSX2-expressing cells (Figure 10B).
The small shift in Bmi1 migration was indicative of the addition of a small
modification, like phosphorylation, so in order to test whether Bmi1 was
phosphorylated as a result of proteasome inhibition, we immunoprecipitated
exogenously-expressed 2PY-tagged Bmi1 from C2C12 cells that were treated
with MG132 then subjected the samples to a phosphatase assay. Incubation of
the precipitated complexes from vehicle- and MG132-treated cells with -
phosphatase led to a collapse in the 2PY-Bmi1 band compared to complexes
with no -phosphatase (Figure 10C) indicating that Bmi1 was phosphorylated in
both conditions. The inclusion of phosphatase inhibitors in the reaction mixture
prevented the change in mobility further supporting this finding (Figure 10C).
Treatment with MG132 led to a slight increase in the height of the 2PY-Bmi1
band suggesting either a higher amount of phosphorylated species or a higher
degree of phosphorylation in these samples. Together these data indicate that
2PY-Bmi1 is phosphorylated under normal conditions. These modified species
accumulate under conditions of proteasome inhibition and are an intermediate in
the proteasomal degradation pathway.
In experiments where we observed SYT-SSX2-associated decrease in
Bmi1 signal, proteasome inhibition failed to prevent this loss (data not shown),
and instead resulted in the increased phosphorylation of Bmi1 as we have

92
described. Because SYT-SSX2 interacts with additional protein complexes
involved in the epigenetic regulation of transcription, we wanted to determine
whether the activity of other epigenetic modifiers was required for Bmi1
regulation. Treatment of C2C12 cells with either curcumin (p300 inhibitor) or
trichostatin A (HDAC inhibitor) also led to a change in mobility of Bmi1 (Figure
10B). This indicates that alterations in the activity of epigenetic regulators that
cooperate with or antagonize Polycomb repression result in modification of Bmi1.
Interestingly, acute inhibition of tyrosine phosphatases also led to the
accumulation of the lower mobility Bmi1 species (Figure 10B). Therefore, in
general, it appears that cellular stress can cause the phosphorylation of Bmi1.
This is in agreement with previous studies showing that Bmi1 becomes
phosphorylated under stressed conditions like growth factor deprivation
(Voncken et al., 2004). These data suggest that Bmi1 may act as a node through
which various signaling networks may converge. More studies are required to
understand the nature of Bmi1 regulation through phosphorylation as well as the
functional consequences of this modification.
Antagonism of Polycomb repression by SYT-SSX2
In previous work, we show that SYT-SSX2-mediated antagonism of
Polycomb repression requires the C-terminal end of SSX2 because of its
targeting function (Barco et al., 2009). Reports by other groups indicate the
importance of the N-terminus in transformation (Nagai et al., 2001); however the
molecular basis for this requirement is unclear. To begin define the mechanistic

93
details of Polycomb antagonism by SYT-SSX2, we made N-terminal deletion
mutants of the fusion lacking the first 20 (NΔ20) and 40 (NΔ40) amino acids of
the SYT component and determined the expression of SYT-SSX2 target genes
that we previously validated in C2C12 cells (Chapter 3, Figure 2). Deletion of the
N-terminus of SYT-SSX2 led to a graded decrease in the expression of Ngfr such
that the larger N-terminal deletion restored Ngfr transcript levels to basal. This is
in contrast to Dll1 and Igf2 which are increased in cells expressing the NΔ20
mutant and either return to basal levels (Dll1) or a level nearly equivalent with
full-length SYT-SSX2 (Igf2) (Figure 11A). These differential effects are rather
confounding, so as a first step to understand the effect of N-terminal deletion on
transcription, we decided to determine if these mutants retained their ability to
bind to known SYT-SSX interactors. In preliminary studies, we tested the ability
of SYT-SSX2 and its N-terminal mutants to associate with Brg1 by
immunoprecipitation. SYT-SSX2 could co-precipitate Brg1, and this ability to bind
Brg1 falls below basal levels in the NΔ20 mutant and is lost in the NΔ40 mutant
(Figure 11C, top left panel). These data indicate that the ability to bind Brg1 may
not be necessary for activation by SYT-SSX2 in all cases. Further experiments
are required for the validation of these findings.
Our previous studies focused on the global regulation of Bmi1 and
Polycomb by SYT-SSX2 (Barco et al., 2009), but the present data suggests that
while global changes can be detected, the mechanism of how these changes
occur are more likely to be discovered by studies of specific target genes. To
understand how SYT-SSX2 antagonizes Polycomb complex activity locally, we
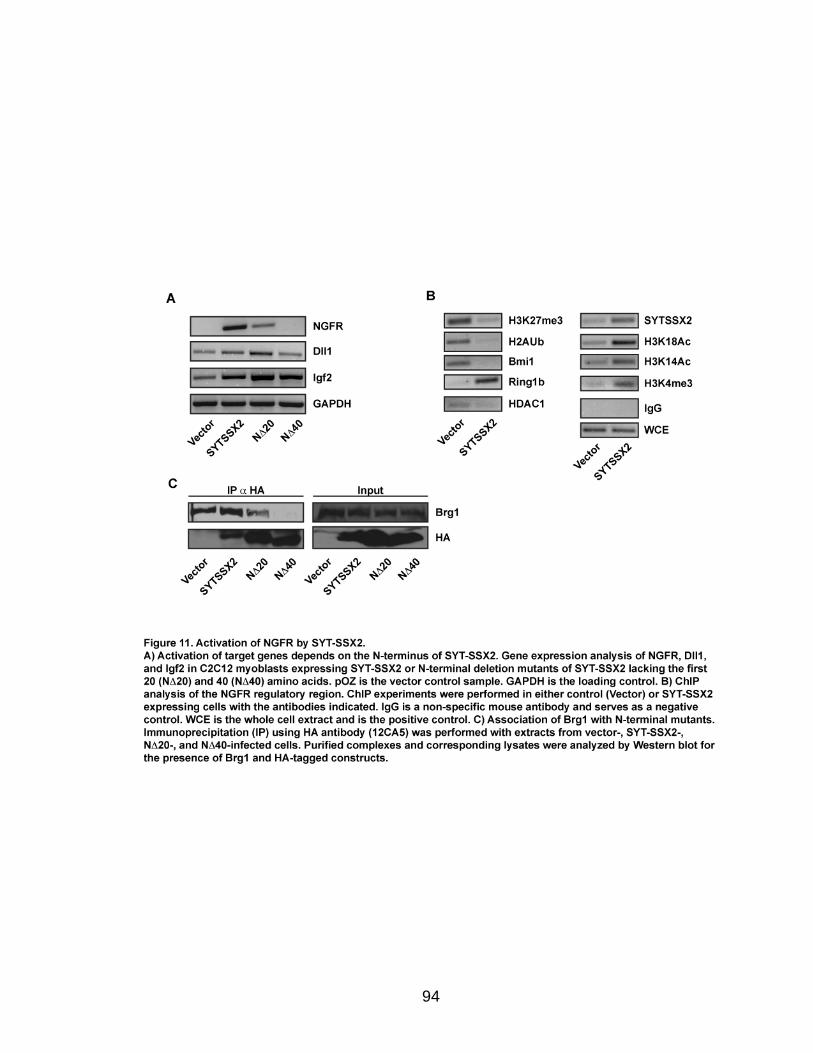
94

95
decided to study the Ngfr gene. We were able to validate Polycomb-mediated
silencing of Ngfr in C2C12 cells (Figure 11B). By chromatin immunprecipitation
(ChIP) experiments, we detected the presence of Polycomb-associated histone
modifications (H3K27me3 and H2AUb) and members of the PRC1 complex
(Bmi1 and Ring1b) at the Ngfr promoter region in control cells (Figure 11B).
When SYT-SSX2 was expressed, the levels of H3K27me3, H2AUb, and Bmi1 at
the Ngfr gene were decreased indicating loss of Polycomb-mediated silencing. In
addition, we observed lower association of HDAC1 with the Ngfr gene (Figure
11B). Conversely, ChIP experiments to detect markers of transcriptional
activation (H3K18Ac, H3K14Ac, and H3K4me3) revealed an increase in these
modifications in cells expressing SYT-SSX2. To validate that Ngfr is targeted by
the oncogene, we were also able to demonstrate its presence by ChIP.
Interestingly, the signal in the Ring1b ChIP increases in the presence of SYT-
SSX2. This phenomenon was reproduced in multiple experiments; however, we
have not been able to determine the mechanism by which this occurs.
Altogether, we show that the Ngfr gene is directly targeted by the SYT-SSX2
oncoprotein and that its expression is associated with increased expression as
well as alterations in the configuration of the promoter region. Repressive
proteins and histone marks are lost, while activating marks are gained. Additional
studies are required in order to understand the interplay of SYT-SSX2 and its
associated proteins with the Polycomb complexes at this locus that result in gene
expression.
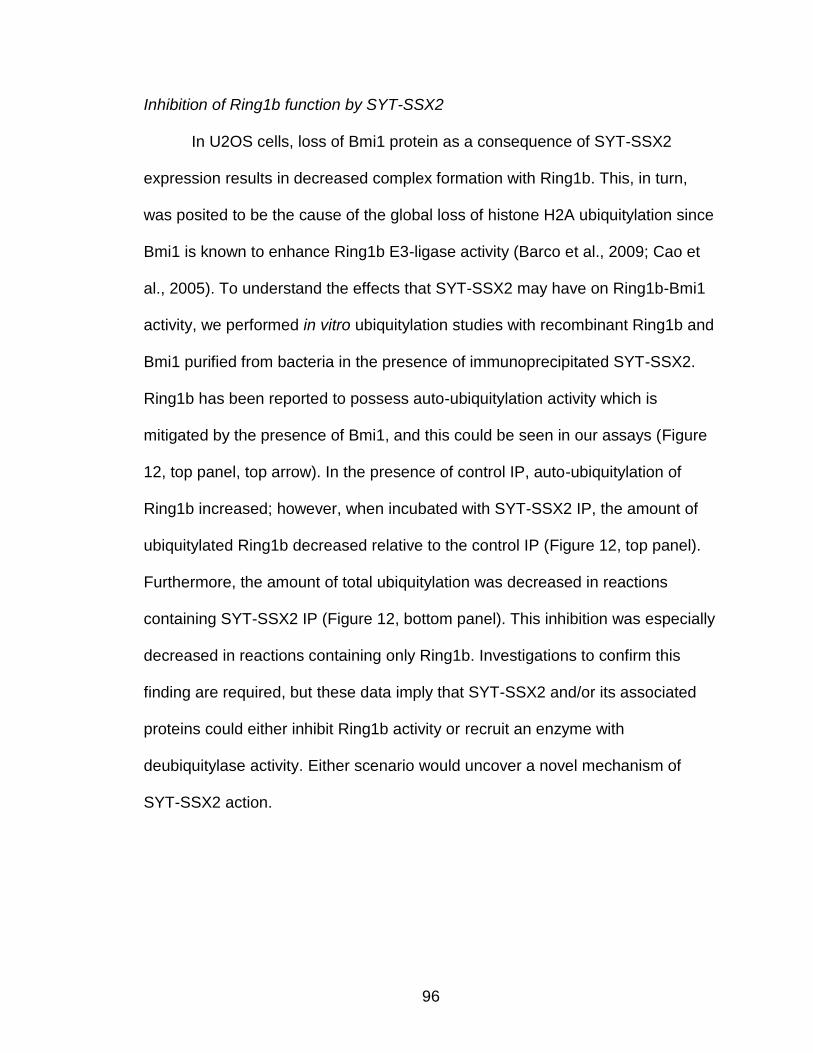
96
Inhibition of Ring1b function by SYT-SSX2
In U2OS cells, loss of Bmi1 protein as a consequence of SYT-SSX2
expression results in decreased complex formation with Ring1b. This, in turn,
was posited to be the cause of the global loss of histone H2A ubiquitylation since
Bmi1 is known to enhance Ring1b E3-ligase activity (Barco et al., 2009; Cao et
al., 2005). To understand the effects that SYT-SSX2 may have on Ring1b-Bmi1
activity, we performed in vitro ubiquitylation studies with recombinant Ring1b and
Bmi1 purified from bacteria in the presence of immunoprecipitated SYT-SSX2.
Ring1b has been reported to possess auto-ubiquitylation activity which is
mitigated by the presence of Bmi1, and this could be seen in our assays (Figure
12, top panel, top arrow). In the presence of control IP, auto-ubiquitylation of
Ring1b increased; however, when incubated with SYT-SSX2 IP, the amount of
ubiquitylated Ring1b decreased relative to the control IP (Figure 12, top panel).
Furthermore, the amount of total ubiquitylation was decreased in reactions
containing SYT-SSX2 IP (Figure 12, bottom panel). This inhibition was especially
decreased in reactions containing only Ring1b. Investigations to confirm this
finding are required, but these data imply that SYT-SSX2 and/or its associated
proteins could either inhibit Ring1b activity or recruit an enzyme with
deubiquitylase activity. Either scenario would uncover a novel mechanism of
SYT-SSX2 action.
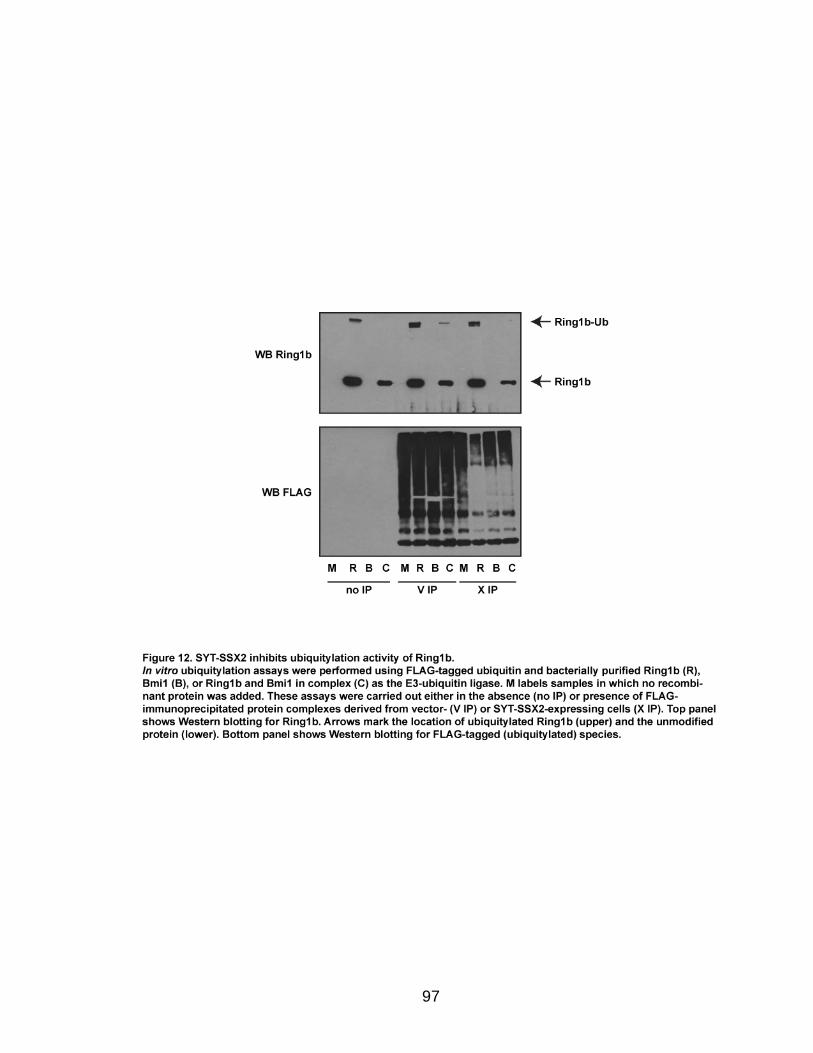
97
98
Conclusions
The experiments described here provide a foundation for future studies to
elucidate the molecular mechanism of SYT-SSX2 antagonism of Polycomb-
mediated gene silencing. Bmi1 is phosphorylated in response to a number of
different stimuli, including SYT-SSX2 expression. Phosphorylation of Bmi1
correlates with its dissociation from chromatin during the cell cycle (Voncken et
al., 2004); therefore, this modification may explain how Bmi1 is lost from the Ngfr
promoter. The fact that Bmi1 is phosphorylated after inhibition of HAT and HDAC
activity suggests that changes in the epigenetic environment in general may also
cause this event. Knock-down of Suz12 in C2C12 cells results in the re-
distribution of Bmi1 such that the level of Bmi1 bound at genes where PRC1 is
already resident increases without an overall change in protein level (Asp et al.,
2011). Although it is hypothesized that this guards against the inappropriate
expression of lineage-specific genes (Asp et al., 2011), the relocation of Bmi1
may be a more general mechanism that the cell (and perhaps a stem and
progenitor cells in particular) uses to control the accessibility of certain subsets of
genes when challenged with a given insult or signal. In consequence, signaling to
Bmi1 may be one way that various pathways can regulate the expression of
Polycomb target genes.
The initial studies we described here using the N-terminal SYT-SSX2
mutants and the profile of epigenetic markers at the Ngfr promoter provide a
background for understanding the mechanism of SYT-SSX2 function. We show
99
that Ngfr is a Polycomb target in C2C12 cells and that its repression is reversed
by SYT-SSX2. Our data also indicate that Brg1 binding may not be critical for
Ngfr expression; however, its ability to associate with SYT-SSX2 correlates
strongly with activation of this gene. Thus, Brg1 activity may be required for this
process, but recruitment by other mechanisms, like histone acetylation, may
compensate for the inability to associate with SYT-SSX2. Surprisingly, we also
detected differences in expression among the genes we tested in their
requirement for the N-terminal 20 amino acids of SYT-SSX2. This may reflect
differences in the mechanism of regulation at these particular genes. From our
ChIP and ChIPSeq data (Chapters 3 and 4), SYT-SSX2 binds in close proximity
to the TSS of Ngfr but not Dll1 or Igf2. This suggests that increased expression of
these genes may be indirect or due to long-range interactions that are still poorly
understood.
The change in histone modifications at the Ngfr promoter occurs as
expected for a switch from the silenced to an active state. How SYT-SSX2
mediates these changes remains to be clarified. Histone acetylation is likely due
to interaction of SYT-SSX2 with p300, and p300 activity may also directly inhibit
H3K27me3 through acetylation of the same residue (Eid et al., 2000; Tie et al.,
2009). Lysine 27 acetylation in Drosophila requires Trx activity suggesting that
recruitment of MLL occurs prior to p300 catalytic function. Furthermore, removal
of the H3K27me3 mark necessarily precedes acetylation and requires the activity
of a demethylase like UTX or JMJD3 (Lee et al., 2007; Agger et al., 2007).
Additional studies regarding the sequence of events that is orchestrated by SYT-
100
SSX2 at the Ngfr promoter and the identification of novel binding partners will
contribute further insight into this mechanism.
Our preliminary data from in vitro ubiquitylation assays indicate the
inhibition of Ring1b ligase activity or a deubiquitylation activity recruited by SYT-
SSX2 and/or its associated proteins. Thus far we have focused our studies on
the dynamics of Bmi1 as changes to this protein have been the most visible, and
we hypothesize that the loss of Bmi1 from PRC1 leads to the derepression of
Polycomb silencing. Indeed, our ChIP studies at the Ngfr gene indicate that
Ring1b is retained at the promoter, so we conjecture that the loss of its partner
protein caused the decrease in H2AUb making transcription permissible. In light
of the present data, we must now consider the possibility that SYT-SSX2, either
on its own or by the recruitment of other proteins, actively opposes Ring1b
function in addition to any effects on Bmi1. A histone H2A deubiquitylase that
opposes PRC1 has been identified in flies and is homologous to the mammalian
BAP1 (Scheuermann et al., 2010). In addition, USP7 is able to deubiquitylate
Ring1b and thus deactivate it (de Bie et al., 2010). It will be interesting to
determine if SYT-SSX2 can interact with either of these proteins or others with
similar functions.
In summary, the derepression of Polycomb target genes by SYT-SSX2
may take place through both passive and active mechanisms. Understanding
how this is facilitated by the fusion protein may highlight possible avenues for
therapeutic intervention as well as elucidate the regulation of Polycomb in normal
conditions.
101
CHAPTER VI
DISCUSSION AND FUTURE DIRECTIONS
Cellular reprogramming by SYT-SSX2
Taken as a whole, the data presented in this study support cellular
reprogramming as the mechanism by which SYT-SSX2 induces transformation.
The remarkable number of neural and developmental genes shared by the
myoblasts and the hMSCs showcases the dominant programming effect of SYT-
SSX2. Imposing a lineage commitment on stem/progenitor cells appears to be a
recurrent feature of sarcoma-associated translocations (Mackall et al., 2004).
One prominent example is PAX3-FKHR, the rhabdomyosarcoma fusion product
that drives NIH3T3 fibroblasts into a myogenic program (Khan et al., 1999). It is
thought to induce tumorigenesis through stimulation of lineage commitment and
simultaneous prevention of terminal differentiation (Charytonowicz et al., 2009).
Whether SYT-SSX2 acts in a similar manner remains to be seen. Regardless,
the dominant effect on cellular identity is postulated to be a part of oncogenesis
initiation by sarcoma-associated translocations and a necessary step toward
malignant transformation (Mackall et al., 2004).
These observations allow us to speculate on the cell-of-origin for this
malignancy. The capacity of SS cells to be differentiated into mesenchymal and
neural cell types (Naka et al, 2010; Ishibe et al, 2008) implies that the disease
102
originates in multipotent cells from either of these lineages. Our data indicate that
the neural features are caused primarily by SYT-SSX2 itself, irrespective of
cellular context, so the target cell may not necessarily be of neural origin.
Expression of SYT-SSX2 in multiple lineages in mice recapitulates human
synovial sarcoma in all cases, attesting to the dominant program established by
the oncogene and its capacity to transform different cell types (Haldar et al.,
2009). Additionally, expression of SYT-SSX2 in committed myogenic progenitor
cells results in tumor formation in mice suggesting that the cell-of-origin could be
a more differentiated entity. However, in this model, genomic plasticity was
essential, as SYT-SSX2 was non-tumorigenic in differentiated muscle cells
(Haldar et al., 2007).
Epigenetic mechanism of SYT-SSX2 targeting and function
A major mechanism of recruitment occurs through interactions with PRCs,
but like other transcriptional regulators, binding of SYT-SSX2 does not
completely correlate with changes in gene expression. Studies on cellular
reprogramming as well as on alterations in chromatin structure during
differentiation indicate that transcription factor binding and/or differential histone
modification signatures pre-label genes that may undergo changes in expression
when given the proper stimulus (Koche et al., 2010; Orford et al., 2008). Thus,
genes that are bound but whose expression is unaltered may be “poised” for
activation in response to certain signaling events. Indeed, the dependence of the
103
neural phenotype on FGF signaling supports such a scenario. In this model,
binding by SYT-SSX2 alters the chromatin structure of neural genes into a
poised state, and signaling downstream of FGFR2 induces the activation of these
targets. This suggests that transcriptional activity is directed by extracellular
signaling, and stimulation of other pathways will result in the generation of
distinct phenotypes. Comprehension of the complete transformative program will
consider these alternate fates.
Latent programs primed by SYT-SSX2 will also have important
ramifications on disease progression and treatment response. The studies
described here are concerned with the acute phase of transformation by the
oncogene and document how targeting of the chimeric protein dictates early
events. Genes that are involved in tumor maintenance during later stages of
progression and/or metastasis could also be pre-marked by SYT-SSX2. It may
then be possible to predict tumor behavior by knowing the identities of those
genes and determining pathways that induce their activation.
Molecular mechanism of Polycomb derepression
Because of its interaction with multiple epigenetic regulatory complexes,
SYT-SSX2 stands as the central node that organizes transcriptional deregulation.
Transcription factors possess domains that allow them to interact with multiple
downstream effectors and thus orchestrate transcription (Frietze and Farnham,
2011). This includes transactivation domains and other protein-protein interaction

104
modules with the capability to bind activators and repressors. Thus, one protein
through the same domain can elicit distinct effects (Frietze and Farnham, 2011).
The SNH domain of SYT may perform this function since it can interact with both
p300 and mSin3a (Eid et al., 2000; Ito et al., 2004). Differential binding might be
controlled by upstream extracellular cues like the FGF or other signaling
pathways providing a direct link between the microenvironment and the control of
Polycomb. In this way, SYT-SSX2 can execute multiple functions with diverse
effects at a target gene.
Studying the molecular function of SYT-SSX2 will also illuminate the
sequential recruitment of factors necessary to counteract Polycomb-mediated
silencing. Understanding this process has considerable implications for normal
cellular reprogramming (e.g. conversion of fibroblasts to induced pluripotent stem
cells). Polycomb complexes are part of a larger epigenetic program that must be
conformed to the structure of the target cell type in order for reprogramming to be
complete (Gaspar-Maia et al., 2011). Our study on SYT-SSX2 suggests that
targeted inhibition of PcG proteins in combination with specific signals can
produce a distinct cell fate. In elaborating how SYT-SSX2 initiates and controls
this process, and by identifying how genes within a specific program are
targeted, it will become clearer how to change the epigenetic structure of one cell
to that of an alternate lineage. Ultimately, this will improve the efficiency of
cellular reprogramming.
Our data indicate that transformation by SYT-SSX2 occurs through
improper reprogramming of the nucleus most likely via modulation of the
105
activities of epigenetic regulators with cooperation from signaling pathways. This
has important implications in the treatment of synovial sarcoma. Although
epigenetic reprogramming is a slow process, once complete, it is persistent.
Therefore, even in the absence of the initiating signal (i.e. oncogene expression),
this abnormal nuclear program remains intact (Abollo-Jiménez et al., 2010;
Castellanos et al., 2010). Indeed, this is characteristic of normal Polycomb-
mediated gene repression (Schuettengruber et al., 2007; Kerppola, 2009)
suggesting that treatment of synovial sarcoma could become resistant to SYT-
SSX-specific therapeutics and that the most effective therapies will instead target
the aberrant program.
Future Directions
Molecular mechanism of SYT-SSX2 function
The extracellular signals that govern differentiation and development are
well-characterized for many tissues, yet the manner in which these pathways
regulate Polycomb function is incompletely understood. The data presented in
this study indicate that SYT-SSX2 activity relies on extracellular signaling,
specifically the FGF pathway. Contributions from other factors in the
microenvironment are possible, and future efforts should delineate the
relationship between signaling pathways and the control of transcription by the
fusion protein. Although associated with a disease phenotype, the cycle of events
directed by SYT-SSX2 with input from the FGF pathway likely reflect normal
106
mechanisms. Thus it will be informative for researchers who are interested in the
transcriptional control of differentiation and development as well as those
investigating possible therapeutic interventions for SS.
Three-dimensional structure of chromatin
Polycomb and SWI/SNF mediate higher-order chromatin configurations.
Many binding sites in our ChIPSeq analysis occur in intergenic regions, so it will
be fascinating to determine how SYT-SSX2 affects three-dimensional chromatin
structure. Chromosome conformation capture experiments will build a more
complete picture of SYT-SSX2 function. These studies will also demonstrate
whether SYT-SSX2 modulates long-range transcriptional regulation. As a
preliminary finding, our ChIPSeq analysis revealed the association of SYT-SSX2
within a region of the H19-Igf2 locus between the 2 genes that drives expression
of Igf2 in mesodermal tissues (Drewell et al., 2002). As a whole, these
investigations will yield valuable information concerning the mechanism by which
chromatin architecture controls transcription.
Therapy and cellular reprogramming
The development of effective therapeutics in the treatment of SS will
require a deep understanding of the tumorigenic program initiated by SYT-SSX2,
and it will be necessary to establish how this predisposes the cell to respond to
therapeutic interventions. Additional studies should focus on how the SYT-SSX2
program is maintained, whether it can be reversed, and the nature of changes in
107
gene expression and fusion protein targeting following various stimuli. Overall,
these studies will advance our knowledge of how cellular identity is controlled
and how the pathways that govern differentiation and plasticity may be exploited
in cancer. This will lead to the generation of new therapeutics with increased
ability to target the reprogrammed cells essential for tumor propagation.

108
APPENDIX A
SUPPLEMENTARY METHODS
In vitro phosphorylation
Bacterially purified Ring1b, Bmi1, or Ring1b-Bmi1 complex was incubated with
25 µL pOZ- or SYT-SSX2-expressing cell nuclear extract in kinase assay buffer
(20 mM Tris pH 8.0, 150 mM NaCl, 2 mM DTT, 20 mM MgCl2, 40 µM ATP [plus 5
µCi -32P-ATP for hot kinase assay]) with protease and phosphatase inhibitors at
30˚C for 30 minutes. Reactions were stopped by the addition of 2x sample buffer.
In vitro acetylation
Acetylation assays were performed as previously described (Gu and Roeder,
1997) with some modification. Bacterially purified Ring1b (2.5 µg), Bmi1 (2.5 µg),
or Ring1b-Bmi1 complex (2.5 µg each monomer) were incubated in assay buffer
(50 mM HEPES pH 7.9, 10% glycerol, 1 mM DTT, 1 mM PMSF, 10 mM sodium
butyrate, 1 µL 14C-acetyl CoA [60 mCi/mmol]) with 100 ng of recombinant human
p300 catalytic domain (Enzo Life Sciences, Plymouth Meeting, PA) and 2 µg
HeLa nucleosomes for 1 hour at 30˚C. Reactions were stopped by the addition of
2x sample buffer. Samples were separated using SDS-PAGE, gels were
Coomassie stained, dried, and proteins were visualized by autoradiography.
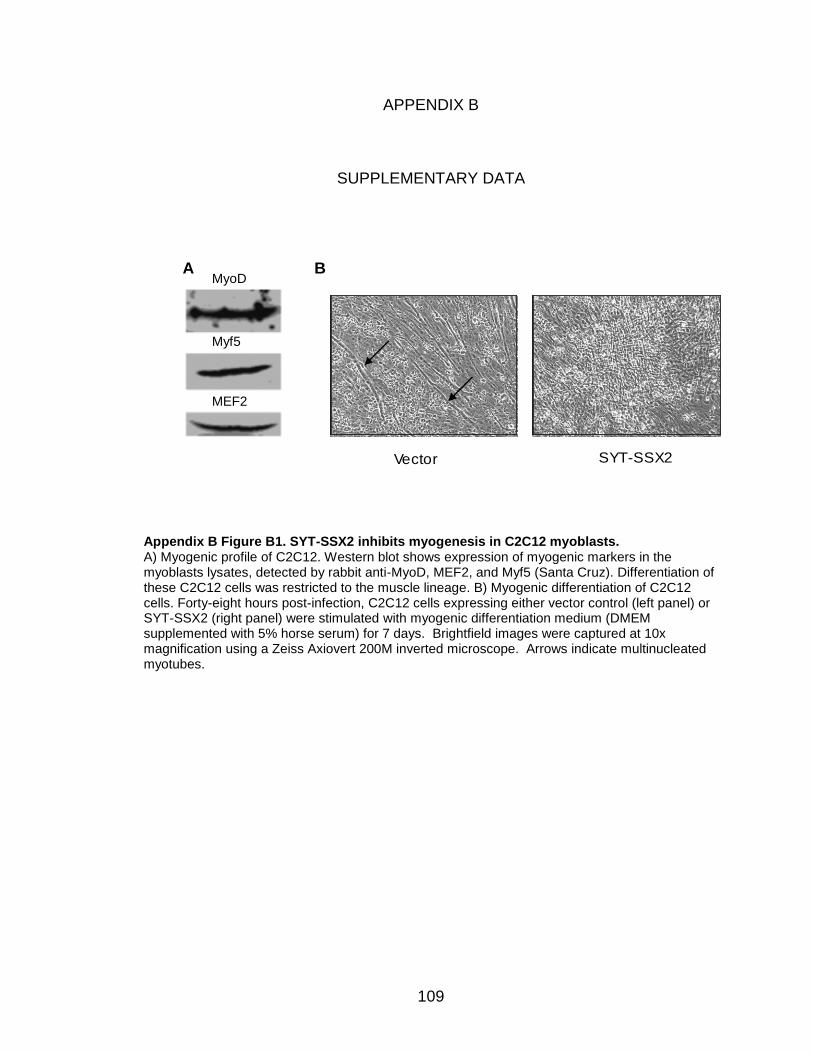
109
APPENDIX B
SUPPLEMENTARY DATA
Appendix B Figure B1. SYT-SSX2 inhibits myogenesis in C2C12 myoblasts. A) Myogenic profile of C2C12. Western blot shows expression of myogenic markers in the myoblasts lysates, detected by rabbit anti-MyoD, MEF2, and Myf5 (Santa Cruz). Differentiation of these C2C12 cells was restricted to the muscle lineage. B) Myogenic differentiation of C2C12 cells. Forty-eight hours post-infection, C2C12 cells expressing either vector control (left panel) or SYT-SSX2 (right panel) were stimulated with myogenic differentiation medium (DMEM supplemented with 5% horse serum) for 7 days. Brightfield images were captured at 10x magnification using a Zeiss Axiovert 200M inverted microscope. Arrows indicate multinucleated myotubes.
SYT-SSX2Vector
MyoD
Myf5
MEF2
A B
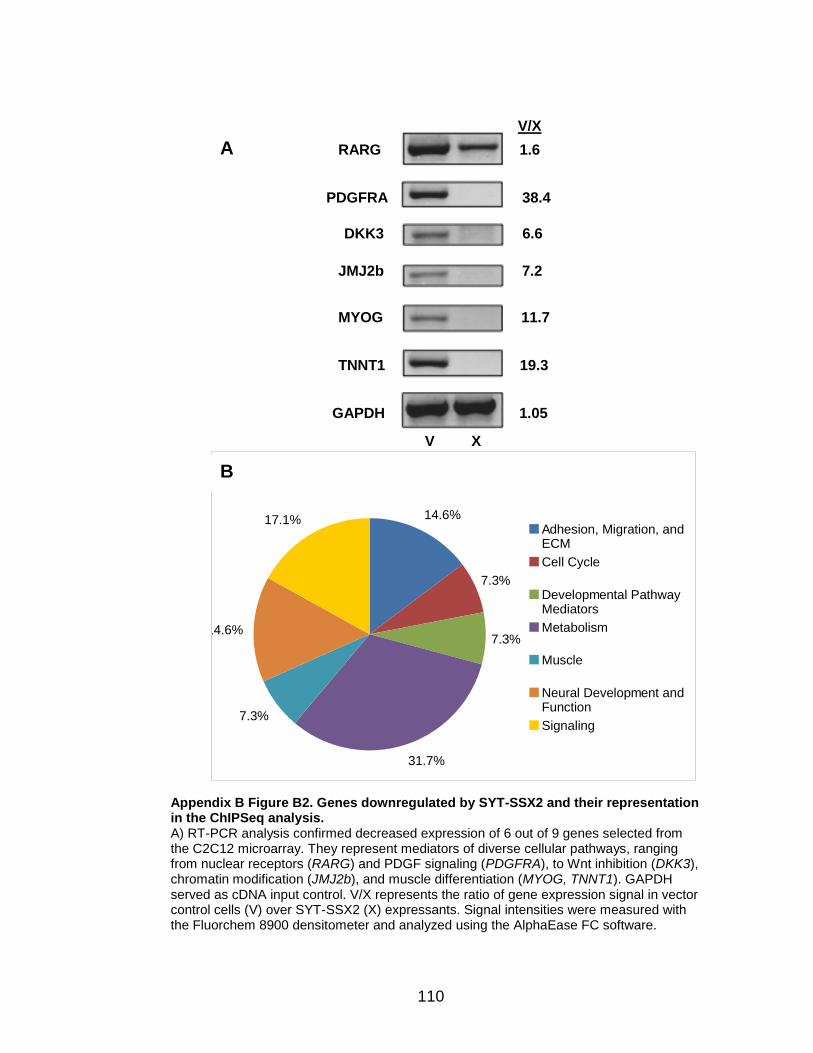
110
14.6%
7.3%
7.3%
31.7%
7.3%
14.6%
17.1%Adhesion, Migration, andECM
Cell Cycle
Developmental PathwayMediators
Metabolism
Muscle
Neural Development andFunction
Signaling
RARG 1.6
GAPDH 1.05
TNNT1 19.3
PDGFRA 38.4
DKK3 6.6
JMJ2b 7.2
MYOG 11.7
V/X
V X
A
B
Appendix B Figure B2. Genes downregulated by SYT-SSX2 and their representation in the ChIPSeq analysis. A) RT-PCR analysis confirmed decreased expression of 6 out of 9 genes selected from the C2C12 microarray. They represent mediators of diverse cellular pathways, ranging from nuclear receptors (RARG) and PDGF signaling (PDGFRA), to Wnt inhibition (DKK3), chromatin modification (JMJ2b), and muscle differentiation (MYOG, TNNT1). GAPDH served as cDNA input control. V/X represents the ratio of gene expression signal in vector control cells (V) over SYT-SSX2 (X) expressants. Signal intensities were measured with the Fluorchem 8900 densitometer and analyzed using the AlphaEase FC software.
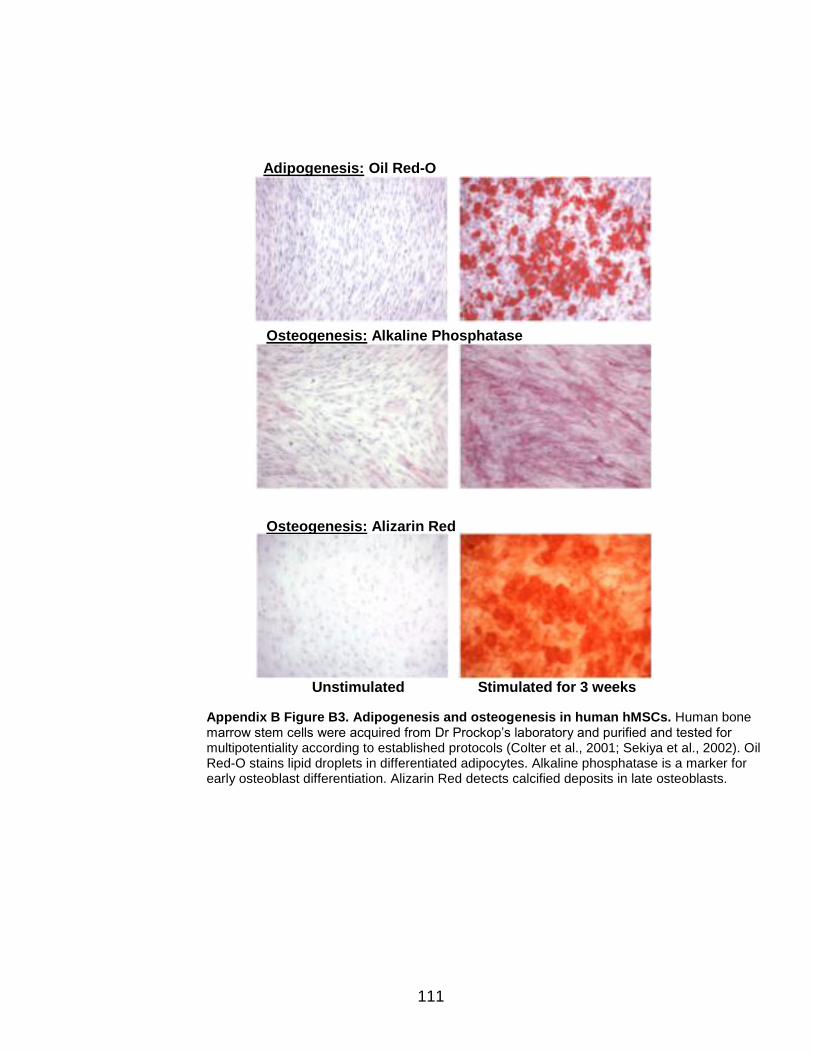
111
Adipogenesis: Oil Red-O
Osteogenesis: Alkaline Phosphatase
Osteogenesis: Alizarin Red
Unstimulated Stimulated for 3 weeks
Appendix B Figure B3. Adipogenesis and osteogenesis in human hMSCs. Human bone marrow stem cells were acquired from Dr Prockop‟s laboratory and purified and tested for multipotentiality according to established protocols (Colter et al., 2001; Sekiya et al., 2002). Oil Red-O stains lipid droplets in differentiated adipocytes. Alkaline phosphatase is a marker for early osteoblast differentiation. Alizarin Red detects calcified deposits in late osteoblasts.
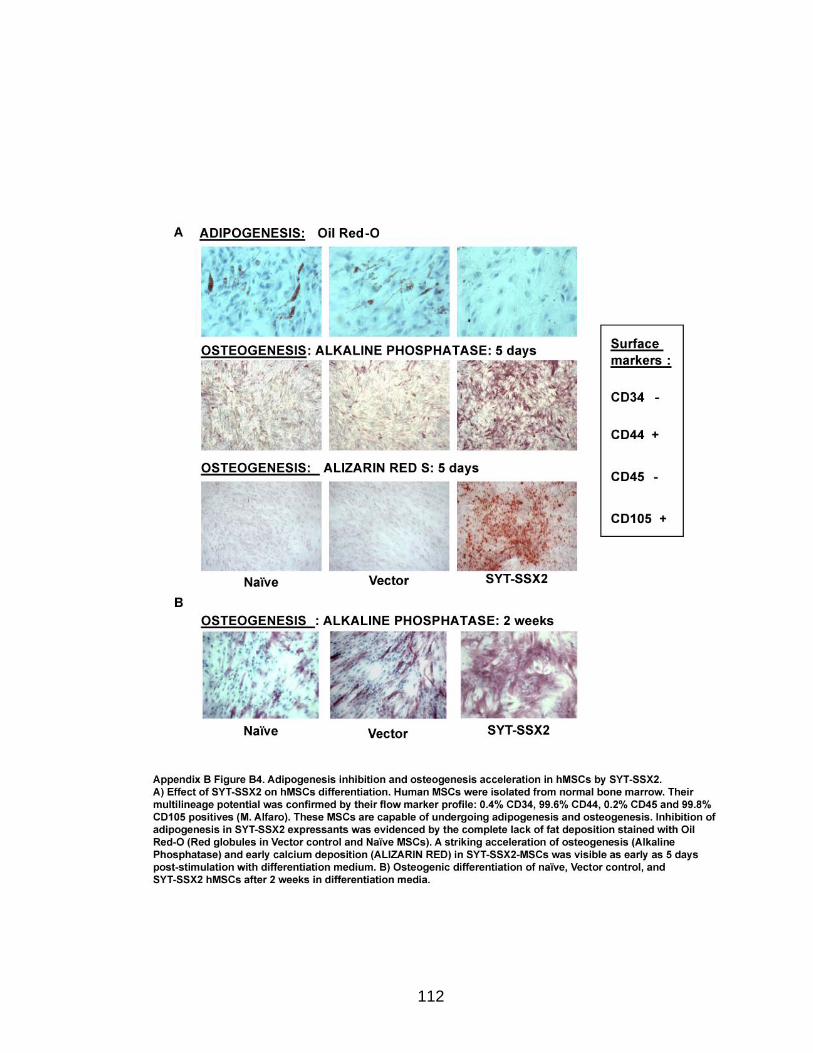
112
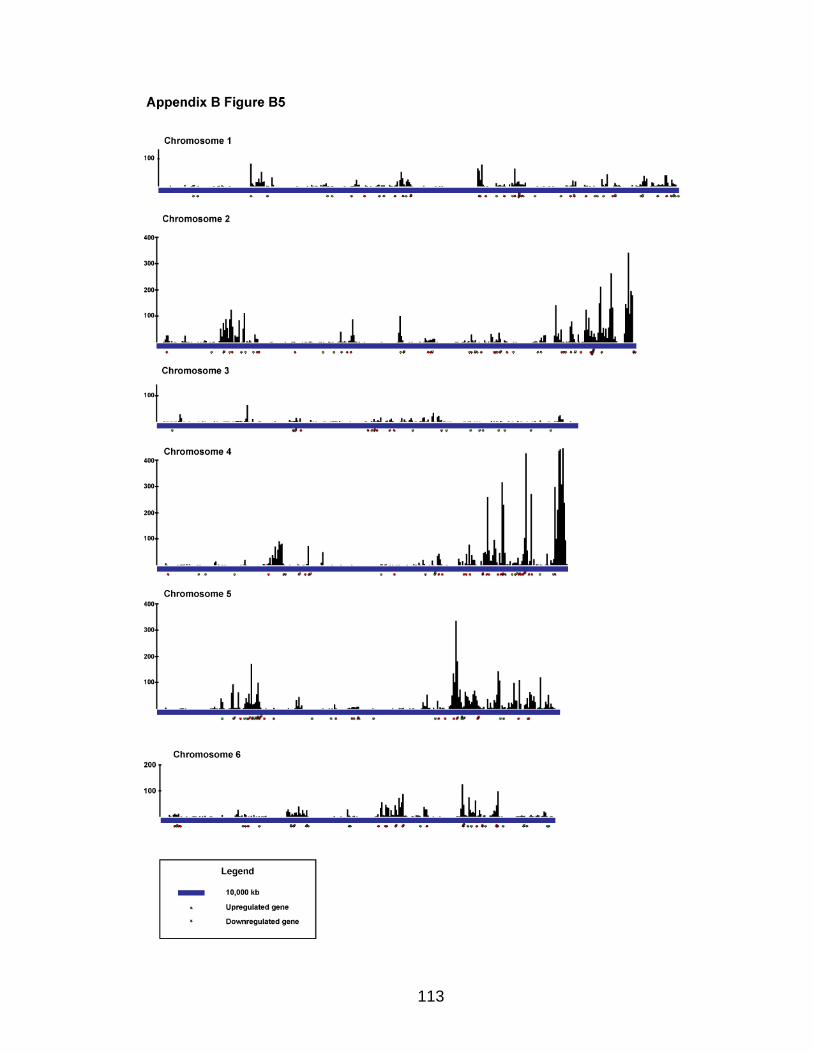
113
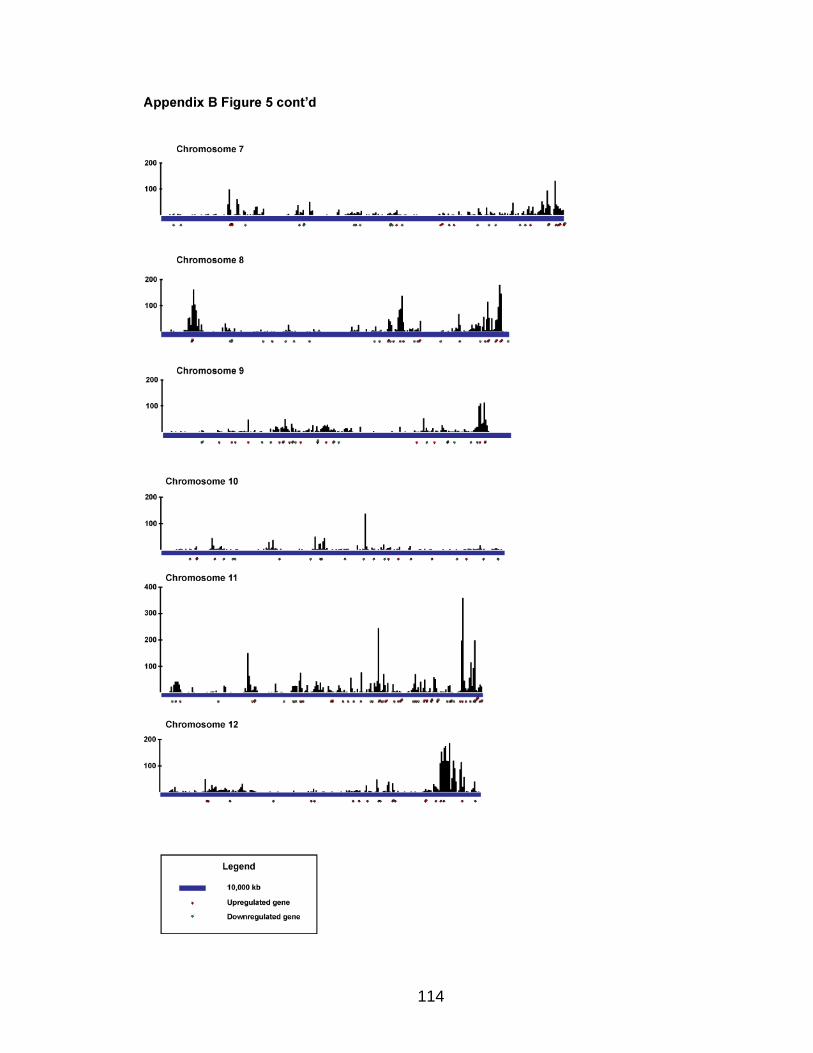
114
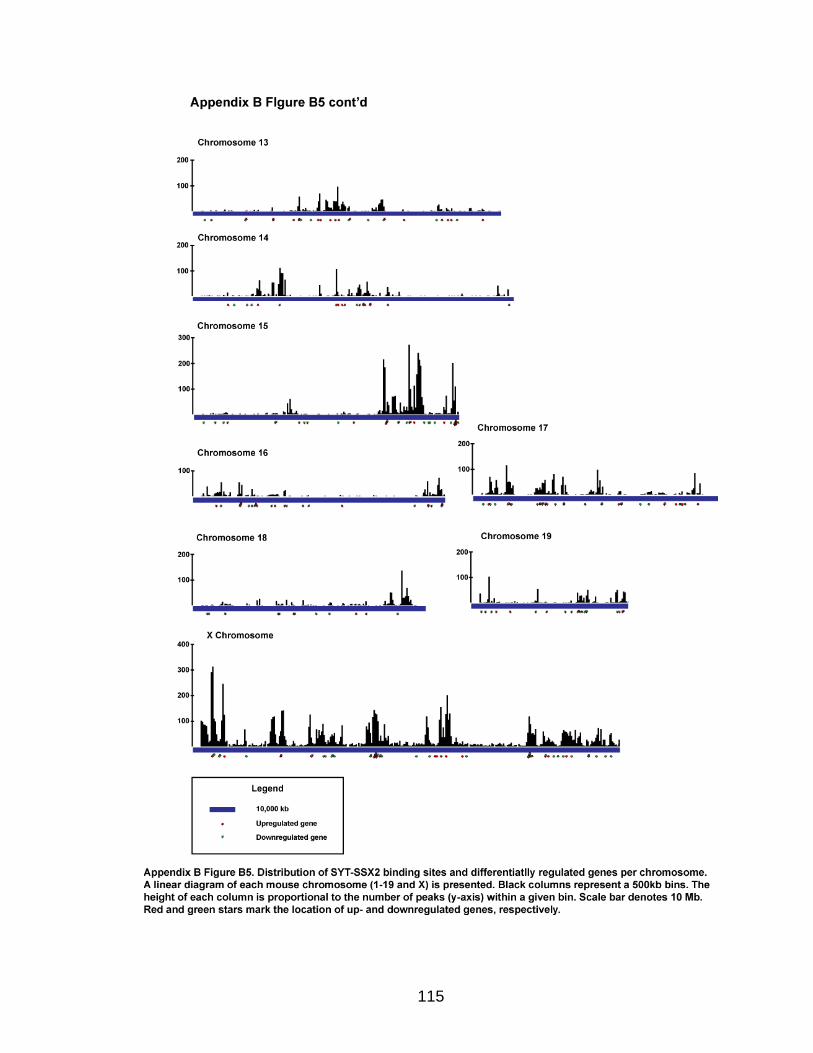
115
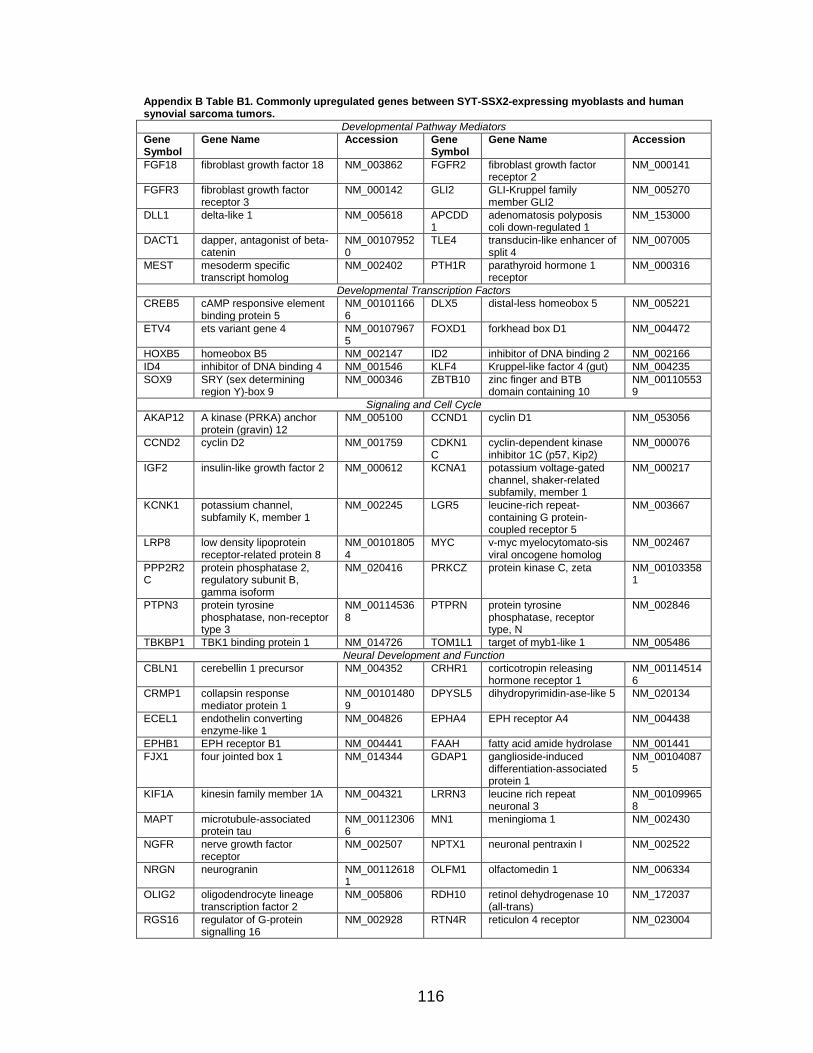
116
Appendix B Table B1. Commonly upregulated genes between SYT-SSX2-expressing myoblasts and human synovial sarcoma tumors.
Developmental Pathway Mediators
Gene Symbol
Gene Name Accession Gene Symbol
Gene Name Accession
FGF18 fibroblast growth factor 18 NM_003862 FGFR2 fibroblast growth factor receptor 2
NM_000141
FGFR3 fibroblast growth factor receptor 3
NM_000142 GLI2 GLI-Kruppel family member GLI2
NM_005270
DLL1 delta-like 1 NM_005618 APCDD1
adenomatosis polyposis coli down-regulated 1
NM_153000
DACT1 dapper, antagonist of beta-catenin
NM_001079520
TLE4 transducin-like enhancer of split 4
NM_007005
MEST mesoderm specific transcript homolog
NM_002402 PTH1R parathyroid hormone 1 receptor
NM_000316
Developmental Transcription Factors
CREB5 cAMP responsive element binding protein 5
NM_001011666
DLX5 distal-less homeobox 5 NM_005221
ETV4 ets variant gene 4 NM_001079675
FOXD1 forkhead box D1 NM_004472
HOXB5 homeobox B5 NM_002147 ID2 inhibitor of DNA binding 2 NM_002166
ID4 inhibitor of DNA binding 4 NM_001546 KLF4 Kruppel-like factor 4 (gut) NM_004235
SOX9 SRY (sex determining region Y)-box 9
NM_000346 ZBTB10 zinc finger and BTB domain containing 10
NM_001105539
Signaling and Cell Cycle
AKAP12 A kinase (PRKA) anchor protein (gravin) 12
NM_005100 CCND1 cyclin D1 NM_053056
CCND2 cyclin D2 NM_001759 CDKN1C
cyclin-dependent kinase inhibitor 1C (p57, Kip2)
NM_000076
IGF2 insulin-like growth factor 2 NM_000612 KCNA1 potassium voltage-gated channel, shaker-related subfamily, member 1
NM_000217
KCNK1 potassium channel, subfamily K, member 1
NM_002245 LGR5 leucine-rich repeat-containing G protein-coupled receptor 5
NM_003667
LRP8 low density lipoprotein receptor-related protein 8
NM_001018054
MYC v-myc myelocytomato-sis viral oncogene homolog
NM_002467
PPP2R2C
protein phosphatase 2, regulatory subunit B, gamma isoform
NM_020416 PRKCZ protein kinase C, zeta NM_001033581
PTPN3 protein tyrosine phosphatase, non-receptor type 3
NM_001145368
PTPRN protein tyrosine phosphatase, receptor type, N
NM_002846
TBKBP1 TBK1 binding protein 1 NM_014726 TOM1L1 target of myb1-like 1 NM_005486
Neural Development and Function
CBLN1 cerebellin 1 precursor NM_004352 CRHR1 corticotropin releasing hormone receptor 1
NM_001145146
CRMP1 collapsin response mediator protein 1
NM_001014809
DPYSL5 dihydropyrimidin-ase-like 5 NM_020134
ECEL1 endothelin converting enzyme-like 1
NM_004826 EPHA4 EPH receptor A4 NM_004438
EPHB1 EPH receptor B1 NM_004441 FAAH fatty acid amide hydrolase NM_001441
FJX1 four jointed box 1 NM_014344 GDAP1 ganglioside-induced differentiation-associated protein 1
NM_001040875
KIF1A kinesin family member 1A NM_004321 LRRN3 leucine rich repeat neuronal 3
NM_001099658
MAPT microtubule-associated protein tau
NM_001123066
MN1 meningioma 1 NM_002430
NGFR nerve growth factor receptor
NM_002507 NPTX1 neuronal pentraxin I NM_002522
NRGN neurogranin NM_001126181
OLFM1 olfactomedin 1 NM_006334
OLIG2 oligodendrocyte lineage transcription factor 2
NM_005806 RDH10 retinol dehydrogenase 10 (all-trans)
NM_172037
RGS16 regulator of G-protein signalling 16
NM_002928 RTN4R reticulon 4 receptor NM_023004
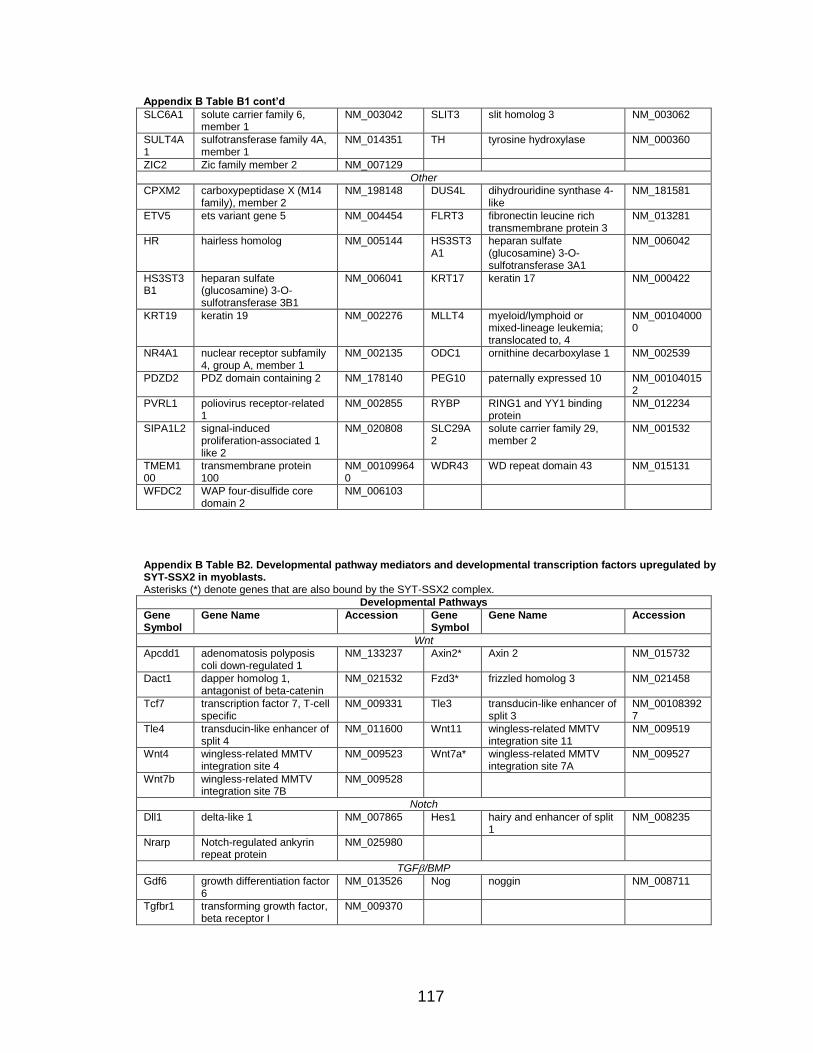
117
Appendix B Table B1 cont’d
SLC6A1 solute carrier family 6, member 1
NM_003042 SLIT3 slit homolog 3 NM_003062
SULT4A1
sulfotransferase family 4A, member 1
NM_014351 TH tyrosine hydroxylase NM_000360
ZIC2 Zic family member 2 NM_007129
Other
CPXM2 carboxypeptidase X (M14 family), member 2
NM_198148 DUS4L dihydrouridine synthase 4-like
NM_181581
ETV5 ets variant gene 5 NM_004454 FLRT3 fibronectin leucine rich transmembrane protein 3
NM_013281
HR hairless homolog NM_005144 HS3ST3A1
heparan sulfate (glucosamine) 3-O-sulfotransferase 3A1
NM_006042
HS3ST3B1
heparan sulfate (glucosamine) 3-O-sulfotransferase 3B1
NM_006041 KRT17 keratin 17 NM_000422
KRT19 keratin 19 NM_002276 MLLT4 myeloid/lymphoid or mixed-lineage leukemia; translocated to, 4
NM_001040000
NR4A1 nuclear receptor subfamily 4, group A, member 1
NM_002135 ODC1 ornithine decarboxylase 1 NM_002539
PDZD2 PDZ domain containing 2 NM_178140 PEG10 paternally expressed 10 NM_001040152
PVRL1 poliovirus receptor-related 1
NM_002855 RYBP RING1 and YY1 binding protein
NM_012234
SIPA1L2 signal-induced proliferation-associated 1 like 2
NM_020808 SLC29A2
solute carrier family 29, member 2
NM_001532
TMEM100
transmembrane protein 100
NM_001099640
WDR43 WD repeat domain 43 NM_015131
WFDC2 WAP four-disulfide core domain 2
NM_006103
Appendix B Table B2. Developmental pathway mediators and developmental transcription factors upregulated by SYT-SSX2 in myoblasts. Asterisks (*) denote genes that are also bound by the SYT-SSX2 complex.
Developmental Pathways
Gene Symbol
Gene Name Accession Gene Symbol
Gene Name Accession
Wnt
Apcdd1 adenomatosis polyposis coli down-regulated 1
NM_133237 Axin2* Axin 2 NM_015732
Dact1 dapper homolog 1, antagonist of beta-catenin
NM_021532 Fzd3* frizzled homolog 3 NM_021458
Tcf7 transcription factor 7, T-cell specific
NM_009331 Tle3 transducin-like enhancer of split 3
NM_001083927
Tle4 transducin-like enhancer of split 4
NM_011600 Wnt11 wingless-related MMTV integration site 11
NM_009519
Wnt4 wingless-related MMTV integration site 4
NM_009523 Wnt7a* wingless-related MMTV integration site 7A
NM_009527
Wnt7b wingless-related MMTV integration site 7B
NM_009528
Notch
Dll1 delta-like 1 NM_007865 Hes1 hairy and enhancer of split 1
NM_008235
Nrarp Notch-regulated ankyrin repeat protein
NM_025980
TGF/BMP
Gdf6 growth differentiation factor 6
NM_013526 Nog noggin NM_008711
Tgfbr1 transforming growth factor, beta receptor I
NM_009370
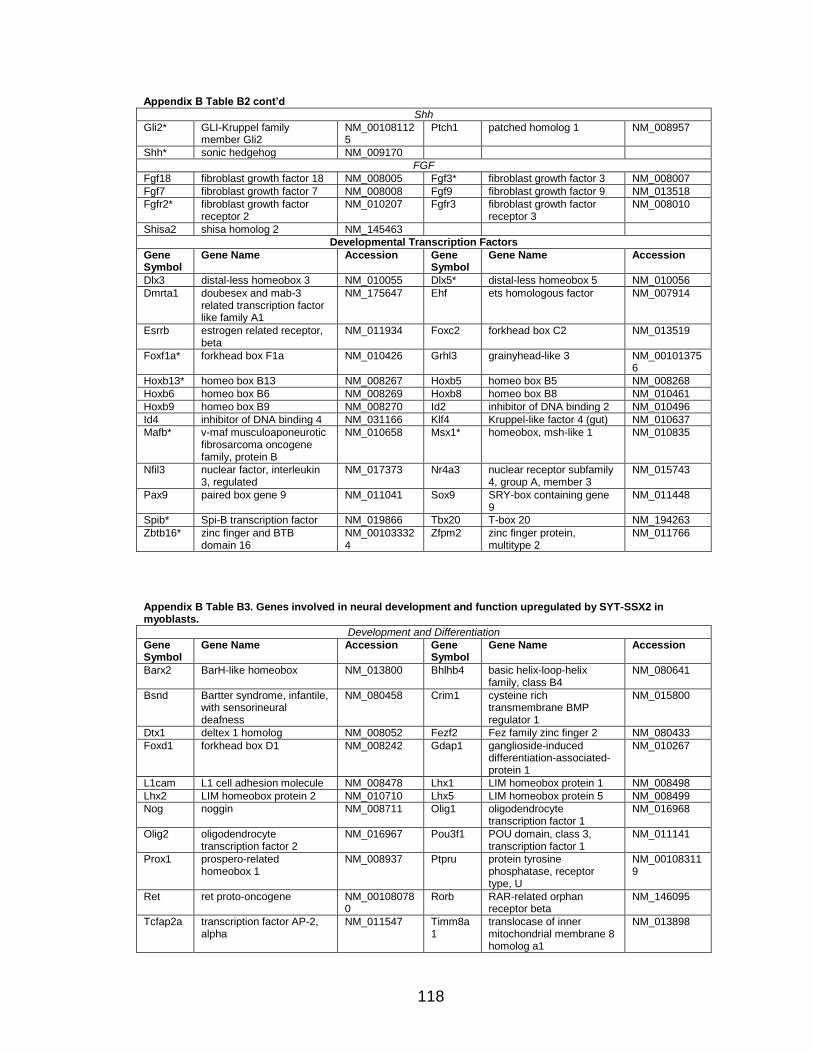
118
Appendix B Table B2 cont’d
Shh
Gli2* GLI-Kruppel family member Gli2
NM_001081125
Ptch1 patched homolog 1 NM_008957
Shh* sonic hedgehog NM_009170
FGF
Fgf18 fibroblast growth factor 18 NM_008005 Fgf3* fibroblast growth factor 3 NM_008007
Fgf7 fibroblast growth factor 7 NM_008008 Fgf9 fibroblast growth factor 9 NM_013518
Fgfr2* fibroblast growth factor receptor 2
NM_010207 Fgfr3 fibroblast growth factor receptor 3
NM_008010
Shisa2 shisa homolog 2 NM_145463
Developmental Transcription Factors
Gene Symbol
Gene Name Accession Gene Symbol
Gene Name Accession
Dlx3 distal-less homeobox 3 NM_010055 Dlx5* distal-less homeobox 5 NM_010056
Dmrta1 doubesex and mab-3 related transcription factor like family A1
NM_175647 Ehf ets homologous factor NM_007914
Esrrb estrogen related receptor, beta
NM_011934 Foxc2 forkhead box C2 NM_013519
Foxf1a* forkhead box F1a NM_010426 Grhl3 grainyhead-like 3 NM_001013756
Hoxb13* homeo box B13 NM_008267 Hoxb5 homeo box B5 NM_008268
Hoxb6 homeo box B6 NM_008269 Hoxb8 homeo box B8 NM_010461
Hoxb9 homeo box B9 NM_008270 Id2 inhibitor of DNA binding 2 NM_010496
Id4 inhibitor of DNA binding 4 NM_031166 Klf4 Kruppel-like factor 4 (gut) NM_010637
Mafb* v-maf musculoaponeurotic fibrosarcoma oncogene family, protein B
NM_010658 Msx1* homeobox, msh-like 1 NM_010835
Nfil3 nuclear factor, interleukin 3, regulated
NM_017373 Nr4a3 nuclear receptor subfamily 4, group A, member 3
NM_015743
Pax9 paired box gene 9 NM_011041 Sox9 SRY-box containing gene 9
NM_011448
Spib* Spi-B transcription factor NM_019866 Tbx20 T-box 20 NM_194263
Zbtb16* zinc finger and BTB domain 16
NM_001033324
Zfpm2 zinc finger protein, multitype 2
NM_011766
Appendix B Table B3. Genes involved in neural development and function upregulated by SYT-SSX2 in myoblasts.
Development and Differentiation
Gene Symbol
Gene Name Accession Gene Symbol
Gene Name Accession
Barx2 BarH-like homeobox NM_013800 Bhlhb4 basic helix-loop-helix family, class B4
NM_080641
Bsnd Bartter syndrome, infantile, with sensorineural deafness
NM_080458 Crim1 cysteine rich transmembrane BMP regulator 1
NM_015800
Dtx1 deltex 1 homolog NM_008052 Fezf2 Fez family zinc finger 2 NM_080433
Foxd1 forkhead box D1 NM_008242 Gdap1 ganglioside-induced differentiation-associated-protein 1
NM_010267
L1cam L1 cell adhesion molecule NM_008478 Lhx1 LIM homeobox protein 1 NM_008498
Lhx2 LIM homeobox protein 2 NM_010710 Lhx5 LIM homeobox protein 5 NM_008499
Nog noggin NM_008711 Olig1 oligodendrocyte transcription factor 1
NM_016968
Olig2 oligodendrocyte transcription factor 2
NM_016967 Pou3f1 POU domain, class 3, transcription factor 1
NM_011141
Prox1 prospero-related homeobox 1
NM_008937 Ptpru protein tyrosine phosphatase, receptor type, U
NM_001083119
Ret ret proto-oncogene NM_001080780
Rorb RAR-related orphan receptor beta
NM_146095
Tcfap2a transcription factor AP-2, alpha
NM_011547 Timm8a1
translocase of inner mitochondrial membrane 8 homolog a1
NM_013898
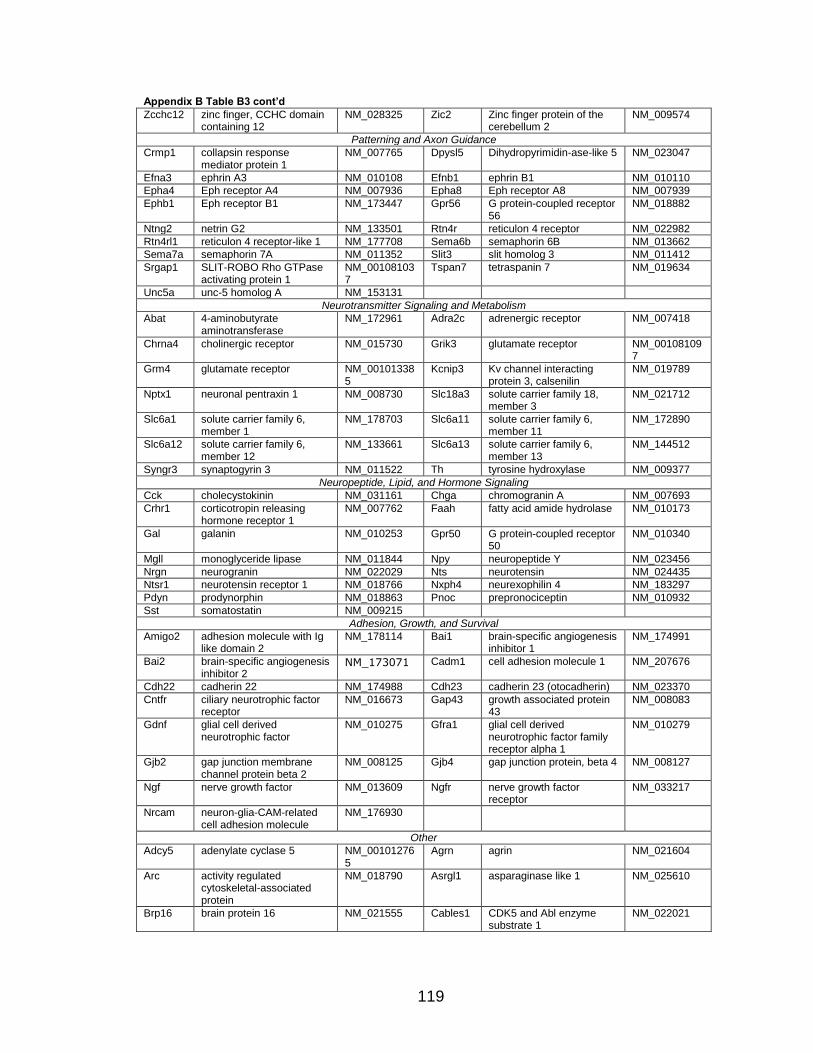
119
Appendix B Table B3 cont’d
Zcchc12 zinc finger, CCHC domain containing 12
NM_028325 Zic2 Zinc finger protein of the cerebellum 2
NM_009574
Patterning and Axon Guidance
Crmp1 collapsin response mediator protein 1
NM_007765 Dpysl5 Dihydropyrimidin-ase-like 5 NM_023047
Efna3 ephrin A3 NM_010108 Efnb1 ephrin B1 NM_010110
Epha4 Eph receptor A4 NM_007936 Epha8 Eph receptor A8 NM_007939
Ephb1 Eph receptor B1 NM_173447 Gpr56 G protein-coupled receptor 56
NM_018882
Ntng2 netrin G2 NM_133501 Rtn4r reticulon 4 receptor NM_022982
Rtn4rl1 reticulon 4 receptor-like 1 NM_177708 Sema6b semaphorin 6B NM_013662
Sema7a semaphorin 7A NM_011352 Slit3 slit homolog 3 NM_011412
Srgap1 SLIT-ROBO Rho GTPase activating protein 1
NM_001081037
Tspan7 tetraspanin 7 NM_019634
Unc5a unc-5 homolog A NM_153131
Neurotransmitter Signaling and Metabolism
Abat 4-aminobutyrate aminotransferase
NM_172961 Adra2c adrenergic receptor NM_007418
Chrna4 cholinergic receptor NM_015730 Grik3 glutamate receptor NM_001081097
Grm4 glutamate receptor NM_001013385
Kcnip3 Kv channel interacting protein 3, calsenilin
NM_019789
Nptx1 neuronal pentraxin 1 NM_008730 Slc18a3 solute carrier family 18, member 3
NM_021712
Slc6a1 solute carrier family 6, member 1
NM_178703 Slc6a11 solute carrier family 6, member 11
NM_172890
Slc6a12 solute carrier family 6, member 12
NM_133661 Slc6a13 solute carrier family 6, member 13
NM_144512
Syngr3 synaptogyrin 3 NM_011522 Th tyrosine hydroxylase NM_009377
Neuropeptide, Lipid, and Hormone Signaling
Cck cholecystokinin NM_031161 Chga chromogranin A NM_007693
Crhr1 corticotropin releasing hormone receptor 1
NM_007762 Faah fatty acid amide hydrolase NM_010173
Gal galanin NM_010253 Gpr50 G protein-coupled receptor 50
NM_010340
Mgll monoglyceride lipase NM_011844 Npy neuropeptide Y NM_023456
Nrgn neurogranin NM_022029 Nts neurotensin NM_024435
Ntsr1 neurotensin receptor 1 NM_018766 Nxph4 neurexophilin 4 NM_183297
Pdyn prodynorphin NM_018863 Pnoc prepronociceptin NM_010932
Sst somatostatin NM_009215
Adhesion, Growth, and Survival
Amigo2 adhesion molecule with Ig like domain 2
NM_178114 Bai1 brain-specific angiogenesis inhibitor 1
NM_174991
Bai2 brain-specific angiogenesis inhibitor 2
NM_173071 Cadm1 cell adhesion molecule 1 NM_207676
Cdh22 cadherin 22 NM_174988 Cdh23 cadherin 23 (otocadherin) NM_023370
Cntfr ciliary neurotrophic factor receptor
NM_016673 Gap43 growth associated protein 43
NM_008083
Gdnf glial cell derived neurotrophic factor
NM_010275 Gfra1 glial cell derived neurotrophic factor family receptor alpha 1
NM_010279
Gjb2 gap junction membrane channel protein beta 2
NM_008125 Gjb4 gap junction protein, beta 4 NM_008127
Ngf nerve growth factor NM_013609 Ngfr nerve growth factor receptor
NM_033217
Nrcam neuron-glia-CAM-related cell adhesion molecule
NM_176930
Other
Adcy5 adenylate cyclase 5 NM_001012765
Agrn agrin NM_021604
Arc activity regulated cytoskeletal-associated protein
NM_018790 Asrgl1 asparaginase like 1 NM_025610
Brp16 brain protein 16 NM_021555
Cables1 CDK5 and Abl enzyme substrate 1
NM_022021
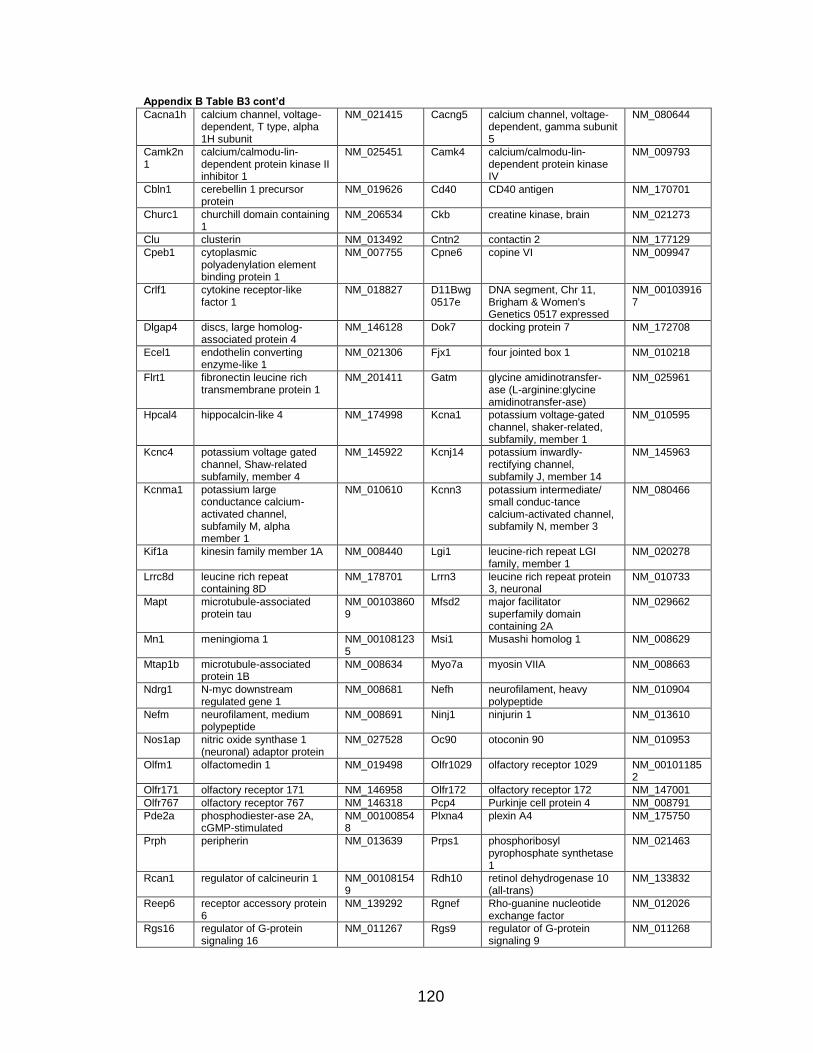
120
Appendix B Table B3 cont’d
Cacna1h calcium channel, voltage-dependent, T type, alpha 1H subunit
NM_021415 Cacng5 calcium channel, voltage-dependent, gamma subunit 5
NM_080644
Camk2n1
calcium/calmodu-lin-dependent protein kinase II inhibitor 1
NM_025451 Camk4 calcium/calmodu-lin-dependent protein kinase IV
NM_009793
Cbln1 cerebellin 1 precursor protein
NM_019626 Cd40 CD40 antigen NM_170701
Churc1 churchill domain containing 1
NM_206534 Ckb creatine kinase, brain NM_021273
Clu clusterin NM_013492 Cntn2 contactin 2 NM_177129
Cpeb1 cytoplasmic polyadenylation element binding protein 1
NM_007755 Cpne6 copine VI NM_009947
Crlf1 cytokine receptor-like factor 1
NM_018827 D11Bwg0517e
DNA segment, Chr 11, Brigham & Women's Genetics 0517 expressed
NM_001039167
Dlgap4 discs, large homolog-associated protein 4
NM_146128 Dok7 docking protein 7 NM_172708
Ecel1 endothelin converting enzyme-like 1
NM_021306 Fjx1 four jointed box 1 NM_010218
Flrt1 fibronectin leucine rich transmembrane protein 1
NM_201411 Gatm glycine amidinotransfer-ase (L-arginine:glycine amidinotransfer-ase)
NM_025961
Hpcal4 hippocalcin-like 4 NM_174998 Kcna1 potassium voltage-gated channel, shaker-related, subfamily, member 1
NM_010595
Kcnc4 potassium voltage gated channel, Shaw-related subfamily, member 4
NM_145922 Kcnj14 potassium inwardly-rectifying channel, subfamily J, member 14
NM_145963
Kcnma1 potassium large conductance calcium-activated channel, subfamily M, alpha member 1
NM_010610 Kcnn3 potassium intermediate/ small conduc-tance calcium-activated channel, subfamily N, member 3
NM_080466
Kif1a kinesin family member 1A NM_008440 Lgi1 leucine-rich repeat LGI family, member 1
NM_020278
Lrrc8d leucine rich repeat containing 8D
NM_178701 Lrrn3 leucine rich repeat protein 3, neuronal
NM_010733
Mapt microtubule-associated protein tau
NM_001038609
Mfsd2 major facilitator superfamily domain containing 2A
NM_029662
Mn1 meningioma 1 NM_001081235
Msi1 Musashi homolog 1 NM_008629
Mtap1b microtubule-associated protein 1B
NM_008634 Myo7a myosin VIIA NM_008663
Ndrg1 N-myc downstream regulated gene 1
NM_008681 Nefh neurofilament, heavy polypeptide
NM_010904
Nefm neurofilament, medium polypeptide
NM_008691 Ninj1 ninjurin 1 NM_013610
Nos1ap nitric oxide synthase 1 (neuronal) adaptor protein
NM_027528 Oc90 otoconin 90 NM_010953
Olfm1 olfactomedin 1 NM_019498 Olfr1029 olfactory receptor 1029 NM_001011852
Olfr171 olfactory receptor 171 NM_146958 Olfr172 olfactory receptor 172 NM_147001
Olfr767 olfactory receptor 767 NM_146318 Pcp4 Purkinje cell protein 4 NM_008791
Pde2a phosphodiester-ase 2A, cGMP-stimulated
NM_001008548
Plxna4 plexin A4 NM_175750
Prph peripherin NM_013639 Prps1 phosphoribosyl pyrophosphate synthetase 1
NM_021463
Rcan1 regulator of calcineurin 1 NM_001081549
Rdh10 retinol dehydrogenase 10 (all-trans)
NM_133832
Reep6 receptor accessory protein 6
NM_139292 Rgnef Rho-guanine nucleotide exchange factor
NM_012026
Rgs16 regulator of G-protein signaling 16
NM_011267 Rgs9 regulator of G-protein signaling 9
NM_011268
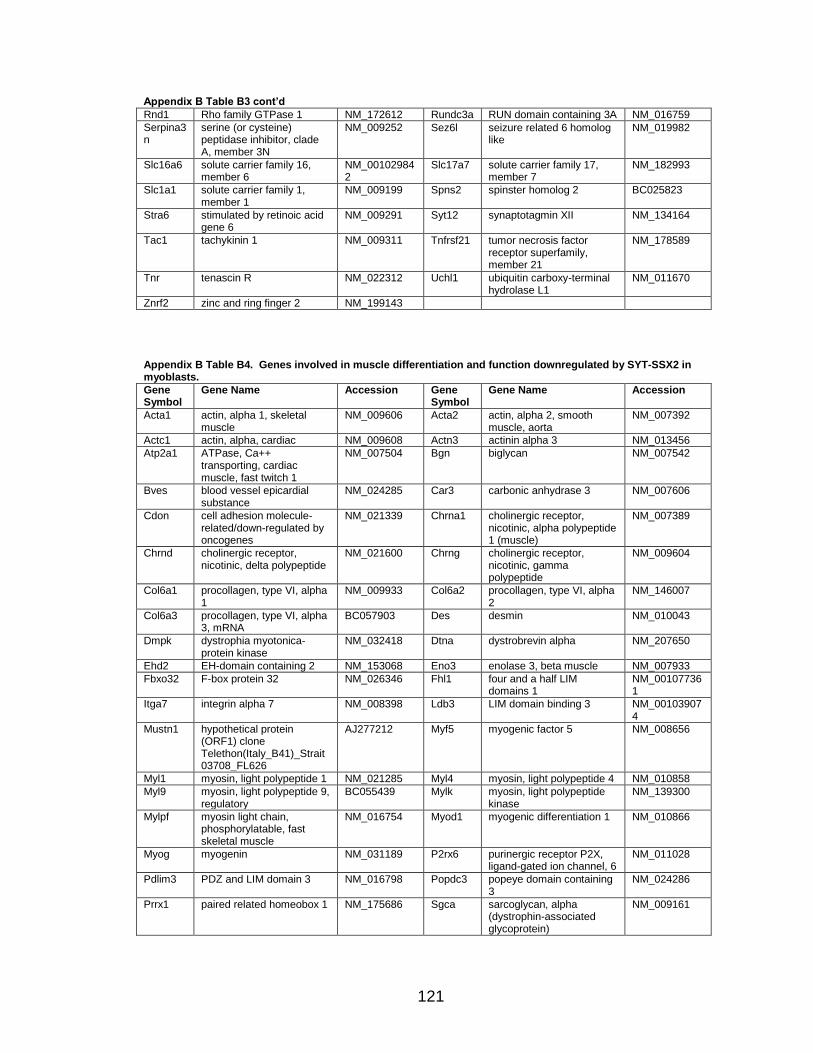
121
Appendix B Table B3 cont’d
Rnd1 Rho family GTPase 1 NM_172612 Rundc3a RUN domain containing 3A NM_016759
Serpina3n
serine (or cysteine) peptidase inhibitor, clade A, member 3N
NM_009252 Sez6l seizure related 6 homolog like
NM_019982
Slc16a6 solute carrier family 16, member 6
NM_001029842
Slc17a7 solute carrier family 17, member 7
NM_182993
Slc1a1 solute carrier family 1, member 1
NM_009199 Spns2 spinster homolog 2 BC025823
Stra6 stimulated by retinoic acid gene 6
NM_009291
Syt12 synaptotagmin XII NM_134164
Tac1 tachykinin 1 NM_009311 Tnfrsf21 tumor necrosis factor receptor superfamily, member 21
NM_178589
Tnr tenascin R NM_022312 Uchl1 ubiquitin carboxy-terminal hydrolase L1
NM_011670
Znrf2 zinc and ring finger 2 NM_199143
Appendix B Table B4. Genes involved in muscle differentiation and function downregulated by SYT-SSX2 in myoblasts.
Gene Symbol
Gene Name Accession Gene Symbol
Gene Name Accession
Acta1 actin, alpha 1, skeletal muscle
NM_009606 Acta2 actin, alpha 2, smooth muscle, aorta
NM_007392
Actc1 actin, alpha, cardiac NM_009608 Actn3 actinin alpha 3 NM_013456
Atp2a1 ATPase, Ca++ transporting, cardiac muscle, fast twitch 1
NM_007504 Bgn biglycan NM_007542
Bves blood vessel epicardial substance
NM_024285 Car3 carbonic anhydrase 3 NM_007606
Cdon cell adhesion molecule-related/down-regulated by oncogenes
NM_021339 Chrna1 cholinergic receptor, nicotinic, alpha polypeptide 1 (muscle)
NM_007389
Chrnd cholinergic receptor, nicotinic, delta polypeptide
NM_021600 Chrng cholinergic receptor, nicotinic, gamma polypeptide
NM_009604
Col6a1 procollagen, type VI, alpha 1
NM_009933 Col6a2 procollagen, type VI, alpha 2
NM_146007
Col6a3 procollagen, type VI, alpha 3, mRNA
BC057903 Des desmin NM_010043
Dmpk dystrophia myotonica-protein kinase
NM_032418 Dtna dystrobrevin alpha NM_207650
Ehd2 EH-domain containing 2 NM_153068 Eno3 enolase 3, beta muscle NM_007933
Fbxo32 F-box protein 32 NM_026346 Fhl1 four and a half LIM domains 1
NM_001077361
Itga7 integrin alpha 7 NM_008398 Ldb3 LIM domain binding 3 NM_001039074
Mustn1 hypothetical protein (ORF1) clone Telethon(Italy_B41)_Strait03708_FL626
AJ277212 Myf5 myogenic factor 5 NM_008656
Myl1 myosin, light polypeptide 1 NM_021285 Myl4 myosin, light polypeptide 4 NM_010858
Myl9 myosin, light polypeptide 9, regulatory
BC055439 Mylk myosin, light polypeptide kinase
NM_139300
Mylpf myosin light chain, phosphorylatable, fast skeletal muscle
NM_016754 Myod1 myogenic differentiation 1 NM_010866
Myog myogenin NM_031189 P2rx6 purinergic receptor P2X, ligand-gated ion channel, 6
NM_011028
Pdlim3 PDZ and LIM domain 3 NM_016798 Popdc3 popeye domain containing 3
NM_024286
Prrx1 paired related homeobox 1 NM_175686 Sgca sarcoglycan, alpha (dystrophin-associated glycoprotein)
NM_009161

122
Appendix B Table B4 cont’d
Sgcb sarcoglycan, beta (dystrophin-associated glycoprotein)
NM_011890 Sgcd sarcoglycan, delta (dystrophin-associated glycoprotein)
NM_011891
Sgcg sarcoglycan, gamma (dystrophin-associated glycoprotein)
ENSMUST00000077954
Six4 sine oculis-related homeobox 4 homolog (Drosophila)
NM_011382
Speg SPEG complex locus NM_007463 Sspn sarcospan NM_010656
Sync syncoilin NM_023485 Tnnc1 troponin C, cardiac/slow skeletal
NM_009393
Tnni1 troponin I, skeletal, slow 1 NM_021467 Tnnt1 troponin T1, skeletal, slow NM_011618
Tnnt3 troponin T3, skeletal, fast NM_011620 Ttn titin NM_011652
Unc93b1 unc-93 homolog B1 (C. elegans)
NM_019449 Boc biregional cell adhesion molecule-related/down-regulated by oncogenes (Cdon) binding protein
NM_172506
Appendix B Table B5. Genes involved in bone formation upregulated by SYT-SSX2 in human mesenchymal stem cells.
Gene Symbol
Gene Name Accession Gene Symbol
Gene Name Accession
ALPL alkaline phosphatase NM_000478 BMP2 bone morphogenetic protein 2
NM_001200
BMP6 bone morphogenetic protein 6
NM_001718 COMP cartilage oligomeric matrix protein
NM_000095
CRTAC1 cartilage acidic protein NM_018058 FGFR3 fibroblast growth factor receptor 3
NM_000142
HOXD1 homeobox D1 NM_024501 HOXD10 homeobox D10 NM_002148
IGSF10 immunoglobulin superfamily, member 10
NM_178822 LIFR leukemia inhibitory factor receptor
NM_002310
MGP matrix Gla protein NM_000900 OSR2 odd-skipped related 2 NM_053001
ROR2 receptor tyrosine kinase –like 2
NM_004560 TNS4 tensin 4 NM_032865
Appendix B Table B6. Differentially regulated genes in C2C12 myoblasts and hMSCs expressing SYT-SSX2. Underlined genes are downregulated in both C2C12 myoblasts and hMSCs expressing SYT-SSX2.
Gene Symbol
Gene Name Accession Gene Symbol
Gene Name Accession
Adhesion, Migration, and ECM
Arhgap20
Rho GTPase activating protein 20
NM_175535 Ceacam1 carcinoembryonic antigen-related cell adhesion molecule 1
NM_011926
Cldn1 claudin 1 NM_016674 Col4a1 collagen, type IV, alpha I
NM_009931
Crispld2 cysteine-rich secretory protein LCCL domain containing 2
NM_030209 Flrt3 fibronectin leucine rich transmembrane protein 3
NM_178382
Icam1 intercellular adhesion molecule 1
NM_010493 Iqgap2 IQ motif containing GTPase activating protein 2
NM_027711
Itga9 integrin alpha 9 NM_133721 Krt17 keratin 17 NM_010663 Krt6a keratin 6a NM_008476 Mmp10 matrix
metallopeptidase 10 NM_019471
Rhou ras homolog gene family, member U
NM_133955 Scube1 signal peptide, CUB domain, EGF-like 1
NM_022723
Tnxb tenascin XB NM_031176 Arhgap18
Rho GTPase activating protein 18
NM_176837
Ccbe1 collagen and calcium binding EGF domains 1
NM_178793 Ccdc80 coiled-coil domain containing 80
NM_026439
Dcn decorin NM_007833 Dlc1 deleted in liver cancer 1
NM_015802
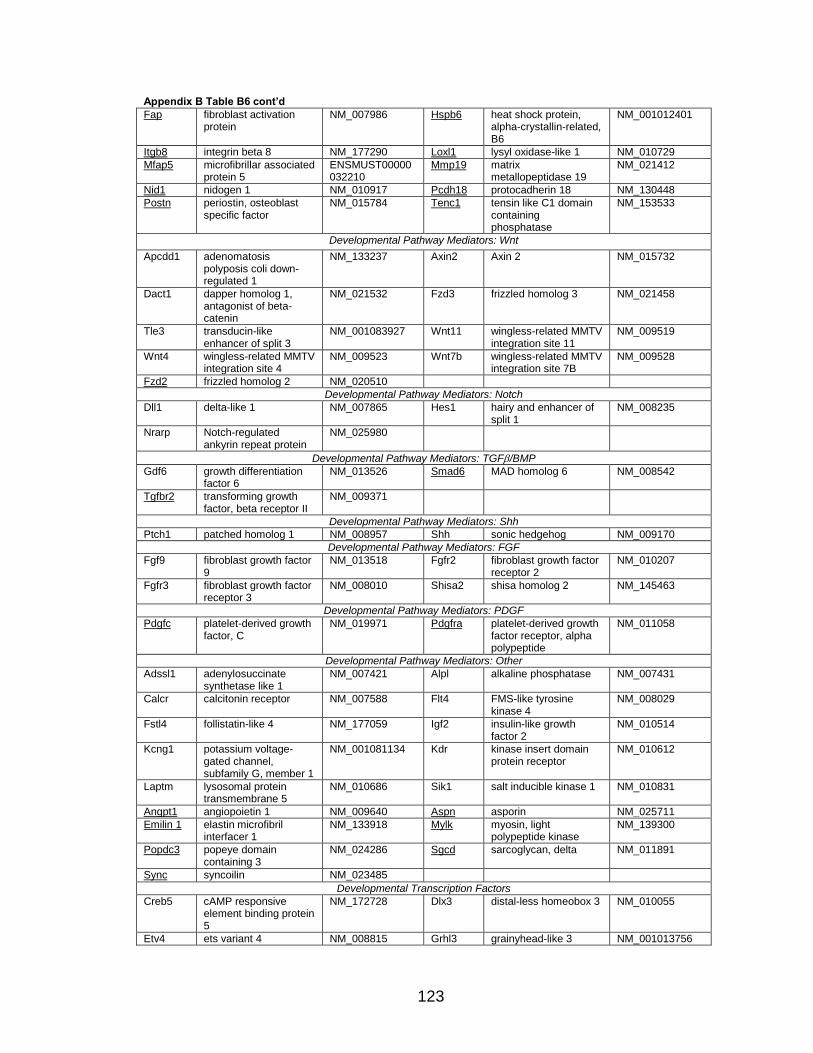
123
Appendix B Table B6 cont’d
Fap fibroblast activation protein
NM_007986 Hspb6 heat shock protein, alpha-crystallin-related, B6
NM_001012401
Itgb8 integrin beta 8 NM_177290 Loxl1 lysyl oxidase-like 1 NM_010729 Mfap5 microfibrillar associated
protein 5 ENSMUST00000032210
Mmp19 matrix metallopeptidase 19
NM_021412
Nid1 nidogen 1 NM_010917 Pcdh18 protocadherin 18 NM_130448 Postn periostin, osteoblast
specific factor NM_015784 Tenc1 tensin like C1 domain
containing phosphatase
NM_153533
Developmental Pathway Mediators: Wnt
Apcdd1 adenomatosis polyposis coli down-regulated 1
NM_133237 Axin2 Axin 2 NM_015732
Dact1 dapper homolog 1, antagonist of beta-catenin
NM_021532 Fzd3 frizzled homolog 3 NM_021458
Tle3 transducin-like enhancer of split 3
NM_001083927 Wnt11 wingless-related MMTV integration site 11
NM_009519
Wnt4 wingless-related MMTV integration site 4
NM_009523 Wnt7b wingless-related MMTV integration site 7B
NM_009528
Fzd2 frizzled homolog 2 NM_020510
Developmental Pathway Mediators: Notch
Dll1 delta-like 1 NM_007865 Hes1 hairy and enhancer of split 1
NM_008235
Nrarp Notch-regulated ankyrin repeat protein
NM_025980
Developmental Pathway Mediators: TGF/BMP
Gdf6 growth differentiation factor 6
NM_013526 Smad6 MAD homolog 6 NM_008542
Tgfbr2 transforming growth factor, beta receptor II
NM_009371
Developmental Pathway Mediators: Shh
Ptch1 patched homolog 1 NM_008957 Shh sonic hedgehog NM_009170
Developmental Pathway Mediators: FGF
Fgf9 fibroblast growth factor 9
NM_013518 Fgfr2 fibroblast growth factor receptor 2
NM_010207
Fgfr3 fibroblast growth factor receptor 3
NM_008010 Shisa2 shisa homolog 2 NM_145463
Developmental Pathway Mediators: PDGF
Pdgfc platelet-derived growth factor, C
NM_019971 Pdgfra platelet-derived growth factor receptor, alpha polypeptide
NM_011058
Developmental Pathway Mediators: Other
Adssl1 adenylosuccinate synthetase like 1
NM_007421 Alpl alkaline phosphatase NM_007431
Calcr calcitonin receptor NM_007588 Flt4 FMS-like tyrosine kinase 4
NM_008029
Fstl4 follistatin-like 4 NM_177059 Igf2 insulin-like growth factor 2
NM_010514
Kcng1 potassium voltage-gated channel, subfamily G, member 1
NM_001081134 Kdr kinase insert domain protein receptor
NM_010612
Laptm lysosomal protein transmembrane 5
NM_010686 Sik1 salt inducible kinase 1 NM_010831
Angpt1 angiopoietin 1 NM_009640 Aspn asporin NM_025711 Emilin 1 elastin microfibril
interfacer 1 NM_133918 Mylk myosin, light
polypeptide kinase NM_139300
Popdc3 popeye domain containing 3
NM_024286 Sgcd sarcoglycan, delta NM_011891
Sync syncoilin NM_023485 Developmental Transcription Factors
Creb5 cAMP responsive element binding protein 5
NM_172728 Dlx3 distal-less homeobox 3 NM_010055
Etv4 ets variant 4 NM_008815 Grhl3 grainyhead-like 3 NM_001013756
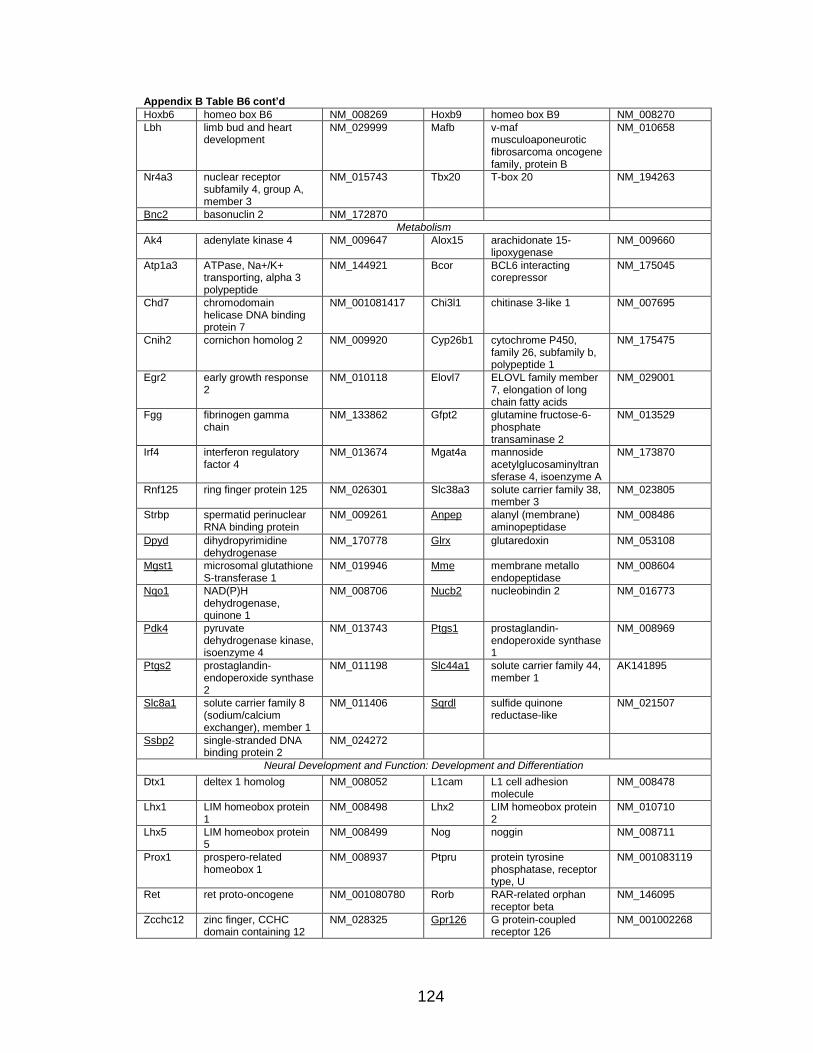
124
Appendix B Table B6 cont’d
Hoxb6 homeo box B6 NM_008269 Hoxb9 homeo box B9 NM_008270
Lbh limb bud and heart development
NM_029999 Mafb v-maf musculoaponeurotic fibrosarcoma oncogene family, protein B
NM_010658
Nr4a3 nuclear receptor subfamily 4, group A, member 3
NM_015743 Tbx20 T-box 20 NM_194263
Bnc2 basonuclin 2 NM_172870
Metabolism
Ak4 adenylate kinase 4 NM_009647 Alox15 arachidonate 15-lipoxygenase
NM_009660
Atp1a3 ATPase, Na+/K+ transporting, alpha 3 polypeptide
NM_144921 Bcor BCL6 interacting corepressor
NM_175045
Chd7 chromodomain helicase DNA binding protein 7
NM_001081417 Chi3l1 chitinase 3-like 1 NM_007695
Cnih2 cornichon homolog 2 NM_009920 Cyp26b1 cytochrome P450, family 26, subfamily b, polypeptide 1
NM_175475
Egr2 early growth response 2
NM_010118 Elovl7 ELOVL family member 7, elongation of long chain fatty acids
NM_029001
Fgg fibrinogen gamma chain
NM_133862 Gfpt2 glutamine fructose-6-phosphate transaminase 2
NM_013529
Irf4 interferon regulatory factor 4
NM_013674 Mgat4a mannoside acetylglucosaminyltransferase 4, isoenzyme A
NM_173870
Rnf125 ring finger protein 125 NM_026301 Slc38a3 solute carrier family 38, member 3
NM_023805
Strbp spermatid perinuclear RNA binding protein
NM_009261 Anpep alanyl (membrane) aminopeptidase
NM_008486
Dpyd dihydropyrimidine
dehydrogenase NM_170778 Glrx glutaredoxin NM_053108
Mgst1 microsomal glutathione S-transferase 1
NM_019946 Mme membrane metallo endopeptidase
NM_008604
Nqo1 NAD(P)H dehydrogenase, quinone 1
NM_008706 Nucb2 nucleobindin 2 NM_016773
Pdk4 pyruvate dehydrogenase kinase, isoenzyme 4
NM_013743 Ptgs1 prostaglandin-endoperoxide synthase 1
NM_008969
Ptgs2 prostaglandin-endoperoxide synthase 2
NM_011198 Slc44a1 solute carrier family 44, member 1
AK141895
Slc8a1 solute carrier family 8 (sodium/calcium exchanger), member 1
NM_011406 Sqrdl sulfide quinone reductase-like
NM_021507
Ssbp2 single-stranded DNA binding protein 2
NM_024272
Neural Development and Function: Development and Differentiation
Dtx1 deltex 1 homolog NM_008052 L1cam L1 cell adhesion molecule
NM_008478
Lhx1 LIM homeobox protein 1
NM_008498 Lhx2 LIM homeobox protein 2
NM_010710
Lhx5 LIM homeobox protein 5
NM_008499 Nog noggin NM_008711
Prox1 prospero-related homeobox 1
NM_008937 Ptpru protein tyrosine phosphatase, receptor type, U
NM_001083119
Ret ret proto-oncogene NM_001080780 Rorb RAR-related orphan receptor beta
NM_146095
Zcchc12 zinc finger, CCHC domain containing 12
NM_028325 Gpr126 G protein-coupled receptor 126
NM_001002268
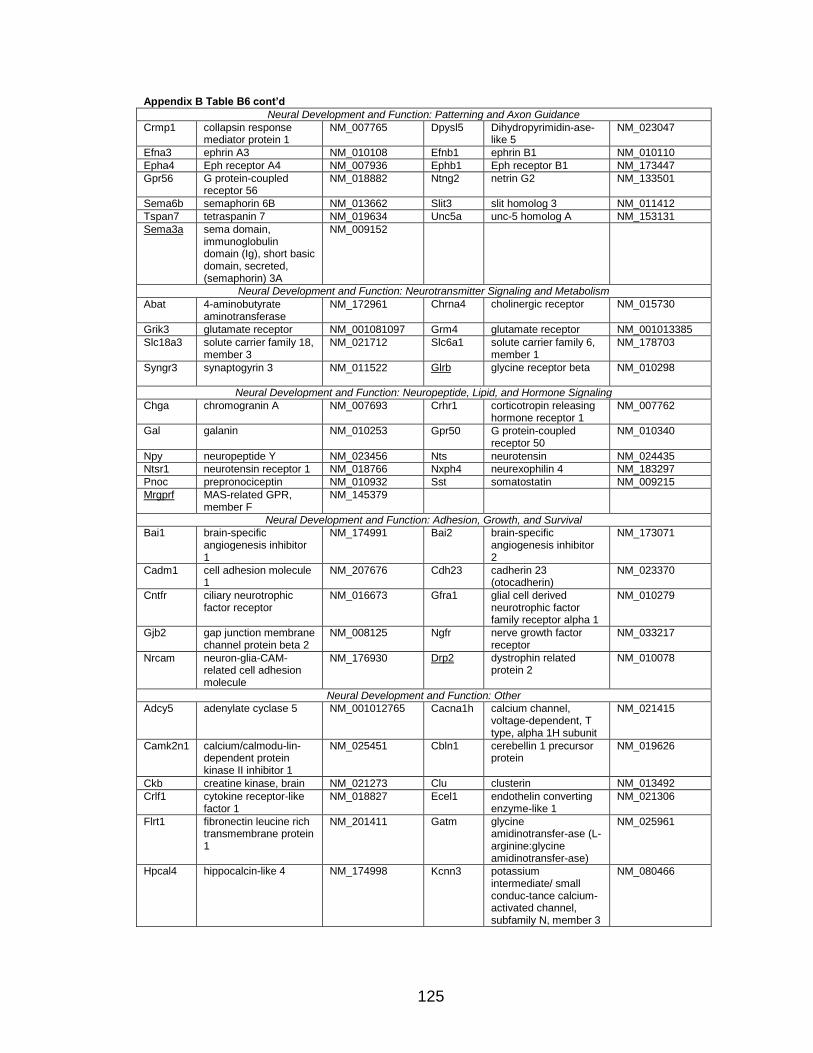
125
Appendix B Table B6 cont’d
Neural Development and Function: Patterning and Axon Guidance
Crmp1 collapsin response mediator protein 1
NM_007765 Dpysl5 Dihydropyrimidin-ase-like 5
NM_023047
Efna3 ephrin A3 NM_010108 Efnb1 ephrin B1 NM_010110
Epha4 Eph receptor A4 NM_007936 Ephb1 Eph receptor B1 NM_173447
Gpr56 G protein-coupled receptor 56
NM_018882 Ntng2 netrin G2 NM_133501
Sema6b semaphorin 6B NM_013662 Slit3 slit homolog 3 NM_011412
Tspan7 tetraspanin 7 NM_019634 Unc5a unc-5 homolog A NM_153131
Sema3a sema domain, immunoglobulin domain (Ig), short basic domain, secreted, (semaphorin) 3A
NM_009152
Neural Development and Function: Neurotransmitter Signaling and Metabolism
Abat 4-aminobutyrate aminotransferase
NM_172961 Chrna4 cholinergic receptor NM_015730
Grik3 glutamate receptor NM_001081097 Grm4 glutamate receptor NM_001013385
Slc18a3 solute carrier family 18, member 3
NM_021712 Slc6a1 solute carrier family 6, member 1
NM_178703
Syngr3 synaptogyrin 3 NM_011522 Glrb glycine receptor beta NM_010298
Neural Development and Function: Neuropeptide, Lipid, and Hormone Signaling
Chga chromogranin A NM_007693 Crhr1 corticotropin releasing hormone receptor 1
NM_007762
Gal galanin NM_010253 Gpr50 G protein-coupled receptor 50
NM_010340
Npy neuropeptide Y NM_023456 Nts neurotensin NM_024435
Ntsr1 neurotensin receptor 1 NM_018766 Nxph4 neurexophilin 4 NM_183297
Pnoc prepronociceptin NM_010932 Sst somatostatin NM_009215
Mrgprf MAS-related GPR, member F
NM_145379
Neural Development and Function: Adhesion, Growth, and Survival
Bai1 brain-specific angiogenesis inhibitor 1
NM_174991 Bai2 brain-specific angiogenesis inhibitor 2
NM_173071
Cadm1 cell adhesion molecule 1
NM_207676 Cdh23 cadherin 23 (otocadherin)
NM_023370
Cntfr ciliary neurotrophic factor receptor
NM_016673 Gfra1 glial cell derived neurotrophic factor family receptor alpha 1
NM_010279
Gjb2 gap junction membrane channel protein beta 2
NM_008125 Ngfr nerve growth factor receptor
NM_033217
Nrcam neuron-glia-CAM-related cell adhesion molecule
NM_176930 Drp2 dystrophin related protein 2
NM_010078
Neural Development and Function: Other
Adcy5 adenylate cyclase 5 NM_001012765 Cacna1h calcium channel, voltage-dependent, T type, alpha 1H subunit
NM_021415
Camk2n1 calcium/calmodu-lin-dependent protein kinase II inhibitor 1
NM_025451 Cbln1 cerebellin 1 precursor protein
NM_019626
Ckb creatine kinase, brain NM_021273 Clu clusterin NM_013492
Crlf1 cytokine receptor-like factor 1
NM_018827 Ecel1 endothelin converting enzyme-like 1
NM_021306
Flrt1 fibronectin leucine rich transmembrane protein 1
NM_201411 Gatm glycine amidinotransfer-ase (L-arginine:glycine amidinotransfer-ase)
NM_025961
Hpcal4 hippocalcin-like 4 NM_174998 Kcnn3 potassium intermediate/ small conduc-tance calcium-activated channel, subfamily N, member 3
NM_080466
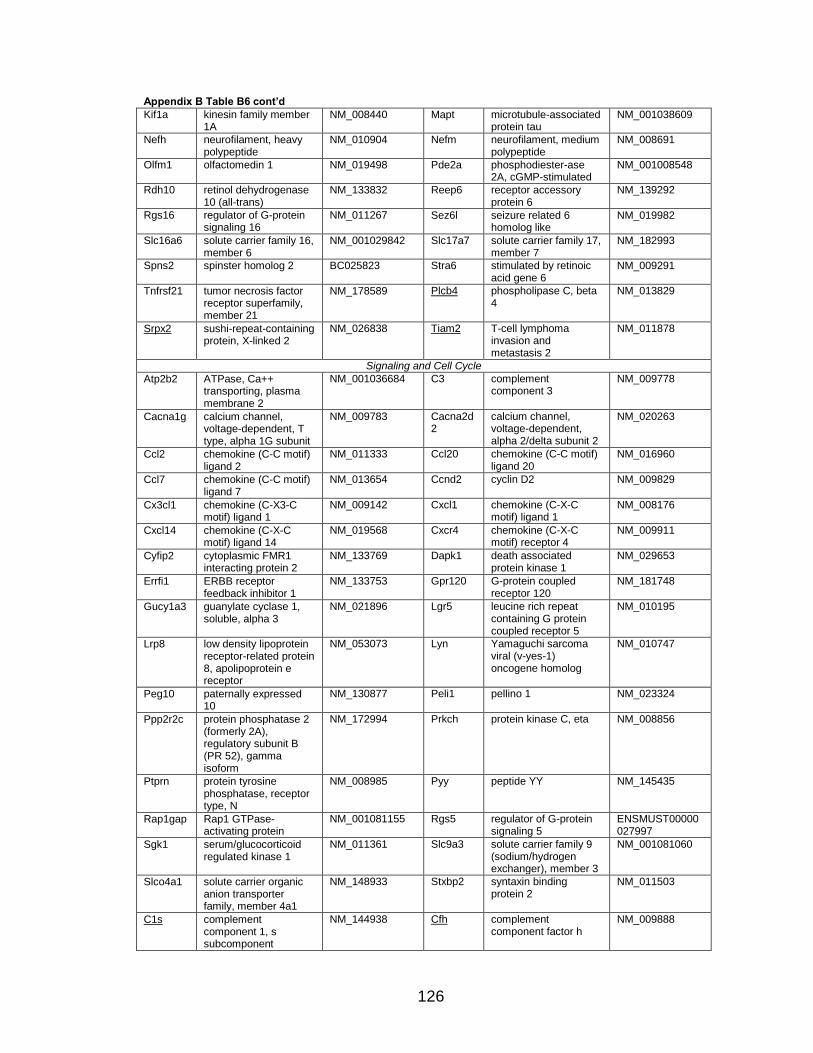
126
Appendix B Table B6 cont’d
Kif1a kinesin family member 1A
NM_008440 Mapt microtubule-associated protein tau
NM_001038609
Nefh neurofilament, heavy polypeptide
NM_010904 Nefm neurofilament, medium polypeptide
NM_008691
Olfm1 olfactomedin 1 NM_019498 Pde2a phosphodiester-ase 2A, cGMP-stimulated
NM_001008548
Rdh10 retinol dehydrogenase 10 (all-trans)
NM_133832
Reep6 receptor accessory protein 6
NM_139292
Rgs16 regulator of G-protein signaling 16
NM_011267 Sez6l seizure related 6 homolog like
NM_019982
Slc16a6 solute carrier family 16, member 6
NM_001029842 Slc17a7 solute carrier family 17, member 7
NM_182993
Spns2 spinster homolog 2 BC025823 Stra6 stimulated by retinoic acid gene 6
NM_009291
Tnfrsf21 tumor necrosis factor receptor superfamily, member 21
NM_178589 Plcb4 phospholipase C, beta 4
NM_013829
Srpx2 sushi-repeat-containing protein, X-linked 2
NM_026838 Tiam2 T-cell lymphoma invasion and metastasis 2
NM_011878
Signaling and Cell Cycle
Atp2b2 ATPase, Ca++ transporting, plasma membrane 2
NM_001036684 C3 complement component 3
NM_009778
Cacna1g calcium channel, voltage-dependent, T type, alpha 1G subunit
NM_009783
Cacna2d2
calcium channel, voltage-dependent, alpha 2/delta subunit 2
NM_020263
Ccl2 chemokine (C-C motif) ligand 2
NM_011333 Ccl20 chemokine (C-C motif) ligand 20
NM_016960
Ccl7 chemokine (C-C motif) ligand 7
NM_013654 Ccnd2 cyclin D2 NM_009829
Cx3cl1 chemokine (C-X3-C motif) ligand 1
NM_009142 Cxcl1 chemokine (C-X-C motif) ligand 1
NM_008176
Cxcl14 chemokine (C-X-C motif) ligand 14
NM_019568 Cxcr4 chemokine (C-X-C motif) receptor 4
NM_009911
Cyfip2 cytoplasmic FMR1 interacting protein 2
NM_133769 Dapk1 death associated protein kinase 1
NM_029653
Errfi1 ERBB receptor feedback inhibitor 1
NM_133753 Gpr120 G-protein coupled receptor 120
NM_181748
Gucy1a3 guanylate cyclase 1, soluble, alpha 3
NM_021896 Lgr5 leucine rich repeat containing G protein coupled receptor 5
NM_010195
Lrp8 low density lipoprotein receptor-related protein 8, apolipoprotein e receptor
NM_053073 Lyn Yamaguchi sarcoma viral (v-yes-1) oncogene homolog
NM_010747
Peg10 paternally expressed 10
NM_130877 Peli1 pellino 1 NM_023324
Ppp2r2c protein phosphatase 2 (formerly 2A), regulatory subunit B (PR 52), gamma isoform
NM_172994 Prkch protein kinase C, eta NM_008856
Ptprn protein tyrosine phosphatase, receptor type, N
NM_008985 Pyy peptide YY NM_145435
Rap1gap Rap1 GTPase-activating protein
NM_001081155 Rgs5 regulator of G-protein signaling 5
ENSMUST00000027997
Sgk1 serum/glucocorticoid regulated kinase 1
NM_011361 Slc9a3 solute carrier family 9 (sodium/hydrogen exchanger), member 3
NM_001081060
Slco4a1 solute carrier organic anion transporter family, member 4a1
NM_148933 Stxbp2 syntaxin binding protein 2
NM_011503
C1s complement component 1, s subcomponent
NM_144938 Cfh complement component factor h
NM_009888
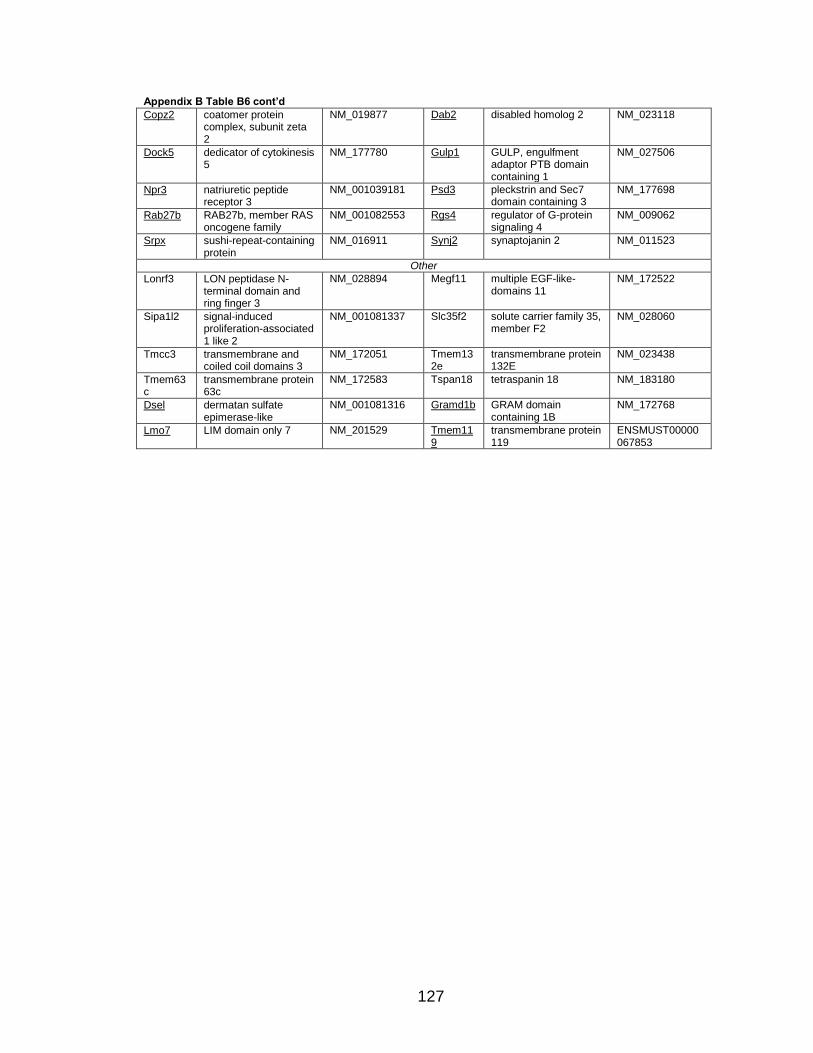
127
Appendix B Table B6 cont’d
Copz2 coatomer protein complex, subunit zeta 2
NM_019877 Dab2 disabled homolog 2 NM_023118
Dock5 dedicator of cytokinesis 5
NM_177780 Gulp1 GULP, engulfment adaptor PTB domain containing 1
NM_027506
Npr3 natriuretic peptide receptor 3
NM_001039181 Psd3 pleckstrin and Sec7 domain containing 3
NM_177698
Rab27b RAB27b, member RAS oncogene family
NM_001082553 Rgs4 regulator of G-protein signaling 4
NM_009062
Srpx sushi-repeat-containing protein
NM_016911 Synj2 synaptojanin 2 NM_011523
Other
Lonrf3 LON peptidase N-terminal domain and ring finger 3
NM_028894 Megf11 multiple EGF-like-domains 11
NM_172522
Sipa1l2 signal-induced proliferation-associated 1 like 2
NM_001081337 Slc35f2 solute carrier family 35, member F2
NM_028060
Tmcc3 transmembrane and coiled coil domains 3
NM_172051 Tmem132e
transmembrane protein 132E
NM_023438
Tmem63c
transmembrane protein 63c
NM_172583 Tspan18 tetraspanin 18 NM_183180
Dsel dermatan sulfate epimerase-like
NM_001081316 Gramd1b GRAM domain containing 1B
NM_172768
Lmo7 LIM domain only 7 NM_201529 Tmem119
transmembrane protein 119
ENSMUST00000067853
128
REFERENCES
Abollo-Jiménez F, Jimenez R, Cobaleda C. (2010). “Physiological cellular reprogramming and cancer.” Semin Cancer Biol 20: 98-106.
Agger K, Cloos PAC, Christensen J, Pasini D, Rose S, Rappsilber J, Issaeva I,
Canaani E, Salcini AE, Helin K. (2007). “UTX and JMJD3 are histone H3K27 demethylases involved in HOX gene regulation and development.” Nature doi: 10.1038/nature06145.
Alfaro MP, Pagni M, Vincent A, Atkinson J, Hill MF, Cates J, Davidson JM,
Rottman J, Lee E, Young PP. (2008). “The Wnt modulator sFRP2 enhances mesenchymal stem cell engraftment, granulation tissue formation and myocardial repair.” Proc Natl Acad Sci USA 105:18366-71.
Allander SV, Illei PB, Chen Y, Antonescu CR, Bittner M, Ladanyi M, Meltzer PS.
(2002). “Expression profiling of synovial sarcoma by cDNA microarrays: association of ERBB2, IGFBP2, and ELF3 with epithelial differentiation.” Am J Pathol 161: 1587-95.
Asp P, Blum R, Vethantham V, Parisi F, Micsinai M, Cheng J, Bowman C, Kluger
Y, Dynlacht BD. (2011). “Genome-wide remodeling of the epigenetic landscape during myogenic differentiation.” Proc Natl Acad Sci USA 108:E149-58.
Bailey TL and Elkan C. (1994). “Fitting a mixture model by expectation
maximization to discover motifs in biopolymers.” Proc Int Conf Intell Syst Mol Biol 2: 28-36.
Bannister AJ and Kouzarides T. (2011). “Regulation of chromatin by histone
modifications.” Cell Res 21: 381-95. Barco R, Garcia CB, Eid JE. (2009). “The synovial sarcoma-associated
SYTSSX2 oncogene antagonizes the Polycomb complex protein Bmi1.” PLoS One 4: e5060. doi:10.1371/journal.pone.0005060.
Barco R, Hunt LB, Frump AL, Garcia CB, Benesh A, Caldwell RL, Eid JE. (2007).
“The synovial sarcoma SYT-SSX2 oncogene remodels the cytoskeleton through activation of the ephrin pathway.” Mol Biol Cell 18: 4003-12.
Blankenberg D, Von Kuster G, Coraor N, Ananda G, Lazarus R, Mangan M,
Nekrutenko A, Taylor J. (2010). “Galaxy: a web-based genome analysis tool for experimentalists.” in Curr Protoc Mol Biol, ed Ausubel F (Wiley-Interscience, New York), Chapter 19: Unit 19.10.1-21.
129
Ben-Saadon R, Zaaroor D, Ziv T, Ciechanover A. (2008). “The Polycomb protein Ring1B generates self atypical mixed ubiquitin chains required for its in vitro histone H2A ligase activity.” Mol Cell 24: 701-11.
Boyer LA, Lee TI, Cole MF, Johnstone SE, Levine SS, Zucker JP, Guenther MG,
Kumar RM, Murray HL, Jenner RG, Gifford DK, Melton DA, Jaenisch R, Young RA. (2005). “Core transcriptional regulatory circuitry in human embryonic stem cells.” Cell 122: 947-56.
Bozzi F, Ferrari A, Negri T, Conca E, L DR, Losa M, Casieri P, Orsenigo M,
Lampis A, Meazza C, Casanova M, Pierotti MA, Tamborini E, Pilotti S. (2008). “Molecular characterization of synovial sarcoma in children and adolescents: evidence of Akt activation.” Transl Oncol 1: 95-101.
Brett D, Whitehouse S, Antonson P, Shipley J, Cooper C, Goodwin G. (1997).
“The SYT protein involved in the t(X;18) synovial sarcoma translocation is a transcriptional activator localized in nuclear bodies.” Hum Mol Genet 6: 1559-64.
Brodin B, Haslam K, Yang K, Bartolazzi A, Xie Y, Starborg, M, Lundeberg J,
Larsson O. (2001). “Cloning and characterization of spliced fusion transcript variants of synvial sarcoma: SYT/SSX4, SYT/SSX4v, and SYT/SSX2v. Possible regulatory role of the fusion gene product in wild type SYT expression.” Gene 268: 173-82.
Brown MV, Burnett PE, Denning MF, Reynolds AB. (2009). “PDGF receptor
activation induces p120-catenin phosphorylation at serine 879 via a PKCalpha-dependent pathway.” Exp Cell Res 315: 39-49.
Cao L, Yu Y, Bilke S, Walker RL, Mayeenuddin LH, Azorsa DO, Yang F, Pineda
M, Helman LJ, Meltzer PS. (2010). “Genome-wide identification of PAX3-FKHR binding sites in rhabdomyosarcoma reveals candidate target genes important for development and cancer.” Cancer Res 70:6497-508.
Cao R, Tsukada Y, Zhang Y. (2005). “Role of Bmi1 and Ring1A in H2A
ubiquitylation and Hox gene silencing.” Mol Cell 20: 845-54. Cao Y, Yao Z, Sarkar D, Lawrence M, Sanchez GJ, Parker MH, MacQuarrie KL,
Davison J, Morgan MT, Ruzzo WL, Gentleman RC, Tapscott SJ. (2010). “Genome-wide MyoD binding in skeletal muscle cells: a potential for broad cellular reprogramming.” Dev Cell 18:662-74.
Castellanos A, Vicente-Dueñas C, Campos-Sánchez E, Cruz JJ, García-Criado
FJ, García-Cenador MB, Lazo PA, Pérez-Losada J, Sánchez-García I. (2010). “Cancer as a reprogramming-like disease: implications in tumor development and treatment.” Semin Cancer Biol 20:93-7.
130
Chadashvili T and Peterson DA. (2006). “Cytoarchitecture of fibroblast growth factor receptor 2 (FGFR-2) immunoreactivity in astrocytes of neurogenic and non-neurogenic regions of the young adult and aged rat brain.” J Comp Neurol 498: 1-15.
Charytonowicz E, Cordon-Cardo C, Matushansky I, Ziman M. (2009). “Alveolar
rhabdomyosarcoma: is the cell of origin a mesenchymal stem cell?” Cancer Lett 279:126-36.
Chen Y, Teng FYH, Tang BL. (2006). “Coaxing bone marrow stromal
mesenchymal stem cells towards neuronal differentiation: progress and uncertainties.” Cell Mol Life Sci 63: 1649-57.
Chittezhath M, Frump AL, Jourquin J, Lobdell N, Eid JE. (2008). “The proto-
oncoprotein SYT (SS18) controls ATP release and regulates cyst formation by polarized MDCK cells.” Exp Cell Res 314: 3551-62.
Cironi L, Prover P, Riggi N, Janiszewska M, Suva D, Suva M-L, Kindler V,
Stamenkovic J. (2009). “Epigenetic features of human mesenchymal stem cells determine their permissiveness for induction of relevant transcriptional changes by SYT-SSX1.” PLoS One 4: e7904. doi: 10.1371/journal.pone.0007904.
Clark J, Rocques PJ, Crew AJ, Gill S, Shipley J, Chan AM-L, Gusterson BA,
Cooper CS. (1994). “Identification of novel genes, SYT and SSX, involved in the t(X;18)(p11.2;q11.2) translocation found in human synovial sarcoma.” Nat Genet 7: 502-8.
Colter DC, Sekiya I, Prockop DJ. (2001). “Identification of a subpopulation of
rapidly self-renewing and multipotential adult stem cells in colonies of human marrow stromal cells.” Proc Natl Acad Sci USA 98:7841-5.
Crew AJ, Clark J, Fisher C, Gill S, Grimer R, Chand A, Shipley J, Gusterson BA,
Cooper CS. (1995). “Fusion of SYT to two genes, SSX1 and SSX2 encoding proteins with homology to the Kruppel-associated box in human synovial sarcoma.” EMBO J 14: 2333-40.
de Bie P, Zaaroor-Regev D, Ciechanover A. (2010). “Regulation of the Polycomb
protein Ring1B ubiquitination by USP7.” Biochem Biophys Res Commun 400: 389-95.
de Bruijn DR, Allander SV, van Dijk AHA, Willemse MP, Thijssen J, van
Groningen JJM, Meltzer PS, Geurts van Kessel A. (2006a). “The synovial sarcoma-associated SS18-SSX2 fusion protein induces epigenetic gene (de)regulation.” Cancer Res 66: 9474-82.
131
de Bruijn DR, Baats E, Zechner U, de Leeuw B, Balemans M, Olde Weghuis D, Hirning-Folz U, Geurts van Kessel A. (1996). “Isolation and characterization of the mouse homolog of SYT, a gene implicated in the development of human synovial sarcomas.” Oncogene 13: 643-8.
de Bruijn DR, dos Santos NR, Kater-Baats E, Thijssen J, van den Berk L, Stap J,
Balemans M, Schepens M, Merkx G, Geurts van Kessel A. (2002). “The cancer-related protein SSX2 interacts with the human homologue of a Ras-like GTPase interactor, RAB3IP, and a novel nuclear protein, SSX2IP.” Genes Chromosomes Cancer 34: 285-98.
de Bruijn DR, dos Santos NR, Thijssen J, Balemans M, Debernardi S, Linder B,
Young BD, Geurts van Kessel A. (2001). “The synovial sarcoma associated protein SYT interacts with the acute leukemia associated protein AF10.” Oncogene 20: 3281-89.
de Bruijn DR, Peters WJM, Chuva de Sousa Lopes SM, van Dijk AHA, Willemse
MP, Pfundt R, de Boer P, Geurts van Kessel A. (2006b). “Targeted disruption of the synovial sarcoma-associated SS18 gene causes early embryonic lethality and affects PPARBP expression.” Hum Mol Genet 15: 2936-44.
de Bruijn DR, van Dijk AHA, Willemse MP, Geurts van Kessel A. (2008). “The C
terminus of the synovial sarcoma-associated SSX proteins interacts with the LIM homeobox protein LHX4.” Oncogene 27: 653-62.
de Hoon MJL, Imoto S, Nolan J, Miyano S. (2004). “Open source clustering
software.” Bioinformatics 20: 1453-4. dos Santos NR, de Bruijn DR, Balemans M, Janssen B, Gärtner F, Lopes JM,
deLeeuw B, Geurts van Kessel A. (1999). “Nuclear localization of SYT, SSX, and the synovial sarcoma-associated SYT-SSX fusion proteins.” Hum Mol Genet 6: 1549-58.
dos Santos NR, de Bruijn DR, Geurts van Kessel A. (2001). “Molecular
mechanisms underlying human synovial sarcoma development.” Genes Chromosomes Cancer 30: 1-14.
dos Santos NR, de Bruijn DR, Kater-Baats E, Otte AP, Geurts van Kessel A.
(2000). “Delineation of the protein domains responsible for SYT, SSX, and SYT-SSX nuclear localization.” Exp Cell Res 256: 192-202.
Drewell RA, Arney KL, Arima T, Barton SC, Brenton JD, Surani MA. (2002).
“Novel conserved elements upstream of the H19 gene are transcribed and act as mesodermal enhancers.” Development 129: 1205-13.
132
Edgar R, Domrachev M, Lash AE. (2002). “Gene Expression Omnibus: NCBI gene expression and hybridization array data repository.” Nucleic Acids Res 30: 207-10.
Eid JE, Kung AL, Scully R, Livingston DM. (2000). “p300 interacts with the
nuclear proto-oncoprotein SYT as part of the active control of cell adhesion.” Cell 102: 839-48.
Elderkin S, Maertens GN, Endoh M, Mallery DL, Morrice N, Koseki H, Peters G,
Brockdorff N, Hiom K. (2007). “A phosphorylated form of Mel-18 targets the Ring1B histone H2A ubiquitin ligase to chromatin.” Mol Cell 28: 107-20.
Ever L and Gaiano N. (2005). “Radial 'glial' progenitors: neurogenesis and
signaling.” Curr Opin Neurobiol 15: 29-33. Farnham PJ. (2009). “Insights from genomic profiling of transcription factors.” Nat
Rev Genet 10:605-16. Feldman AT and Dapson RW. (1974). “Relative effectiveness of various solvents
for Oil Red O.” Med Lab Technol 31: 335-41. Frietze S and Farnham PJ. (2011). “Transcription factor effector domains.” in A
Handbook of Transcription Factors, Subcell Biochem, ed Hughes TR. (Springer) 52: 261-77 doi: 10.1007/978-90-481-0_12.
Fujita PA, Rhead B, Zweig AS, Hinrichs AS, Karolchik D, Cline MS, Goldman M,
Barber GP, Clawson H, Coelho A, Diekhans M, Dreszer TR, Giardine BM, Harte RA, Hillman-Jackson J, Hsu F, Kirkup V, Kuhn RM, Learned K, Li CH, Meyer LR, Pohl A, Raney BJ, Rosenbloom KR, Smith KE, Haussler D, Kent WJ. (2010). “The UCSC genome browser database: update 2011.” Nucleic Acids Res doi: 10.1093/nar/gkq963.
Fukukawa C, Nagayama S, Tsunoda T, Toguchida J, Nakamura Y, Katagiri T.
(2009). “Activation of the non-canonical Dvl-Rac1-JNK pathway by Frizzled homologue 10 in human synovial sarcoma.” Oncogene 28: 1110-20.
Gaspar-Maia A, Alajem A, Meshorer E, Ramalho-Santos M. (2011). “Open
chromatin in pluripotency and reprogramming.” Nature Rev Mol Cell Biol 12: 36-47.
Giardine B, Riemer C, Hardison RC, Burhans R, Elnitski L, Shah P, Zhang Y,
Blankenberg D, Albert I, Taylor J, Miller W, Kent WJ, Nekrutenko A. (2005). "Galaxy: a platform for interactive large-scale genome analysis." Genome Res 15:1451-5.
133
Goecks, J, Nekrutenko, A, Taylor, J and The Galaxy Team. (2010). “Galaxy: a comprehensive approach for supporting accessible, reproducible, and transparent computational research in the life sciences.” Genome Biol 11:R86.
Gupta S, Stamatoyannopolous JA, Bailey T, Noble WS. (2007). “Quantifying
similarity between motifs.” Genome Biol 8: R24 doi:10.1186/gb-2007-8-2-r24.
Gurdon JB and Melton DA. (2008). “Nuclear reprogramming in cells.” Science
322:1811-5. Gu W and Roeder RG. (1997). “Activation of p53 sequence-specific DNA binding
by acetylation of the p53 C-terminal domain.” Cell 90: 595-606. Güre AO, Wei IJ, Old LJ, Chen Y-T. (2002). “The SSX gene family:
characterization of 9 complete genes.” Int J Cancer 101: 448-53. Haldar M, Hancock JD, Coffin CM, Lessnick SL, Capecchi MR. (2007). “A
conditional mouse model of synovial sarcoma: insights into a myogenic origin.” Cancer Cell 11: 375-88.
Haldar M, Hedberg ML, Hockin MF, Capecchi MR. (2009). “A CreER-based
random induction strategy for modeling translocation-associated sarcomas in mice.” Cancer Res 69: 3657-64.
Haldar M, Randall RL, Capecchi MR. (2008). “Synovial sarcoma: from genetics
to genetic-based animal modeling.” Clin Orthop Relat Res doi: 10.1007/s11999-008-0340-2.
Henikoff S and Shilatifard A. (2011). “Histone modification: cause or cog?”
Trends Genet 27: 389-96. Hernández-Muñoz I, Lund AH, van der Stoop P, Boutsma E, Muijrers I,
Verhoeven E, Nusinow DA, Panning B, Marahrens Y, van Lohuizen M. (2005). “Stable X chromosome inactivation involves the PRC1 Polycomb complex and requires histone MACROH2A1 and the CULLIN3/SPOP ubiquitin E3 ligase.” Proc Natl Acad Sci USA 102: 7635-40.
Ho L, Miller EL, Ronan JL, Ho WQ, Jothi R, Crabtree GR. (2011). “esBAF
facilitates pluripotency for LIF/STAT3 signalling and by regulating polycomb function.” Nature Cell Biol 13 903-13.
Huang W, Yang S, Shao J, Li YP. (2007). “Signaling and transcriptional
regulation in osteoblast commitment and differentiation.” Front Biosc12: 3068-92.
134
Hupkes M, van Someren EP, Middelkamp SH, Piek E, van Zoelen EJ, Dechering KJ. (2011). “DNA methylation restricts spontaneous multi-lineage differentiation of mesenchymal progenitor cells, but is stable during growth factor-induced terminal differentiation.” Biochim Biophys Acta 1813: 839-49.
Ishibe T, Nakayama T, Aoyama T, Nakamura T, Toguchida J. (2008). “Neuronal
differentiation of synovial sarcoma and its therapeutic application.” Clin Orthop Relat Res 466: 2147-55.
Ishibe T, Nakayama T, Okamoto T, Aoyama T, Nishijo K, Shibata KR, Shima Y,
Nagayama S, Katagiri T, Nakamura Y, Nakamura T, Toguchida J. (2005). “Disruption of fibroblast growth factor signal pathway inhibits the growth of synovial sarcomas: potential application of signal inhibitors to molecular target therapy.” Clin Cancer Res 11: 2702-12.
Ishida M, Miyamoto M, Naitoh S, Tatsuda D, Hasegawa T, Nemoto T, Yokozeki
H, Nishioka K, Matsukage A, hki M, Ohta T. (2007). “The SYT-SSX fusion protein down-regulates the cell proliferation regulator COM1 in t(X;18) synovial sarcoma.” Mol Cell Biol 27: 1348-55.
Ishida M, Tanaka S, Ohki M, Ohta T. (2004). “Transcriptional co-activator activity
of SYT is negatively regulated by BRM and Brg1.” Genes Cells 9: 419-28. Ito T, Ouchida M, Ito S, Jitsumori Y, Morimoto Y, Ozaki T, Kawai A, Inoue H,
Shimizu K. (2004). “SYT, a partner of SYT-SSX oncoprotein in synovial sarcomas, interacts with mSin3A, a component of histone deacetylase complex.” Lab Invest 84: 1484-90.
Iwasaki T, Koibuci N, Chin WW. (2005). “Synovial sarcoma translocation (SYT)
encodes a nuclear receptor coactivator.” Endocrinol 146: 3892-9. Jones PA and Baylin SB. (2007). “The epigenomics of cancer.” Cell 128: 683-
92. Kato H, Tjernberg A, Zhang W, Kruchinsky AN, An W, Takeuchi T, Ohtsuki Y,
Sugano S, de Bruijn DR, Chait BT, Roeder RG. (2002). “SYT associates with human SNF/SWI complexes and the C-terminal region of its fusion partner SSX1 targets histones.” J Biol Chem 277: 5498-5505.
Katoh M. (2008). “Cancer genomics and genetics of FGFR2.” Int J Oncol 33:
233-237. Katoh Y and Katoh M. (2009). “FGFR2-related pathogenesis and FGFR2-
targeted therapeutics.” Int J Mol Med 23: 307-11.
135
Kawai A, Naito N, Yoshida A, Morimoto Y, Ouchida M, Shimizu K, Beppu Y. (2004). “Establishment and characterization of a biphasic synovial sarcoma cell line, SYO-1.” Cancer Lett 204: 105-13.
Kent WJ, Sugnet CW, Furey TS, Roskin KM, Pringle TH, Zahler AM, Haussler D.
(2002). “The human genome browser at UCSC.” Genome Res 12: 996-1006.
Kerppola TK. (2009). “Polycomb group complexes – many combinations, many
functions.” Trends Cell Biol 19: 692-704. Khan J, Bittner ML, Saal LH, Teichmann U, Azorsa DO, Gooden GC, Pavan WJ,
Trent JM, Meltzer PS. (1999). “cDNA microarrays detect activation of a myogenic transcription program by the PAX3-FKHR fusion oncogene.” Proc Natl Acad Sci USA 96: 13264-9.
Kim J, Swee M, Parks WC. (2009). “Cytosolic SYT/SS18 isoforms are actin-
associated proteins that function in matrix-specific adhesion.” PLoS One 4: e6455. doi:10.1371/journal.pone.0006455.
Kimura T, Sakai M, Tabu K, Wang L, Tsunematsu R, Tsuda M, Sawa H,
Nagashima K, Nishihara H, Hatakeyama S, Nakayama K, Ladanyi M, Tanaka S, Nakayama KI. (2009). “Human synovial saroma proto-oncogene Syt is essential for early embryonic development through the regulation of cell migration.” Lab Invest 89: 645-56.
Koche RP, Smith ZD, Adli M, Gu H, Ku M, Gnirke A, Bernstein BE, Meissner A.
(2010). “Reprogramming factor expression initiates widespread chromatin remodeling.” Cell Stem Cell 8: 96-105.
Ku M, Koche RP, Rheinbay E, Mendenhall EM, Endoh M, Mikkelsen TS, Presser
A, Nusbaum C, Xie X, Chi AS, Adli M, Kasif S, Ptaszek LM, Cowan CA, Lander ES, Koseki H, Bernstein BE. (2008). “Genomewide analysis of PRC1 and PRC2 occupancy identifies two classes of bivalent domains.” PLoS Genet 4: e1000242 doi: 10.1371/journal.pgen.1000242.
Ladanyi M. (2001). “Fusions of the SYT and SSX genes in synovial sarcoma.” Oncogene 20: 5755-62.
Langmead B, Trapnell C, Pop M, Salzberg SL. (2009). “Ultrafast and memory-
efficient alignment of short DNA sequences to the human genome.” Genome Biol 10: R25 doi:10.1186/gb-2009-10-3-r25.
Lee MG, Villa R, Troje P, Norman J, Yan K-P, Reinberg D, Di Croce L,
Shiekhattar R. (2007). “Demethylation of H3K27 regulates Polycomb recruitment and H2A ubiquitination.” Science doi: 10.1126/science.1149042.

136
Lim FL, Soulez M, Koczan D, Thiesen H-J, Knight JC. (1998). “A KRAB-related domain and a novel transcription repression domain in proteins encoded by SSX genes that are disrupted in human sarcomas.” Oncogene 17: 2013-8.
Lessard JA and Crabtree GR. (2010). “Chromatin regulatory mechanisms in
pluripotency.” Annu Rev Cell Dev Biol 26: 503-32. Lobo NA, Shimono Y, Qian D, Clarke MF. (2007). “The biology of cancer stem
cells.” Annu Rev Cell Dev Biol 23: 675-99. Lubieniecka JM, de Bruijn DR, Su L, van Dijk AHA, Subramanian S, van de Rijn
M, Poulin N, Geurts van Kessel A, Nielsen TO. (2008). “Histone deacetylase inhibitors reverse SS18-SSX-mediated Polycomb silencing of tumor suppressor Early Growth Response 1 in synovial sarcoma.” Cancer Res 68: 4303-10.
McLeay RC, Leat CJ, Bailey TJ. (2011). “Tissue-specific prediction of directly
regulated genes.” Bioinformatics 27: 2354-60. Mackall CL, Meltzer PS, Helman LJ. (2004). “Focus on sarcomas.” Cancer Cell
2: 175-8. Maglott D, Ostell J, Pruitt KD, Tatusova T. (2006). “Entrez Gene: gene-centered
information at NCBI.” Nucleic Acids Res 35 (suppl 1): D26-31. Machinis K, Pantel J, Netchine I, Léger J, Camand OJ, Sobrier ML, Dastoat-Le
Moal F, Duquesnoy P, Abitbol M, Czernichow P, Amselem S. (2001). “Syndromic short stature in patients with a germline mutation in the LIM homeobox LXH4.” Am J Hum Genet 69: 961-8.
Maric D, Fiorio Pla A, Chang YH, Barker JL. (2007). “Self-renewing and
differentiating properties of cortical neural stem cells are selectively regulated by basic fibroblast growth factor (FGF) signaling via specific FGF receptors.” J Neurosci 27: 1836-52.
Mateos-Langerak J and Cavalli G. (2008). “Polycomb group proteins and long-
range gene regulation.” Adv Genet 61: 45-66. Miraoui H and Marie PJ. (2010). “Fibroblast growth factor receptor signaling
crosstalk in skeletogenesis.” Sci Signal 3: re9. Morgulis A, Gertz EM, Schaffer AA, Agarwala R. (2006). “A fast and symmetric
DUST implementation to mask low-complexity DNA sequences.” J Comput Biol 13: 1028-40.
137
Muruganandan S, Roman AA, Sinal CJ. (2009). “Adipocyte differentiation of bone marrow-derived mesenchymal stem cells: crosstalk with the osteoblastogenic program.” Cell Mol Life Sci 66: 236-53.
Nagai M, Tanaka S, Tsuda M, Endo S, Kato H, Sonobe H, Minai A, Hiraga H,
Nishihara H, Sawa H, Nagashima K. (2001). “Analysis of transforming activity of human synovial sarcoma-associated chimeric protein SYT-SSX1 bound to chromatin remodeling factor hBRM/hSNF2α.” Proc Natl Acad Sci USA 98: 3843-8.
Naka N, Takenaka S, Araki N, Miwa T, Hasimoto N, Yoshioka K, Joyama S,
Hamada K-I, Tsukamoto Y, Tomita Y, Ueda T, Yoshikawa H, Itoh K. (2010). “Synovial sarcoma is a stem cell malignancy.” Stem Cells 28: 1119-31.
Nakatani Y and Ogryzko V. (2003). “Immunoaffinity purification of mammalian
protein complexes.” Methods Enzymol 370: 430-44. Natsume-Kitatani Y, Shiga M, Mamitsuka H. (2011). “Genome-wide integration
on transcription factors, histone acetylation and gene expression reveals genes co-regulated by histone modification patterns.” PLoS One 6: e22281. doi:10.1371/journal.pone.0022281.
Nielsen TO, West RB, Linn SC, Alter O, Knowling MA, O‟Connell JX, et al.
(2002). “Molecular characterisation of soft tissue tumours: a gene expression study.” Lancet 359: 1301-7.
Odelberg SJ, Kohlhoff A, Keating MT. (2000). “Dedifferentiation of mammalian
myotubes induced by msx1.” Cell 103: 1099-109. Ong C-T and Corces VG. (2011). “Enhancer function: new insights into the
regulation of tissue-specific gene expression.” Nat Rev Genet 12: 283-93. Orford K, Kharchenko P, Lai W, Dao MC, Worhunsky DJ, Ferro A, Janzen V,
Park PJ, Scadden DT. (2007). “Differential H3K4 methylation identifies developmentally posed hematopoietic genes.” Dev Cell doi: 10.1016/j.devcel.2008.04.002.
Pardo OE, Latigo J, Jeffery RE, Nye E, Poulsom R, Spencer-Dene B, Lemoine
NR, Stamp GW, Aboagye EO, Seckl MJ. (2009). “The fibroblast growth factor receptor inhibitor PD173074 blocks small cell lung cancer growth in vitro and in vivo.” Cancer Res 69:8645-51.
138
Perani M, Antonson P, Hamoudi R, Ingram CJE, Cooper CS, Garrett MD, Goodwin GH. (2005). “The proto-oncoprotein SYT interacts with SYT-interacting protein/Co-activator Activator (SIP/CoAA), an human nuclear receptor co-activator with similarity to EWS and TLS/FUS family of proteins.” J Biol Chem 280: 42863-76.
Perani M, Ingram CJE, Cooper CS, Garrett MD, Goodwin GH. (2003).
“Conserved SNH domain of the proto-oncoprotein SYT interacts with components of the human chromatin remodeling complexes, while the QPGY repeat domain forms homo-oligomers.” Oncogene 22: 8156-67.
Pretto D, Barco R, Rivera J, Neel N, Gustavson MD, Eid JE. (2006). “The
synovial sarcoma translocation protein SYT-SSX2 recruits β-catenin to the nucleus and associates with it in an active complex.” Oncogene 25: 3661-9.
Pruitt KD, Tatusova T, Maglott DR. (2007). “NCBI Reference Sequence
(RefSeq): a curated non-redundant database of genomes, transcripts and proteins.” Nucleic Acids Res 35(Database issue): D61-5. doi: 10.1093/nar/gkl842.
Rada-Iglesias A, Bajpal R, Swigut T, Brugmann SA, Flynn RA, Wysocka J.
(2010). “A unique chromatin signature uncovers early developmental enhancers in humans.” Nature doi:10.1038/nature09692.
Rao PS, Satelli A, Zhang S, Srivastava SK, Srivenugopal SK, Rao US. (2009).
“RNF2 is the target for phosphorylation by the p38 MAPK and ERK signaling pathways.” Proteomics 9: 1-12.
Ren X and Kerppola TK. (2011). “REST interacts with Cbx proteins and regulates
Polycomb Repressive Complex 1 occupancy at RE1 elements.” Mol Cell Biol 31: 2100-10.
Safran M, Dalah I, Alexander J, Rosen N, Iny Stein T, Shmoish M, Nativ N, Bahir
I, Doniger T, Krug H, Sirota-Madi A, Olender T, Golan Y, Stelzer G, Harel A, Lancet D. (2010). “GeneCards Version 3:the human gene integrator.” Database doi:10.1093/database/baq020.
Saito T, Nagai M, Ladanyi M. (2006). “SYT-SSX1 and SYT-SSX2 interfere with
repression of E-cadherin by Snail and Slug: a potential mechanism for aberrant mesenchymal to epithelial transition in human synovial sarcoma.” Cancer Res 66: 6919-27.
Saldanha AJ. (2004). “Java Treeview – extensible visualization of microarray
data.” Bioinformatics 20: 3246-8.
139
Scheuermann JC, de Ayala Alonso AG, Oktaba K, Ly-Hartig N, McGinty RK, Fraterman S, Wilm M, Muir TW, Müller J. (2010). “Histone H2A deubiquitinase activity of the Polycomb repressive complex PR-DUB.” Nature doi: 10.1038/nature08966.
Schoenherr CJ and Anderson DJ. (1995). “The Neuron-Restrictive Silencer
Factor (NRSF): a coordinate repressor of multiple neuron-specific genes.” Science 267: 1360-3.
Schuettengruber B, Chourrout D, Vervoort M, Leblanc B, Cavalli G. (2007).
“Genome regulation by Polycomb and Trithorax proteins.” Cell 128: 735-45.
Schwartz YB, Kahn TG, Stenberg P, Ohno K, Bourgon R, Pirrotta V. (2010).
“Alternative epigenetic chromatin states of Polycomb target genes.” PLoS Genet 6: e1000805. doi: 10.1037/journal.pgen.1000805.
Schwartz YB and Pirotta V. (2008). “Polycomb complexes and epigenetic states.”
Curr Opin Cell Biol 20: 1-8. Sekiya I, Larson BL, Smith JR, Pochampally R, Cui JG, Prockop DJ. (2002).
“Expansion of human adult stem cells from bone marrow stroma: conditions that maximize the yields of early progenitors and evaluate their quality.” Stem Cells 20:530-41.
Shakhova O and Sommer L. (2010). “Neural crest-derived stem cells.” in
Stembook, eds Gage F and Watt F. (The Stem Cell Research Community) doi/10.3824/stembook1.51.1, http://www.stembook.org.
Simon JA and Kingston RE. (2009). “Mechanisms of Polycomb gene silencing:
knowns and unknowns.” Nat Rev Mol Cell Biol 10: 697-708. Skytting B, Nilsson G, Brodin B, Xie Y, Lundeberg J, Uhlén M, Larsson O.
(1999). “A novel fusion gene, SYT-SSX4, in synovial sarcoma.” J Natl Cancer Institute 91: 974-5.
Smeenk L, van Heeringen SJ, Koeppel M, Gilbert B, Janssen-Megens E,
Stunnenberg HG, Lohrum M. (2011). “Role of p53 serine 56 phosphorylation in p53 target gene regulation.” PLoS One 6:e17574.
Smith HA and McNeel DG. (2010). “The SSX family of cancer-testis antigens as
targets for tumor therapy.” Clin Dev Immunol doi: 10.1155/2010/150951. Sparmann A and van Lohuizen M. (2006). “Polycomb silencers control cell fate,
development and cancer.” Nat Rev Cancer 6: 846-56.
140
Storlazzi CT, Mertens F, Mandahl N, Gisselsson D, Isaksson M, Gustafson P, Domanski HA, Panagopoulos I. (2003). “A novel fusion gene, SS18L1/SSX1 in synovial sarcoma.” Genes Chromosomes Cancer 37: 195-200
Sun Y, Gao D, Liu Y, Huang J, Lessnick S, Tanaka S. (2006). “IGF2 is critical for
tumorigenesis by synovial sarcoma oncoprotein SYTSSX1.” Oncogene 25: 1042-52.
Thaete C, Brett D, Monaghan P, Whitehouse S, Renie G, Rayner E, Cooper CS,
Goodwin G. (1999). “Functional domains of the SYT and SYT-SSX synovial sarcoma translocation proteins and co-localization with the SNF protein BRM in the nucleus.” Hum Mol Genet 8: 585-91.
Tie F, Banerjee R, Stratton CA, Prasad-Sinha J, Stepanik V, Zlobin A, Diaz MO,
Scarcheri PC, Harte PJ. (2009). “CBP-mediated acetylation of histone H3 lysine 27 antagonizes Drosophila Polycomb silencing.” Dev 136: 3131-41.
Törnkvist M, Natalishvili N, Xie Y, Girnita A, D‟Arcy P, Brodin B, Axelson M,
Girnita L. (2008). “Differential roles of SS18-SSX fusion gene and insulin-like growth factor-1 receptor in synovial sarcoma.” Biochem Biophys Res Commun 368: 793-800.
Trojer P and Reinberg D. (2007). “Facultative heterochromatin: Is there a
distinctive molecular signature?” Mol Cell 28: 1-13. Tsuda M, Watanabe T, Seki T, Kimura T, Sawa H, Minami A, Akagi T, Isobe K-I,
Nagashima K, Tanaka S. (2005). “Induction of p21WAF1/CIP1 by human synovial sarcoma-associated chimeric oncoprotein SYTSSX1.” Oncogene 24: 7984-90.
Vichai V and Kirtikara K. (2006). “Sulforhodamine B colorimetric assay for
cytotoxicity screening.” Nat Protoc 1: 1112-1116. Villegas SN, Canham, M, Brickman, JM. (2010). “FGF signaling as a mediator of
lineage transitions – Evidence from embryonic stem cell differentiation.” J Cell Biochem 110: 10-20.
Voncken JW, Niessen H, Neufeld B, Rennefahrt U, Dahlmans V, Kubben N,
Holzer B, Ludwig S, Rapp UR. (2005). “MAPKAP kinase 3pK phosphorylates and regulates chromatin association of the Polycomb group protein Bmi1.” J Biol Chem 280: 5178-87.
141
Voncken JW Schweizer D, Aagaard L, Sattler L, Jantsch MF, van Lohuizen M. (1999). “Chromatin-association of the Polycomb group protein BMI1 is cell-cycle regulated and correlates with its phosphorylation status.” J Cell Sci 112: 4627-39.
Wang J. (2011). “Computational study of associations between histone
modifications and protein-DNA binding in yeast genome by integrating diverse information.” BMC Genomics 12: 172. doi: 10.1186/1471-2164-12-172.
Watanabe T, Tsuda M, Makino Y, Ichihara S, Sawa H, Minami A, Mochizuke N,
NagashimaK, Tanaka S. (2006). “Adaptor molecule Crk is required for sustained phosphorylation of Grb2-associated binder 1 and hepatocyte growth factor-induced cell motility of human synovial sarcoma cell lines.” Mol Cancer Res 4: 499-510.
Watanabe T, Tsuda M, Tanaka S, Ohba Y, Kawaguchi H, Majima T, Sawa H,
Minami A. (2009). “Adaptor protein Crk induces Src-dependent activation of p38 MAPK in regulation of synovial sarcoma cell proliferation.” Mol Cancer Res 7: 1582-92.
Watanabe Y, Kameoka S, Gopalakrishnan V, Aldape KD, Pan ZZ, Lang FF,
Majumder S. (2004). “Conversion of myoblasts to physiologically active neuronal phenotype.” Genes Dev 18: 889-900.
Weake VM and Workman JL. (2008). “Histone ubiquitination: triggering gene
activity.” Mol Cell 29: 653-63. Weintraub H, Tapscott SJ, Davis RL, Thayer MJ, Adam MA, Lassar AB, Miller
AD. (1989). “Activation of muscle-specific genes in pigment, nerve, fat, liver, and fibroblast cell lines by forced expression of MyoD.” Proc Natl Acad Sci USA 86: 5434-8.
Xie Y, Skytting B, Nilsson G, Brodin B, Larsson O. (1999). “Expression of Insulin-
like Growth Factor-1 Receptor in synovial sarcoma: association with an aggressive phenotype.” Cancer Res 59: 3588-91.
Zhang Y, Liu T, Meyer CA, Eeckhoute J, Johnson DS, Bernstein BE, Nusbaum
C, Myers RM, Brown M, Li W, Liu XS. (2008). “Model-based analysis of ChIP-Seq (MACS)” Genome Biol 9: R137 doi:10.1186/gb-2008-9-9-r137.
Zhao C, Deng W, Gage FH. (2008). “Mechanisms and functional implications of
adult neurogenesis.” Cell 132: 645-60.
Related Documents


