Evaluation of the implementation status, outcomes and challenges of “Auditable Pharmaceuticals Transactions and Services” in selected hospitals of Ethiopia By Ayalew Adinew A Research Project Submitted to College of Health Sciences, Jimma University; Health Research and Graduate Coordinating Office, in Partial Fulfillment for the Requirement of Masters of Public Health (MPH) Oct 2015 Jimma University, Ethiopia

Welcome message from author
This document is posted to help you gain knowledge. Please leave a comment to let me know what you think about it! Share it to your friends and learn new things together.
Transcript
The findings of APTS evaluation by: A. Adinew. S. Ololo. F. Tessema Oct 2015
Evaluationoftheimplementationstatus,outcomesand
challengesof“AuditablePharmaceuticalsTransactions
andServices”inselectedhospitalsofEthiopia
By
Ayalew Adinew
A Research Project Submitted to College of Health Sciences, Jimma University;
Health Research and Graduate Coordinating Office, in Partial Fulfillment for the
Requirement of Masters of Public Health (MPH)
Oct 2015
Jimma University, Ethiopia
The findings of APTS evaluation by: A. Adinew. S. Ololo. F. Tessema Oct 2015
i
Evaluationoftheimplementationstatus,outcomesand
challengesof“AuditablePharmaceuticalsTransactions
andServices”intenselectedhospitalsofEthiopia
By
Ayalew Adinew
Advisors:
Shimeles Ololo (MPH, Assistant Professor, Jimma University)
Fasil Tessema (MSc, Associate Professor, Jimma University)
Oct 2015
Jimma University, Ethiopia
The findings of APTS evaluation by: A. Adinew. S. Ololo. F. Tessema Oct 2015
ii
Abstract
Background: Availability of essential medicines is necessary to maintain health of the
community. In Ethiopia, availability of medicines was low (65%), with high expiry rate (8.24%),
low patient knowledge on correct dosage (50.5%) and satisfaction on pharmacy services
(74.5%). To avert these problems, the government had enacted legislation on a system called
“Auditable Pharmaceutical Transactions and Services (APTS)”. The system is being
implemented in more than 45 hospitals. However, the outcomes and challenges in
implementation of this system were not evaluated.
Objective: To measure the status, outcomes, and challenges of APTS implementation in selected
hospitals in Ethiopia.
Methods: Cross sectional descriptive study and multiple case study designs were used
employing both quantitative and qualitative methods. This research was conducted in 10 APTS
implementing hospitals. In-depth interviews were made with 10 CEOs and pharmacy heads.
Self-administered questionnaire was distributed to 348 pharmacy staffs. APTS reports of 153
months (with different characteristics) were also reviewed. Using W.H.O questionnaire, 1000
patients were interviewed for their knowledge on correct dosage and satisfaction. Quantitative
data was entered and analyzed using SPSS version 20. Multivariate logistic regression was used
to determine crude and adjusted OR.
Result: The implementation statuses of APTS ranged from 68% to 95%. Slopes for trends of
cumulative rate of medicines expiry (-0.089) and gross profit from medicines sales ranged from
77 to 4079 respectively. Patients’, who were served in hospitals which had APTS standards,
knew correct dosage 4.6 times more than otherwise (AOR=4.6, C.I.95%). Patients’ satisfaction
on pharmacy services were associated with availability of medicines and seated service for
special counseling (AOR=2.3, AOR=4, C.I.95%) respectively. Patients served in a hospital
which identified medicines for top ten diseases and follow regularly, have got their prescribed
medicines 7.5 times more than otherwise (AOR=7.5. C.I. 3.887-14.473)
Conclusion and recommendation: APTS evaluation showed that it reduces rate of medicines
expiry and improve patient knowledge on correct dosage and satisfaction. Therefore, I
recommended that; APTS should be scaled up to all health facilities in Ethiopia by FMOH and
beyond to all African countries by FMOH of Ethiopia and Africa Union.
The findings of APTS evaluation by: A. Adinew. S. Ololo. F. Tessema Oct 2015
iii
Acknowledgements
I would like to express my profound gratitude for the supervisors of the research Ato Shimeles
Ololo and Ato Fasil Tessema for their meticulous follow-up and guidance throughout the
research.
I would like to thank data collectors for their commitment and scrupulous activities they were
doing during data collection.
I am pleased to acknowledge my wife, Seble Fentaw for her marvelous assistance during data
entry of this study in to SPSS.
In addition to my advisers, I want also to extend my appreciation to my brothers and friends; Dr
Fekad Yeshaneh, Dr. Habtamu Adinew, Tenaw Andualem and Asrat Gebre, Bruk Wogayehu for
their comments
The findings of APTS evaluation by: A. Adinew. S. Ololo. F. Tessema Oct 2015
iv
Table of Contents
Abstract ........................................................................................................................................... 2
Acknowledgements ......................................................................................................................... 3
Table of Contents ........................................................................................................................... 4
List of Tables and Figures ............................................................................................................. 7
Abbreviations ................................................................................................................................ 11
Chapter 1: Introduction .............................................................................................................. 12
1.1. Background ....................................................................................................................... 12
1.2. Statement of the problem .................................................................................................. 14
1.3. Significance of the study ................................................................................................... 16
Chapter 2: Literature Review .................................................................................................... 17
I. Objectives of the APTS program .......................................................................................... 20
II. Conceptual framework for APTS evaluation; Adapted from Logic Model .................... 22
Chapter 3: Objectives ................................................................................................................... 23
3.1. General Objective .............................................................................................................. 23
3.4. Specific Objectives ............................................................................................................. 23
Chapter 4: Methodology .............................................................................................................. 24
4.1. Study area and period ....................................................................................................... 24
4.2. Study Design ...................................................................................................................... 25
4.3. Population ......................................................................................................................... 25
4.3.1. Source populations ............................................................................................................................ 25
4.3.2. Study populations .............................................................................................................................. 25
4.3.3. Inclusion criteria ................................................................................................................................ 26
4.3.4. Exclusion criteria ............................................................................................................................... 26
4.4. Sample Size and Sampling Technique ............................................................................. 26
4.4.1. Sample size determination ................................................................................................................. 26
4.4.2. Sampling Techniques ........................................................................................................................ 27
The findings of APTS evaluation by: A. Adinew. S. Ololo. F. Tessema Oct 2015
v
4.4.3. Sampling Frames: .............................................................................................................................. 28
4.5. Data Collection .................................................................................................................. 28
4.5.1. Development of data collection tools ................................................................................................ 28
4.5.2. Personnel recruitment and training .................................................................................................... 29
4.5.3. Data collection techniques ................................................................................................................. 29
4.6. Variables ............................................................................................................................ 30
4.6.1. Dependent variables .......................................................................................................................... 30
4.6.2. Independent variables ........................................................................................................................ 30
4.7. Operational Definition ...................................................................................................... 31
4.8. Data Processing and Analysis .......................................................................................... 33
4.9. Data Quality Management................................................................................................ 34
4.10. Ethical Considerations .................................................................................................. 34
4.11. Dissemination of Results ............................................................................................... 34
Chapter 5: Results ........................................................................................................................ 35
5.1. Socio Demographic Characteristics ................................................................................. 35
5.1. Documentary Survey ......................................................................................................... 36
5.2. Implementation status of APTS tools and systems .......................................................... 37
5.2.1. Efficient Budget Utilization (Result Area 1 of 4) .............................................................................. 37
5.2.2. Affordability ...................................................................................................................................... 46
5.2.3. Transparency; (outcomes of result area 2) ......................................................................................... 47
5.2.4. Effective workforce development, deployment and organization (Result A. 3) ................................ 48
5.2.5. Reliable information on product, finance and services; (result area 4) ............................................. 52
5.3. Availability of prescribed medicines ................................................................................. 52
5.4. Patient knowledge on correct dosage ............................................................................... 55
5.5. Patient satisfaction on pharmacy services ....................................................................... 58
Chapter 6: Discussion .................................................................................................................. 63
5.5. Socio demographic characteristics ................................................................................... 63
5.6. Rate of Expiry.................................................................................................................... 63
5.7. Income from sales of medicines and Affordability .......................................................... 65
5.8. Transparency ..................................................................................................................... 67
5.9. Effective workforce deployment, development and organization (R. Area 3) ................ 69
5.9.1. Pharmacy premises and workflow adjustment .................................................................................. 69
5.9.2. Human power adjustment .................................................................................................................. 69
The findings of APTS evaluation by: A. Adinew. S. Ololo. F. Tessema Oct 2015
vi
5.10. Availability of prescribed medicines and factors affecting .......................................... 69
5.11. Patient knowledge and factors affecting ...................................................................... 70
5.12. Patient satisfaction ........................................................................................................ 70
5.12.1. Patient satisfaction on overall pharmacy services ............................................................................. 71
5.12.2. Patient satisfaction on personnel services.......................................................................................... 71
5.12.3. Arrangement of workflow; a factor for patient satisfaction ............................................................... 72
5.13. Challenges of APTS implementation............................................................................ 73
5.14. Limitations of the Study ................................................................................................ 73
Chapter 7: Conclusion and Recommendation ............................................................................ 73
7.1. Conclusion ......................................................................................................................... 73
7.2. Recommendations ............................................................................................................. 75
Reference ...................................................................................................................................... 76
Annexes ........................................................................................................................................ 80
5.15. Annex 1. Check list for document review ..................................................................... 80
5.16. Annex 2: In-depth interview guide ......................................................................... 91
5.17. Annex 3: Self-Administered Questionnaire ................................................................. 94
5.18. Annex 4 Questionnaires to measure patient knowledge on correct dosage and
satisfaction on pharmacy services -adopted from W.H.O drug use indicators: ...................... 103
5.19. Annex 5: Consent Form for in depth interview .................................................. 108
5.20. Annex 7: Budget Breakdown .................................................................................. 109
5.21. Annex 8, APTS implementing sites, when data collection started, ........................... 110
as of March 2015........................................................................................................................ 110
5.22. Annex 9, Name list of data collectors ......................................................................... 111
The findings of APTS evaluation by: A. Adinew. S. Ololo. F. Tessema Oct 2015
vii
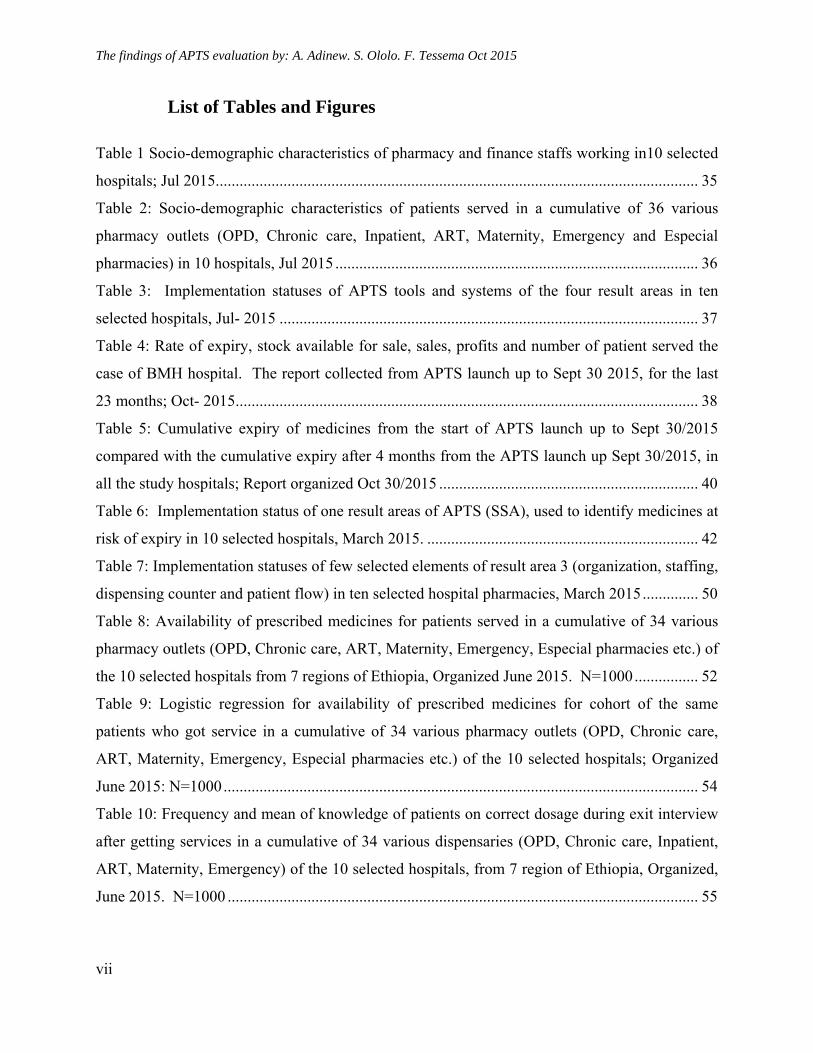
List of Tables and Figures
Table 1 Socio-demographic characteristics of pharmacy and finance staffs working in10 selected
hospitals; Jul 2015......................................................................................................................... 35
Table 2: Socio-demographic characteristics of patients served in a cumulative of 36 various
pharmacy outlets (OPD, Chronic care, Inpatient, ART, Maternity, Emergency and Especial
pharmacies) in 10 hospitals, Jul 2015 ........................................................................................... 36
Table 3: Implementation statuses of APTS tools and systems of the four result areas in ten
selected hospitals, Jul- 2015 ......................................................................................................... 37
Table 4: Rate of expiry, stock available for sale, sales, profits and number of patient served the
case of BMH hospital. The report collected from APTS launch up to Sept 30 2015, for the last
23 months; Oct- 2015 .................................................................................................................... 38
Table 5: Cumulative expiry of medicines from the start of APTS launch up to Sept 30/2015
compared with the cumulative expiry after 4 months from the APTS launch up Sept 30/2015, in
all the study hospitals; Report organized Oct 30/2015 ................................................................. 40
Table 6: Implementation status of one result areas of APTS (SSA), used to identify medicines at
risk of expiry in 10 selected hospitals, March 2015. .................................................................... 42
Table 7: Implementation statuses of few selected elements of result area 3 (organization, staffing,
dispensing counter and patient flow) in ten selected hospital pharmacies, March 2015 .............. 50
Table 8: Availability of prescribed medicines for patients served in a cumulative of 34 various
pharmacy outlets (OPD, Chronic care, ART, Maternity, Emergency, Especial pharmacies etc.) of
the 10 selected hospitals from 7 regions of Ethiopia, Organized June 2015. N=1000 ................ 52
Table 9: Logistic regression for availability of prescribed medicines for cohort of the same
patients who got service in a cumulative of 34 various pharmacy outlets (OPD, Chronic care,
ART, Maternity, Emergency, Especial pharmacies etc.) of the 10 selected hospitals; Organized
June 2015: N=1000 ....................................................................................................................... 54
Table 10: Frequency and mean of knowledge of patients on correct dosage during exit interview
after getting services in a cumulative of 34 various dispensaries (OPD, Chronic care, Inpatient,
ART, Maternity, Emergency) of the 10 selected hospitals, from 7 region of Ethiopia, Organized,
June 2015. N=1000 ...................................................................................................................... 55
The findings of APTS evaluation by: A. Adinew. S. Ololo. F. Tessema Oct 2015
viii
Table 11: Multivariate Logistic Regression analysis for knowledge of patients on correct dosage,
during exit interview among respondent patients who got pharmacy service in a cumulative of 34
various pharmacy outlets (OPD, Chronic care, ART, Maternity, Emergency, Especial
pharmacies) from pharmacies that have different implementation statuses of APTS; June, 2015;
N=1000 ......................................................................................................................................... 57
Table 12: Satisfaction of patients served in a cumulative of 34 various dispensing outlets (OPD,
Chronic care, Inpatient, ART, Maternity, Emergency, Especial pharmacies) of 10 selected
hospitals; using LIKERT scale questions and Nominal Scales questions, June 2015: N=1000 ... 59
Table 13: Multivariate logistic regression analysis for patient satisfaction with personnel service
in 10 selected hospitals; among respondents who got pharmacy services in a cumulative of 34
various pharmacy outlets (OPD, Chronic care, ART, Maternity, Emergency, Especial
pharmacies); of which hospital pharmacies with different level of implementation status of
APTS; June 2015 .......................................................................................................................... 60
Table 14: Multivariate logistic regression analysis for patients’ satisfaction with overall
pharmacy service in ten selected hospitals among respondents who got service in a cumulative
of 34 various pharmacy outlets (OPD, Chronic care, Inpatient, ART, Maternity, Emergency,
Especial pharmacies) of which hospital pharmacies with different level of implementation
statuses of APTS; June, 2015 N=1000 ......................................................................................... 61
Table 15: Crude and Adjusted Odds Ratio for patient satisfaction with dispensing process among
respondents for cohort of patients who got the service in a cumulative of 34 various pharmacies
(OPD, Chronic care, ART, Maternity, Emergency, Especial pharmacies etc.) of which hospital
pharmacies with different implementation statuses of APTS; June, 2015. N=1000 ................... 62
Graph7. 1 Rate of medicines expiry for the last 39 months in ten selected APTS implementing
hospitals from seven regions of Ethiopia; rate compared with the baseline (taken before APTS
implementation) up to September 30-2015. Report organized Oct 2015 ..................................... 40
Graph7. 2 The slope of the trend line of the cumulative rate of medicines expiry for the last 39
months of the ten selected APTS implementing hospitals from seven regions of Ethiopia; trend
compared with the baseline (taken before APTS implementation) up to September 30- 2015.
Report organized on Oct-2015 ...................................................................................................... 41
The findings of APTS evaluation by: A. Adinew. S. Ololo. F. Tessema Oct 2015
ix
Graph7. 3 The slope of the trend line of the rate of medicines expiry for the last 39 months in
DMH; trend compared with the baseline (taken before APTS implementation) up to September
2015; data organized Oct 2015. .................................................................................................... 42
Graph7. 4 Trends of cash sales of medicines in birr in ten selected APTS implementing hospitals
from 7 regions of Ethiopia: cash sales collected during 4500 days; starting from the first month
of APTS implementation in each hospital up to September 30, 2015 .......................................... 43
Graph7. 5 Trends of gross profit from cash sales of medicines in birr in ten selected hospitals
from 7 regions of Ethiopia: gross profit collected during 4500 days; starting from the first month
of APTS implementation in each hospital up to September 30, 2015 .......................................... 44
Graph7. 6 Trends of total sales of medicines (Cash + Credit + for Free) in birr in ten selected
hospitals from 7 regions of Ethiopia: total sales collected during 4500 patient-days (150 months
with different characteristics) ; starting from the first month of APTS implementation in each
hospital up to September 30, 2015; Data organized Oct 2015. .................................................... 44
Graph7. 7 Trends of gross profit from total sales (cash + credit + free) of medicines in birr in
ten selected hospitals; total gross profit collected during 4500 patient-days (151 months with
different characteristics) ; starting from the first month of APTS implementation in each hospital
up to September 30, 2015; Data organized Oct: 2015 .................................................................. 45
Graph7. 8 Trend of number of patient served on cash in ten selected hospitals from 7 regions of
Ethiopia, in the last 39 months, starting from the first month of APTS implementation onwards
up to September 30, 2015; Data organized Oct 2015 ................................................................... 45
Graph7. 9. The trend line of the number of patient served on (cash + Credit + for free) in ten
selected hospitals from 7 regions of Ethiopia, in the last 39 months, starting from the first month
of APTS implementation onwards up to September 30, 2015; Data organized Oct 2015. .......... 46
Graph7. 10: The median days’ wage for unskilled government worker that would have to pay to
buy medicines from 34 various pharmacy outlets (OPD, Emergency, Inpatients, Chronic care
etc.) of the ten selected hospitals from 7 regions of Ethiopia; of the last 39 months up to
September 30 2015. Data organized Oct. 2015. ........................................................................... 47
Graph7. 11: Trends of days’ wage that unskilled government worker would have to work to buy
medicines on cash in ten selected hospitals from 7 regions of Ethiopia, starting from APTS
initiation up to September 30 2015. Data organized Oct 2015. .................................................... 47
The findings of APTS evaluation by: A. Adinew. S. Ololo. F. Tessema Oct 2015
x
Graph7. 12: The time needed (in days) to conduct physical inventory of medicines, before and
after APTS, in 10 selected hospitals from 7 regions of Ethiopia, Oct 2015 ................................. 48
Graph7. 13 Implementation statuses of R 3 of APTS (Pharmacy staffs adjustment) based on
APTS workload analysis principles in ten selected hospitals from 7 regions of Ethiopia, before
and after APTS, June 2015. .......................................................................................................... 51
Graph7. 14 Implementation status of one result areas of APTS (finance staffs adjustment) based
on APTS workload analysis principles in ten selected hospitals, before and after APTS, June
2015............................................................................................................................................... 51
Graph7. 15 Availability of prescribed medicines and patient who got all prescribed medicines;
that patients served in a cumulative of 34 various dispensing outlets (OPD, Chronic care, ART,
Maternity, Emergency, Especial pharmacy outlets etc.) of the 10 selected hospitals from 7
regions of Ethiopia, June 2015. N=1000 ..................................................................................... 53
Graph7. 16 # of prescribed and dispensed medicines for patients served in in a cumulative of 34
various dispensing outlets (OPD, Chronic care, ART, Maternity, Emergency, Especial
pharmacies) 10 selected hospitals from 7 regions of Ethiopia, Organized June 2015 ................. 53
Figure 1: Multiple queue single server modeling for dispensary patient flow _ University of Jos,
Nigeria. 2011................................................................................................................................ 18
Figure 2: Single queue - multiple server- modeling for dispensary patient flow _ University of
Jos, Nigeria. 2011 ........................................................................................................................ 18
Figure 3: Result areas (dimensions) of Auditable Pharmaceuticals Transactions and Services
program, 2012, Amhara Region: Ethiopia [8] .............................................................................. 21
Figure 4: Regions of the Ethiopian; Nations, Nationalities and Peoples, where APTS is being
implemented and the study area that this thesis evaluated APTS: are regions those painted in
yellow; March, 2015 ..................................................................................................................... 24
Figure 5: Premises, work flow and patient queue modeling in APTS; (single queue - multiple
server modeling) Ethiopia, 2010; reported June 2015 ................................................................. 51
The findings of APTS evaluation by: A. Adinew. S. Ololo. F. Tessema Oct 2015
xi
Abbreviations
ABC A class, B class and C class
ABC/VEN A class, B class and C class medicines / Vital, essential and non-essential
AMR Anti-Microbial resistance
APTS Auditable Pharmaceuticals Transactions and Services
ARM Annual Review Meeting
CTA Consumption to stock analysis
FMOH Federal Ministry of Health
HSDP IV Health sector development IV (2010-2015) of Ethiopia
IFRR Internal facility report and requisition form
MAM/SAM Moderate Acute Malnutrition and Severe Acute Malnutrition
MDG Millennium Development Goal
MFRF Monthly Financial Reporting form of APTS
MOFED Ministry of Finance and Economic Development
MSRF Monthly Service Reporting form of APTS
RFEDB Regional Finance and Economic Development Bureau
RHB Regional Health Bureau
SIAPS Systems for Improved Access to Pharmaceuticals and Services
SPS Strengthening Pharmaceutical Systems
SPSS Statistical Package for Social Sciences
SSA Stock Status Analysis
SAS Stock available for sale
STI Sexually Transmitted infections
STR Stock Turnover Ratio
UN United Nations
UNICEF United Nations Children Fund
VEN Vital essential and nonessential
W.H.O World Health Organization
The findings of APTS evaluation by: A. Adinew. S. Ololo. F. Tessema Oct 2015
12
Chapter 1: Introduction
1.1. Background
United Nations’-article 25 of the 1948 universal declaration of human rights states that-
“everyone has the right to a standard of living adequate for health and the right to security in the
event of sickness or disability” [1]. Governments that endorsed this declaration are responsible
and accountable to prevent and treat their citizens from manmade and natural disasters causing
morbidity, disability and deaths [2]. Ethiopia is one of the countries which endorsed the
universal declaration of human right [3]. In Ethiopia, communicable diseases such as pneumonia,
diarrhea, malaria, tuberculosis, meningitis, HIV/AIDS/STI, blindness, and non-communicable
diseases such as diabetes, hyper tension and cancer, mental illness are being the major causes of
morbidity and mortality [4]. To prevent and treat such diseases, huge capacities are needed
including; health facilities, trained human power and availability of medicines.
Availability of medicines at all times in adequate amounts, appropriate dosage, at affordable
price for the individual client and their proper use are indispensable since medicines complement
other types of health care services including; vaccination, prophylaxis, treatment and
rehabilitation [5, 6]. To avail these medicines and use in such a manner, selection of medicines
should be based on critical factors; disease prevalence, consumption pattern and adequate
personnel expertise to diagnose, prescribe, dispense and manage medicine. Financial resources to
buy these medicines and efficient use of resources are also necessary [7]. Further to this, factors
that leads to wastage of medicines in health facilities such as; expiry, pilferage, theft and
irrational use of medicines should be prevented. In turn, to perform the aforementioned duties,
pharmacy organizations and patient flow within pharmacies should be properly addressed [8].
Rational drug use is of the key factor; worldwide, more than 50% of all medicines are prescribed,
dispensed or sold inappropriately, and half of all patients fail to take medicines correctly and
hence the overuse, underuse or misuse of medicines harms people and wastes resources. More
than 50% of all countries do not implement basic policies to promote rational use of medicines.
This is high in developing countries; only less than 40% of patients in the public sector and 30%
in the private sector are treated according to clinical guidelines [9].
The findings of APTS evaluation by: A. Adinew. S. Ololo. F. Tessema Oct 2015
13
Pharmacy organization of health facilities, workflow within pharmacy outlets, the number, mix
and ratio of pharmacist to client ratio are the basic elements to be fulfilled to deliver quality
pharmacy services and attain appropriate patient satisfaction [8]. The pharmacies of hospitals
should be organized as outpatient, inpatient and emergency pharmacies and a central medical
store of each directed by a registered pharmacist [10]. In addition, the hospital has to have
adequate personnel, equipment, premises and facilities required to store pharmaceutical supplies
and carry out compounding, dispensing and counseling activities. The work flow should be
designed in such a way that customers should enter in one gate of the pharmacy outlets and exit
in another, in a way inside the pharmacy; customers see prescription evaluator, biller, cashier,
and medicines use counselor in a queue [8].
Transparency and accountability is another big challenge in the pharmaceutical sector. The
World Bank has identified corruption as “the single greatest obstacle to social and economic
development keeping millions of people trapped in poverty” and labelled a ʺcancerʺ [11]. The
pharmaceutical sector is particularly vulnerable to corruption and unethical practices since the
commercial reality of the pharmaceutical market tempts many different actors [11]. Processes of
the pharmaceutical sectors that are vulnerable to corruption and need interventions are:
registration of medicines, licensing of pharmaceutical business, inspection of establishments,
medicine promotion, selection, quantification, procurement and issuing of medicines to various
health facilities and distribution to sections within health facilities [11, 8]. As per the W.H.O
strategy, improving good governance of pharmaceutical management in public health facilities is
very important especially for disadvantaged, poor and vulnerable populations [11, 12].
The Federal Ministry of Health (FMOH) of Ethiopia had developed the Ethiopian Hospital
Reform Implementation Guidelines (EHRIG) which includes the pharmacy service reforms [13].
Further to implementation of EHRIG in hospitals for the last five years, a system was designed
that assumed to curtail the aforementioned pharmacy service drawbacks, called Auditable
Pharmaceuticals Transactions and Services (APTS). The system, APTS is being put in to law
regionally in Amhara 2011 [14], Diredawa in 2012 [15], SNNP in 2014 [16], Tigray in 2015,
Oromiya in 2015, and by the Federal Government in 2014 [17, 18]. FMOH of Ethiopia decided
to scale up APTS nationwide.
The findings of APTS evaluation by: A. Adinew. S. Ololo. F. Tessema Oct 2015
14
These were the main reasons why APTS implementation in health facilities of Ethiopia in
2014/2015 becomes one of the top priority agenda for the regional health bureaus, the Federal
Ministry of Health, the Federal Ministry of Finance and partners [2].
1.2. Statement of the problem
Globally, in developing and industrialized countries alike, efforts to provide health care are
facing new challenges. These include the rising costs of health care, limited financial resources,
shortage of human resources, inefficient health systems, the huge burden of disease, and
challenges to relate to treatment that one third of the world’s population does not yet have
regular access to essential medicines [19, 20]. Availability of medicines in low- and middle-
income countries is low, particularly in the public sector [20]. For many people, the affordability
of medicines is a major constraint due to high price especially in private sector reaching in some
cases 80 times the international reference price and requires over 15 days’ wages to purchase 30
days of treatment [19, 20, 21]. In low- and middle income countries, because of high prices,
medications account for 25% to 70% of total health care expenditures, compared to less than
15% in high-income countries. Inaccessibility and unaffordability to essential medicines are
aggravated by medicines diversion from government to private, theft, non-transparency, non-
systematic selection, poor procurement and wastage due to expiry, irrational use, and poor
pharmacy organization and workflow [8, 19, 20, and 21].
A recent report of the President’s Malaria Initiative to Congress of the US Government indicated
that until April 2014, the stealing is continuing and there was no solution solicited in Africa [22].
As per the study of World Bank in collaboration with anti-corruption authority of Ethiopia, even
though corruption is uncommon compared to other African countries, pharmaceutical sector is
found to be one of the two most corrupted sectors in Ethiopia that donated products are being
diverted for private resale within Ethiopia and abroad [23, 24].
Studies showed that the root causes of drug diversion in Ethiopia includes: non-transparent
transaction; while medicines entered in the store, issued to sections and dispensed to patients,
patients used to buy medicines with a receipt prepared by a cashier who is unable to write the
The findings of APTS evaluation by: A. Adinew. S. Ololo. F. Tessema Oct 2015
15
names and full descriptions of medicines. The type, quantity and price of medicines that are
transacted had not been traced. Therefore, a system that can transparently show step by step flow
of medicines until it reach the intended patient is becoming mandatory [8].
A recent baseline assessment for APTS implementation done by FMOH in collaboration
USAID/SIAPS project, revealed that: patient knowledge on how to take their medicines;
concerning dose, route of administration, frequency and duration showed that only 50.5% clients
properly know all parameters [25].
In Ethiopia, various findings showed that essential medicines are poorly available (65%) [26],
with high expiry rate (8.24% nationally) [27]. There are poor information on product and
financial values of medicines, inefficient utilization of medicines budget, poor pharmacy
infrastructure and chaotic work flow, all together resulting in poor quality of medicines
management and erratic dispensing activities including counseling services and low overall
patient satisfaction on pharmacy services (74.5%). [8, 13, 25]
It is to solve the aforementioned problems that the concept of APTS was innovated in Ethiopia,
piloted in Amhara Region, Debre Markos Referral Hospital, in 2011 [8, 28], commented by
various types of professionals of Ethiopians during consecutive workshops and is being scaled
up in health facilities throughout the country by RHBS and FMOH in collaboration with partners
(USAID/SIAPS and WHO).
Some outcomes of APTS intervention have been studied in Debre Markos Referral Hospital
during piloting. Additionally, few preliminary studies that assessed the outcomes of APTS have
been documented by Amhara RHB and individual hospitals. However, such big interventions
like APTS should be undertaken by the government and its stakeholders based on a thorough
knowledge on its outcomes and challenges faced during its implementation. Since prior research
on this topic is minimal, corresponding relevant information are scares. So, it is critical to
conduct this study and fill the gap by giving relevant information to the ministry of health,
regional health bureaus and relevant stakeholders.
The expected results of this study are to measure implementation status of APTS tools and
systems, to identify the type and amount of various outcomes of its implementation in terms of
The findings of APTS evaluation by: A. Adinew. S. Ololo. F. Tessema Oct 2015
16
reducing wastage of medicines, availability and affordability of medicines, improving work flow,
increasing revenue from medicines sales, improving patient satisfaction on pharmacy services.
1.3. Significance of the study
The baseline data for health sector development plan (HSDP IV 2010-2015) of Ethiopia [27]
showed that stock-out for essential drugs was found to be 35%, patients’ knowledge on correct
dosage (68%) and national average rate of medicines expiry (8.24%). The World Bank
identified corruption and lack of transparency in the pharmaceutical sector, as the greatest
“cancer” and obstacle to social and economic development, keeping millions of people trapped
in poverty [11]. Execution of pharmaceutical transactions and services in hospitals of Ethiopia
lacks transparency and accountability; thus vulnerable for corruption [8].
The aforementioned issues were the main reasons why APTS had been created since it is
intended to be a tool and system used to solve such problems. Preliminary assessment of APTS
implementation in one pilot site showed promising results [8]. It was the only reason that APTS
is being expanded throughout the health facilities in the country, with big investment and
commitment of the Government of Ethiopia and stakeholders. Additionally, various regional
governments like the Amhara, the SNNP, and the Diredawa Administration have enacted
regulation on APTS. However, there is no evidence based information formally studied that
showed APTS implementation status, challenges and outcomes. There is no full-fledged
scientific evidence based answer for questions arises on the system whether it is important or
futile exercise, whether the value added by the system and the expenses due to the system are
justifiable. Such big interventions like APTS should have been undertaken with a thorough
knowledge on above issues. Due to absence of such formal study, information for decision
makers is scares.
The expected results of this study are to measure the implementation status, outcomes and
challenges of APTS implementation in terms of reducing wastage of medicines, optimizing
medicines budget, improving work flow thereby improving patient knowledge on correct dosage
and satisfaction on pharmacy services by comparing with the national, regional and hospital
specific baseline data taken before APTS. Therefore, it is timely to conduct this study, to fill the
The findings of APTS evaluation by: A. Adinew. S. Ololo. F. Tessema Oct 2015
17
gaps and to provide information to FMOH, MOFED, RHBs, and donors so that respective bodies
could take appropriate measures. This study will also serve as a base line for the forthcoming
researchers.
Chapter 2: Literature Review
APTS is a service delivery scheme that assumed to enables establishment of transparent and
accountable medicines transaction and service provision. The ultimate objectives of APTS are to:
institute ethical, transparent and responsible pharmacy practice that enables health facilities
optimize utilization of medicines budget; improve access to medicines; continually improve the
number, skill, mix & efficiency of pharmacy workforce, improve documentation and pharmacy
premises and workflow, generate reliable and consistent information on products finance and
services for decision making, improve patient knowledge on prescribed medicines and
customers satisfaction. The system is intended to enables pharmaceutical transactions and
service to be audited at any time [8].
APTS has five main pillars: Efficient budget utilization, transparent and accountable
transactions, reliable information, effective workload analysis including; performance
measurement and workforce deployment and improving customer satisfactions [8]. The APTS
system [8] declares that there are many factors which affect the quality and volume of pharmacy
service provision; including, lack of training that intern reflected by lack of knowledge and
capacity, chaotic workflow, poor infrastructure, insufficient equipment and facilities needed to
give the service, lack of using the highest efficient mix of services units of pharmacy, medicines
budget and number of professionals.
A study in Kenyatta National Hospital, Kenya, indicated that “low employee’s capacity led to a
decrease in provision of service quality by factor of 0.981” while inadequate technology
adoption for health service led to a decrease in provision of service quality by a factor of 0.917.
The ineffective communication channels affected delivery service quality in public health sector
by a factor of 0.768 while insufficient financial resources resulted to decrease in provision of
health service quality by factor of 0.671. From this study, it was concluded that “low employees
capacity and insufficient fund affect delivery of service quality to patients in public health sector
affecting health service quality perceptions, patient satisfaction and loyalty” [29].
The findings of APTS evaluation by: A. Adinew. S. Ololo. F. Tessema Oct 2015
18
A study conducted by Dr Liz Sexton et al on factors influencing pharmacist performance, in the
“Centre for Pharmacy Workforce Studies”, in Great Britain, showed that; “ pharmacist
performance is affected by characteristics such as age, gender, ethnicity, place of primary
qualification, workplace factors, workload and mental and physical health problems, alcohol use
or drug addictions” [30].
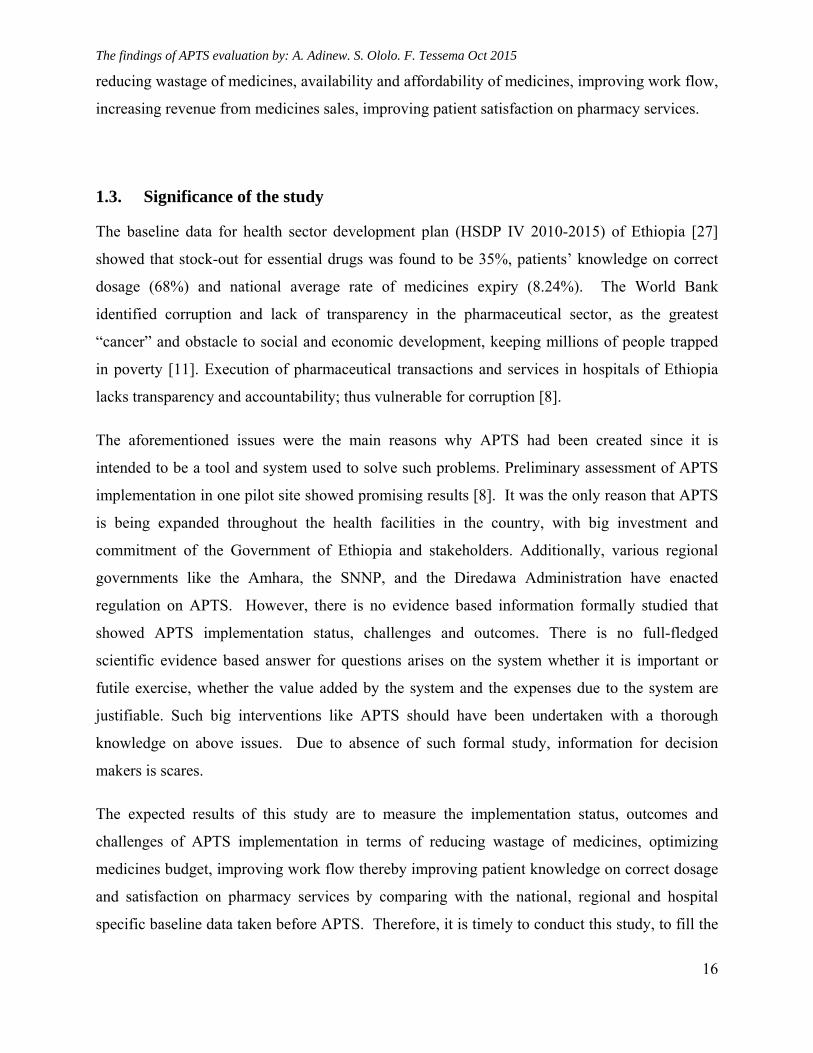
Workflow in pharmacy services is a problem in many African countries. Its inefficiency also has
a negative impact in all over performance of the health facility. By the study made in Nigerian
faculty of pharmaceutical sciences, the impact of rearrangement of workflow pattern on queue
characteristics and discipline was measured. During the baseline of that study, the queue
characteristics in the pharmacy service _ patient flow modeling were “single server-multiple
queue model” as in the modeling figure below.
Figure 1: Multiple queue single server modeling for dispensary patient flow _ University of Jos, Nigeria. 2011
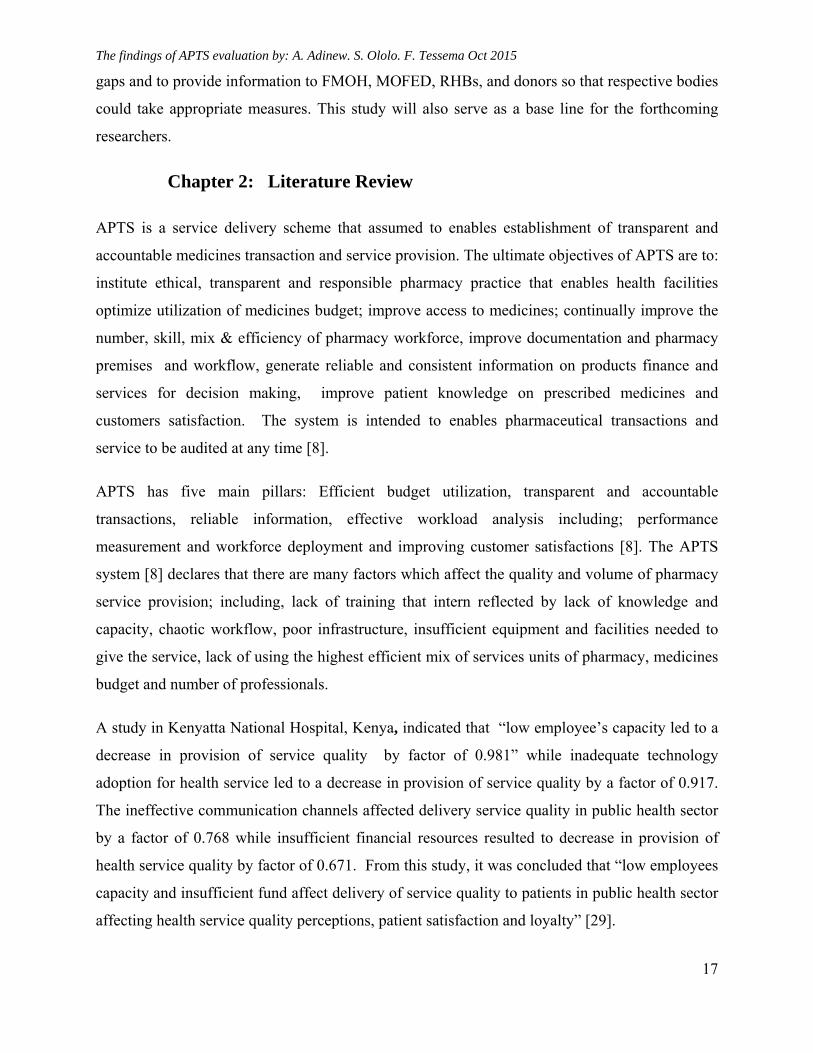
In this study what the researchers did was that they measured various models against the
baseline. The comparison queue model types were; single server with single queue model,
multiple servers with single queue model, and then multiple servers with multiple queue model.
Finally, after staff re-orientation the streamline process, the best model that reduces waiting time
from 167.0 to 55.1 minute which indicated a 67% reduction waiting time was adopted by
consensus and practiced. This patient flow model is multiple servers, single queue model as
indicated in the modeling figure below.
Figure 2: Single queue - multiple server- modeling for dispensary patient flow _ University of Jos, Nigeria. 2011
An article in Washington stated that:-“millions of dollars of donated antimalarial drugs have
been stolen, most often by staff of recipient government medical stores. For this reason, Sweden
The findings of APTS evaluation by: A. Adinew. S. Ololo. F. Tessema Oct 2015
19
and Germany have already suspended funding. The article recommended that the entire system
needs to change [31]. In the wall Street journal, a survey showed that antimalarial medicines are
diverted from east to West Africa due to lack of transparency of medicines supply management
system [32]. Therefore, a system that can transparently show step by step flow of medicines until
it reach the intended patient is becoming mandatory. APTS is expected to do solve such
problems and it will be proved or disproved when evaluated.
By the interviewing 500 patients, using descriptive workshop based epidemiological study made
in India showed that: “More than half (47.4%) reported that they did not ask and were not told
how to store their medicines properly at home”. Less than one 1/3rd (30.4%) of study
participants reported that they did not ask the doctor about any possible side effects of their
medicines. More than two thirds (72.4%) of the study population said that they discontinued their
treatment course when they felt that their symptoms disappeared [33].
One study done in Afghanistan by USIAD/SPS program, in 14 health facilities, in 2010 showed
that the patients who know all the seven WHO drug use indicators that enables on how to take
dispensed medicines (the name, dose, route of administration, the frequency, duration,
precaution, storage) ranged from less than 10% to 60% as shown in the graph below [34]. A
study done in Kenya health facilities by WHO Kenya office, indicated that the incidence of
expiry of medicines in dispensing shelves were found to 2.3% in government health facilities
where as 1.9% in private health facilities [35]. Study conducted in Uganda to assess expiry of
medicines in supply outlets at the public and private health facilities showed that high
contribution of the expiry medicines to be due to storing medicines that treat rare diseases
(81.8%) and drug donation (56 %) [36].
In the study conducted by Food Medicines Health Care Authority of Ethiopia in collaboration
with WHO in 2003 revealed that the national averages expiry rate of medicines was found to be
8%, 2% and 3% in health facilities, regional drug stores and private drug retail outlets,
respectively [25].
In the study conducted by Birma Abdosh on quality of hospital service in eastern Ethiopia, the
percentage of patient satisfaction for pharmacy service was 65% being less than laboratory
service (75%) [37]
The findings of APTS evaluation by: A. Adinew. S. Ololo. F. Tessema Oct 2015
20
From the study conducted by respective Ethiopian regional health bureaus and Federal Ministry
of Health in collaboration with USAID/SIAPS, during collection of APTS baseline data, in the
year 2013/2014, indicated that: in 2004 E.C (2012), there was an overall wastage of
3,281,562.20 ETB ($164,078.11) accounting to an average of 3.9% of the total value of
medicines received by 6 hospitals. In 2005 EC (2013), the value of wastage was estimated to be
birr 10,684,221.09 indicating an average wastage rate of 8.3% for 9 of the study hospitals [25].
This rate of expiry was found to be equivalent to the rate of expiry of medicines taken during
national HSDP-IV (2010-2015) baseline [27]. The six month data for 2006 EC (2014) of the
same hospitals shows total wastage of 1,542,491.6 ETB ($77,124.58) indicating an average of
5.1% wastage rate. When the outlier results of the two hospitals were excluded from the
analysis, the average wastage rate of the remaining 8 hospitals was found to be 4.8%, amounting
to 11,078,910.52 ETB ($553,945.53) [25].
In the second batch of hospitals that started APTS before two years showed that the medicines
expiry rate of Debre Markos were found to be 10%, Felege Hiwot Referral Hospital 9%, and
that of Debre Berhan was found to be 15% when compared with the stock availed for dispensing
[38].
In the APTS baseline assessments conducted at different times in these hospitals, overall patient
satisfactions on pharmacy services were found to be; 77% in Debre Markos Referral Hospital
[8] and 40% in Felege Hiwot Referral Hospital [39]
In the third batch of hospitals implementing APTS, the baseline data taken by respective regional
health bureaus in collaboration with USAID/SIAPS indicated that the average expiry rate of
these hospitals was found to be 5.4% [38, 40, and 41].
In the APTS baseline assessment conducted in 17 hospitals, the baseline data of the patient
knowledge on how to take dispensed medicines ranged that percentage of patients who knew all
parameters were 15.5% whereas who knew all five basic drug use indicators (dose, route,
frequency, duration, storage) were 46.6% [25]
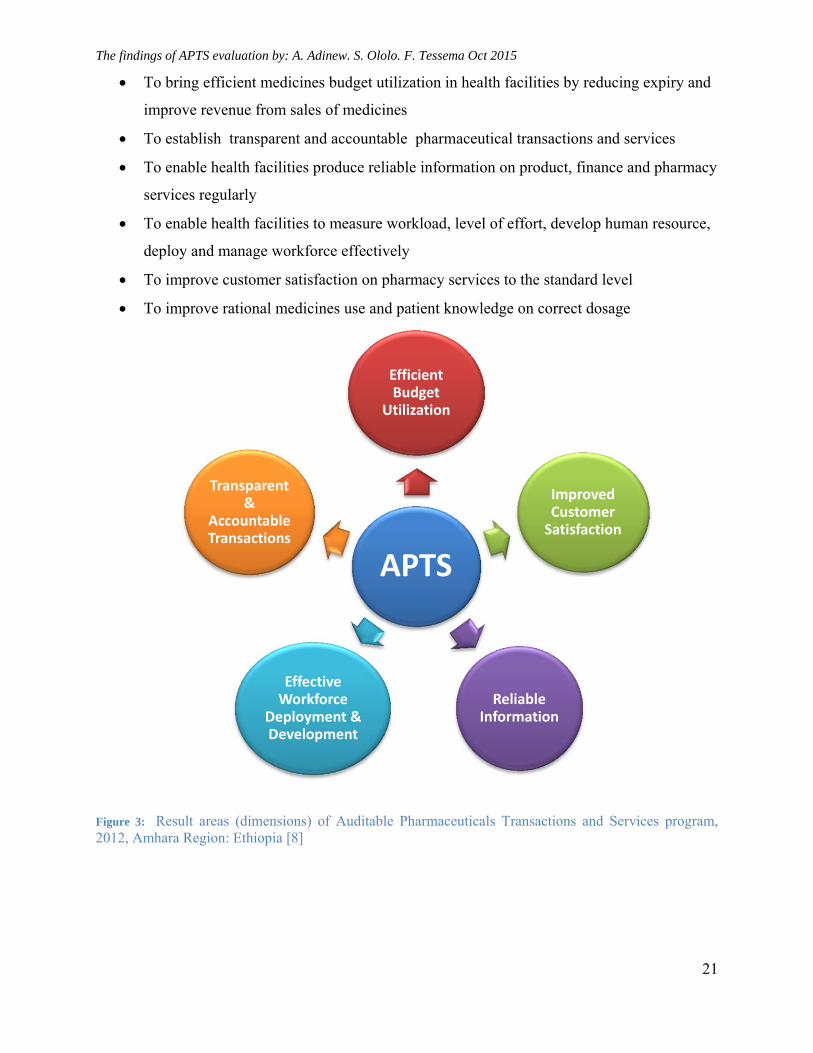
I. Objectives of the APTS program
APTS was designed to address the following objectives:
The findings of APTS evaluation by: A. Adinew. S. Ololo. F. Tessema Oct 2015
21
To bring efficient medicines budget utilization in health facilities by reducing expiry and
improve revenue from sales of medicines
To establish transparent and accountable pharmaceutical transactions and services
To enable health facilities produce reliable information on product, finance and pharmacy
services regularly
To enable health facilities to measure workload, level of effort, develop human resource,
deploy and manage workforce effectively
To improve customer satisfaction on pharmacy services to the standard level
To improve rational medicines use and patient knowledge on correct dosage
Figure 3: Result areas (dimensions) of Auditable Pharmaceuticals Transactions and Services program, 2012, Amhara Region: Ethiopia [8]
APTS
Efficient Budget
Utilization
Improved Customer Satisfaction
Reliable Information
Effective Workforce
Deployment & Development
Transparent &
Accountable Transactions
The findings of APTS evaluation by: A. Adinew. S. Ololo. F. Tessema Oct 2015
22
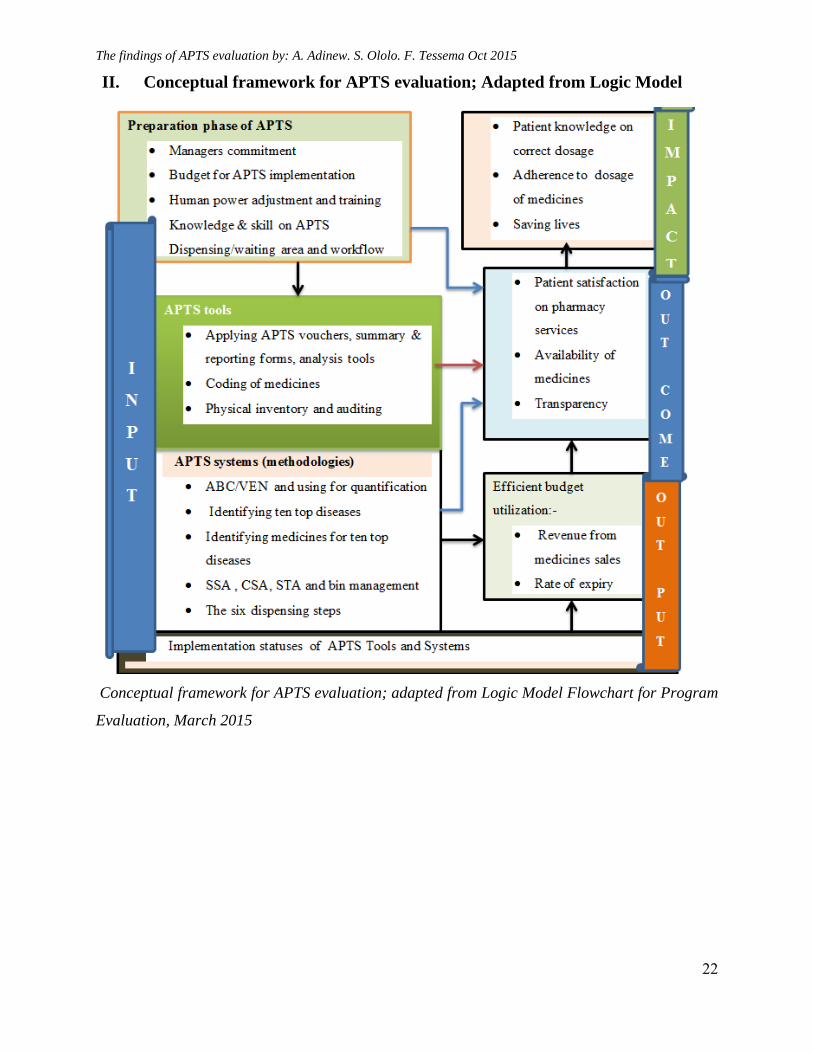
II. Conceptual framework for APTS evaluation; Adapted from Logic Model
Conceptual framework for APTS evaluation; adapted from Logic Model Flowchart for Program
Evaluation, March 2015
The findings of APTS evaluation by: A. Adinew. S. Ololo. F. Tessema Oct 2015
23
Chapter 3: Objectives
3.1. General Objective
To measure the implementation status of APTS tools and systems with its outcomes and
challenges of its implementation in selected hospitals from Ethiopia
3.4. Specific Objectives
To measure the implementation status of APTS tools and systems
To evaluate outcomes of APTS implementation in reducing medicines expiry
To measure the outcomes of APTS implementation in increasing revenue from sales of
medicines
To evaluate the outcome of APTS implementation in improving patient knowledge on
correct dosage and satisfaction on pharmacy services
To identify the challenges of APTS implementation
The findings of APTS evaluation by: A. Adinew. S. Ololo. F. Tessema Oct 2015
24
Chapter 4: Methodology
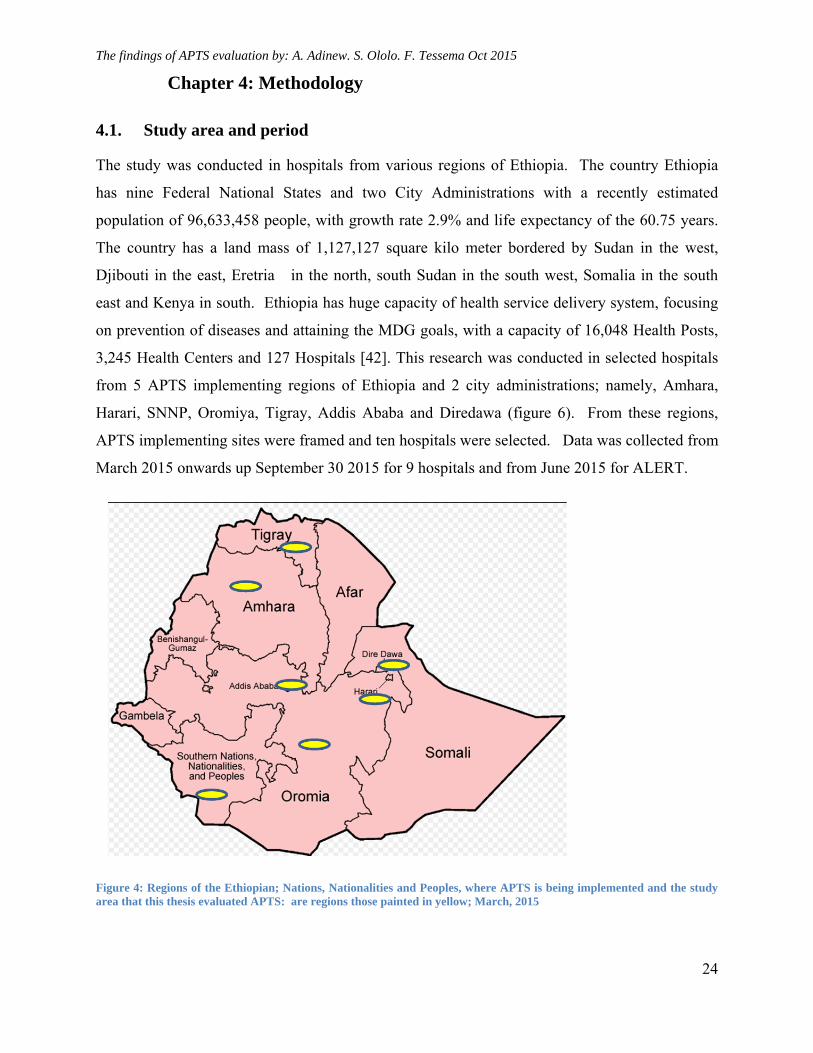
4.1. Study area and period
The study was conducted in hospitals from various regions of Ethiopia. The country Ethiopia
has nine Federal National States and two City Administrations with a recently estimated
population of 96,633,458 people, with growth rate 2.9% and life expectancy of the 60.75 years.
The country has a land mass of 1,127,127 square kilo meter bordered by Sudan in the west,
Djibouti in the east, Eretria in the north, south Sudan in the south west, Somalia in the south
east and Kenya in south. Ethiopia has huge capacity of health service delivery system, focusing
on prevention of diseases and attaining the MDG goals, with a capacity of 16,048 Health Posts,
3,245 Health Centers and 127 Hospitals [42]. This research was conducted in selected hospitals
from 5 APTS implementing regions of Ethiopia and 2 city administrations; namely, Amhara,
Harari, SNNP, Oromiya, Tigray, Addis Ababa and Diredawa (figure 6). From these regions,
APTS implementing sites were framed and ten hospitals were selected. Data was collected from
March 2015 onwards up September 30 2015 for 9 hospitals and from June 2015 for ALERT.
Figure 4: Regions of the Ethiopian; Nations, Nationalities and Peoples, where APTS is being implemented and the study area that this thesis evaluated APTS: are regions those painted in yellow; March, 2015
The findings of APTS evaluation by: A. Adinew. S. Ololo. F. Tessema Oct 2015
25
4.2. Study Design
Multiple case studies and cross-sectional descriptive study design were conducted employing
both qualitative and quantitative methods.
4.3. Population
Target Population: Health facilities to which the findings of this research will be targeted
(extrapolated) are APTS implementing sites in Ethiopia.
4.3.1. Source populations
1. The source populations for challenges and qualitative evaluations; the key informants were
CEOs and head pharmacist in ten selected APTS implementing hospitals of Ethiopia
2. The source populations to identify implementation status and challenges; all pharmacy and
finance staffs of all 10 selected hospitals in Ethiopia which are implementing APTS. They were
348 staffs.
3. The source populations for structured questions of patients for their knowledge and
satisfaction were all patients who got pharmacy service on the data collection period in the 10
selected hospitals of Ethiopia which implemented APTS.
4. The source populations for expiry rate, revenue from medicines sales, documents to be
reviewed were monthly reports of APTS starting from the first APTS monthly report generated
and submitted to RHB and or FMOH onwards, ABC/VEN analysis documents performed in the
APTS implementation year/s and stock status analysis made in the same year/s.
4.3.2. Study populations
1. The study populations for challenges and qualitative evaluations were sampled CEOs and head
pharmacist of hospitals which implement APTS in Ethiopia and which were selected for the
study.
2. The study populations for implementation status were all pharmacy and finance staffs in 10
selected hospitals in Ethiopia, to whom, self-administered question were distributed and who
fulfilled the inclusion criteria.
The findings of APTS evaluation by: A. Adinew. S. Ololo. F. Tessema Oct 2015
26
3. The study populations for structured questionnaire of patients for their knowledge to their
dispensed medicines and satisfaction on pharmacy services: are sampled patients by fulfilling the
inclusion criteria in ten selected hospitals of Ethiopia and who got pharmacy service in the data
collection period
4. The study populations for revenue, expiry rate and implementation status; documents to be
reviewed were all monthly reports of APTS starting from the first months of APTS monthly
report production onwards, sampled ABC/VEN analysis documents performed in the APTS
implementation year/s and sampled stock status analysis made in the same year/s.
4.3.3. Inclusion criteria
All pharmacy and finance staffs working in the pharmacy of the 10 selected hospitals of
Ethiopia that implemented APTS
For patient knowledge and satisfaction, patients who got pharmacy service in the ten
selected hospitals during the study period and willing to participate in the study with all
age groups were taken (for children care givers were targeted)
4.3.4. Exclusion criteria
Staffs who are in annual leave during the study period
Staffs who are sick during the study period
New staffs who were employed in less than six month period in the hospital
Patients who were very sick and unable to give information and also who are not willing
Documents which are disorganized
4.4. Sample Size and Sampling Technique
4.4.1. Sample size determination
1. The sample sizes for the in-depth interview were all CEOs and head pharmacists from 10
selected hospitals.
2. The sample size for self-administer questions to APTS implementing staffs from the selected
hospitals was 348 professionals. All who fulfilled the inclusion criteria were questioned.
The findings of APTS evaluation by: A. Adinew. S. Ololo. F. Tessema Oct 2015
27
3. For patient knowledge to dispensed medicines and patient satisfaction on pharmacy
services, the W.H.O. recommended sample size, at least 100 patients per facility and the
recommended number of health facilities (N=10) were selected to be sampled. So, the total
number of health facilities was 1000 as per W.H.O. recommendations [43].
4. The sample size for document review was all APTS monthly reports produced from each
hospital starting from the first month of APTS implementation onwards, all stock status
analysis findings and ABC/VEN analysis conducted in the APTS implementation period
5. Ten hospitals were selected from which CEOs, Head Pharmacists, documents were studied
4.4.2. Sampling Techniques
1. For qualitative evaluations, key informants were purposively the CEOs and head pharmacist
of all the 10 hospitals were interviewed using in-depth interview guide
2. For qualitative evaluations like challenges, the structured self-administer questions, data was
collected by self-administered questions to all pharmacy and finance staffs in the selected
hospitals. Questions were constructed according to the thematic areas of the APTS elements.
Staffs were asked to choose answers concerning their respective duties they had been
assigned.
3. For implementation status, expiry rate and revenue; data was collected from each selected
hospitals by reviewing various data sources- APTS monthly reports starting from APTS
implementation onwards. All ABC/VEN analysis documents and all stock status analysis
documents analyzed during the APTS implementation periods were also reviewed.
4. For patient knowledge and satisfaction, the W.H.O. recommended sampling technique that
enabled comparing health facilities amongst samples was employed. I.e.100 cases per health
facility were taken from 10 health facilities until arriving at 100 patients in each hospital and
a total of 1000 patients [43]. Since chronic care patients are usually scheduled either on both
Monday and Friday or on both Tuesday and Thursday in Ethiopian hospitals practice,
patients were interviewed starting from Monday onwards so that at least one of the days will
be chronic care day. For those hospitals which didn’t get enough samples of patients during
data collection in the first week, the next consecutive weeks were used. Samples were taken
on these days using convenient sampling technique until the number of patients reaches 100
from each health facility.
The findings of APTS evaluation by: A. Adinew. S. Ololo. F. Tessema Oct 2015
28
4.4.3. Sampling Frames:
The proportion of hospitals that implemented APTS varies from region to region; i.e. Amhara
17, Addis Ababa 3, SNNPR 3, Tigray 2, Oromiya 1, Diredawa 1, and Hararie 1, a total of 28
Hospitals implemented APTS during start of data collection. To select study subjects for both
qualitative and quantitative methods from these hospitals that represents each region, number of
hospitals were assigned to respective regions by using a power allocation stratified sampling
technique; that enable to distribute sample size in skewed population, so that higher probability
for regions with a small number of APTS implementing hospitals was allocated [47].
So, all hospitals that implemented APTS from seven regions were framed. Then 10 were
selected based on stratified power allocation method to represent each region [46]. To select
hospitals from each region again, convenient sampling technique was used. Therefore, from
Oromiya=1 (Jimma University Hospital), Tigray 1 (Axum St Mary Hospital), Diredawa 1
(Dilchora Hospital), Harare 1 (Jegol Hospital), SNNP 1 (Arba Minch Hospital), Addis Ababa 1
(ALERT); a total of 6 hospitals were selected. The rest 4 hospitals were allocated to Amhara
region. The four hospitals from Amhara region were selected conveniently by dividing them in
to two zones (two hospitals were selected from west and two hospitals from east Amhara).
Accordingly, Debre Markos Referral Hospital and Felege Hiwot Referral Hospital were selected
from west Amhara while Borumeda Hospital and Dessie Referral Hospital were selected from
east Amhara.
A total of 348 self-administer questionnaire were distributed to all pharmacy and finance
professionals of the selected hospitals. All professionals who fulfil the inclusion criteria were
given a self- administer questions to measure implementation status and identify challenges.
Among the self-administer questions, 251(72%) were responded.
4.5. Data Collection
4.5.1. Development of data collection tools
Based on the objective of this study:
1. To collect information from key informants by in-depth interview, in-depth interview guide
was developed
The findings of APTS evaluation by: A. Adinew. S. Ololo. F. Tessema Oct 2015
29
2. To identify the implementation status of various result areas of APTS and challenges to
corresponding assigned professionals; self-administer structured questionnaire was
developed.
3. The portion of validated and standardized WHO drug use indicator assessment tool, that had
also been adapted by the Federal Ministry of Health and RHBs during baseline assessment of
APTS, was adapted for the APTS context and was used to collect the data by exit interview
from patients served in pharmacies of selected health facilities regarding patient satisfaction
and knowledge on correct dosage.
4. To collect secondary data from APTS monthly reports of each hospitals, and ABC/VEN and
SSA documents, a checklist was prepared
Each questionnaire had an introductory part which asks consent of the respondent and the
questions were formulated in a logical order according to result areas of APTS.
4.5.2. Personnel recruitment and training
Data collectors, which were already trained by each RHB during APTS baseline assessment and
who collected the baseline data of APTS, were purposively chosen from each region and were
given refresher training for one day by the principal researchers. The refresher training addressed
details about the data collection tool, interviewing procedures, the sampling technique to follow,
to review document and related ethical considerations. Twenty data collectors (two to each
health facility) were assigned.
4.5.3. Data collection techniques
The data collectors were assigned to nearby hospitals of their own region. Two data collectors
were assigned to one hospital. One of the two data collectors was assigned as a supervisor in
addition to data collection. The principal researcher was overseeing the performance of each
data collectors on telephone daily, progress made and gave comments for each step. Both, being
together saw the CEO and chief pharmacist of the hospital before starting their job. The principal
researcher communicated to the head of regional health bureau, pharmacy core process and CEO
and Chief pharmacist of the hospital prior to the start of data collection and obtained ethical
clearance accordingly. The patient interview was conducted starting from Monday until they
reached the sample size. The collected data were sent through EMS to the principal researcher
from each pair of data collectors.
The findings of APTS evaluation by: A. Adinew. S. Ololo. F. Tessema Oct 2015
30
4.6. Variables
4.6.1. Dependent variables
The outcome variables of this study are:
Category one:
1. The implementation status of APTS tools and systems
2. Availability of prescribed medicines
Category two
3. Expiry rate of medicines
4. Revenue from medicines sales
Category three
5. Patient satisfaction on pharmacy services
6. Patients’ knowledge on correct dosage
7. Challenges of APTS implementation
4.6.2. Independent variables
In this study the explanatory variables and the most proximate determinants for the dependent
variable are:
1. Category one:
a. implementation of APTS tools and systems
b. Adjustment of man power based on baseline and workload
c. Physical inventory an auditing
2. Category two:
d. Stock status analysis and ABC/VEN reconciliation analyses
e. Identifying of medicines used to treat top diseases
f. Bin management at dispensary
g. Implementation of effective medicines sales tools
h. Reduction of theft and pilferages
i. Patient knowledge on how to take medicines
The findings of APTS evaluation by: A. Adinew. S. Ololo. F. Tessema Oct 2015
31
3. Category three:
a. Pharmacy organization and workflow based on APTS standards
b. Dispensing /waiting area that fulfil APTS standards
c. Standard dispensing counter
d. Seated service for special counseling in OPD and chronic care pharmacies
4.7. Operational Definition
APTS standard vouchers and sales tickets: Models (19, 22, and sales tickets
standardized by Federal Ministry of Finance for APTS implementation.
APTS result areas: They are the pillars of APTS which includes; efficient budget
utilization, transparent pharmaceutical transaction, pharmacy organization and
workflow, reliable information used as in put of APTS and patient knowledge and
satisfaction as output of the system. Each of them has measurement indicators in APTS.
APTS standard dispensing area and counter: The dispensing areas of the outpatient
and emergency pharmacies of a hospital that has entrance door, billing/prescription
evaluation counter ( with height 0.75cm for sitting service, 1.10 meter for standing
service), for cashiers cubicle and medicines use counseling cubicle, and exit door in the
opposite side of entrance.
Availability of key medicines: it is the percentage availability of medicines used to treat
ten top diseases during the APTS reporting periods
Implementation status of APTS tools and systems: A hospital is said to be it has
implemented certain result areas of APTS; if documents are found that showed the result
area done as per the APTS guide for implementation or infrastructures are found being
built. Example: availability of drug list, prioritizations of drug list by VEN,
identifications drugs for ten top diseases, performing ABC analysis, conducting stock
status analysis and taking interventions. Receiving, issuing, selling of medicines using
vouchers/sales tickets approved by Federal ministry of finance, using drug codes,
auditing reports, producing daily summary and monthly reports, dispensary has two
doors, standard counters are built, man power adjusted, cashiers are inside the pharmacy,
process are rearranged as per APTS guide etc.
The findings of APTS evaluation by: A. Adinew. S. Ololo. F. Tessema Oct 2015
32
Knowledge of professionals: Level of understanding of the study participants
(pharmacists, cashiers, accountants) about their assigned duties concerning APTS
implementation is 100 % when they are asked to explain about their duties)
Key medicines: Medicines used to treat top ten disease are said to be key medicines
Management commitment: defined as the devotion of managers of the hospital to
allocate budget for renovation of dispensing area and employing human power.
Mean satisfaction: Mean satisfaction is the average of the results on LIKERT scale.
Patient knowledge: patients are considered that they know how to take their dispensed
medicines if they answer at least all 5 basic W.H.O drug use indicators (the dose, route
of administration, frequency, duration and storage) during exit interview.
Patient-days: The number of days in which patients were served in a hospital
Patient Satisfaction: patients are considered that they are satisfied if they answer either
agree or strongly agree for the LIKERT scale questions and that should be re-coded in
to new different variables
Patient dissatisfaction: patients are considered that they are dissatisfied if they answer
either disagree, keep quite or strongly disagree when they are asked. This also should be
recoded in to new variable.
Skill of professionals: the capacity of pharmacists, pharmacy accountants, cashiers and
store managers, to perform their respective duties of APTS implementation.
Revenue increment from sales of medicines: revenue is increased if there is a positive
slope of increment of revenue from sales of medicines starting from the baseline
Reduction of expiry rate of medicines: rate of expiry is said to be reduced if there is a
negative slope of rate of expiry of medicines for at least 3 months from the baseline.
Rate of expiry: It is the percentage calculated by dividing the expired value in monetary
forms to the stock available for sale.
Rate of sales of medicines: Rate of sales of medicines is the percentage of sales of
medicines divided by stock available for sale
Stock Available for sale: The sum of beginning stock and stock received during the
reporting period minus issued stocks to other party if any.
The findings of APTS evaluation by: A. Adinew. S. Ololo. F. Tessema Oct 2015
33
Trend of rate of expiry of medicines: is measured by calculating the slope of a serious
of values of expired medicines, which expired at different times since the start of APTS
report generation onwards
Trends of sales of medicines: it is measured by calculating the slope of sales of
medicines at each days and months since the start of APTS reporting dates onwards.
W.H.O drug use indicators: Variables that the World Health Organization (W.H.O)
uses as a standard for measuring patient knowledge on correct dosage
4.8. Data Processing and Analysis
The quantitative data was entered in to computer, explored, cleaned, standardized and
summarized by principal investigator using SPSS version 20. Data collected using LIKERT
scale questions to measure satisfaction and data collected to measure patients’ knowledge on
correct dosage using five W.H.O drug use indicators, were re-coded in to different variables,
counted and summarized to represent the dependent variables. Summarizations and recoding was
done based on the operational definitions. Logistic regression was used to determine crude and
adjusted OR. Bivariate analysis was carried out to assess association between the dependent and
all the independent variables and those variables which had statistically significant relationship
(p – value less than 0.25) were considered candidate for multivariate analysis. Then multivariate
analysis was performed to determine the independent predictors of the dependent variable
concerning implementation status of APTS and its results. The results were summarized by using
SPPS frequency tables. The challenges encountered by finance and pharmacy staffs, main points
obtained from CEOs and head pharmacists during in-depth interview, were summarized and
analyzed based on their thematic areas. Findings- data reviewed from documents, collected from
purposively selected CEOs and head pharmacists using in-depth interview guide, and data
collected from staffs by self-administer structured questionnaires and interviewed patients were
triangulated and association was analyzed. The results and associations were compared with the
regional, national and facility level baseline data of APTS descriptively. Odds ratios (OR) with
95% confidence intervals (CI) were calculated to determine the association and effect of
implementation status of APTS result areas with respective APTS outcomes. All p-values were
two-tailed and statistical significance was set at 0.05.
The findings of APTS evaluation by: A. Adinew. S. Ololo. F. Tessema Oct 2015
34
4.9. Data Quality Management
To improve the consistency of the tools prepared, tools was originally prepared in English. To
narrow language barriers during the interview, portion of tools that was used for patient exit
interview was translated into local languages of the respective regions including Amharic,
Tigregna, Oromiffaa and Gamugna.
The new portion of the tool was pretested in STH in Addis to check whether the tool was
sensitive enough to tempt interviewee in the intended manner and gather the necessary
information needed. The APTS baseline assessment tool, and the W.H.O. standardized tool of
patient knowledge and satisfaction were not modified. Data collector pharmacists were trained
for one day by a principal investigator. Final discussion was made with data collectors before
and after the start of the assessment to make sure each member of the data collector fully
understood the methods and tools. The guide was given for every data collector. Furthermore the
principal researcher was overseeing the whole data collection process. Once quantitative data is
entered in to SPSS, all questioners were reviewed to ensure accuracy of data entry.
4.10. Ethical Considerations
Ethical clearance with a formal covering letter, obtained from Jimma University (Reg. No:
RPGD 3079/2015) was submitted to the CEO of each hospital. Armauer Hansen Research
Institute (AHRI) ethical committee evaluated the proposal and gave another ethical clearance
(Reg. No: PO19/15). Oral informed consent was obtained from each respondent for patient
knowledge and satisfaction prior to the interview. For the purpose of confidentiality and ethical
issues, names of hospitals from which information obtained were recorded and analyzed using
uniquely identifying codes.
4.11. Dissemination of Results
The finding will be presented to the Jimma University and approval will be sought before
disseminating to other bodies. The principal investigator will report the approved findings and
give recommendations to the Federal Ministry of Health, Regional Health Bureaus, Hospitals,
Civil Service Bureau, Civil Service University and relevant NGOs concerning the
implementation status, challenges, outcomes, and recommendations. Finally, this thesis will be
published in international journals.
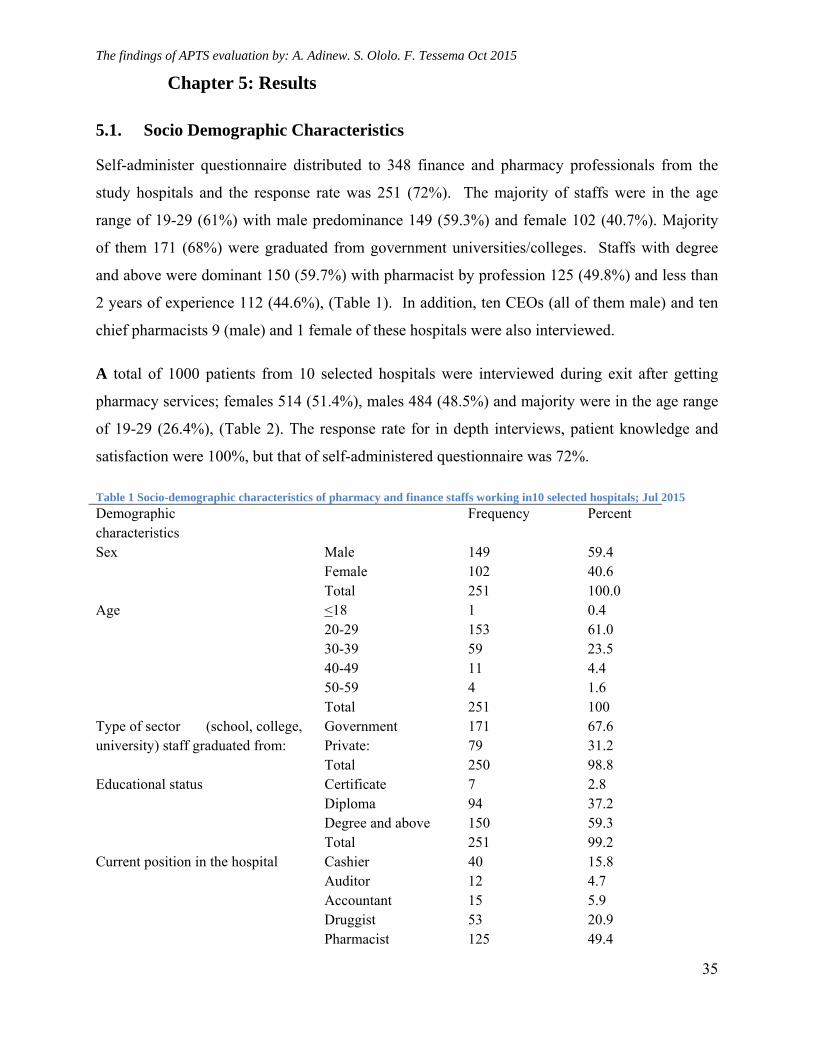
The findings of APTS evaluation by: A. Adinew. S. Ololo. F. Tessema Oct 2015
35
Chapter 5: Results
5.1. Socio Demographic Characteristics
Self-administer questionnaire distributed to 348 finance and pharmacy professionals from the
study hospitals and the response rate was 251 (72%). The majority of staffs were in the age
range of 19-29 (61%) with male predominance 149 (59.3%) and female 102 (40.7%). Majority
of them 171 (68%) were graduated from government universities/colleges. Staffs with degree
and above were dominant 150 (59.7%) with pharmacist by profession 125 (49.8%) and less than
2 years of experience 112 (44.6%), (Table 1). In addition, ten CEOs (all of them male) and ten
chief pharmacists 9 (male) and 1 female of these hospitals were also interviewed.
A total of 1000 patients from 10 selected hospitals were interviewed during exit after getting
pharmacy services; females 514 (51.4%), males 484 (48.5%) and majority were in the age range
of 19-29 (26.4%), (Table 2). The response rate for in depth interviews, patient knowledge and
satisfaction were 100%, but that of self-administered questionnaire was 72%.
Table 1 Socio-demographic characteristics of pharmacy and finance staffs working in10 selected hospitals; Jul 2015
Demographic characteristics
Frequency Percent
Sex Male 149 59.4 Female 102 40.6
Total 251 100.0 Age <18 1 0.4
20-29 153 61.0 30-39 59 23.5 40-49 11 4.4 50-59 4 1.6 Total 251 100
Type of sector (school, college, university) staff graduated from:
Government 171 67.6 Private: 79 31.2 Total 250 98.8
Educational status Certificate 7 2.8 Diploma 94 37.2 Degree and above 150 59.3 Total 251 99.2
Current position in the hospital Cashier 40 15.8 Auditor 12 4.7 Accountant 15 5.9 Druggist 53 20.9 Pharmacist 125 49.4
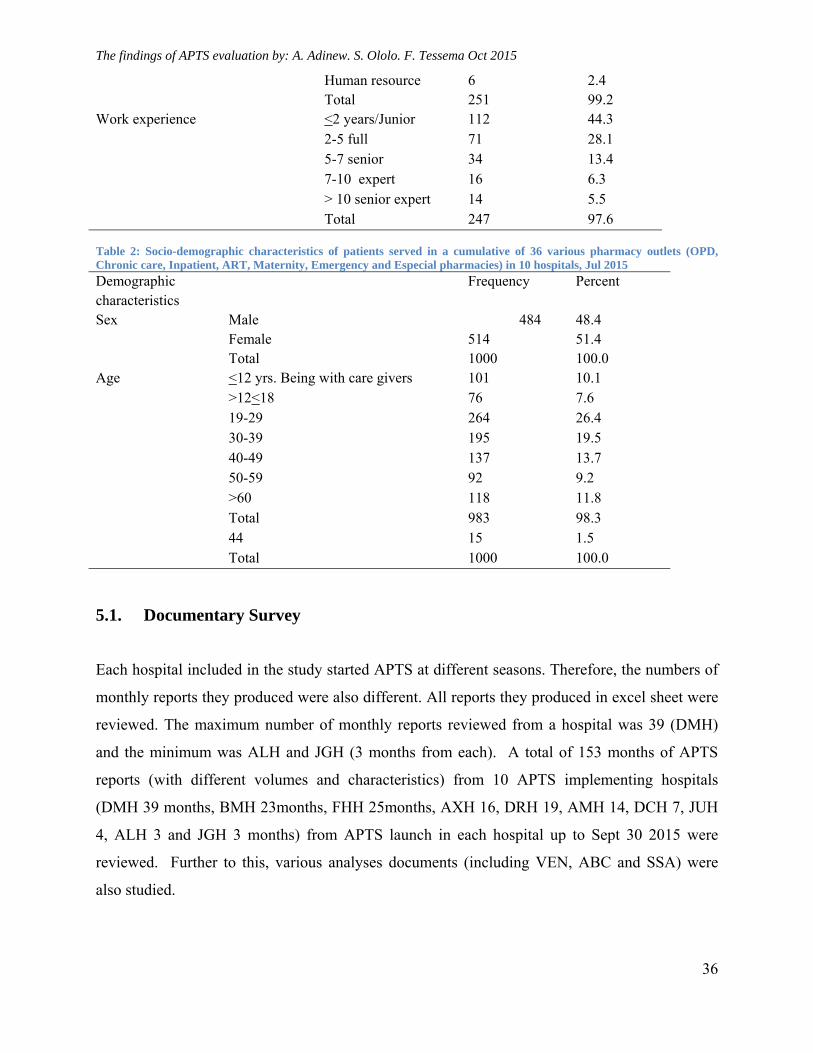
The findings of APTS evaluation by: A. Adinew. S. Ololo. F. Tessema Oct 2015
36
Human resource 6 2.4 Total 251 99.2
Work experience <2 years/Junior 112 44.3 2-5 full 71 28.1 5-7 senior 34 13.4 7-10 expert 16 6.3 > 10 senior expert 14 5.5 Total 247 97.6
Table 2: Socio-demographic characteristics of patients served in a cumulative of 36 various pharmacy outlets (OPD, Chronic care, Inpatient, ART, Maternity, Emergency and Especial pharmacies) in 10 hospitals, Jul 2015 Demographic characteristics
Frequency Percent
Sex Male 484 48.4 Female 514 51.4 Total 1000 100.0
Age <12 yrs. Being with care givers 101 10.1 >12<18 76 7.6 19-29 264 26.4 30-39 195 19.5 40-49 137 13.7 50-59 92 9.2 >60 118 11.8 Total 983 98.3 44 15 1.5 Total 1000 100.0
5.1. Documentary Survey
Each hospital included in the study started APTS at different seasons. Therefore, the numbers of
monthly reports they produced were also different. All reports they produced in excel sheet were
reviewed. The maximum number of monthly reports reviewed from a hospital was 39 (DMH)
and the minimum was ALH and JGH (3 months from each). A total of 153 months of APTS
reports (with different volumes and characteristics) from 10 APTS implementing hospitals
(DMH 39 months, BMH 23months, FHH 25months, AXH 16, DRH 19, AMH 14, DCH 7, JUH
4, ALH 3 and JGH 3 months) from APTS launch in each hospital up to Sept 30 2015 were
reviewed. Further to this, various analyses documents (including VEN, ABC and SSA) were
also studied.
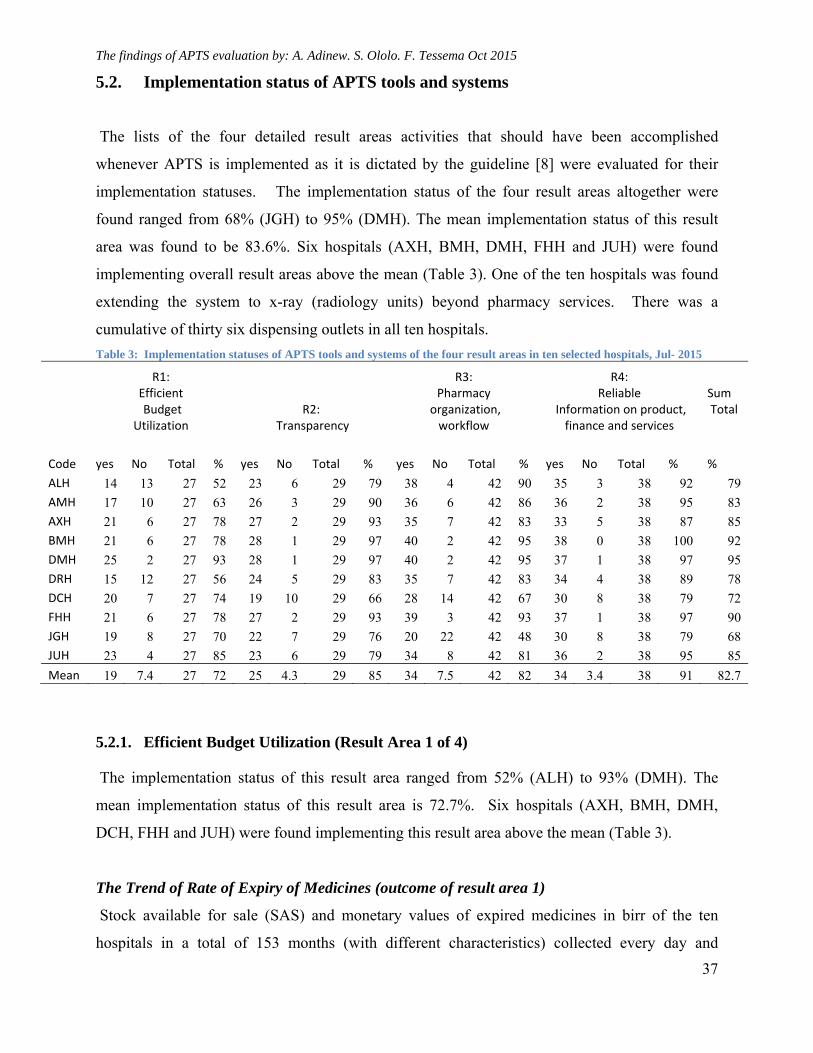
The findings of APTS evaluation by: A. Adinew. S. Ololo. F. Tessema Oct 2015
37
5.2. Implementation status of APTS tools and systems
The lists of the four detailed result areas activities that should have been accomplished
whenever APTS is implemented as it is dictated by the guideline [8] were evaluated for their
implementation statuses. The implementation status of the four result areas altogether were
found ranged from 68% (JGH) to 95% (DMH). The mean implementation status of this result
area was found to be 83.6%. Six hospitals (AXH, BMH, DMH, FHH and JUH) were found
implementing overall result areas above the mean (Table 3). One of the ten hospitals was found
extending the system to x-ray (radiology units) beyond pharmacy services. There was a
cumulative of thirty six dispensing outlets in all ten hospitals.
Table 3: Implementation statuses of APTS tools and systems of the four result areas in ten selected hospitals, Jul- 2015
R1: Efficient Budget
Utilization R2:
Transparency
R3: Pharmacy
organization, workflow
R4: Reliable
Information on product, finance and services
Sum Total
Code yes No Total % yes No Total
% yes No Total
% yes No Total
% %
ALH 14 13 27 52 23 6 29 79 38 4 42 90 35 3 38 92 79
AMH 17 10 27 63 26 3 29 90 36 6 42 86 36 2 38 95 83
AXH 21 6 27 78 27 2 29 93 35 7 42 83 33 5 38 87 85
BMH 21 6 27 78 28 1 29 97 40 2 42 95 38 0 38 100 92
DMH 25 2 27 93 28 1 29 97 40 2 42 95 37 1 38 97 95
DRH 15 12 27 56 24 5 29 83 35 7 42 83 34 4 38 89 78
DCH 20 7 27 74 19 10 29 66 28 14 42 67 30 8 38 79 72
FHH 21 6 27 78 27 2 29 93 39 3 42 93 37 1 38 97 90
JGH 19 8 27 70 22 7 29 76 20 22 42 48 30 8 38 79 68
JUH 23 4 27 85 23 6 29 79 34 8 42 81 36 2 38 95 85
Mean 19 7.4 27 72 25 4.3 29 85 34 7.5 42 82 34 3.4 38 91 82.7
5.2.1. Efficient Budget Utilization (Result Area 1 of 4)
The implementation status of this result area ranged from 52% (ALH) to 93% (DMH). The
mean implementation status of this result area is 72.7%. Six hospitals (AXH, BMH, DMH,
DCH, FHH and JUH) were found implementing this result area above the mean (Table 3).
The Trend of Rate of Expiry of Medicines (outcome of result area 1)
Stock available for sale (SAS) and monetary values of expired medicines in birr of the ten
hospitals in a total of 153 months (with different characteristics) collected every day and
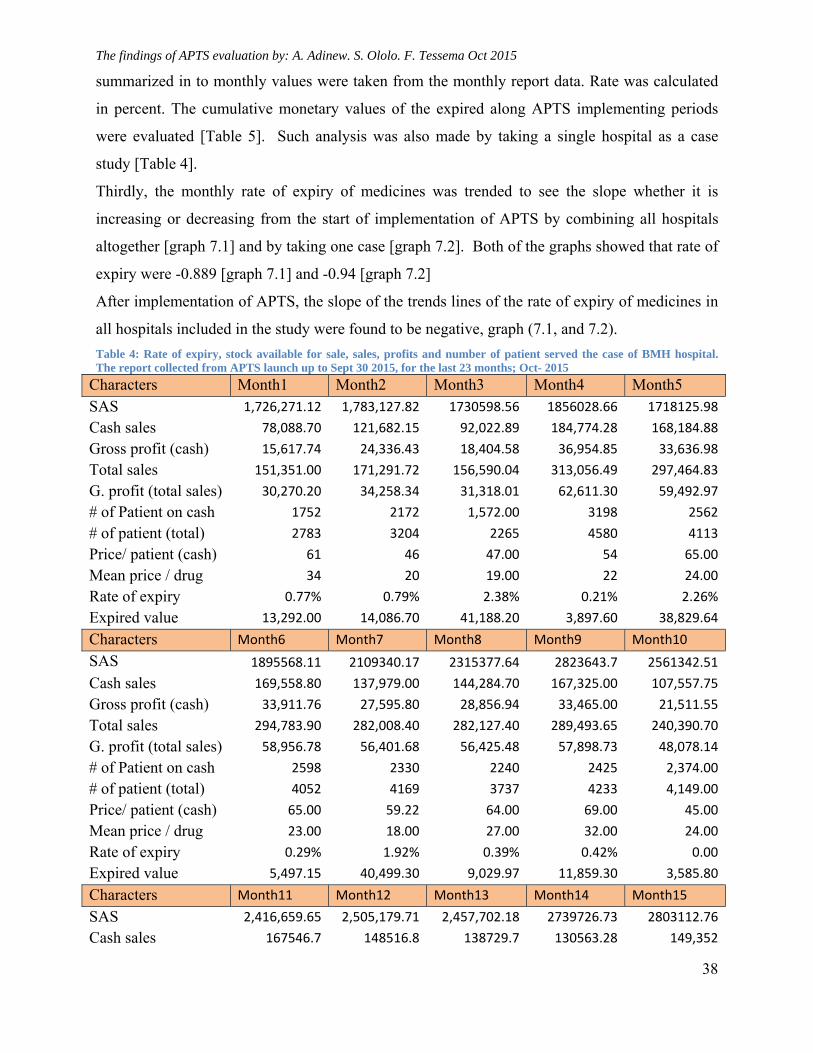
The findings of APTS evaluation by: A. Adinew. S. Ololo. F. Tessema Oct 2015
38
summarized in to monthly values were taken from the monthly report data. Rate was calculated
in percent. The cumulative monetary values of the expired along APTS implementing periods
were evaluated [Table 5]. Such analysis was also made by taking a single hospital as a case
study [Table 4].
Thirdly, the monthly rate of expiry of medicines was trended to see the slope whether it is
increasing or decreasing from the start of implementation of APTS by combining all hospitals
altogether [graph 7.1] and by taking one case [graph 7.2]. Both of the graphs showed that rate of
expiry were -0.889 [graph 7.1] and -0.94 [graph 7.2]
After implementation of APTS, the slope of the trends lines of the rate of expiry of medicines in
all hospitals included in the study were found to be negative, graph (7.1, and 7.2).
Table 4: Rate of expiry, stock available for sale, sales, profits and number of patient served the case of BMH hospital. The report collected from APTS launch up to Sept 30 2015, for the last 23 months; Oct- 2015
Characters Month1 Month2 Month3 Month4 Month5 SAS 1,726,271.12 1,783,127.82 1730598.56 1856028.66 1718125.98
Cash sales 78,088.70 121,682.15 92,022.89 184,774.28 168,184.88
Gross profit (cash) 15,617.74 24,336.43 18,404.58 36,954.85 33,636.98
Total sales 151,351.00 171,291.72 156,590.04 313,056.49 297,464.83
G. profit (total sales) 30,270.20 34,258.34 31,318.01 62,611.30 59,492.97
# of Patient on cash 1752 2172 1,572.00 3198 2562
# of patient (total) 2783 3204 2265 4580 4113
Price/ patient (cash) 61 46 47.00 54 65.00
Mean price / drug 34 20 19.00 22 24.00
Rate of expiry 0.77% 0.79% 2.38% 0.21% 2.26%
Expired value 13,292.00 14,086.70 41,188.20 3,897.60 38,829.64
Characters Month6 Month7 Month8 Month9 Month10
SAS 1895568.11 2109340.17 2315377.64 2823643.7 2561342.51
Cash sales 169,558.80 137,979.00 144,284.70 167,325.00 107,557.75
Gross profit (cash) 33,911.76 27,595.80 28,856.94 33,465.00 21,511.55
Total sales 294,783.90 282,008.40 282,127.40 289,493.65 240,390.70
G. profit (total sales) 58,956.78 56,401.68 56,425.48 57,898.73 48,078.14
# of Patient on cash 2598 2330 2240 2425 2,374.00
# of patient (total) 4052 4169 3737 4233 4,149.00
Price/ patient (cash) 65.00 59.22 64.00 69.00 45.00
Mean price / drug 23.00 18.00 27.00 32.00 24.00
Rate of expiry 0.29% 1.92% 0.39% 0.42% 0.00
Expired value 5,497.15 40,499.30 9,029.97 11,859.30 3,585.80
Characters Month11 Month12 Month13 Month14 Month15
SAS 2,416,659.65 2,505,179.71 2,457,702.18 2739726.73 2803112.76
Cash sales 167546.7 148516.8 138729.7 130563.28 149,352
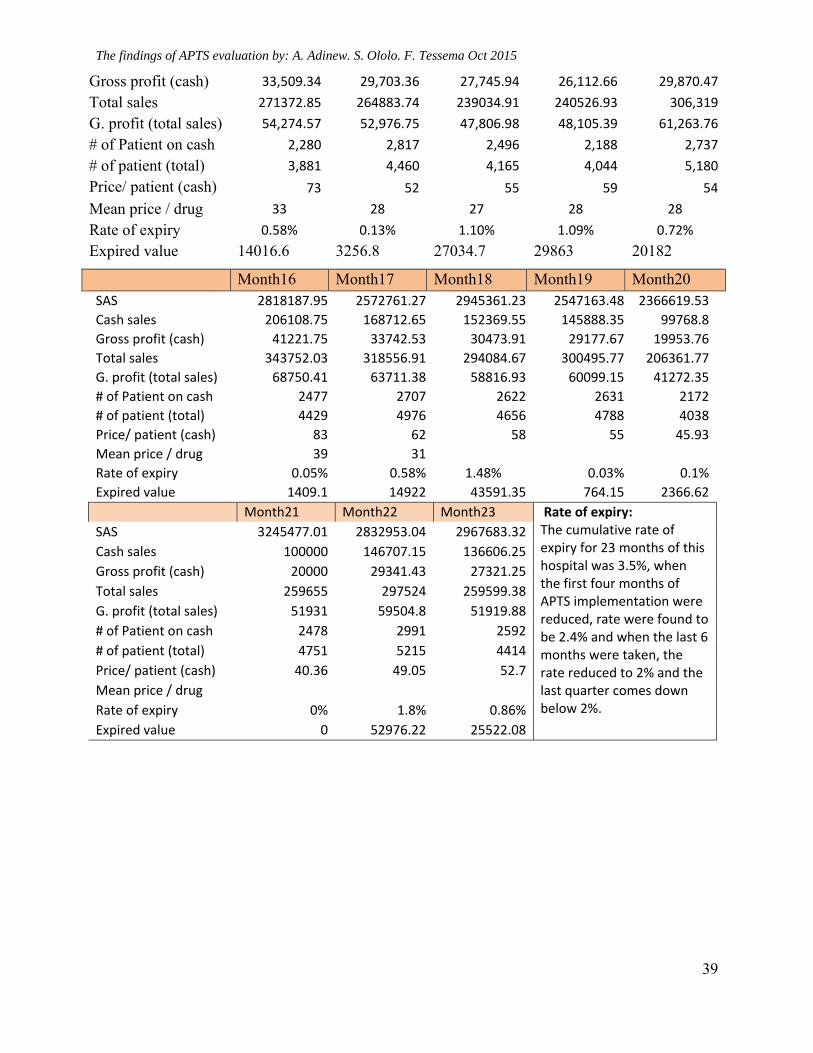
The findings of APTS evaluation by: A. Adinew. S. Ololo. F. Tessema Oct 2015
39
Gross profit (cash) 33,509.34 29,703.36 27,745.94 26,112.66 29,870.47
Total sales 271372.85 264883.74 239034.91 240526.93 306,319
G. profit (total sales) 54,274.57 52,976.75 47,806.98 48,105.39 61,263.76
# of Patient on cash 2,280 2,817 2,496 2,188 2,737
# of patient (total) 3,881 4,460 4,165 4,044 5,180
Price/ patient (cash) 73 52 55 59 54
Mean price / drug 33 28 27 28 28
Rate of expiry 0.58% 0.13% 1.10% 1.09% 0.72%
Expired value 14016.6 3256.8 27034.7 29863 20182
Month16 Month17 Month18 Month19 Month20 SAS 2818187.95 2572761.27 2945361.23 2547163.48 2366619.53
Cash sales 206108.75 168712.65 152369.55 145888.35 99768.8
Gross profit (cash) 41221.75 33742.53 30473.91 29177.67 19953.76
Total sales 343752.03 318556.91 294084.67 300495.77 206361.77
G. profit (total sales) 68750.41 63711.38 58816.93 60099.15 41272.35
# of Patient on cash 2477 2707 2622 2631 2172
# of patient (total) 4429 4976 4656 4788 4038
Price/ patient (cash) 83 62 58 55 45.93
Mean price / drug 39 31
Rate of expiry 0.05% 0.58% 1.48% 0.03% 0.1%
Expired value 1409.1 14922 43591.35 764.15 2366.62
Month21 Month22 Month23 Rate of expiry: The cumulative rate of expiry for 23 months of this hospital was 3.5%, when the first four months of APTS implementation were reduced, rate were found to be 2.4% and when the last 6 months were taken, the rate reduced to 2% and the last quarter comes down below 2%.
SAS 3245477.01 2832953.04 2967683.32
Cash sales 100000 146707.15 136606.25
Gross profit (cash) 20000 29341.43 27321.25
Total sales 259655 297524 259599.38
G. profit (total sales) 51931 59504.8 51919.88
# of Patient on cash 2478 2991 2592
# of patient (total) 4751 5215 4414
Price/ patient (cash) 40.36 49.05 52.7
Mean price / drug
Rate of expiry 0% 1.8% 0.86%
Expired value 0 52976.22 25522.08
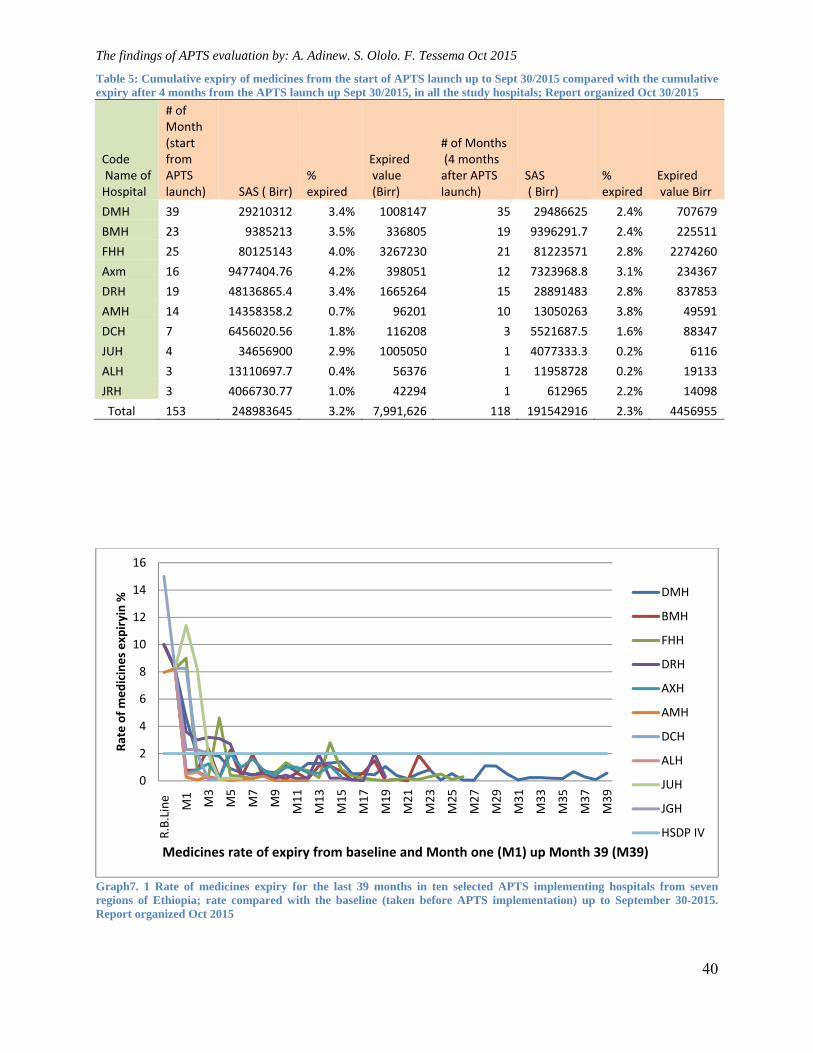
The findings of APTS evaluation by: A. Adinew. S. Ololo. F. Tessema Oct 2015
40
Table 5: Cumulative expiry of medicines from the start of APTS launch up to Sept 30/2015 compared with the cumulative expiry after 4 months from the APTS launch up Sept 30/2015, in all the study hospitals; Report organized Oct 30/2015
Code Name of Hospital
# of Month (start from APTS launch) SAS ( Birr)
% expired
Expired value (Birr)
# of Months (4 months after APTS launch)
SAS ( Birr)
% expired
Expired value Birr
DMH 39 29210312 3.4% 1008147 35 29486625 2.4% 707679
BMH 23 9385213 3.5% 336805 19 9396291.7 2.4% 225511
FHH 25 80125143 4.0% 3267230 21 81223571 2.8% 2274260
Axm 16 9477404.76 4.2% 398051 12 7323968.8 3.1% 234367
DRH 19 48136865.4 3.4% 1665264 15 28891483 2.8% 837853
AMH 14 14358358.2 0.7% 96201 10 13050263 3.8% 49591
DCH 7 6456020.56 1.8% 116208 3 5521687.5 1.6% 88347
JUH 4 34656900 2.9% 1005050 1 4077333.3 0.2% 6116
ALH 3 13110697.7 0.4% 56376 1 11958728 0.2% 19133
JRH 3 4066730.77 1.0% 42294 1 612965 2.2% 14098
Total 153 248983645 3.2% 7,991,626 118 191542916 2.3% 4456955
Graph7. 1 Rate of medicines expiry for the last 39 months in ten selected APTS implementing hospitals from seven regions of Ethiopia; rate compared with the baseline (taken before APTS implementation) up to September 30-2015. Report organized Oct 2015
0
2
4
6
8
10
12
14
16
R.B.Line
M1
M3
M5
M7
M9
M11
M13
M15
M17
M19
M21
M23
M25
M27
M29
M31
M33
M35
M37
M39
Rate of medicines expiryin %
Medicines rate of expiry from baseline and Month one (M1) up Month 39 (M39)
DMH
BMH
FHH
DRH
AXH
AMH
DCH
ALH
JUH
JGH
HSDP IV
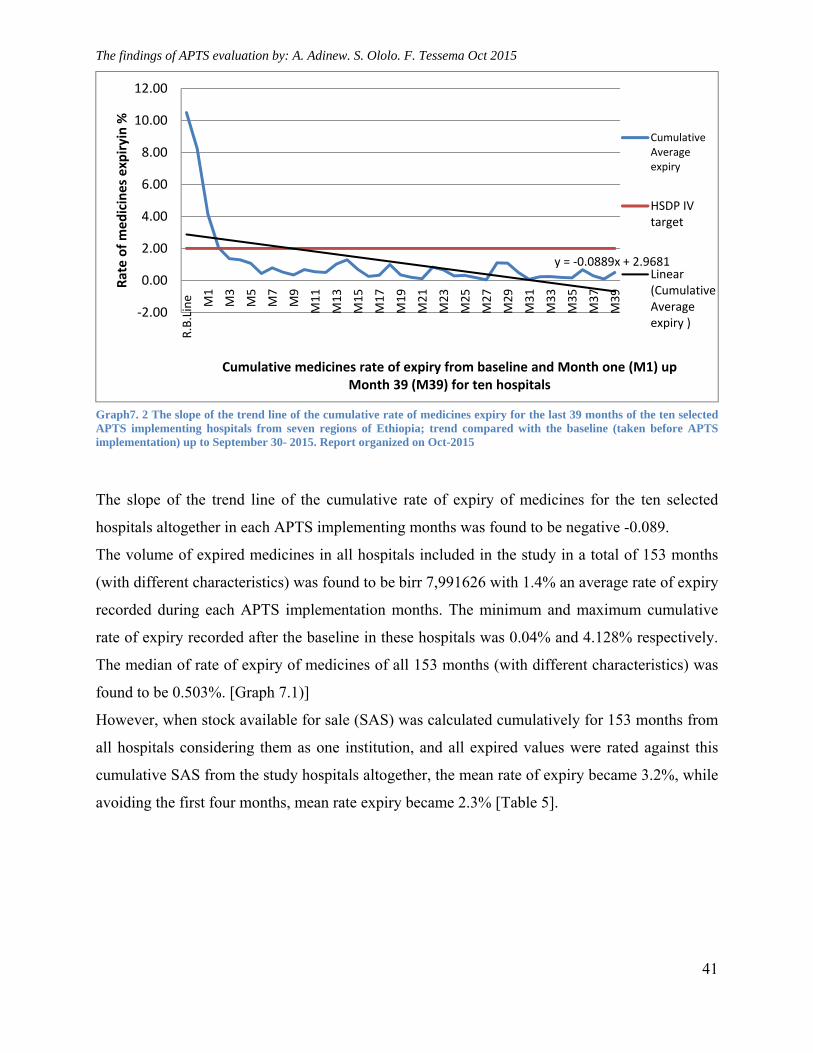
The findings of APTS evaluation by: A. Adinew. S. Ololo. F. Tessema Oct 2015
41
Graph7. 2 The slope of the trend line of the cumulative rate of medicines expiry for the last 39 months of the ten selected APTS implementing hospitals from seven regions of Ethiopia; trend compared with the baseline (taken before APTS implementation) up to September 30- 2015. Report organized on Oct-2015
The slope of the trend line of the cumulative rate of expiry of medicines for the ten selected
hospitals altogether in each APTS implementing months was found to be negative -0.089.
The volume of expired medicines in all hospitals included in the study in a total of 153 months
(with different characteristics) was found to be birr 7,991626 with 1.4% an average rate of expiry
recorded during each APTS implementation months. The minimum and maximum cumulative
rate of expiry recorded after the baseline in these hospitals was 0.04% and 4.128% respectively.
The median of rate of expiry of medicines of all 153 months (with different characteristics) was
found to be 0.503%. [Graph 7.1)]
However, when stock available for sale (SAS) was calculated cumulatively for 153 months from
all hospitals considering them as one institution, and all expired values were rated against this
cumulative SAS from the study hospitals altogether, the mean rate of expiry became 3.2%, while
avoiding the first four months, mean rate expiry became 2.3% [Table 5].
y = ‐0.0889x + 2.9681
‐2.00
0.00
2.00
4.00
6.00
8.00
10.00
12.00
R.B.Line M1
M3
M5
M7
M9
M11
M13
M15
M17
M19
M21
M23
M25
M27
M29
M31
M33
M35
M37
M39
Rate of medicines expiryin %
Cumulative medicines rate of expiry from baseline and Month one (M1) up Month 39 (M39) for ten hospitals
CumulativeAverageexpiry
HSDP IVtarget
Linear(CumulativeAverageexpiry )
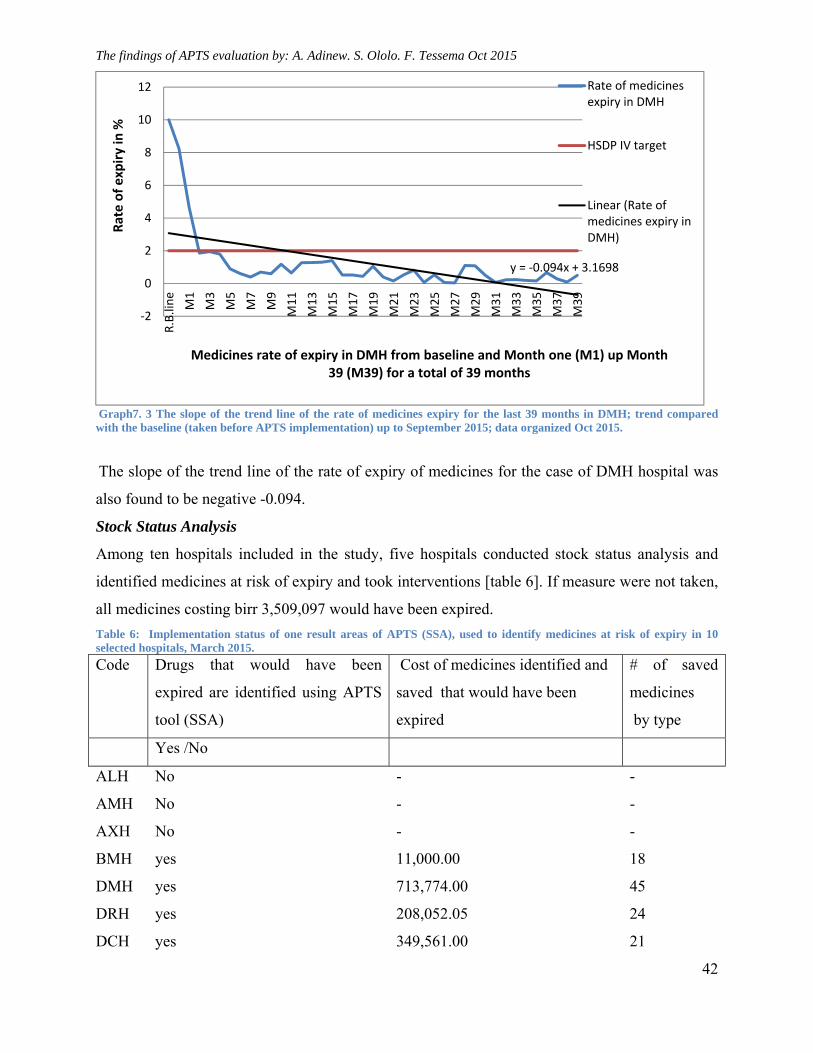
The findings of APTS evaluation by: A. Adinew. S. Ololo. F. Tessema Oct 2015
42
Graph7. 3 The slope of the trend line of the rate of medicines expiry for the last 39 months in DMH; trend compared with the baseline (taken before APTS implementation) up to September 2015; data organized Oct 2015.
The slope of the trend line of the rate of expiry of medicines for the case of DMH hospital was
also found to be negative -0.094.
Stock Status Analysis
Among ten hospitals included in the study, five hospitals conducted stock status analysis and
identified medicines at risk of expiry and took interventions [table 6]. If measure were not taken,
all medicines costing birr 3,509,097 would have been expired.
Table 6: Implementation status of one result areas of APTS (SSA), used to identify medicines at risk of expiry in 10 selected hospitals, March 2015.
Code Drugs that would have been
expired are identified using APTS
tool (SSA)
Cost of medicines identified and
saved that would have been
expired
# of saved
medicines
by type
Yes /No
ALH No - -
AMH No - -
AXH No - -
BMH yes 11,000.00 18
DMH yes 713,774.00 45
DRH yes 208,052.05 24
DCH yes 349,561.00 21
y = ‐0.094x + 3.1698
‐2
0
2
4
6
8
10
12
R.B.line
M1
M3
M5
M7
M9
M11
M13
M15
M17
M19
M21
M23
M25
M27
M29
M31
M33
M35
M37
M39
Rate of expiry in %
Medicines rate of expiry in DMH from baseline and Month one (M1) up Month 39 (M39) for a total of 39 months
Rate of medicinesexpiry in DMH
HSDP IV target
Linear (Rate ofmedicines expiry inDMH)
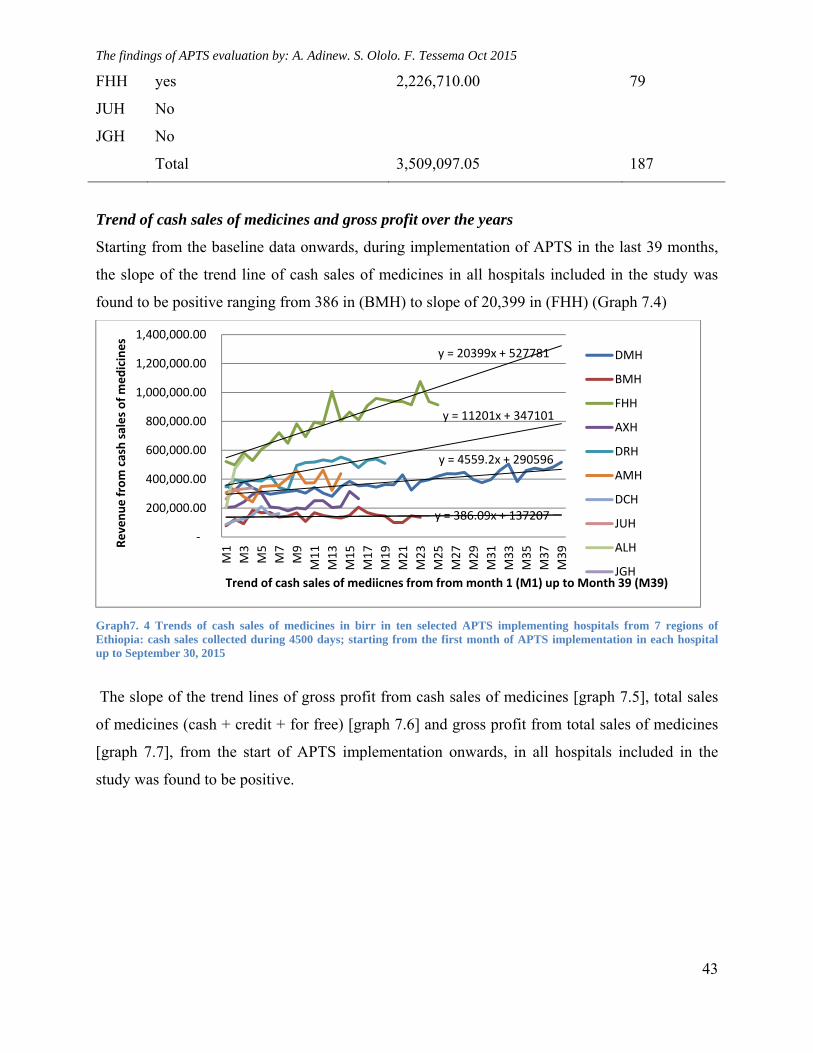
The findings of APTS evaluation by: A. Adinew. S. Ololo. F. Tessema Oct 2015
43
FHH yes 2,226,710.00 79
JUH No
JGH No
Total 3,509,097.05 187
Trend of cash sales of medicines and gross profit over the years
Starting from the baseline data onwards, during implementation of APTS in the last 39 months,
the slope of the trend line of cash sales of medicines in all hospitals included in the study was
found to be positive ranging from 386 in (BMH) to slope of 20,399 in (FHH) (Graph 7.4)
Graph7. 4 Trends of cash sales of medicines in birr in ten selected APTS implementing hospitals from 7 regions of Ethiopia: cash sales collected during 4500 days; starting from the first month of APTS implementation in each hospital up to September 30, 2015
The slope of the trend lines of gross profit from cash sales of medicines [graph 7.5], total sales
of medicines (cash + credit + for free) [graph 7.6] and gross profit from total sales of medicines
[graph 7.7], from the start of APTS implementation onwards, in all hospitals included in the
study was found to be positive.
y = 4559.2x + 290596
y = 386.09x + 137207
y = 20399x + 527781
y = 11201x + 347101
‐
200,000.00
400,000.00
600,000.00
800,000.00
1,000,000.00
1,200,000.00
1,400,000.00
M1
M3
M5
M7
M9
M11
M13
M15
M17
M19
M21
M23
M25
M27
M29
M31
M33
M35
M37
M39Revenue from cash sales of medicines
Trend of cash sales of mediicnes from from month 1 (M1) up to Month 39 (M39)
DMH
BMH
FHH
AXH
DRH
AMH
DCH
JUH
ALH
JGH
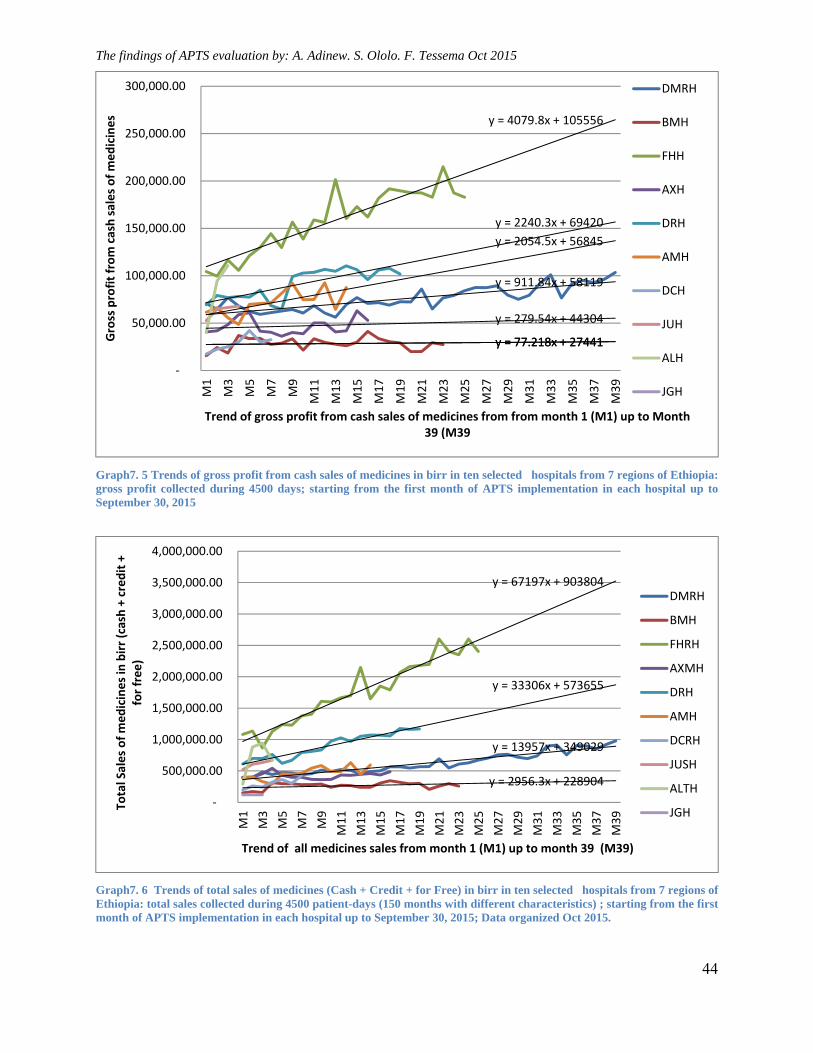
The findings of APTS evaluation by: A. Adinew. S. Ololo. F. Tessema Oct 2015
44
Graph7. 5 Trends of gross profit from cash sales of medicines in birr in ten selected hospitals from 7 regions of Ethiopia: gross profit collected during 4500 days; starting from the first month of APTS implementation in each hospital up to September 30, 2015
Graph7. 6 Trends of total sales of medicines (Cash + Credit + for Free) in birr in ten selected hospitals from 7 regions of Ethiopia: total sales collected during 4500 patient-days (150 months with different characteristics) ; starting from the first month of APTS implementation in each hospital up to September 30, 2015; Data organized Oct 2015.
y = 911.84x + 58119
y = 77.218x + 27441y = 77.218x + 27441
y = 4079.8x + 105556
y = 279.54x + 44304
y = 2240.3x + 69420
y = 2054.5x + 56845
‐
50,000.00
100,000.00
150,000.00
200,000.00
250,000.00
300,000.00
M1
M3
M5
M7
M9
M11
M13
M15
M17
M19
M21
M23
M25
M27
M29
M31
M33
M35
M37
M39
Gross profit from cash sales of medicines
Trend of gross profit from cash sales of medicines from from month 1 (M1) up to Month 39 (M39
DMRH
BMH
FHH
AXH
DRH
AMH
DCH
JUH
ALH
JGH
y = 13957x + 349029
y = 2956.3x + 228904
y = 67197x + 903804
y = 33306x + 573655
‐
500,000.00
1,000,000.00
1,500,000.00
2,000,000.00
2,500,000.00
3,000,000.00
3,500,000.00
4,000,000.00
M1
M3
M5
M7
M9
M11
M13
M15
M17
M19
M21
M23
M25
M27
M29
M31
M33
M35
M37
M39
Total Sales of medicines in birr (cash + credit +
for free)
Trend of all medicines sales from month 1 (M1) up to month 39 (M39)
DMRH
BMH
FHRH
AXMH
DRH
AMH
DCRH
JUSH
ALTH
JGH
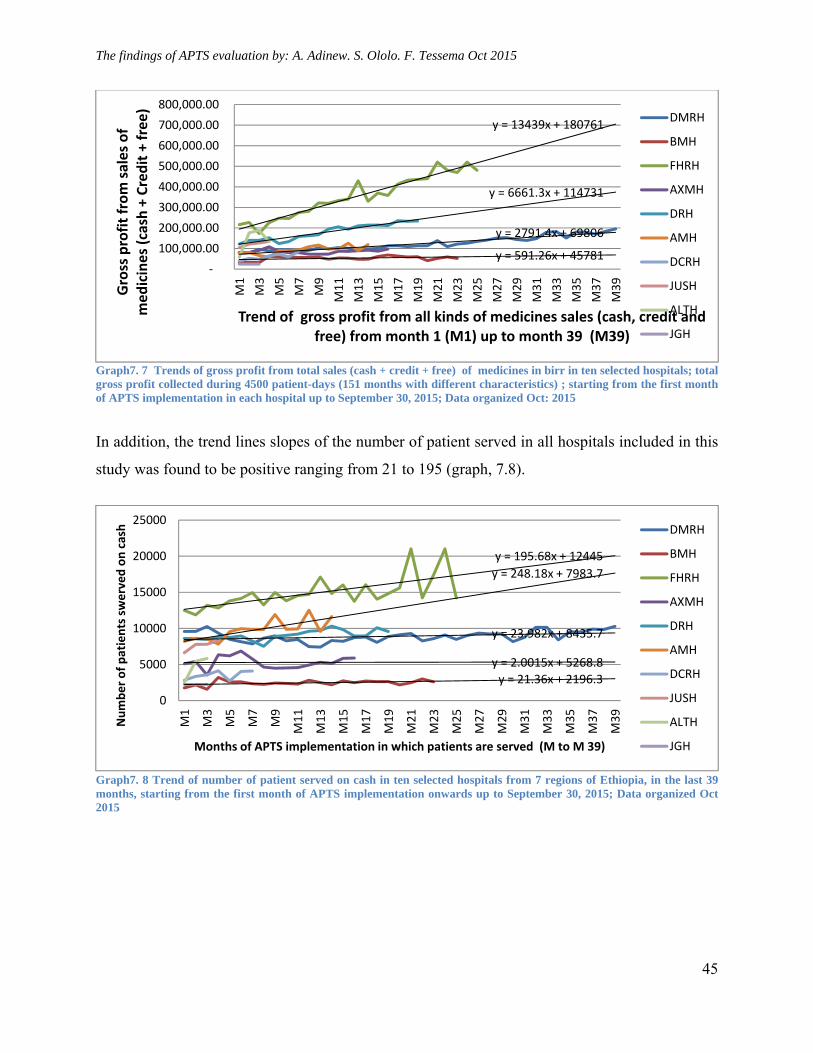
The findings of APTS evaluation by: A. Adinew. S. Ololo. F. Tessema Oct 2015
45
Graph7. 7 Trends of gross profit from total sales (cash + credit + free) of medicines in birr in ten selected hospitals; total gross profit collected during 4500 patient-days (151 months with different characteristics) ; starting from the first month of APTS implementation in each hospital up to September 30, 2015; Data organized Oct: 2015
In addition, the trend lines slopes of the number of patient served in all hospitals included in this
study was found to be positive ranging from 21 to 195 (graph, 7.8).
Graph7. 8 Trend of number of patient served on cash in ten selected hospitals from 7 regions of Ethiopia, in the last 39 months, starting from the first month of APTS implementation onwards up to September 30, 2015; Data organized Oct 2015
y = 2791.4x + 69806
y = 591.26x + 45781
y = 13439x + 180761
y = 6661.3x + 114731
‐
100,000.00
200,000.00
300,000.00
400,000.00
500,000.00
600,000.00
700,000.00
800,000.00
M1
M3
M5
M7
M9
M11
M13
M15
M17
M19
M21
M23
M25
M27
M29
M31
M33
M35
M37
M39
Gross profit from sales of
medicines (cash + Credit + free)
Trend of gross profit from all kinds of medicines sales (cash, credit and free) from month 1 (M1) up to month 39 (M39)
DMRH
BMH
FHRH
AXMH
DRH
AMH
DCRH
JUSH
ALTH
JGH
y = 23.982x + 8435.7
y = 21.36x + 2196.3
y = 195.68x + 12445
y = 2.0015x + 5268.8
y = 248.18x + 7983.7
0
5000
10000
15000
20000
25000
M1
M3
M5
M7
M9
M11
M13
M15
M17
M19
M21
M23
M25
M27
M29
M31
M33
M35
M37
M39
Number of patients swerved on cash
Months of APTS implementation in which patients are served (M to M 39)
DMRH
BMH
FHRH
AXMH
DRH
AMH
DCRH
JUSH
ALTH
JGH
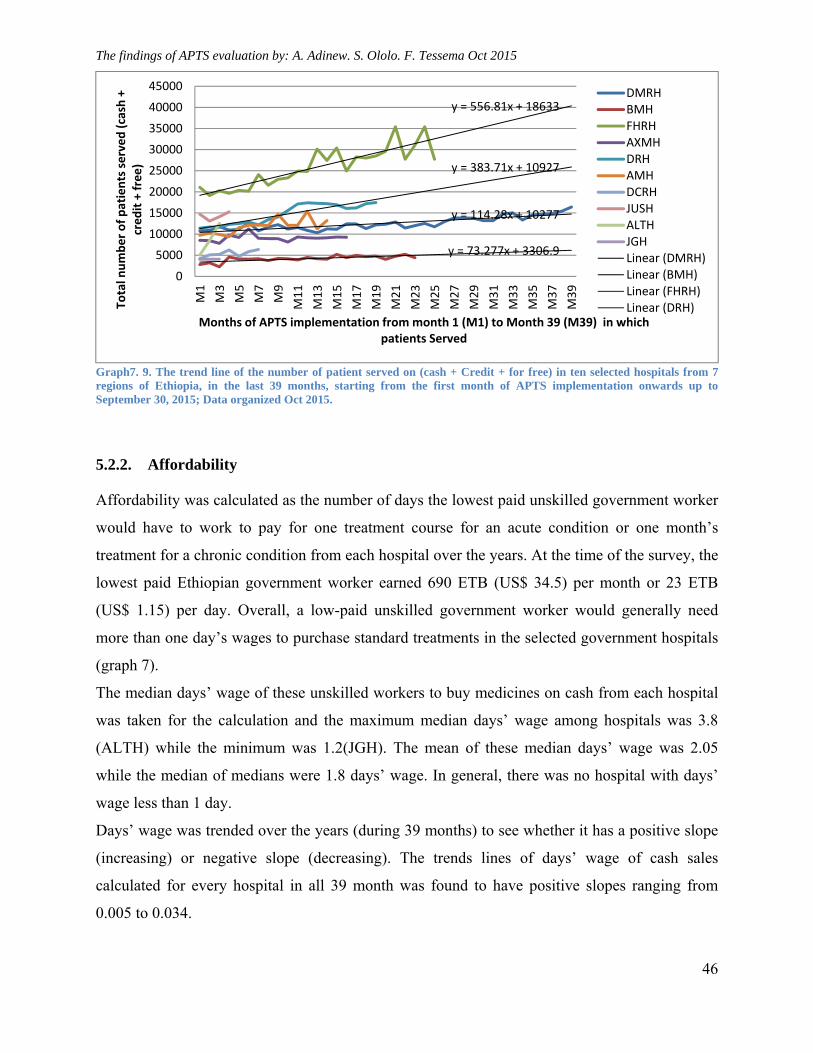
The findings of APTS evaluation by: A. Adinew. S. Ololo. F. Tessema Oct 2015
46
Graph7. 9. The trend line of the number of patient served on (cash + Credit + for free) in ten selected hospitals from 7 regions of Ethiopia, in the last 39 months, starting from the first month of APTS implementation onwards up to September 30, 2015; Data organized Oct 2015.
5.2.2. Affordability
Affordability was calculated as the number of days the lowest paid unskilled government worker
would have to work to pay for one treatment course for an acute condition or one month’s
treatment for a chronic condition from each hospital over the years. At the time of the survey, the
lowest paid Ethiopian government worker earned 690 ETB (US$ 34.5) per month or 23 ETB
(US$ 1.15) per day. Overall, a low-paid unskilled government worker would generally need
more than one day’s wages to purchase standard treatments in the selected government hospitals
(graph 7).
The median days’ wage of these unskilled workers to buy medicines on cash from each hospital
was taken for the calculation and the maximum median days’ wage among hospitals was 3.8
(ALTH) while the minimum was 1.2(JGH). The mean of these median days’ wage was 2.05
while the median of medians were 1.8 days’ wage. In general, there was no hospital with days’
wage less than 1 day.
Days’ wage was trended over the years (during 39 months) to see whether it has a positive slope
(increasing) or negative slope (decreasing). The trends lines of days’ wage of cash sales
calculated for every hospital in all 39 month was found to have positive slopes ranging from
0.005 to 0.034.
y = 114.28x + 10277
y = 73.277x + 3306.9
y = 556.81x + 18633
y = 383.71x + 10927
0
5000
10000
15000
20000
25000
30000
35000
40000
45000
M1
M3
M5
M7
M9
M11
M13
M15
M17
M19
M21
M23
M25
M27
M29
M31
M33
M35
M37
M39
Total number of patients served (cash +
credit + free)
Months of APTS implementation from month 1 (M1) to Month 39 (M39) in which patients Served
DMRHBMHFHRHAXMHDRHAMHDCRHJUSHALTHJGHLinear (DMRH)Linear (BMH)Linear (FHRH)Linear (DRH)
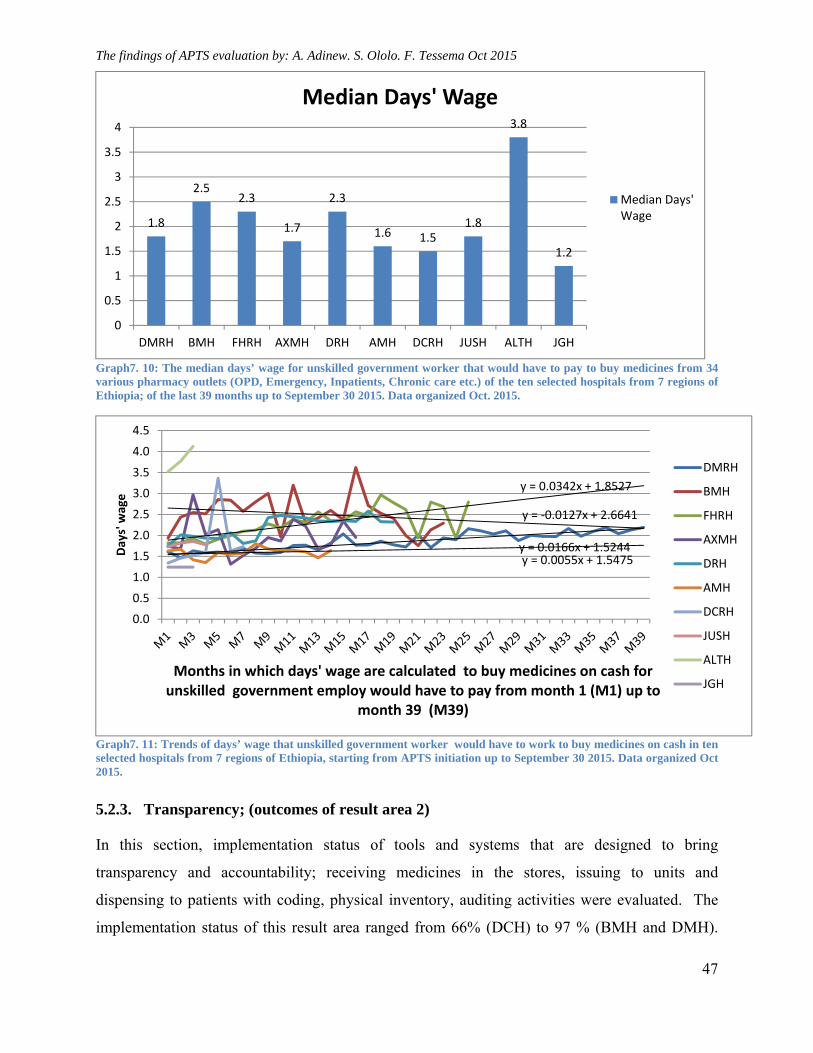
The findings of APTS evaluation by: A. Adinew. S. Ololo. F. Tessema Oct 2015
47
Graph7. 10: The median days’ wage for unskilled government worker that would have to pay to buy medicines from 34 various pharmacy outlets (OPD, Emergency, Inpatients, Chronic care etc.) of the ten selected hospitals from 7 regions of Ethiopia; of the last 39 months up to September 30 2015. Data organized Oct. 2015.
Graph7. 11: Trends of days’ wage that unskilled government worker would have to work to buy medicines on cash in ten selected hospitals from 7 regions of Ethiopia, starting from APTS initiation up to September 30 2015. Data organized Oct 2015.
5.2.3. Transparency; (outcomes of result area 2)
In this section, implementation status of tools and systems that are designed to bring
transparency and accountability; receiving medicines in the stores, issuing to units and
dispensing to patients with coding, physical inventory, auditing activities were evaluated. The
implementation status of this result area ranged from 66% (DCH) to 97 % (BMH and DMH).
1.8
2.52.3
1.7
2.3
1.6 1.51.8
3.8
1.2
0
0.5
1
1.5
2
2.5
3
3.5
4
DMRH BMH FHRH AXMH DRH AMH DCRH JUSH ALTH JGH
Median Days' Wage
Median Days'Wage
y = 0.0166x + 1.5244
y = ‐0.0127x + 2.6641
y = 0.0342x + 1.8527
y = 0.0055x + 1.5475
0.0
0.5
1.0
1.5
2.0
2.5
3.0
3.5
4.0
4.5
Days' wage
Months in which days' wage are calculated to buy medicines on cash for unskilled government employ would have to pay from month 1 (M1) up to
month 39 (M39)
DMRH
BMH
FHRH
AXMH
DRH
AMH
DCRH
JUSH
ALTH
JGH
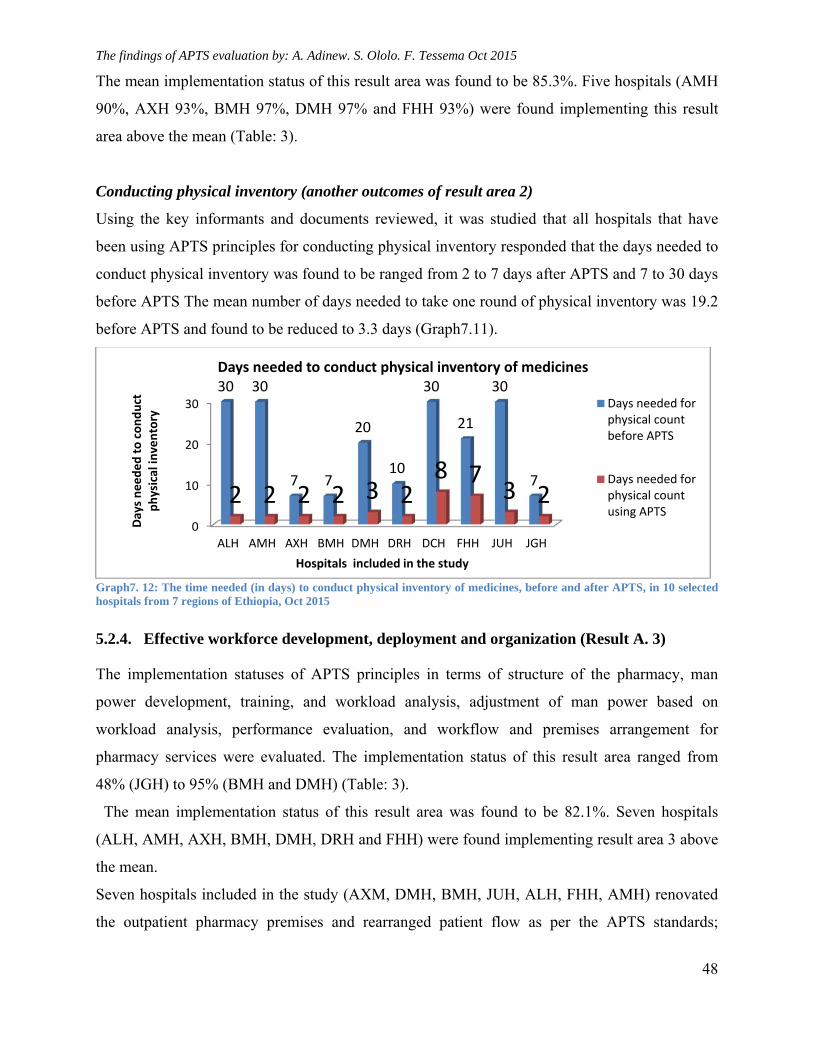
The findings of APTS evaluation by: A. Adinew. S. Ololo. F. Tessema Oct 2015
48
The mean implementation status of this result area was found to be 85.3%. Five hospitals (AMH
90%, AXH 93%, BMH 97%, DMH 97% and FHH 93%) were found implementing this result
area above the mean (Table: 3).
Conducting physical inventory (another outcomes of result area 2)
Using the key informants and documents reviewed, it was studied that all hospitals that have
been using APTS principles for conducting physical inventory responded that the days needed to
conduct physical inventory was found to be ranged from 2 to 7 days after APTS and 7 to 30 days
before APTS The mean number of days needed to take one round of physical inventory was 19.2
before APTS and found to be reduced to 3.3 days (Graph7.11).
Graph7. 12: The time needed (in days) to conduct physical inventory of medicines, before and after APTS, in 10 selected hospitals from 7 regions of Ethiopia, Oct 2015
5.2.4. Effective workforce development, deployment and organization (Result A. 3)
The implementation statuses of APTS principles in terms of structure of the pharmacy, man
power development, training, and workload analysis, adjustment of man power based on
workload analysis, performance evaluation, and workflow and premises arrangement for
pharmacy services were evaluated. The implementation status of this result area ranged from
48% (JGH) to 95% (BMH and DMH) (Table: 3).
The mean implementation status of this result area was found to be 82.1%. Seven hospitals
(ALH, AMH, AXH, BMH, DMH, DRH and FHH) were found implementing result area 3 above
the mean.
Seven hospitals included in the study (AXM, DMH, BMH, JUH, ALH, FHH, AMH) renovated
the outpatient pharmacy premises and rearranged patient flow as per the APTS standards;
0
10
20
30
ALH AMH AXH BMH DMH DRH DCH FHH JUH JGH
30 30
7 7
20
10
30
21
30
72 2 2 2 3 2
8 73 2
Days needed to conduct
physical inventory
Hospitals included in the study
Days needed to conduct physical inventory of medicines
Days needed forphysical countbefore APTS
Days needed forphysical countusing APTS
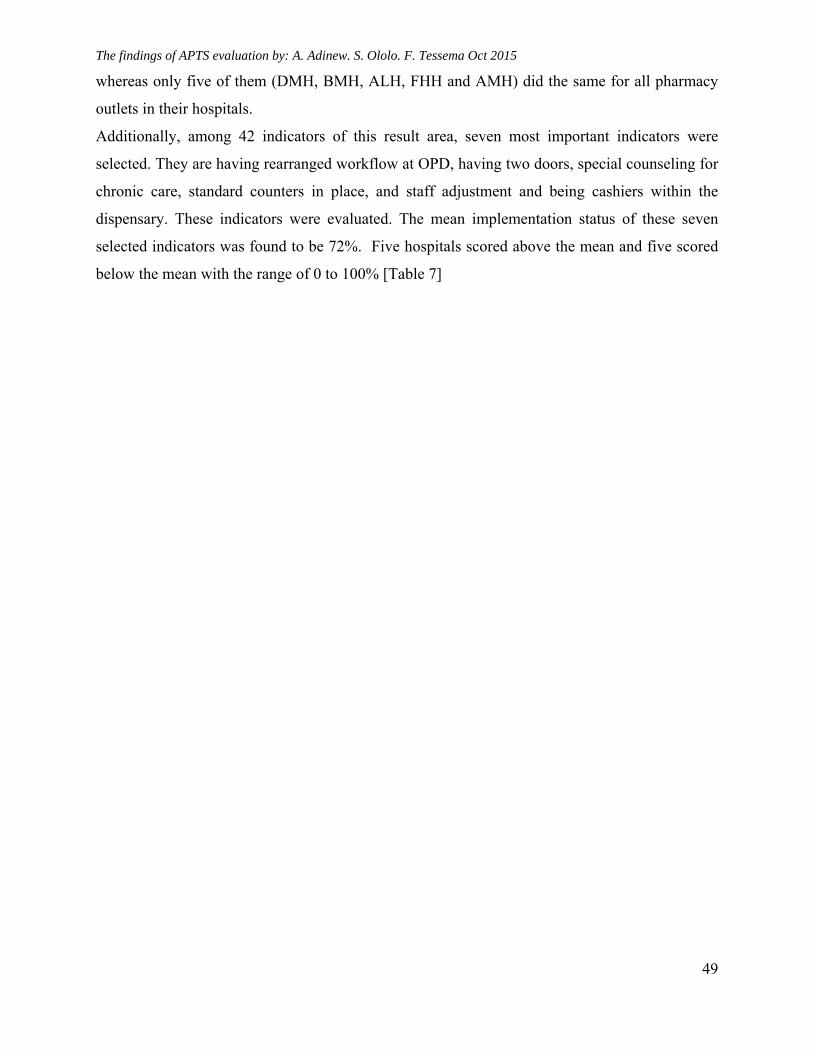
The findings of APTS evaluation by: A. Adinew. S. Ololo. F. Tessema Oct 2015
49
whereas only five of them (DMH, BMH, ALH, FHH and AMH) did the same for all pharmacy
outlets in their hospitals.
Additionally, among 42 indicators of this result area, seven most important indicators were
selected. They are having rearranged workflow at OPD, having two doors, special counseling for
chronic care, standard counters in place, and staff adjustment and being cashiers within the
dispensary. These indicators were evaluated. The mean implementation status of these seven
selected indicators was found to be 72%. Five hospitals scored above the mean and five scored
below the mean with the range of 0 to 100% [Table 7]
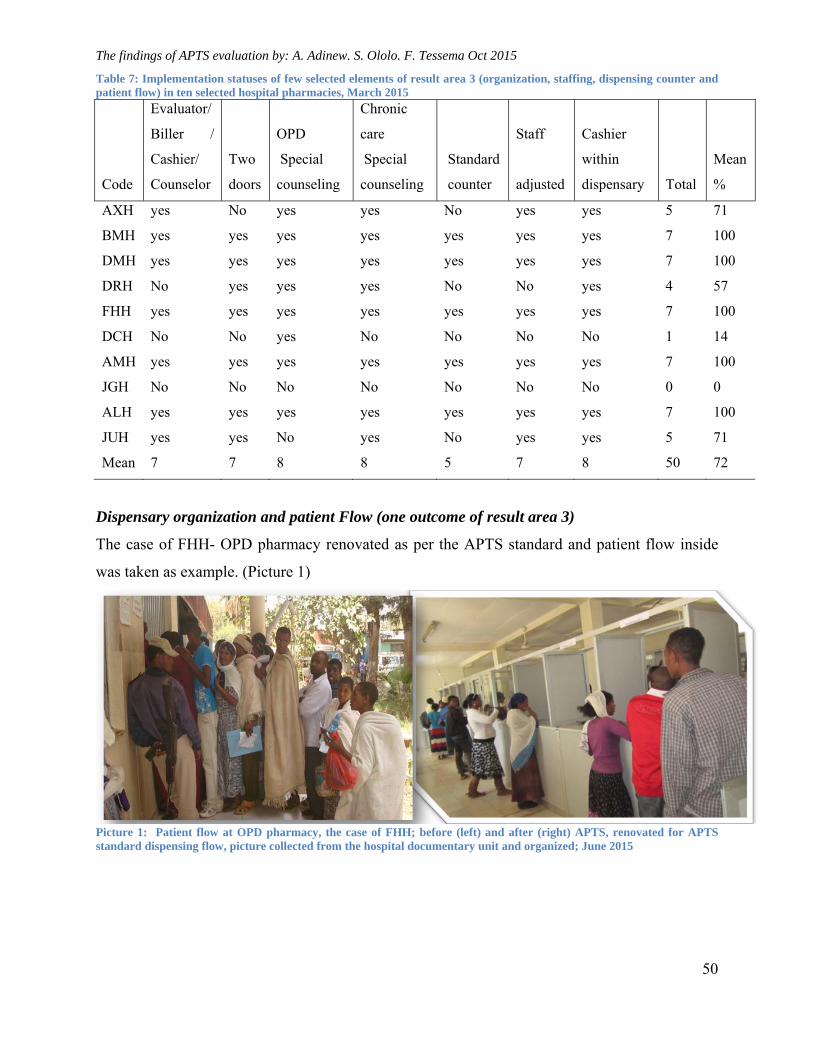
The findings of APTS evaluation by: A. Adinew. S. Ololo. F. Tessema Oct 2015
50
Table 7: Implementation statuses of few selected elements of result area 3 (organization, staffing, dispensing counter and patient flow) in ten selected hospital pharmacies, March 2015
Code
Evaluator/
Biller /
Cashier/
Counselor
Two
doors
OPD
Special
counseling
Chronic
care
Special
counseling
Standard
counter
Staff
adjusted
Cashier
within
dispensary Total
Mean
%
AXH yes No yes yes No yes yes 5 71
BMH yes yes yes yes yes yes yes 7 100
DMH yes yes yes yes yes yes yes 7 100
DRH No yes yes yes No No yes 4 57
FHH yes yes yes yes yes yes yes 7 100
DCH No No yes No No No No 1 14
AMH yes yes yes yes yes yes yes 7 100
JGH No No No No No No No 0 0
ALH yes yes yes yes yes yes yes 7 100
JUH yes yes No yes No yes yes 5 71
Mean 7 7 8 8 5 7 8 50 72
Dispensary organization and patient Flow (one outcome of result area 3)
The case of FHH- OPD pharmacy renovated as per the APTS standard and patient flow inside
was taken as example. (Picture 1)
Picture 1: Patient flow at OPD pharmacy, the case of FHH; before (left) and after (right) APTS, renovated for APTS standard dispensing flow, picture collected from the hospital documentary unit and organized; June 2015
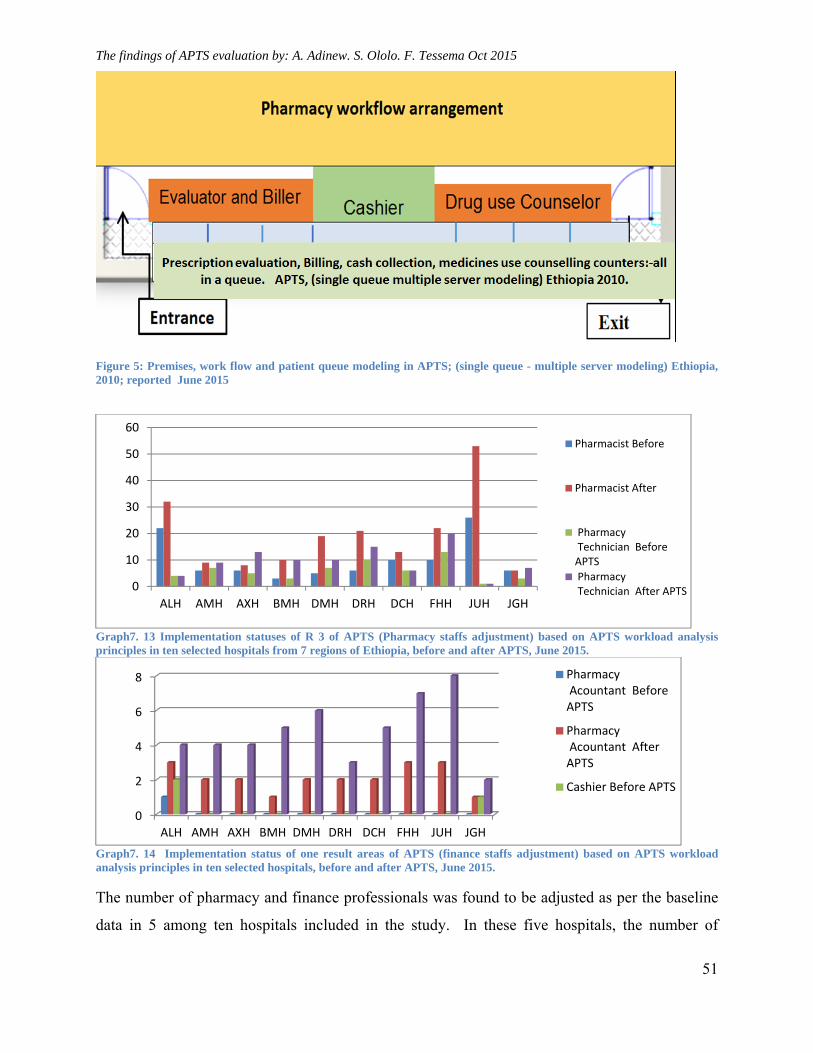
The findings of APTS evaluation by: A. Adinew. S. Ololo. F. Tessema Oct 2015
51
Figure 5: Premises, work flow and patient queue modeling in APTS; (single queue - multiple server modeling) Ethiopia, 2010; reported June 2015
Graph7. 13 Implementation statuses of R 3 of APTS (Pharmacy staffs adjustment) based on APTS workload analysis principles in ten selected hospitals from 7 regions of Ethiopia, before and after APTS, June 2015.
Graph7. 14 Implementation status of one result areas of APTS (finance staffs adjustment) based on APTS workload analysis principles in ten selected hospitals, before and after APTS, June 2015.
The number of pharmacy and finance professionals was found to be adjusted as per the baseline
data in 5 among ten hospitals included in the study. In these five hospitals, the number of
0
10
20
30
40
50
60
ALH AMH AXH BMH DMH DRH DCH FHH JUH JGH
Pharmacist Before
Pharmacist After
Pharmacy Technician BeforeAPTS
Pharmacy Technician After APTS
0
2
4
6
8
ALH AMH AXH BMH DMH DRH DCH FHH JUH JGH
Pharmacy Acountant BeforeAPTS
Pharmacy Acountant AfterAPTS
Cashier Before APTS
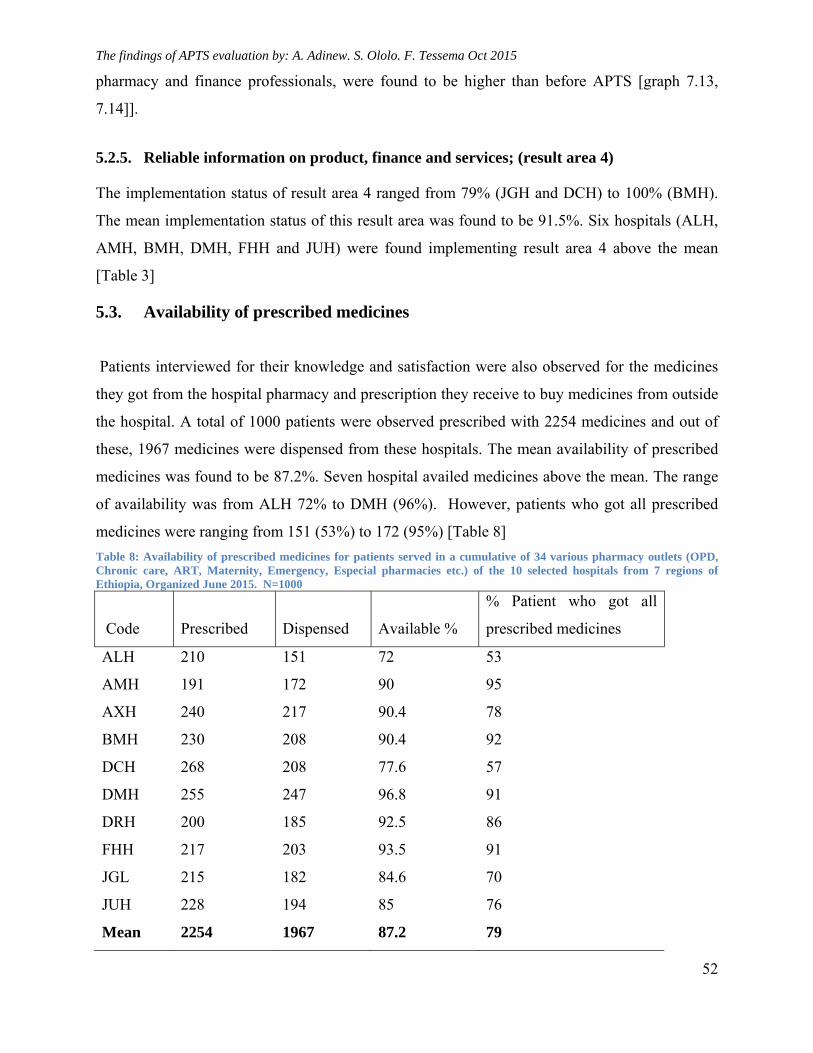
The findings of APTS evaluation by: A. Adinew. S. Ololo. F. Tessema Oct 2015
52
pharmacy and finance professionals, were found to be higher than before APTS [graph 7.13,
7.14]].
5.2.5. Reliable information on product, finance and services; (result area 4)
The implementation status of result area 4 ranged from 79% (JGH and DCH) to 100% (BMH).
The mean implementation status of this result area was found to be 91.5%. Six hospitals (ALH,
AMH, BMH, DMH, FHH and JUH) were found implementing result area 4 above the mean
[Table 3]
5.3. Availability of prescribed medicines
Patients interviewed for their knowledge and satisfaction were also observed for the medicines
they got from the hospital pharmacy and prescription they receive to buy medicines from outside
the hospital. A total of 1000 patients were observed prescribed with 2254 medicines and out of
these, 1967 medicines were dispensed from these hospitals. The mean availability of prescribed
medicines was found to be 87.2%. Seven hospital availed medicines above the mean. The range
of availability was from ALH 72% to DMH (96%). However, patients who got all prescribed
medicines were ranging from 151 (53%) to 172 (95%) [Table 8]
Table 8: Availability of prescribed medicines for patients served in a cumulative of 34 various pharmacy outlets (OPD, Chronic care, ART, Maternity, Emergency, Especial pharmacies etc.) of the 10 selected hospitals from 7 regions of Ethiopia, Organized June 2015. N=1000
Code Prescribed Dispensed Available %
% Patient who got all
prescribed medicines
ALH 210 151 72 53
AMH 191 172 90 95
AXH 240 217 90.4 78
BMH 230 208 90.4 92
DCH 268 208 77.6 57
DMH 255 247 96.8 91
DRH 200 185 92.5 86
FHH 217 203 93.5 91
JGL 215 182 84.6 70
JUH 228 194 85 76
Mean 2254 1967 87.2 79
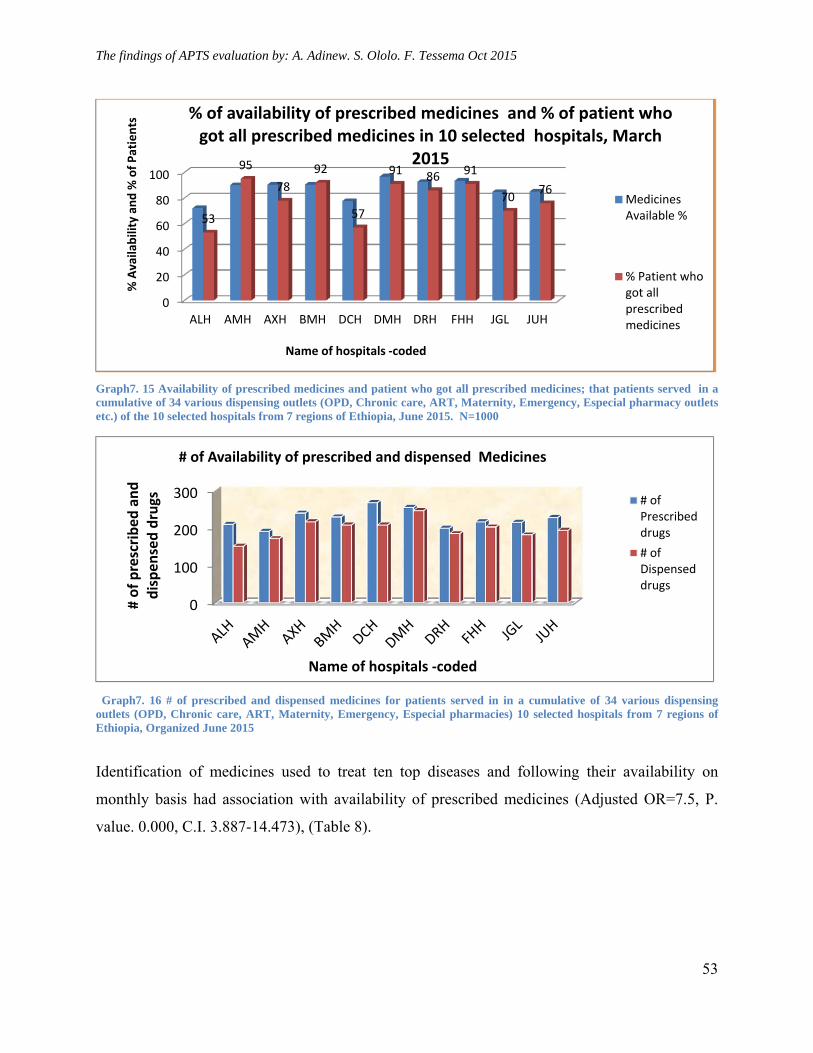
The findings of APTS evaluation by: A. Adinew. S. Ololo. F. Tessema Oct 2015
53
Graph7. 15 Availability of prescribed medicines and patient who got all prescribed medicines; that patients served in a cumulative of 34 various dispensing outlets (OPD, Chronic care, ART, Maternity, Emergency, Especial pharmacy outlets etc.) of the 10 selected hospitals from 7 regions of Ethiopia, June 2015. N=1000
Graph7. 16 # of prescribed and dispensed medicines for patients served in in a cumulative of 34 various dispensing outlets (OPD, Chronic care, ART, Maternity, Emergency, Especial pharmacies) 10 selected hospitals from 7 regions of Ethiopia, Organized June 2015
Identification of medicines used to treat ten top diseases and following their availability on
monthly basis had association with availability of prescribed medicines (Adjusted OR=7.5, P.
value. 0.000, C.I. 3.887-14.473), (Table 8).
0
20
40
60
80
100
ALH AMH AXH BMH DCH DMH DRH FHH JGL JUH
53
95
78
92
57
91 86 91
7076
% Availability and % of Patients
Name of hospitals ‐coded
% of availability of prescribed medicines and % of patient who got all prescribed medicines in 10 selected hospitals, March
2015
MedicinesAvailable %
% Patient whogot allprescribedmedicines
0
100
200
300
# of prescribed and
dispensed drugs
Name of hospitals ‐coded
# of Availability of prescribed and dispensed Medicines
# ofPrescribeddrugs
# ofDispenseddrugs
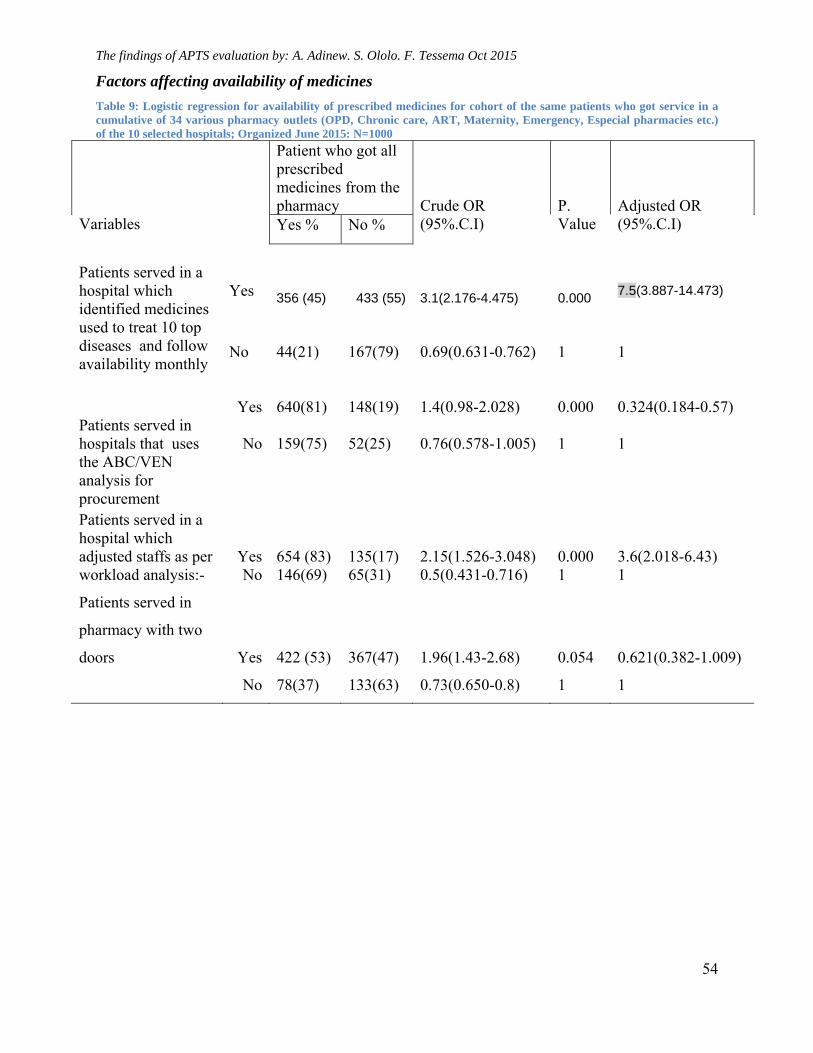
The findings of APTS evaluation by: A. Adinew. S. Ololo. F. Tessema Oct 2015
54
Factors affecting availability of medicines
Table 9: Logistic regression for availability of prescribed medicines for cohort of the same patients who got service in a cumulative of 34 various pharmacy outlets (OPD, Chronic care, ART, Maternity, Emergency, Especial pharmacies etc.) of the 10 selected hospitals; Organized June 2015: N=1000
Variables
Patient who got all prescribed medicines from the pharmacy
Crude OR (95%.C.I)
P. Value
Adjusted OR (95%.C.I) Yes % No %
Patients served in a hospital which identified medicines used to treat 10 top diseases and follow availability monthly
Yes
356 (45)
433 (55)
3.1(2.176-4.475)
0.000
7.5(3.887-14.473)
No
44(21)
167(79)
0.69(0.631-0.762)
1
1
Patients served in hospitals that uses the ABC/VEN analysis for procurement
Yes
640(81)
148(19)
1.4(0.98-2.028)
0.000
0.324(0.184-0.57)
No
159(75)
52(25)
0.76(0.578-1.005)
1
1
Patients served in a hospital which adjusted staffs as per workload analysis:-
Yes
654 (83)
135(17)
2.15(1.526-3.048)
0.000
3.6(2.018-6.43)
No 146(69) 65(31) 0.5(0.431-0.716) 1 1
Patients served in
pharmacy with two
doors
Yes
422 (53)
367(47)
1.96(1.43-2.68)
0.054
0.621(0.382-1.009)
No 78(37) 133(63) 0.73(0.650-0.8) 1 1
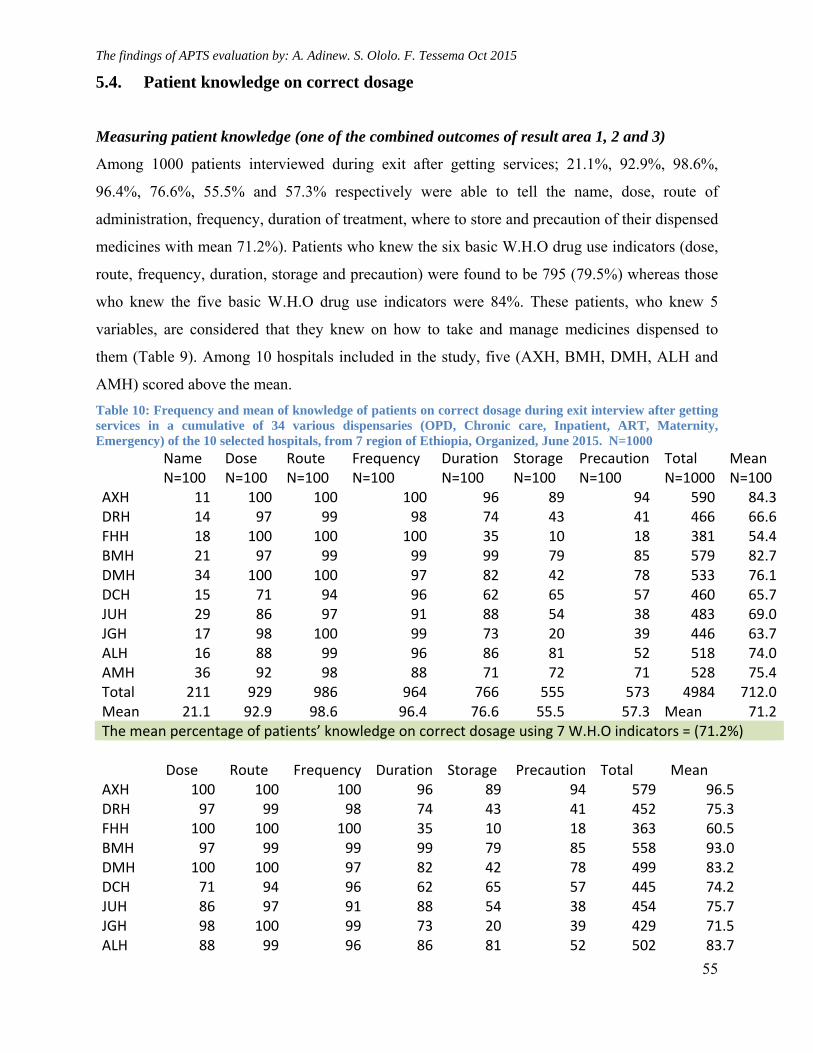
The findings of APTS evaluation by: A. Adinew. S. Ololo. F. Tessema Oct 2015
55
5.4. Patient knowledge on correct dosage
Measuring patient knowledge (one of the combined outcomes of result area 1, 2 and 3)
Among 1000 patients interviewed during exit after getting services; 21.1%, 92.9%, 98.6%,
96.4%, 76.6%, 55.5% and 57.3% respectively were able to tell the name, dose, route of
administration, frequency, duration of treatment, where to store and precaution of their dispensed
medicines with mean 71.2%). Patients who knew the six basic W.H.O drug use indicators (dose,
route, frequency, duration, storage and precaution) were found to be 795 (79.5%) whereas those
who knew the five basic W.H.O drug use indicators were 84%. These patients, who knew 5
variables, are considered that they knew on how to take and manage medicines dispensed to
them (Table 9). Among 10 hospitals included in the study, five (AXH, BMH, DMH, ALH and
AMH) scored above the mean.
Table 10: Frequency and mean of knowledge of patients on correct dosage during exit interview after getting services in a cumulative of 34 various dispensaries (OPD, Chronic care, Inpatient, ART, Maternity, Emergency) of the 10 selected hospitals, from 7 region of Ethiopia, Organized, June 2015. N=1000
Name N=100
Dose N=100
Route N=100
Frequency N=100
Duration N=100
Storage N=100
Precaution N=100
Total N=1000
Mean N=100
AXH 11 100 100 100 96 89 94 590 84.3DRH 14 97 99 98 74 43 41 466 66.6FHH 18 100 100 100 35 10 18 381 54.4BMH 21 97 99 99 99 79 85 579 82.7DMH 34 100 100 97 82 42 78 533 76.1DCH 15 71 94 96 62 65 57 460 65.7JUH 29 86 97 91 88 54 38 483 69.0JGH 17 98 100 99 73 20 39 446 63.7ALH 16 88 99 96 86 81 52 518 74.0AMH 36 92 98 88 71 72 71 528 75.4Total 211 929 986 964 766 555 573 4984 712.0Mean 21.1 92.9 98.6 96.4 76.6 55.5 57.3 Mean 71.2The mean percentage of patients’ knowledge on correct dosage using 7 W.H.O indicators = (71.2%)
Dose Route Frequency Duration Storage Precaution Total Mean AXH 100 100 100 96 89 94 579 96.5DRH 97 99 98 74 43 41 452 75.3FHH 100 100 100 35 10 18 363 60.5BMH 97 99 99 99 79 85 558 93.0DMH 100 100 97 82 42 78 499 83.2DCH 71 94 96 62 65 57 445 74.2JUH 86 97 91 88 54 38 454 75.7JGH 98 100 99 73 20 39 429 71.5ALH 88 99 96 86 81 52 502 83.7
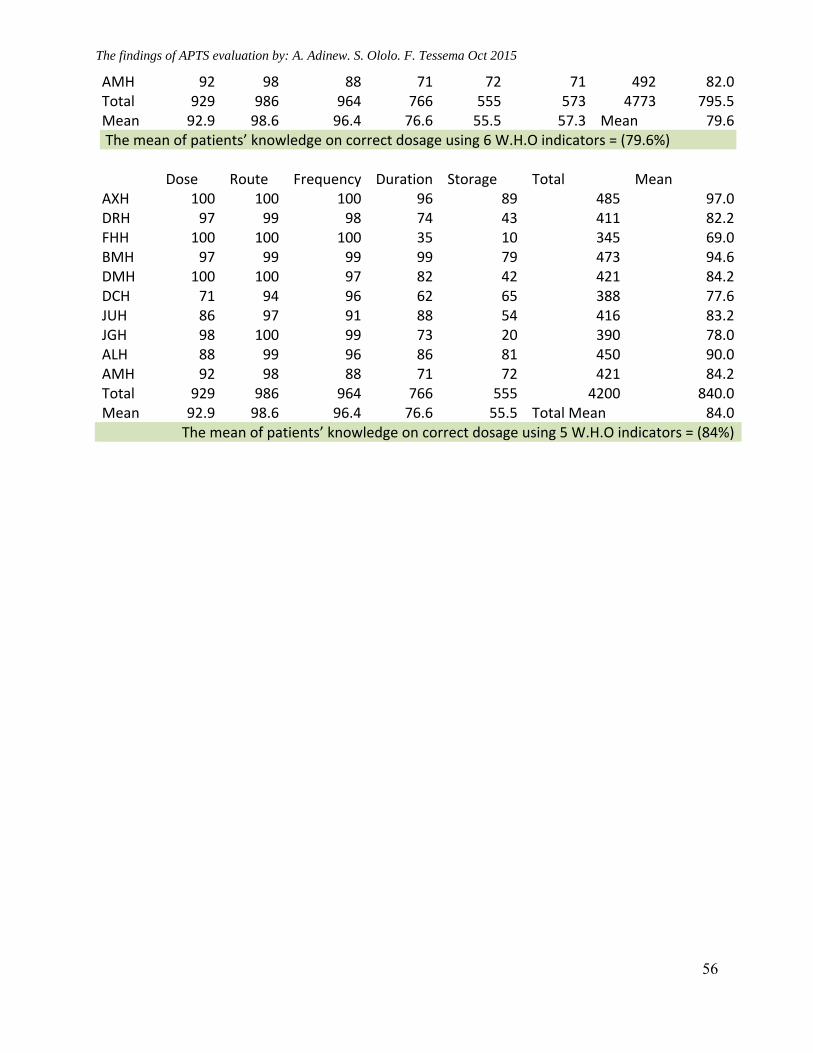
The findings of APTS evaluation by: A. Adinew. S. Ololo. F. Tessema Oct 2015
56
AMH 92 98 88 71 72 71 492 82.0Total 929 986 964 766 555 573 4773 795.5Mean 92.9 98.6 96.4 76.6 55.5 57.3 Mean 79.6 The mean of patients’ knowledge on correct dosage using 6 W.H.O indicators = (79.6%) Dose Route Frequency Duration Storage Total Mean AXH 100 100 100 96 89 485 97.0DRH 97 99 98 74 43 411 82.2FHH 100 100 100 35 10 345 69.0BMH 97 99 99 99 79 473 94.6DMH 100 100 97 82 42 421 84.2DCH 71 94 96 62 65 388 77.6JUH 86 97 91 88 54 416 83.2JGH 98 100 99 73 20 390 78.0ALH 88 99 96 86 81 450 90.0AMH 92 98 88 71 72 421 84.2Total 929 986 964 766 555 4200 840.0Mean 92.9 98.6 96.4 76.6 55.5 Total Mean 84.0
The mean of patients’ knowledge on correct dosage using 5 W.H.O indicators = (84%)
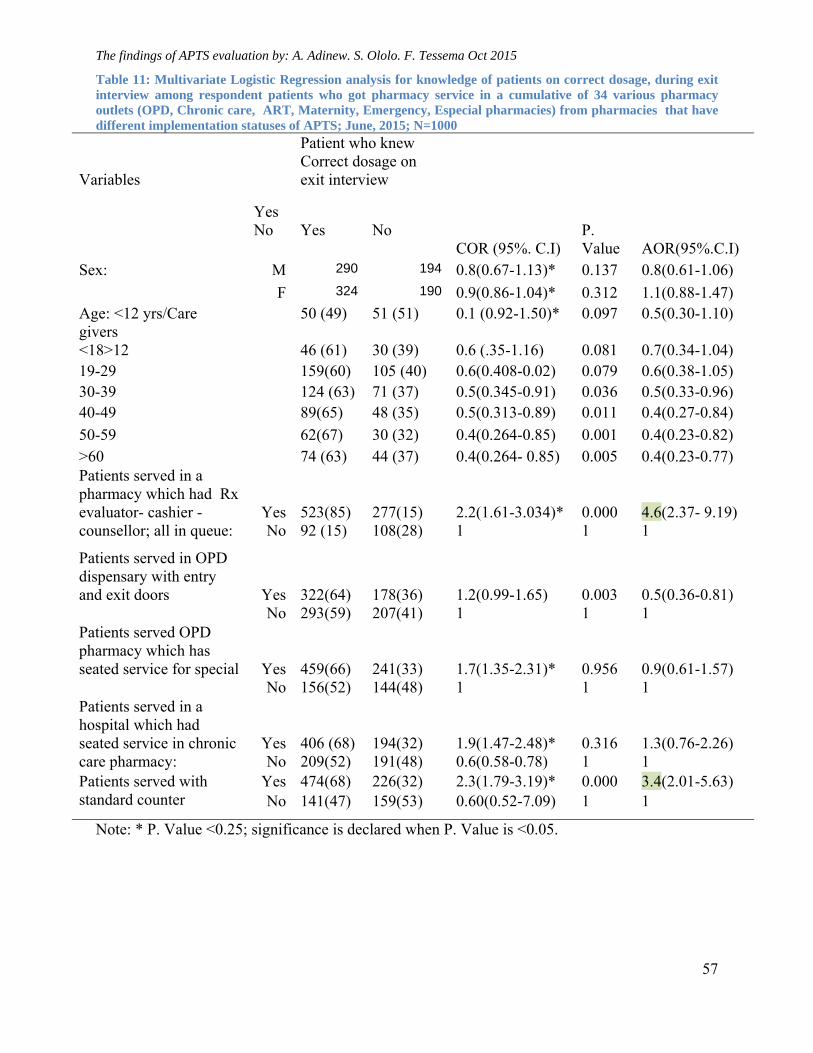
The findings of APTS evaluation by: A. Adinew. S. Ololo. F. Tessema Oct 2015
57
Table 11: Multivariate Logistic Regression analysis for knowledge of patients on correct dosage, during exit interview among respondent patients who got pharmacy service in a cumulative of 34 various pharmacy outlets (OPD, Chronic care, ART, Maternity, Emergency, Especial pharmacies) from pharmacies that have different implementation statuses of APTS; June, 2015; N=1000
Variables
Yes
Patient who knew Correct dosage on exit interview
No Yes No COR (95%. C.I)
P. Value
AOR(95%.C.I)
Sex:
M 290 194 0.8(0.67-1.13)* 0.137 0.8(0.61-1.06)
F 324 190 0.9(0.86-1.04)* 0.312 1.1(0.88-1.47) Age: <12 yrs/Care givers
50 (49) 51 (51) 0.1 (0.92-1.50)* 0.097 0.5(0.30-1.10)
<18>12 46 (61) 30 (39) 0.6 (.35-1.16) 0.081 0.7(0.34-1.04) 19-29 159(60) 105 (40) 0.6(0.408-0.02) 0.079 0.6(0.38-1.05) 30-39 124 (63) 71 (37) 0.5(0.345-0.91) 0.036 0.5(0.33-0.96) 40-49 89(65) 48 (35) 0.5(0.313-0.89) 0.011 0.4(0.27-0.84)
50-59 62(67) 30 (32) 0.4(0.264-0.85) 0.001 0.4(0.23-0.82) >60 74 (63) 44 (37) 0.4(0.264- 0.85) 0.005 0.4(0.23-0.77) Patients served in a pharmacy which had Rx evaluator- cashier - counsellor; all in queue:
Yes No
523(85) 92 (15)
277(15) 108(28)
2.2(1.61-3.034)* 1
0.000 1
4.6(2.37- 9.19) 1
Patients served in OPD dispensary with entry and exit doors
Yes
322(64)
178(36)
1.2(0.99-1.65)
0.003
0.5(0.36-0.81)
No 293(59) 207(41) 1 1 1 Patients served OPD pharmacy which has seated service for special
Yes
459(66)
241(33)
1.7(1.35-2.31)*
0.956
0.9(0.61-1.57)
No 156(52) 144(48) 1 1 1 Patients served in a hospital which had seated service in chronic care pharmacy:
Yes No
406 (68) 209(52)
194(32) 191(48)
1.9(1.47-2.48)* 0.6(0.58-0.78)
0.316 1
1.3(0.76-2.26) 1
Patients served with standard counter
Yes 474(68) 226(32) 2.3(1.79-3.19)* 0.000 3.4(2.01-5.63) No 141(47) 159(53) 0.60(0.52-7.09) 1 1
Note: * P. Value <0.25; significance is declared when P. Value is <0.05.
The findings of APTS evaluation by: A. Adinew. S. Ololo. F. Tessema Oct 2015
58
5.5. Patient satisfaction on pharmacy services
Measuring patient satisfaction (another combined outcome of result area 1, 2 and 3)
The same 1000 patients, (who were interviewed during exit about their knowledge on dispensed
medicines); were also interviewed about their satisfaction. They reported their satisfaction with
waiting /dispensing area and counter with mean (79.9%), privacy (72.8%), dispensing process
(83%), personnel service (87.2%), and with overall pharmacy services (86.8%). (Table 11)
The LIKERT result showed that patients who are strongly satisfied 2036 (40.7%), satisfied 2070
(41.4%), neutral 552(11.04%), dissatisfied 204 (4.08%) and strongly dissatisfied were
136(2.86%) (Table 11)
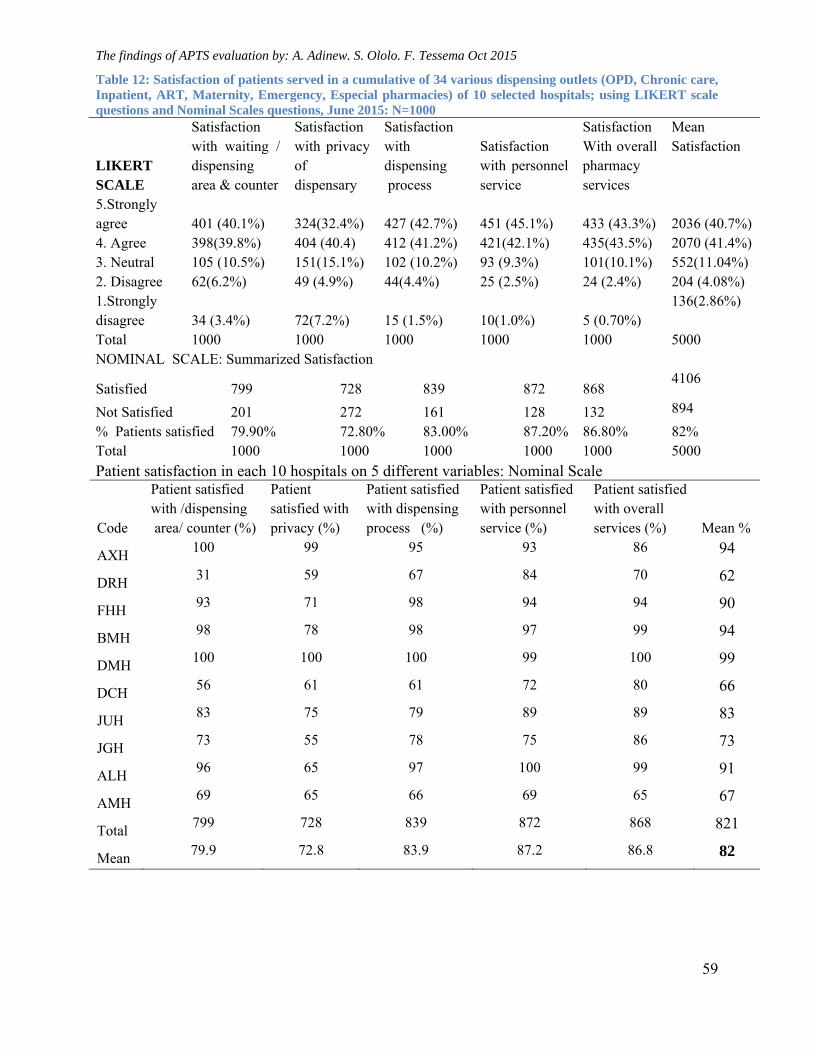
The findings of APTS evaluation by: A. Adinew. S. Ololo. F. Tessema Oct 2015
59
Table 12: Satisfaction of patients served in a cumulative of 34 various dispensing outlets (OPD, Chronic care, Inpatient, ART, Maternity, Emergency, Especial pharmacies) of 10 selected hospitals; using LIKERT scale questions and Nominal Scales questions, June 2015: N=1000
LIKERT SCALE
Satisfaction with waiting / dispensing area & counter
Satisfaction with privacy of dispensary
Satisfaction with dispensing process
Satisfaction with personnel service
Satisfaction With overall pharmacy services
Mean Satisfaction
5.Strongly agree 401 (40.1%) 324(32.4%) 427 (42.7%) 451 (45.1%) 433 (43.3%)
2036 (40.7%)
4. Agree 398(39.8%) 404 (40.4) 412 (41.2%) 421(42.1%) 435(43.5%) 2070 (41.4%) 3. Neutral 105 (10.5%) 151(15.1%) 102 (10.2%) 93 (9.3%) 101(10.1%) 552(11.04%) 2. Disagree 62(6.2%) 49 (4.9%) 44(4.4%) 25 (2.5%) 24 (2.4%) 204 (4.08%) 1.Strongly disagree 34 (3.4%) 72(7.2%) 15 (1.5%) 10(1.0%) 5 (0.70%)
136(2.86%)
Total 1000 1000 1000 1000 1000 5000 NOMINAL SCALE: Summarized Satisfaction
Satisfied 799 728 839 872 868 4106
Not Satisfied 201 272 161 128 132 894
% Patients satisfied 79.90% 72.80% 83.00% 87.20% 86.80% 82% Total 1000 1000 1000 1000 1000 5000
Patient satisfaction in each 10 hospitals on 5 different variables: Nominal Scale
Code
Patient satisfied with /dispensing area/ counter (%)
Patient satisfied with privacy (%)
Patient satisfied with dispensing process (%)
Patient satisfied with personnel service (%)
Patient satisfied with overall services (%) Mean %
AXH 100 99 95 93 86 94
DRH 31 59 67 84 70 62
FHH 93 71 98 94 94 90
BMH 98 78 98 97 99 94
DMH 100 100 100 99 100 99
DCH 56 61 61 72 80 66
JUH 83 75 79 89 89 83
JGH 73 55 78 75 86 73
ALH 96 65 97 100 99 91
AMH 69 65 66 69 65 67
Total 799 728 839 872 868 821
Mean 79.9 72.8 83.9 87.2 86.8 82
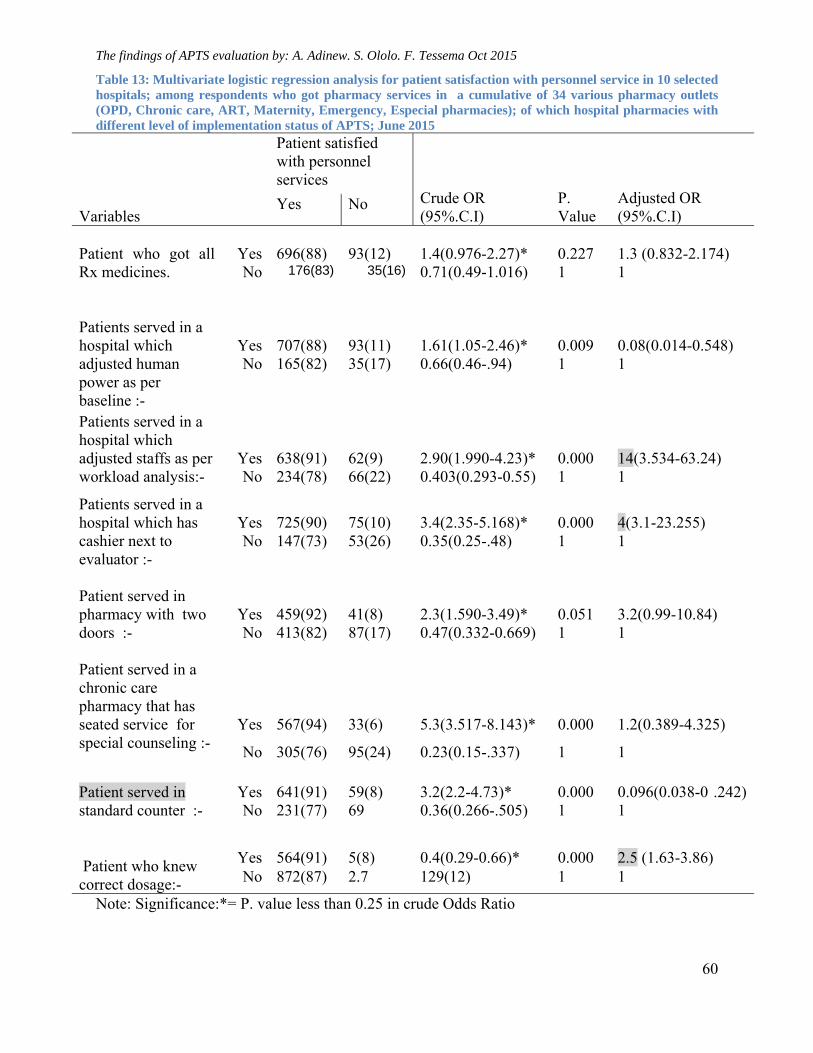
The findings of APTS evaluation by: A. Adinew. S. Ololo. F. Tessema Oct 2015
60
Table 13: Multivariate logistic regression analysis for patient satisfaction with personnel service in 10 selected hospitals; among respondents who got pharmacy services in a cumulative of 34 various pharmacy outlets (OPD, Chronic care, ART, Maternity, Emergency, Especial pharmacies); of which hospital pharmacies with different level of implementation status of APTS; June 2015
Variables
Patient satisfied with personnel services
Crude OR (95%.C.I)
P. Value
Adjusted OR (95%.C.I)
Yes No
Patient who got all Rx medicines.
Yes
696(88)
93(12)
1.4(0.976-2.27)*
0.227
1.3 (0.832-2.174)
No 176(83) 35(16) 0.71(0.49-1.016) 1 1 Patients served in a hospital which adjusted human power as per baseline :-
Yes
707(88)
93(11)
1.61(1.05-2.46)*
0.009
0.08(0.014-0.548)
No 165(82) 35(17) 0.66(0.46-.94) 1 1
Patients served in a hospital which adjusted staffs as per workload analysis:-
Yes
638(91)
62(9)
2.90(1.990-4.23)*
0.000
14(3.534-63.24)
No 234(78) 66(22) 0.403(0.293-0.55) 1 1
Patients served in a hospital which has cashier next to evaluator :-
Yes
725(90)
75(10)
3.4(2.35-5.168)*
0.000
4(3.1-23.255)
No 147(73) 53(26) 0.35(0.25-.48) 1 1
Patient served in pharmacy with two doors :-
Yes
459(92)
41(8)
2.3(1.590-3.49)*
0.051
3.2(0.99-10.84)
No 413(82) 87(17) 0.47(0.332-0.669) 1 1 Patient served in a chronic care pharmacy that has seated service for special counseling :-
Yes
567(94)
33(6)
5.3(3.517-8.143)*
0.000
1.2(0.389-4.325)
No 305(76) 95(24) 0.23(0.15-.337) 1 1 Patient served in standard counter :-
Yes
641(91)
59(8)
3.2(2.2-4.73)*
0.000
0.096(0.038-0 .242)
No 231(77) 69 0.36(0.266-.505) 1 1 Patient who knew correct dosage:-
Yes 564(91) 5(8) 0.4(0.29-0.66)* 0.000 2.5 (1.63-3.86) No 872(87) 2.7 129(12) 1 1
Note: Significance:*= P. value less than 0.25 in crude Odds Ratio
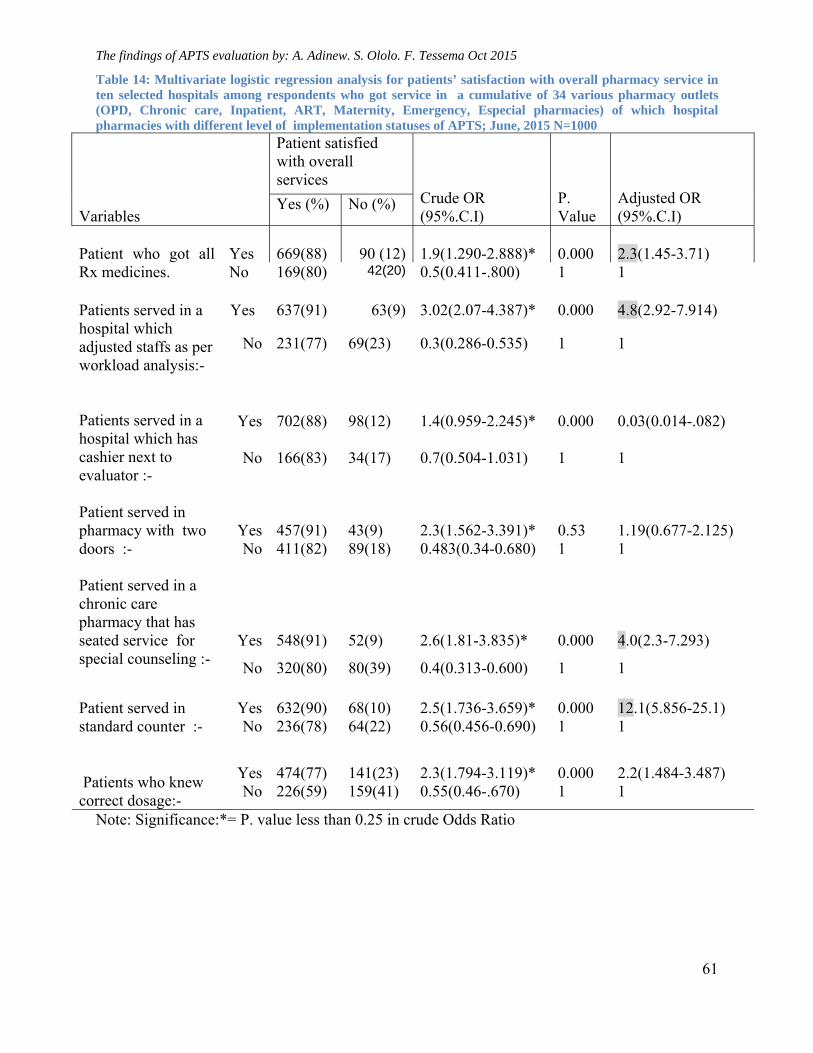
The findings of APTS evaluation by: A. Adinew. S. Ololo. F. Tessema Oct 2015
61
Table 14: Multivariate logistic regression analysis for patients’ satisfaction with overall pharmacy service in ten selected hospitals among respondents who got service in a cumulative of 34 various pharmacy outlets (OPD, Chronic care, Inpatient, ART, Maternity, Emergency, Especial pharmacies) of which hospital pharmacies with different level of implementation statuses of APTS; June, 2015 N=1000
Variables
Patient satisfied with overall services
Crude OR (95%.C.I)
P. Value
Adjusted OR (95%.C.I)
Yes (%) No (%)
Patient who got all Rx medicines.
Yes
669(88) 90 (12)
1.9(1.290-2.888)*
0.000
2.3(1.45-3.71)
No 169(80) 42(20) 0.5(0.411-.800) 1 1 Patients served in a hospital which adjusted staffs as per workload analysis:-
Yes
637(91) 63(9)
3.02(2.07-4.387)*
0.000
4.8(2.92-7.914)
No 231(77) 69(23) 0.3(0.286-0.535) 1 1
Patients served in a hospital which has cashier next to evaluator :-
Yes 702(88) 98(12) 1.4(0.959-2.245)* 0.000 0.03(0.014-.082)
No 166(83) 34(17) 0.7(0.504-1.031) 1 1
Patient served in pharmacy with two doors :-
Yes
457(91)
43(9)
2.3(1.562-3.391)*
0.53
1.19(0.677-2.125)
No 411(82) 89(18) 0.483(0.34-0.680) 1 1 Patient served in a chronic care pharmacy that has seated service for special counseling :-
Yes
548(91)
52(9)
2.6(1.81-3.835)*
0.000
4.0(2.3-7.293)
No 320(80) 80(39) 0.4(0.313-0.600) 1 1 Patient served in standard counter :-
Yes
632(90)
68(10)
2.5(1.736-3.659)*
0.000
12.1(5.856-25.1)
No 236(78) 64(22) 0.56(0.456-0.690) 1 1 Patients who knew correct dosage:-
Yes 474(77) 141(23) 2.3(1.794-3.119)* 0.000 2.2(1.484-3.487) No 226(59) 159(41) 0.55(0.46-.670) 1 1
Note: Significance:*= P. value less than 0.25 in crude Odds Ratio
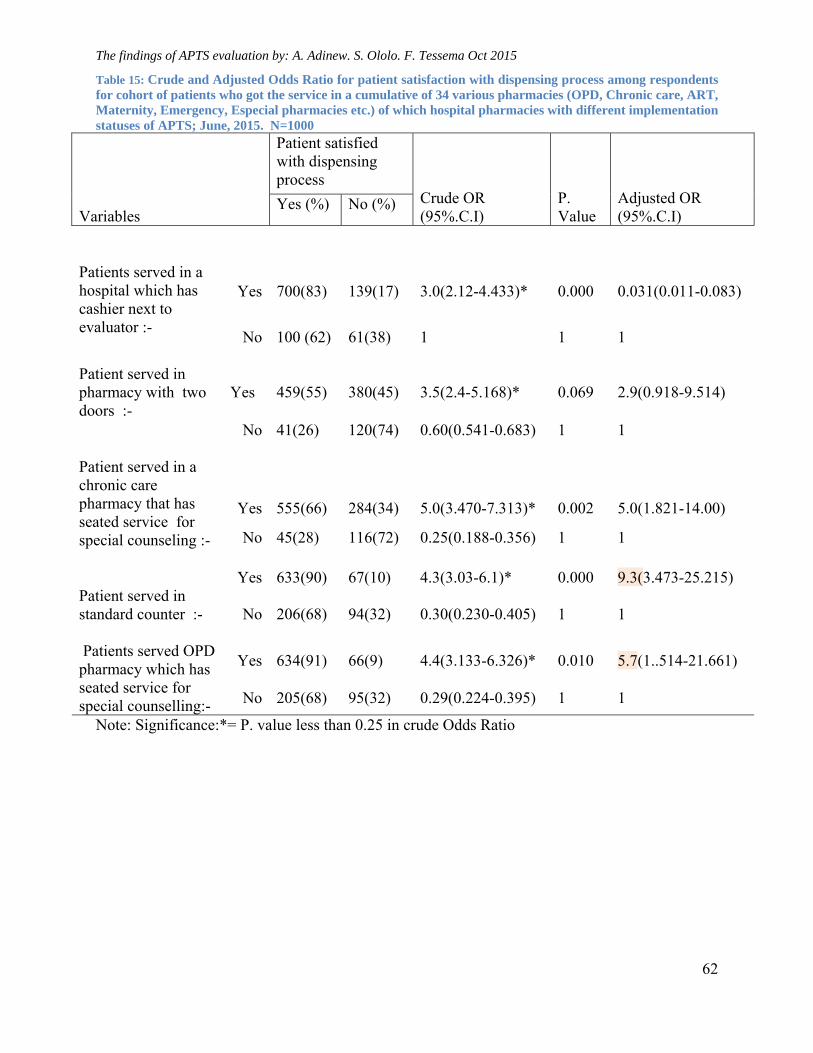
The findings of APTS evaluation by: A. Adinew. S. Ololo. F. Tessema Oct 2015
62
Table 15: Crude and Adjusted Odds Ratio for patient satisfaction with dispensing process among respondents for cohort of patients who got the service in a cumulative of 34 various pharmacies (OPD, Chronic care, ART, Maternity, Emergency, Especial pharmacies etc.) of which hospital pharmacies with different implementation statuses of APTS; June, 2015. N=1000
Variables
Patient satisfied with dispensing process
Crude OR (95%.C.I)
P. Value
Adjusted OR (95%.C.I)
Yes (%) No (%)
Patients served in a hospital which has cashier next to evaluator :-
Yes
700(83)
139(17)
3.0(2.12-4.433)*
0.000
0.031(0.011-0.083)
No
100 (62)
61(38)
1
1
1
Patient served in pharmacy with two doors :-
Yes
459(55)
380(45)
3.5(2.4-5.168)*
0.069
2.9(0.918-9.514)
No
41(26)
120(74)
0.60(0.541-0.683)
1
1
Patient served in a chronic care pharmacy that has seated service for special counseling :-
Yes 555(66) 284(34) 5.0(3.470-7.313)* 0.002 5.0(1.821-14.00)
No 45(28) 116(72) 0.25(0.188-0.356) 1 1 Patient served in standard counter :-
Yes
633(90)
67(10)
4.3(3.03-6.1)*
0.000
9.3(3.473-25.215)
No
206(68)
94(32)
0.30(0.230-0.405)
1
1
Patients served OPD pharmacy which has seated service for special counselling:-
Yes 634(91) 66(9) 4.4(3.133-6.326)* 0.010 5.7(1..514-21.661)
No 205(68)
95(32)
0.29(0.224-0.395)
1
1
Note: Significance:*= P. value less than 0.25 in crude Odds Ratio
The findings of APTS evaluation by: A. Adinew. S. Ololo. F. Tessema Oct 2015
63
Chapter 6: Discussion
5.5. Socio demographic characteristics
In the study conducted on factors influencing pharmacist performance, in Great Britain and
in Kenya, showed that; “ pharmacist’s performance was found to be affected by
characteristics such as age, gender, ethnicity, low employee’s capacity and place of
primary qualification [29, 30]. Expecting similar findings, socio demographic characteristics
were seen for association. However, there was no significant association found between
implementation status of APTS result areas with assigned personnel’s demographic
characteristics (educational status, type of university graduated from (private/government),
work experience, sex and age. Staffs were found working their own assigned result areas of
APTS equivalent to each other. The main factor that hidden the difference might be due to
the fact that staffs were found being assigned based on graduation profiles. In majority of the
hospitals, stores were found being managed by pharmacy technician of diploma graduate,
cash collection were managed by cashiers of certificates graduates, accounting parts were
found being managed by finance professionals of degree graduates whereas almost all
pharmacists were working in the front line with patients . This type of job assignment might
make staffs to work their own duty effectively.
5.6. Rate of Expiry
The cumulative rate of medicines expiry in a total of 153 months were found reducing that it was
decreasing from 3.2% to 2.3% during APTS implementation periods [Table 5]. The cumulative
rate of expiry from the start of APTS launch up to Sept 30/2015 of all study hospitals (3.2%)
were compared with the cumulate rate of expiry after 4 months from the APTS launch up to Sept
30/2015 (2.3%)[Table 5]. Such analysis was also made by taking a single hospital as a case
study [Table 4]. The cumulative rate of expiry for the total of 23 months of this hospital was
3.5%; whereas, when the first four months of APTS implementation were reduced from the data,
the rate was found to be 2.4% and when only the last 6 months were taken, the rate was found to
be reduced to 2% and then the last quarter came down below 2%. This shows that APTS
implementing hospitals were found to reduce rate of expiry of medicines from the start of APTS
implementation onwards.
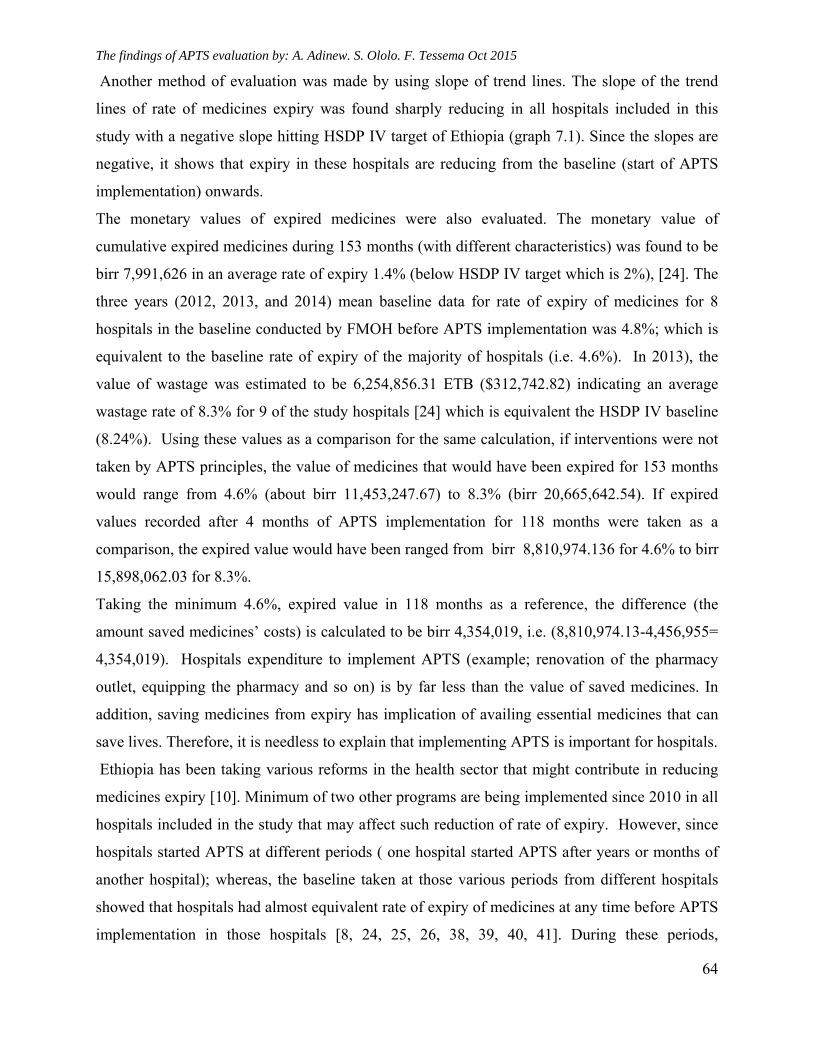
The findings of APTS evaluation by: A. Adinew. S. Ololo. F. Tessema Oct 2015
64
Another method of evaluation was made by using slope of trend lines. The slope of the trend
lines of rate of medicines expiry was found sharply reducing in all hospitals included in this
study with a negative slope hitting HSDP IV target of Ethiopia (graph 7.1). Since the slopes are
negative, it shows that expiry in these hospitals are reducing from the baseline (start of APTS
implementation) onwards.
The monetary values of expired medicines were also evaluated. The monetary value of
cumulative expired medicines during 153 months (with different characteristics) was found to be
birr 7,991,626 in an average rate of expiry 1.4% (below HSDP IV target which is 2%), [24]. The
three years (2012, 2013, and 2014) mean baseline data for rate of expiry of medicines for 8
hospitals in the baseline conducted by FMOH before APTS implementation was 4.8%; which is
equivalent to the baseline rate of expiry of the majority of hospitals (i.e. 4.6%). In 2013), the
value of wastage was estimated to be 6,254,856.31 ETB ($312,742.82) indicating an average
wastage rate of 8.3% for 9 of the study hospitals [24] which is equivalent the HSDP IV baseline
(8.24%). Using these values as a comparison for the same calculation, if interventions were not
taken by APTS principles, the value of medicines that would have been expired for 153 months
would range from 4.6% (about birr 11,453,247.67) to 8.3% (birr 20,665,642.54). If expired
values recorded after 4 months of APTS implementation for 118 months were taken as a
comparison, the expired value would have been ranged from birr 8,810,974.136 for 4.6% to birr
15,898,062.03 for 8.3%.
Taking the minimum 4.6%, expired value in 118 months as a reference, the difference (the
amount saved medicines’ costs) is calculated to be birr 4,354,019, i.e. (8,810,974.13-4,456,955=
4,354,019). Hospitals expenditure to implement APTS (example; renovation of the pharmacy
outlet, equipping the pharmacy and so on) is by far less than the value of saved medicines. In
addition, saving medicines from expiry has implication of availing essential medicines that can
save lives. Therefore, it is needless to explain that implementing APTS is important for hospitals.
Ethiopia has been taking various reforms in the health sector that might contribute in reducing
medicines expiry [10]. Minimum of two other programs are being implemented since 2010 in all
hospitals included in the study that may affect such reduction of rate of expiry. However, since
hospitals started APTS at different periods ( one hospital started APTS after years or months of
another hospital); whereas, the baseline taken at those various periods from different hospitals
showed that hospitals had almost equivalent rate of expiry of medicines at any time before APTS
implementation in those hospitals [8, 24, 25, 26, 38, 39, 40, 41]. During these periods,
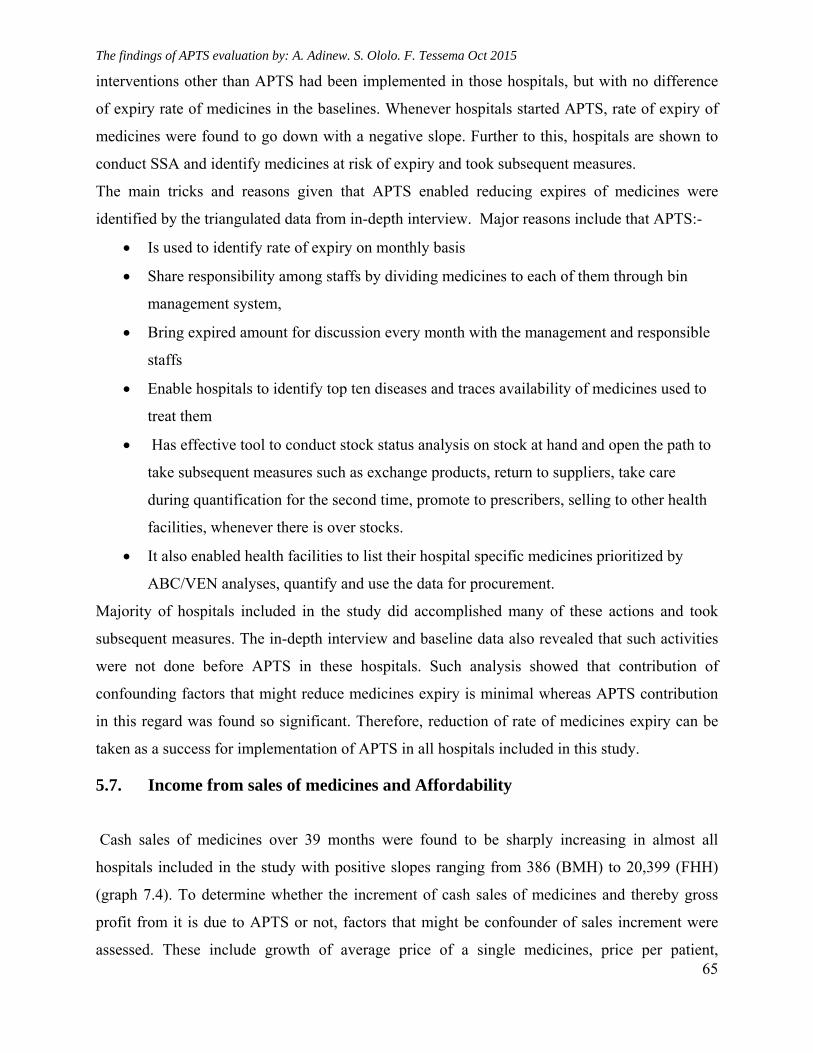
The findings of APTS evaluation by: A. Adinew. S. Ololo. F. Tessema Oct 2015
65
interventions other than APTS had been implemented in those hospitals, but with no difference
of expiry rate of medicines in the baselines. Whenever hospitals started APTS, rate of expiry of
medicines were found to go down with a negative slope. Further to this, hospitals are shown to
conduct SSA and identify medicines at risk of expiry and took subsequent measures.
The main tricks and reasons given that APTS enabled reducing expires of medicines were
identified by the triangulated data from in-depth interview. Major reasons include that APTS:-
Is used to identify rate of expiry on monthly basis
Share responsibility among staffs by dividing medicines to each of them through bin
management system,
Bring expired amount for discussion every month with the management and responsible
staffs
Enable hospitals to identify top ten diseases and traces availability of medicines used to
treat them
Has effective tool to conduct stock status analysis on stock at hand and open the path to
take subsequent measures such as exchange products, return to suppliers, take care
during quantification for the second time, promote to prescribers, selling to other health
facilities, whenever there is over stocks.
It also enabled health facilities to list their hospital specific medicines prioritized by
ABC/VEN analyses, quantify and use the data for procurement.
Majority of hospitals included in the study did accomplished many of these actions and took
subsequent measures. The in-depth interview and baseline data also revealed that such activities
were not done before APTS in these hospitals. Such analysis showed that contribution of
confounding factors that might reduce medicines expiry is minimal whereas APTS contribution
in this regard was found so significant. Therefore, reduction of rate of medicines expiry can be
taken as a success for implementation of APTS in all hospitals included in this study.
5.7. Income from sales of medicines and Affordability
Cash sales of medicines over 39 months were found to be sharply increasing in almost all
hospitals included in the study with positive slopes ranging from 386 (BMH) to 20,399 (FHH)
(graph 7.4). To determine whether the increment of cash sales of medicines and thereby gross
profit from it is due to APTS or not, factors that might be confounder of sales increment were
assessed. These include growth of average price of a single medicines, price per patient,
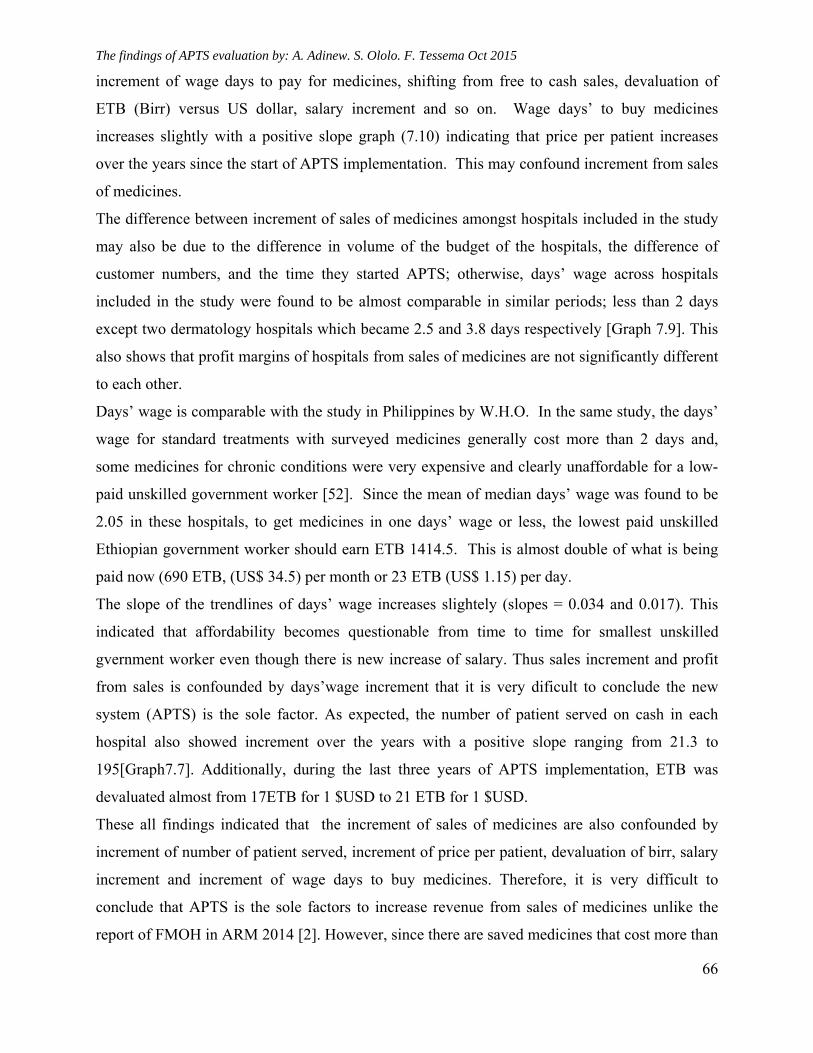
The findings of APTS evaluation by: A. Adinew. S. Ololo. F. Tessema Oct 2015
66
increment of wage days to pay for medicines, shifting from free to cash sales, devaluation of
ETB (Birr) versus US dollar, salary increment and so on. Wage days’ to buy medicines
increases slightly with a positive slope graph (7.10) indicating that price per patient increases
over the years since the start of APTS implementation. This may confound increment from sales
of medicines.
The difference between increment of sales of medicines amongst hospitals included in the study
may also be due to the difference in volume of the budget of the hospitals, the difference of
customer numbers, and the time they started APTS; otherwise, days’ wage across hospitals
included in the study were found to be almost comparable in similar periods; less than 2 days
except two dermatology hospitals which became 2.5 and 3.8 days respectively [Graph 7.9]. This
also shows that profit margins of hospitals from sales of medicines are not significantly different
to each other.
Days’ wage is comparable with the study in Philippines by W.H.O. In the same study, the days’
wage for standard treatments with surveyed medicines generally cost more than 2 days and,
some medicines for chronic conditions were very expensive and clearly unaffordable for a low-
paid unskilled government worker [52]. Since the mean of median days’ wage was found to be
2.05 in these hospitals, to get medicines in one days’ wage or less, the lowest paid unskilled
Ethiopian government worker should earn ETB 1414.5. This is almost double of what is being
paid now (690 ETB, (US$ 34.5) per month or 23 ETB (US$ 1.15) per day.
The slope of the trendlines of days’ wage increases slightely (slopes = 0.034 and 0.017). This
indicated that affordability becomes questionable from time to time for smallest unskilled
gvernment worker even though there is new increase of salary. Thus sales increment and profit
from sales is confounded by days’wage increment that it is very dificult to conclude the new
system (APTS) is the sole factor. As expected, the number of patient served on cash in each
hospital also showed increment over the years with a positive slope ranging from 21.3 to
195[Graph7.7]. Additionally, during the last three years of APTS implementation, ETB was
devaluated almost from 17ETB for 1 $USD to 21 ETB for 1 $USD.
These all findings indicated that the increment of sales of medicines are also confounded by
increment of number of patient served, increment of price per patient, devaluation of birr, salary
increment and increment of wage days to buy medicines. Therefore, it is very difficult to
conclude that APTS is the sole factors to increase revenue from sales of medicines unlike the
report of FMOH in ARM 2014 [2]. However, since there are saved medicines that cost more than
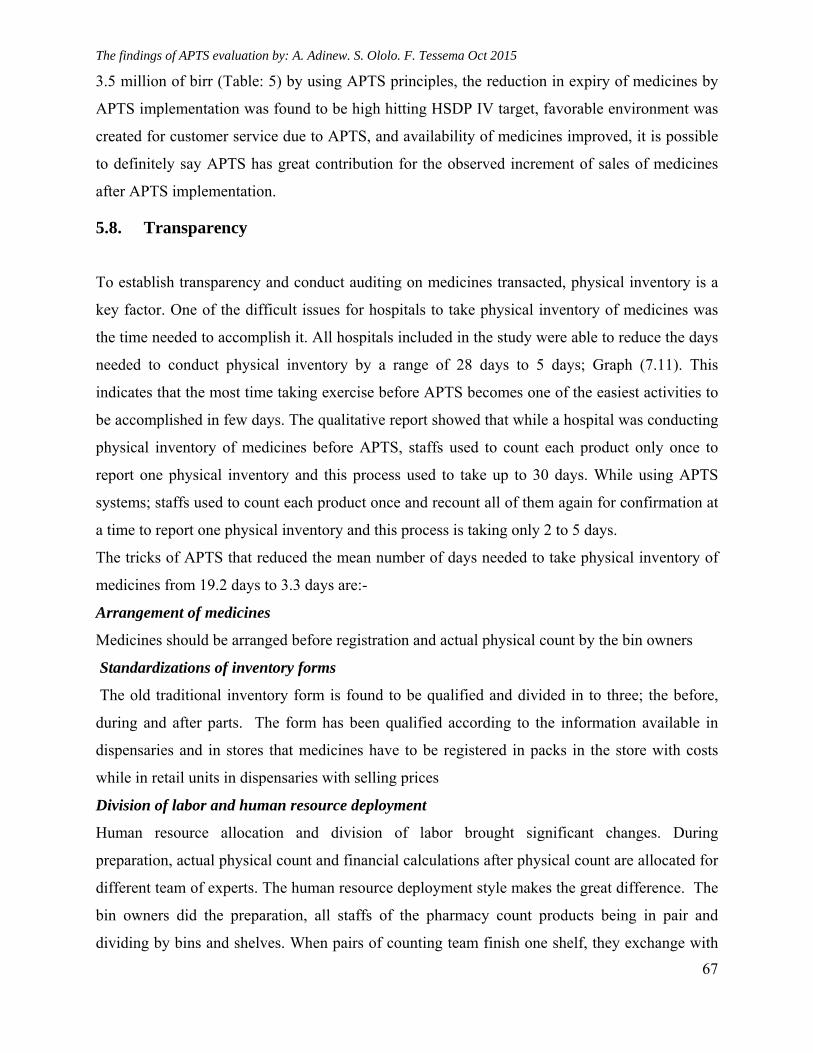
The findings of APTS evaluation by: A. Adinew. S. Ololo. F. Tessema Oct 2015
67
3.5 million of birr (Table: 5) by using APTS principles, the reduction in expiry of medicines by
APTS implementation was found to be high hitting HSDP IV target, favorable environment was
created for customer service due to APTS, and availability of medicines improved, it is possible
to definitely say APTS has great contribution for the observed increment of sales of medicines
after APTS implementation.
5.8. Transparency
To establish transparency and conduct auditing on medicines transacted, physical inventory is a
key factor. One of the difficult issues for hospitals to take physical inventory of medicines was
the time needed to accomplish it. All hospitals included in the study were able to reduce the days
needed to conduct physical inventory by a range of 28 days to 5 days; Graph (7.11). This
indicates that the most time taking exercise before APTS becomes one of the easiest activities to
be accomplished in few days. The qualitative report showed that while a hospital was conducting
physical inventory of medicines before APTS, staffs used to count each product only once to
report one physical inventory and this process used to take up to 30 days. While using APTS
systems; staffs used to count each product once and recount all of them again for confirmation at
a time to report one physical inventory and this process is taking only 2 to 5 days.
The tricks of APTS that reduced the mean number of days needed to take physical inventory of
medicines from 19.2 days to 3.3 days are:-
Arrangement of medicines
Medicines should be arranged before registration and actual physical count by the bin owners
Standardizations of inventory forms
The old traditional inventory form is found to be qualified and divided in to three; the before,
during and after parts. The form has been qualified according to the information available in
dispensaries and in stores that medicines have to be registered in packs in the store with costs
while in retail units in dispensaries with selling prices
Division of labor and human resource deployment
Human resource allocation and division of labor brought significant changes. During
preparation, actual physical count and financial calculations after physical count are allocated for
different team of experts. The human resource deployment style makes the great difference. The
bin owners did the preparation, all staffs of the pharmacy count products being in pair and
dividing by bins and shelves. When pairs of counting team finish one shelf, they exchange with
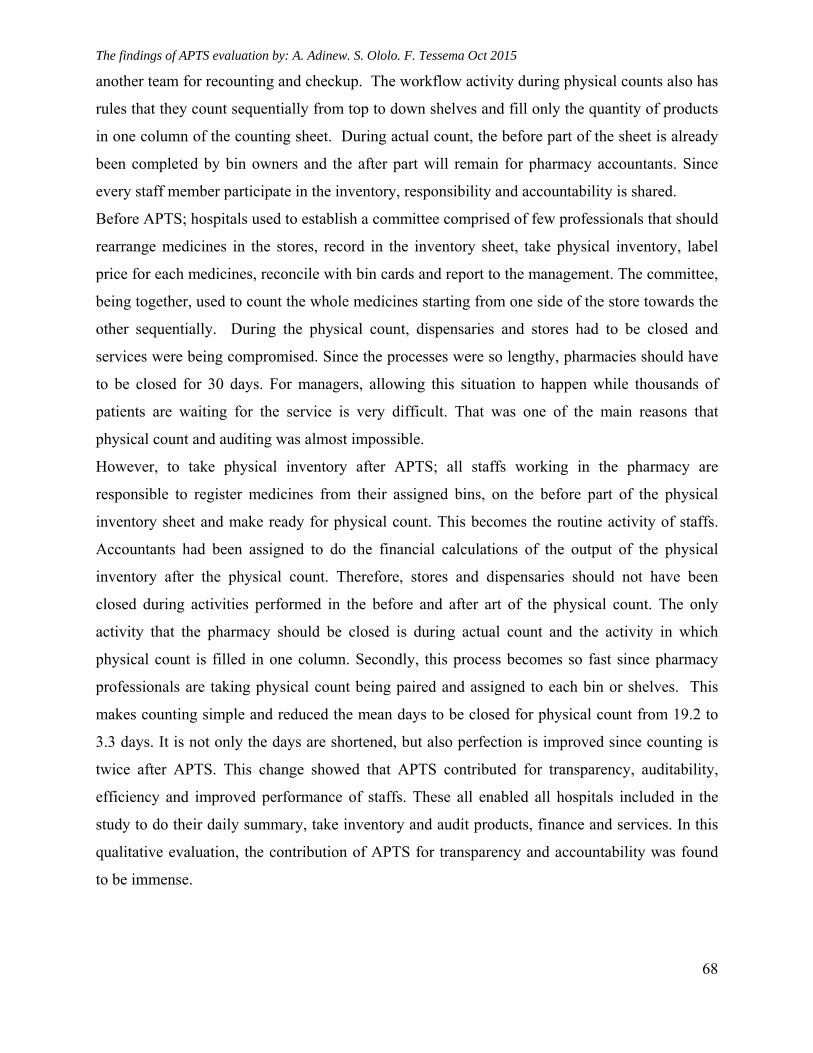
The findings of APTS evaluation by: A. Adinew. S. Ololo. F. Tessema Oct 2015
68
another team for recounting and checkup. The workflow activity during physical counts also has
rules that they count sequentially from top to down shelves and fill only the quantity of products
in one column of the counting sheet. During actual count, the before part of the sheet is already
been completed by bin owners and the after part will remain for pharmacy accountants. Since
every staff member participate in the inventory, responsibility and accountability is shared.
Before APTS; hospitals used to establish a committee comprised of few professionals that should
rearrange medicines in the stores, record in the inventory sheet, take physical inventory, label
price for each medicines, reconcile with bin cards and report to the management. The committee,
being together, used to count the whole medicines starting from one side of the store towards the
other sequentially. During the physical count, dispensaries and stores had to be closed and
services were being compromised. Since the processes were so lengthy, pharmacies should have
to be closed for 30 days. For managers, allowing this situation to happen while thousands of
patients are waiting for the service is very difficult. That was one of the main reasons that
physical count and auditing was almost impossible.
However, to take physical inventory after APTS; all staffs working in the pharmacy are
responsible to register medicines from their assigned bins, on the before part of the physical
inventory sheet and make ready for physical count. This becomes the routine activity of staffs.
Accountants had been assigned to do the financial calculations of the output of the physical
inventory after the physical count. Therefore, stores and dispensaries should not have been
closed during activities performed in the before and after art of the physical count. The only
activity that the pharmacy should be closed is during actual count and the activity in which
physical count is filled in one column. Secondly, this process becomes so fast since pharmacy
professionals are taking physical count being paired and assigned to each bin or shelves. This
makes counting simple and reduced the mean days to be closed for physical count from 19.2 to
3.3 days. It is not only the days are shortened, but also perfection is improved since counting is
twice after APTS. This change showed that APTS contributed for transparency, auditability,
efficiency and improved performance of staffs. These all enabled all hospitals included in the
study to do their daily summary, take inventory and audit products, finance and services. In this
qualitative evaluation, the contribution of APTS for transparency and accountability was found
to be immense.
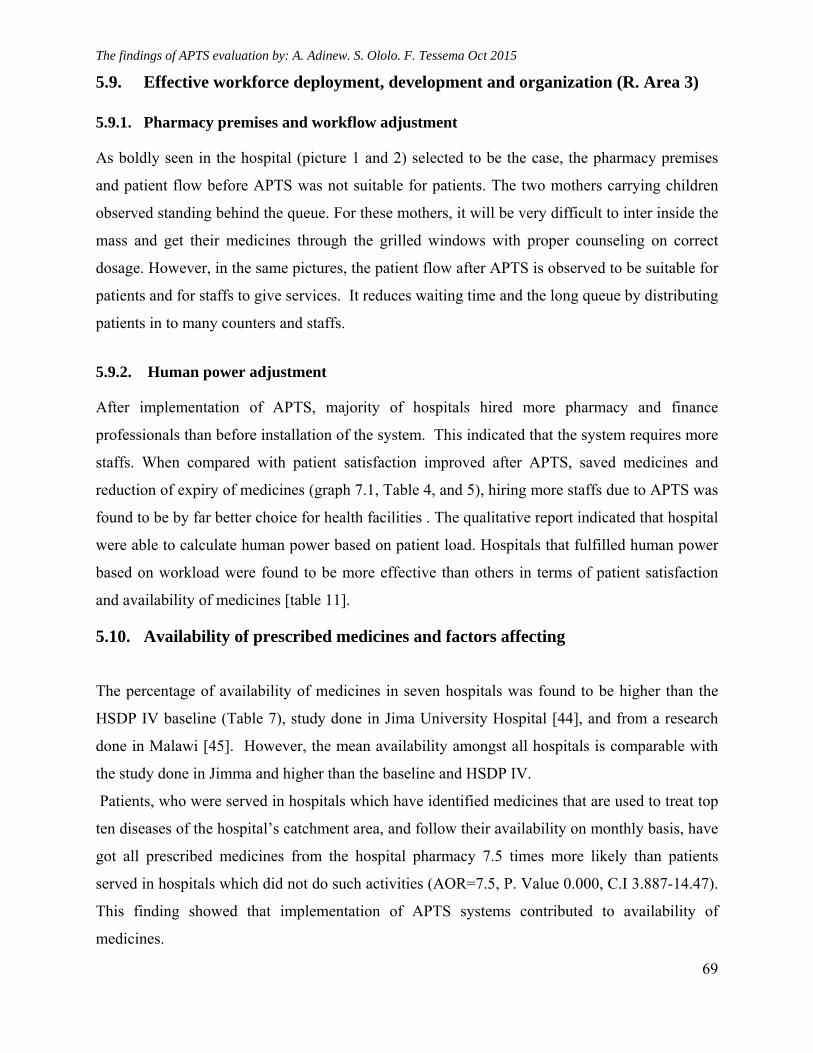
The findings of APTS evaluation by: A. Adinew. S. Ololo. F. Tessema Oct 2015
69
5.9. Effective workforce deployment, development and organization (R. Area 3)
5.9.1. Pharmacy premises and workflow adjustment
As boldly seen in the hospital (picture 1 and 2) selected to be the case, the pharmacy premises
and patient flow before APTS was not suitable for patients. The two mothers carrying children
observed standing behind the queue. For these mothers, it will be very difficult to inter inside the
mass and get their medicines through the grilled windows with proper counseling on correct
dosage. However, in the same pictures, the patient flow after APTS is observed to be suitable for
patients and for staffs to give services. It reduces waiting time and the long queue by distributing
patients in to many counters and staffs.
5.9.2. Human power adjustment
After implementation of APTS, majority of hospitals hired more pharmacy and finance
professionals than before installation of the system. This indicated that the system requires more
staffs. When compared with patient satisfaction improved after APTS, saved medicines and
reduction of expiry of medicines (graph 7.1, Table 4, and 5), hiring more staffs due to APTS was
found to be by far better choice for health facilities . The qualitative report indicated that hospital
were able to calculate human power based on patient load. Hospitals that fulfilled human power
based on workload were found to be more effective than others in terms of patient satisfaction
and availability of medicines [table 11].
5.10. Availability of prescribed medicines and factors affecting
The percentage of availability of medicines in seven hospitals was found to be higher than the
HSDP IV baseline (Table 7), study done in Jima University Hospital [44], and from a research
done in Malawi [45]. However, the mean availability amongst all hospitals is comparable with
the study done in Jimma and higher than the baseline and HSDP IV.
Patients, who were served in hospitals which have identified medicines that are used to treat top
ten diseases of the hospital’s catchment area, and follow their availability on monthly basis, have
got all prescribed medicines from the hospital pharmacy 7.5 times more likely than patients
served in hospitals which did not do such activities (AOR=7.5, P. Value 0.000, C.I 3.887-14.47).
This finding showed that implementation of APTS systems contributed to availability of
medicines.
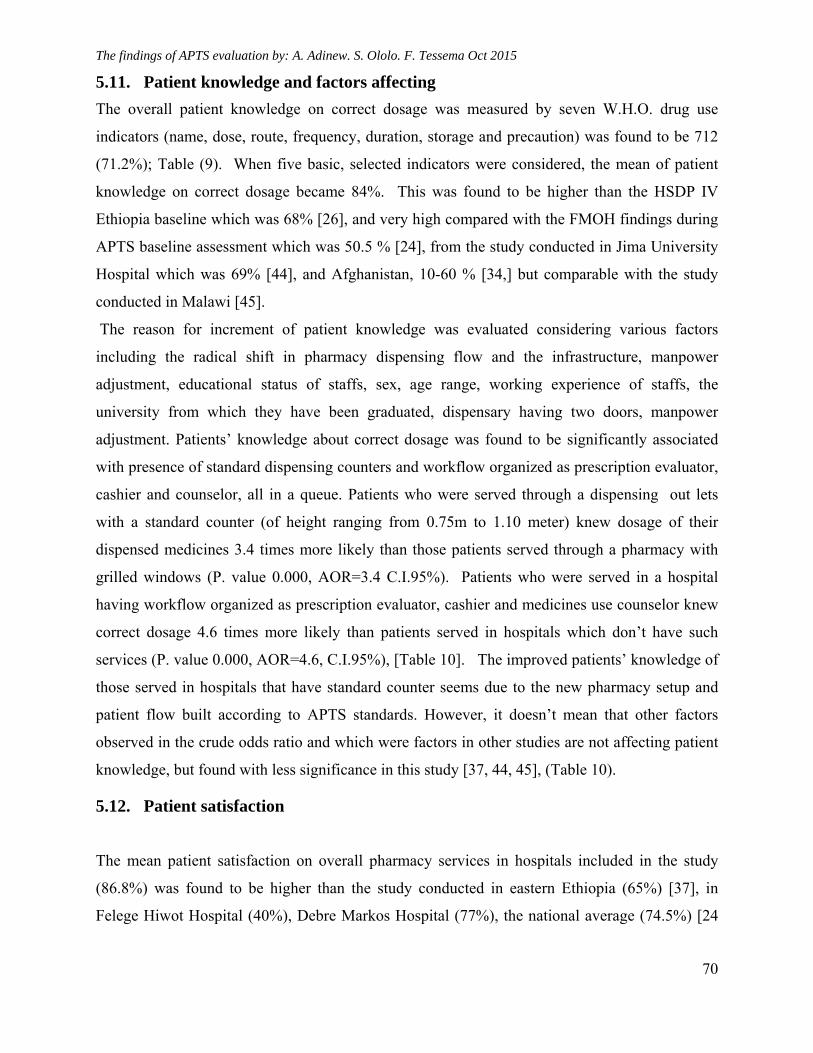
The findings of APTS evaluation by: A. Adinew. S. Ololo. F. Tessema Oct 2015
70
5.11. Patient knowledge and factors affecting
The overall patient knowledge on correct dosage was measured by seven W.H.O. drug use
indicators (name, dose, route, frequency, duration, storage and precaution) was found to be 712
(71.2%); Table (9). When five basic, selected indicators were considered, the mean of patient
knowledge on correct dosage became 84%. This was found to be higher than the HSDP IV
Ethiopia baseline which was 68% [26], and very high compared with the FMOH findings during
APTS baseline assessment which was 50.5 % [24], from the study conducted in Jima University
Hospital which was 69% [44], and Afghanistan, 10-60 % [34,] but comparable with the study
conducted in Malawi [45].
The reason for increment of patient knowledge was evaluated considering various factors
including the radical shift in pharmacy dispensing flow and the infrastructure, manpower
adjustment, educational status of staffs, sex, age range, working experience of staffs, the
university from which they have been graduated, dispensary having two doors, manpower
adjustment. Patients’ knowledge about correct dosage was found to be significantly associated
with presence of standard dispensing counters and workflow organized as prescription evaluator,
cashier and counselor, all in a queue. Patients who were served through a dispensing out lets
with a standard counter (of height ranging from 0.75m to 1.10 meter) knew dosage of their
dispensed medicines 3.4 times more likely than those patients served through a pharmacy with
grilled windows (P. value 0.000, AOR=3.4 C.I.95%). Patients who were served in a hospital
having workflow organized as prescription evaluator, cashier and medicines use counselor knew
correct dosage 4.6 times more likely than patients served in hospitals which don’t have such
services (P. value 0.000, AOR=4.6, C.I.95%), [Table 10]. The improved patients’ knowledge of
those served in hospitals that have standard counter seems due to the new pharmacy setup and
patient flow built according to APTS standards. However, it doesn’t mean that other factors
observed in the crude odds ratio and which were factors in other studies are not affecting patient
knowledge, but found with less significance in this study [37, 44, 45], (Table 10).
5.12. Patient satisfaction
The mean patient satisfaction on overall pharmacy services in hospitals included in the study
(86.8%) was found to be higher than the study conducted in eastern Ethiopia (65%) [37], in
Felege Hiwot Hospital (40%), Debre Markos Hospital (77%), the national average (74.5%) [24
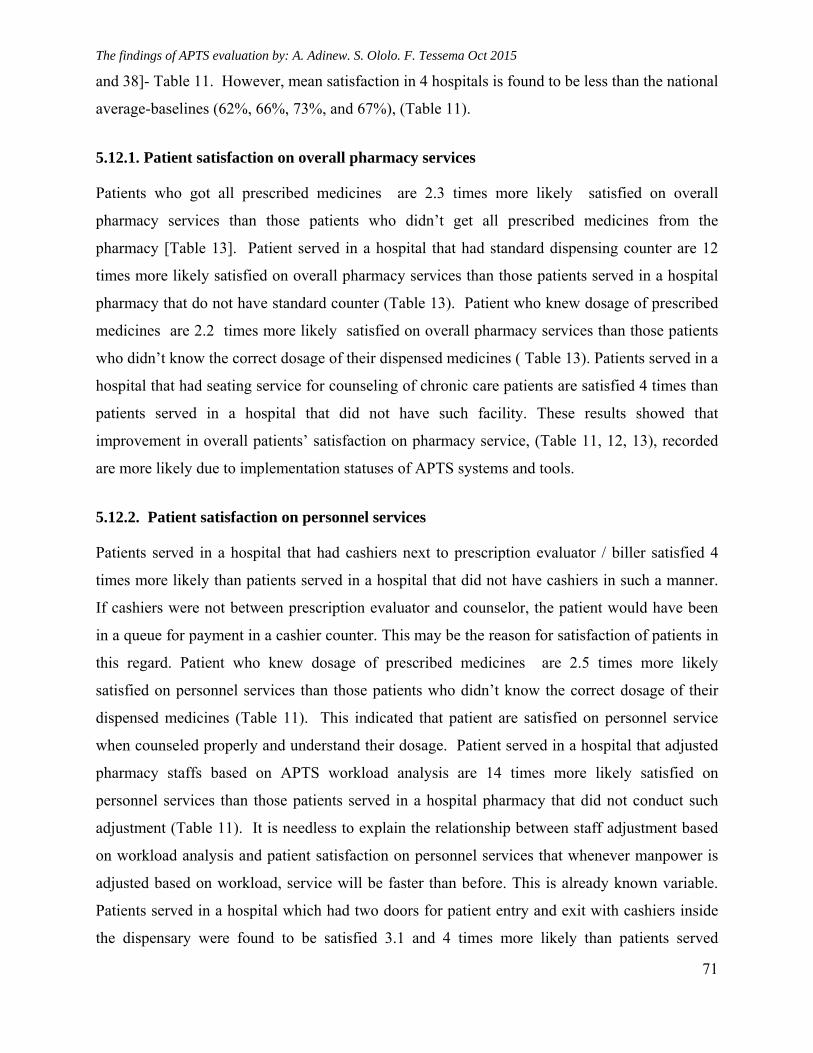
The findings of APTS evaluation by: A. Adinew. S. Ololo. F. Tessema Oct 2015
71
and 38]- Table 11. However, mean satisfaction in 4 hospitals is found to be less than the national
average-baselines (62%, 66%, 73%, and 67%), (Table 11).
5.12.1. Patient satisfaction on overall pharmacy services
Patients who got all prescribed medicines are 2.3 times more likely satisfied on overall
pharmacy services than those patients who didn’t get all prescribed medicines from the
pharmacy [Table 13]. Patient served in a hospital that had standard dispensing counter are 12
times more likely satisfied on overall pharmacy services than those patients served in a hospital
pharmacy that do not have standard counter (Table 13). Patient who knew dosage of prescribed
medicines are 2.2 times more likely satisfied on overall pharmacy services than those patients
who didn’t know the correct dosage of their dispensed medicines ( Table 13). Patients served in a
hospital that had seating service for counseling of chronic care patients are satisfied 4 times than
patients served in a hospital that did not have such facility. These results showed that
improvement in overall patients’ satisfaction on pharmacy service, (Table 11, 12, 13), recorded
are more likely due to implementation statuses of APTS systems and tools.
5.12.2. Patient satisfaction on personnel services
Patients served in a hospital that had cashiers next to prescription evaluator / biller satisfied 4
times more likely than patients served in a hospital that did not have cashiers in such a manner.
If cashiers were not between prescription evaluator and counselor, the patient would have been
in a queue for payment in a cashier counter. This may be the reason for satisfaction of patients in
this regard. Patient who knew dosage of prescribed medicines are 2.5 times more likely
satisfied on personnel services than those patients who didn’t know the correct dosage of their
dispensed medicines (Table 11). This indicated that patient are satisfied on personnel service
when counseled properly and understand their dosage. Patient served in a hospital that adjusted
pharmacy staffs based on APTS workload analysis are 14 times more likely satisfied on
personnel services than those patients served in a hospital pharmacy that did not conduct such
adjustment (Table 11). It is needless to explain the relationship between staff adjustment based
on workload analysis and patient satisfaction on personnel services that whenever manpower is
adjusted based on workload, service will be faster than before. This is already known variable.
Patients served in a hospital which had two doors for patient entry and exit with cashiers inside
the dispensary were found to be satisfied 3.1 and 4 times more likely than patients served
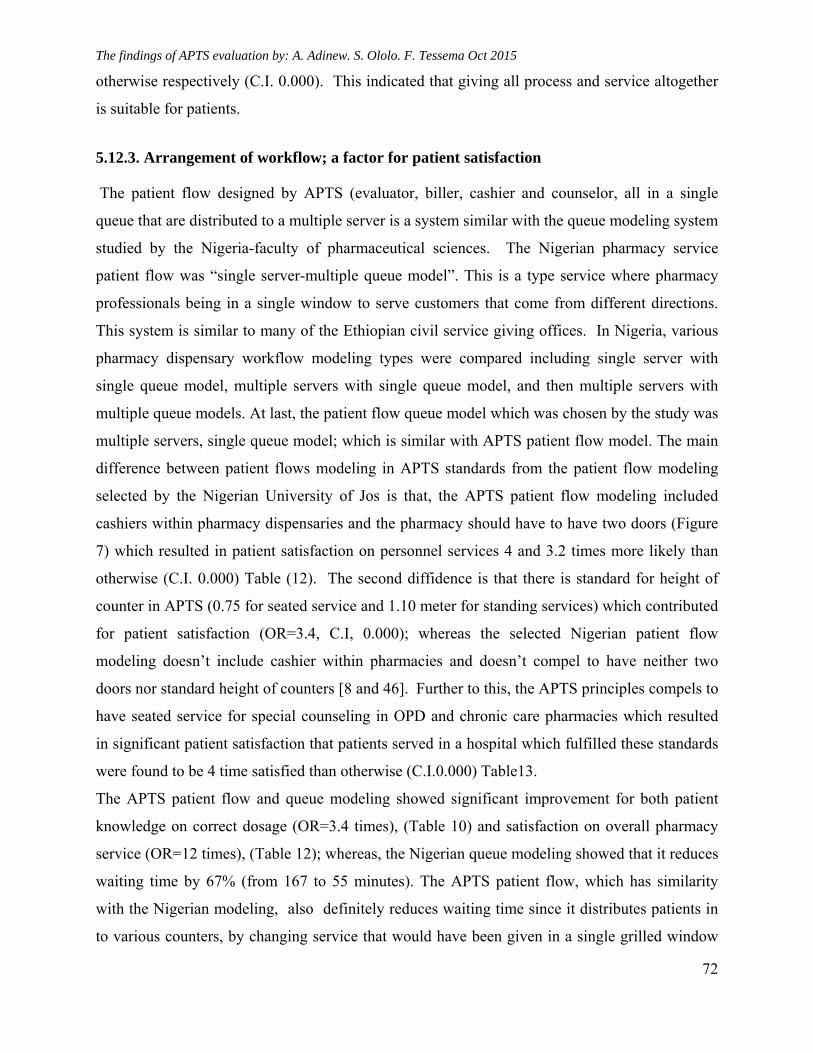
The findings of APTS evaluation by: A. Adinew. S. Ololo. F. Tessema Oct 2015
72
otherwise respectively (C.I. 0.000). This indicated that giving all process and service altogether
is suitable for patients.
5.12.3. Arrangement of workflow; a factor for patient satisfaction
The patient flow designed by APTS (evaluator, biller, cashier and counselor, all in a single
queue that are distributed to a multiple server is a system similar with the queue modeling system
studied by the Nigeria-faculty of pharmaceutical sciences. The Nigerian pharmacy service
patient flow was “single server-multiple queue model”. This is a type service where pharmacy
professionals being in a single window to serve customers that come from different directions.
This system is similar to many of the Ethiopian civil service giving offices. In Nigeria, various
pharmacy dispensary workflow modeling types were compared including single server with
single queue model, multiple servers with single queue model, and then multiple servers with
multiple queue models. At last, the patient flow queue model which was chosen by the study was
multiple servers, single queue model; which is similar with APTS patient flow model. The main
difference between patient flows modeling in APTS standards from the patient flow modeling
selected by the Nigerian University of Jos is that, the APTS patient flow modeling included
cashiers within pharmacy dispensaries and the pharmacy should have to have two doors (Figure
7) which resulted in patient satisfaction on personnel services 4 and 3.2 times more likely than
otherwise (C.I. 0.000) Table (12). The second diffidence is that there is standard for height of
counter in APTS (0.75 for seated service and 1.10 meter for standing services) which contributed
for patient satisfaction (OR=3.4, C.I, 0.000); whereas the selected Nigerian patient flow
modeling doesn’t include cashier within pharmacies and doesn’t compel to have neither two
doors nor standard height of counters [8 and 46]. Further to this, the APTS principles compels to
have seated service for special counseling in OPD and chronic care pharmacies which resulted
in significant patient satisfaction that patients served in a hospital which fulfilled these standards
were found to be 4 time satisfied than otherwise (C.I.0.000) Table13.
The APTS patient flow and queue modeling showed significant improvement for both patient
knowledge on correct dosage (OR=3.4 times), (Table 10) and satisfaction on overall pharmacy
service (OR=12 times), (Table 12); whereas, the Nigerian queue modeling showed that it reduces
waiting time by 67% (from 167 to 55 minutes). The APTS patient flow, which has similarity
with the Nigerian modeling, also definitely reduces waiting time since it distributes patients in
to various counters, by changing service that would have been given in a single grilled window
The findings of APTS evaluation by: A. Adinew. S. Ololo. F. Tessema Oct 2015
73
(picture 1). Majority of hospitals changed the single window in to more 5 windows that waiting
time reduces accordingly.
5.13. Challenges of APTS implementation
The qualitative report collected by in-depth interview of CEOs and chief pharmacists,
questionnaires from staffs indicated that they considered the system to be very important tool for
performance evaluation, improvement of patient satisfaction, generating information for decision
making, to bring transparency and efficiency. The system is proved being one of the key priority
of the management and board of all hospitals included in the study.
However, the delay of indemnity for compensation of shortages that might come due to human
error and at the same time, due to measures being taken based on the auditor reports about
discrepancies occurred on pharmacy and finance professionals who committed human error
caused grievance. This caused some staffs to be resistant to the implementation of the system.
Respondents described that doing the system in hard copy is so tiresome. Among 10 hospitals
included in the study, 9 of them were found implementing the systems using excel sheet for daily
summary and monthly report while recording of medicines in a hard copy. Only one of the ten
hospitals had developed software program for APTS implementation. All the 9 hospitals
demands to get software for the same reason.
5.14. Limitations of the Study
Hospitals included in the study started APTS at different times; therefore, some results like
revenue increment from medicines sales might not be comparable to each other.
To this date, there are many reforms and health system strengthening interventions being
implemented in hospitals, therefore, few improvements in the APTS result areas may be
confounded by these interventions. Since APTS is a new system implemented in Ethiopia only,
literatures on the issue to be reviewed that could be used for comparison were scarce.
Chapter 7: Conclusion and Recommendation
7.1. Conclusion
Hospitals included in this study implemented APTS tools and systems with big
difference of implementation statuses ranging from 68% to 95%. The more hospitals
The findings of APTS evaluation by: A. Adinew. S. Ololo. F. Tessema Oct 2015
74
implemented the system, the more they have got better outcomes in terms of
improvement in availability of prescribed medicines, patient knowledge on correct
dosage and patient satisfaction on pharmacy services.
Rate of medicines expiry was found to be sharply reducing in all hospitals included in
the study with a negative slope hitting HSDP IV target of Ethiopia planned in this
regard. Contribution of other programs to reduce expiry were found to be minimal.
Therefore, reduction of expiry of medicines was found to be significantly contributed by
APTS implementation.
Implementation of APTS tools and systems was found to contribute for increment of
revenue from sales of medicines. Other interventions and factors were also found to
contribute for increment of revenue from sales of medicines.
Implementing APTS tools and systems contribute significantly to increment of patient
knowledge on correct dosage and patient satisfaction on pharmacy services.
The two most challenging factors faced during implementation status of APTS were
found to be:
o Absence of software better than spreadsheet makes the system so tiresome
o Delay of indemnity for discrepancies that might occur due to human error causes
grievance among staffs.
In conclusion: APTS was found to improve availability of medicines, reduce wastage
and expiry, increase performance of staffs, reduce time to take physical inventory and
make conditions suitable for auditing, contribute for increment of revenue from
medicines sales, generate information on; product, finance and services. Above all, due
to APTS, waiting time is reduced, patient privacy is ensured, patient knowledge on
correct dosage is also increased thereby adherence to dosages is improved, and
satisfaction on pharmacy services are increased. Cumulative of these milestone
achievements contributed to a great share for saving lives.
Since the system was found to be the best means for implementation of the
USAID/SIAPS program and best aligned with the countries priority objective of the
pharmaceutical sector, this system is being orchestrated by the technical and financial
supports of the program and the government of Ethiopia. That helped it to be effectively
implemented.
The findings of APTS evaluation by: A. Adinew. S. Ololo. F. Tessema Oct 2015
75
7.2. Recommendations
It is highly recommended that the system called Auditable Pharmaceuticals Transactions
and Services (APTS) should be implemented in all hospitals, health centers and health
posts in all over Ethiopia by RHBs, FMOH and partners.
The FMOH, RHBs and partners should focus on quality of the services and transactions
since results showed significant variations amongst hospitals implementing the system.
o Major interventions that brought difference in quality of service and transactions
amongst hospitals; i.e. identifying top ten diseases and medicines for them,
improving dispensaries (dispensing area, standard counters and dispensing flow),
human power adjustment, bin management, SSA, drug list by VEN, ABC/VEN
reconciliations, availability and affordability, special counseling , uniquely
identifying codes, taking inventory using the smart methods of APTS, auditing,
using reliable data and reporting should be taken as a priority
The RHBs, FMOH, USAID/SIAPS should find better software for the system.
Staffs working in health facilities handling drugs and medical supplies that cost millions
of birr should better to be guaranteed by equivalent indemnity for discrepancies that
might occur due to human error through RHBs and FMOH.
To use the system for customer service delivery systems for any organization, and for all
types of stock management of any commodity other than medicines, concerned bodies
like the civil service bureau, the civil service university and Jima university shall better
take actions
o However, other studies are recommended to prove and indicate the means
whether this system is working for all types of customer service delivery schemes
and any type of stock managements
The Ethiopian FMOH has moral responsibility to assist African union so that it could
take experience of APTS and scale-up the system to all African countries through Africa
Union
The findings of APTS evaluation by: A. Adinew. S. Ololo. F. Tessema Oct 2015
76
Reference
1. United Nations, the Universal Declaration of Human Rights (UDHR), UN article 25
adopted, France, Paris. December 1948
2. Federal Ministry of Health; Medical Service Directorate. The 8 key priority agenda of
the 16th National Annual Review Meeting (ARM) of the FMOH, Diredawa Ethiopia
Oct.2014;http://www.moh.gov.et/documents/26765/0/Auditable+Pharmaceutical+Transa
ction+and+Service(APTS)/b199e166-155 c-4d2b- accessed in Dec.2014
3. The Ethiopian Human Right Commission (EHRC). Human Rights Research & Resource
Center, Bulletin. International Human Rights Day Dec. 10, 2012. Addis Ababa Ethiopia
4. World Health Organization, health actions in crisis, Ethiopian strategic document, Addis
Ababa Ethiopia. May 2005.
5. Dr Guitelle Et al, Department of essential medicines and pharmaceutical police (EMP),
Ethics, equity, trade and human right. W.H.O, Geneva, Switzerland. 2009.
6. World Health Organization Promoting rational use of medicines: core components,
policy perspectives on medicines, Geneva. September 2002.
7. Armin Fidler and Wezi Msisha, Governance in the pharmaceutical sector, London
school of economics and political science, Euro health bulletin Vol 14 No, 1,
2008http://www.lse.ac.uk/LSEHealthAndSocialCare/pdf/eurohealth/VOL14No1/FidlerM
sisha. accessed in Dec.2014
8. Ayalew Adinew et al. Auditable Pharmaceuticals Transactions and Services (APTS), A
Guide for implementation, Amhara Region, Andinet Printing Press, Addis Ababa
Ethiopia. May 2012.
9. Kathleen Holloway et al the world medicines situation, 2011 rational use of medicines,
Department of Essential Medicines and Pharmaceutical Policies, WHO, Geneva 2011
10. Federal Ministry of Health, Medical Service Directorate; Ethiopian Hospitals Reform
Implementation Guidelines (EHRIG), Volume I, Chapter 4; pharmacy Services, Addis
Ababa, Ethiopia. 2010
11. World Health Organization. Departments of Pharmaceutical Policies and Ethics.
Measuring transparency in the public pharmaceutical sector. Geneva Switzerland, 2011
12. Armin Fidler and Wezi Msisha, Governance in the pharmaceutical sector, London
school of economics and political science, Euro health bulletin Vol 14 No, 1, 2008
The findings of APTS evaluation by: A. Adinew. S. Ololo. F. Tessema Oct 2015
77
http://www.lse.ac.uk/LSEHealthAndSocialCare/pdf/eurohealth/VOL14No1/FidlerMsisha
. accessed in Dec.2014
13. Bethlehem Gulelat Assessment on the implementation of Hospital Reform Guideline with
reference to Pharmacy service in Addis Ababa Department of Pharmaceutics, Pharmaco
epidemiology , Addis Ababa University 2014
14. The council of the Amhara National Regional state of Ethiopia. Regulation for
Medicines Supply, Storage, Distribution and Service Delivery System, Zikre-Hig of;
regulation No 95/2012, 8 June 2012, Ayalew Gobezie, state Governor, Bahirdar Ethiopia.
15. The Council of the Dire Dawa Administration. Regulation for Medicines Supply,
Storage, Distribution and Service Delivery System, Dire Negarit Gazeta, Assed Ziyad,
Administration Mayer, Diredawa, Ethiopia October 1, 2012,
16. The Council of the SNNP Regional State. Regulation for Pharmacy services of
government health facilities; Debub Negarit Gazeta, Regulation No 118/2014, Dessie
Dalkie, State Governor, , Hawasa, Ethiopia. October 20, 2014
17. The Federal Ministry of Health of Ethiopia. Directive for pharmacy services of the
Federal and University Hospitals, directive No 001/2014, Honorable, Dr Kesete Berhan
Admasu, Addis Ababa. August 2014
18. Federal Ministry of Finance and Economic Development (MOFED) of Ethiopia.
Endorsement letter no 1/7/48 dated March 5 2014. Alemayehu Gujo, Vice Minister of
MOFED, 2014 Addis Ababa
19. Karin Wiedenmayer, Rob S. Summers et.al. Developing Pharmacy Practice; a focus on
patient care, handbook-2006 edition, World Health Organization, Geneva, Switzerland In
collaboration with International Pharmaceutical Federation, The Netherlands; 2006
20. Agustín Lage MD PhD, Global Pharmaceutical Development and Access: Critical Issues
of Ethics and Equity. Rio de Janeiro, Brazil, May, 2011;
http://www.medicc.org/mediccreview/articles/mr_204.pdf accessed in Dec.2014
21. World Health Organization, Essential Medicines and Health Products Information
Portal. Chapter 4. World pharmaceutical sales and consumption,
http://apps.who.int/medicinedocs/en/d/Js6160e/6.html#Js6160e.6 accessed in Dec.2014
22. USAID and CDC, the president’s malaria initiative (PMI). The eighth annual report to
congress USA; April 2014
The findings of APTS evaluation by: A. Adinew. S. Ololo. F. Tessema Oct 2015
78
23. Janelle Plummer. The World Bank, UK AID. Diagnosing Corruption in Ethiopia,
perceptions realities and the way forward. Washington D.C. 2012
24. Global Fund Fight AIDS Tuberculosis and Malaria. Theft and Illegal Diversion of
Medicines, Report to High-Level Meeting. Addis Ababa, Ethiopia, December 2011
25. Federal Ministry of Health of Ethiopia, medical service directorate and USAID/SIAPS;
APTS baseline assessment from 17 federal, university and Addis Ababa hospitals, Addis
Ababa. 2014
26. Drug Administration and control authority and Federal Ministry of Health, National
assessment of medicines supply, Ethiopia, Addis Ababa. 2003
27. Federal Ministry of Health of Ethiopia plan and program directorate, Health Sector
Development IV (HSDP IV /2010-2015) plan, Addis Ababa, Ethiopia. 2010.
28. Amhara Regional Health Bureau. Certificate of recognition for innovation of the concept
of APTS and Guide preparation, awarded for the team members from Debre Markos
Referral Hospital, Amhara Regional Health Bureau and USAID/SIAPS. Bahirdar
Ethiopia. December, 2013. http://www.frontlinehealthworkers.org/how-one-pharmacist-
can-make-a-difference-transforming-ethiopias-pharmaceutical-sector/
29. Dr. Kenneth N. et al. Factors Affecting Provision of Service Quality in the Public Health
Sector: A Case of Kenyatta National Hospital; Jomo Kenyatta University of Agriculture
& Technology International Journal of Humanities and Social Science, Vol. 2 No. 13;
Nairobi, Kenya. July 2012
30. Dr Liz Seston, Dr Ellen Schafheutle, a literature review on factors influencing
pharmacist performance. Centre for Pharmacy Workforce Studies, School of Pharmacy
& Pharmaceutical Sciences, University of Manchester. Great Britain, July 2010.
31. Roger Bate; Partners in Crime: National Theft of Global Fund Medicines, Africa Fighting
Malaria (AFM) Briefing Paper. Washington DC. April 20, 2011.
32. Benoît Faucon, Nicholas Bariyo and Jeanne Whalen, Thieves Hijacking Malaria Drugs in
Africa. The Wall Street Journal (WSJ), USA. November 11, 2013.
http://online.wsj.com/articles accessed in Dec.2014
33. Pragnadyuti Mandal et al Peoples’ knowledge about the use of medicine in West Bengal,
India. World Journal of Medicine and Medical Science Research Vol. 1 (4), pp. 077-081,
India, October 2013
The findings of APTS evaluation by: A. Adinew. S. Ololo. F. Tessema Oct 2015
79
34. Terry Green et al. Afghanistan Medicine Use Study: A Survey of 28 Health Facilities in 5
Provinces. Strengthening Pharmaceutical Systems Center for Pharmaceutical
Management, Management Sciences for Health, Arlington, USA, 2010
35. World health organization. Kenya office. Access to essential medicines in Kenya health
facility survey. Kenya 2009
36. Richard Sebastian Silumbe, Pharmaceutical management and prescribing pattern of
antimalarial drugs in the public health facilities in Dar-es-Salaam, Tanzania, July 2011
37. Birma Abdosh, Harari Regional Health Bureau, The quality of hospital services in
eastern Ethiopia: patient’s perspective Ethiopia Journal of Health Dev. 2006
38. Amhara Regional Health Bureau and USAID/SIAPS; APTS baseline assessment from 15
Regional, referral and general hospitals at different times, Bahir Dar. 2013/2014 ( among
15, only 2 findings are published)
39. Amhara Regional Health Bureau and USAID/SIAPS; APTS baseline assessment from
Felege Hiwot referral hospital, Bahir Dar. 2013/2014
40. SNNP Health Bureau and USAID/SIAPS; APTS baseline assessment from 3 Regional,
general hospitals of the southern nations, Hawasa 2013/2014 (un published)
41. Diredawa Administration Health Bureau and USAID/SIAPS; APTS baseline assessment
from one hospital Diredwa 2013/2014 (un published)
42. Noah Elias, et al. policy and practice, information for action, quarterly health bulletin,
vol.6, No 1, Federal Ministry of Health, Addis Ababa, Ethiopia. April, 2014
43. World Health Organization. How to investigate drug use in health facilities, Geneva,1993
44. Workneh Etefa, Chalachew Teshale, Segewkal Hawaze, assessment of dispensing
practice in south west Ethiopia: the case of Jimma university hospital. Jimma, 2013
45. Aaron Glyn Sosola, Assessment of Prescribing and Dispensing Practices in Public
Health Facilities of Southern, International journal of pharmaceutical sciences, Malawi
December 2007
46. Ndukwe H. C et al. Reducing queues in a Nigerian hospital pharmacy. Faculty of
Pharmaceutical Sciences, University of Jos, Plateau State, Nigeria. 2011
47. PIERRE LA V ALLEE and MICHEL A. HIDIROGLOU, Survey Methodology, On the
Stratification of Skewed Populations. Canada, June 1988
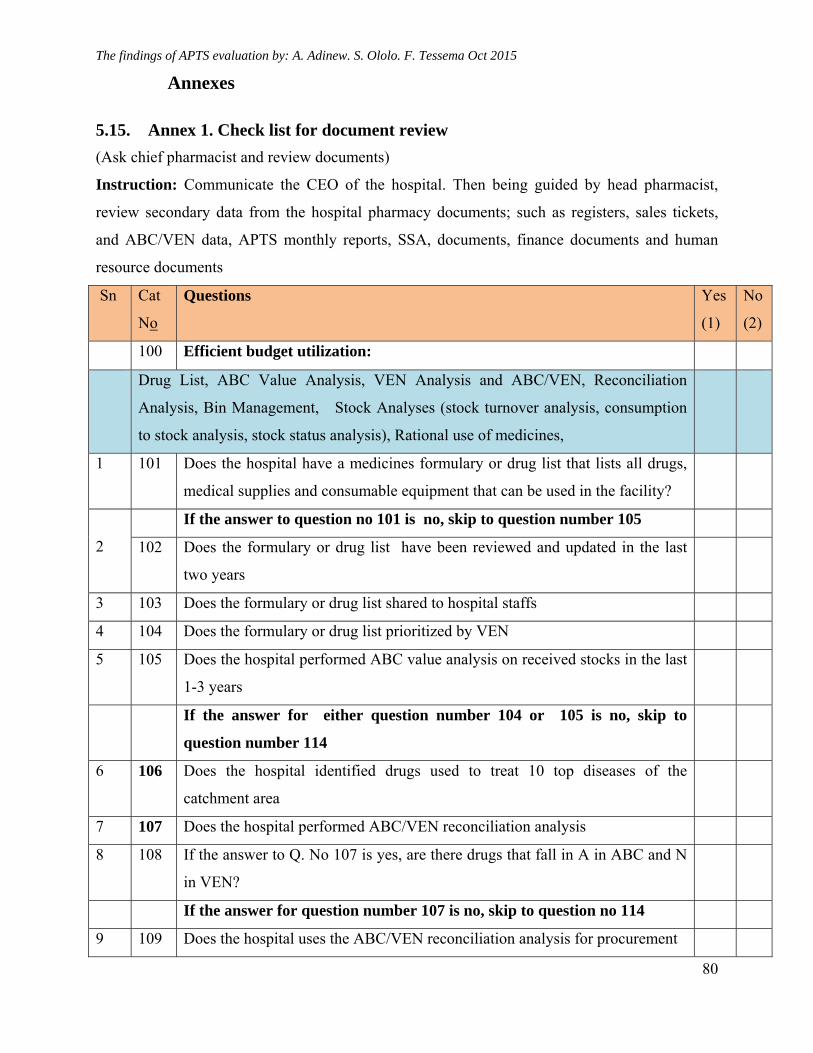
The findings of APTS evaluation by: A. Adinew. S. Ololo. F. Tessema Oct 2015
80
Annexes
5.15. Annex 1. Check list for document review
(Ask chief pharmacist and review documents)
Instruction: Communicate the CEO of the hospital. Then being guided by head pharmacist,
review secondary data from the hospital pharmacy documents; such as registers, sales tickets,
and ABC/VEN data, APTS monthly reports, SSA, documents, finance documents and human
resource documents
Sn Cat
No
Questions Yes
(1)
No
(2)
100 Efficient budget utilization:
Drug List, ABC Value Analysis, VEN Analysis and ABC/VEN, Reconciliation
Analysis, Bin Management, Stock Analyses (stock turnover analysis, consumption
to stock analysis, stock status analysis), Rational use of medicines,
1 101 Does the hospital have a medicines formulary or drug list that lists all drugs,
medical supplies and consumable equipment that can be used in the facility?
2
If the answer to question no 101 is no, skip to question number 105
102 Does the formulary or drug list have been reviewed and updated in the last
two years
3 103 Does the formulary or drug list shared to hospital staffs
4 104 Does the formulary or drug list prioritized by VEN
5 105 Does the hospital performed ABC value analysis on received stocks in the last
1-3 years
If the answer for either question number 104 or 105 is no, skip to
question number 114
6 106 Does the hospital identified drugs used to treat 10 top diseases of the
catchment area
7 107 Does the hospital performed ABC/VEN reconciliation analysis
8 108 If the answer to Q. No 107 is yes, are there drugs that fall in A in ABC and N
in VEN?
If the answer for question number 107 is no, skip to question no 114
9 109 Does the hospital uses the ABC/VEN reconciliation analysis for procurement
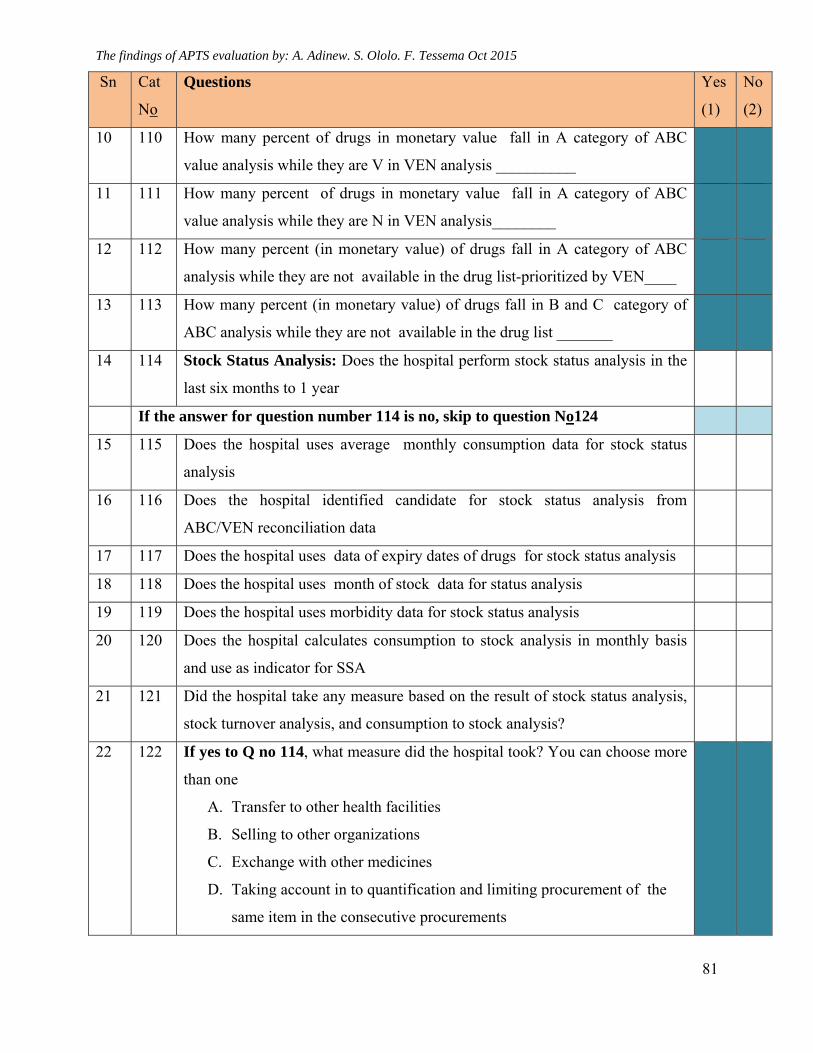
The findings of APTS evaluation by: A. Adinew. S. Ololo. F. Tessema Oct 2015
81
Sn Cat
No
Questions Yes
(1)
No
(2)
10 110 How many percent of drugs in monetary value fall in A category of ABC
value analysis while they are V in VEN analysis __________
11 111 How many percent of drugs in monetary value fall in A category of ABC
value analysis while they are N in VEN analysis________
12 112 How many percent (in monetary value) of drugs fall in A category of ABC
analysis while they are not available in the drug list-prioritized by VEN____
13 113 How many percent (in monetary value) of drugs fall in B and C category of
ABC analysis while they are not available in the drug list _______
14 114 Stock Status Analysis: Does the hospital perform stock status analysis in the
last six months to 1 year
If the answer for question number 114 is no, skip to question No124
15 115 Does the hospital uses average monthly consumption data for stock status
analysis
16 116 Does the hospital identified candidate for stock status analysis from
ABC/VEN reconciliation data
17 117 Does the hospital uses data of expiry dates of drugs for stock status analysis
18 118 Does the hospital uses month of stock data for status analysis
19 119 Does the hospital uses morbidity data for stock status analysis
20 120 Does the hospital calculates consumption to stock analysis in monthly basis
and use as indicator for SSA
21 121 Did the hospital take any measure based on the result of stock status analysis,
stock turnover analysis, and consumption to stock analysis?
22 122 If yes to Q no 114, what measure did the hospital took? You can choose more
than one
A. Transfer to other health facilities
B. Selling to other organizations
C. Exchange with other medicines
D. Taking account in to quantification and limiting procurement of the
same item in the consecutive procurements
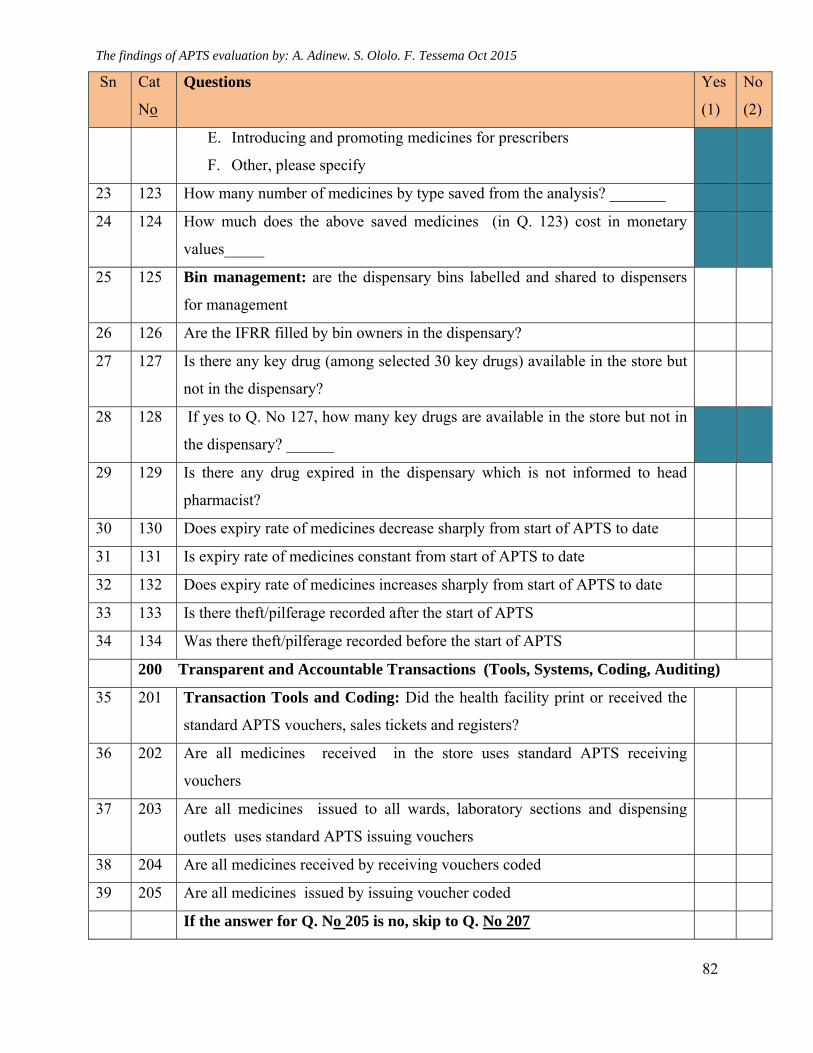
The findings of APTS evaluation by: A. Adinew. S. Ololo. F. Tessema Oct 2015
82
Sn Cat
No
Questions Yes
(1)
No
(2)
E. Introducing and promoting medicines for prescribers
F. Other, please specify
23 123 How many number of medicines by type saved from the analysis? _______
24 124 How much does the above saved medicines (in Q. 123) cost in monetary
values_____
25 125 Bin management: are the dispensary bins labelled and shared to dispensers
for management
26 126 Are the IFRR filled by bin owners in the dispensary?
27 127 Is there any key drug (among selected 30 key drugs) available in the store but
not in the dispensary?
28 128 If yes to Q. No 127, how many key drugs are available in the store but not in
the dispensary? ______
29 129 Is there any drug expired in the dispensary which is not informed to head
pharmacist?
30 130 Does expiry rate of medicines decrease sharply from start of APTS to date
31 131 Is expiry rate of medicines constant from start of APTS to date
32 132 Does expiry rate of medicines increases sharply from start of APTS to date
33 133 Is there theft/pilferage recorded after the start of APTS
34 134 Was there theft/pilferage recorded before the start of APTS
200 Transparent and Accountable Transactions (Tools, Systems, Coding, Auditing)
35 201 Transaction Tools and Coding: Did the health facility print or received the
standard APTS vouchers, sales tickets and registers?
36 202 Are all medicines received in the store uses standard APTS receiving
vouchers
37 203 Are all medicines issued to all wards, laboratory sections and dispensing
outlets uses standard APTS issuing vouchers
38 204 Are all medicines received by receiving vouchers coded
39 205 Are all medicines issued by issuing voucher coded
If the answer for Q. No 205 is no, skip to Q. No 207
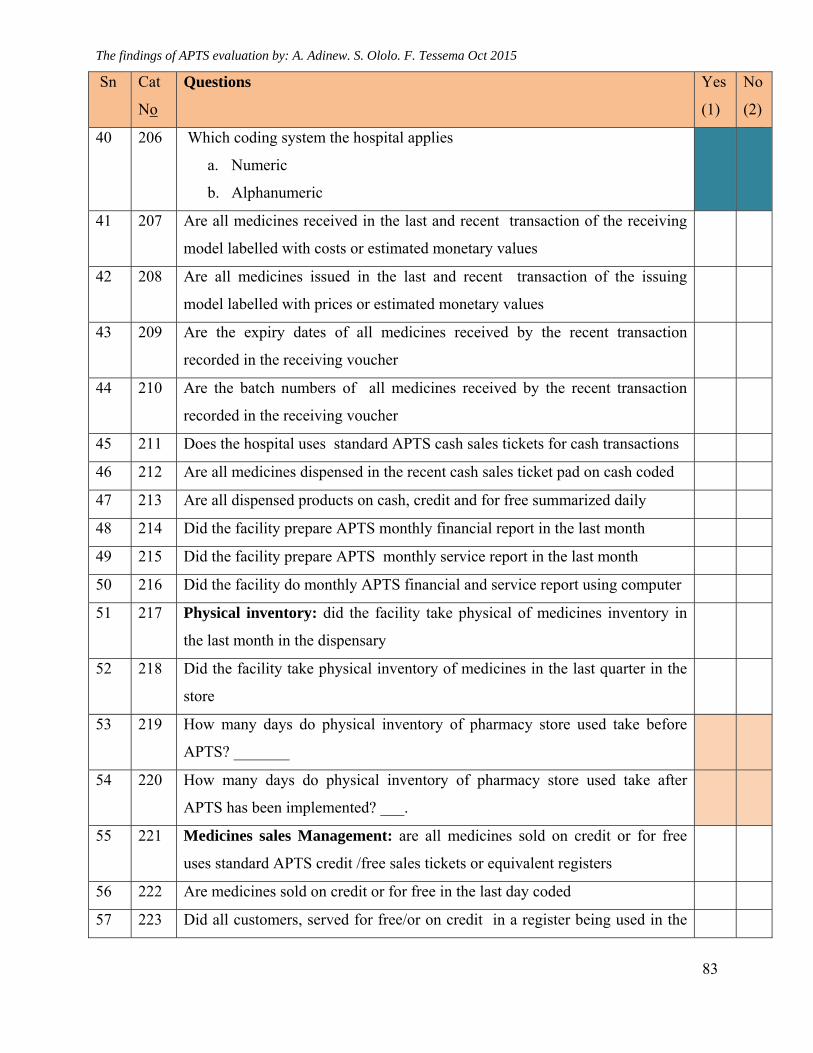
The findings of APTS evaluation by: A. Adinew. S. Ololo. F. Tessema Oct 2015
83
Sn Cat
No
Questions Yes
(1)
No
(2)
40 206 Which coding system the hospital applies
a. Numeric
b. Alphanumeric
41 207 Are all medicines received in the last and recent transaction of the receiving
model labelled with costs or estimated monetary values
42 208 Are all medicines issued in the last and recent transaction of the issuing
model labelled with prices or estimated monetary values
43 209 Are the expiry dates of all medicines received by the recent transaction
recorded in the receiving voucher
44 210 Are the batch numbers of all medicines received by the recent transaction
recorded in the receiving voucher
45 211 Does the hospital uses standard APTS cash sales tickets for cash transactions
46 212 Are all medicines dispensed in the recent cash sales ticket pad on cash coded
47 213 Are all dispensed products on cash, credit and for free summarized daily
48 214 Did the facility prepare APTS monthly financial report in the last month
49 215 Did the facility prepare APTS monthly service report in the last month
50 216 Did the facility do monthly APTS financial and service report using computer
51 217 Physical inventory: did the facility take physical of medicines inventory in
the last month in the dispensary
52 218 Did the facility take physical inventory of medicines in the last quarter in the
store
53 219 How many days do physical inventory of pharmacy store used take before
APTS? _______
54 220 How many days do physical inventory of pharmacy store used take after
APTS has been implemented? ___.
55 221 Medicines sales Management: are all medicines sold on credit or for free
uses standard APTS credit /free sales tickets or equivalent registers
56 222 Are medicines sold on credit or for free in the last day coded
57 223 Did all customers, served for free/or on credit in a register being used in the
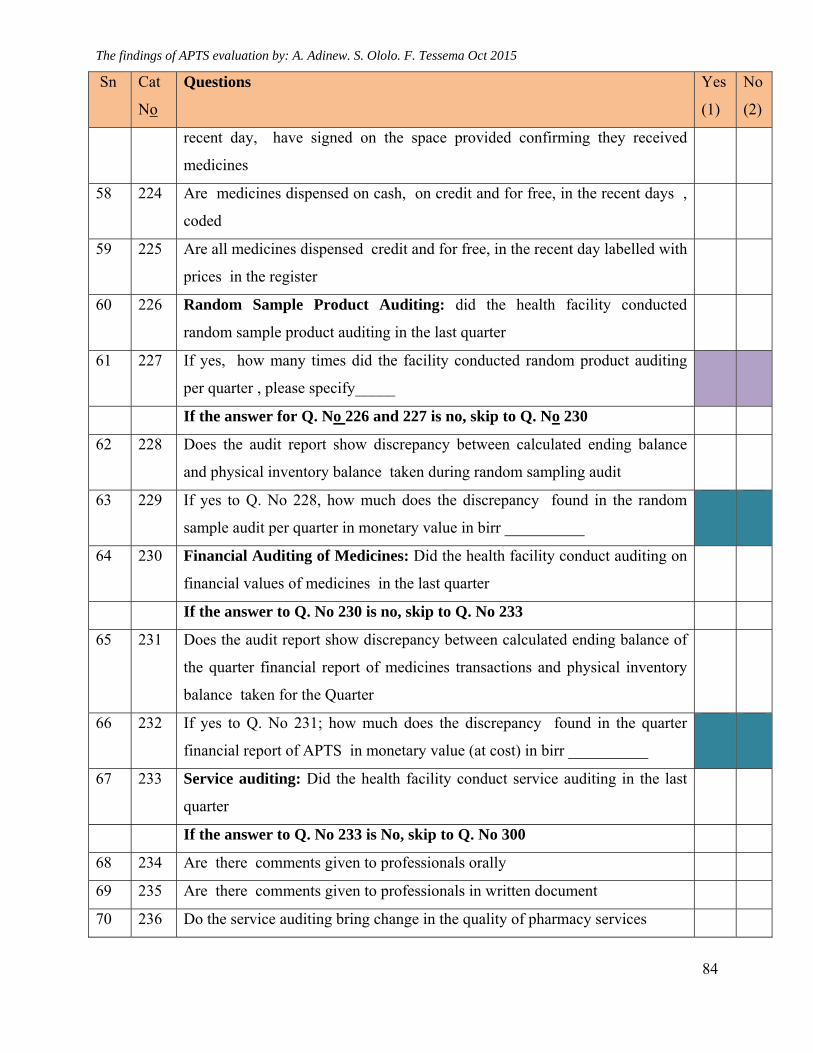
The findings of APTS evaluation by: A. Adinew. S. Ololo. F. Tessema Oct 2015
84
Sn Cat
No
Questions Yes
(1)
No
(2)
recent day, have signed on the space provided confirming they received
medicines
58 224 Are medicines dispensed on cash, on credit and for free, in the recent days ,
coded
59 225 Are all medicines dispensed credit and for free, in the recent day labelled with
prices in the register
60 226 Random Sample Product Auditing: did the health facility conducted
random sample product auditing in the last quarter
61 227 If yes, how many times did the facility conducted random product auditing
per quarter , please specify_____
If the answer for Q. No 226 and 227 is no, skip to Q. No 230
62 228 Does the audit report show discrepancy between calculated ending balance
and physical inventory balance taken during random sampling audit
63 229 If yes to Q. No 228, how much does the discrepancy found in the random
sample audit per quarter in monetary value in birr __________
64 230 Financial Auditing of Medicines: Did the health facility conduct auditing on
financial values of medicines in the last quarter
If the answer to Q. No 230 is no, skip to Q. No 233
65 231 Does the audit report show discrepancy between calculated ending balance of
the quarter financial report of medicines transactions and physical inventory
balance taken for the Quarter
66 232 If yes to Q. No 231; how much does the discrepancy found in the quarter
financial report of APTS in monetary value (at cost) in birr __________
67 233 Service auditing: Did the health facility conduct service auditing in the last
quarter
If the answer to Q. No 233 is No, skip to Q. No 300
68 234 Are there comments given to professionals orally
69 235 Are there comments given to professionals in written document
70 236 Do the service auditing bring change in the quality of pharmacy services
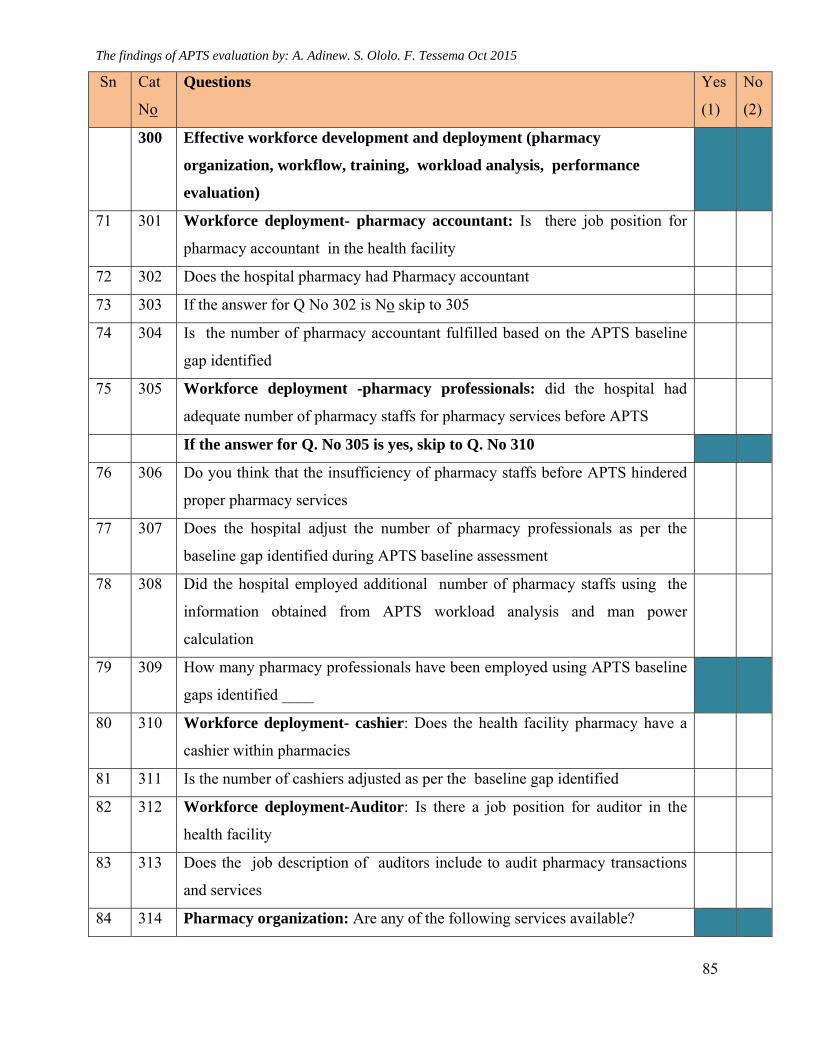
The findings of APTS evaluation by: A. Adinew. S. Ololo. F. Tessema Oct 2015
85
Sn Cat
No
Questions Yes
(1)
No
(2)
300 Effective workforce development and deployment (pharmacy
organization, workflow, training, workload analysis, performance
evaluation)
71 301 Workforce deployment- pharmacy accountant: Is there job position for
pharmacy accountant in the health facility
72 302 Does the hospital pharmacy had Pharmacy accountant
73 303 If the answer for Q No 302 is No skip to 305
74 304 Is the number of pharmacy accountant fulfilled based on the APTS baseline
gap identified
75 305 Workforce deployment -pharmacy professionals: did the hospital had
adequate number of pharmacy staffs for pharmacy services before APTS
If the answer for Q. No 305 is yes, skip to Q. No 310
76 306 Do you think that the insufficiency of pharmacy staffs before APTS hindered
proper pharmacy services
77 307 Does the hospital adjust the number of pharmacy professionals as per the
baseline gap identified during APTS baseline assessment
78 308 Did the hospital employed additional number of pharmacy staffs using the
information obtained from APTS workload analysis and man power
calculation
79 309 How many pharmacy professionals have been employed using APTS baseline
gaps identified ____
80 310 Workforce deployment- cashier: Does the health facility pharmacy have a
cashier within pharmacies
81 311 Is the number of cashiers adjusted as per the baseline gap identified
82 312 Workforce deployment-Auditor: Is there a job position for auditor in the
health facility
83 313 Does the job description of auditors include to audit pharmacy transactions
and services
84 314 Pharmacy organization: Are any of the following services available?
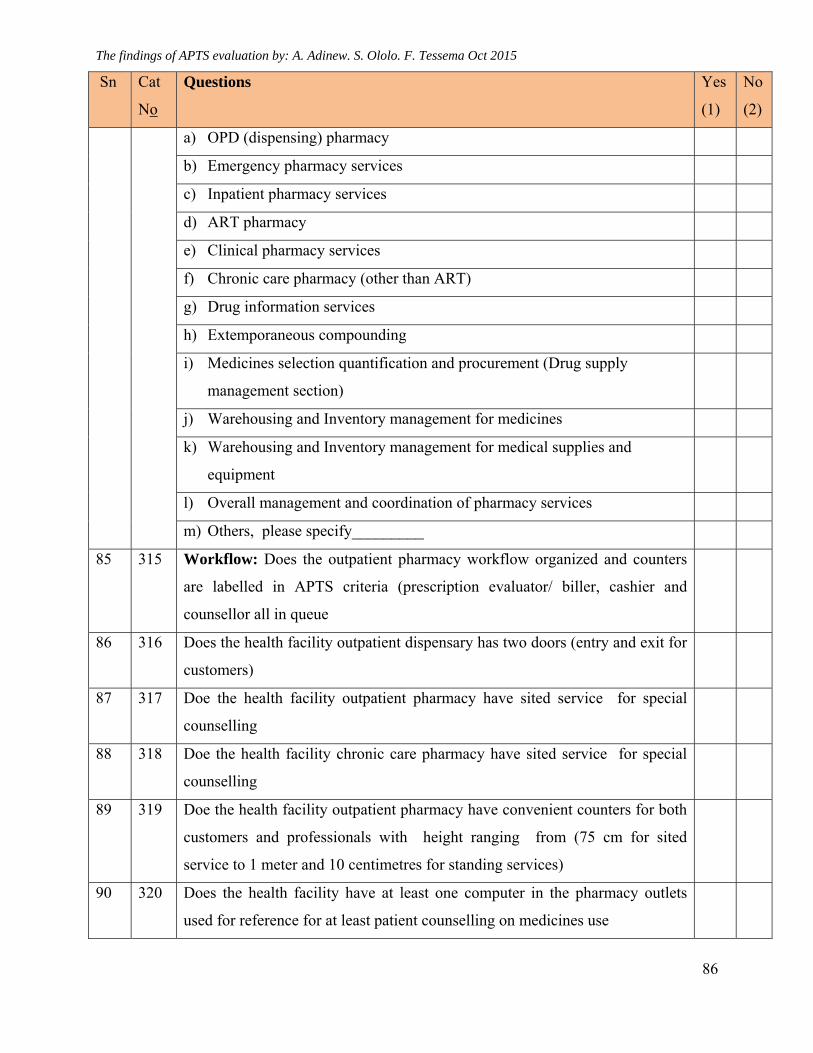
The findings of APTS evaluation by: A. Adinew. S. Ololo. F. Tessema Oct 2015
86
Sn Cat
No
Questions Yes
(1)
No
(2)
a) OPD (dispensing) pharmacy
b) Emergency pharmacy services
c) Inpatient pharmacy services
d) ART pharmacy
e) Clinical pharmacy services
f) Chronic care pharmacy (other than ART)
g) Drug information services
h) Extemporaneous compounding
i) Medicines selection quantification and procurement (Drug supply
management section)
j) Warehousing and Inventory management for medicines
k) Warehousing and Inventory management for medical supplies and
equipment
l) Overall management and coordination of pharmacy services
m) Others, please specify_________
85 315 Workflow: Does the outpatient pharmacy workflow organized and counters
are labelled in APTS criteria (prescription evaluator/ biller, cashier and
counsellor all in queue
86 316 Does the health facility outpatient dispensary has two doors (entry and exit for
customers)
87 317 Doe the health facility outpatient pharmacy have sited service for special
counselling
88 318 Doe the health facility chronic care pharmacy have sited service for special
counselling
89 319 Doe the health facility outpatient pharmacy have convenient counters for both
customers and professionals with height ranging from (75 cm for sited
service to 1 meter and 10 centimetres for standing services)
90 320 Does the health facility have at least one computer in the pharmacy outlets
used for reference for at least patient counselling on medicines use
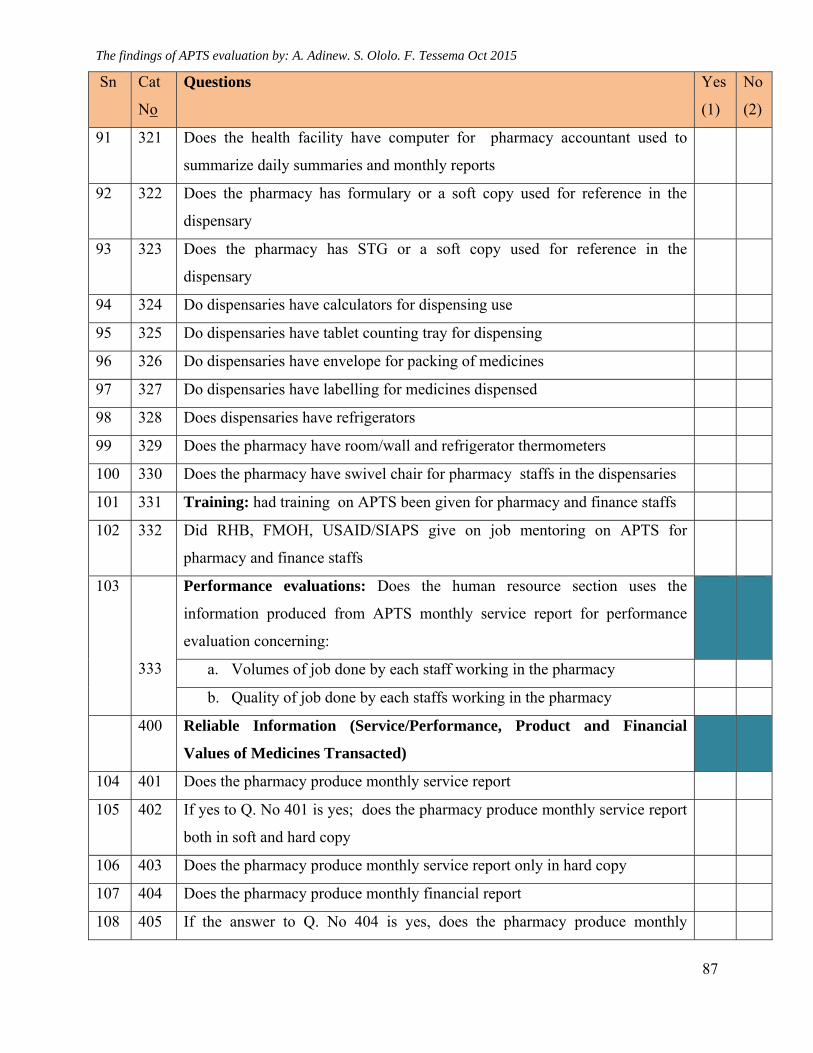
The findings of APTS evaluation by: A. Adinew. S. Ololo. F. Tessema Oct 2015
87
Sn Cat
No
Questions Yes
(1)
No
(2)
91 321 Does the health facility have computer for pharmacy accountant used to
summarize daily summaries and monthly reports
92 322 Does the pharmacy has formulary or a soft copy used for reference in the
dispensary
93 323 Does the pharmacy has STG or a soft copy used for reference in the
dispensary
94 324 Do dispensaries have calculators for dispensing use
95 325 Do dispensaries have tablet counting tray for dispensing
96 326 Do dispensaries have envelope for packing of medicines
97 327 Do dispensaries have labelling for medicines dispensed
98 328 Does dispensaries have refrigerators
99 329 Does the pharmacy have room/wall and refrigerator thermometers
100 330 Does the pharmacy have swivel chair for pharmacy staffs in the dispensaries
101 331 Training: had training on APTS been given for pharmacy and finance staffs
102 332 Did RHB, FMOH, USAID/SIAPS give on job mentoring on APTS for
pharmacy and finance staffs
103
333
Performance evaluations: Does the human resource section uses the
information produced from APTS monthly service report for performance
evaluation concerning:
a. Volumes of job done by each staff working in the pharmacy
b. Quality of job done by each staffs working in the pharmacy
400 Reliable Information (Service/Performance, Product and Financial
Values of Medicines Transacted)
104 401 Does the pharmacy produce monthly service report
105 402 If yes to Q. No 401 is yes; does the pharmacy produce monthly service report
both in soft and hard copy
106 403 Does the pharmacy produce monthly service report only in hard copy
107 404 Does the pharmacy produce monthly financial report
108 405 If the answer to Q. No 404 is yes, does the pharmacy produce monthly
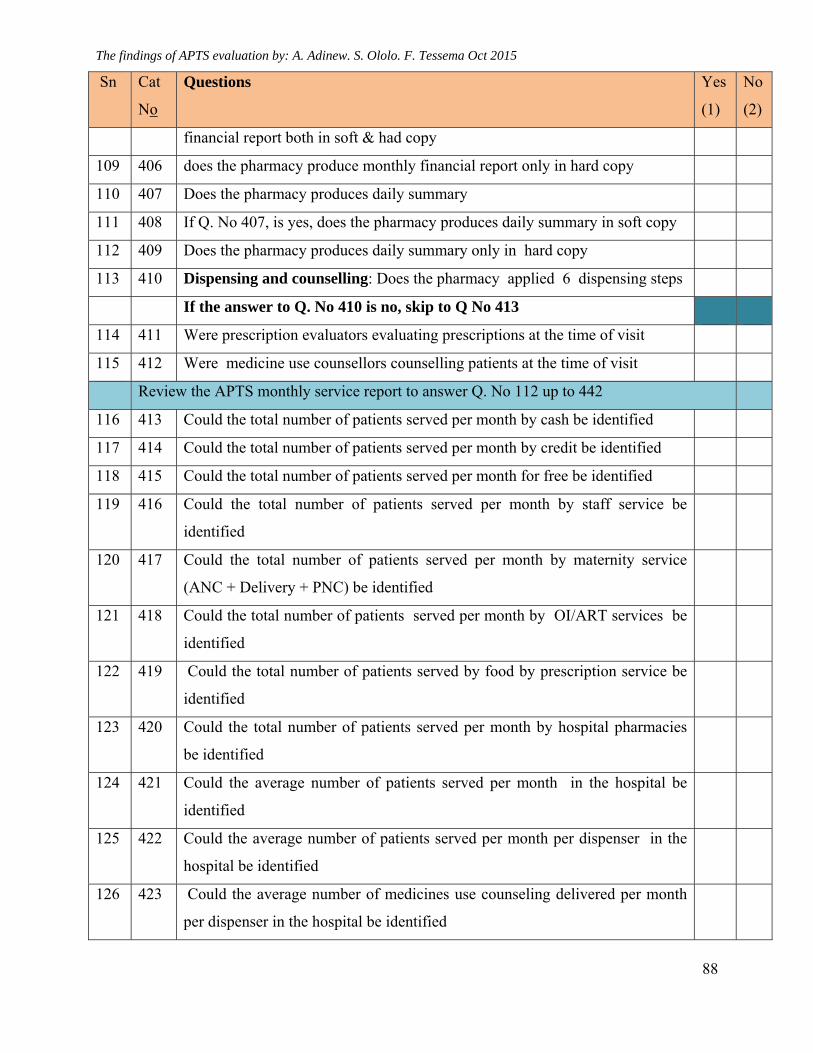
The findings of APTS evaluation by: A. Adinew. S. Ololo. F. Tessema Oct 2015
88
Sn Cat
No
Questions Yes
(1)
No
(2)
financial report both in soft & had copy
109 406 does the pharmacy produce monthly financial report only in hard copy
110 407 Does the pharmacy produces daily summary
111 408 If Q. No 407, is yes, does the pharmacy produces daily summary in soft copy
112 409 Does the pharmacy produces daily summary only in hard copy
113 410 Dispensing and counselling: Does the pharmacy applied 6 dispensing steps
If the answer to Q. No 410 is no, skip to Q No 413
114 411 Were prescription evaluators evaluating prescriptions at the time of visit
115 412 Were medicine use counsellors counselling patients at the time of visit
Review the APTS monthly service report to answer Q. No 112 up to 442
116 413 Could the total number of patients served per month by cash be identified
117 414 Could the total number of patients served per month by credit be identified
118 415 Could the total number of patients served per month for free be identified
119 416 Could the total number of patients served per month by staff service be
identified
120 417 Could the total number of patients served per month by maternity service
(ANC + Delivery + PNC) be identified
121 418 Could the total number of patients served per month by OI/ART services be
identified
122 419 Could the total number of patients served by food by prescription service be
identified
123 420 Could the total number of patients served per month by hospital pharmacies
be identified
124 421 Could the average number of patients served per month in the hospital be
identified
125 422 Could the average number of patients served per month per dispenser in the
hospital be identified
126 423 Could the average number of medicines use counseling delivered per month
per dispenser in the hospital be identified
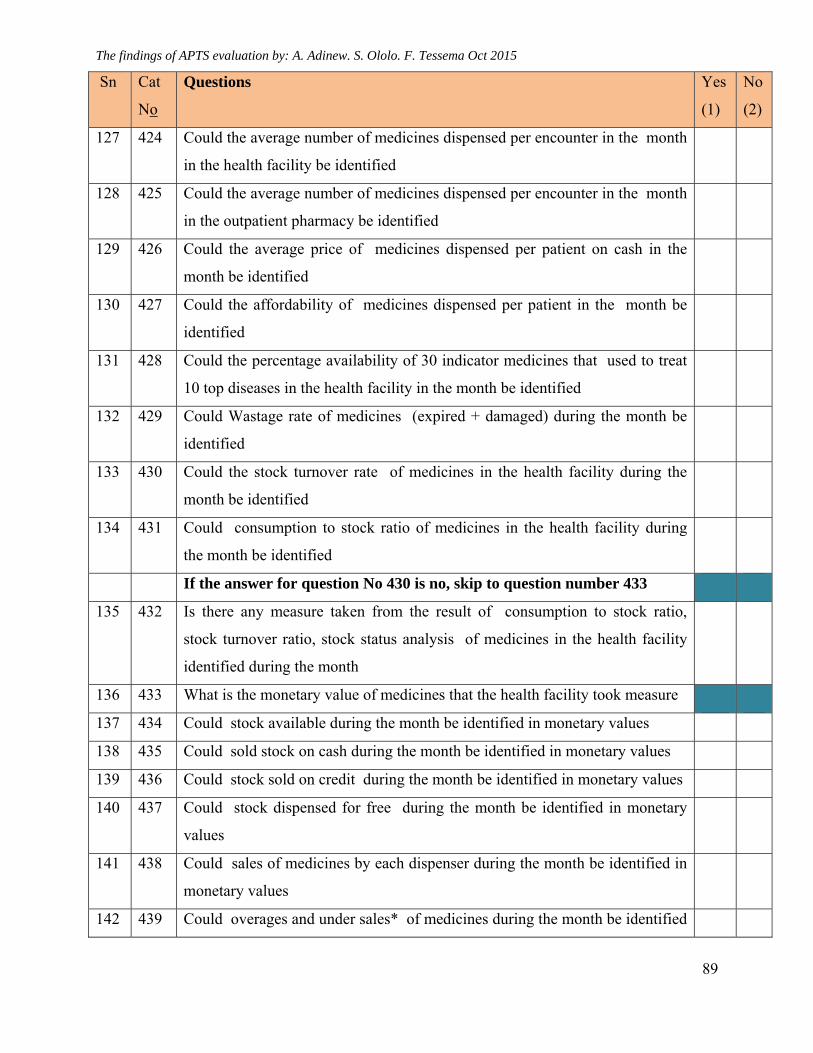
The findings of APTS evaluation by: A. Adinew. S. Ololo. F. Tessema Oct 2015
89
Sn Cat
No
Questions Yes
(1)
No
(2)
127 424 Could the average number of medicines dispensed per encounter in the month
in the health facility be identified
128 425 Could the average number of medicines dispensed per encounter in the month
in the outpatient pharmacy be identified
129 426 Could the average price of medicines dispensed per patient on cash in the
month be identified
130 427 Could the affordability of medicines dispensed per patient in the month be
identified
131 428 Could the percentage availability of 30 indicator medicines that used to treat
10 top diseases in the health facility in the month be identified
132 429 Could Wastage rate of medicines (expired + damaged) during the month be
identified
133 430 Could the stock turnover rate of medicines in the health facility during the
month be identified
134 431 Could consumption to stock ratio of medicines in the health facility during
the month be identified
If the answer for question No 430 is no, skip to question number 433
135 432 Is there any measure taken from the result of consumption to stock ratio,
stock turnover ratio, stock status analysis of medicines in the health facility
identified during the month
136 433 What is the monetary value of medicines that the health facility took measure
137 434 Could stock available during the month be identified in monetary values
138 435 Could sold stock on cash during the month be identified in monetary values
139 436 Could stock sold on credit during the month be identified in monetary values
140 437 Could stock dispensed for free during the month be identified in monetary
values
141 438 Could sales of medicines by each dispenser during the month be identified in
monetary values
142 439 Could overages and under sales* of medicines during the month be identified
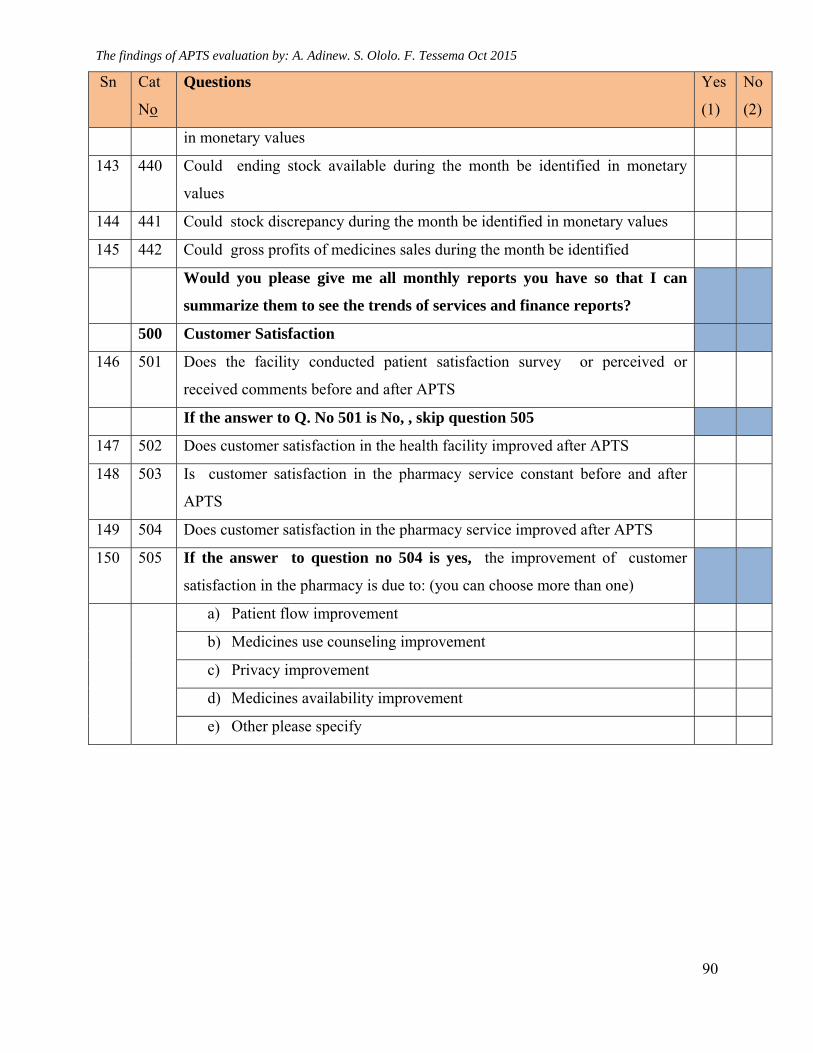
The findings of APTS evaluation by: A. Adinew. S. Ololo. F. Tessema Oct 2015
90
Sn Cat
No
Questions Yes
(1)
No
(2)
in monetary values
143 440 Could ending stock available during the month be identified in monetary
values
144 441 Could stock discrepancy during the month be identified in monetary values
145 442 Could gross profits of medicines sales during the month be identified
Would you please give me all monthly reports you have so that I can
summarize them to see the trends of services and finance reports?
500 Customer Satisfaction
146 501 Does the facility conducted patient satisfaction survey or perceived or
received comments before and after APTS
If the answer to Q. No 501 is No, , skip question 505
147 502 Does customer satisfaction in the health facility improved after APTS
148 503 Is customer satisfaction in the pharmacy service constant before and after
APTS
149 504 Does customer satisfaction in the pharmacy service improved after APTS
150 505 If the answer to question no 504 is yes, the improvement of customer
satisfaction in the pharmacy is due to: (you can choose more than one)
a) Patient flow improvement
b) Medicines use counseling improvement
c) Privacy improvement
d) Medicines availability improvement
e) Other please specify
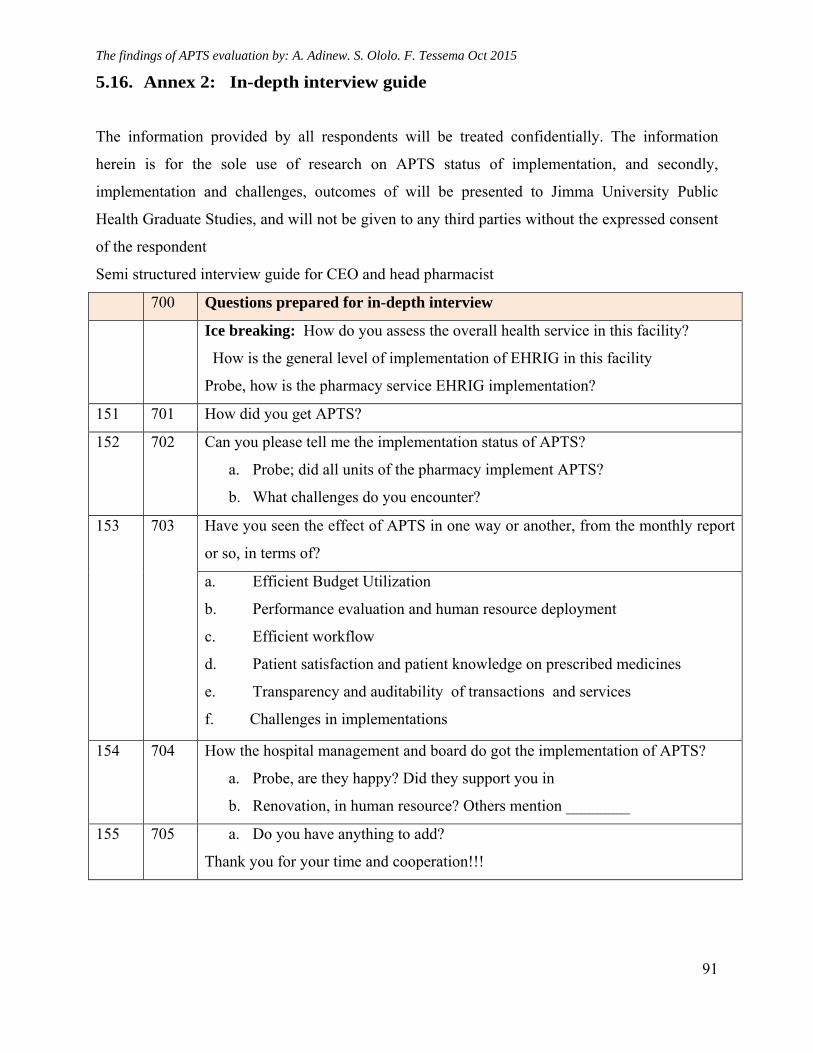
The findings of APTS evaluation by: A. Adinew. S. Ololo. F. Tessema Oct 2015
91
5.16. Annex 2: In-depth interview guide
The information provided by all respondents will be treated confidentially. The information
herein is for the sole use of research on APTS status of implementation, and secondly,
implementation and challenges, outcomes of will be presented to Jimma University Public
Health Graduate Studies, and will not be given to any third parties without the expressed consent
of the respondent
Semi structured interview guide for CEO and head pharmacist
700 Questions prepared for in-depth interview
Ice breaking: How do you assess the overall health service in this facility?
How is the general level of implementation of EHRIG in this facility
Probe, how is the pharmacy service EHRIG implementation?
151 701 How did you get APTS?
152 702 Can you please tell me the implementation status of APTS?
a. Probe; did all units of the pharmacy implement APTS?
b. What challenges do you encounter?
153 703 Have you seen the effect of APTS in one way or another, from the monthly report
or so, in terms of?
a. Efficient Budget Utilization
b. Performance evaluation and human resource deployment
c. Efficient workflow
d. Patient satisfaction and patient knowledge on prescribed medicines
e. Transparency and auditability of transactions and services
f. Challenges in implementations
154 704 How the hospital management and board do got the implementation of APTS?
a. Probe, are they happy? Did they support you in
b. Renovation, in human resource? Others mention ________
155 705 a. Do you have anything to add?
Thank you for your time and cooperation!!!
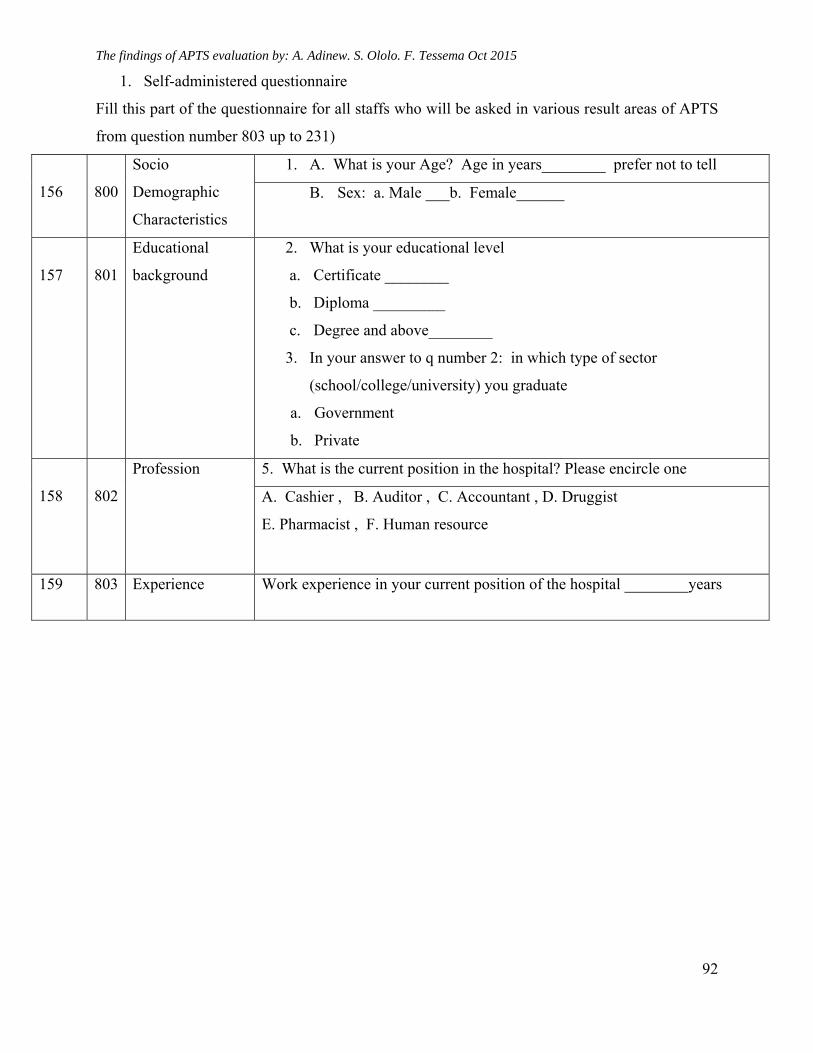
The findings of APTS evaluation by: A. Adinew. S. Ololo. F. Tessema Oct 2015
92
1. Self-administered questionnaire
Fill this part of the questionnaire for all staffs who will be asked in various result areas of APTS
from question number 803 up to 231)
156
800
Socio
Demographic
Characteristics
1. A. What is your Age? Age in years________ prefer not to tell
B. Sex: a. Male ___b. Female______
157
801
Educational
background
2. What is your educational level
a. Certificate ________
b. Diploma _________
c. Degree and above________
3. In your answer to q number 2: in which type of sector
(school/college/university) you graduate
a. Government
b. Private
158
802
Profession
5. What is the current position in the hospital? Please encircle one
A. Cashier , B. Auditor , C. Accountant , D. Druggist
E. Pharmacist , F. Human resource
159 803 Experience Work experience in your current position of the hospital ________years
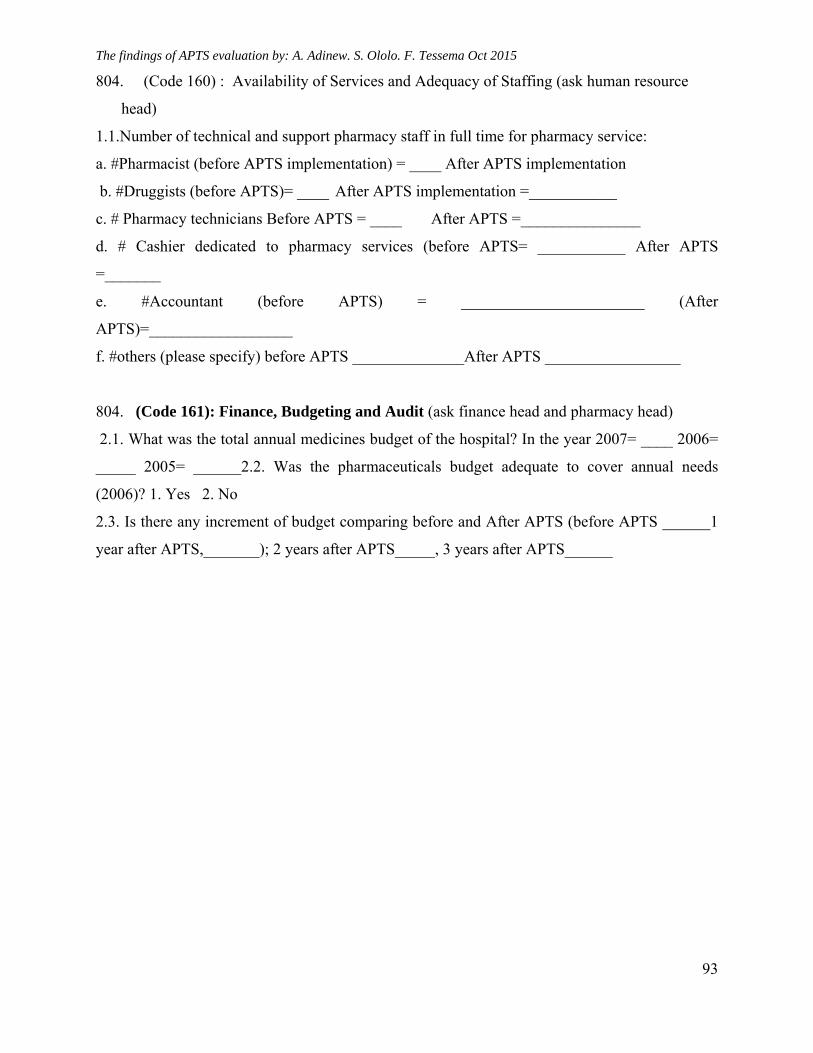
The findings of APTS evaluation by: A. Adinew. S. Ololo. F. Tessema Oct 2015
93
804. (Code 160) : Availability of Services and Adequacy of Staffing (ask human resource
head)
1.1.Number of technical and support pharmacy staff in full time for pharmacy service:
a. #Pharmacist (before APTS implementation) = ____ After APTS implementation
b. #Druggists (before APTS)= ____ After APTS implementation =___________
c. # Pharmacy technicians Before APTS = ____ After APTS =_______________
d. # Cashier dedicated to pharmacy services (before APTS= ___________ After APTS
=_______
e. #Accountant (before APTS) = _______________________ (After
APTS)=__________________
f. #others (please specify) before APTS ______________After APTS _________________
804. (Code 161): Finance, Budgeting and Audit (ask finance head and pharmacy head)
2.1. What was the total annual medicines budget of the hospital? In the year 2007= ____ 2006=
_____ 2005= ______2.2. Was the pharmaceuticals budget adequate to cover annual needs
(2006)? 1. Yes 2. No
2.3. Is there any increment of budget comparing before and After APTS (before APTS ______1
year after APTS,_______); 2 years after APTS_____, 3 years after APTS______
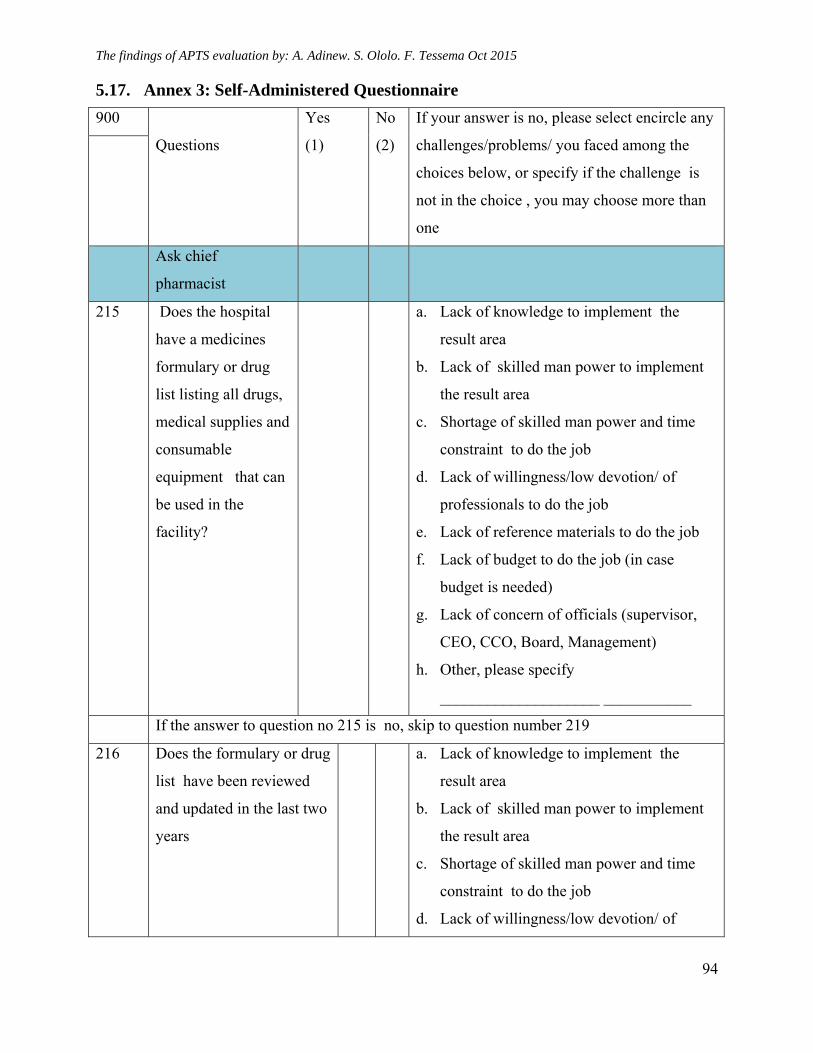
The findings of APTS evaluation by: A. Adinew. S. Ololo. F. Tessema Oct 2015
94
5.17. Annex 3: Self-Administered Questionnaire
900
Questions
Yes
(1)
No
(2)
If your answer is no, please select encircle any
challenges/problems/ you faced among the
choices below, or specify if the challenge is
not in the choice , you may choose more than
one
Ask chief
pharmacist
215 Does the hospital
have a medicines
formulary or drug
list listing all drugs,
medical supplies and
consumable
equipment that can
be used in the
facility?
a. Lack of knowledge to implement the
result area
b. Lack of skilled man power to implement
the result area
c. Shortage of skilled man power and time
constraint to do the job
d. Lack of willingness/low devotion/ of
professionals to do the job
e. Lack of reference materials to do the job
f. Lack of budget to do the job (in case
budget is needed)
g. Lack of concern of officials (supervisor,
CEO, CCO, Board, Management)
h. Other, please specify
____________________ ___________
If the answer to question no 215 is no, skip to question number 219
216 Does the formulary or drug
list have been reviewed
and updated in the last two
years
a. Lack of knowledge to implement the
result area
b. Lack of skilled man power to implement
the result area
c. Shortage of skilled man power and time
constraint to do the job
d. Lack of willingness/low devotion/ of
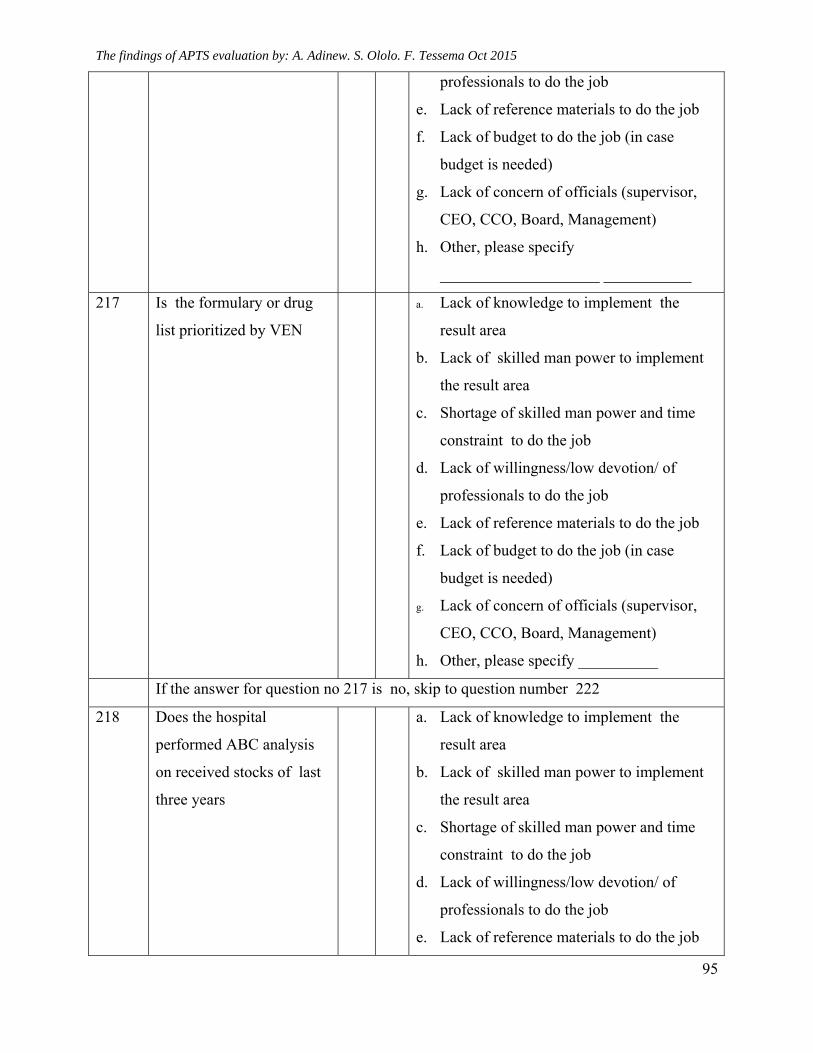
The findings of APTS evaluation by: A. Adinew. S. Ololo. F. Tessema Oct 2015
95
professionals to do the job
e. Lack of reference materials to do the job
f. Lack of budget to do the job (in case
budget is needed)
g. Lack of concern of officials (supervisor,
CEO, CCO, Board, Management)
h. Other, please specify
____________________ ___________
217 Is the formulary or drug
list prioritized by VEN
a. Lack of knowledge to implement the
result area
b. Lack of skilled man power to implement
the result area
c. Shortage of skilled man power and time
constraint to do the job
d. Lack of willingness/low devotion/ of
professionals to do the job
e. Lack of reference materials to do the job
f. Lack of budget to do the job (in case
budget is needed)
g. Lack of concern of officials (supervisor,
CEO, CCO, Board, Management)
h. Other, please specify __________
If the answer for question no 217 is no, skip to question number 222
218 Does the hospital
performed ABC analysis
on received stocks of last
three years
a. Lack of knowledge to implement the
result area
b. Lack of skilled man power to implement
the result area
c. Shortage of skilled man power and time
constraint to do the job
d. Lack of willingness/low devotion/ of
professionals to do the job
e. Lack of reference materials to do the job
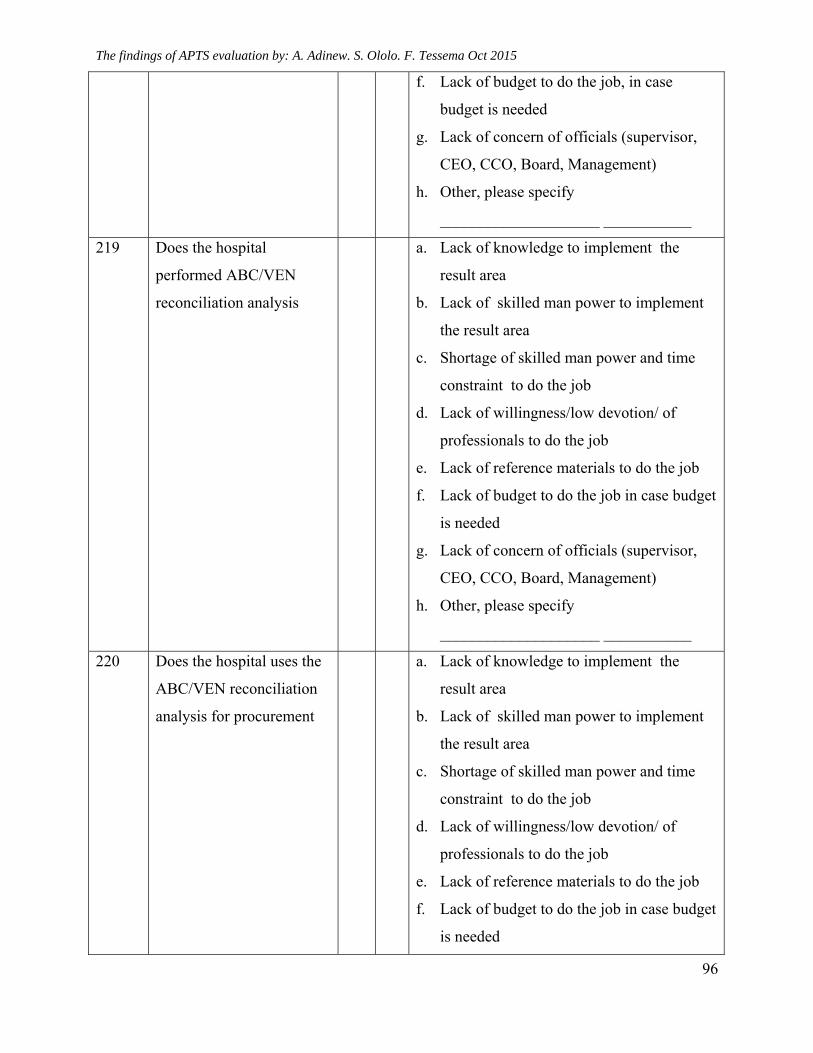
The findings of APTS evaluation by: A. Adinew. S. Ololo. F. Tessema Oct 2015
96
f. Lack of budget to do the job, in case
budget is needed
g. Lack of concern of officials (supervisor,
CEO, CCO, Board, Management)
h. Other, please specify
____________________ ___________
219 Does the hospital
performed ABC/VEN
reconciliation analysis
a. Lack of knowledge to implement the
result area
b. Lack of skilled man power to implement
the result area
c. Shortage of skilled man power and time
constraint to do the job
d. Lack of willingness/low devotion/ of
professionals to do the job
e. Lack of reference materials to do the job
f. Lack of budget to do the job in case budget
is needed
g. Lack of concern of officials (supervisor,
CEO, CCO, Board, Management)
h. Other, please specify
____________________ ___________
220 Does the hospital uses the
ABC/VEN reconciliation
analysis for procurement
a. Lack of knowledge to implement the
result area
b. Lack of skilled man power to implement
the result area
c. Shortage of skilled man power and time
constraint to do the job
d. Lack of willingness/low devotion/ of
professionals to do the job
e. Lack of reference materials to do the job
f. Lack of budget to do the job in case budget
is needed
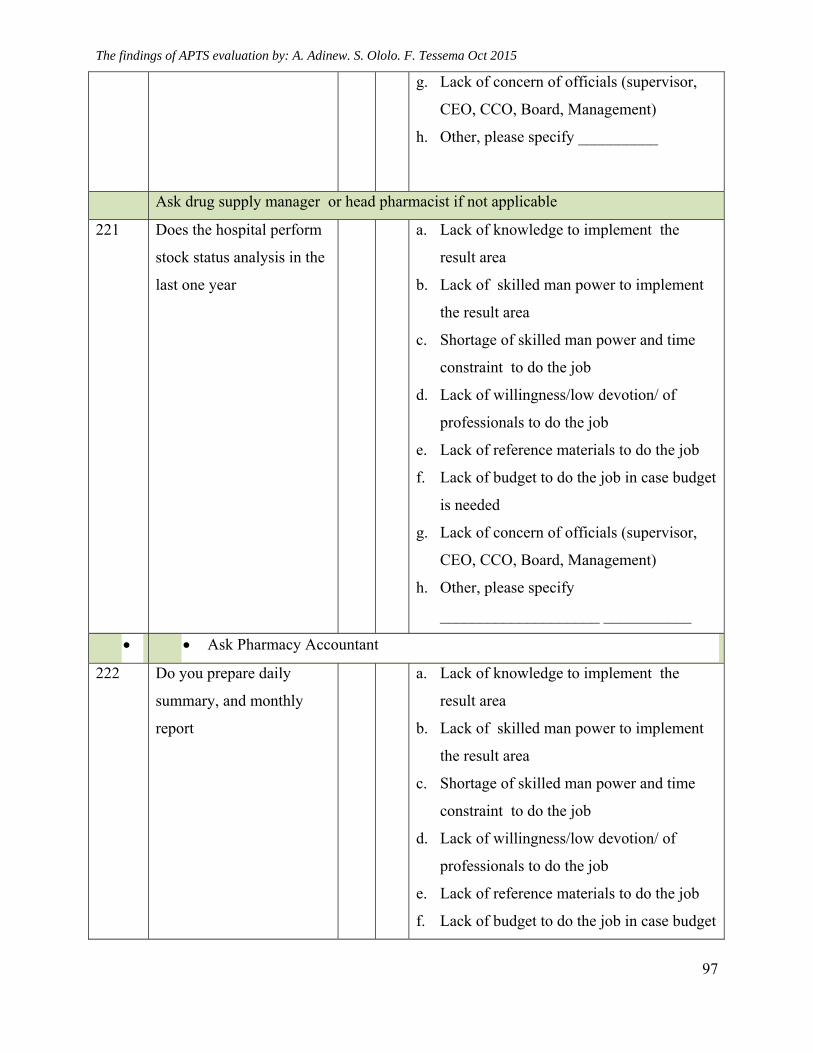
The findings of APTS evaluation by: A. Adinew. S. Ololo. F. Tessema Oct 2015
97
g. Lack of concern of officials (supervisor,
CEO, CCO, Board, Management)
h. Other, please specify __________
Ask drug supply manager or head pharmacist if not applicable
221 Does the hospital perform
stock status analysis in the
last one year
a. Lack of knowledge to implement the
result area
b. Lack of skilled man power to implement
the result area
c. Shortage of skilled man power and time
constraint to do the job
d. Lack of willingness/low devotion/ of
professionals to do the job
e. Lack of reference materials to do the job
f. Lack of budget to do the job in case budget
is needed
g. Lack of concern of officials (supervisor,
CEO, CCO, Board, Management)
h. Other, please specify
____________________ ___________
Ask Pharmacy Accountant
222 Do you prepare daily
summary, and monthly
report
a. Lack of knowledge to implement the
result area
b. Lack of skilled man power to implement
the result area
c. Shortage of skilled man power and time
constraint to do the job
d. Lack of willingness/low devotion/ of
professionals to do the job
e. Lack of reference materials to do the job
f. Lack of budget to do the job in case budget
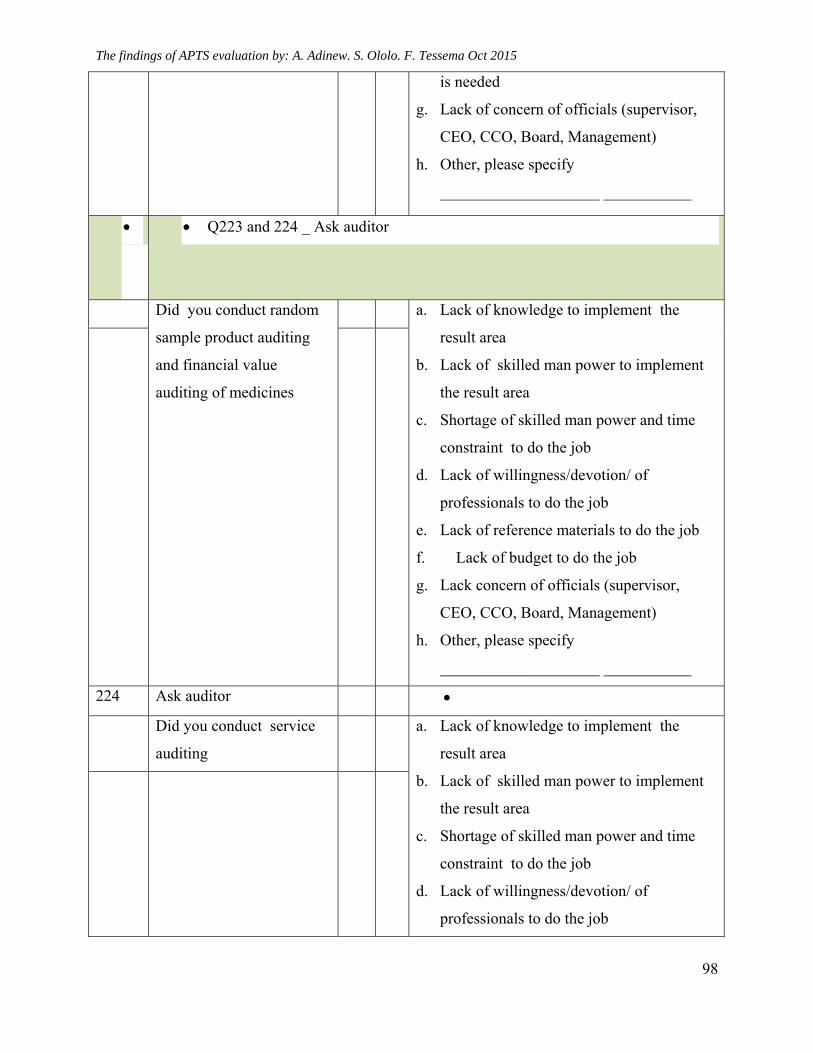
The findings of APTS evaluation by: A. Adinew. S. Ololo. F. Tessema Oct 2015
98
is needed
g. Lack of concern of officials (supervisor,
CEO, CCO, Board, Management)
h. Other, please specify
____________________ ___________
2
2
Q223 and 224 _ Ask auditor
Did you conduct random
sample product auditing
and financial value
auditing of medicines
a. Lack of knowledge to implement the
result area
b. Lack of skilled man power to implement
the result area
c. Shortage of skilled man power and time
constraint to do the job
d. Lack of willingness/devotion/ of
professionals to do the job
e. Lack of reference materials to do the job
f. Lack of budget to do the job
g. Lack concern of officials (supervisor,
CEO, CCO, Board, Management)
h. Other, please specify
____________________ ___________
224 Ask auditor
Did you conduct service
auditing
a. Lack of knowledge to implement the
result area
b. Lack of skilled man power to implement
the result area
c. Shortage of skilled man power and time
constraint to do the job
d. Lack of willingness/devotion/ of
professionals to do the job
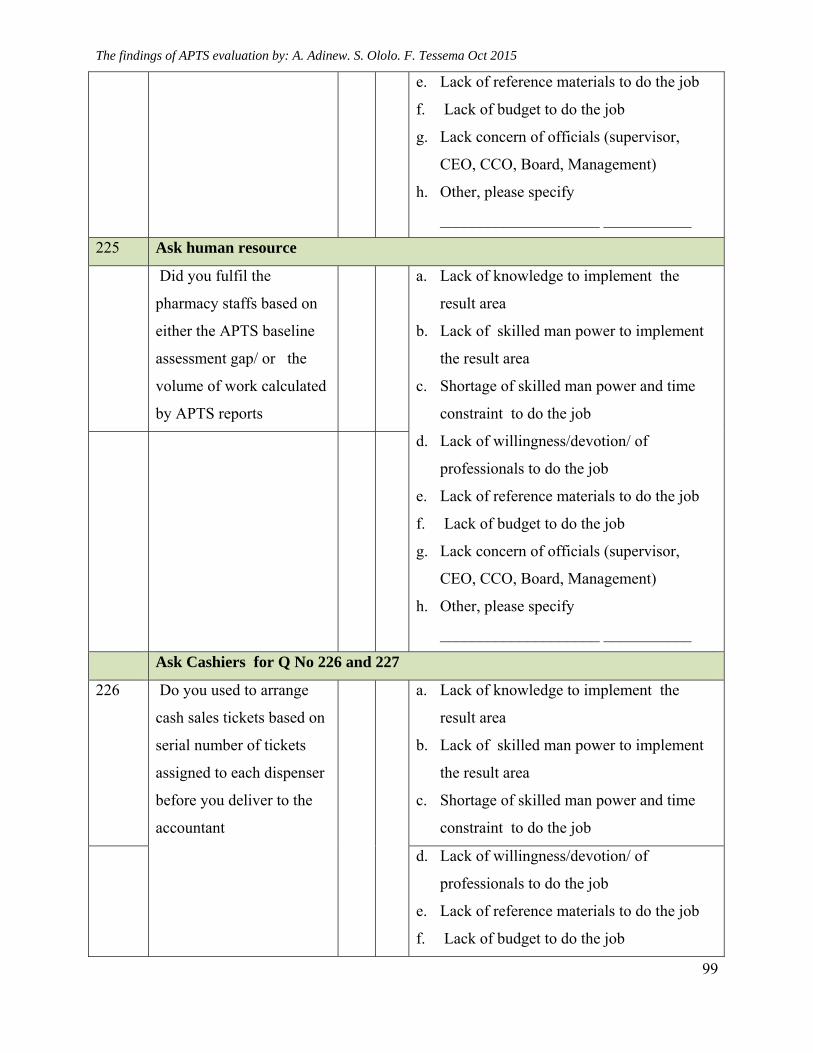
The findings of APTS evaluation by: A. Adinew. S. Ololo. F. Tessema Oct 2015
99
e. Lack of reference materials to do the job
f. Lack of budget to do the job
g. Lack concern of officials (supervisor,
CEO, CCO, Board, Management)
h. Other, please specify
____________________ ___________
225 Ask human resource
Did you fulfil the
pharmacy staffs based on
either the APTS baseline
assessment gap/ or the
volume of work calculated
by APTS reports
a. Lack of knowledge to implement the
result area
b. Lack of skilled man power to implement
the result area
c. Shortage of skilled man power and time
constraint to do the job
d. Lack of willingness/devotion/ of
professionals to do the job
e. Lack of reference materials to do the job
f. Lack of budget to do the job
g. Lack concern of officials (supervisor,
CEO, CCO, Board, Management)
h. Other, please specify
____________________ ___________
Ask Cashiers for Q No 226 and 227
226 Do you used to arrange
cash sales tickets based on
serial number of tickets
assigned to each dispenser
before you deliver to the
accountant
a. Lack of knowledge to implement the
result area
b. Lack of skilled man power to implement
the result area
c. Shortage of skilled man power and time
constraint to do the job
d. Lack of willingness/devotion/ of
professionals to do the job
e. Lack of reference materials to do the job
f. Lack of budget to do the job
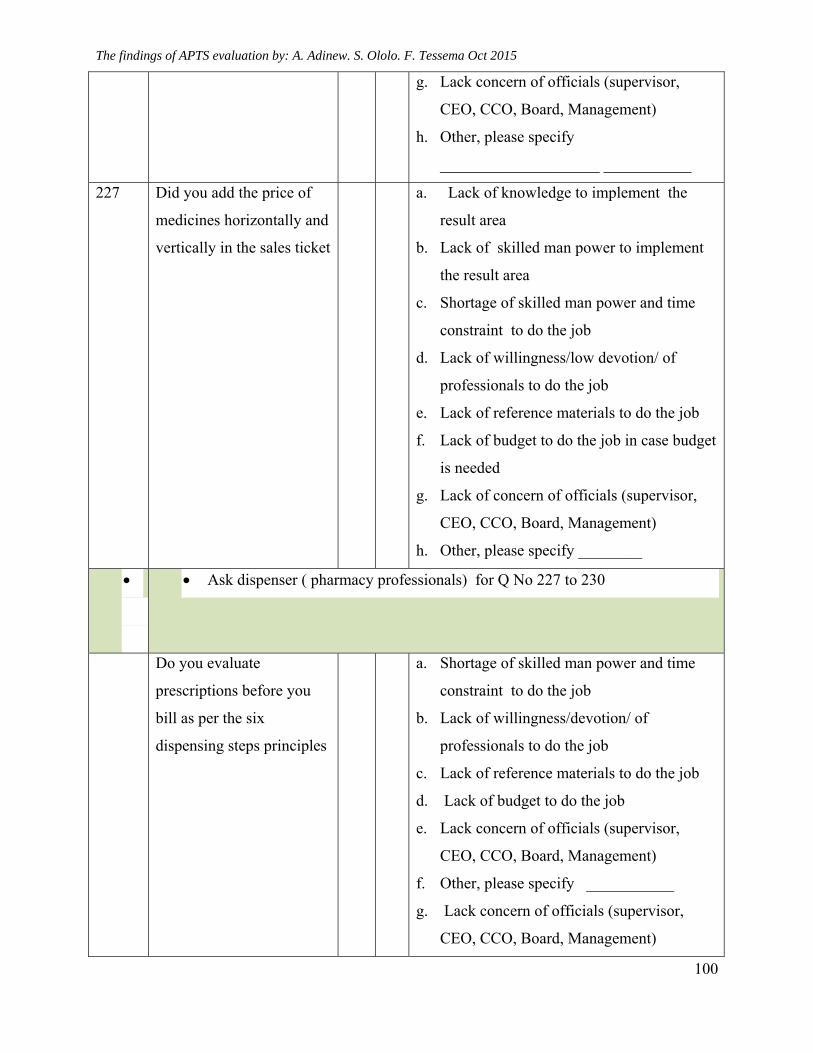
The findings of APTS evaluation by: A. Adinew. S. Ololo. F. Tessema Oct 2015
100
g. Lack concern of officials (supervisor,
CEO, CCO, Board, Management)
h. Other, please specify
____________________ ___________
227 Did you add the price of
medicines horizontally and
vertically in the sales ticket
a. Lack of knowledge to implement the
result area
b. Lack of skilled man power to implement
the result area
c. Shortage of skilled man power and time
constraint to do the job
d. Lack of willingness/low devotion/ of
professionals to do the job
e. Lack of reference materials to do the job
f. Lack of budget to do the job in case budget
is needed
g. Lack of concern of officials (supervisor,
CEO, CCO, Board, Management)
h. Other, please specify ________
2
2
Ask dispenser ( pharmacy professionals) for Q No 227 to 230
Do you evaluate
prescriptions before you
bill as per the six
dispensing steps principles
a. Shortage of skilled man power and time
constraint to do the job
b. Lack of willingness/devotion/ of
professionals to do the job
c. Lack of reference materials to do the job
d. Lack of budget to do the job
e. Lack concern of officials (supervisor,
CEO, CCO, Board, Management)
f. Other, please specify ___________
g. Lack concern of officials (supervisor,
CEO, CCO, Board, Management)
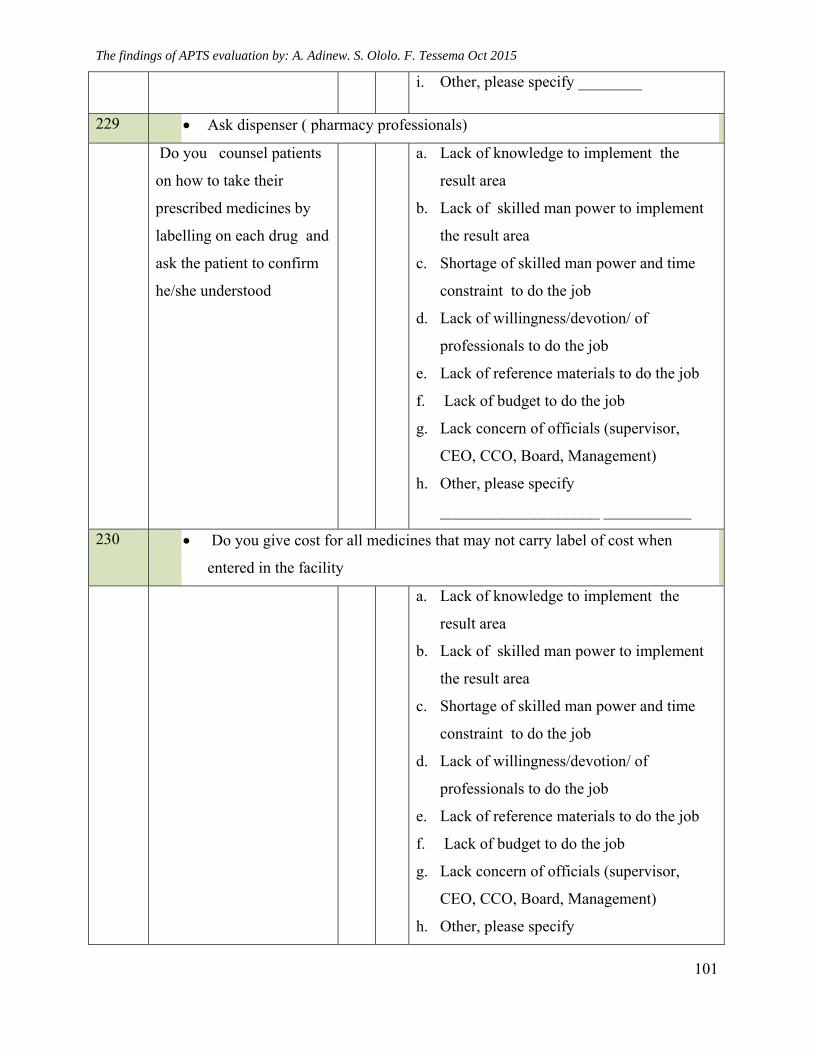
The findings of APTS evaluation by: A. Adinew. S. Ololo. F. Tessema Oct 2015
101
i. Other, please specify ________
229 Ask dispenser ( pharmacy professionals)
Do you counsel patients
on how to take their
prescribed medicines by
labelling on each drug and
ask the patient to confirm
he/she understood
a. Lack of knowledge to implement the
result area
b. Lack of skilled man power to implement
the result area
c. Shortage of skilled man power and time
constraint to do the job
d. Lack of willingness/devotion/ of
professionals to do the job
e. Lack of reference materials to do the job
f. Lack of budget to do the job
g. Lack concern of officials (supervisor,
CEO, CCO, Board, Management)
h. Other, please specify
____________________ ___________
230 Do you give cost for all medicines that may not carry label of cost when
entered in the facility
a. Lack of knowledge to implement the
result area
b. Lack of skilled man power to implement
the result area
c. Shortage of skilled man power and time
constraint to do the job
d. Lack of willingness/devotion/ of
professionals to do the job
e. Lack of reference materials to do the job
f. Lack of budget to do the job
g. Lack concern of officials (supervisor,
CEO, CCO, Board, Management)
h. Other, please specify
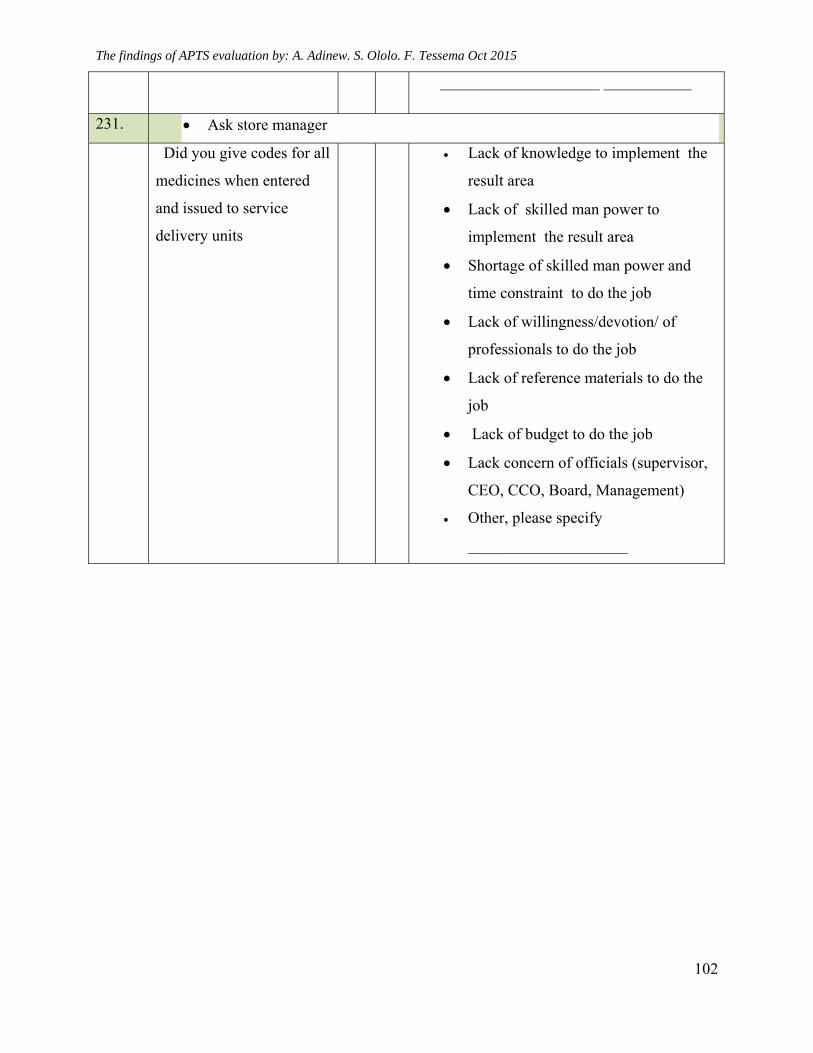
The findings of APTS evaluation by: A. Adinew. S. Ololo. F. Tessema Oct 2015
102
____________________ ___________
231. Ask store manager
Did you give codes for all
medicines when entered
and issued to service
delivery units
Lack of knowledge to implement the
result area
Lack of skilled man power to
implement the result area
Shortage of skilled man power and
time constraint to do the job
Lack of willingness/devotion/ of
professionals to do the job
Lack of reference materials to do the
job
Lack of budget to do the job
Lack concern of officials (supervisor,
CEO, CCO, Board, Management)
Other, please specify
____________________
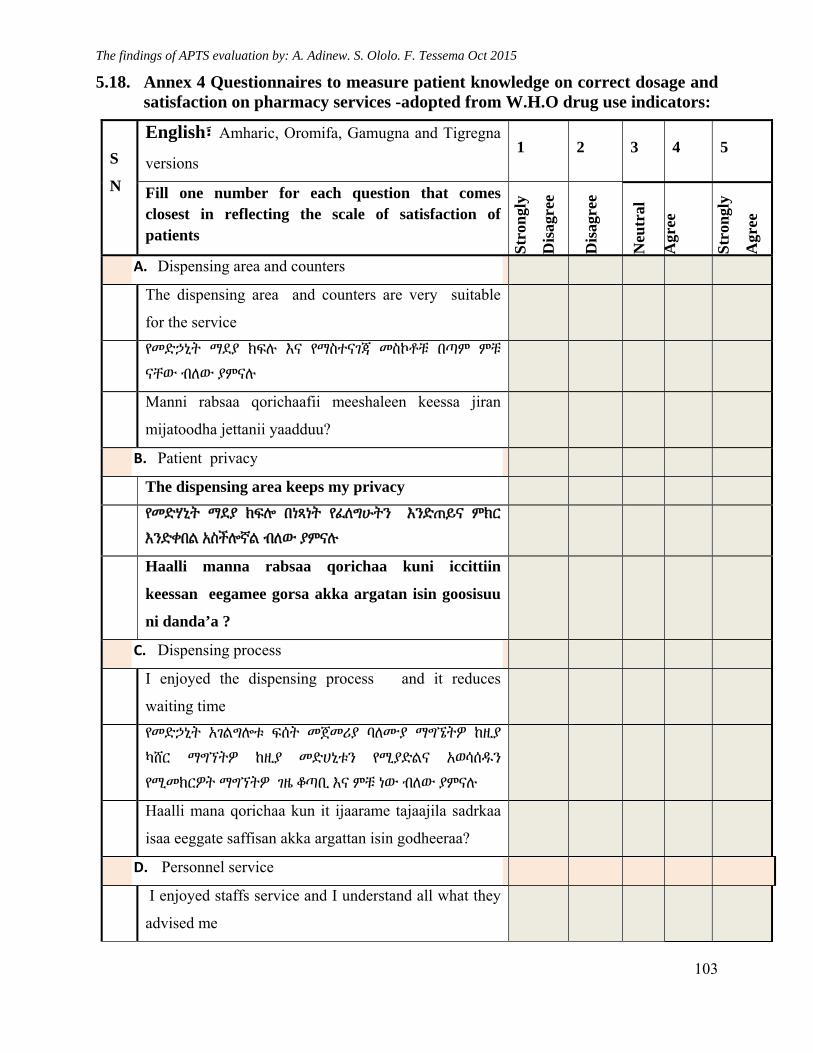
The findings of APTS evaluation by: A. Adinew. S. Ololo. F. Tessema Oct 2015
103
5.18. Annex 4 Questionnaires to measure patient knowledge on correct dosage and satisfaction on pharmacy services -adopted from W.H.O drug use indicators:
S
N
English፣ Amharic, Oromifa, Gamugna and Tigregna
versions 1 2 3 4 5
Fill one number for each question that comes closest in reflecting the scale of satisfaction of patients
Str
ongl
y
Dis
agre
e
Dis
agre
e
Neu
tral
Agr
ee
Str
ongl
y
Agr
ee
A. Dispensing area and counters
The dispensing area and counters are very suitable
for the service
የመድኃኒት ማደያ ክፍሉ እና የማስተናገጃ መስኮቶቹ በጣም ምቹ
ናቸው ብለው ያምናሉ
Manni rabsaa qorichaafii meeshaleen keessa jiran
mijatoodha jettanii yaadduu?
B. Patient privacy
The dispensing area keeps my privacy
የመድሃኒት ማደያ ክፍሎ በነጻነት የፈለግሁትን እንድጠይና ምክር
እንድቀበል አስችሎኛል ብለው ያምናሉ
Haalli manna rabsaa qorichaa kuni iccittiin
keessan eegamee gorsa akka argatan isin goosisuu
ni danda’a ?
C. Dispensing process
I enjoyed the dispensing process and it reduces
waiting time
የመድኃኒት አገልግሎቱ ፍሰት መጀመሪያ ባለሙያ ማግኜትዎ ከዚያ
ካሸር ማግኘትዎ ከዚያ መድሀኒቱን የሚያድልና አወሳሰዱን
የሚመክርዎት ማግኘትዎ ገዜ ቆጣቢ እና ምቹ ነው ብለው ያምናሉ
Haalli mana qorichaa kun it ijaarame tajaajila sadrkaa
isaa eeggate saffisan akka argattan isin godheeraa?
D. Personnel service
I enjoyed staffs service and I understand all what they
advised me
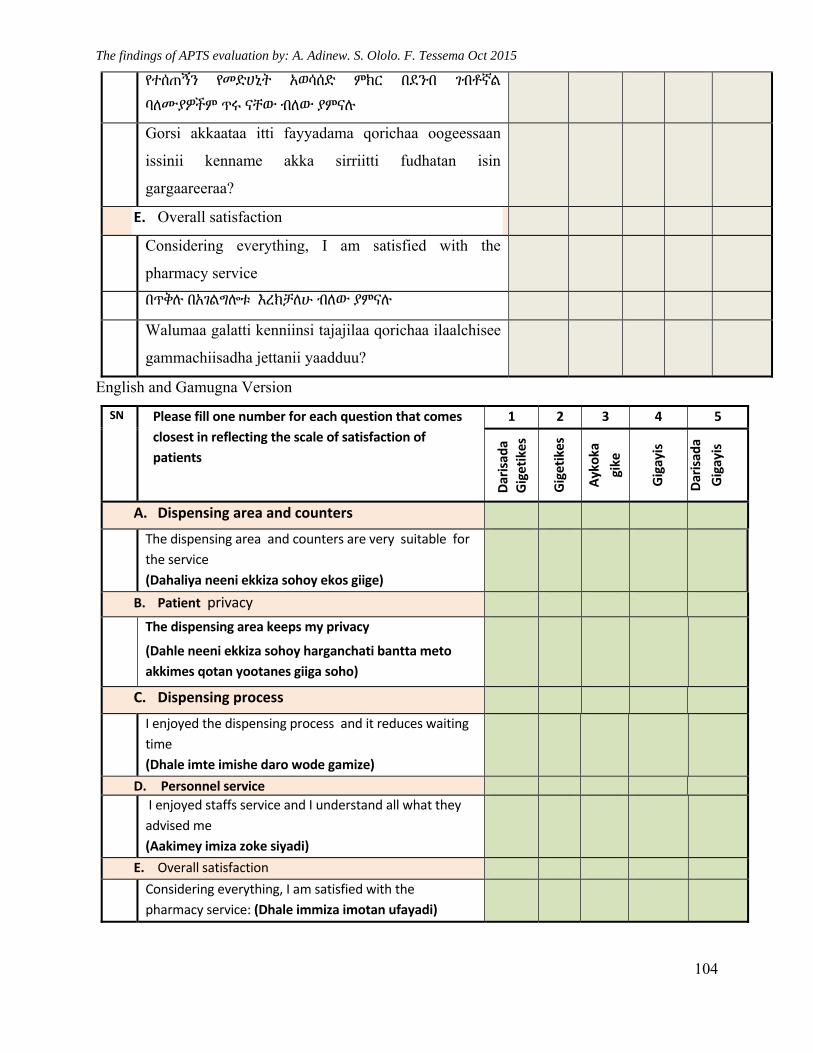
The findings of APTS evaluation by: A. Adinew. S. Ololo. F. Tessema Oct 2015
104
የተሰጠኝን የመድሀኒት አወሳሰድ ምክር በደንብ ገብቶኛል
ባለሙያዎችም ጥሩ ናቸው ብለው ያምናሉ
Gorsi akkaataa itti fayyadama qorichaa oogeessaan
issinii kenname akka sirriitti fudhatan isin
gargaareeraa?
E. Overall satisfaction
Considering everything, I am satisfied with the
pharmacy service
በጥቅሉ በአገልግሎቱ እረክቻለሁ ብለው ያምናሉ
Walumaa galatti kenniinsi tajajilaa qorichaa ilaalchisee
gammachiisadha jettanii yaadduu?
English and Gamugna Version
SN Please fill one number for each question that comes
closest in reflecting the scale of satisfaction of
patients
1 2 3 4 5
Darisad
a
Gigetikes
Gigetikes
Aykoka
gike
Gigayis
Darisad
a
Gigayis
A. Dispensing area and counters
The dispensing area and counters are very suitable for
the service
(Dahaliya neeni ekkiza sohoy ekos giige)
B. Patient privacy
The dispensing area keeps my privacy
(Dahle neeni ekkiza sohoy harganchati bantta meto
akkimes qotan yootanes giiga soho)
C. Dispensing process
I enjoyed the dispensing process and it reduces waiting
time
(Dhale imte imishe daro wode gamize)
D. Personnel service
I enjoyed staffs service and I understand all what they
advised me
(Aakimey imiza zoke siyadi)
E. Overall satisfaction
Considering everything, I am satisfied with the
pharmacy service: (Dhale immiza imotan ufayadi)
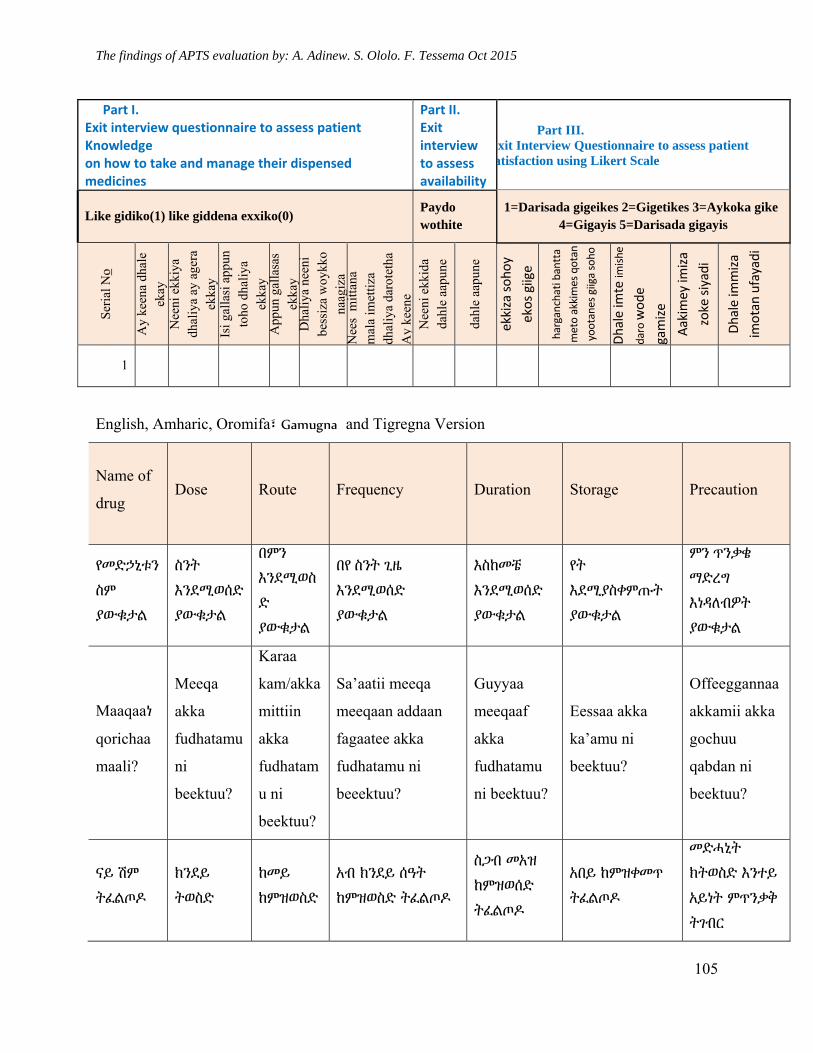
The findings of APTS evaluation by: A. Adinew. S. Ololo. F. Tessema Oct 2015
105
Part I. Exit interview questionnaire to assess patient Knowledge on how to take and manage their dispensed medicines
Part II. Exit interview to assess availability
Part III. Exit Interview Questionnaire to assess patient atisfaction using Likert Scale
Like gidiko(1) like giddena exxiko(0) Paydo wothite
1=Darisada gigeikes 2=Gigetikes 3=Aykoka gike 4=Gigayis 5=Darisada gigayis
Ser
ial N
o
Ay
keen
a dh
ale
ekay
N
eeni
ekk
iya
dhal
iya
ay a
gera
ek
kay
Isi g
alla
si a
ppun
to
ho d
haliy
a ek
kay
App
un g
alla
sas
ekka
y D
haliy
a ne
eni
bess
iza
woy
kko
naag
iza
Nee
s m
ittan
a m
ala
imet
tiza
dh
aliy
a da
rote
tha
Ay
keen
e N
eeni
ekk
ida
dahl
e aa
pune
dahl
e aa
pune
ekkiza sohoy
ekos giige
harganchati bantta
meto akkimes qotan
yootanes giiga soho
Dhale im
te im
ishe
daro wode
gamize
Aakimey im
iza
zoke siyadi
Dhale im
miza
imotan ufayadi
1
English, Amharic, Oromifa፣ Gamugna and Tigregna Version
Name of
drug Dose Route Frequency Duration Storage Precaution
የመድኃኒቱን
ስም
ያውቁታል
ስንት
እንደሚወሰድ
ያውቁታል
በምን
እንደሚወስ
ድ
ያውቁታል
በየ ስንት ጊዜ
እንደሚወሰድ
ያውቁታል
እስከመቼ
እንደሚወሰድ
ያውቁታል
የት
እደሚያስቀምጡት
ያውቁታል
ምን ጥንቃቄ
ማድረግ
እነዳለብዎት
ያውቁታል
Maaqaaነ
qorichaa
maali?
Meeqa
akka
fudhatamu
ni
beektuu?
Karaa
kam/akka
mittiin
akka
fudhatam
u ni
beektuu?
Sa’aatii meeqa
meeqaan addaan
fagaatee akka
fudhatamu ni
beeektuu?
Guyyaa
meeqaaf
akka
fudhatamu
ni beektuu?
Eessaa akka
ka’amu ni
beektuu?
Offeeggannaa
akkamii akka
gochuu
qabdan ni
beektuu?
ናይ ሽም
ትፈልጦዶ
ክንደይ
ትወስድ
ከመይ
ከምዝወስድ
አብ ክንደይ ሰዓት
ከምዝወስድ ትፈልጦዶ
ስጋብ መአዝ
ከምዝወሰድ
ትፈልጦዶ
አበይ ከምዝቀመጥ
ትፈልጦዶ
መድሓኒት
ክትወስድ እንተይ
አይነት ምጥንቃቅ
ትገብር
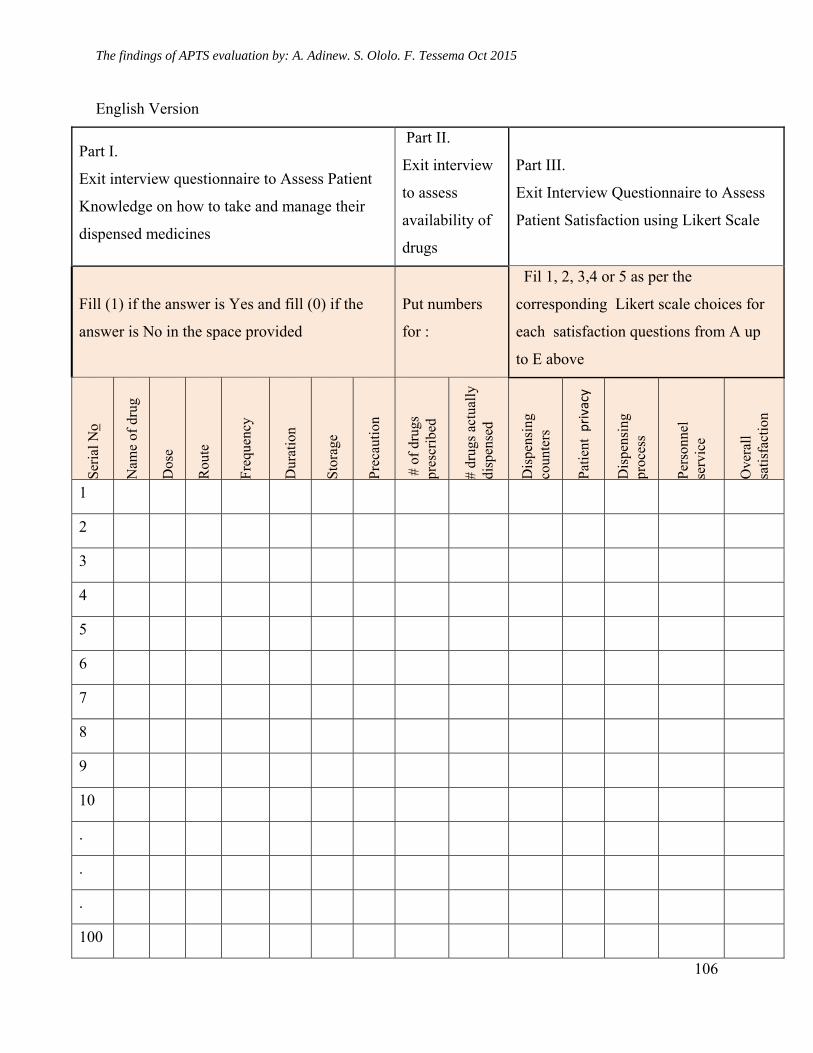
The findings of APTS evaluation by: A. Adinew. S. Ololo. F. Tessema Oct 2015
106
English Version
Part I.
Exit interview questionnaire to Assess Patient
Knowledge on how to take and manage their
dispensed medicines
Part II.
Exit interview
to assess
availability of
drugs
Part III.
Exit Interview Questionnaire to Assess
Patient Satisfaction using Likert Scale
Fill (1) if the answer is Yes and fill (0) if the
answer is No in the space provided
Put numbers
for :
Fil 1, 2, 3,4 or 5 as per the
corresponding Likert scale choices for
each satisfaction questions from A up
to E above
Ser
ial N
o
Nam
e of
dru
g
Dos
e
Rou
te
Fre
quen
cy
Dur
atio
n
Sto
rage
Pre
caut
ion
# o
f dr
ugs
pr
escr
ibed
# dr
ugs
actu
ally
di
spen
sed
Dis
pens
ing
coun
ters
Pat
ient
privacy
Dis
pens
ing
proc
ess
Per
sonn
el
serv
ice
Ove
rall
sa
tisf
acti
on
1
2
3
4
5
6
7
8
9
10
.
.
.
100
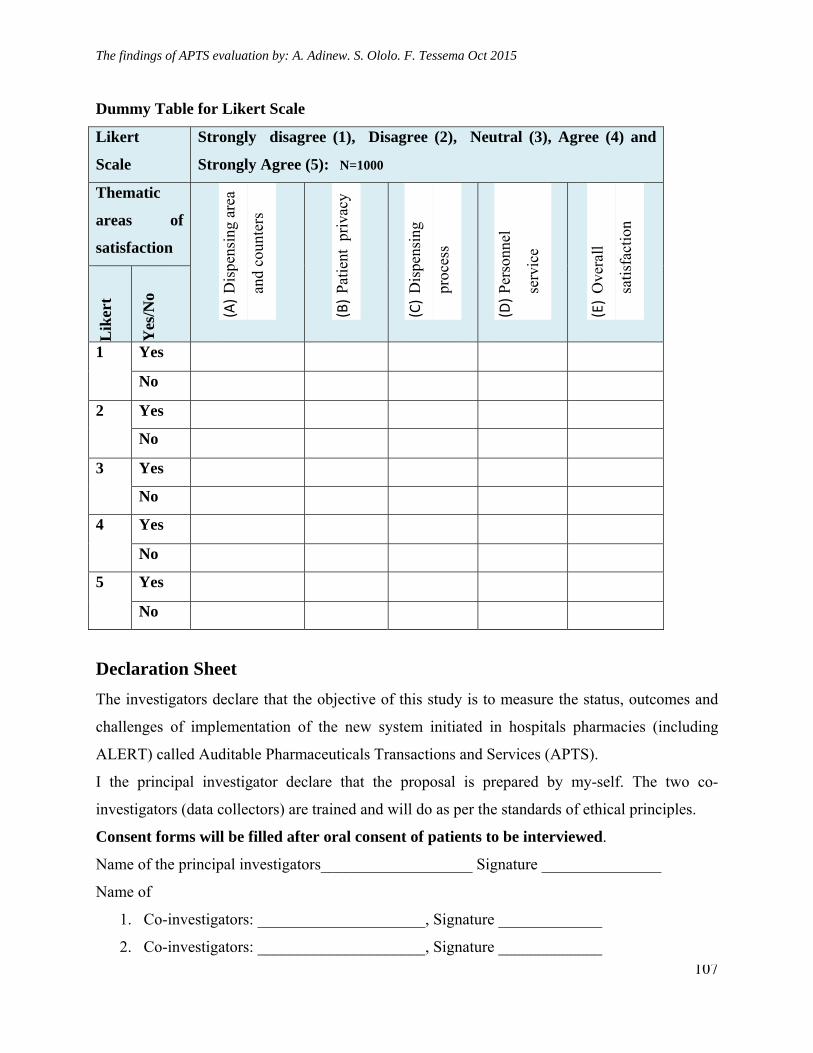
The findings of APTS evaluation by: A. Adinew. S. Ololo. F. Tessema Oct 2015
107
Dummy Table for Likert Scale
Likert
Scale
Strongly disagree (1), Disagree (2), Neutral (3), Agree (4) and
Strongly Agree (5): N=1000
Thematic
areas of
satisfaction (A)
Dis
pens
ing
area
and
coun
ters
(B)
Pat
ient
pri
vacy
(C)
Dis
pens
ing
proc
ess
(D)
Per
sonn
el
serv
ice
(E)
Ove
rall
sati
sfac
tion
Lik
ert
Yes
/No
1 Yes
No
2 Yes
No
3 Yes
No
4 Yes
No
5 Yes
No
Declaration Sheet
The investigators declare that the objective of this study is to measure the status, outcomes and
challenges of implementation of the new system initiated in hospitals pharmacies (including
ALERT) called Auditable Pharmaceuticals Transactions and Services (APTS).
I the principal investigator declare that the proposal is prepared by my-self. The two co-
investigators (data collectors) are trained and will do as per the standards of ethical principles.
Consent forms will be filled after oral consent of patients to be interviewed.
Name of the principal investigators___________________ Signature _______________
Name of
1. Co-investigators: _____________________, Signature _____________
2. Co-investigators: _____________________, Signature _____________
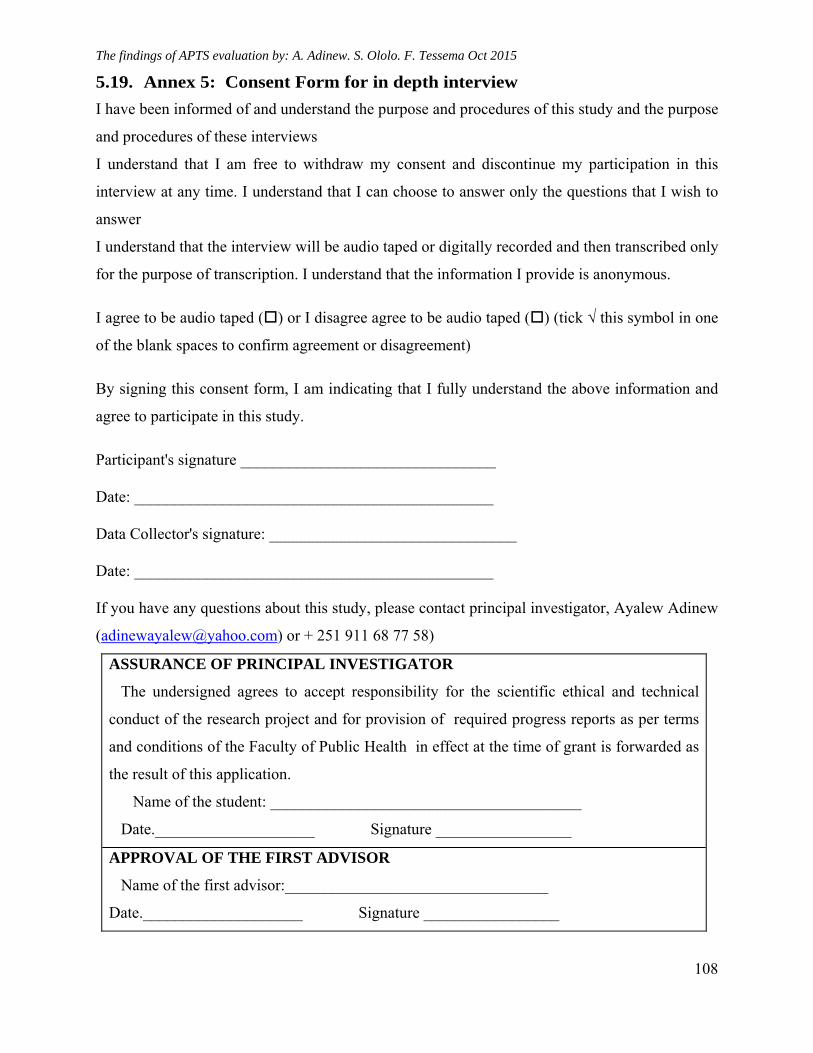
The findings of APTS evaluation by: A. Adinew. S. Ololo. F. Tessema Oct 2015
108
5.19. Annex 5: Consent Form for in depth interview
I have been informed of and understand the purpose and procedures of this study and the purpose
and procedures of these interviews
I understand that I am free to withdraw my consent and discontinue my participation in this
interview at any time. I understand that I can choose to answer only the questions that I wish to
answer
I understand that the interview will be audio taped or digitally recorded and then transcribed only
for the purpose of transcription. I understand that the information I provide is anonymous.
I agree to be audio taped () or I disagree agree to be audio taped () (tick √ this symbol in one
of the blank spaces to confirm agreement or disagreement)
By signing this consent form, I am indicating that I fully understand the above information and
agree to participate in this study.
Participant's signature ________________________________
Date: _____________________________________________
Data Collector's signature: _______________________________
Date: _____________________________________________
If you have any questions about this study, please contact principal investigator, Ayalew Adinew
([email protected]) or + 251 911 68 77 58)
ASSURANCE OF PRINCIPAL INVESTIGATOR
The undersigned agrees to accept responsibility for the scientific ethical and technical
conduct of the research project and for provision of required progress reports as per terms
and conditions of the Faculty of Public Health in effect at the time of grant is forwarded as
the result of this application.
Name of the student: _______________________________________
Date.____________________ Signature _________________
APPROVAL OF THE FIRST ADVISOR
Name of the first advisor:_________________________________
Date.____________________ Signature _________________
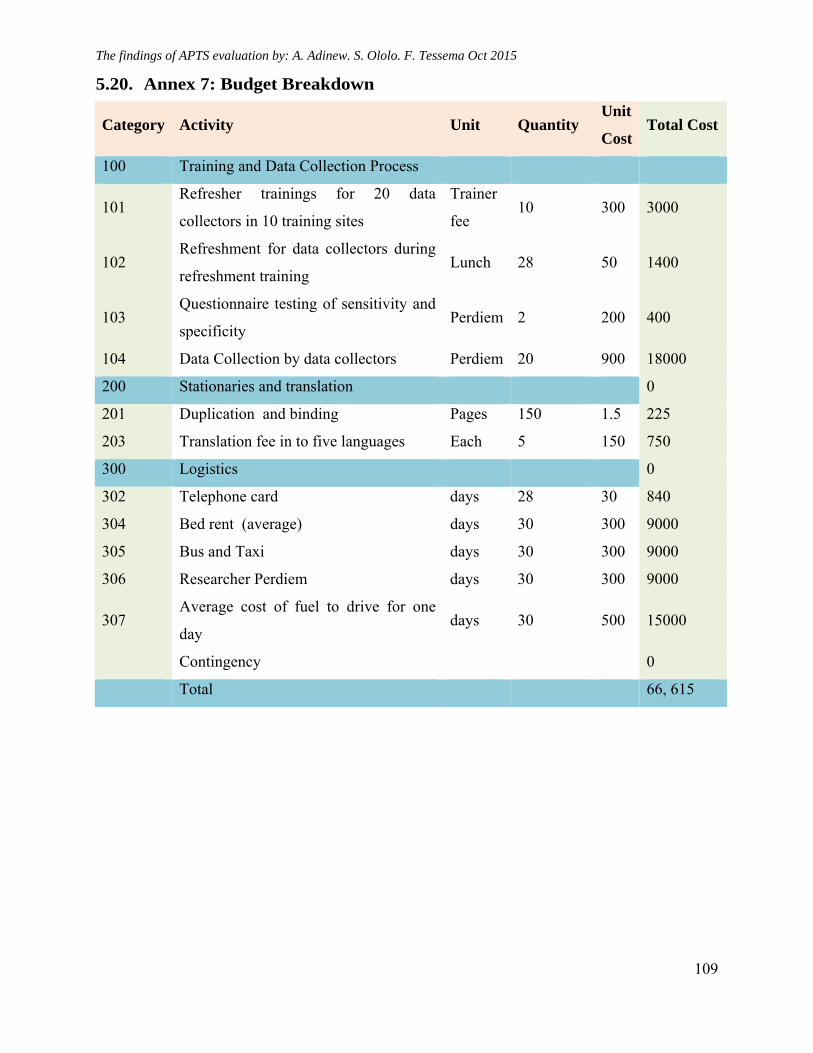
The findings of APTS evaluation by: A. Adinew. S. Ololo. F. Tessema Oct 2015
109
5.20. Annex 7: Budget Breakdown
Category Activity Unit Quantity Unit
Cost Total Cost
100 Training and Data Collection Process
101 Refresher trainings for 20 data
collectors in 10 training sites
Trainer
fee 10 300 3000
102 Refreshment for data collectors during
refreshment training Lunch 28 50 1400
103 Questionnaire testing of sensitivity and
specificity Perdiem 2 200 400
104 Data Collection by data collectors Perdiem 20 900 18000
200 Stationaries and translation 0
201 Duplication and binding Pages 150 1.5 225
203 Translation fee in to five languages Each 5 150 750
300 Logistics 0
302 Telephone card days 28 30 840
304 Bed rent (average) days 30 300 9000
305 Bus and Taxi days 30 300 9000
306 Researcher Perdiem days 30 300 9000
307 Average cost of fuel to drive for one
day days 30 500 15000
Contingency 0
Total 66, 615
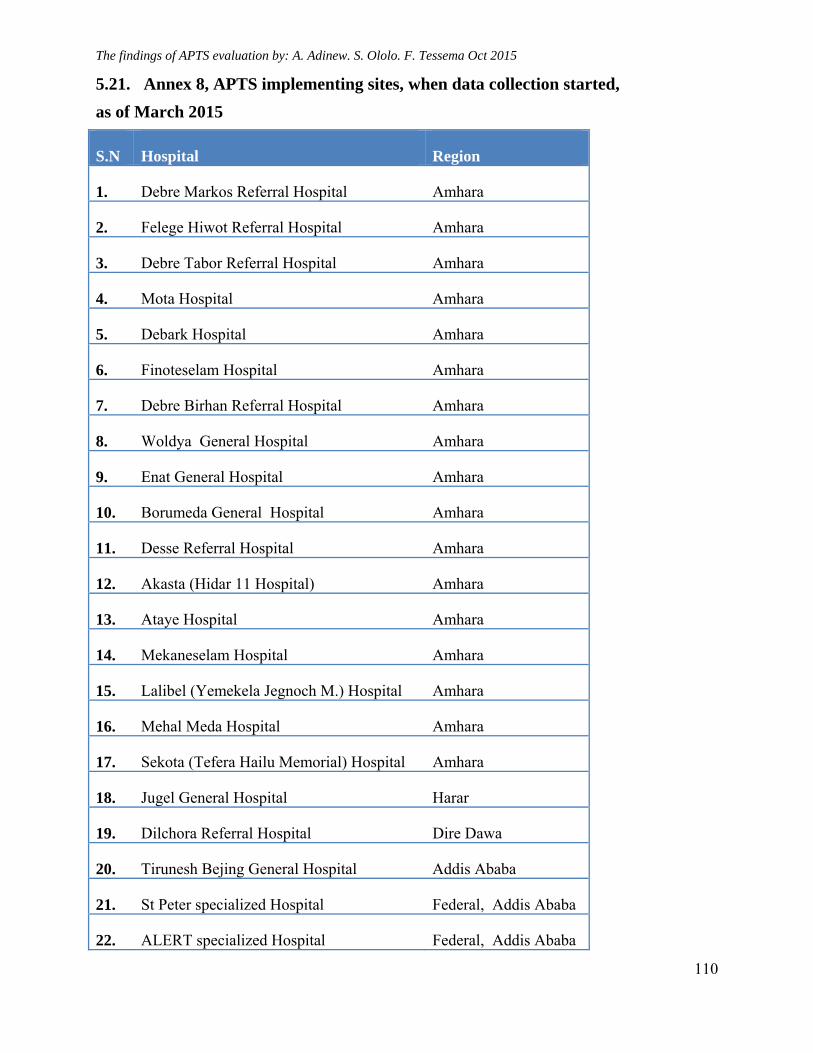
The findings of APTS evaluation by: A. Adinew. S. Ololo. F. Tessema Oct 2015
110
5.21. Annex 8, APTS implementing sites, when data collection started,
as of March 2015
S.N Hospital Region
1. Debre Markos Referral Hospital Amhara
2. Felege Hiwot Referral Hospital Amhara
3. Debre Tabor Referral Hospital Amhara
4. Mota Hospital Amhara
5. Debark Hospital Amhara
6. Finoteselam Hospital Amhara
7. Debre Birhan Referral Hospital Amhara
8. Woldya General Hospital Amhara
9. Enat General Hospital Amhara
10. Borumeda General Hospital Amhara
11. Desse Referral Hospital Amhara
12. Akasta (Hidar 11 Hospital) Amhara
13. Ataye Hospital Amhara
14. Mekaneselam Hospital Amhara
15. Lalibel (Yemekela Jegnoch M.) Hospital Amhara
16. Mehal Meda Hospital Amhara
17. Sekota (Tefera Hailu Memorial) Hospital Amhara
18. Jugel General Hospital Harar
19. Dilchora Referral Hospital Dire Dawa
20. Tirunesh Bejing General Hospital Addis Ababa
21. St Peter specialized Hospital Federal, Addis Ababa
22. ALERT specialized Hospital Federal, Addis Ababa
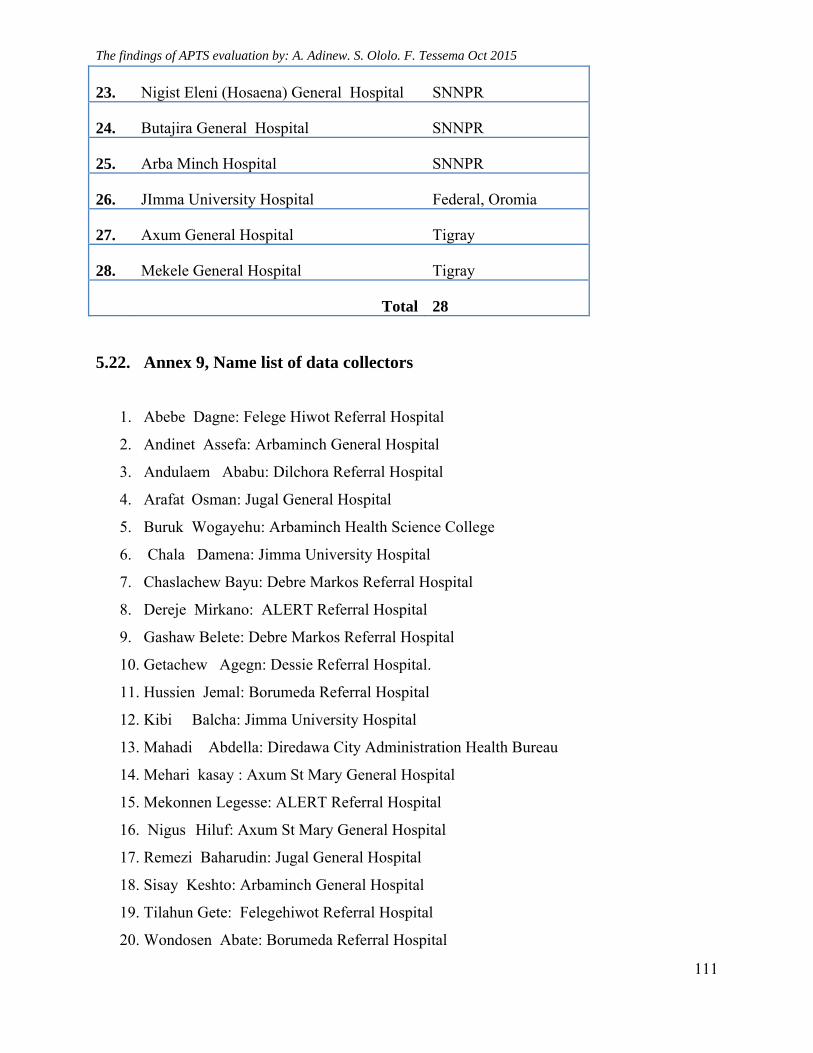
The findings of APTS evaluation by: A. Adinew. S. Ololo. F. Tessema Oct 2015
111
23. Nigist Eleni (Hosaena) General Hospital SNNPR
24. Butajira General Hospital SNNPR
25. Arba Minch Hospital SNNPR
26. JImma University Hospital Federal, Oromia
27. Axum General Hospital Tigray
28. Mekele General Hospital Tigray
Total 28
5.22. Annex 9, Name list of data collectors
1. Abebe Dagne: Felege Hiwot Referral Hospital
2. Andinet Assefa: Arbaminch General Hospital
3. Andulaem Ababu: Dilchora Referral Hospital
4. Arafat Osman: Jugal General Hospital
5. Buruk Wogayehu: Arbaminch Health Science College
6. Chala Damena: Jimma University Hospital
7. Chaslachew Bayu: Debre Markos Referral Hospital
8. Dereje Mirkano: ALERT Referral Hospital
9. Gashaw Belete: Debre Markos Referral Hospital
10. Getachew Agegn: Dessie Referral Hospital.
11. Hussien Jemal: Borumeda Referral Hospital
12. Kibi Balcha: Jimma University Hospital
13. Mahadi Abdella: Diredawa City Administration Health Bureau
14. Mehari kasay : Axum St Mary General Hospital
15. Mekonnen Legesse: ALERT Referral Hospital
16. Nigus Hiluf: Axum St Mary General Hospital
17. Remezi Baharudin: Jugal General Hospital
18. Sisay Keshto: Arbaminch General Hospital
19. Tilahun Gete: Felegehiwot Referral Hospital
20. Wondosen Abate: Borumeda Referral Hospital
Related Documents


