Page | 1 | PHILLIP SECURITIES RESEARCH (SINGAPORE) Ref. No.: US2021_0011 Amazon.com Inc Much more growth ahead UNITED STATES | INTERNET | INITIATION Cloud services and advertising to spearhead secular tailwinds with expected revenue growth of 33% and 54% respectively in FY21e. Core e-commerce business rapidly scaling up fulfilment and logistics capabilities to further widen its moat. Fulfilment centre square footage is expected to jump 44%. Initiate coverage with a BUY recommendation and DCF target price (WACC 6.2%) of US$4,329. Company Background Amazon owns the leading e-commerce platform in the US, and the world’s largest cloud computing business - Amazon Web Services (AWS). Amazon’s online stores generated 51% of FY20 revenue, retail third-party seller services 21%, AWS 12%, retail subscription services 7%, advertising 6%, and physical stores 4%. The US (68% revenue) is Amazon’s biggest market, followed by Germany 8%, UK 7%, Japan 5%, and the rest of the world 12%. Investment Merits 1. More upside for Amazon Web Services (AWS). Public cloud penetration of IT budgets remains low at 4%. As more companies switch to cloud services to meet their IT needs, we expect Amazon’s cloud business to capture much of the growth. We believe AWS’ strength is its ability to execute, security and reliability while offering similar pricing compared to no. 2 Microsoft Azure (20% market share). As the largest player (32% market share), AWS has a greater ability to secure larger scale contracts, such as the multibillion-dollar Department of Defense contract awarded by April 2022. AWS is also scaling faster than competitors with the highest hyperscale data centre capex in the last four quarters. We expect AWS revenue growth of 33% in FY21e and margins of 32% to lift the bottom line significantly. 2. Amazon advertising continues to take market share. Amazon’s first-party user data (data collected directly from Amazon.com) is unaffected by Apple’s new iOS 14 privacy update, which may adversely hurt Facebook ad effectiveness in targeting customers. In addition, Google intends to phase out third-party cookies on Chrome browsers by 2022, forcing marketers to instead rely on first-party data providers such as Amazon ads. Amazon is also expanding their ad capacity and services, recently doubling sponsored ads on web pages and adding video ads and sponsored brand posts. Advertising is Amazon’s fastest growing business with margins estimated to be above 50%. We expect Amazon’s ad revenue to grow 54% in FY21e as higher demand drive up prices, which rose 30% to over US$1.20 per-click since the beginning of 2021. 3. Core e-commerce business expanding its moat. Fulfilment centre square footage is expected to jump 44% in the next few years to 578mn square feet as Amazon boosts capex. Stickiness with buyers and sellers keeps rising. Fulfilment by Amazon, Amazon’s logistics service, is a key reason why sellers choose to sell on Amazon. It fulfils orders for sellers, allowing them to scale quickly, save time, and enjoy a wide regional reach with ease of use compared to using multiple delivery carriers. For buyers, Amazon Prime members, a gauge of recurring Amazon shoppers, is expected to top 153mn this year (about 63% of total US households) as more regions offer free 1 to 2-day shipping for Amazon Prime. We expect Amazon’s gross merchandise value growth to continue to outpace US retail market growth, with Amazon’s e-commerce market share increasing. We initiate coverage with a BUY rating. Our target price is US$4,329 based on DCF valuation with a WACC of 6.2% and terminal growth of 5%. 1 October 2021 BUY (Initiation) CLOSING PRICE FORECAST DIV TARGET PRICE TOTAL RETURN COMPANY DATA Bloomberg CODE: AMZN US O/S SHARES (MN) : 506 MARKET CAP (SGD bn / USD bn) : 2259 / 1664 52 - WK HI/LO (SGD) : 3773.08 / 2881 3M Average Daily T/O (mn) : 3.24 MAJOR SHAREHOLDERS Bezos Jeffrey P 10.1% Vanguard Group Inc 6.5% BlackRock Inc 5.4% PRICE PERFORMANCE (%) 1MTH 3MTH YTD AMAZON.COM INC (1.4) (4.3) 1.4 NASDAQ (4.4) 1.4 15.1 PRICE VS. NASDAQ Source: Bloomberg, PSR KEY FINANCIALS Y/E Dec, USD (bn) FY19 FY20 FY21e FY22e Revenue 280.5 386.1 476.2 564.1 EBITDA 36.3 48.2 61.1 81.0 Net Profit 11.6 21.3 26.5 38.2 EPS (USD) 23.0 41.8 51.5 73.5 P/E (X) 150.2 82.6 67.1 47.0 ROE 18.7% 22.8% 20.3% 21.0% ROA 5.1% 6.6% 6.8% 8.4% Source: Company, PSR VALUATION METHOD Discounted Cash-Flow, WACC 6.2%, g 5.0% Timothy Ang (+65 6212 1852) Research Analyst [email protected] 31.8% USD 3285.04 USD 0.00 USD 4329.00 2,800 3,300 3,800 4,300 Sep-20 Dec-20 Mar-21 Jun-21 Sep-2 NDX Index AMZN US Equity

Welcome message from author
This document is posted to help you gain knowledge. Please leave a comment to let me know what you think about it! Share it to your friends and learn new things together.
Transcript

Page | 1 | PHILLIP SECURITIES RESEARCH (SINGAPORE) Ref. No.: US2021_0011
Amazon.com Inc Much more growth ahead
UNITED STATES | INTERNET | INITIATION
Cloud services and advertising to spearhead secular tailwinds with expected revenue growth of 33% and 54% respectively in FY21e.
Core e-commerce business rapidly scaling up fulfilment and logistics capabilities to further widen its moat. Fulfilment centre square footage is expected to jump 44%.
Initiate coverage with a BUY recommendation and DCF target price (WACC 6.2%) of US$4,329.
Company Background Amazon owns the leading e-commerce platform in the US, and the world’s largest cloud computing business - Amazon Web Services (AWS). Amazon’s online stores generated 51% of FY20 revenue, retail third-party seller services 21%, AWS 12%, retail subscription services
7%, advertising 6%, and physical stores 4%. The US (68% revenue) is Amazon’s biggest market, followed by Germany 8%, UK 7%, Japan 5%, and the rest of the world 12%.
Investment Merits
1. More upside for Amazon Web Services (AWS). Public cloud penetration of IT budgets remains low at 4%. As more companies switch to cloud services to meet their IT needs, we expect Amazon’s cloud business to capture much of the growth. We believe AWS’ strength is its ability to execute, security and reliability while offering similar pricing compared to no. 2 Microsoft Azure (20% market share). As the largest player (32% market share), AWS has a greater ability to secure larger scale contracts, such as the multibillion-dollar Department of Defense contract awarded by April 2022. AWS is also
scaling faster than competitors with the highest hyperscale data centre capex in the last four quarters. We expect AWS revenue growth of 33% in FY21e and margins of 32% to lift the bottom line significantly.
2. Amazon advertising continues to take market share. Amazon’s first-party user data (data collected directly from Amazon.com) is unaffected by Apple’s new iOS 14 privacy update, which may adversely hurt Facebook ad effectiveness in targeting customers. In addition, Google intends to phase out third-party cookies on Chrome browsers by 2022, forcing marketers to instead rely on first-party data providers such as Amazon ads. Amazon is also expanding their ad capacity and services, recently doubling sponsored ads on web pages and adding video ads and sponsored brand posts. Advertising is Amazon’s fastest growing business with margins estimated to be above 50%. We expect Amazon’s ad revenue to grow 54% in FY21e as higher demand drive up prices, which
rose 30% to over US$1.20 per-click since the beginning of 2021.
3. Core e-commerce business expanding its moat. Fulfilment centre square footage is expected to jump 44% in the next few years to 578mn square feet as Amazon boosts capex. Stickiness with buyers and sellers keeps rising. Fulfilment by Amazon, Amazon’s logistics service, is a key reason why sellers choose to sell on Amazon. It fulfils orders for sellers, allowing them to scale quickly, save time, and enjoy a wide regional reach with ease of use compared to using multiple delivery carriers. For buyers, Amazon Prime members, a gauge of recurring Amazon shoppers, is expected to top 153mn this year (about 63% of total US households) as more regions offer free 1 to 2-day shipping for Amazon Prime. We expect Amazon’s gross merchandise value growth to continue to
outpace US retail market growth, with Amazon’s e-commerce market share increasing.
We initiate coverage with a BUY rating. Our target price is US$4,329 based on DCF valuation with a WACC of 6.2% and terminal growth of 5%.
1 October 2021
BUY (Initiation)CLOSING PRICE
FORECAST DIV
TARGET PRICE
TOTAL RETURN
COMPANY DATA
Bloomberg CODE: AMZN US
O/S SHARES (MN) : 506
MARKET CAP (SGD bn / USD bn) : 2259 / 1664
52 - WK HI/LO (SGD) : 3773.08 / 2881
3M Average Daily T/O (mn) : 3.24
MAJOR SHAREHOLDERS
Bezos Jeffrey P 10.1%
Vanguard Group Inc 6.5%
BlackRock Inc 5.4%
PRICE PERFORMANCE (%)
1MTH 3MTH YTD
AMAZON.COM INC (1.4) (4.3) 1.4
NASDAQ (4.4) 1.4 15.1
PRICE VS. NASDAQ
Source: B loomberg, PSR
KEY FINANCIALS
Y/E Dec, USD (bn) FY19 FY20 FY21e FY22e
Revenue 280.5 386.1 476.2 564.1
EBITDA 36.3 48.2 61.1 81.0
Net Profit 11.6 21.3 26.5 38.2
EPS (USD) 23.0 41.8 51.5 73.5
P/E (X) 150.2 82.6 67.1 47.0
ROE 18.7% 22.8% 20.3% 21.0%
ROA 5.1% 6.6% 6.8% 8.4%
Source: Company, PSR
VALUATION METHOD
Discounted Cash-Flow, WACC 6.2%, g 5.0%
Timothy Ang (+65 6212 1852)
Research Analyst
31.8%
USD 3285.04
USD 0.00
USD 4329.00
2,800
3,300
3,800
4,300
Sep-20 Dec-20 Mar-21 Jun-21 Sep-21
NDX Index AMZN US Equity

Page | 2 | PHILLIP SECURITIES RESEARCH (SINGAPORE)
AMAZON.COM INC INITIATION
REVENUE Amazon has six sources of revenue: online stores (51% of FY20 revenue), retail third-party seller services (21%), Amazon Web Services (12%), retail subscription services (7%), other – ads (6%), and physical stores (4%). The US (68% of FY20 revenue) is Amazon’s biggest market, followed by Germany (8%), the UK (7%), Japan (5%), and the rest of the world (12%). Total revenue has expanded at 30% CAGR over the past 5 years, riding on the growth of e-commerce, cloud, and digital ad markets, where Amazon holds leadership ranks. Advertising is Amazon’s fastest growing segment, which makes up 90% of ‘other’ revenue. It grew 66% CAGR from FY15 to FY20 and is expected to grow 53% in FY21. We expect AWS to emerge as the second fastest grower at 33% in FY21 as revenue from online stores and retail third-party seller services normalise after spiking from the onset of COVID-19.
Online stores: Consumer product sales Retail third-party seller services: Commissions, fulfilment and shipping fees from third-party sellers AWS: Sales of AWS cloud services, pay-as-you-go model Retail subscription services: Amazon Prime membership fees, recognised over the subscription period Other: Primarily sales of advertising services, based on number of clicks or impressions
Figure 1: Revenue grew 30% CAGR over the past 5 years
Source: Company, PSR
Figure 2: All segment revenues are growing, with ad fastest
Source: Company, PSR
EXPENSES Cost of sales grew at 20% CAGR in the past five years, compared to revenue growth of 30%. Operating expenses grew more in line at 28% CAGR. Operating expenses include fulfilment (15% of FY20 revenue), technology & content (11%), marketing (6%) and general & administrative (2%) costs. Technology & content, marketing, and general & administrative costs have remained in stable ranges of 11.1% to 12.8%, 5.3% to 6.7%, and 1.7% to 2.1% of revenue respectively. However, fulfilment costs have risen from 13.0% to 15.2% due to fulfilment network expansion, higher staff costs and COVID-19 productivity reduction.
MARGINS Operating margins have gradually risen from 3% to 6% from FY16 to FY20. AWS and advertising are Amazon’s main sources of operating income and margins. AWS operating margins are at 30%, up from 25%, while advertising margins are estimated to be higher than 50%, in line with other large pure-play digital ad companies. We estimate the retail business (merchandise sales) to operate at a negative 0.4% operating margin.
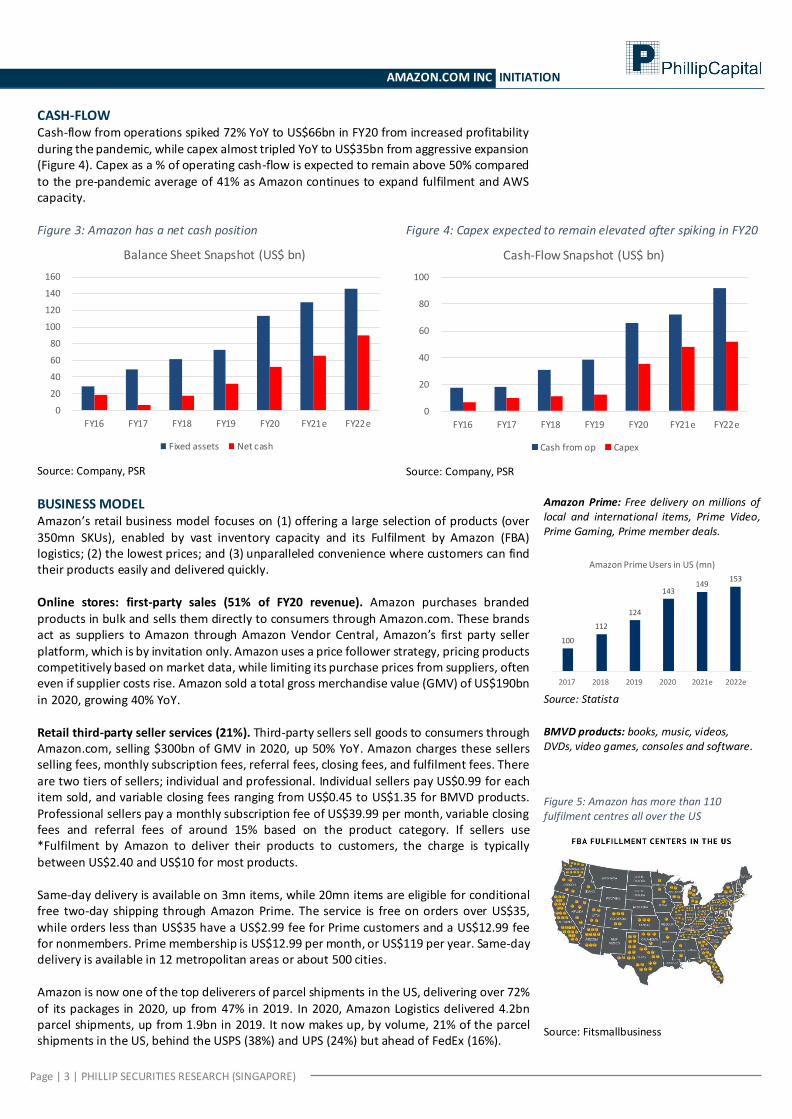
BALANCE SHEET Assets: Fixed assets have grown by four times to US$113bn in the last five years as Amazon expanded its network of fulfilment warehouses and data centres. It spiked 56% in 2020 as Amazon accelerated fulfilment capacity to meet pandemic demand for online sales. Fixed
assets made up 35% of total assets, and is expected to grow an additional 15% in 2021. Liabilities: Amazon has a net cash position of US$53bn, which grew at 30% CAGR from US$18bn in the past five years (Figure 3).
Cost of sales: Purchase of consumer products, shipping costs, digital media content costs Fulfilment: Fulfilment centre (Fulfilment by Amazon), physical stores, customer service centres, and payment processing costs Technology & content: AWS operating costs Marketing: Marketing and selling costs General & admin: Corporate costs
0
100
200
300
400
500
600
FY16 FY17 FY18 FY19 FY20 FY21e FY22e
Revenue (US$ bn)
FY16 to FY20: CAGR 30%
0
100
200
300
400
500
600
FY16 FY17 FY18 FY19 FY20 FY21e FY22e
Revenue by Segment (US$bn)
Online Stores Retail Third-Party Seller Services
Amazon Web Services (AWS) Other
Retail Subscription Services Physical Stores
Page | 3 | PHILLIP SECURITIES RESEARCH (SINGAPORE)
AMAZON.COM INC INITIATION
CASH-FLOW Cash-flow from operations spiked 72% YoY to US$66bn in FY20 from increased profitability during the pandemic, while capex almost tripled YoY to US$35bn from aggressive expansion (Figure 4). Capex as a % of operating cash-flow is expected to remain above 50% compared to the pre-pandemic average of 41% as Amazon continues to expand fulfilment and AWS capacity.
Figure 3: Amazon has a net cash position
Source: Company, PSR
Figure 4: Capex expected to remain elevated after spiking in FY20
Source: Company, PSR
BUSINESS MODEL Amazon’s retail business model focuses on (1) offering a large selection of products (over 350mn SKUs), enabled by vast inventory capacity and its Fulfilment by Amazon (FBA) logistics; (2) the lowest prices; and (3) unparalleled convenience where customers can find their products easily and delivered quickly.
Online stores: first-party sales (51% of FY20 revenue). Amazon purchases branded products in bulk and sells them directly to consumers through Amazon.com. These brands act as suppliers to Amazon through Amazon Vendor Central, Amazon’s first party seller platform, which is by invitation only. Amazon uses a price follower strategy, pricing products competitively based on market data, while limiting its purchase prices from suppliers, often even if supplier costs rise. Amazon sold a total gross merchandise value (GMV) of US$190bn
in 2020, growing 40% YoY.
Amazon Prime: Free delivery on millions of local and international items, Prime Video, Prime Gaming, Prime member deals.
Source: Statista
Retail third-party seller services (21%). Third-party sellers sell goods to consumers through Amazon.com, selling $300bn of GMV in 2020, up 50% YoY. Amazon charges these sellers selling fees, monthly subscription fees, referral fees, closing fees, and fulfilment fees. There are two tiers of sellers; individual and professional. Individual sellers pay US$0.99 for each item sold, and variable closing fees ranging from US$0.45 to US$1.35 for BMVD products. Professional sellers pay a monthly subscription fee of US$39.99 per month, variable closing fees and referral fees of around 15% based on the product category. If sellers use *Fulfilment by Amazon to deliver their products to customers, the charge is typically
between US$2.40 and US$10 for most products. Same-day delivery is available on 3mn items, while 20mn items are eligible for conditional free two-day shipping through Amazon Prime. The service is free on orders over US$35, while orders less than US$35 have a US$2.99 fee for Prime customers and a US$12.99 fee for nonmembers. Prime membership is US$12.99 per month, or US$119 per year. Same-day delivery is available in 12 metropolitan areas or about 500 cities.
Amazon is now one of the top deliverers of parcel shipments in the US, delivering over 72% of its packages in 2020, up from 47% in 2019. In 2020, Amazon Logistics delivered 4.2bn parcel shipments, up from 1.9bn in 2019. It now makes up, by volume, 21% of the parcel shipments in the US, behind the USPS (38%) and UPS (24%) but ahead of FedEx (16%).
BMVD products: books, music, videos, DVDs, video games, consoles and software.
Figure 5: Amazon has more than 110 fulfilment centres all over the US
Source: Fitsmallbusiness
0
20
40
60
80
100
120
140
160
FY16 FY17 FY18 FY19 FY20 FY21e FY22e
Balance Sheet Snapshot (US$ bn)
Fixed assets Net cash
0
20
40
60
80
100
FY16 FY17 FY18 FY19 FY20 FY21e FY22e
Cash-Flow Snapshot (US$ bn)
Cash from op Capex
100
112
124
143 149
153
2017 2018 2019 2020 2021e 2022e
Amazon Prime Users in US (mn)

Page | 4 | PHILLIP SECURITIES RESEARCH (SINGAPORE)
AMAZON.COM INC INITIATION
*Fulfilment by Amazon (FBA): Third-party sellers store their products in Amazon's fulfilment centres. Amazon will pick, pack, ship, and provide customer service for these products. FBA helps third-party sellers scale their business and reach more customers.
Advertising (6%). Sellers can advertise on Amazon’s website using Amazon’s rich array of personalised first-party shopper data to target keywords or product categories. There are three main types of ads: Amazon sponsored product ads, headline search ads, and Amazon product display ads. Advertisers are charged on a cost-per-click basis where they bid for the available supply of advertising real estate on Amazon’s website. E-commerce channel advertising makes up about 89% of Amazon’s ad business, according to eMarketer. The rest of Amazon’s ad revenues come from ads on its video platforms and off-property ads. In 2Q21, cost-per-click advertising on Amazon averaged US$1.20 per click, up 30% from US$0.93 at the start of the year and up over 50% YoY. Demand for advertising on Amazon is rising faster than the ad inventory on and off Amazon, driving up prices. Customers include
established brands with big advertising budgets, who despite rising prices, look to retain market share from incumbent sellers. Amazon ads have higher average conversion rates
(the percentage of clicks an ad converts into sales) of 12% vs Google’s 4% and Facebook’s 9%. Amazon has been beefing up its ad platform. There are now as many as six sponsored products that appear ahead of any organic results, up from two or three, with more promotions elsewhere on the page. Amazon has also added new ad formats like video ads and sponsored brands posts, which feature a single brand and several product listings in a
banner at the top of the page.
Advertisement types Amazon Sponsored Product Ads: Typically displayed above or below the search results page and other product detail pages. They are keyword-targeted, and advertisers have the option of choosing from exact, phrase, or broad match types. Advertisers also have the control of setting a daily budget, as well as the campaign duration. Headline Search Ads: Displayed in the search result pages as headline banner ads. They are also keyword targeted and can be used to promote three or more products together. The minimum campaign budget for these ads is US$100, with a limit of US$1 spent per day. Campaigns can be scheduled to run up to four months in advance. Amazon Product Display Ads: These ads target interests or product categories. Each campaign is limited to one target type. These ads can appear to the right or at the bottom of search results, on the customer reviews page, at the top of the offer listings page, as well as in Amazon marketing emails.
Amazon Web Services (12%). Cloud computing allows businesses and individuals to consume computing resources such as virtual machines, databases, processing, memory, services, storage, messaging, events, using the Web as the transit medium. AWS, Amazon’s cloud business, offers fast deployment speeds, security and flexibility in *IaaS and PaaS services. AWS’ cloud memory, databases, and processes are not rooted in any physical location but are completely portable throughout the cloud. AWS also offers cloud management services. It is available in 44 different zones in 16 geographical locations. Pay-as-you-go model. Customers pay for the resources used on a per-second basis. For compute functions, which make up the majority of cloud charges, AWS and Microsoft’s Azure (second highest market share) offer similar pricing. Amazon charges a high cost of migrating data out of AWS, which helps retain customers. Customers. The number of active AWS users exceeds 1mn. Polls by private consulting firms suggest that enterprise-scale users make up at least 10% of that total. AWS currently has a market share of 48% in the IaaS sector and 25% share in PaaS. An estimated 64% of enterprises that are in the cloud use AWS. *IaaS: Infrastructure as a service is a type of cloud computing service that offers essential compute, storage, and networking resources on demand, on a pay-as-you-go basis. *PaaS: Platform as a service is a complete development and deployment environment in the cloud, with resources that enable you to deliver everything from simple cloud-based apps to sophisticated, cloud-enabled enterprise applications. Customers purchase the resources they need from a cloud service provider on a pay-as-you-go basis and access them over a secure Internet connection.
AWS services Amazon Elastic Compute Cloud (EC2): Pools virtual resources into instances of virtual machines, and stages those instances in locations chosen by the customer. Elastic Container Service (ECS): Delivers applications through containers rather than virtual machines. Customers rent bandwidth and pay for the precise volume of data consumed and the cycles required for processing, for each second of their application's operation. Simple Storage Service (S3): AWS establishes a fee for the method of use of objects stored in buckets, determined by S3. AWS does not charge customers by the storage volume, or in any fraction of a physical device consumed by data. AWS database services: Amazon Aurora, Amazon Redshift, Amazon Kinesis Data Analytics, etc. offer database engines capable of utilizing the data stored in AWS. For example, data analytics.

Page | 5 | PHILLIP SECURITIES RESEARCH (SINGAPORE)
AMAZON.COM INC INITIATION
INDUSTRY Public cloud infrastructure and platform services. Cloud maturity is still at market-entry stage, according to the McKinsey tech trends index. It remains a big opportunity, penetrating only an estimated 4% of the world’s IT spend of US$3.6tn . Gartner expects worldwide end-user spending on public cloud services to grow 23% in 2021 to US$332bn, and 16% CAGR to US$692bn by 2025. The pandemic helped CIOs overcome the reluctance of moving mission-critical workloads from on-premises to the cloud. Emerging technologies such as containerisation, virtualisation and edge computing are also becoming more mainstream. The IaaS segment, AWS’ core business, will see one of the highest growth as CIOs face continued pressure to scale infrastructure that supports moving complex workloads to the cloud and the meeting demands of a hybrid workforce. The IaaS segment is forecast to grow 38% this year alone, and 28% CAGR to US$223bn in 2025. Over 90% of the worldwide IaaS and PaaS cloud market is concentrated in just four cloud providers. As of February 2021, AWS is the leader at 32% share, followed by Microsoft (Azure) at 20%, and Google (GCP) at 8%. AWS’ market share has maintained around 32-34% despite competitors gaining ground. AWS is substantially ahead of the pack in “ability to execute”, according to Gartner’s Magic Quadrant 2021 report that collects analyst and customer views on cloud providers. For some competitors, customers sighted reliability
challenges and complex licensing processes. AWS was placed as the frontrunner in engineering, customer adoption and innovation, and "guides the roadmap" for other cloud providers. Google and Alibaba cloud businesses are still unprofitable.
IaaS: Infrastructure as a Service PaaS: Platform as a Service CIO: Chief investment officer AWS: Amazon Web Services GCP: Google Cloud Platform
Figure 6: AWS is the clear leader and ranked highest in “ability to execute”
Source: Gartner
Figure 7: Competitors gaining market share has not come at an expense to AWS, whose share maintains at 32 to 34%
Source: Synergy Research Group
Figure 8: Loss of appetite for owning your own data centres
Source: Synergy Research Group
Digital advertising. Digital ad spending in the US is forecast to grow 16% CAGR to US$279bn by 2024 as more retail spending move online. Google and Facebook are a duopoly in the US
digital ad market, with 29% and 25% share of revenue in 2020 respectively. Amazon is third, with 10% market share, up from 8% in 2019. Amazon’s market share was strengthened as the pandemic drove consumers to move their spending online, driving up its search ad
revenues from sponsored products and sponsored brands. Amazon controls 76% of the nearly US$24bn US e-commerce channel ad market, with no. 2 Walmart capturing 6.5%. Apple iOS 14 privacy update. In April 2021, Apple rolled out privacy updates in its iOS 14 operating system that forced apps that use targeted advertising to disclose this to end-users upon downloading or updating the app to gain their consent to be tracked. Facebook advertisers were hit by the new privacy update, which removes an Apple user from its entire
digital advertising ecosystem when they opted out for its app. About 75% of Apple users were opting out in response to the new prompt. Marketing agencies reported clients seeing a decline in their Facebook ad performance, causing them to reduce ad spending on
Facebook and sending most of it to Amazon instead. Amazon has a substantial collection of shopper profiles to target relevant ads to shoppers while they browse its site. Between 75%
Figure 9: Amazon continues to outspend competitors in capex
Source: Bloomberg
0
10
20
30
40
50
2016 2017 2018 2019 2020 2021e 2022e
Amazon Capex vs Competitors (US$ bn)
Amazon Alphabet Microsoft Facebook

Page | 6 | PHILLIP SECURITIES RESEARCH (SINGAPORE)
AMAZON.COM INC INITIATION
to 80% of US consumers shop on Amazon at least occasionally, and the company currently has more than 150mn subscribers in its Prime service in the US. As this data does not leave Amazon’s site or app, it’s considered first-party and is not subject to the new iOS 14 privacy requirements. The impact of the privacy update is still early, and potentially presents a tailwind for Amazon to chip away at Facebook’s digital advertising market share.
Google’s cookiepocalypse. To enhance user privacy, Google intends to phase out third-party cookies on Chrome browsers by 2022. They will also not build alternate identifiers to track
individuals browsing the web or using Google’s products. As an advertiser, third-party cookie data allows you to learn about your web visitor's overall online behaviours, such as websites they frequently visit, purchases, and interests that they've shown on various websites. As the phase-out nears, marketers that rely on third-party data will have to
consider alternative first-party strategies, such as advertising with Amazon’s first-party data. Chrome accounts for more than half of all global web traffic.
Figure 10:US digital ad growth forecast 16% CAGR to 2024 as more ad spend shifts online
Source: eMarketer
E-commerce. Amazon is the leading e-commerce company in the US with 40% market share, with no. 2 Walmart at 7% and Ebay at third with 4%. An estimated 74% of consumers go directly to Amazon when they are ready to buy a specific product. E-commerce sales still only accounted for 14% of total retail sales in 2020, according to the US Census Bureau, and
is expected to grow to 24% in 2025. US retail e-commerce sales are forecast to grow at 15% CAGR from US$933bn in 2021 to US$1.65tn in 2025. Amazon offers the largest selection of products, over 350mn SKUs. Walmart is known for general household products. Ebay specialises in offering a wider range of used items. Buyers often choose to shop on Amazon for faster delivery, more trusted brands, products that are cheaper than stores, more reviews, wider selection, and ease of returning products.
Figure 11: Amazon product sales growth outpacing US retail sales ex-motor vehicles
Source: Company, CEIC
Figure 12: US retail e-commerce sales forecast to grow 15% CAGR from 2021 to 2025, reaching US$1.65tn as e-commerce penetration rises from 15% to 24%
Source: eMarketer
Figure 13: Amazon share of US e-commerce sales, by product category in 2020
Source: eMarketer
0%
20%
40%
60%
80%
100%
100
150
200
250
300
2019 2020 2021e 2022e 2023e 2024e
US Digital Ad Spending (US$ bn)
Digital Ad spending % of total ad spend, RHS
0%
10%
20%
30%
40%
20
10
20
11
20
12
20
13
20
14
20
15
20
16
20
17
20
18
20
19
20
20
1H
21
Amazon Product Sales Growth vs US Retail Ex-Motor Vehicles Sales Growth
Amazon product YoY % growthUS retail sales ex motor YoY % growth
0%
5%
10%
15%
20%
25%
0.50
1.00
1.50
2.00
2019 2020 2021e 2022e 2023e 2024e 2025e
US Retail Ecommerce Sales (US$ tn)
Retail ecommerce sales % of total retail sales
(US$ mn) Total ecommerce Amazon Amazon share
spending GMV of ecommerce
Books and magazines 14,829 11,864 80%
Consumer electronics 188,808 94,404 50%
Consumer packaged goods 121,017 57,483 47%
Toys and hobbies 19,373 8,718 45%
Apparel and accessories 107,934 42,094 39%
Office supplies 26,204 10,219 39%
Sports and fitness 16,913 6,596 39%
Furniture, appliances 47,491 15,435 33%
and equipment
Home and garden 26,249 7,875 30%
Flowers, greetings, and 11,353 2,838 25%
miscellaneous gifts
Jewelry and watches 14,366 3,591 25%
Other 98,619 38,168 39%
Total 299,285 39%
Page | 7 | PHILLIP SECURITIES RESEARCH (SINGAPORE)
AMAZON.COM INC INITIATION
Risks 1. New antitrust laws. A package of five antitrust reforms was introduced by a bipartisan group of House lawmakers on June 2021
that would make it harder for companies like Amazon to complete mergers and own businesses that present clear conflicts of interest. Lawmakers found evidence that Amazon’s dominance in cloud computing potentially creates a conflict of interest where customers are forced to consider working with a competitor. They also allege Amazon’s dual role in selling products on its web site and running a marketplace for third-party sellers creates an inherent conflict of interest that encourages Amazon to exploit its access to competing sellers’ data and information. The bills need to be voted on favourably by the Judiciary Committee before making their way to the full House. They would then need to be approved by the Senate before being signed into law by the president. A possible scenario is Amazon could be required to split apart its core e-commerce site from the third-party marketplace where independent vendors sell their products, and from the Amazon Web Services cloud-computing service.
Antitrust laws: Regulations that encourage competition by limiting the market power of any particular firm. This often involves ensuring that mergers and acquisitions don't overly concentrate market power or form monopolies, as well as breaking up firms that have become monopolies. Antitrust laws also prevent multiple firms from colluding or forming a cartel to limit competition through practices such as price fixing.
2. Lower research and development tax deduction. A Republican 2017 tax law provision preventing companies from immediately
deducting the full amount of research and development expenses will begin 2022. This will reduce the value of R&D tax credits as
companies will have to deduct a portion of it every year over five years. The R&D tax credit was designed to incentivise companies to invest on research and development by providing tax breaks for spending on research. Amazon disclosed in a Securities and
Exchange Commission filing earlier this year that the R&D tax credits helped it reduce its US tax burden the most out of all tax credits. The credits was estimated to be in the hundreds of millions. Lobbying is underway against the change in tax provision.
3. Increased investments and wage pressures could weigh on Amazon’s share price sentiment. Amazon plans to add 517 facilities to its global distribution infrastructure in the coming years, according to logistics consultancy MWPVL International. This adds 176mn more square feet on top of the 402mn it already has. Meanwhile, a tight labour market forced Amazon to raise wages early and sign bonuses to attract full and part-time employees, now numbering 1.3mn. The additional capex and expenses could weigh on the sentiment of Amazon’s share price.
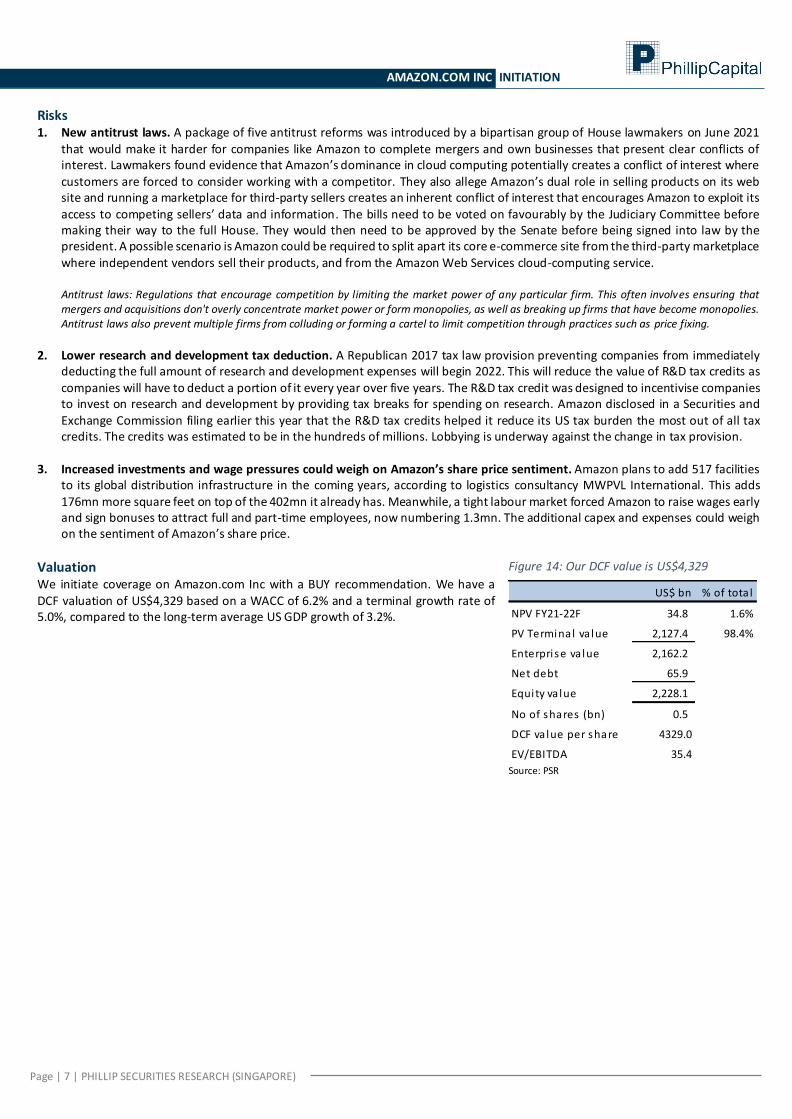
Valuation We initiate coverage on Amazon.com Inc with a BUY recommendation. We have a DCF valuation of US$4,329 based on a WACC of 6.2% and a terminal growth rate of 5.0%, compared to the long-term average US GDP growth of 3.2%.
Figure 14: Our DCF value is US$4,329
Source: PSR
US$ bn % of tota l
NPV FY21-22F 34.8 1.6%
PV Terminal va lue 2,127.4 98.4%
Enterprise va lue 2,162.2
Net debt 65.9
Equity va lue 2,228.1
No of shares (bn) 0.5
DCF va lue per share 4329.0
EV/EBITDA 35.4

Page | 8 | PHILLIP SECURITIES RESEARCH (SINGAPORE)
AMAZON.COM INC INITIATION
Total Returns Recommendation Rating
> +20% Buy 1
+5% to +20% Accumulate 2
-5% to +5% Neutra l 3
-5% to -20% Reduce 4
< -20% Sel l 5
Ratings History
PSR Rating System
Remarks
We do not base our recommendations entirely on the above quanti tative
return bands . We cons ider qual i tative factors l ike (but not l imited to) a s tock's
ri sk reward profi le, market sentiment, recent rate of share price appreciation,
presence or absence of s tock price cata lysts , and speculative undertones
surrounding the s tock, before making our fina l recommendation
12345
2800.00
3100.00
3400.00
3700.00
4000.00
4300.00
4600.00
Oct-2
0
No
v-20
Dec-20
Jan-2
1
Feb-21
Mar-2
1
Ap
r-21
May-2
1
Jun
-21
Jul-21
Au
g-21
Sep-21
Source: Bloomberg, PSR
Market Price Target Price
Page | 9 | PHILLIP SECURITIES RESEARCH (SINGAPORE)
AMAZON.COM INC INITIATION
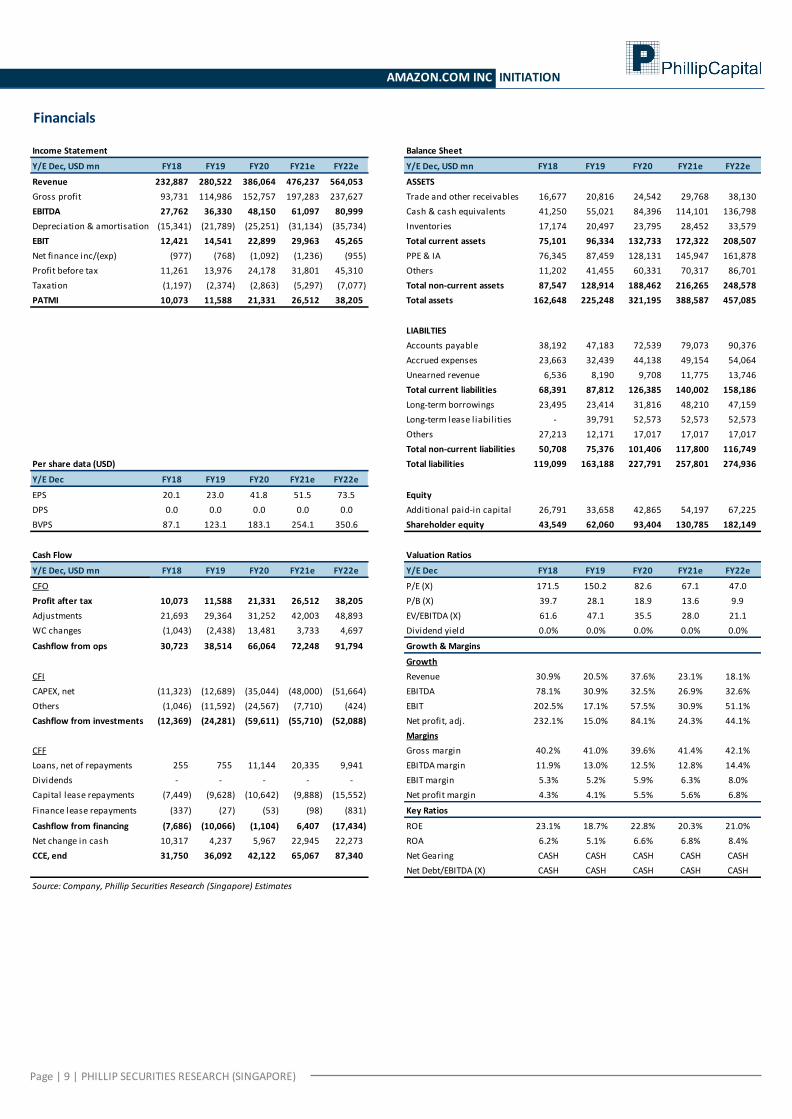
Financials
Income Statement Balance Sheet
Y/E Dec, USD mn FY18 FY19 FY20 FY21e FY22e Y/E Dec, USD mn FY18 FY19 FY20 FY21e FY22e
Revenue 232,887 280,522 386,064 476,237 564,053 ASSETS
Gross profit 93,731 114,986 152,757 197,283 237,627 Trade and other receivables 16,677 20,816 24,542 29,768 38,130
EBITDA 27,762 36,330 48,150 61,097 80,999 Cash & cash equivalents 41,250 55,021 84,396 114,101 136,798
Depreciation & amortisation (15,341) (21,789) (25,251) (31,134) (35,734) Inventories 17,174 20,497 23,795 28,452 33,579
EBIT 12,421 14,541 22,899 29,963 45,265 Total current assets 75,101 96,334 132,733 172,322 208,507
Net finance inc/(exp) (977) (768) (1,092) (1,236) (955) PPE & IA 76,345 87,459 128,131 145,947 161,878
Profit before tax 11,261 13,976 24,178 31,801 45,310 Others 11,202 41,455 60,331 70,317 86,701
Taxation (1,197) (2,374) (2,863) (5,297) (7,077) Total non-current assets 87,547 128,914 188,462 216,265 248,578
PATMI 10,073 11,588 21,331 26,512 38,205 Total assets 162,648 225,248 321,195 388,587 457,085
LIABILTIES
Accounts payable 38,192 47,183 72,539 79,073 90,376
Accrued expenses 23,663 32,439 44,138 49,154 54,064
Unearned revenue 6,536 8,190 9,708 11,775 13,746
Total current liabilities 68,391 87,812 126,385 140,002 158,186
Long-term borrowings 23,495 23,414 31,816 48,210 47,159
Long-term lease liabilities - 39,791 52,573 52,573 52,573
Others 27,213 12,171 17,017 17,017 17,017
Total non-current liabilities 50,708 75,376 101,406 117,800 116,749
Per share data (USD) Total liabilities 119,099 163,188 227,791 257,801 274,936
Y/E Dec FY18 FY19 FY20 FY21e FY22e
EPS 20.1 23.0 41.8 51.5 73.5 Equity
DPS 0.0 0.0 0.0 0.0 0.0 Additional paid-in capital 26,791 33,658 42,865 54,197 67,225
BVPS 87.1 123.1 183.1 254.1 350.6 Shareholder equity 43,549 62,060 93,404 130,785 182,149
Cash Flow Valuation Ratios
Y/E Dec, USD mn FY18 FY19 FY20 FY21e FY22e Y/E Dec FY18 FY19 FY20 FY21e FY22e
CFO P/E (X) 171.5 150.2 82.6 67.1 47.0
Profit after tax 10,073 11,588 21,331 26,512 38,205 P/B (X) 39.7 28.1 18.9 13.6 9.9
Adjustments 21,693 29,364 31,252 42,003 48,893 EV/EBITDA (X) 61.6 47.1 35.5 28.0 21.1
WC changes (1,043) (2,438) 13,481 3,733 4,697 Dividend yield 0.0% 0.0% 0.0% 0.0% 0.0%
Cashflow from ops 30,723 38,514 66,064 72,248 91,794 Growth & Margins
Growth
CFI Revenue 30.9% 20.5% 37.6% 23.1% 18.1%
CAPEX, net (11,323) (12,689) (35,044) (48,000) (51,664) EBITDA 78.1% 30.9% 32.5% 26.9% 32.6%
Others (1,046) (11,592) (24,567) (7,710) (424) EBIT 202.5% 17.1% 57.5% 30.9% 51.1%
Cashflow from investments (12,369) (24,281) (59,611) (55,710) (52,088) Net profit, adj. 232.1% 15.0% 84.1% 24.3% 44.1%
Margins
CFF Gross margin 40.2% 41.0% 39.6% 41.4% 42.1%
Loans, net of repayments 255 755 11,144 20,335 9,941 EBITDA margin 11.9% 13.0% 12.5% 12.8% 14.4%
Dividends - - - - - EBIT margin 5.3% 5.2% 5.9% 6.3% 8.0%
Capital lease repayments (7,449) (9,628) (10,642) (9,888) (15,552) Net profit margin 4.3% 4.1% 5.5% 5.6% 6.8%
Finance lease repayments (337) (27) (53) (98) (831) Key Ratios
Cashflow from financing (7,686) (10,066) (1,104) 6,407 (17,434) ROE 23.1% 18.7% 22.8% 20.3% 21.0%
Net change in cash 10,317 4,237 5,967 22,945 22,273 ROA 6.2% 5.1% 6.6% 6.8% 8.4%
CCE, end 31,750 36,092 42,122 65,067 87,340 Net Gearing CASH CASH CASH CASH CASH
Net Debt/EBITDA (X) CASH CASH CASH CASH CASH
Source: Company, Phillip Securities Research (Singapore) Estimates
Page | 10 | PHILLIP SECURITIES RESEARCH (SINGAPORE)
AMAZON.COM INC INITIATION
Contact Information (Singapore Research Team) Head of Research Research Admin Paul Chew – [email protected] Qystina Azli - [email protected] Consumer | Industrial | Conglomerates Property | REITs Banking & Finance Terence Chua – [email protected] Natalie Ong – [email protected] Glenn Thum – [email protected] Small-Mid Cap US Technology Analyst (Hardware) US Technology Analyst (Internet) Vivian Ye – [email protected] Timothy Ang – [email protected] Jonathan Woo – [email protected]
Technical Analyst Chua Wei Ren – [email protected]
Contact Information (Regional Member Companies)
SINGAPORE Phillip Securities Pte Ltd
Raffles City Tower 250, North Bridge Road #06-00
Singapore 179101 Tel +65 6533 6001 Fax +65 6535 6631
Website: www.poems.com.sg
MALAYSIA Phillip Capital Management Sdn Bhd
B-3-6 Block B Level 3 Megan Avenue II, No. 12, Jalan Yap Kwan Seng, 50450
Kuala Lumpur Tel +603 2162 8841 Fax +603 2166 5099
Website: www.poems.com.my
HONG KONG Phillip Securities (HK) Ltd
11/F United Centre 95 Queensway Hong Kong
Tel +852 2277 6600 Fax +852 2868 5307
Websites: www.phillip.com.hk
JAPAN
Phillip Securities Japan, Ltd. 4-2 Nihonbashi Kabuto-cho Chuo-ku,
Tokyo 103-0026 Tel +81-3 3666 2101 Fax +81-3 3666 6090
Website: www.phillip.co.jp
INDONESIA PT Phillip Securities Indonesia
ANZ Tower Level 23B, Jl Jend Sudirman Kav 33A Jakarta 10220 – Indonesia
Tel +62-21 5790 0800 Fax +62-21 5790 0809
Website: www.phillip.co.id
CHINA Phillip Financial Advisory (Shanghai) Co Ltd
No 550 Yan An East Road, Ocean Tower Unit 2318,
Postal code 200001 Tel +86-21 5169 9200 Fax +86-21 6351 2940
Website: www.phillip.com.cn
THAILAND
Phillip Securities (Thailand) Public Co. Ltd 15th Floor, Vorawat Building,
849 Silom Road, Silom, Bangrak, Bangkok 10500 Thailand
Tel +66-2 6351700 / 22680999 Fax +66-2 22680921
Website www.phillip.co.th
FRANCE King & Shaxson Capital Limited
3rd Floor, 35 Rue de la Bienfaisance 75008
Paris France Tel +33-1 45633100 Fax +33-1 45636017
Website: www.kingandshaxson.com
UNITED KINGDOM King & Shaxson Capital Limited
6th Floor, Candlewick House,
120 Cannon Street, London, EC4N 6AS
Tel +44-20 7426 5950 Fax +44-20 7626 1757
Website: www.kingandshaxson.com
UNITED STATES Phillip Capital Inc
141 W Jackson Blvd Ste 3050
The Chicago Board of Trade Building Chicago, IL 60604 USA Tel +1-312 356 9000 Fax +1-312 356 9005
Website: www.phillipusa.com
AUSTRALIA Phillip Capital Limited
Level 10, 330 Collins Street
Melbourne, Victoria 3000, Australia Tel +61-03 8633 9803 Fax +61-03 8633 9899
Website: www.phillipcapital.com.au
CAMBODIA Phillip Bank Plc
Ground Floor of B-Office Centre,#61-64,
Norodom Blvd Corner Street 306,Sangkat Boeung Keng Kang 1, Khan Chamkamorn,
Phnom Penh, Cambodia Tel: 855 (0) 7796 6151/855 (0) 1620 0769
Website: www.phillipbank.com.kh
INDIA PhillipCapital (India) Private Limited
No.1, 18th Floor, Urmi Estate 95, Ganpatrao Kadam Marg
Lower Parel West, Mumbai 400-013 Maharashtra, India
Tel: +91-22-2300 2999 / Fax: +91-22-2300 2969 Website: www.phillipcapital.in
TURKEY PhillipCapital Menkul Degerler
Dr. Cemil Bengü Cad. Hak Is Merkezi No. 2 Kat. 6A Caglayan 34403 Istanbul, Turkey
Tel: 0212 296 84 84 Fax: 0212 233 69 29
Website: www.phillipcapital.com.tr
DUBAI Phillip Futures DMCC
Member of the Dubai Gold and Commodities Exchange (DGCX)
Unit No 601, Plot No 58, White Crown Bldg, Sheikh Zayed Road, P.O.Box 212291
Dubai-UAE Tel: +971-4-3325052 / Fax: + 971-4-3328895

Page | 11 | PHILLIP SECURITIES RESEARCH (SINGAPORE)
AMAZON.COM INC INITIATION
Important Information
This report is prepared and/or distributed by Phillip Securities Research Pte Ltd ("Phillip Securities Research"), which is a holder of a financial adviser’s licence under the
Financial Advisers Act, Chapter 110 in Singapore.
By receiving or reading this report, you agree to be bound by the terms and limitations set out below. Any failure to comply with these terms and limitati ons may constitute a violation of law. This report has been provided to you for personal use only and shall not be reproduced, distributed or published by you in whole or in part,
for any purpose. If you have received this report by mistake, please delete or destroy it, and notify the sender immediately.
The information and any analysis, forecasts, projections, expectations and opinions (collectively, the “Research”) contained in this report has been obtained from public sources which Phillip Securities Research believes to be reliable. However, Phillip Securities Research does not make any rep resentation or warranty, express or implied that such information or Research is accurate, complete or appropriate or should be relied upon as such. Any such information or Research contained in this report is
subject to change, and Phillip Securities Research shall not have any responsibility to maintain or update the information or Research made available or to supply any corrections, updates or releases in connection therewith.
Any opinions, forecasts, assumptions, estimates, valuations and prices contained in this report are as of the date indicated and are subject to change at any time without prior notice. Past performance of any product referred to in this report is not indicative of future results.
This report does not constitute, and should not be used as a substitute for, tax, legal or investment advice. This report should not be relied upon exclusively or as authoritative, without further being subject to the recipient’s own independent verification and exercise of judgment. The fa ct that this report has been made available constitutes neither a recommendation to enter into a particular transaction, nor a representation that any product described in this repo rt is suitable or appropriate for
the recipient. Recipients should be aware that many of the products, which may be described in this report involve significant risks and may not be suitable for all investors, and that any decision to enter into transactions involving such products should not be made, unless all such risks are understood and an independent determination has been made that such transactions would be appropriate. Any discussion of the risks contained herein with respect to any product should not be
considered to be a disclosure of all risks or a complete discussion of such risks.
Nothing in this report shall be construed to be an offer or solicitation for the purchase or sale of any product. Any decision to purchase any product mentioned in this report should take into account existing public information, including any registered prospectus in respect of such product.
Phillip Securities Research, or persons associated with or connected to Phillip Securities Research, including but not limited to its officers, directors, employees or persons involved in the issuance of this report, may provide an array of financial services to a large number of corporations in Singapore and worldwide, including but not limited
to commercial / investment banking activities (including sponsorship, financial advisory or underwriting activities), brokera ge or securities trading activities. Phillip Securities Research, or persons associated with or connected to Phillip Securities Research, including but not limited to its officers, directors, employees or persons involved in the issuance of this report, may have participated in or invested in transactions with the issuer(s) of the securities mentioned in this report, and may have performed services for or solicited business from such issuers. Additionally, Phillip Securities Research, or persons associa ted with or connected to Phillip Securities
Research, including but not limited to its officers, directors, employees or persons involved in the issuance of this report, may have provided advice or investment services to such companies and investments or related investments, as may be mentioned in this report.
Phillip Securities Research or persons associated with or connected to Phillip Securities Research, including but not limited to its officers, directors, employees or persons involved in the issuance of this report may, from time to time maintain a long or short position in securities referred to herein, or in related futures or options, purchase or sell, make a market in, or engage in any other transaction involving such securities, and earn brokerage or other compensation in respect of the foregoing. Investments will be denominated in various currencies including US dollars and Euro and thus will be subject to any fluctuation in exchange rates between US dollars and Euro or foreign currencies and the currency of your own jurisdiction. Such fluctuations may have an adverse effect on the value, price or income return of the investment.
To the extent permitted by law, Phillip Securities Research, or persons associated with or connected to Phillip Securities Research, including but not limited to its officers, directors, employees or persons involved in the issuance of this report, may at any time engage in any of the above activities as set out above or otherwise hold an interest, whether material or not, in respect of companies and investments or related investments, which may be mentioned in this report. Accordingly, information may be available to Phillip Securities Research, or persons associated with or connected to Phillip Securities Research, including but not limited to its officers, directors, employees or persons involved in the issuance of this report, which is not reflected in this report, and Phillip Securities R esearch, or persons associated with or connected to Phillip Securities Research, including but not limited to its officers, directors, employees or persons involved in the issuance of this report, may, to the extent permitted by law, have acted upon or used the information prior to or immediately following its publication. Phillip Securities Researc h, or persons associated with or connected to Phillip Securities Research, including but not limited its officers, directors, employees or persons involved in the issuance of this report, may have issued other material that is inconsistent with, or reach different conclusions from, the contents of this report.
The information, tools and material presented herein are not directed, intended for distribution to or use by, any person or entity in any jurisdiction or country where such distribution, publication, availability or use would be contrary to the applicable law or regulation or which would subject Phillip Securities Research to any registration or licensing or other requirement, or penalty for contravention of such requirements within such jurisdiction.
This report is intended for general circulation only and does not take into account the specific investment objectives, financial situation or particular needs of any particular person. The products mentioned in this report may not be suitable for all investors and a person receiving or reading this report should seek advice from a professional and financial adviser regarding the legal, business, financial, tax and other aspects including the suitability of such products, taking into account the specific investment objectives, financial situation or particular needs of that person, before making a commitment to invest in any of such products.
This report is not intended for distribution, publication to or use by any person in any jurisdiction outside of Singapore or any other jurisdiction as Phillip Securities Research may determine in its absolute discretion. IMPORTANT DISCLOSURES FOR INCLUDED RESEARCH ANALYSES OR REPORTS OF FOREIGN RESEARCH HOUSES Where the report contains research analyses or reports from a foreign research house, please note:
(i) recipients of the analyses or reports are to contact Phillip Securities Research (and not the relevant foreign research house ) in Singapore at 250 North Bridge Road, #06-00 Raffles City Tower, Singapore 179101, telephone number +65 6533 6001, in respect of any matters arising from, or in connection with, the analyses or reports; and
(ii) to the extent that the analyses or reports are delivered to and intended to be received by any person in Singapore who is not an accredited investor, expert investor or institutional investor, Phillip Securities Research accepts legal responsibility for the contents of the analyses or reports.
Related Documents