Running head: BUSINESS RESEARCH 1 Business Research Name Institution Date

Welcome message from author
This document is posted to help you gain knowledge. Please leave a comment to let me know what you think about it! Share it to your friends and learn new things together.
Transcript

Running head: BUSINESS RESEARCH1
Business Research
Name
Institution
Date
BUSINESS RESEARCH2
Table of ContentsIntroduction.........................................................5
Part I...............................................................5
1.1. Questionnaire Development......................................5
1.2. Questionnaire Distribution Methods.............................5
1.3. Questionnaire Critical Evaluation..............................6
Part II..............................................................8
2.1. Data Analysis, Findings and Managerial Implications............8
(i) Holidays.......................................................8
(ii) Children....................................................14
(iii).......................................................Ratings15
(iv) Satisfaction................................................18
(v) Regression Model............................................21
Conclusion..........................................................23
List of References..................................................25
Appendices..........................................................27
Appendix 1: Questionnaire Introduction..............................27
Appendix 2: Questions for the questionnaire........................28
Appendix 3: Coding Plan for the Questionnaire......................31
Appendix 4: Variable List..........................................33
Appendix 5: Tables.................................................34

BUSINESS RESEARCH3
BUSINESS RESEARCH4
List of Figures
Figure 2: Number of holidays taken last year..................10
Figure 3: Destination for the holiday.........................11
Figure 4: No. of previous holidays with the company...........12
Figure 5: Satisfaction levels.................................19
BUSINESS RESEARCH5
List of Tables
Table 1: Holidays taken last year.............................10
Table 2: Destination of holiday...............................10
Table 3: No. of previous holidays taken with the company......12
Table 4: Measures of association between destination and whether or not respondents travelled with children....................14
Table 5: T-tests for equality of means........................16
Table 6: Association between destination and accommodation rating..............................................................16
Table 7: Association between destination and travel rating. . . .17
Table 8: Overall satisfaction.................................18
Table 9: Satisfaction-number of children correlation..........20
Table 10: Regression Table A..................................22
Table 11: Regression Table B..................................22
Table 12: Association between destination and accommodation rating, travel rating and resort rating.......................35
Table 14: Cross tabs for grouped satisfaction and whether one hadchildren or not...............................................36
BUSINESS RESEARCH6
Introduction
The travel and hospitality industry is one of the fastest growing
industries in the world. The growth is enhanced, in present days, by
modern forms of information and communications technology such as the
internet. Through internet, it has become possible for tour companies
to easily connect with their clients. However, there is a need to
explore the level of satisfaction of clients. The purpose of this
research is to establish clients’ opinions towards the packages
offered by the travel and hospitality company. The other purpose of
the survey is to get suggestions from both individual and corporate
clients on how the services of the company could be improved. In order
to accomplish this, the research process is divided into two parts.
The first part deals with questionnaire development, distribution
methods and critical evaluation. In the second part, the findings are
presented and data analyzed. The analysis also addresses the
implications of the findings in management practice.
BUSINESS RESEARCH7
Part I
1.1. Questionnaire Development
See Appendix 1.
1.2. Questionnaire Distribution Methods
Distribution of questionnaires is a critical stage in research.
According to Armstrong and Fildes (2006), questionnaire distribution
depends on the sampling method that is used. In modern times, there
has been improved efficiency in the way documents are delivered. Berg
(2009) applauds the role of information and communications technology
in research. However, this must be catered for in the research design
or methodology. Nevertheless, the rapid development and use of
internet has helped the process of research. In this case, email will
be a major distribution method of the questionnaires. They will be
sent as word documents such that the client fills with ease. Creswell
(2008) and Patton (2002) observe that PDF files discourage respondents
from participation because they have to print, fill by hand, scan and
send again. The traditional mailing systems are also being phased out.
As earlier noted technology does not mar the research process but
BUSINESS RESEARCH8
rather enhances it. This implies that before questionnaires are
distributed, consent is sought from the potential respondent. Seeking
consent will be done either through email or cell phone. This is what
Franklin (2012) calls “online consent.” The company has a huge
database of clients.
Although technology assists in making work easier, it cannot be
ignored that hard copies are also important. There will also be
physical distribution of questionnaires at the company’s physical
office. Target respondents are the ones defined in the sampling
methods and procedures. These include return clients who come to the
offices of the company; as well as clients who came in the past but
are followed up for survey purposes. These two approaches are expected
to optimize the entire process in a bid to inform the management about
policy areas to improve.
1.3. Questionnaire Critical Evaluation
Questionnaires are very important in any research. This is
because the measure aspects being studied (Armstrong & Soelberg,
1968). This is done through questions that are designed in a way that
actually measures what is supposed to be measured. According to Kara
BUSINESS RESEARCH9
(2012), this is called validity. The firs aspect in evaluating this
questionnaire is looking at the construct of validity. According to
Silverman (2011), validity has to do with whether a tool, such as a
questionnaire, measures what it is supposed to measure. The
development of this questionnaire was based on a wide range of
principles; hence the belief that it is a valid instrument. There are
several examples that can illustrate this fact. For instance, one of
the key objectives of the study was to measure client’s opinions
towards the services and packages offered by the company. In order to
achieve this, this question was asked, “How can you rate our
packages?” The responses that are provided as based in principles of
ordinal measurement. According to Eisner (1981), ordinal measures have
direction. This means that they can be ranked. However, they cannot be
quantified. For instance, very bad, bad, moderate, goo and very good
follow each other in terms of directionality. If a client, for
example, say that the packages are very good; it implies that the
company did well in serving him or her.
The questionnaire used in this study has three sections. These
include demographic information, travel information and information
regarding the services and packages of the company. Demographic
BUSINESS RESEARCH10
information is very essential because it offers an opportunity for the
company to explore and profile the characteristics of its customers.
This is important for several reasons. The first one is that a company
is able to define its target market. For instance, if more young
people are traveling with the company, then the implication for
management is to diversify products and services in that regard. In
addition, studies could be carried out to establish why other age
groups are not as interested in the services of the company as others.
The question on nationality can be used to measure the
representativeness of the sample. According to Lesage (2009), samples
that do not cover wide geographical areas are likely to be biased. In
the words of Herrman (2009), results obtained from such a sample
cannot be generalized for the entire population. Hence some test
statistics such as Chi Square are used. Therefore, the first part is
very essential in capturing the characteristics of the participants as
well as the sample.
Travel information helps a company to analyze the behavior of
consumers in a market (Armstrong & Fildes, 2006; Joubish, 2009).
This is done by exploring the trends in purchase patterns and decision
making. For instance, question six that seeks to ask whether one
BUSINESS RESEARCH11
travelled alone or in a group is useful in measuring consumer
behavior. For instance, if data is collected for a long time, it is
possible to realize patterns such as shift from individual to group
tours. This kind of knowledge is importance in the development of
other aspects of a package. Another indicator of the need to develop
other products is the increase of, for instance, corporate travels as
opposed to personal tours. This questionnaire appears to have covered
very thematic areas in market research; yet in a simple outline and
content. Furthermore, the questionnaire is very easy to understand. It
is not complicated nor is it long. In about 10 minutes, any person
would have completed it. Moreover, the researcher indicated that it
could be filled in 15 minutes as a way of taking into consideration
those that a slow.
The questionnaire has several strengths. First, the questions in
section B are able to give a rough idea on return customers. The
question seeks to enquire how many times the client ever traveled with
the company. The smaller the number, the more customers do not return.
Thus the questionnaire has succeeded in helping the analyst formulate
a hypothesis about the services of the company. If most clients report
that they have travelled with the company for more than five times, it
BUSINESS RESEARCH12
is expected that their response to the question on how to rate the
company would be “very good.” By asking questions about children,
spouses, the number of days spent of travel and the like, the
questionnaire is able to assess changes in preferences of consumers
over time and across space (Alana, Slater & Bucknam, 2011). However,
the questionnaire may not fully get the differential in destination
areas. The category “outside Europe” is too general to cover all the
areas that people from North East England visit. For instance, it is
expected that British visits to the East such as China and Japan are
fewer than those to America and those to Africa (Creswell, 2008). The
questionnaire could have included these other categories as
independent categories without mixing them under a broad category.
Part II
2.1. Data Analysis, Findings and Managerial Implications
(i)Holidays
Number of holidays taken in the last year:
BUSINESS RESEARCH13
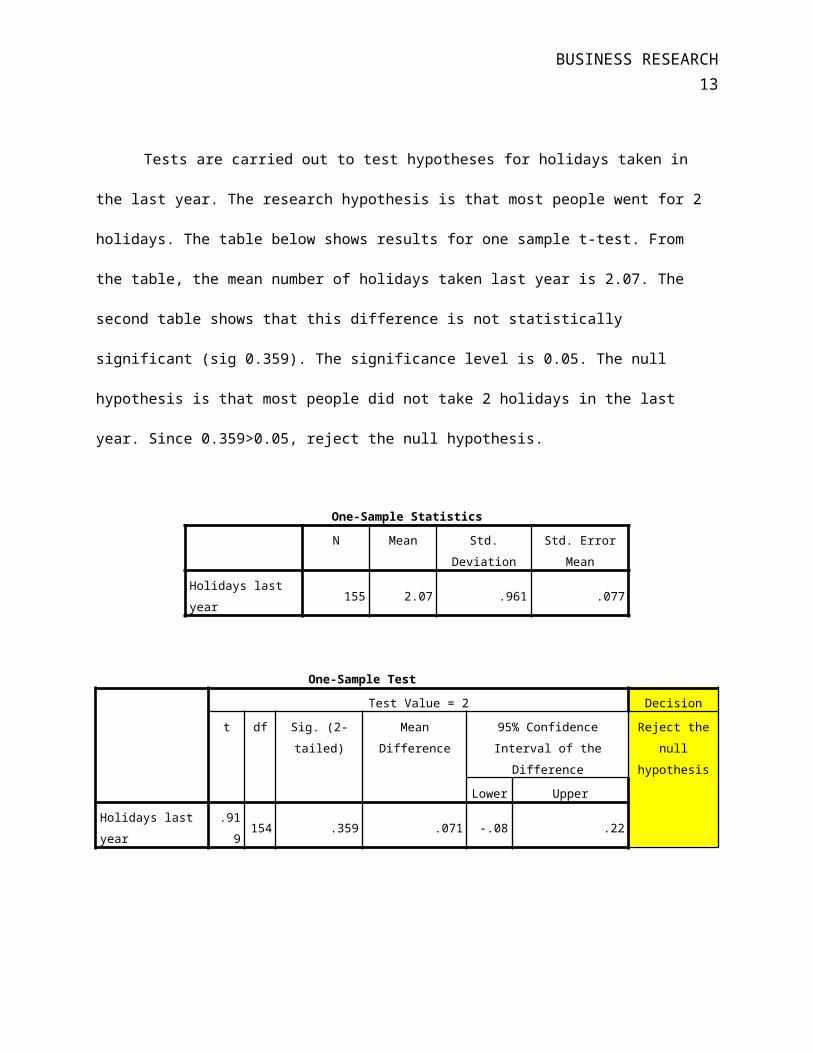
Tests are carried out to test hypotheses for holidays taken in
the last year. The research hypothesis is that most people went for 2
holidays. The table below shows results for one sample t-test. From
the table, the mean number of holidays taken last year is 2.07. The
second table shows that this difference is not statistically
significant (sig 0.359). The significance level is 0.05. The null
hypothesis is that most people did not take 2 holidays in the last
year. Since 0.359>0.05, reject the null hypothesis.
One-Sample StatisticsN Mean Std.
DeviationStd. Error
MeanHolidays last year
155 2.07 .961 .077
One-Sample TestTest Value = 2 Decision
t df Sig. (2-tailed)
MeanDifference
95% ConfidenceInterval of the
Difference
Reject thenull
hypothesisLower Upper
Holidays last year
.919
154 .359 .071 -.08 .22
BUSINESS RESEARCH14
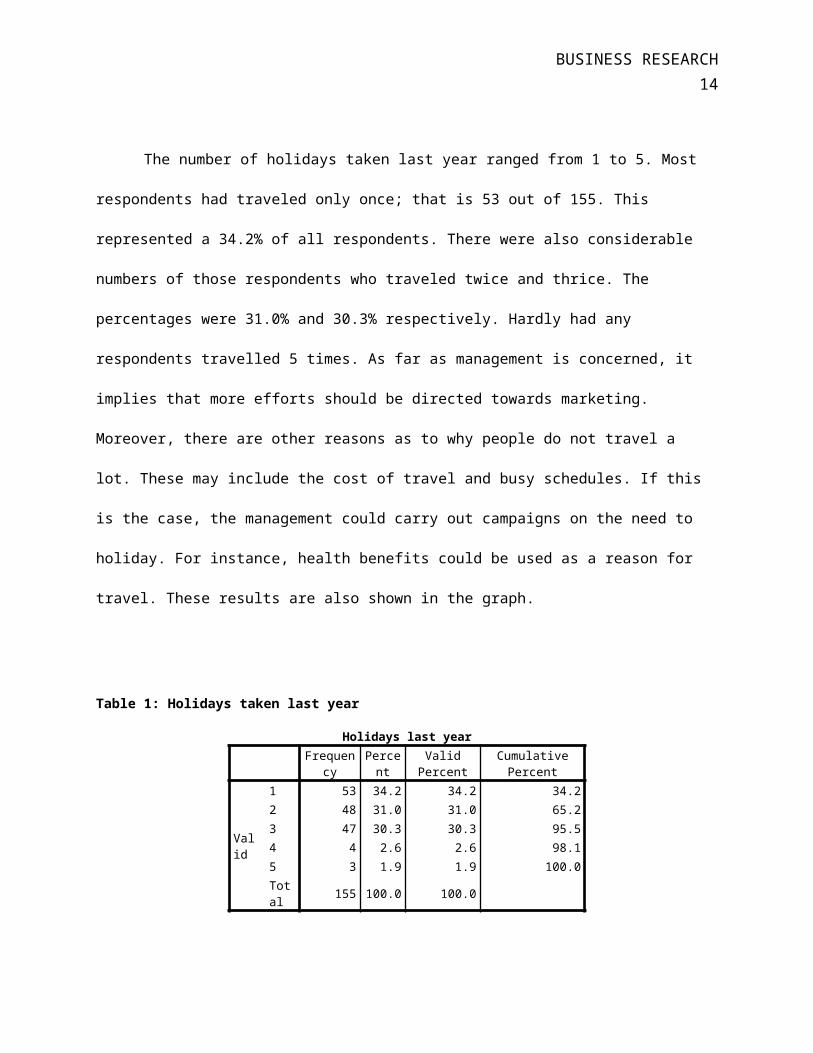
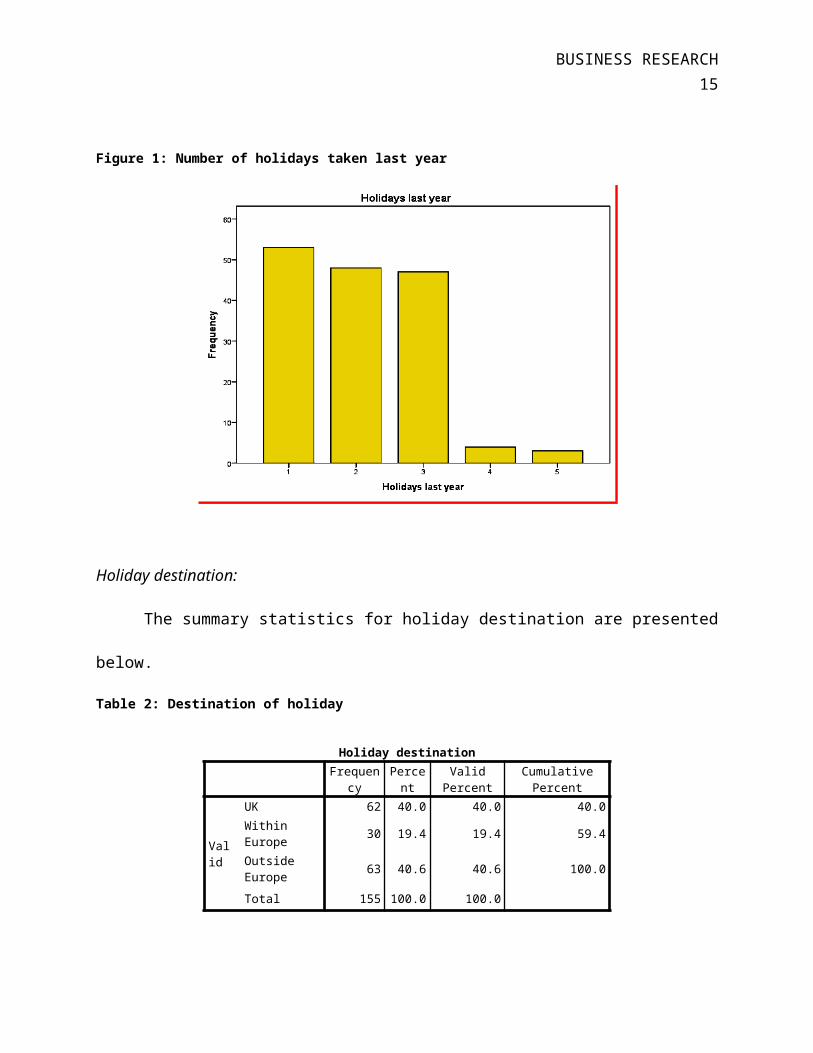
The number of holidays taken last year ranged from 1 to 5. Most
respondents had traveled only once; that is 53 out of 155. This
represented a 34.2% of all respondents. There were also considerable
numbers of those respondents who traveled twice and thrice. The
percentages were 31.0% and 30.3% respectively. Hardly had any
respondents travelled 5 times. As far as management is concerned, it
implies that more efforts should be directed towards marketing.
Moreover, there are other reasons as to why people do not travel a
lot. These may include the cost of travel and busy schedules. If this
is the case, the management could carry out campaigns on the need to
holiday. For instance, health benefits could be used as a reason for
travel. These results are also shown in the graph.
Table 1: Holidays taken last year
Holidays last yearFrequen
cyPercent
ValidPercent
CumulativePercent
Valid
1 53 34.2 34.2 34.22 48 31.0 31.0 65.23 47 30.3 30.3 95.54 4 2.6 2.6 98.15 3 1.9 1.9 100.0Total 155 100.0 100.0
BUSINESS RESEARCH15
Figure 1: Number of holidays taken last year
Holiday destination:
The summary statistics for holiday destination are presented
below.
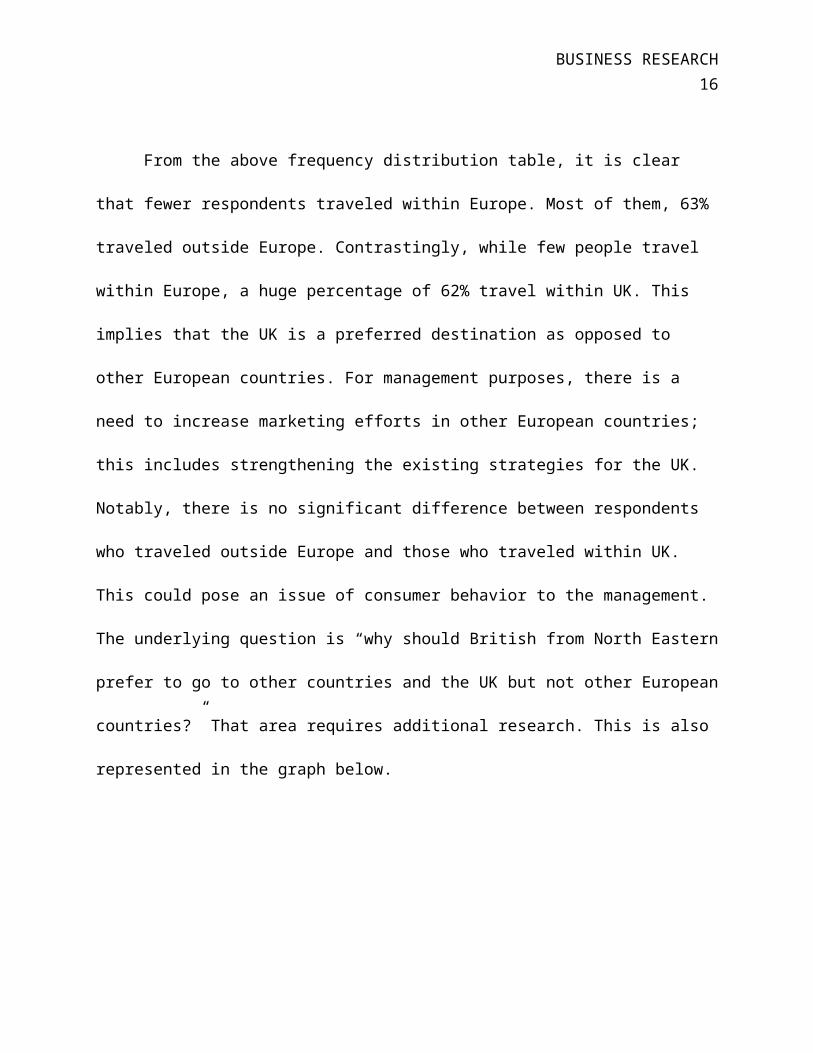
Table 2: Destination of holiday
Holiday destinationFrequen
cyPercent
ValidPercent
CumulativePercent
Valid
UK 62 40.0 40.0 40.0Within Europe 30 19.4 19.4 59.4
Outside Europe 63 40.6 40.6 100.0
Total 155 100.0 100.0
BUSINESS RESEARCH16
From the above frequency distribution table, it is clear
that fewer respondents traveled within Europe. Most of them, 63%
traveled outside Europe. Contrastingly, while few people travel
within Europe, a huge percentage of 62% travel within UK. This
implies that the UK is a preferred destination as opposed to
other European countries. For management purposes, there is a
need to increase marketing efforts in other European countries;
this includes strengthening the existing strategies for the UK.
Notably, there is no significant difference between respondents
who traveled outside Europe and those who traveled within UK.
This could pose an issue of consumer behavior to the management.
The underlying question is “why should British from North Eastern
prefer to go to other countries and the UK but not other European
countries?” That area requires additional research. This is also
represented in the graph below.
BUSINESS RESEARCH17
Figure 2: Destination for the holiday
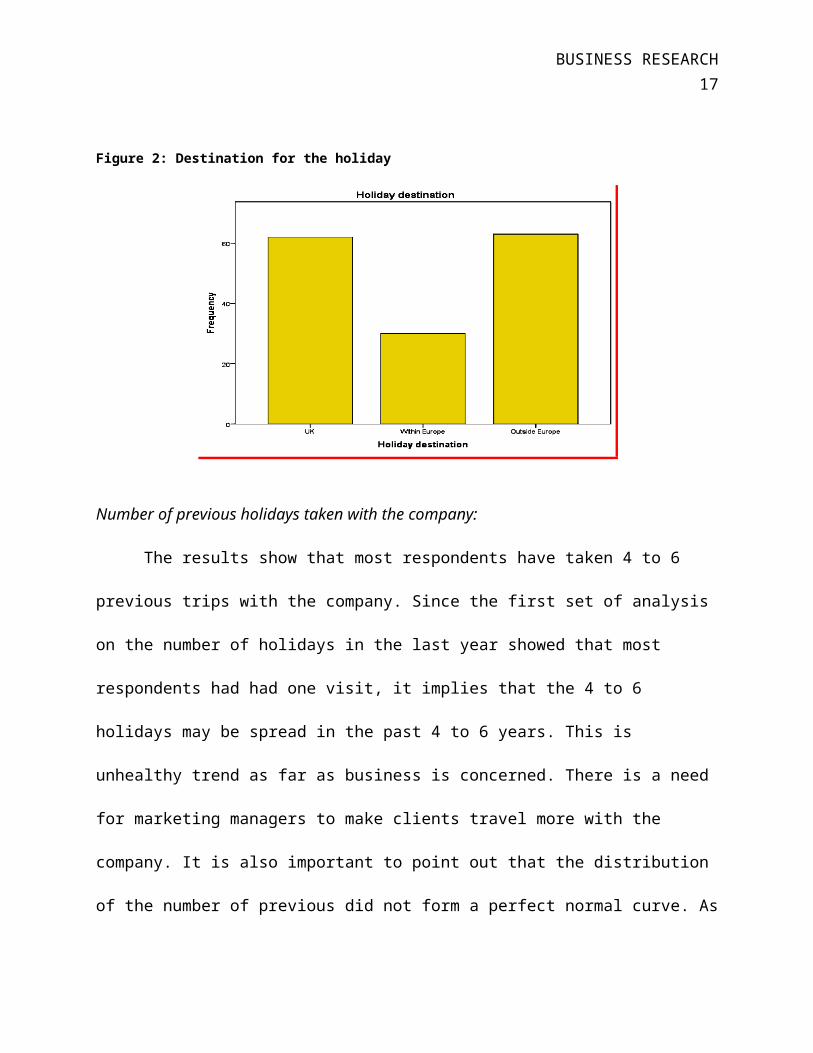
Number of previous holidays taken with the company:
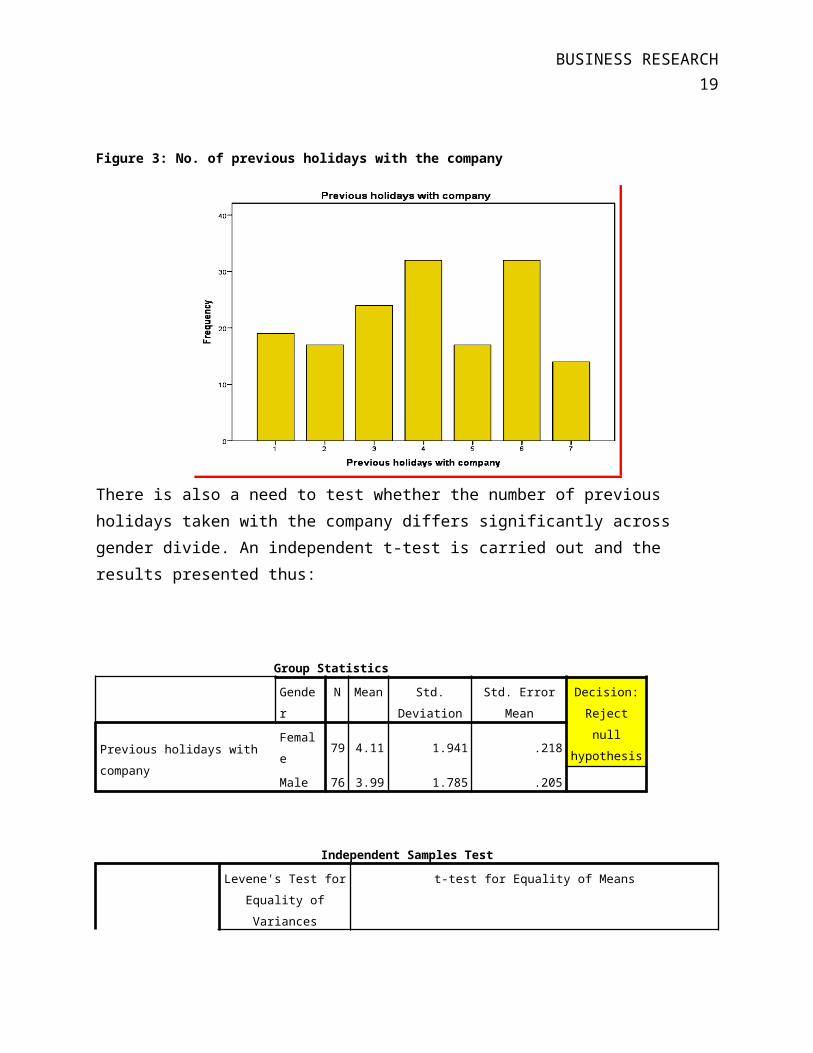
The results show that most respondents have taken 4 to 6
previous trips with the company. Since the first set of analysis
on the number of holidays in the last year showed that most
respondents had had one visit, it implies that the 4 to 6
holidays may be spread in the past 4 to 6 years. This is
unhealthy trend as far as business is concerned. There is a need
for marketing managers to make clients travel more with the
company. It is also important to point out that the distribution
of the number of previous did not form a perfect normal curve. As
BUSINESS RESEARCH18
shown in the corresponding graph below the table, those who
previously travelled with the company 5 times were unexpectedly
low. In order to deal with these fluctuations it the number of
return customers, the company should reconsider its incentives.
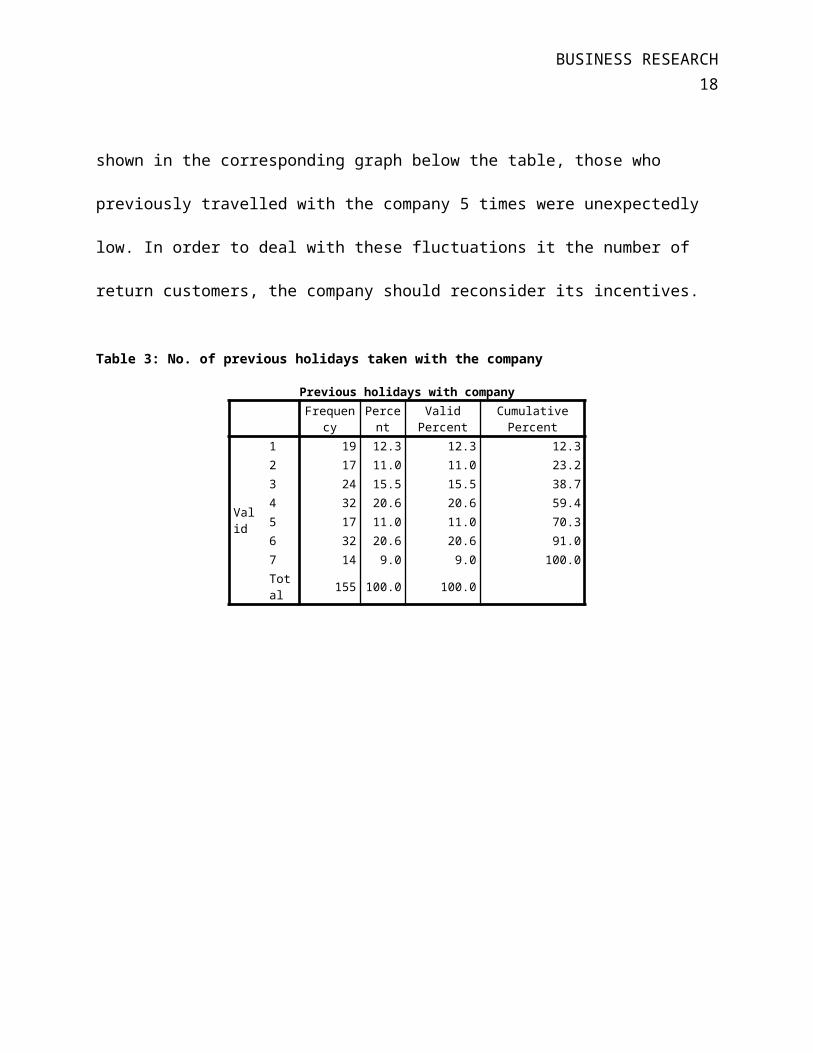
Table 3: No. of previous holidays taken with the company
Previous holidays with companyFrequen
cyPercent
ValidPercent
CumulativePercent
Valid
1 19 12.3 12.3 12.32 17 11.0 11.0 23.23 24 15.5 15.5 38.74 32 20.6 20.6 59.45 17 11.0 11.0 70.36 32 20.6 20.6 91.07 14 9.0 9.0 100.0Total 155 100.0 100.0
BUSINESS RESEARCH19
Figure 3: No. of previous holidays with the company
There is also a need to test whether the number of previous holidays taken with the company differs significantly across gender divide. An independent t-test is carried out and the results presented thus:
Group StatisticsGender
N Mean Std.Deviation
Std. ErrorMean
Decision:Rejectnull
hypothesisPrevious holidays with company
Female
79 4.11 1.941 .218
Male 76 3.99 1.785 .205
Independent Samples TestLevene's Test for
Equality ofVariances
t-test for Equality of Means
BUSINESS RESEARCH20
F Sig. t df Sig.(2-tailed)
MeanDifferen
ce
Std.ErrorDifference
95%ConfidenceInterval of
theDifferenceLower Upper
Previous holidays with company
Equal variances assumed
1.592 .209.424
153 .672 .127 .300 -.465 .720
Equal variances not assumed
.424
152.692
.672 .127 .299 -.464 .719
The null hypothesis is that there is no difference between group means. The test shown in the first table (sig 0,05) shows that there is a difference. Mean for males is 3.99 while for females is 4.11. It means that more females than males have travelled with the company. For management, it implies that more products are developed for women.
(ii) ChildrenRecoding into different variable, those who traveled without
children are assigned “0” and those who had children are assigned “1”.
The null hypothesis is that there is no difference between those who
travelled with children and those who did. The Chi square value is
0.166 with 2 degrees of freedom (p=0.921). Significance level used was
0.05. Since p>0.05, the null hypothesis is rejected.
BUSINESS RESEARCH21
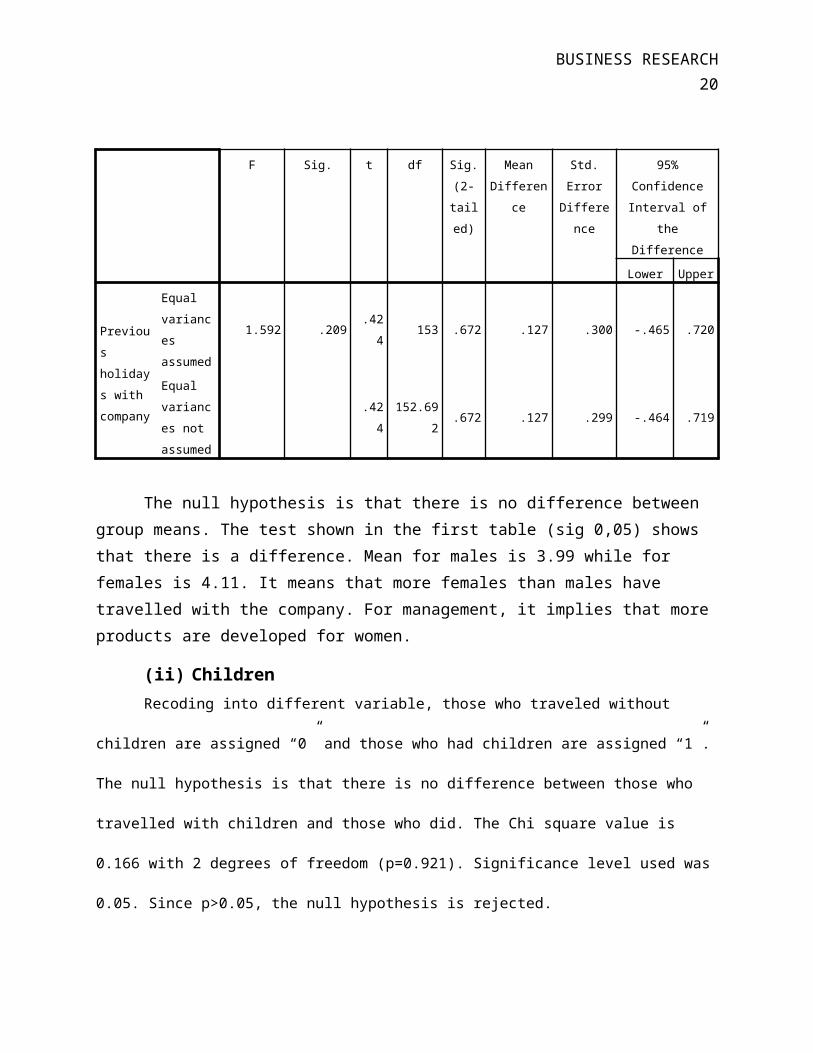
Table 4: Measures of association between destination and whether or not respondents travelled with children
Chi-Square TestsValue df Asymp. Sig. (2-sided)
Pearson Chi-Square .166a 2 .920Likelihood Ratio .166 2 .921Linear-by-Linear Association .156 1 .693N of Valid Cases 155a. 0 cells (0.0%) have expected count less than 5. The minimum expected count is 6.19.
The measures show that the null hypothesis is rejected. As
can be seen in the table in Appendix 6, 20.6% of respondents
travelled without children while 79.4% traveled with children. In
other words, more travelers travel with children. This has some
managerial implications. It implies that among other things, the
company should avail services that are in tandem with children.
This would greatly attract parents to travel with the company as
opposed to those companies that do not provide complimentary
services. This is also shown in the graph below.
BUSINESS RESEARCH22
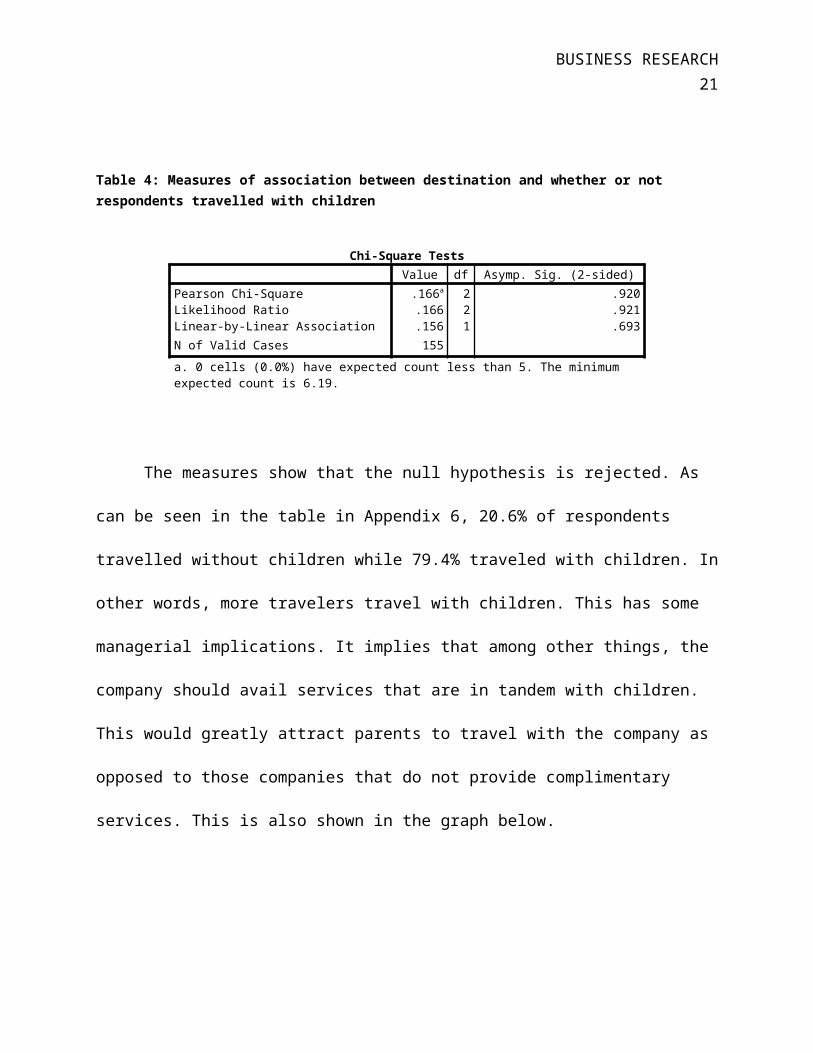
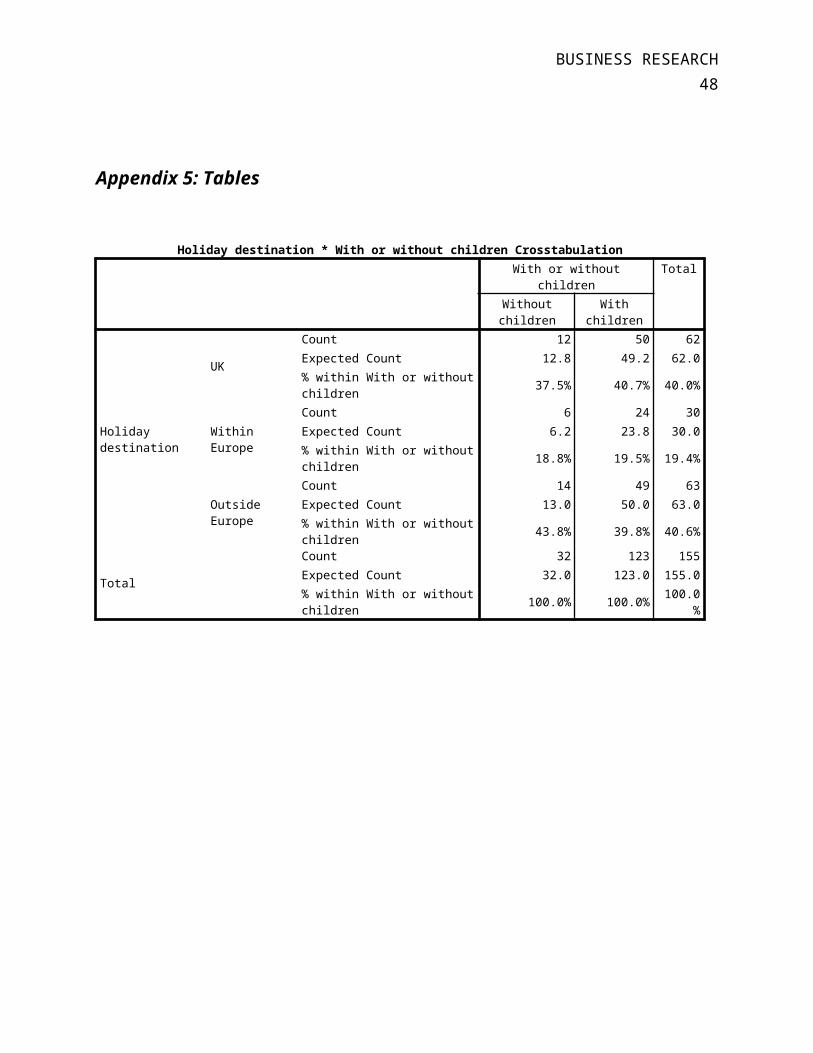
Among those who traveled with children, 40.7% went traveled
within UK, 19.5% within Europe and 39.8% outside Europe. As can be
seen, there is not much difference between “within UK” and “outside
Europe.” This has far reaching implications for management. It implies
that travel to other European countries should not be promoted as much
because it does not make much business sense. It appears that there is
some consumer behavior that is not needs to be addressed before
investing more in non-UK European market. Among those who traveled
with children, 37.5% went to UK, 18.8% within Europe and 43.8%
traveled outside Europe. The latter could imply that the cost involved
in traveling with children may have deterred those who did not travel
BUSINESS RESEARCH23
with them outside Europe to not to travel with them. The company could
consider giving more incentives in line with complementary services
for family travel.
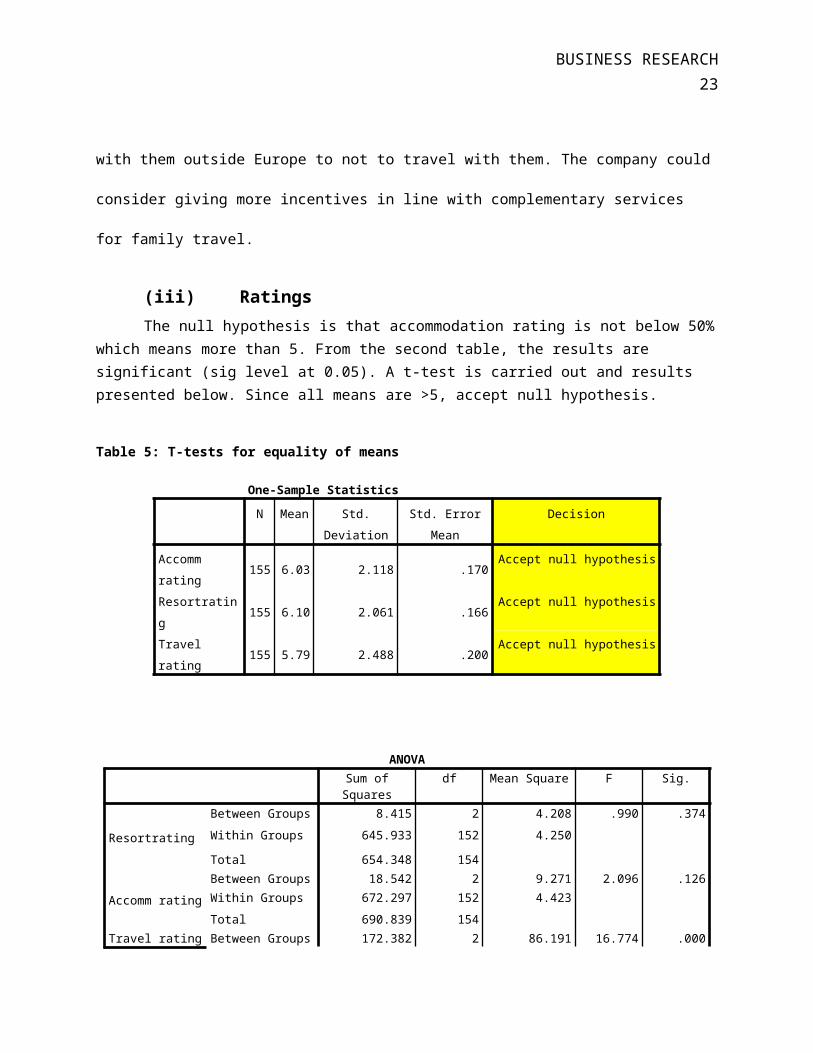
(iii) RatingsThe null hypothesis is that accommodation rating is not below 50%
which means more than 5. From the second table, the results are significant (sig level at 0.05). A t-test is carried out and results presented below. Since all means are >5, accept null hypothesis.
Table 5: T-tests for equality of means
One-Sample StatisticsN Mean Std.
DeviationStd. Error
MeanDecision
Accomm rating
155 6.03 2.118 .170Accept null hypothesis
Resortrating
155 6.10 2.061 .166Accept null hypothesis
Travel rating
155 5.79 2.488 .200Accept null hypothesis
ANOVASum ofSquares
df Mean Square F Sig.
Resortrating
Between Groups 8.415 2 4.208 .990 .374Within Groups 645.933 152 4.250
Total 654.348 154
Accomm ratingBetween Groups 18.542 2 9.271 2.096 .126Within Groups 672.297 152 4.423Total 690.839 154
Travel rating Between Groups 172.382 2 86.191 16.774 .000
BUSINESS RESEARCH24
Within Groups 781.011 152 5.138
Total 953.394 154
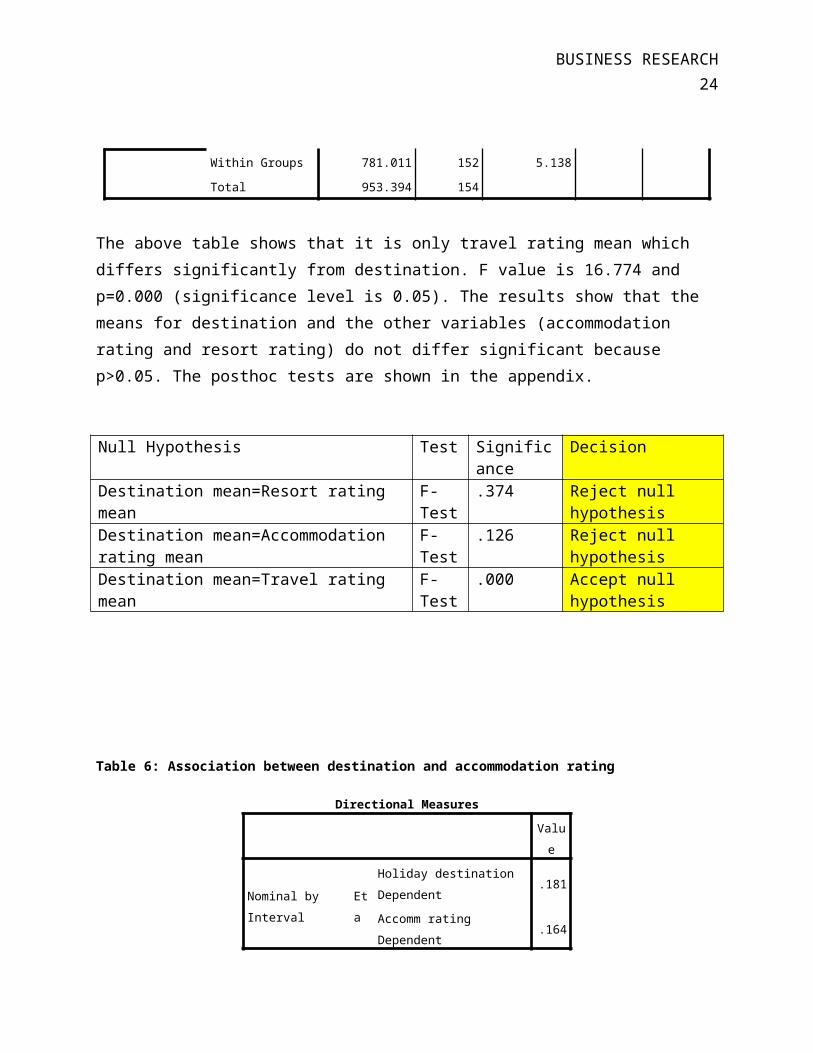
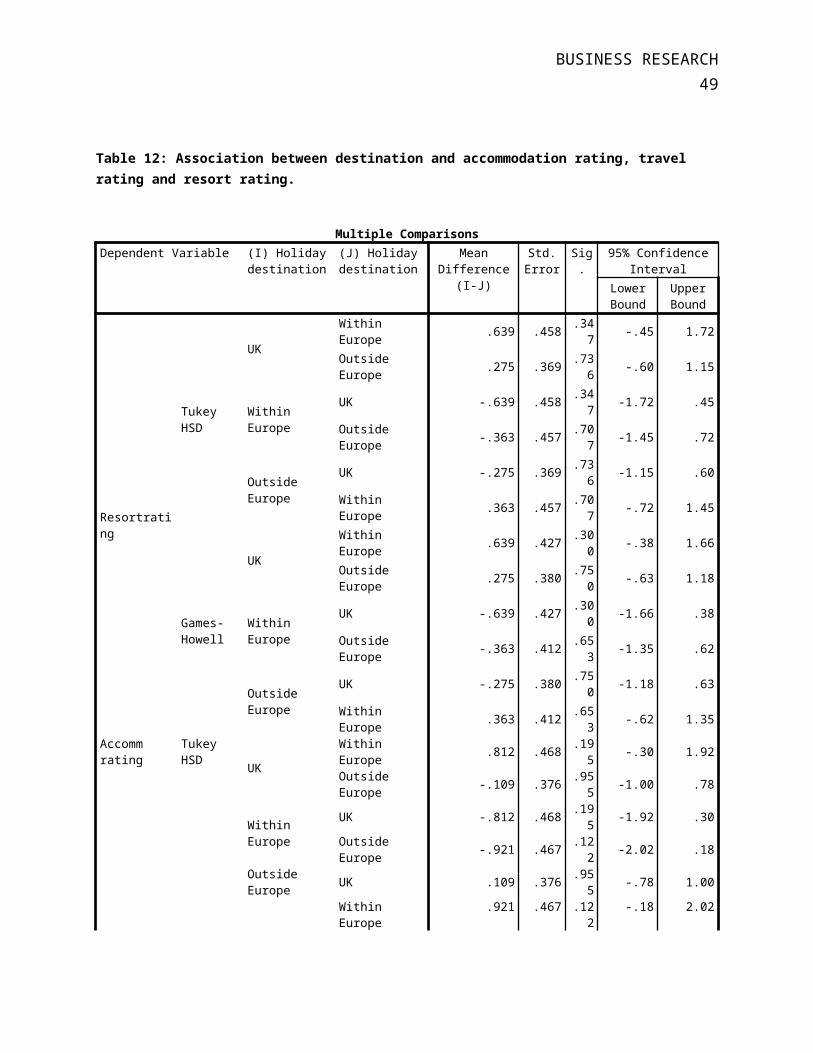
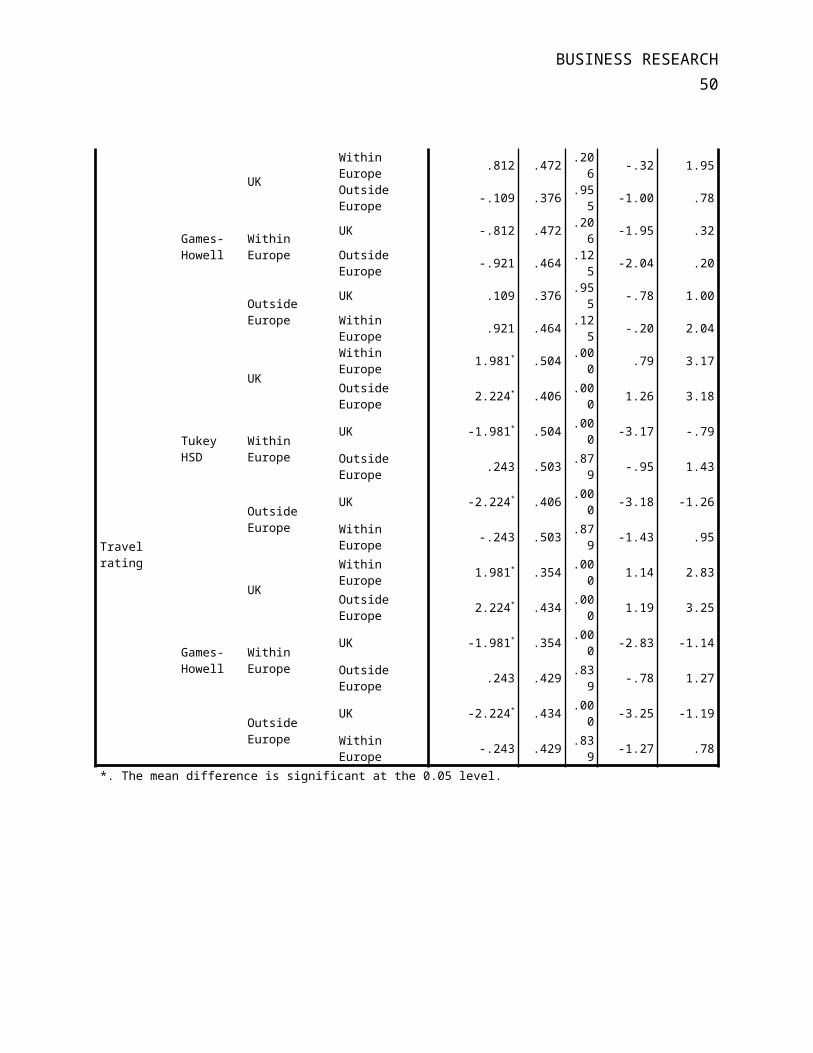
The above table shows that it is only travel rating mean which differs significantly from destination. F value is 16.774 and p=0.000 (significance level is 0.05). The results show that the means for destination and the other variables (accommodation rating and resort rating) do not differ significant because p>0.05. The posthoc tests are shown in the appendix.
Null Hypothesis Test Significance
Decision
Destination mean=Resort rating mean
F-Test
.374 Reject null hypothesis
Destination mean=Accommodation rating mean
F-Test
.126 Reject null hypothesis
Destination mean=Travel rating mean
F-Test
.000 Accept null hypothesis
Table 6: Association between destination and accommodation rating
Directional MeasuresValue
Nominal by Interval
Eta
Holiday destination Dependent
.181
Accomm rating Dependent
.164
BUSINESS RESEARCH25
There is a weak positive association between the
accommodation rating and destination. This is because Eta was
0.181 for destination and 0.164 for accommodation rating.
Although the relationship is weak, it is significant. It was
established that Spearman’s correlation significance was at 0.758
based on normal approximation. Generally, accommodation ratings
in Europe are less that in the other two destinations. The
ratings for UK appear to be the best followed by “outside
Europe.” On a general sense, accommodation rating could be
averaged at 5 and 6. These results are shown in appendix 6.
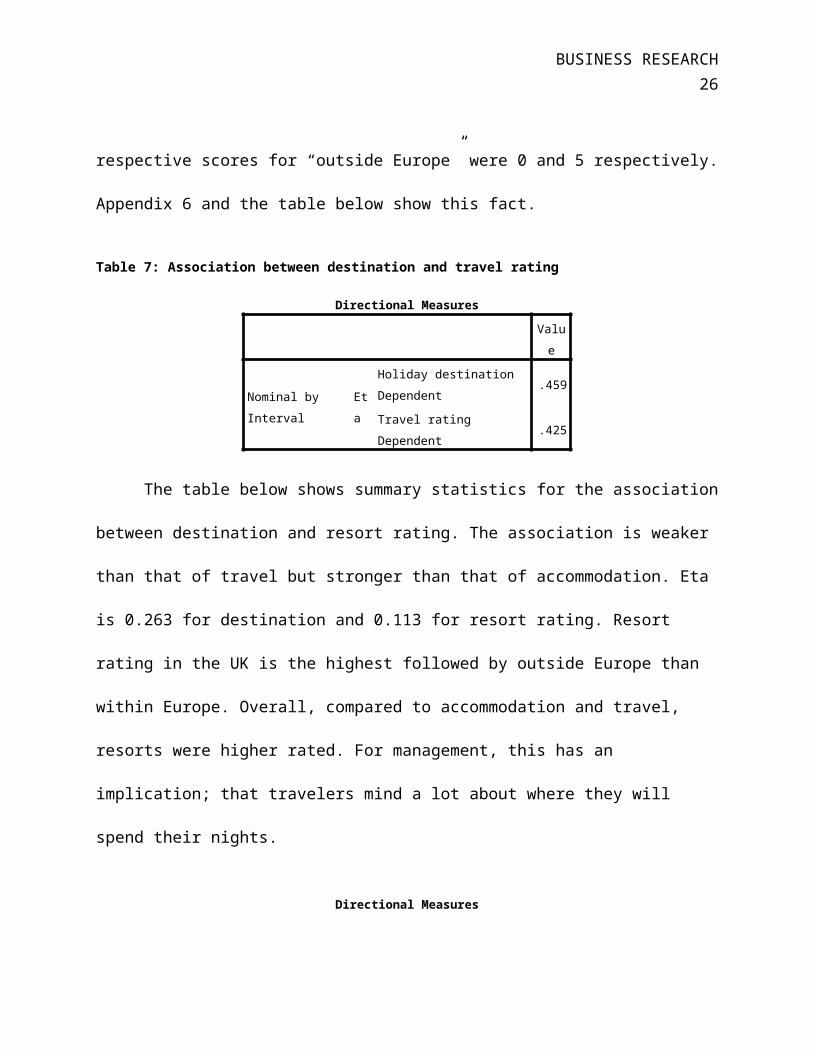
The relationship between travel rating and destination is
also weak. Moreover, it is in a positive direction; and stronger
than that of accommodation. This is because the value of Eta is
0.459 for destination and 0.425 for travel rating. It is also
significant because Spearman correlation is at 0.0000. Most
ratings are between 4 and 6. In UK, travel did not receive any
“negative” rating until at option or level 4 of answers. Rating
within Europe begins at score 3 and peaks at 5 while the
BUSINESS RESEARCH26
respective scores for “outside Europe” were 0 and 5 respectively.
Appendix 6 and the table below show this fact.
Table 7: Association between destination and travel rating
Directional MeasuresValue
Nominal by Interval
Eta
Holiday destination Dependent
.459
Travel rating Dependent
.425
The table below shows summary statistics for the association
between destination and resort rating. The association is weaker
than that of travel but stronger than that of accommodation. Eta
is 0.263 for destination and 0.113 for resort rating. Resort
rating in the UK is the highest followed by outside Europe than
within Europe. Overall, compared to accommodation and travel,
resorts were higher rated. For management, this has an
implication; that travelers mind a lot about where they will
spend their nights.
Directional Measures
BUSINESS RESEARCH27
Value
Nominal by Interval
Eta
Holiday destination Dependent
.263
Resortrating Dependent
.113
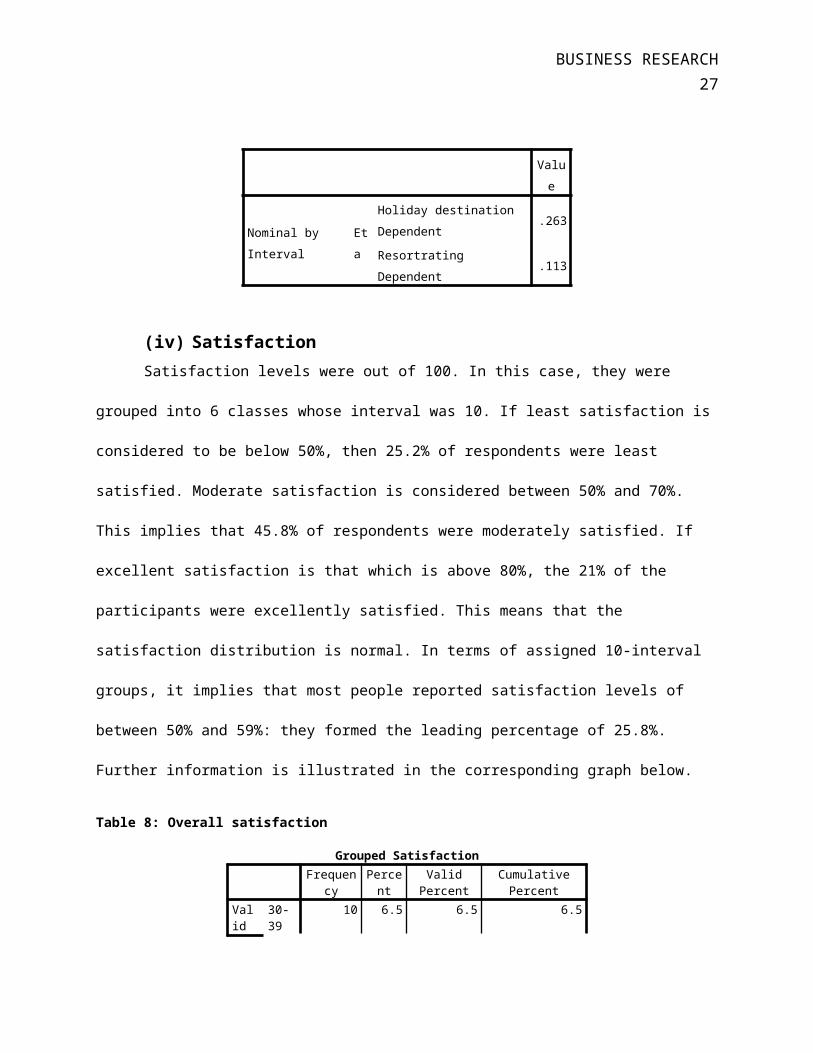
(iv) SatisfactionSatisfaction levels were out of 100. In this case, they were
grouped into 6 classes whose interval was 10. If least satisfaction is
considered to be below 50%, then 25.2% of respondents were least
satisfied. Moderate satisfaction is considered between 50% and 70%.
This implies that 45.8% of respondents were moderately satisfied. If
excellent satisfaction is that which is above 80%, the 21% of the
participants were excellently satisfied. This means that the
satisfaction distribution is normal. In terms of assigned 10-interval
groups, it implies that most people reported satisfaction levels of
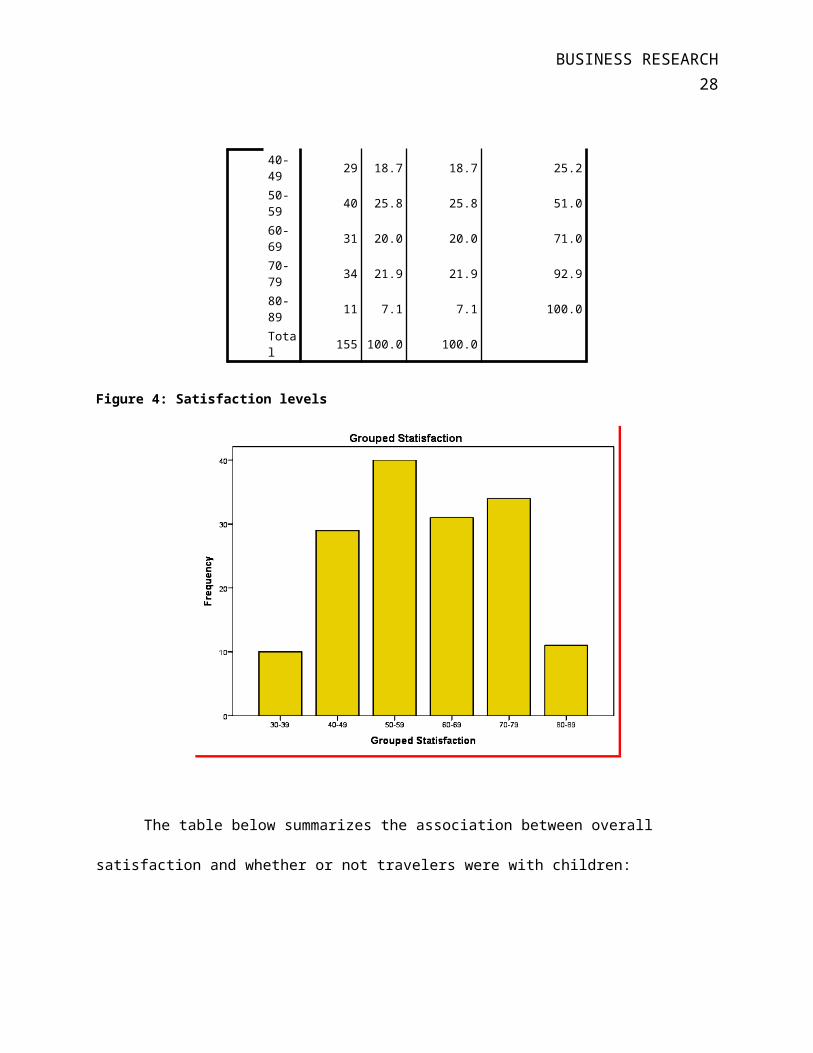
between 50% and 59%: they formed the leading percentage of 25.8%.
Further information is illustrated in the corresponding graph below.
Table 8: Overall satisfaction
Grouped SatisfactionFrequen
cyPercent
ValidPercent
CumulativePercent
Valid
30-39
10 6.5 6.5 6.5
BUSINESS RESEARCH28
40-49 29 18.7 18.7 25.2
50-59 40 25.8 25.8 51.0
60-69 31 20.0 20.0 71.0
70-79 34 21.9 21.9 92.9
80-89 11 7.1 7.1 100.0
Total 155 100.0 100.0
Figure 4: Satisfaction levels
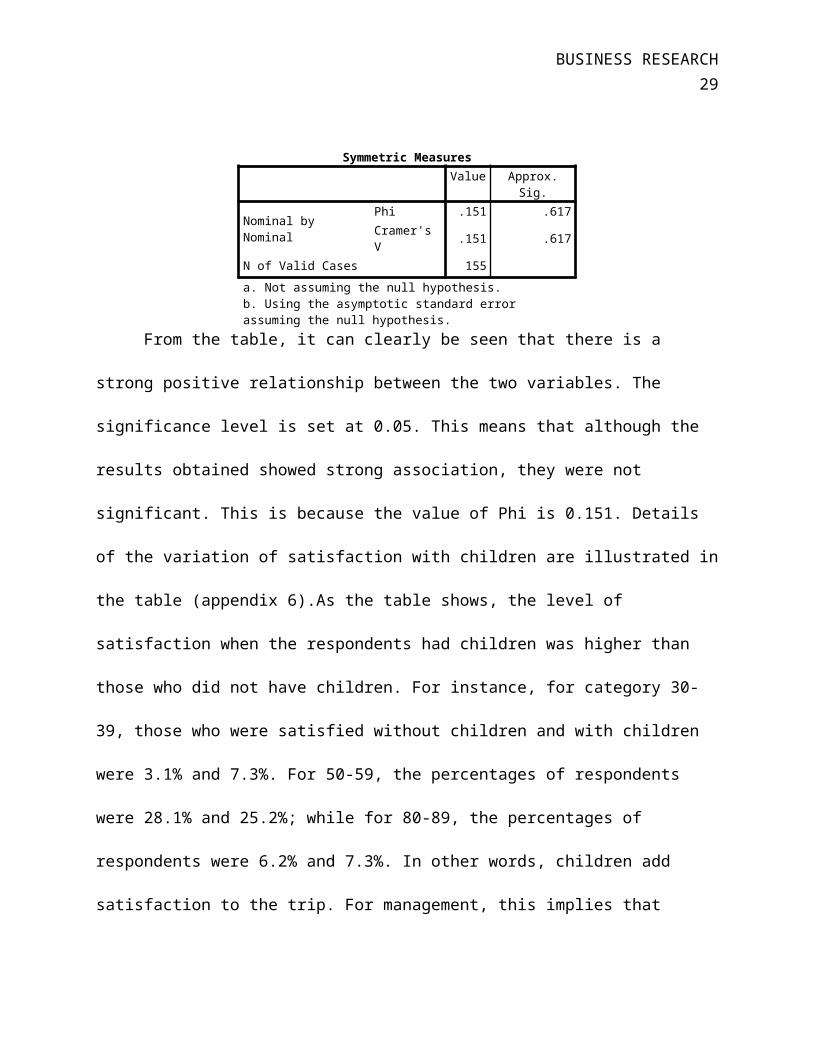
The table below summarizes the association between overall
satisfaction and whether or not travelers were with children:
BUSINESS RESEARCH29
Symmetric MeasuresValue Approx.
Sig.
Nominal by Nominal
Phi .151 .617Cramer's V .151 .617
N of Valid Cases 155a. Not assuming the null hypothesis.b. Using the asymptotic standard error assuming the null hypothesis.
From the table, it can clearly be seen that there is a
strong positive relationship between the two variables. The
significance level is set at 0.05. This means that although the
results obtained showed strong association, they were not
significant. This is because the value of Phi is 0.151. Details
of the variation of satisfaction with children are illustrated in
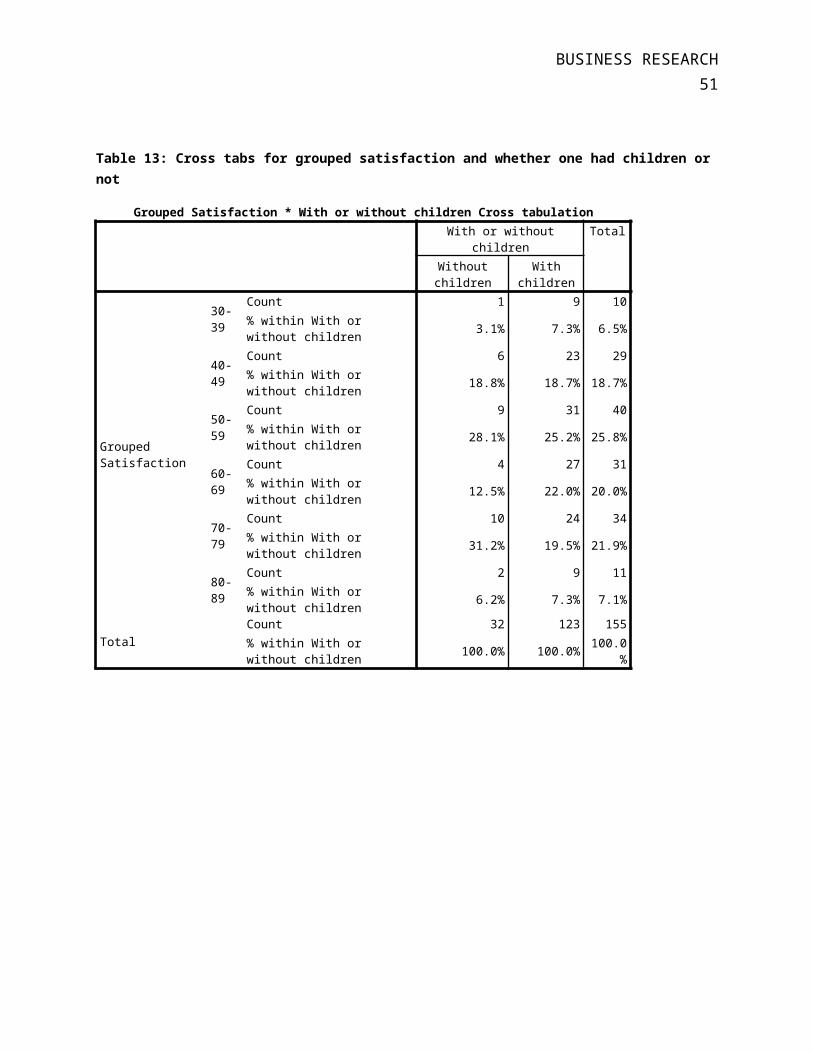
the table (appendix 6).As the table shows, the level of
satisfaction when the respondents had children was higher than
those who did not have children. For instance, for category 30-
39, those who were satisfied without children and with children
were 3.1% and 7.3%. For 50-59, the percentages of respondents
were 28.1% and 25.2%; while for 80-89, the percentages of
respondents were 6.2% and 7.3%. In other words, children add
satisfaction to the trip. For management, this implies that
BUSINESS RESEARCH30
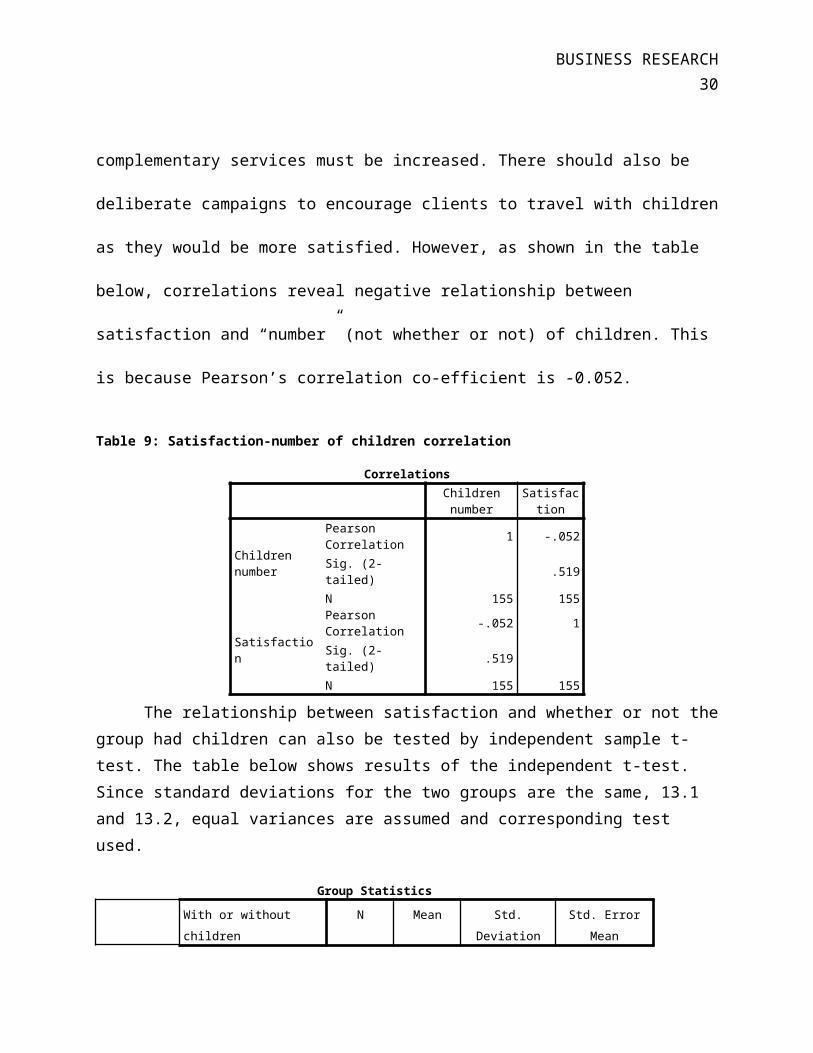
complementary services must be increased. There should also be
deliberate campaigns to encourage clients to travel with children
as they would be more satisfied. However, as shown in the table
below, correlations reveal negative relationship between
satisfaction and “number” (not whether or not) of children. This
is because Pearson’s correlation co-efficient is -0.052.
Table 9: Satisfaction-number of children correlation
CorrelationsChildrennumber
Satisfaction
Children number
Pearson Correlation 1 -.052
Sig. (2-tailed) .519
N 155 155
Satisfaction
Pearson Correlation -.052 1
Sig. (2-tailed) .519
N 155 155
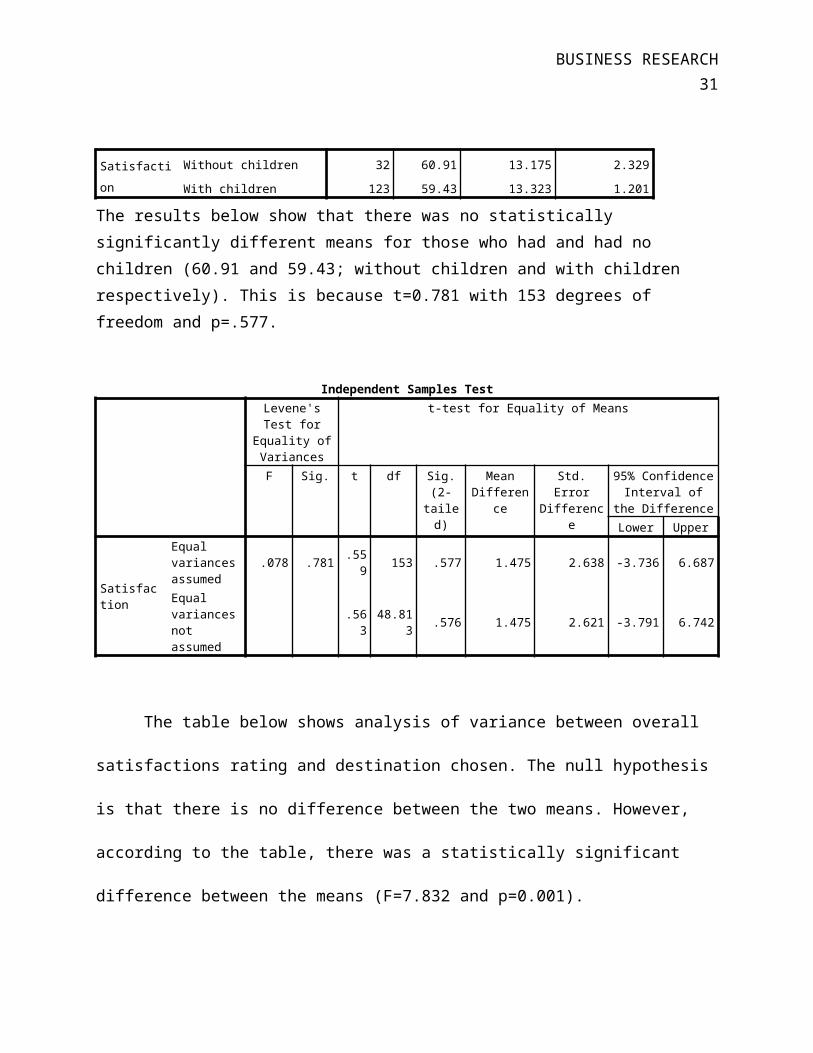
The relationship between satisfaction and whether or not thegroup had children can also be tested by independent sample t-test. The table below shows results of the independent t-test. Since standard deviations for the two groups are the same, 13.1 and 13.2, equal variances are assumed and corresponding test used.
Group StatisticsWith or without children
N Mean Std.Deviation
Std. ErrorMean
BUSINESS RESEARCH31
Satisfaction
Without children 32 60.91 13.175 2.329With children 123 59.43 13.323 1.201
The results below show that there was no statistically significantly different means for those who had and had no children (60.91 and 59.43; without children and with children respectively). This is because t=0.781 with 153 degrees of freedom and p=.577.
Independent Samples TestLevene'sTest for
Equality ofVariances
t-test for Equality of Means
F Sig. t df Sig.(2-tailed)
MeanDifferen
ce
Std.Error
Difference
95% ConfidenceInterval of
the DifferenceLower Upper
Satisfaction
Equal variancesassumed
.078 .781 .559 153 .577 1.475 2.638 -3.736 6.687
Equal variancesnot assumed
.563
48.813 .576 1.475 2.621 -3.791 6.742
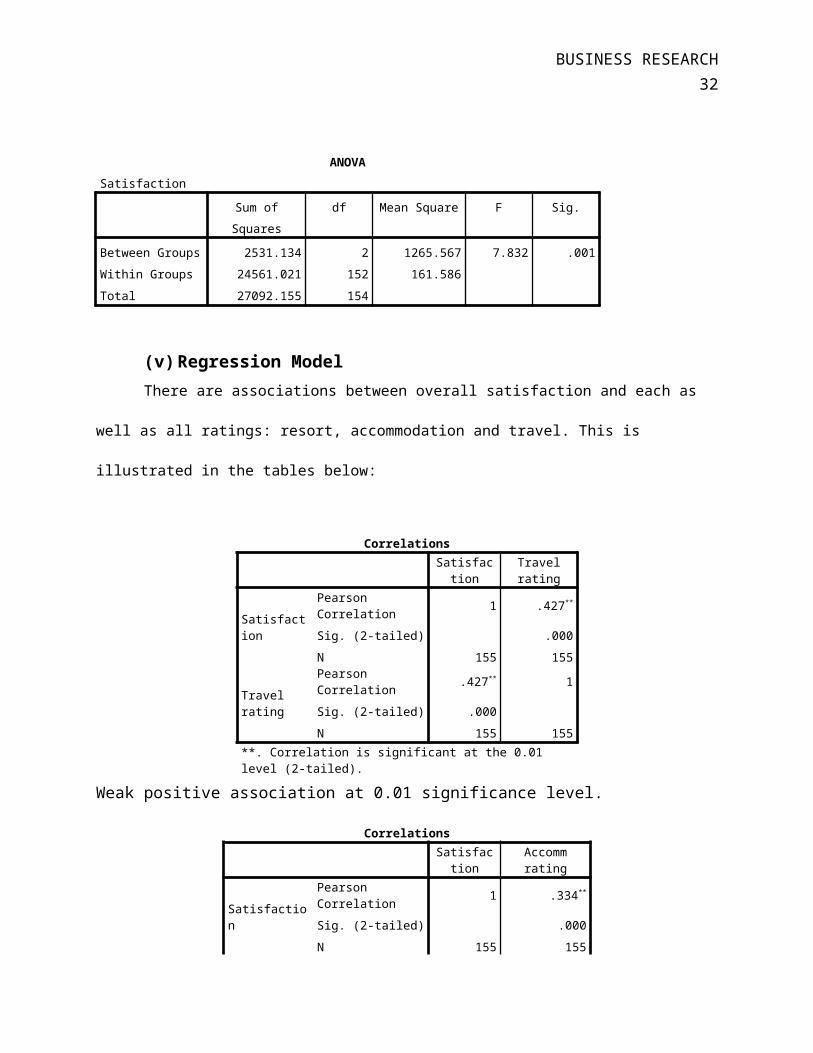
The table below shows analysis of variance between overall
satisfactions rating and destination chosen. The null hypothesis
is that there is no difference between the two means. However,
according to the table, there was a statistically significant
difference between the means (F=7.832 and p=0.001).
BUSINESS RESEARCH32
ANOVASatisfaction
Sum ofSquares
df Mean Square F Sig.
Between Groups 2531.134 2 1265.567 7.832 .001Within Groups 24561.021 152 161.586Total 27092.155 154
(v)Regression ModelThere are associations between overall satisfaction and each as
well as all ratings: resort, accommodation and travel. This is
illustrated in the tables below:
CorrelationsSatisfac
tionTravelrating
Satisfaction
Pearson Correlation 1 .427**
Sig. (2-tailed) .000N 155 155
Travel rating
Pearson Correlation .427** 1
Sig. (2-tailed) .000N 155 155
**. Correlation is significant at the 0.01 level (2-tailed).
Weak positive association at 0.01 significance level.
CorrelationsSatisfac
tionAccommrating
Satisfaction
Pearson Correlation 1 .334**
Sig. (2-tailed) .000N 155 155
BUSINESS RESEARCH33
Accomm rating
Pearson Correlation .334** 1
Sig. (2-tailed) .000N 155 155
**. Correlation is significant at the 0.01 level (2-tailed).
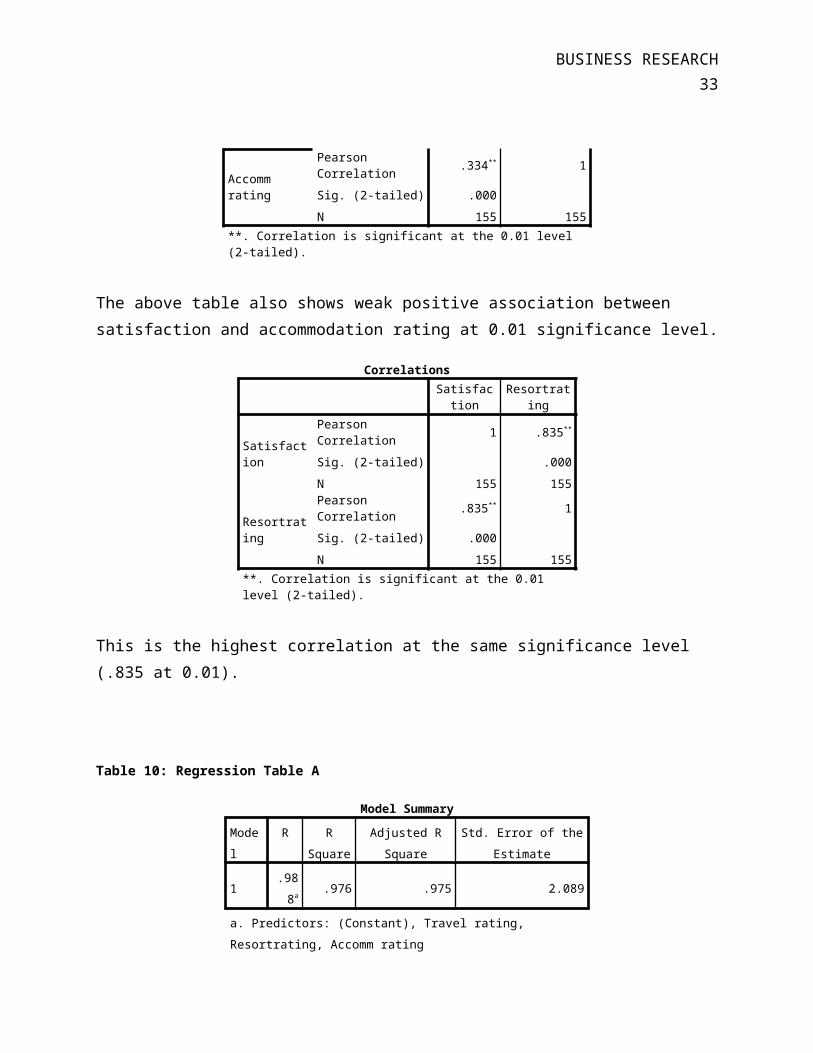
The above table also shows weak positive association between satisfaction and accommodation rating at 0.01 significance level.
CorrelationsSatisfac
tionResortrat
ing
Satisfaction
Pearson Correlation 1 .835**
Sig. (2-tailed) .000N 155 155
Resortrating
Pearson Correlation .835** 1
Sig. (2-tailed) .000N 155 155
**. Correlation is significant at the 0.01 level (2-tailed).
This is the highest correlation at the same significance level (.835 at 0.01).
Table 10: Regression Table A
Model SummaryModel
R RSquare
Adjusted RSquare
Std. Error of theEstimate
1.988a .976 .975 2.089
a. Predictors: (Constant), Travel rating, Resortrating, Accomm rating
BUSINESS RESEARCH34
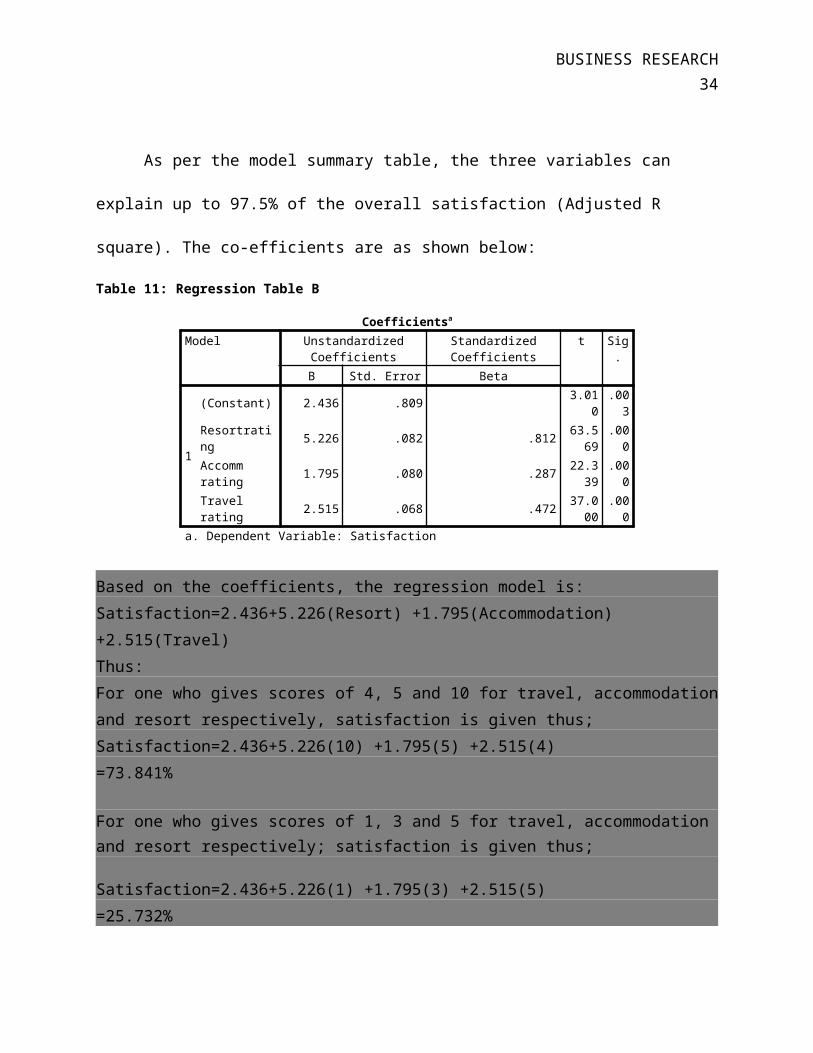
As per the model summary table, the three variables can
explain up to 97.5% of the overall satisfaction (Adjusted R
square). The co-efficients are as shown below:
Table 11: Regression Table B
Coefficientsa
Model UnstandardizedCoefficients
StandardizedCoefficients
t Sig.
B Std. Error Beta
1
(Constant) 2.436 .809 3.010
.003
Resortrating 5.226 .082 .812 63.5
69.000
Accomm rating 1.795 .080 .287 22.3
39.000
Travel rating 2.515 .068 .472 37.0
00.000
a. Dependent Variable: Satisfaction
Based on the coefficients, the regression model is:Satisfaction=2.436+5.226(Resort) +1.795(Accommodation) +2.515(Travel)Thus:For one who gives scores of 4, 5 and 10 for travel, accommodationand resort respectively, satisfaction is given thus;Satisfaction=2.436+5.226(10) +1.795(5) +2.515(4)=73.841%
For one who gives scores of 1, 3 and 5 for travel, accommodation and resort respectively; satisfaction is given thus;
Satisfaction=2.436+5.226(1) +1.795(3) +2.515(5)=25.732%
BUSINESS RESEARCH35
From the above table of co-efficients, resort rating
contributes most to satisfaction. A high score such as 10
translates into greater satisfaction (first model). The
management should ensure that they take their clients to better
hotels and restaurants. On the contrary, if resorts are given low
scores such as 1 in the second model, there is expected to be low
satisfaction.
ConclusionAs a matter of conclusion, this study aimed at establishing
the opinions of clients towards the services, packages and
related aspects of the company. This was done through designing a
questionnaire that captured all the objectives. After carefully
evaluating the questionnaire, it was apparent that it had more
strengths than weaknesses. In the first part of the report, it
was evident that development and critical analyses of the
questionnaire were handled. In the second part of the paper, data
analysis and findings were presented. It was found out that type

BUSINESS RESEARCH36
of resorts were the greatest predictor of satisfaction among
clients in North East England.
BUSINESS RESEARCH37
List of ReferencesAlana, J. E., Slater, T. & Bucknam, A. (2011). Action Research for Business,
Nonprofit, and Public Administration - A Tool for Complex Times . Thousand Oaks, CA: Sage
Armstrong, J.S. & Fildes, R. (2006). "Monetary Incentives in MailSurveys". International Journal of Forecasting.
Armstrong, J.S. & Soelberg, P. (1968). "On the Interpretation of Factor Analysis". Psychological Bulletin, 70, 61–364.
Armstrong, J.S. & Sperry, T. (1994). "Business School Prestige: Research versus Teaching". Energy & Environment, 18 (2), 13–43.
Berg, B. L., (2009). Qualitative Research Methods for the Social Sciences. 7th ed. Boston, MA: Pearson Education Inc.
Cohen, N. & Arieli, T. (2011) Field research in conflict environments: Methodological challenges and snowball sampling. Journal of Peace Research, 48 (4), 423–436.
Creswell, J. W. (2008). Educational Research: Planning, Conducting, and Evaluating Quantitative and Qualitative Research. Upper Saddle River, NJ. Pearson Education, Inc.
Eisner, E. W. (1981). "On the Differences between Scientific and Artistic Approaches to Qualitative Research". Educational Researcher, 10 (4), 5–9.
Franklin, M.I. (2012). Understanding Research: Coping with the Quantitative-Qualitative Divide. London and New York: Routledge.
BUSINESS RESEARCH38
Freshwater, D., Sherwood, G. & Drury, V. (2006) International research collaboration. Issues, benefits and challenges of the global network. Journal of Research in Nursing, 11 (4), 9295–303.
Herrman, C. S. (2009). “Fundamentals of Methodology,” a series of papers On the Social Sciences Research Network (SSRN).
Joubish, F. (2009). Educational Research, Federal Urdu University, Karachi,Pakistan.
Kara, H. (2012) Research and Evaluation for Busy Practitioners: A Time-Saving Guide. Bristol: The Policy Press.
Lesage, D. (2009). "Who’s Afraid of Artistic Research? On measuring artistic research output". Art &Research: A Journal of Ideas, Contexts and Methods, 2 (2).
Patton, M. Q. (2002). Qualitative research & evaluation methods, 3rd ed. Thousand Oaks, CA: Sage Publications.
Silverman, D. (Ed). (2011). Qualitative Research: Issues of Theory, Method and Practice, 3rd ed. London, Sage Publications.
BUSINESS RESEARCH39
Appendices
Appendix 1: Questionnaire Introduction
Dear Customers,
We are carrying out an evaluation of our services and products. We wish to ask your opinion so that we can improve where necessary and make them more relevant for you. We assure you that this information will only be used for research purposes (Do not write your name anywhere in this questionnaire).
Filing the questionnaire will take about 15 minutes. Kindly tick or fill as is appropriate.
Thanking you in advance.
BUSINESS RESEARCH40
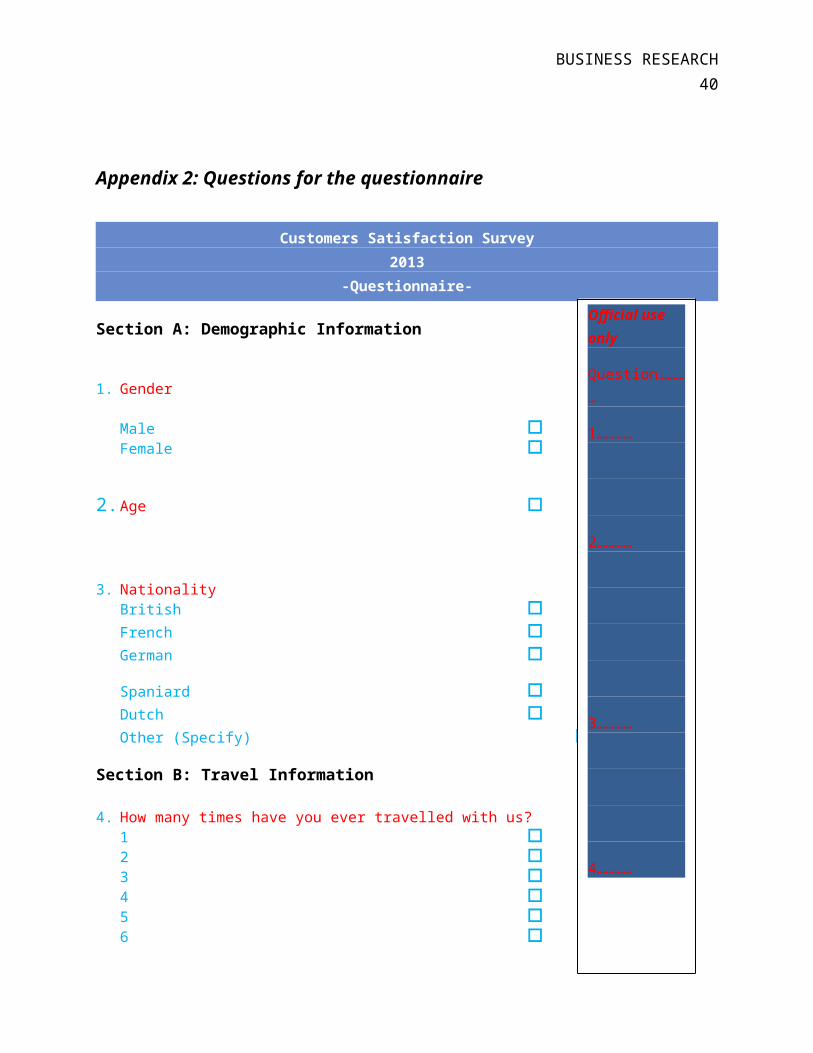
Appendix 2: Questions for the questionnaire
Customers Satisfaction Survey2013
-Questionnaire-
Section A: Demographic Information
1. Gender
Male Female
2.Age
3. NationalityBritish French German
Spaniard Dutch Other (Specify)
Section B: Travel Information
4. How many times have you ever travelled with us?1 2 3 4 5 6
Official use only
Question…………
1…………
2…………
3…………
4…………
BUSINESS RESEARCH41
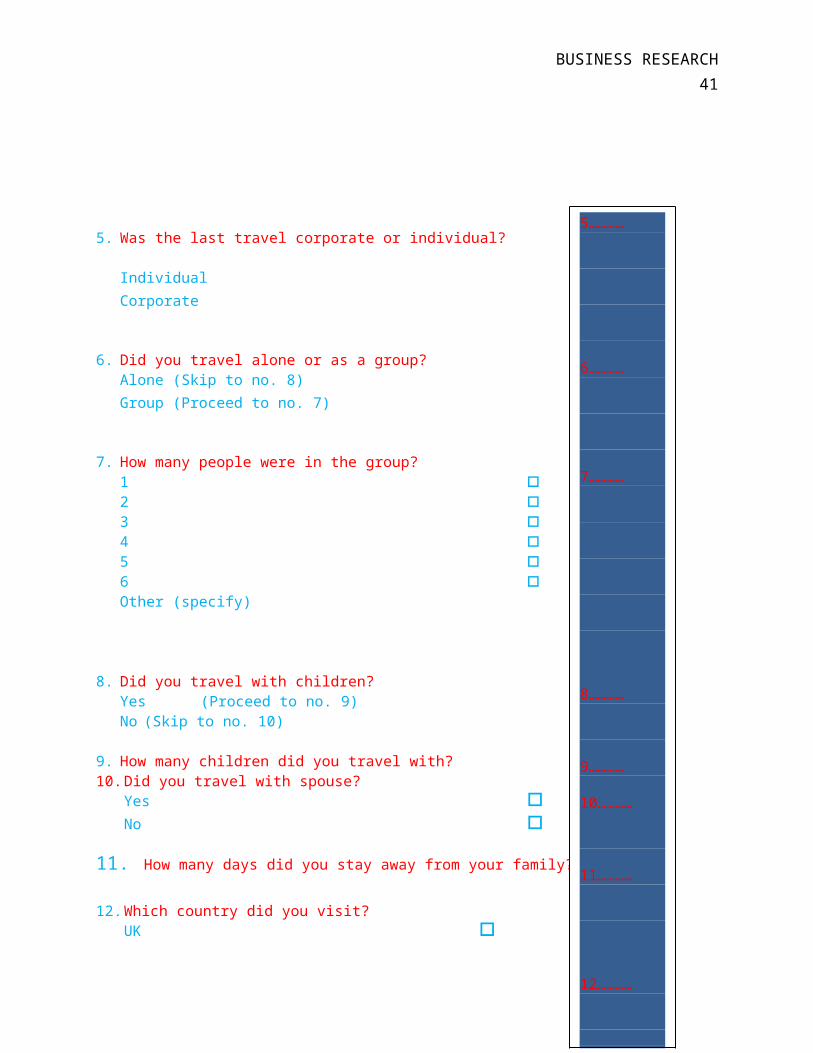
5. Was the last travel corporate or individual?
Individual Corporate
6. Did you travel alone or as a group?Alone (Skip to no. 8)
Group (Proceed to no. 7)
7. How many people were in the group?1 2 3 4 5 6 Other (specify)
8. Did you travel with children?Yes (Proceed to no. 9) No (Skip to no. 10)
9. How many children did you travel with? 10.Did you travel with spouse?
Yes No
11. How many days did you stay away from your family?
12.Which country did you visit?UK
5…………
6…………
7…………
8…………
9…………
10…………
11…………
12…………
BUSINESS RESEARCH42
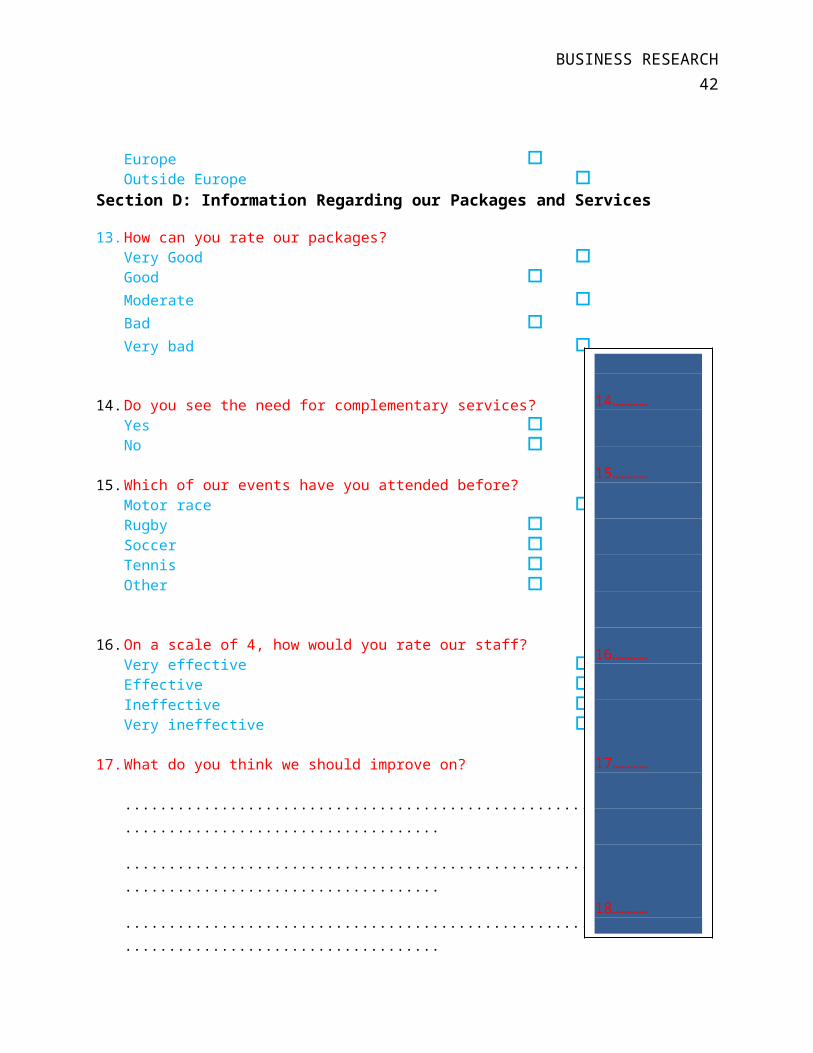
Europe Outside Europe
Section D: Information Regarding our Packages and Services
13.How can you rate our packages?Very Good Good Moderate Bad Very bad
14.Do you see the need for complementary services?Yes No
15.Which of our events have you attended before?Motor race Rugby Soccer Tennis Other
16.On a scale of 4, how would you rate our staff? Very effective Effective Ineffective Very ineffective
17.What do you think we should improve on?
...................................................................
....................................
...................................................................
....................................
...................................................................
....................................
14…………
15…………
16…………
17…………
18…………

BUSINESS RESEARCH43
18.Any other comment?
Thank you very much for taking the time to complete thisquestionnaire.
BUSINESS RESEARCH44
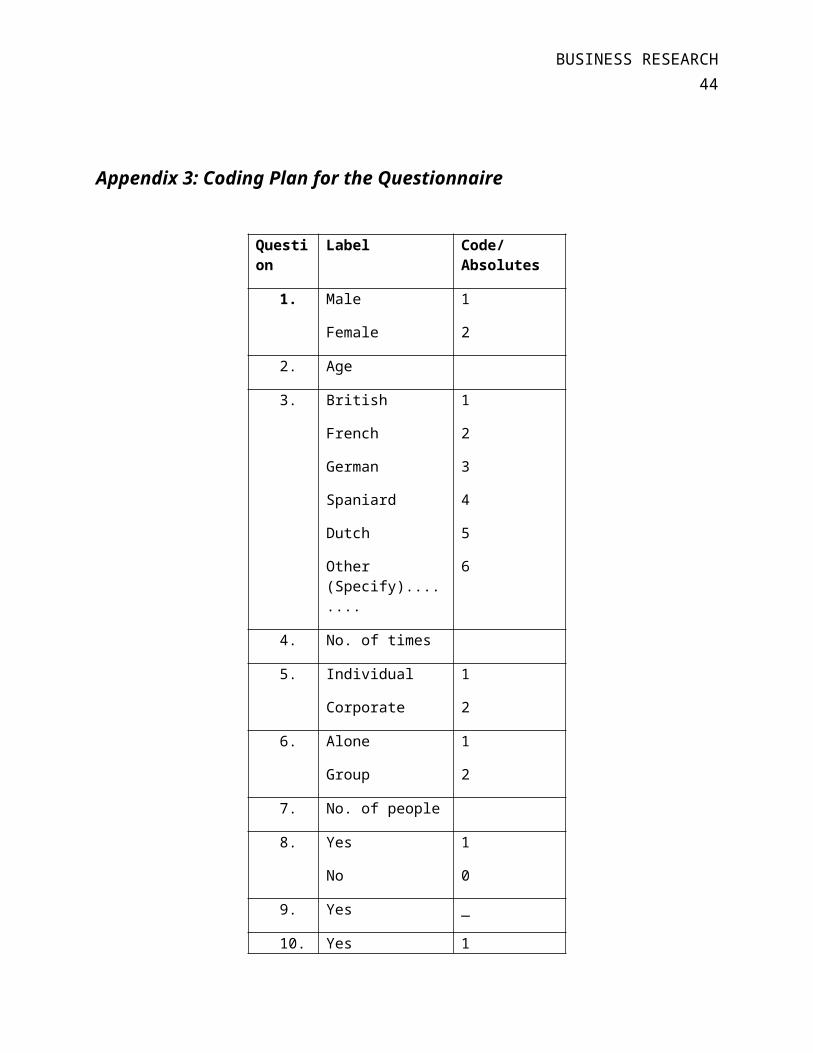
Appendix 3: Coding Plan for the Questionnaire
Question
Label Code/Absolutes
1. Male
Female
1
2
2. Age
3. British
French
German
Spaniard
Dutch
Other (Specify)........
1
2
3
4
5
6
4. No. of times
5. Individual
Corporate
1
2
6. Alone
Group
1
2
7. No. of people
8. Yes
No
1
0
9. Yes _
10. Yes 1
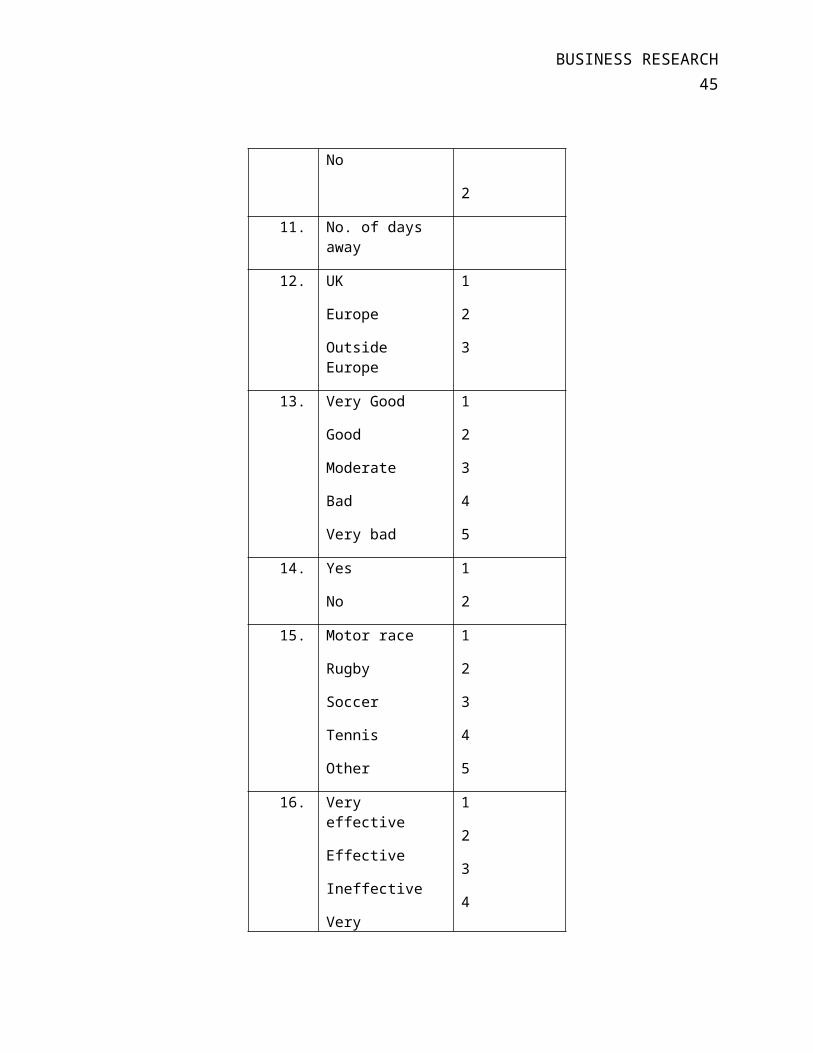
BUSINESS RESEARCH45
No
2
11. No. of days away
12. UK
Europe
Outside Europe
1
2
3
13. Very Good
Good
Moderate
Bad
Very bad
1
2
3
4
5
14. Yes
No
1
2
15. Motor race
Rugby
Soccer
Tennis
Other
1
2
3
4
5
16. Very effective
Effective
Ineffective
Very
1
2
3
4
BUSINESS RESEARCH46
ineffective
17. _ _
18. _ _
BUSINESS RESEARCH47
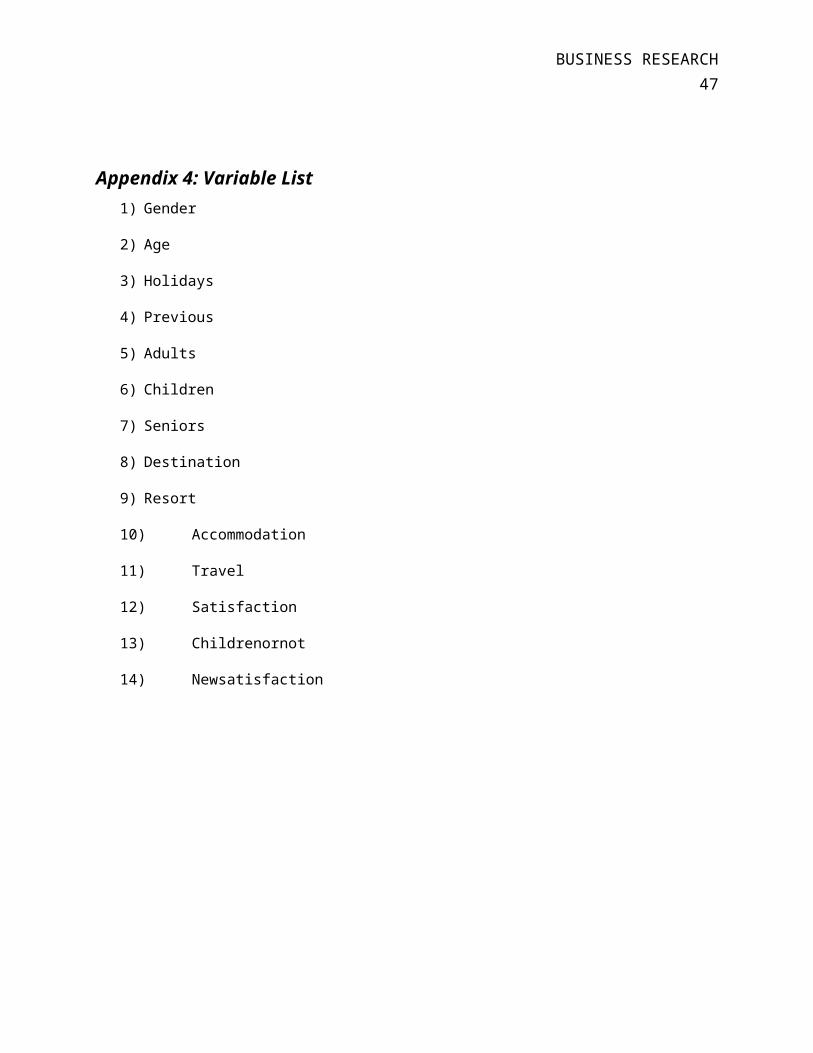
Appendix 4: Variable List1) Gender
2) Age
3) Holidays
4) Previous
5) Adults
6) Children
7) Seniors
8) Destination
9) Resort
10) Accommodation
11) Travel
12) Satisfaction
13) Childrenornot
14) Newsatisfaction
BUSINESS RESEARCH48
Appendix 5: Tables
Holiday destination * With or without children CrosstabulationWith or without
childrenTotal
Withoutchildren
Withchildren
Holiday destination
UK
Count 12 50 62Expected Count 12.8 49.2 62.0% within With or withoutchildren 37.5% 40.7% 40.0%
Within Europe
Count 6 24 30Expected Count 6.2 23.8 30.0% within With or withoutchildren 18.8% 19.5% 19.4%
Outside Europe
Count 14 49 63Expected Count 13.0 50.0 63.0% within With or withoutchildren 43.8% 39.8% 40.6%
Total
Count 32 123 155Expected Count 32.0 123.0 155.0% within With or withoutchildren 100.0% 100.0% 100.0
%
BUSINESS RESEARCH49
Table 12: Association between destination and accommodation rating, travel rating and resort rating.
Multiple ComparisonsDependent Variable (I) Holiday
destination(J) Holidaydestination
MeanDifference
(I-J)
Std.Error
Sig.
95% ConfidenceInterval
LowerBound
UpperBound
Resortrating
Tukey HSD
UK
Within Europe .639 .458 .34
7 -.45 1.72
Outside Europe .275 .369 .73
6 -.60 1.15
Within Europe
UK -.639 .458 .347 -1.72 .45
Outside Europe -.363 .457 .70
7 -1.45 .72
Outside Europe
UK -.275 .369 .736 -1.15 .60
Within Europe .363 .457 .70
7 -.72 1.45
Games-Howell
UK
Within Europe .639 .427 .30
0 -.38 1.66
Outside Europe .275 .380 .75
0 -.63 1.18
Within Europe
UK -.639 .427 .300 -1.66 .38
Outside Europe -.363 .412 .65
3 -1.35 .62
Outside Europe
UK -.275 .380 .750 -1.18 .63
Within Europe .363 .412 .65
3 -.62 1.35
Accomm rating
Tukey HSD UK
Within Europe .812 .468 .19
5 -.30 1.92
Outside Europe -.109 .376 .95
5 -1.00 .78
Within Europe
UK -.812 .468 .195 -1.92 .30
Outside Europe -.921 .467 .12
2 -2.02 .18
Outside Europe UK .109 .376 .95
5 -.78 1.00
Within Europe
.921 .467 .122
-.18 2.02
BUSINESS RESEARCH50
Games-Howell
UK
Within Europe .812 .472 .20
6 -.32 1.95
Outside Europe -.109 .376 .95
5 -1.00 .78
Within Europe
UK -.812 .472 .206 -1.95 .32
Outside Europe -.921 .464 .12
5 -2.04 .20
Outside Europe
UK .109 .376 .955 -.78 1.00
Within Europe .921 .464 .12
5 -.20 2.04
Travel rating
Tukey HSD
UK
Within Europe 1.981* .504 .00
0 .79 3.17
Outside Europe 2.224* .406 .00
0 1.26 3.18
Within Europe
UK -1.981* .504 .000 -3.17 -.79
Outside Europe .243 .503 .87
9 -.95 1.43
Outside Europe
UK -2.224* .406 .000 -3.18 -1.26
Within Europe -.243 .503 .87
9 -1.43 .95
Games-Howell
UK
Within Europe 1.981* .354 .00
0 1.14 2.83
Outside Europe 2.224* .434 .00
0 1.19 3.25
Within Europe
UK -1.981* .354 .000 -2.83 -1.14
Outside Europe .243 .429 .83
9 -.78 1.27
Outside Europe
UK -2.224* .434 .000 -3.25 -1.19
Within Europe -.243 .429 .83
9 -1.27 .78
*. The mean difference is significant at the 0.05 level.
BUSINESS RESEARCH51
Table 13: Cross tabs for grouped satisfaction and whether one had children or not
Grouped Satisfaction * With or without children Cross tabulationWith or without
childrenTotal
Withoutchildren
Withchildren
Grouped Satisfaction
30-39
Count 1 9 10% within With or without children 3.1% 7.3% 6.5%
40-49
Count 6 23 29% within With or without children 18.8% 18.7% 18.7%
50-59
Count 9 31 40% within With or without children 28.1% 25.2% 25.8%
60-69
Count 4 27 31% within With or without children 12.5% 22.0% 20.0%
70-79
Count 10 24 34% within With or without children 31.2% 19.5% 21.9%
80-89
Count 2 9 11% within With or without children 6.2% 7.3% 7.1%
TotalCount 32 123 155% within With or without children 100.0% 100.0% 100.0
%
Related Documents