10 Hospitality Upgrade | Spring 2008 www.hospitalityupgrade.com BUSINESS INTELLIGENCE by Jon Inge ©fotolia.com There are four main aspects to ensuring a successful BI implementation: 1| clean, consistent data in every system involved, carefully defined to allow meaningful analysis 2| sophisticated consolidation tools to combine it into a single, cohesive database 3| skillfully designed reporting and analysis tools 4| strong management commitment to process improvement based on the output Hoteliers are no different from the rest of us buried under the huge amounts of operational data generated by their management systems. The truism about finding a needle in the haystack has never been more apt, and the stack seems to grow exponentially each year. As managers dig through it looking for critical data they’re distracted by all the straw blowing around them in the wind. How do they find the pieces of information they need? And how do they decide which of the apparently ran- dom swirls of hay are actually trends they need to pick up on and deal with? There’s no question that great amounts of potentially useful data are contained in each of the principal systems on any typical property. However, until it’s integrated into a meaningful whole it’s hard to identify both operational exceptions and trends. There is so much information available that it can be hard to know where to start. Properties using a fully integrated multimodular system with a single database (such as, to varying degrees, MICROS's OPERA, NORTHWIND’s Maestro, Agilysys’ Visual One and LMS, PAR Springer-Miller’s Host, IQWare, etc.) often find that the ad hoc report-writing/filtering tools built into them may be enough to let them keep tabs on at least the main areas of day-to-day interest. Most systems can export data to Excel for further analysis, and most vendors provide data dictionaries for hotels wanting to explore the data more deeply using third-party tools such as Crystal Reports or Cognos. But while Excel is certainly very useful, most properties use a mix of systems from dif- ferent vendors or are part of a multiproperty organization. Then the task quickly becomes far more difficult, both because of the sheer volume of data and because it isn’t consistent and coherent across all systems or properties. Even though some chains are quite strict in requiring every site to use the same set of systems – even, in a centrally hosted configu- ration, one single system – each property may not use the same data fields in quite the same way. For management companies that operate properties under several different franchise brands with very different system standards, it’s exponentially more difficult. It’s no won- der that interest in business intelligence has mushroomed recently. BUSINESS INTELLIGENCE

Welcome message from author
This document is posted to help you gain knowledge. Please leave a comment to let me know what you think about it! Share it to your friends and learn new things together.
Transcript
10 Hospitality Upgrade | Spring 2008 www.hospitalityupgrade.com
B U S i n e S S i n t e l l i g e n c e
by Jon Inge
©fo
tolia
.com
there are four main aspects to ensuring a successful Bi implementation:
1| clean, consistent data in every system involved, carefully defined to allow meaningful analysis
2| sophisticated consolidation tools to combine it into a single, cohesive database
3| skillfully designed reporting and analysis tools
4| strong management commitment to process improvement based on the output
Hoteliers are no different from the rest of us buried under the huge amounts of operational data generated by their management systems. The truism about finding a needle in the haystack has never been more apt, and the stack seems to grow exponentially each year. As managers dig through it looking for critical data they’re distracted by all the straw blowing around them in the wind. How do they find the pieces of information they need? And how do they decide which of the apparently ran-dom swirls of hay are actually trends they need to pick up on and deal with?
There’s no question that great amounts of potentially useful data are contained in each of the principal systems on any typical property. However, until it’s integrated into a meaningful whole it’s hard to identify both operational exceptions and trends. There is so much information available that it can be hard to know where to start.
Properties using a fully integrated multimodular system with a single database (such as, to varying degrees, MICROS's OPERA, NORTHWIND’s Maestro, Agilysys’ Visual One and LMS, PAR Springer-Miller’s
Host, IQWare, etc.) often find that the ad hoc report-writing/filtering tools built into them may be enough to let them keep tabs on at least the main areas of day-to-day interest. Most systems can export data to Excel for further analysis, and most vendors provide data dictionaries for hotels wanting to explore the data more deeply using third-party tools such as Crystal Reports or Cognos.
But while Excel is certainly very useful, most properties use a mix of systems from dif-ferent vendors or are part of a multiproperty organization. Then the task quickly becomes far more difficult, both because of the sheer volume of data and because it isn’t consistent and coherent across all systems or properties. Even though some chains are quite strict in requiring every site to use the same set of systems – even, in a centrally hosted configu-ration, one single system – each property may not use the same data fields in quite the same way. For management companies that operate properties under several different franchise brands with very different system standards, it’s exponentially more difficult. It’s no won-der that interest in business intelligence has mushroomed recently.
Business intelligence

12 Hospitality Upgrade | Spring 2008 www.hospitalityupgrade.com
One company known for making the maximum use of data collected from its systems is Marriott
International, no mean feat given the number of different brands and applications involved. Marriott has pulled data from the chain systems into a central database for years now, using it to provide revenue management-type information to the properties. What’s new?
"There’s been an explosion of new BI tools recently," said Mike Keppler, VP sales, marketing and revenue management systems. "The tools have enhanced our insight in key new areas of the business, such as Web site traffic and customer click-stream patterns. Another is around labor management, with tools for scheduling and optimizing how we schedule staff in line with business needs. We're also applying new BI techniques to unstructured data, using a text analytics tool. There’s a great deal of valuable information in guest satisfaction and customer care comments, and these tools help you see the patterns."
What makes BI work at Marriott? "It requires a true partnership with the business side of the house. IT should always be looking at a variety of available BI tools and techniques in the light of strategic and tactical discussions with business to see where each might be best used – are we trying to drive new revenue, maximize existing business, make sure we’re serving the right customers? Which questions aren’t being answered?" said Keppler.
B U S i n e S S i n t e l l i g e n c e
Managing the Mix at Marriott
Figure1 Typical dashboard display with a good use of color to show exceptions from standard KPIs, both positive and negative. Drill down is available from each figure. The gauges and bars on the left show variations from bud-geted targets; the lower right sliders allow the user to see the impact of various possible changes in other metrics. (Courtesy of Datavision Technologies, Inc.)
"What’s lifted BI at Marriott has been a series of inspired business sponsors with analytic backgrounds in statistics, revenue management or operations analysis. If you give them a pack of data and the tools to look through it, they’ll work out how to make it useful to a broader audience."
A constant challenge is to provide the right amount of data at the hotel level. "We have so much data as an enterprise," said Keppler. "General managers need tools that are easy to use. Their time is focused on running the hotel, working with people and being visible around the property; they need a quick, clear picture of their key performance indicators (KPIs) and trends to keep things moving in the right direction."
Data accuracy is critical to effective analysis, of course. How do you train the staff to enter data accurately? "You make the process as automated as possible, which means defining really good data edits," said Keppler. "We’re constantly refining this, looking at which PMS fields ought to be mandatory and what options need to be in the pick lists to fill them. Correct address information is critical to proper geographic analysis, of course, so data is cleansed and refreshed on a regular basis to keep it accurate. We use some third-party vendors to help with this, but we now actually have one person on staff who’s recognized by the U.S. Postal Service as an expert on address cleansing."
BasicsTo gain any meaningful insight
into aggregated data it’s essential to have a very clear understanding of what each data element means in each system and how each can be combined into a meaningful whole for comparison. Basic consolidation and simple analysis that assumes everyone is working from the same page make it terribly easy to misinterpret what’s being reported and used as the basis for decisions.
It takes a major, continuous effort to ensure that the data col-lected is accurate, consistent between properties, and meaningful enough to use for guidance. However, the insights gained from a well-implemented BI initiative can produce very significant benefits in providing a quick, visual way of monitoring key performance indicators (KPIs) and other metrics, spotting exceptions immediately as they occur and providing flexible and intuitive drill-down to the underlying data to identify the causes.
In the hospitality arena, the value of BI is recognized both by the presence
14 Hospitality Upgrade | Spring 2008 www.hospitalityupgrade.com
[email protected] | www.msisolutions.com | 800.331.7890
PROVEN. INTEGRATED.HOTEL TECHNOLOGY.
Hospitality solutions can be puzzling. Do the people behind the technology really understand your operations? MSI does. More importantly, we take the time to learn how our solutions can best serve you. Then, we deliver a proven, integrated technology suite that empowers you to seamlessly manage all the pieces of your business from point of sale to property
management, from registration to global accounting.
Web BookingENGINE
MSI. WHERE ALL THE PIECES OF HOTEL PROPERTY MANAGEMENT COME TOGETHER.
124552 HU Ad.indd 1 2/5/08 9:48:44 AM
B U S i n e S S i n t e l l i g e n c e
of three dedicated hospitality BI vendors – Aptech, Datavision and the IDT Group – and by the fact that most major PMS vendors now offer BI modules in addition to their regular ad hoc report generators/filters. SoftBrands developed its own Cognos-based BI tool and also offers Serenata’s CRM and BI modules under the Mosaik brand. Agilysys is expanding the BI tool it acquired with InfoGenesis, and NORTHWIND has developed its own BI suite using tools from QlikTech. MICROS did offer a third-party tool (Vision, from Eclipse Systems) but following Vision’s withdrawal from the hospitality market it has developed its own product based on Oracle tools and integrated into the OPERA PMS/CRS suite.
As mentioned in the sidebar on page 10, there are four main aspects to ensure a successful BI implementation:
1 Clean, consistent data in every system involved, carefully defined to allow meaningful analysis 2 Sophisticated consolidation tools to combine it into a single, cohesive database 3 Skillfully designed reporting and analysis tools4 Strong management commitment to process improvement based on the output.
Clean DataIt all starts with the data definitions,
and with a constant, steady focus on getting
accurate information as early as possible in the process. As always, it’s essential to start with agreement on goals and prioritize them with realistic schedules. What do you want to improve? Forecast accuracy, index per-centage changes in your STR comp set data, flash reporting with consolidations, rollups and labor data? How do you measure these? What metrics will give you the most immedi-ate return?
Once you know what you want to mea-sure, or are likely to want to in the future, you have the basis for clearly defining the data elements you’ll need. After all, if you don’t capture enough detail in the first place you can’t analyze it later. The variety of systems in use at any individual property means that it must be very clear that even something as fundamental as "guest name" means the same thing in each of them, and that all use the same codes for market segments, source of business, etc.
In multiproperty operations, even if all sites use the same system (or, in centrally hosted configurations, the same single sys-tem) it’s far from given that each one will use it the same way, or will use the same guest type or market segment codes. Take a simple, universal KPI such as average daily rate (ADR). Everyone knows what it means – or do they? Some base it on gross revenue, some on net, some focus only on how it compares to the previous year at the same property, and so on.
Other complex challenges include nor-malizing KPIs across a range of property types and labor environments. Data such as cost per occupied room and cost per available room from a limited-service property with salaried managers doing multiple types of labor will look very different to that from a mid-market site staffed by union labor on hourly wages. Getting franchisees to agree to use the same data definitions as everyone else raises the challenge one notch higher.
Even for properties using a single, integrated system, everyone must agree on
It takes major, continuous effort to ensure that the data collected is accurate, consistent between properties, and meaningful enough to use for guidance.
16 Hospitality Upgrade | Spring 2008 www.hospitalityupgrade.com
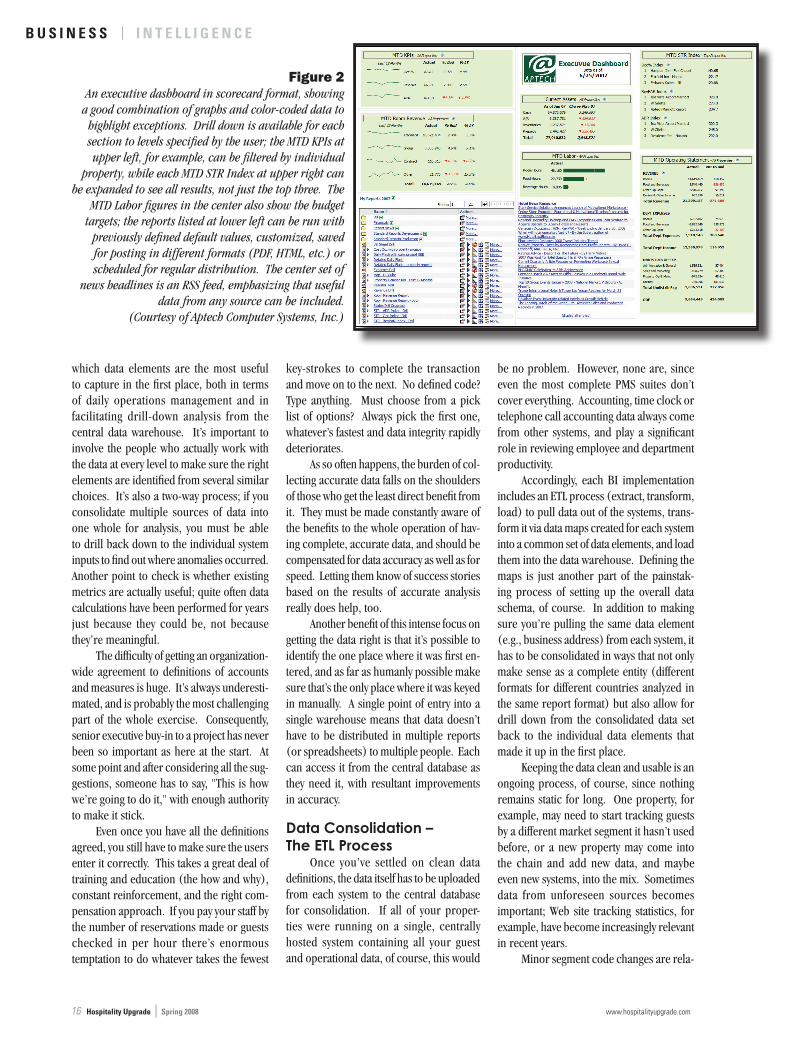
Figure 2 An executive dashboard in scorecard format, showing a good combination of graphs and color-coded data to
highlight exceptions. Drill down is available for each section to levels specified by the user; the MTD KPIs at upper left, for example, can be filtered by individual
property, while each MTD STR Index at upper right can be expanded to see all results, not just the top three. The
MTD Labor figures in the center also show the budget targets; the reports listed at lower left can be run with
previously defined default values, customized, saved for posting in different formats (PDF, HTML, etc.) or scheduled for regular distribution. The center set of
news headlines is an RSS feed, emphasizing that useful data from any source can be included.
(Courtesy of Aptech Computer Systems, Inc.)
B U S i n e S S i n t e l l i g e n c e
which data elements are the most useful to capture in the first place, both in terms of daily operations management and in facilitating drill-down analysis from the central data warehouse. It’s important to involve the people who actually work with the data at every level to make sure the right elements are identified from several similar choices. It’s also a two-way process; if you consolidate multiple sources of data into one whole for analysis, you must be able to drill back down to the individual system inputs to find out where anomalies occurred. Another point to check is whether existing metrics are actually useful; quite often data calculations have been performed for years just because they could be, not because they’re meaningful.
The difficulty of getting an organization-wide agreement to definitions of accounts and measures is huge. It’s always underesti-mated, and is probably the most challenging part of the whole exercise. Consequently, senior executive buy-in to a project has never been so important as here at the start. At some point and after considering all the sug-gestions, someone has to say, "This is how we’re going to do it," with enough authority to make it stick.
Even once you have all the definitions agreed, you still have to make sure the users enter it correctly. This takes a great deal of training and education (the how and why), constant reinforcement, and the right com-pensation approach. If you pay your staff by the number of reservations made or guests checked in per hour there’s enormous temptation to do whatever takes the fewest
key-strokes to complete the transaction and move on to the next. No defined code? Type anything. Must choose from a pick list of options? Always pick the first one, whatever’s fastest and data integrity rapidly deteriorates.
As so often happens, the burden of col-lecting accurate data falls on the shoulders of those who get the least direct benefit from it. They must be made constantly aware of the benefits to the whole operation of hav-ing complete, accurate data, and should be compensated for data accuracy as well as for speed. Letting them know of success stories based on the results of accurate analysis really does help, too.
Another benefit of this intense focus on getting the data right is that it’s possible to identify the one place where it was first en-tered, and as far as humanly possible make sure that’s the only place where it was keyed in manually. A single point of entry into a single warehouse means that data doesn’t have to be distributed in multiple reports (or spreadsheets) to multiple people. Each can access it from the central database as they need it, with resultant improvements in accuracy.
Data Consolidation – The ETL Process
Once you’ve settled on clean data definitions, the data itself has to be uploaded from each system to the central database for consolidation. If all of your proper-ties were running on a single, centrally hosted system containing all your guest and operational data, of course, this would
be no problem. However, none are, since even the most complete PMS suites don’t cover everything. Accounting, time clock or telephone call accounting data always come from other systems, and play a significant role in reviewing employee and department productivity.
Accordingly, each BI implementation includes an ETL process (extract, transform, load) to pull data out of the systems, trans-form it via data maps created for each system into a common set of data elements, and load them into the data warehouse. Defining the maps is just another part of the painstak-ing process of setting up the overall data schema, of course. In addition to making sure you’re pulling the same data element (e.g., business address) from each system, it has to be consolidated in ways that not only make sense as a complete entity (different formats for different countries analyzed in the same report format) but also allow for drill down from the consolidated data set back to the individual data elements that made it up in the first place.
Keeping the data clean and usable is an ongoing process, of course, since nothing remains static for long. One property, for example, may need to start tracking guests by a different market segment it hasn’t used before, or a new property may come into the chain and add new data, and maybe even new systems, into the mix. Sometimes data from unforeseen sources becomes important; Web site tracking statistics, for example, have become increasingly relevant in recent years.
Minor segment code changes are rela-
18 Hospitality Upgrade | Spring 2008 www.hospitalityupgrade.com
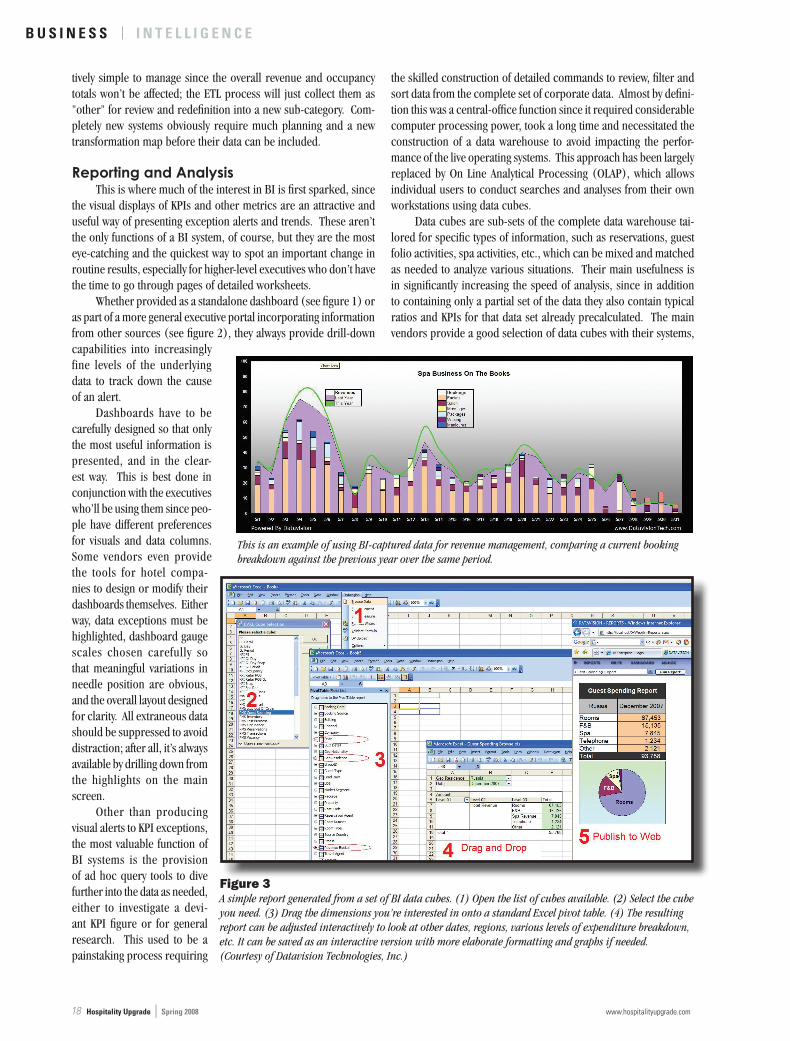
This is an example of using BI-captured data for revenue management, comparing a current booking breakdown against the previous year over the same period.
Figure 3A simple report generated from a set of BI data cubes. (1) Open the list of cubes available. (2) Select the cube you need. (3) Drag the dimensions you’re interested in onto a standard Excel pivot table. (4) The resulting report can be adjusted interactively to look at other dates, regions, various levels of expenditure breakdown, etc. It can be saved as an interactive version with more elaborate formatting and graphs if needed. (Courtesy of Datavision Technologies, Inc.)
B U S i n e S S i n t e l l i g e n c e
tively simple to manage since the overall revenue and occupancy totals won’t be affected; the ETL process will just collect them as "other" for review and redefinition into a new sub-category. Com-pletely new systems obviously require much planning and a new transformation map before their data can be included.
Reporting and AnalysisThis is where much of the interest in BI is first sparked, since
the visual displays of KPIs and other metrics are an attractive and useful way of presenting exception alerts and trends. These aren’t the only functions of a BI system, of course, but they are the most eye-catching and the quickest way to spot an important change in routine results, especially for higher-level executives who don’t have the time to go through pages of detailed worksheets.
Whether provided as a standalone dashboard (see figure 1) or as part of a more general executive portal incorporating information from other sources (see figure 2), they always provide drill-down capabilities into increasingly fine levels of the underlying data to track down the cause of an alert.
Dashboards have to be carefully designed so that only the most useful information is presented, and in the clear-est way. This is best done in conjunction with the executives who’ll be using them since peo-ple have different preferences for visuals and data columns. Some vendors even provide the tools for hotel compa-nies to design or modify their dashboards themselves. Either way, data exceptions must be highlighted, dashboard gauge scales chosen carefully so that meaningful variations in needle position are obvious, and the overall layout designed for clarity. All extraneous data should be suppressed to avoid distraction; after all, it’s always available by drilling down from the highlights on the main screen.
Other than producing visual alerts to KPI exceptions, the most valuable function of BI systems is the provision of ad hoc query tools to dive further into the data as needed, either to investigate a devi-ant KPI figure or for general research. This used to be a painstaking process requiring
the skilled construction of detailed commands to review, filter and sort data from the complete set of corporate data. Almost by defini-tion this was a central-office function since it required considerable computer processing power, took a long time and necessitated the construction of a data warehouse to avoid impacting the perfor-mance of the live operating systems. This approach has been largely replaced by On Line Analytical Processing (OLAP), which allows individual users to conduct searches and analyses from their own workstations using data cubes.
Data cubes are sub-sets of the complete data warehouse tai-lored for specific types of information, such as reservations, guest folio activities, spa activities, etc., which can be mixed and matched as needed to analyze various situations. Their main usefulness is in significantly increasing the speed of analysis, since in addition to containing only a partial set of the data they also contain typical ratios and KPIs for that data set already precalculated. The main vendors provide a good selection of data cubes with their systems,
20 Hospitality Upgrade | Spring 2008 www.hospitalityupgrade.com
B U S i n e S S i n t e l l i g e n c e
Starwood Hotels and Resorts has a range of hotel operations broader and deeper than most. How do you apply business intelligence (BI) to benefit such a diverse organization?
"We’ve been working on BI for several years," said Clive Perry-Gore, Starwood’s director, business intelligence solutions. "And it’s been adopted and consolidated quite well – although there’s always room for more buy-in. We started with a GMs’ dashboard in Actuate three to four years ago with just the six most relevant key performance indicators (KPIs) on it (EBITDA, GOP, STR, RevPAR Index, SAP production metrics and GSI), and more recently developed a separate hotel statement using MicroStrategy to support our owner relations teams, who were looking for a different presentation of the metrics.
"Visuals are good, but you also have to have the numbers. The trick is deciding what is actionable, defining the data structure well enough to know what sub-metrics drive the high-level ones such as RevPAR. It also helps to use an iteractive prototyping approach, working with quick and simple alternative displays and metrics to refine what’s actually useful to the users and then building up the final version.
"Data quality is key, and it takes a great deal of time to manage effectively. The information may not be available or consistent across all properties, due to different systems' contractual agreements. Even for such basic parameters as market segment codes, there’s a constant feedback process to show the users the output, highlight the errors and let them see how valuable the information can be when made consistent."
Perry-Gore said, "And it’s not just the data; sometimes the business rules in place can distort the meaning. For example, when Expedia took off and (its) initial process was faxing reservations to the properties, these were manually entered into the hotels’ own property system – and therefore initially appeared as property bookings, not Internet/Expedia. If you catch this consistently you can redefine it in the ETL process, but eventually you do have to redefine the data in the base system.
"One thing that’s improved accuracy in the last few years has been developing single-source entries for as much data as we can. For example, if each property takes its own STR data, calculates its RevPAR index and distributes that information to others via worksheets there are several potential opportunities for error. Entering it once centrally, and doing all the calculations automatically in one database that each user can access on demand has improved consistency and transparency. There are those who prefer a printed hard copy of the information, but more and more are accessing the information directly online, especially with our real estate and global sales teams."
To make BI important all of this requires a commitment from the executive team. "Everyone on the team has (his or her) own area of expertise, and it takes work to create a common vision – and then hold each accountable both for the data quality from (his or her) area and for taking action on the results," said Perry-Gore.
Starwood Stays Focused on the Source

22 Hospitality Upgrade | Spring 2008 www.hospitalityupgrade.com
B U S i n e S S i n t e l l i g e n c e
based on their experience with many hos-pitality companies’ needs. They provide an excellent base for a property to begin analysis quickly and, if necessary, learn what additional factors it would like to track and add to the cube in the future.
An off-shoot from this is that it’s rela-tively easy for power users to derive useful interactive worksheets from these data cubes, usually in Excel, for middle manag-ers who are less familiar with the full BI tool but are more involved with day-to-day op-erations. These include input cells to allow
selection of input parameters, such as for an analysis of spend-by-guest nationality (see figure 3), and are a real benefit for quickly monitor-ing areas of in-terest.
Another re-porting aspect that really helps is to make the data and tools available on-line. Apart from providing quick
and simple access to useful information, being able to see how each property is doing compared to the rest of its group provides a powerful stimulus to improvement. Peer pressure is a great motivator.
Process ImprovementBeing able to find out why exceptions
have occurred is useful, as is the ability to identify trends as they’re building. But while information is interesting, the benefits of BI only come with action when you do some-thing with the insights gained. Business processes need to be constantly refined to avoid future recurrences of identified prob-lems, to take advantage of opportunities, or to refocus marketing efforts to leverage new trends. And the process of measuring the results and readjusting the processes never stops.
While upper management focuses on KPI variations, effective process change usually only happens when the data and analysis tools are put into the hands of the people who use that process in their daily operations. No matter how sophisticated
the corporate’s in-depth analysis tools are, middle management needs to have intuitive tools to work through the sub-set of data affecting their area and get to the detail quickly.
They’re more familiar with the how of what happened; with the added insight of why from BI, they and their staff can more readily identify which changes at the day-to-day level will produce the required improvements. They’re also the ones best placed to explain the benefits in a wider context and re-train people appropriately to make it happen.
ImplementationThere are two conflicting forces at
work on BI implementations. One is ex-citement at the chance to get widespread benefit out of the approach as quickly and widely as possible; the other is fear, both that the task will be overwhelming and that too much trust will be placed in data analysis of unproven accuracy.
For both reasons, it’s always best to start small. Some vendors take data from existing systems and reproduce copies of a property’s standard reports for a few weeks, building confidence in their output. This is also a great way to check how accurate the
data entry is, as it’s easy to see if only the right segment codes are being used, and to run reality checks to pick up anomalies such as a guest from Seattle, Japan.
From there they can start thinking about other views of the same data, more detailed analysis of the reports, and perhaps new reports on KPIs that haven’t been moni-tored before since it was just too much work to do manually. It’s also possible to develop new insights by looking into consolidated data that was previously too sensitive to be researched raw. It’s more anonymous when consolidated, and appropriate levels of drill down can still be made available to users with the right authority.
Once trust has been established, there’s much more acceptance of the possibility of changing business practices based on the analysis. People are often surprised by the ease with which they can now look at their business from different angles, but they need time to build confidence in the tools and accept that they can take advantage of this new information and make changes based on it.
Few companies use BI across their whole operations; it’s just too complex a management task. The most success-ful implementations are usually made by
Being able to see how each property is doing compared to the rest of its group provides a powerful stimulus to improvement. Peer pressure is a great motivator.
The benefits of BI in a multiproperty operation are clear in terms of comparative reporting across sites. But, where does a single property focus when it wants to make better use of its data?
“We focus principally on revenue management,” said Dominic Van Nes, VP information services at renowned Pebble Beach. “We started a serious BI focus in mid-2005, using Datavision Technologies to create combined pace reports that weren’t available from our standard systems. It’s critical to our operation to match golf, spa and guestroom booking rates for maximum revenue, and since guests book so far in advance (often up to four years ahead) we need as much guidance as possible.
“We pull in data from a range of systems: PAR Springer-Miller Host for PMS, Delphi S&C for spa and golf, and Great Plains for accounting and labor statistics. This lets us understand booking trends in more detail: length of stay and booking lead day analysis for various rates and channels, comparing past room and golf/spa utilization with current pace, and so on,” Van Nes said.
“The ad hoc analysis we can apply to this consolidated data allows for much faster response to changing conditions. It’s easy to see when something’s not right, try out alternative approaches and react to it knowledgeably, something that was impossible with a manual approach. Having all data centralized also means that the same data is pulled and analyzed the same way by everyone who needs it; there aren’t differing interpretations of the same information being used in different areas.”
What advice would Van Nes give to a hotel beginning a BI initiative? “Keep your goals narrow,” he said. “You can do a great deal with the tools, but it’s complicated to get each area aligned for meaningful analysis. It’s essential to spend time working out how you want to use the data before you start, to make sure you have the right data elements and metrics defined. Start with a manageable project, work with it for a while, then grow it from there.”
improving the “green” at Pebble Beach
24 Hospitality Upgrade | Spring 2008 www.hospitalityupgrade.com
B U S i n e S S i n t e l l i g e n c e
companies which have identified a specific business problem they can’t tackle without further, detailed insight, and who therefore have a real stimulus to act on the data and insights uncovered. Once the basic concepts have been proven, they can be expanded to other areas as other priority opportunities are identified. But it all starts with a strong and constant focus on collecting the right data from the start.
Where is BI Going? BI has become a mainstream require-
ment in all commercial fields, especially in an increasingly service-oriented world where multiple software applications (or even individual modules) are linked together with an enterprise service bus. With valuable information going through the bus rather than through the individual applications, it makes sense to focus BI efforts through specialized central tools instead of relying on the reporting functions of the applica-tions themselves.
Emphasizing BI’s mainstream role, Microsoft recently added BI reporting and analysis to SQL Server. Further, many of the major independent BI vendors have now
been acquired by the heavy hitters of the IT world to form part of their general ap-plication lines. IBM, for example, recently acquired Cognos, Oracle bought Hyperion, and SAP took over Business Objects. Other independent vendors still remain strong, including SAS (arguably the company that pioneered BI), MicroStrategy, Actuate, In-formation Builders and QlikTech.
As PC power continues to grow at the remarkable rate we’ve come to expect, there are moves toward providing full data access and analysis on individual worksta-tions, especially those with 64-bit processors and significant amounts of memory. This should lead to more flexible ad-hoc analysis by eliminating the need to predefine data cubes and precalculated metrics. QlikTech seems to be leading the way to this so-called operational BI approach, preaching the ben-efits of analyzing data continuously instead of storing it first and then running a query.
Another intriguing development is the growing interest in deriving usable BI from unstructured text such as guest satisfac-tion survey comments, customer service e-mails, Web site commentaries and so on. This is clearly a whole new challenge, given
that rules have to be derived as to what’s meaningful in what context; irate guests don’t usually follow strict data definitions when phrasing their complaints. Neverthe-less, there are now several tools available to address this, and the data and trends they uncover will certainly form part of the BI mix.
SummaryThe world is not getting any less com-
plex; the more accurate guidance hoteliers can get to manage it, the better. It’s telling how much interest in BI tools has grown even during the relatively good times expe-rienced by most hoteliers over the last few years. Access to real-time information and the ability to make mid-course corrections promptly and accurately has allowed many to fine tune their operations well. This will become even more important as the cycle inevitably begins to slow down.
Jon Inge is an independent consultant specializing in technology at the property level. He can be reached by e-mail at [email protected] or by phone at (206) 546-0966.
Related Documents